Domino Effect Sequential Infographics Template for PowerPoint & Google Slides


Description
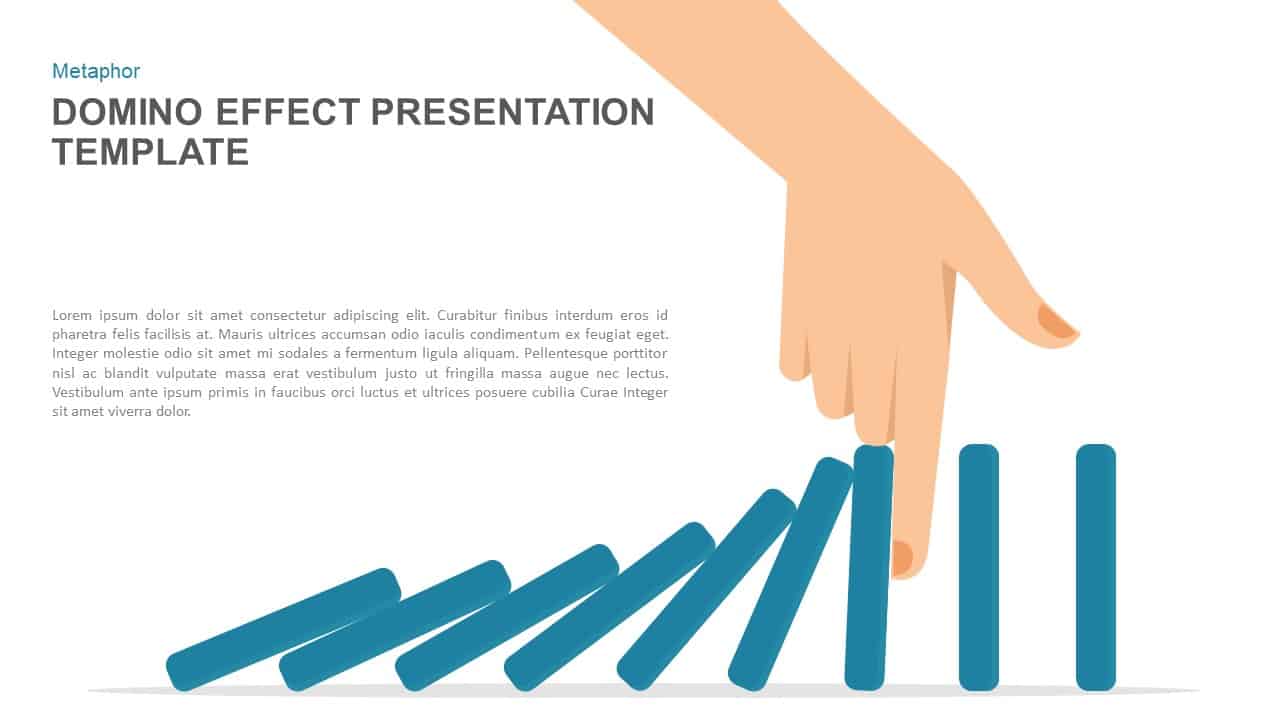
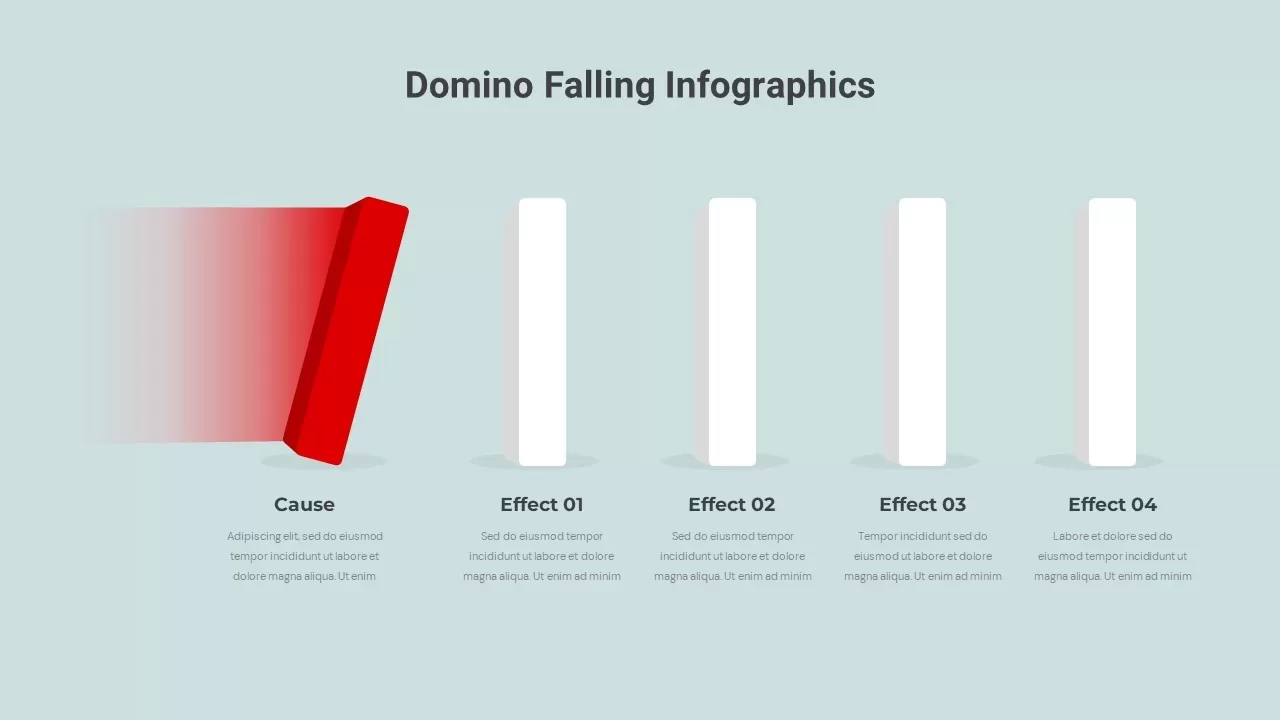
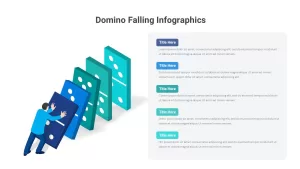
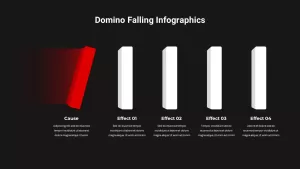
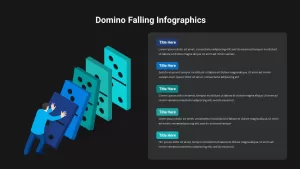
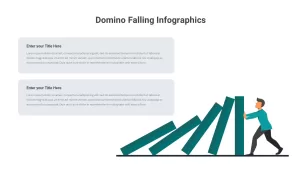
Illustrate cascading cause-and-effect relationships with this dynamic Domino Effect Sequential Infographics slide for PowerPoint & Google Slides. The fully editable layout features a bold red “Cause” domino tipping into four sequential white “Effect” dominos, each paired with clear headings and space for concise explanatory text. Master slide support and vector shapes allow you to swap colors, adjust domino heights, or update labels in seconds without breaking alignment. Subtle drop shadows ground each element, while the clean white canvas and minimalist sans-serif typography ensure maximum readability. Whether you’re mapping risk triggers, project dependencies, or strategic outcomes, the smooth left-to-right flow guides audiences through complex sequences with ease.
Engineered for maximum flexibility, this template harnesses native PowerPoint and Google Slides features—drag-and-drop graphics, alignment guides, and global theme settings—to streamline customization. Duplicate, hide, or reorder any domino to reflect additional steps or emphasize key impacts. Integrated SmartArt support lets you incorporate data-driven icons or small charts within each segment, transforming static visuals into interactive storyboards. The modular design adapts to any color palette: simply update the red accent to match brand guidelines, or apply a gradient fill to highlight priority steps. Use built-in placeholder text to describe methodologies, illustrate process bottlenecks, or call out milestone achievements directly beneath each domino.
Optimized for both boardroom presentations and remote webinars, this infographic slide maintains vector quality across high-resolution displays and printed handouts. Export individual sections as standalone graphics, embed the full slide into larger decks, or collaborate in real time on Google Slides to refine your narrative. With its compelling visual hierarchy, intuitive flow, and rapid editability, the Domino Effect Sequential Infographics template empowers you to break down intricate processes into engaging, digestible visuals that drive clear understanding and action.
Who is it for
Project managers, process consultants, business analysts, and strategists who need to communicate cascading risks, dependencies, or sequential impacts in a clear, visually compelling format.
Other Uses
Repurpose this slide to map decision-tree outcomes, stakeholder influence chains, fault-tree analyses, or any scenario requiring side-by-side comparison of triggers and resulting effects.
Login to download this file

Item ID
SB02979
Related Templates

Domino Effect Prevention Presentation Template for PowerPoint & Google Slides
Process
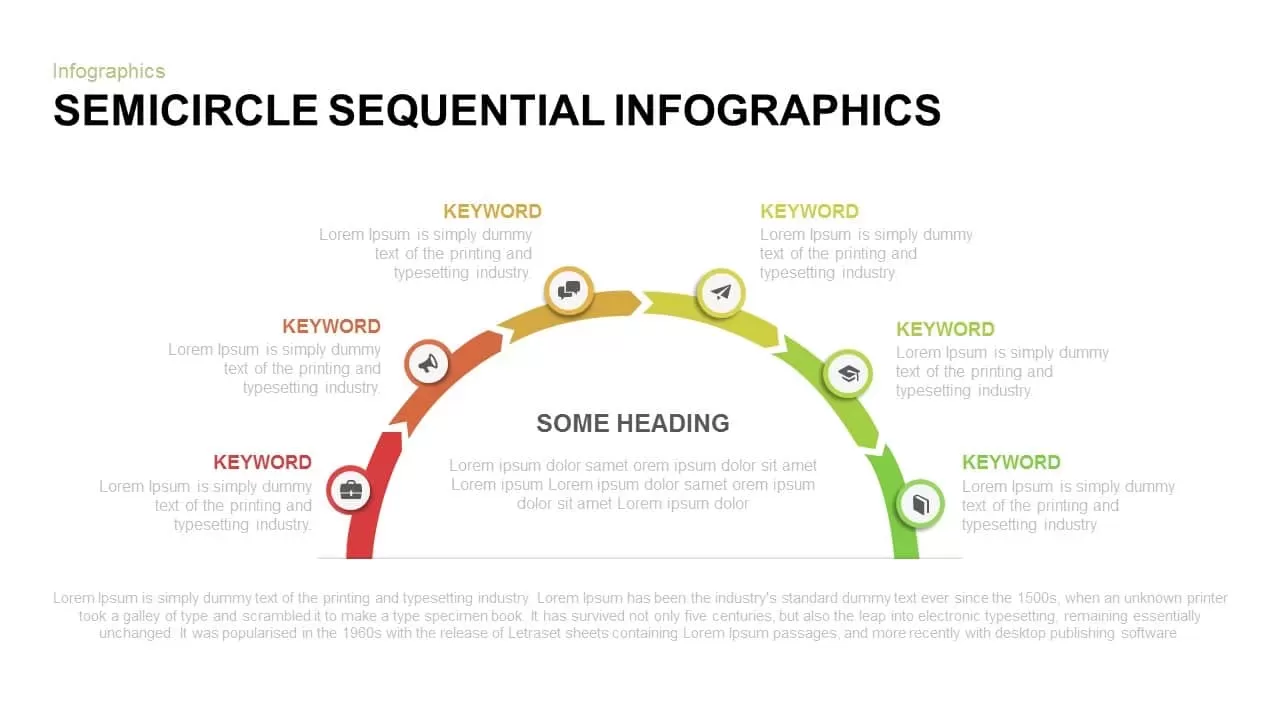
Semicircle Sequential Infographics Template for PowerPoint & Google Slides
Arrow
Sequential Arrow Timeline and Planning template for PowerPoint & Google Slides
Timeline
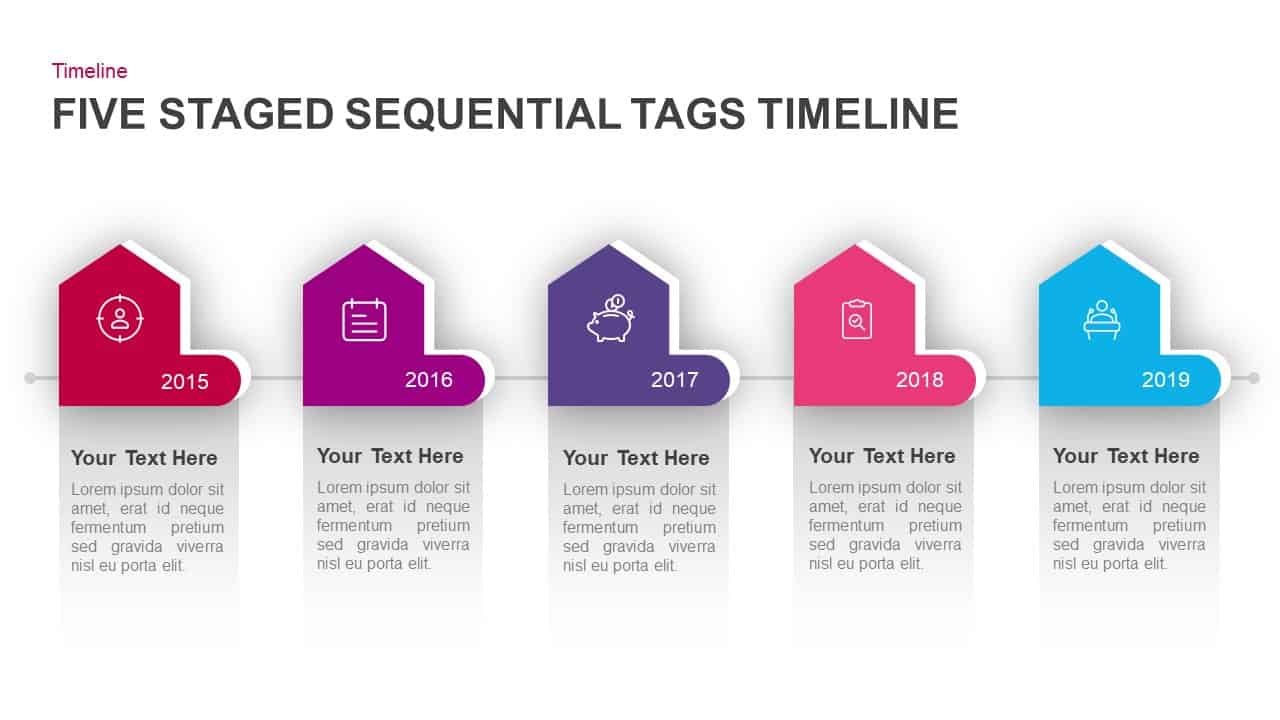
Five-Stage Sequential Tags Timeline Template for PowerPoint & Google Slides
Timeline
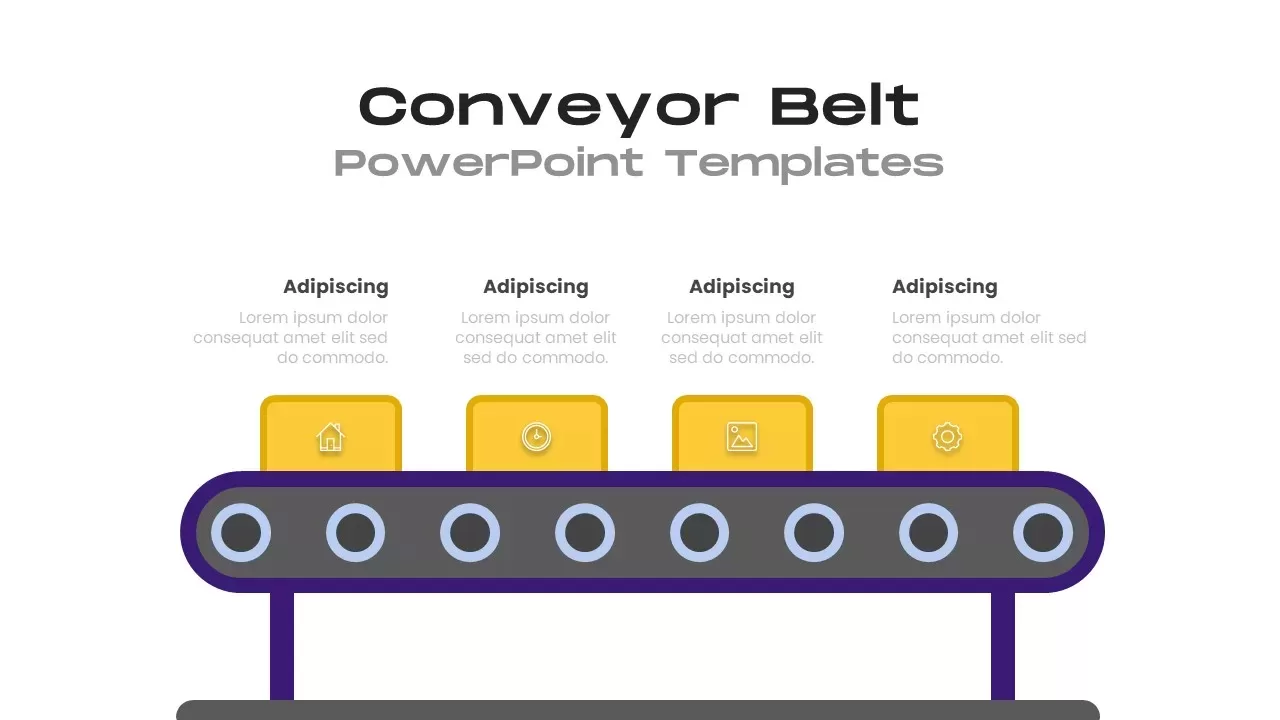
Conveyor Belt Sequential Process Flow Template for PowerPoint & Google Slides
Process

Cause and Effect Diagram Infographic Template for PowerPoint & Google Slides
Bar/Column
Fishbone Diagram Cause-and-Effect Template for PowerPoint & Google Slides
Process
Fishbone Cause and Effect Diagram Template for PowerPoint & Google Slides
Process
Five-Input Cause and Effect Diagram Template for PowerPoint & Google Slides
Arrow
Fishbone Cause and Effect Infographic Template for PowerPoint & Google Slides
Infographics
Underwater Fishbone Cause-Effect Diagram Template for PowerPoint & Google Slides
Process
Snowball Effect Process Diagram Template for PowerPoint & Google Slides
Process
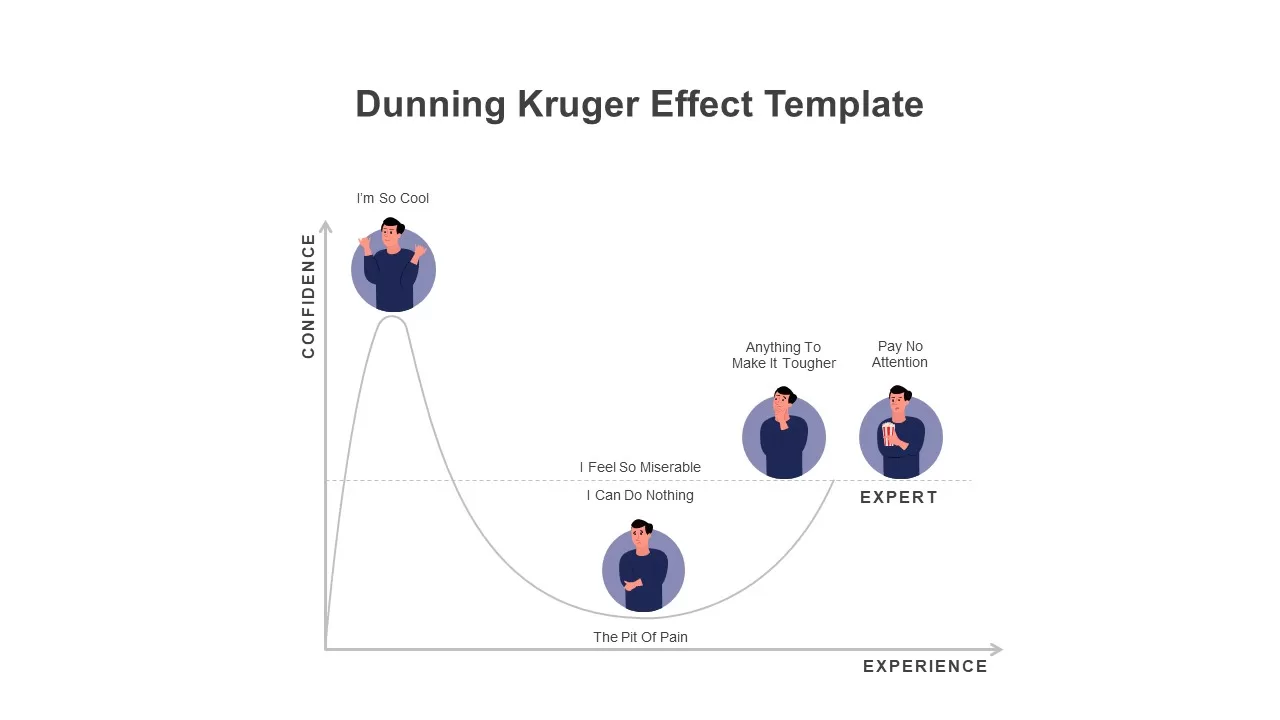
Modern Dunning Kruger Effect Diagram Template for PowerPoint & Google Slides
Business
5Cs of Network Effect Circular Diagram Template for PowerPoint & Google Slides
Circular
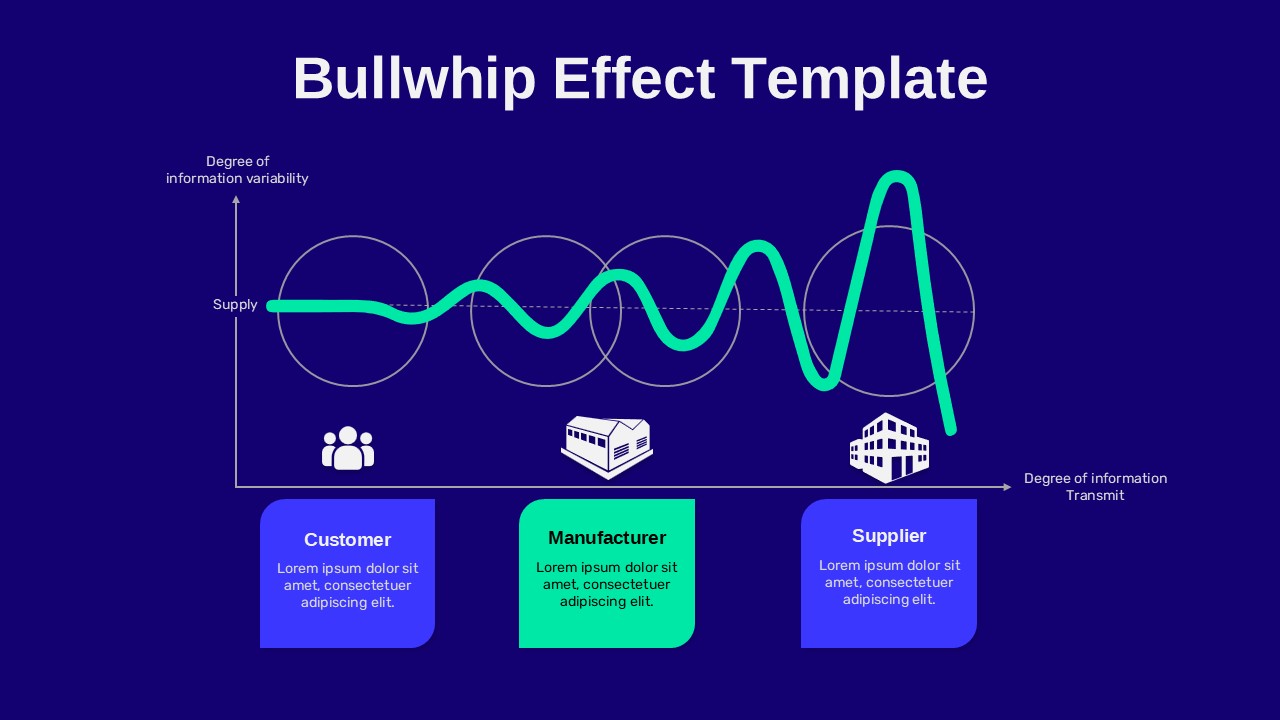
Bullwhip Effect Supply Chain Variability Diagram Template for PowerPoint & Google Slides
Business Models
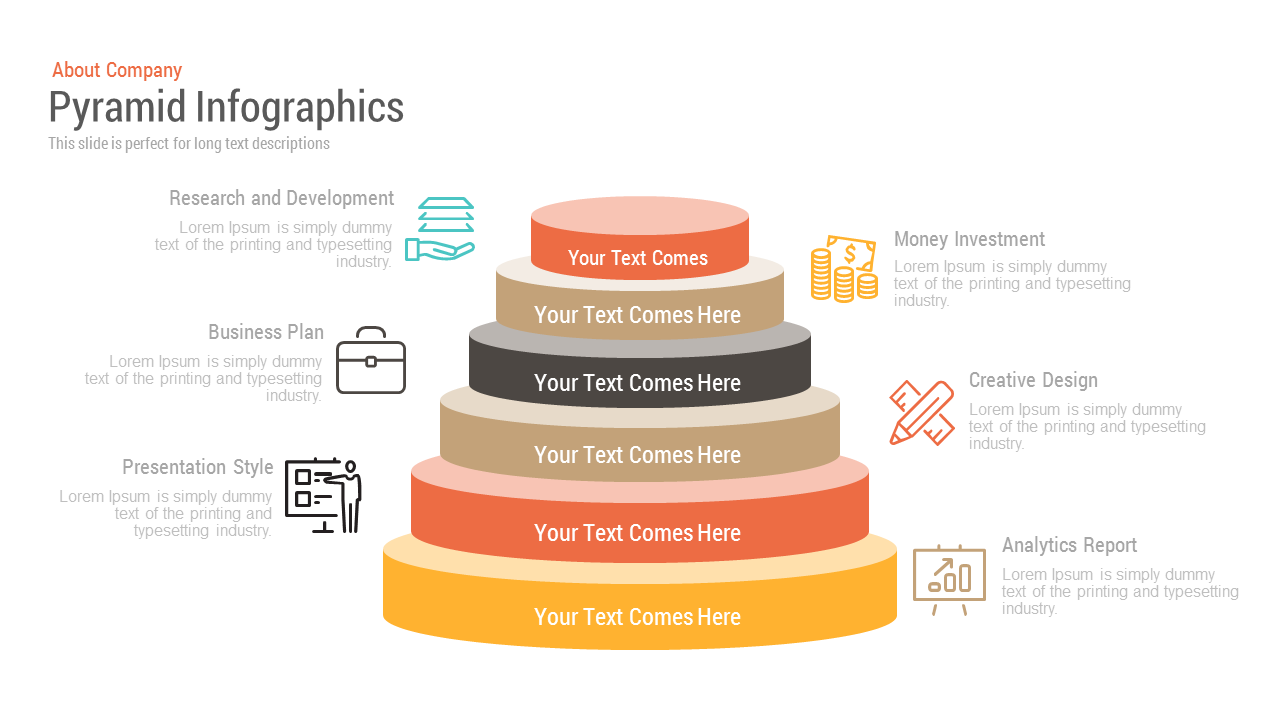
Free Pyramid Infographics template for PowerPoint & Google Slides
Pyramid
Free
Free Creative Hemisphere Infographics template for PowerPoint & Google Slides
Infographics
Free
Box Services Infographics template for PowerPoint & Google Slides
Process
Circle Timeline Infographics template for PowerPoint & Google Slides
Timeline
Funnel Flow Stage Infographics template for PowerPoint & Google Slides
Funnel
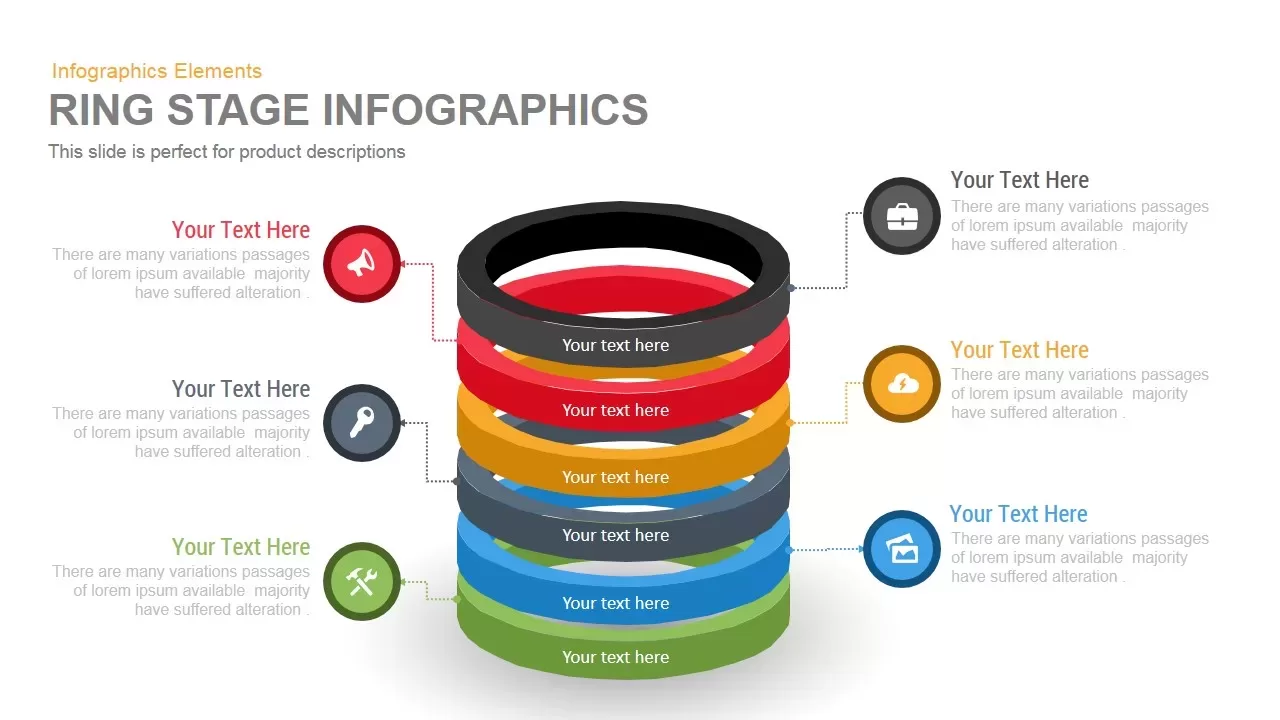
Ring Infographics template for PowerPoint & Google Slides
Circular
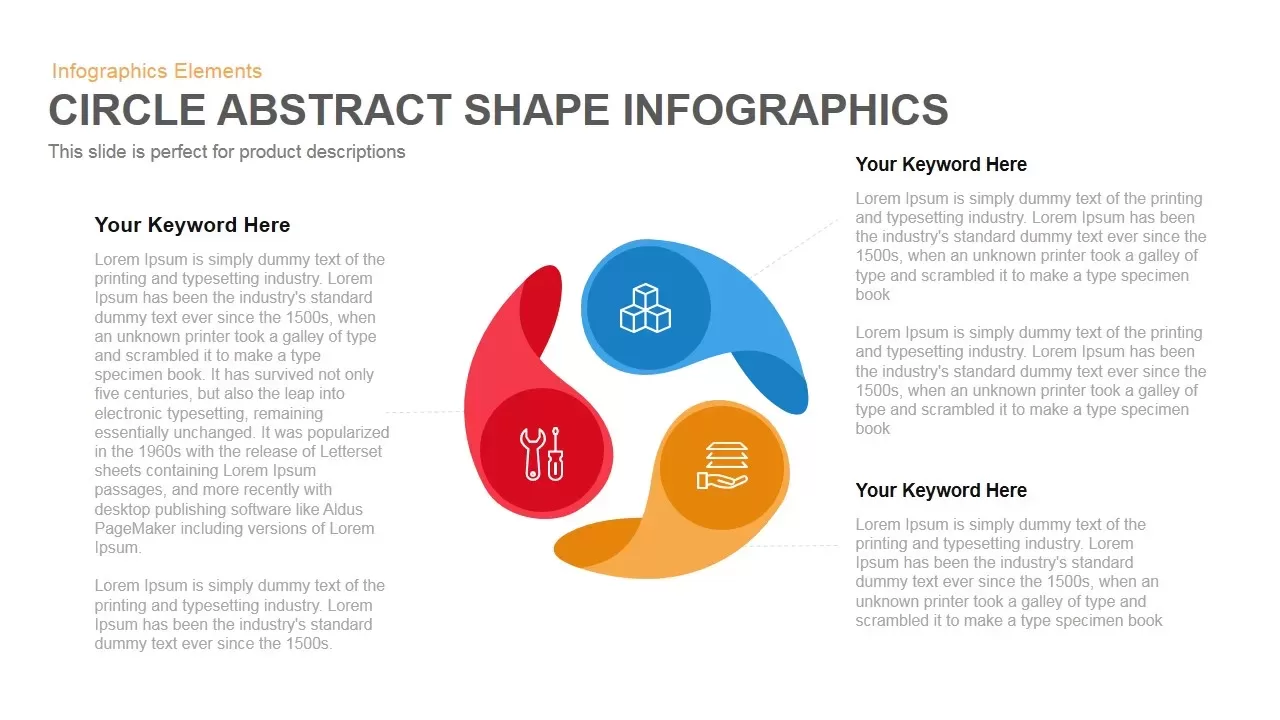
Circle Abstract Shape Infographics Template for PowerPoint & Google Slides
Circular
3D Four Arrow Infographics Diagram Template for PowerPoint & Google Slides
Arrow
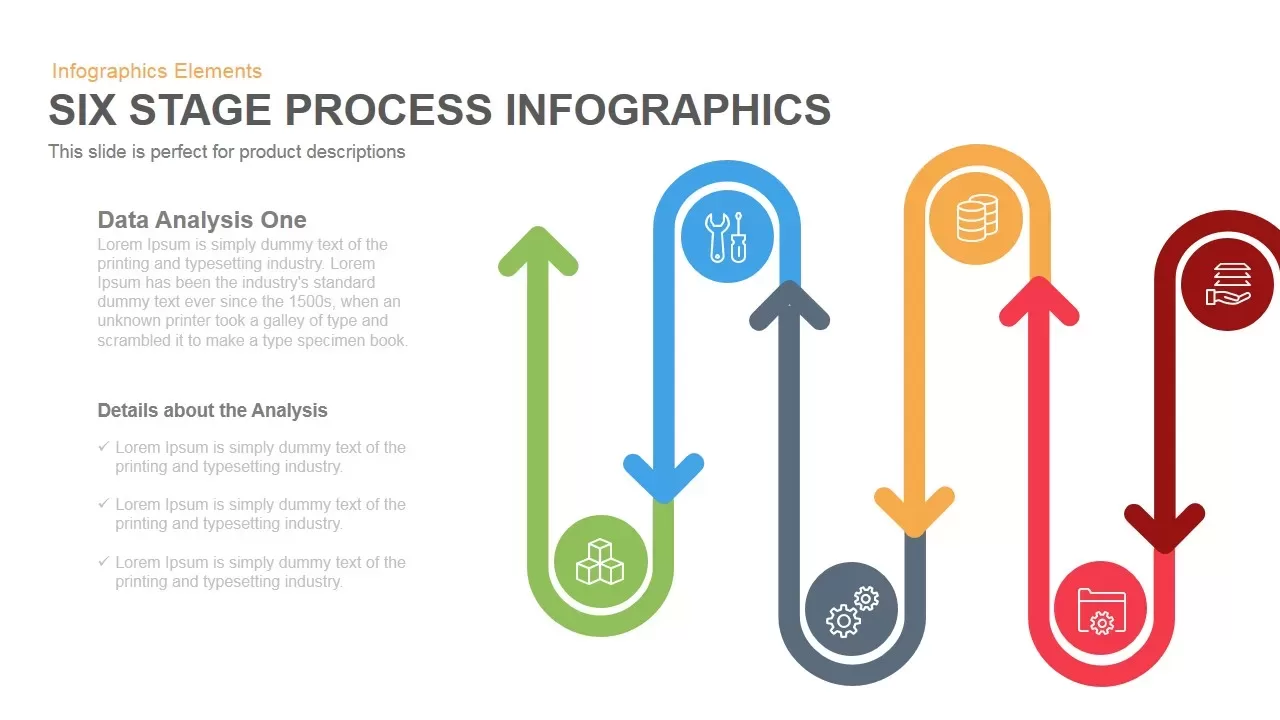
Six-Stage Process Infographics Template for PowerPoint & Google Slides
Process
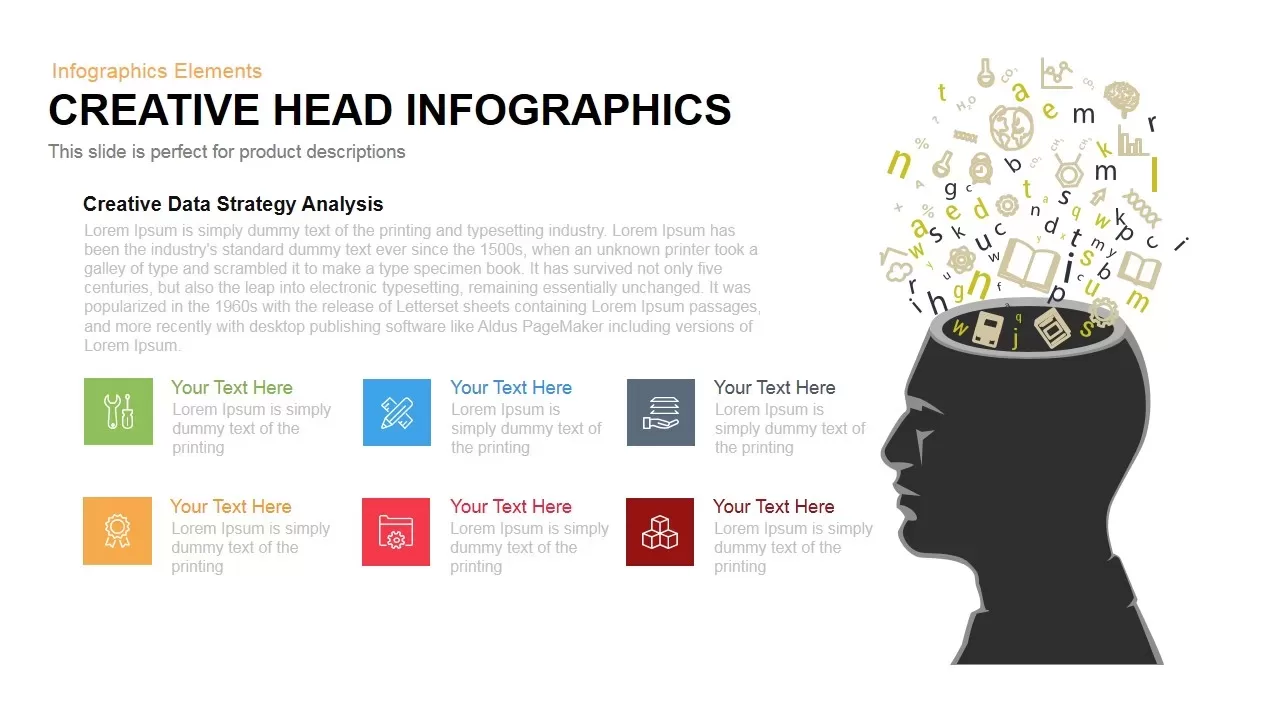
Dynamic Creative Head Infographics Template for PowerPoint & Google Slides
Circular
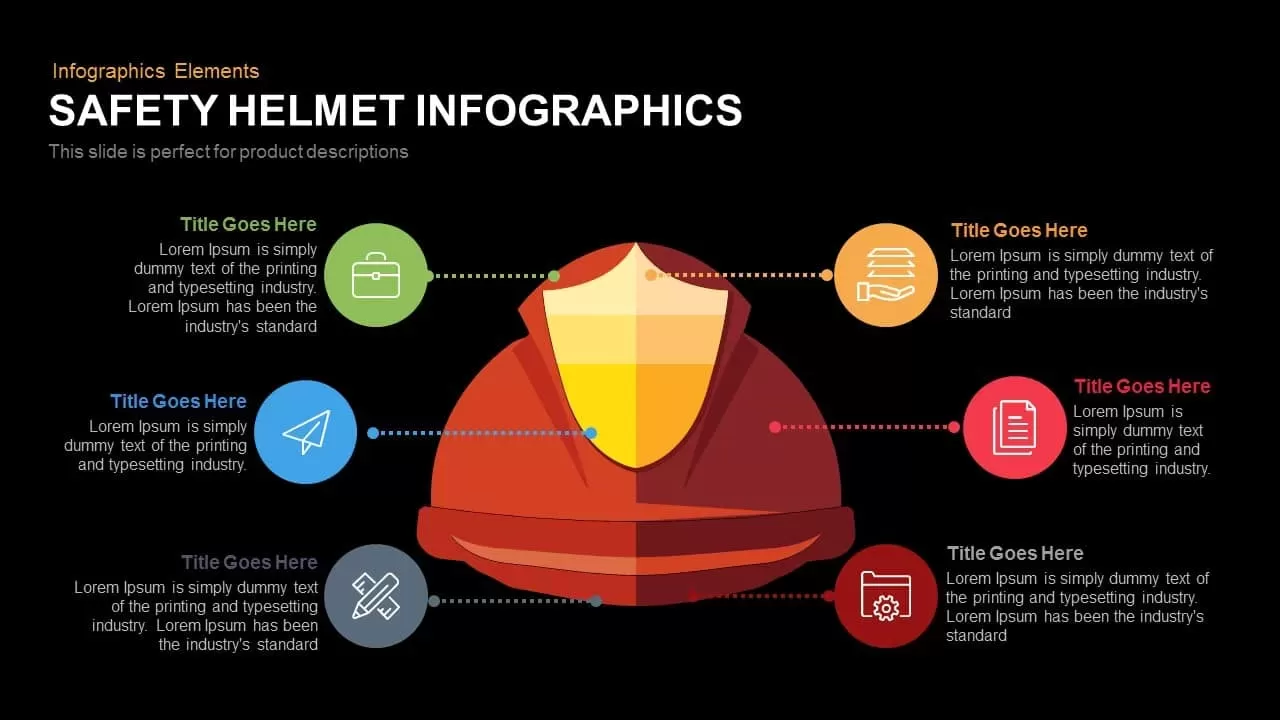
Safety Helmet Infographics Template for PowerPoint & Google Slides
Infographics
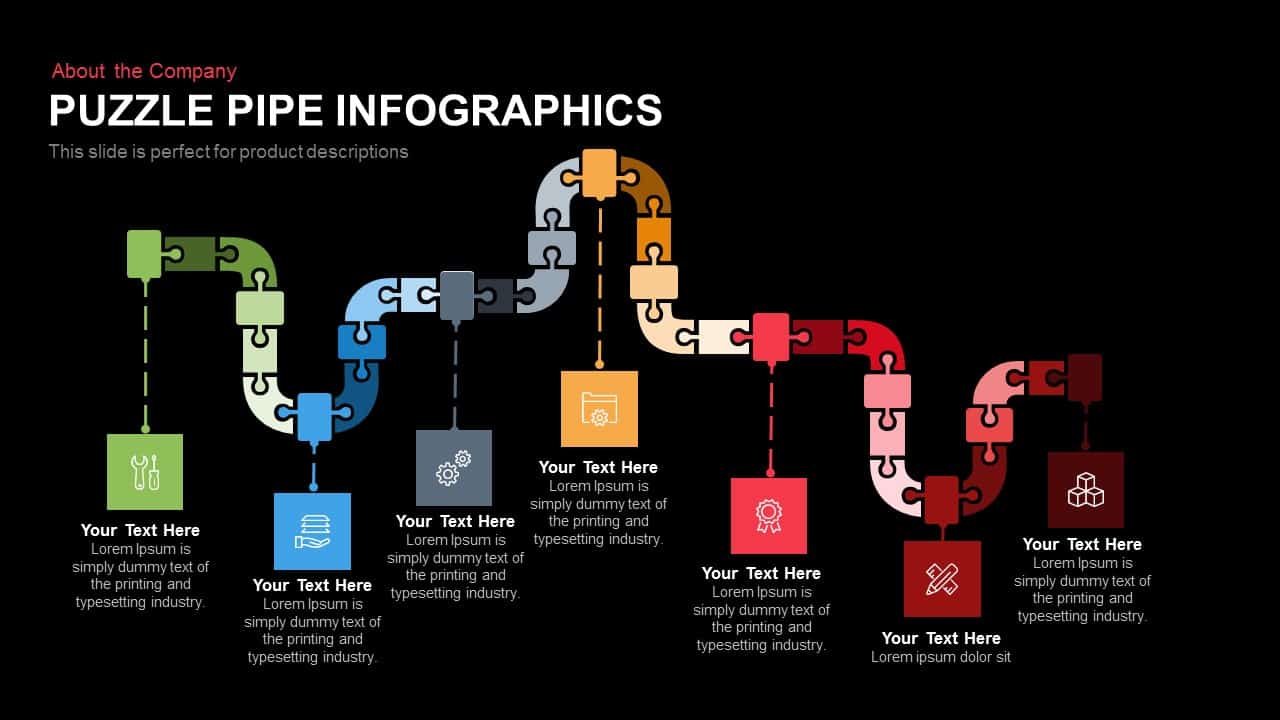
Puzzle Pipe Infographics Process Flow Template for PowerPoint & Google Slides
Process
Four Arrow Square Infographics Template for PowerPoint & Google Slides
Arrow
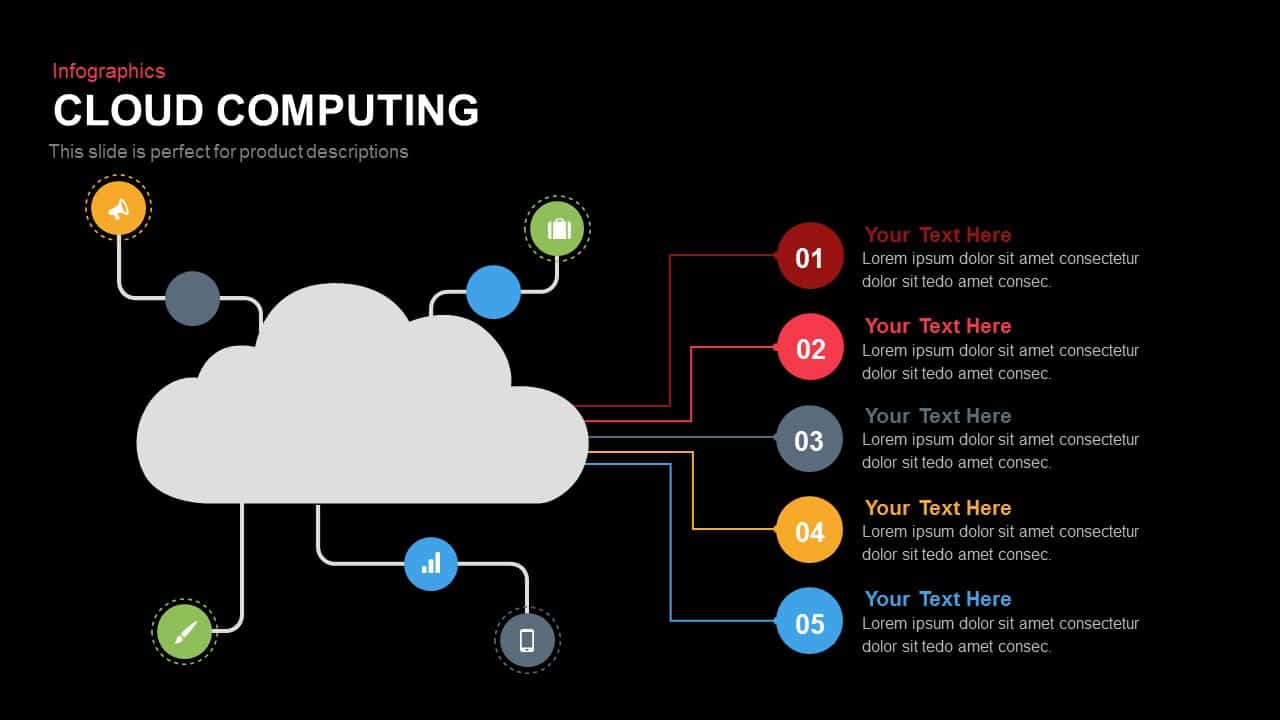
Cloud Computing Infographics template for PowerPoint & Google Slides
Cloud Computing
Brain Gear Hub-and-Spoke Infographics template for PowerPoint & Google Slides
Org Chart
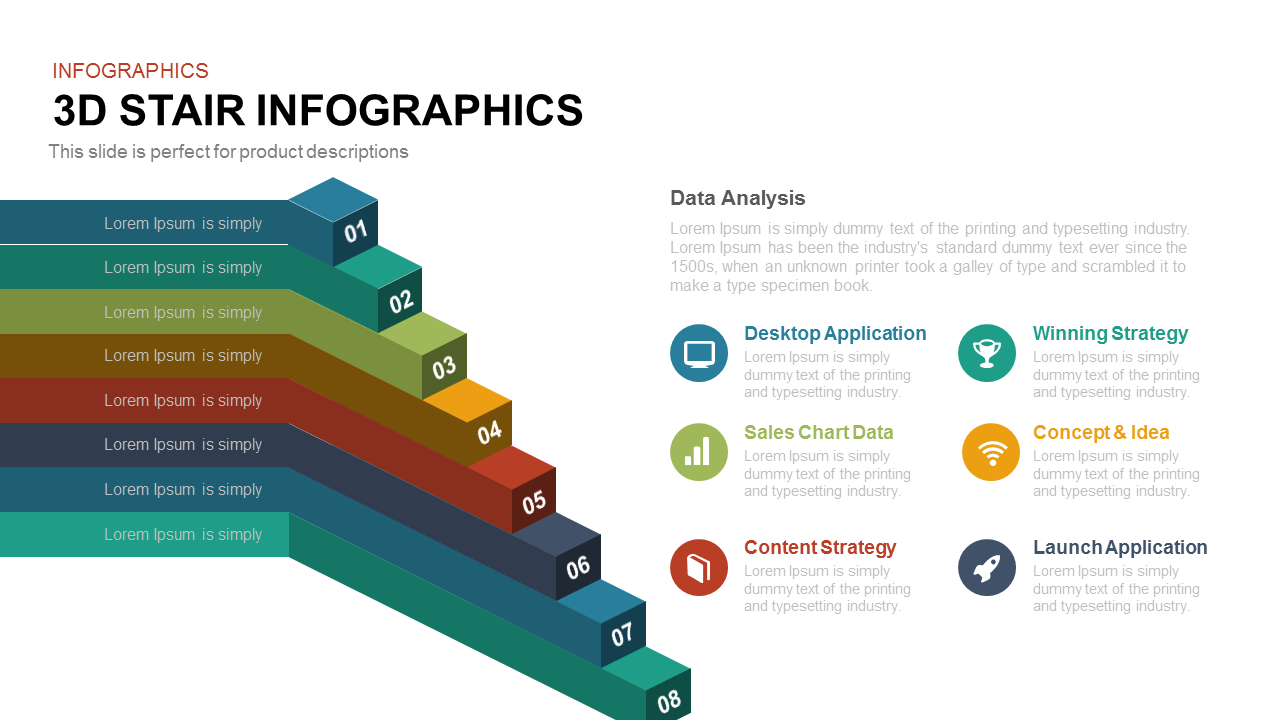
8-Step 3D Stair Infographics Slide template for PowerPoint & Google Slides
Process
Tree Infographics template for PowerPoint & Google Slides
Infographics
Overcoming Challenges Infographics template for PowerPoint & Google Slides
Opportunities Challenges
Multi-Stage Timeline Infographics Template for PowerPoint & Google Slides
Timeline
Five Arrow Infographics Diagram Template for PowerPoint & Google Slides
Arrow
Five-Stage Hexagon Process Infographics template for PowerPoint & Google Slides
Process
Business Strategy Infographics Diagram Template for PowerPoint & Google Slides
Business Strategy
Four Segment Infographics Element Template for PowerPoint & Google Slides
Comparison
Six-Stage Time Arrow Infographics Template for PowerPoint & Google Slides
Arrow
Six Stage Timeline Infographics Template for PowerPoint & Google Slides
Timeline
3D Arrow Infographics template for PowerPoint & Google Slides
Arrow
Free Layer Infographics template for PowerPoint & Google Slides
Process
Free

Seven-Stage Timeline Infographics Template for PowerPoint & Google Slides
Timeline
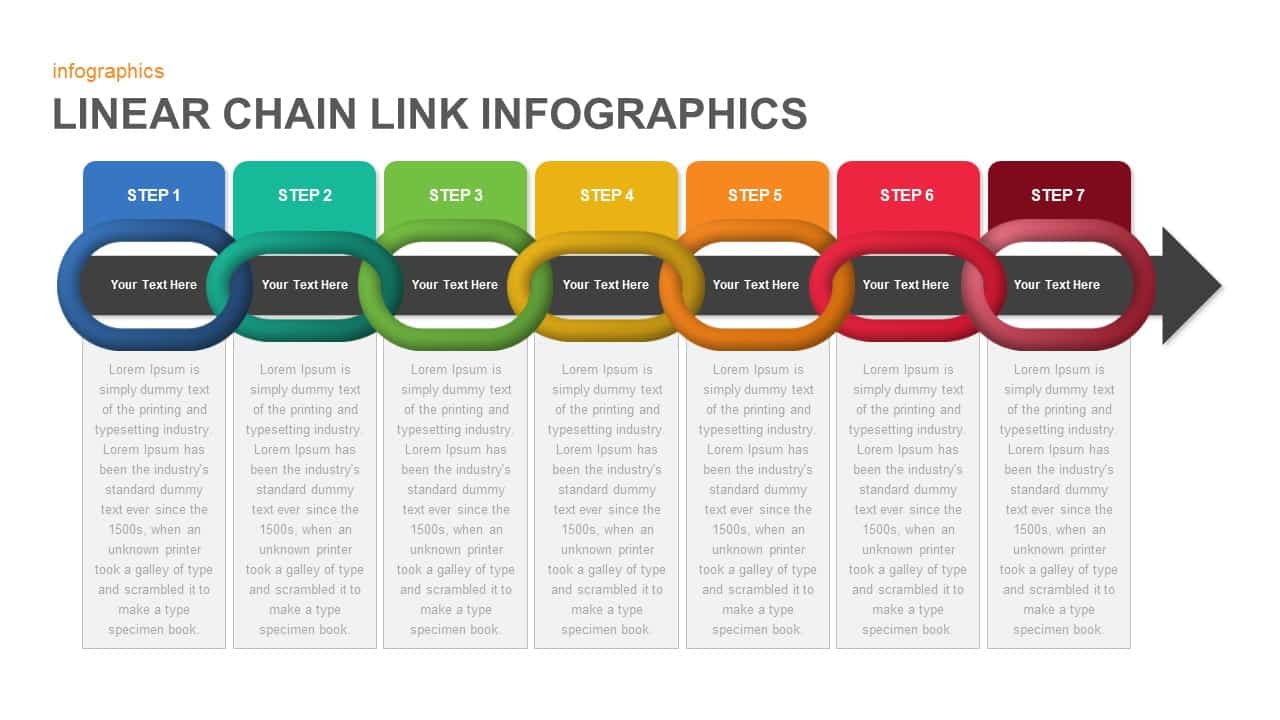
Linear Chain Link Infographics Template for PowerPoint & Google Slides
Process
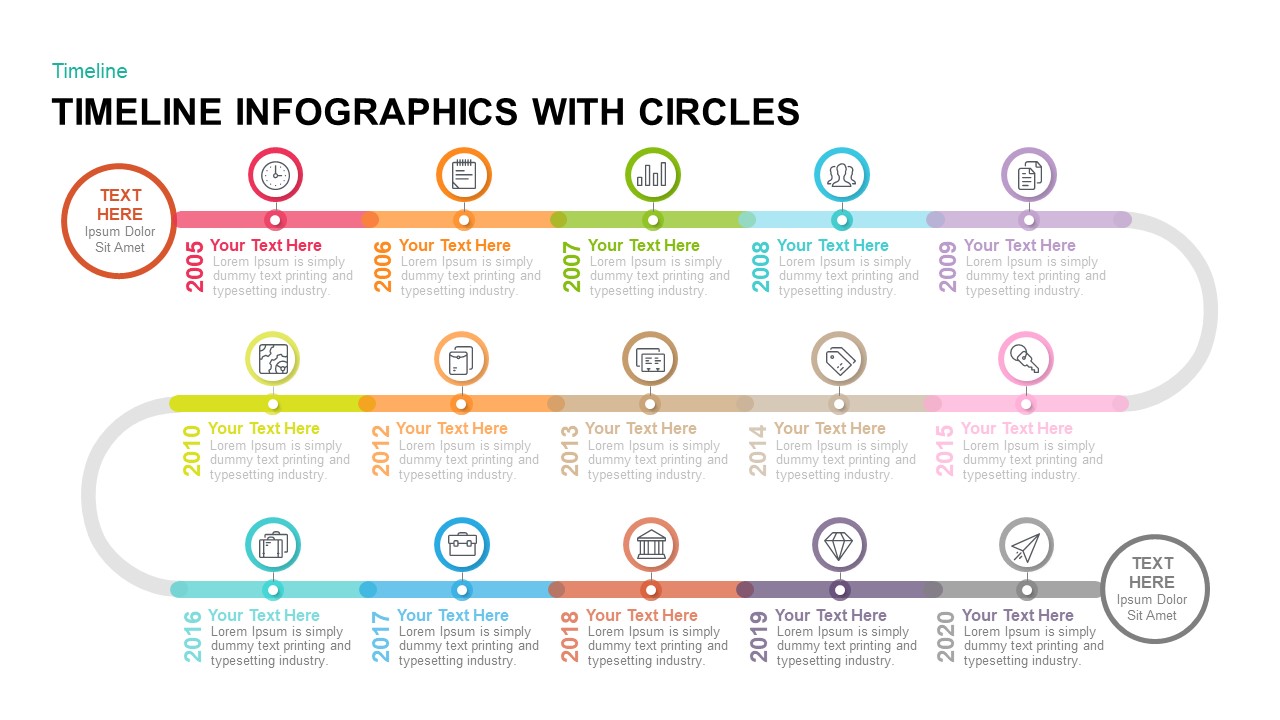
Circular Timeline Infographics Template for PowerPoint & Google Slides
Timeline
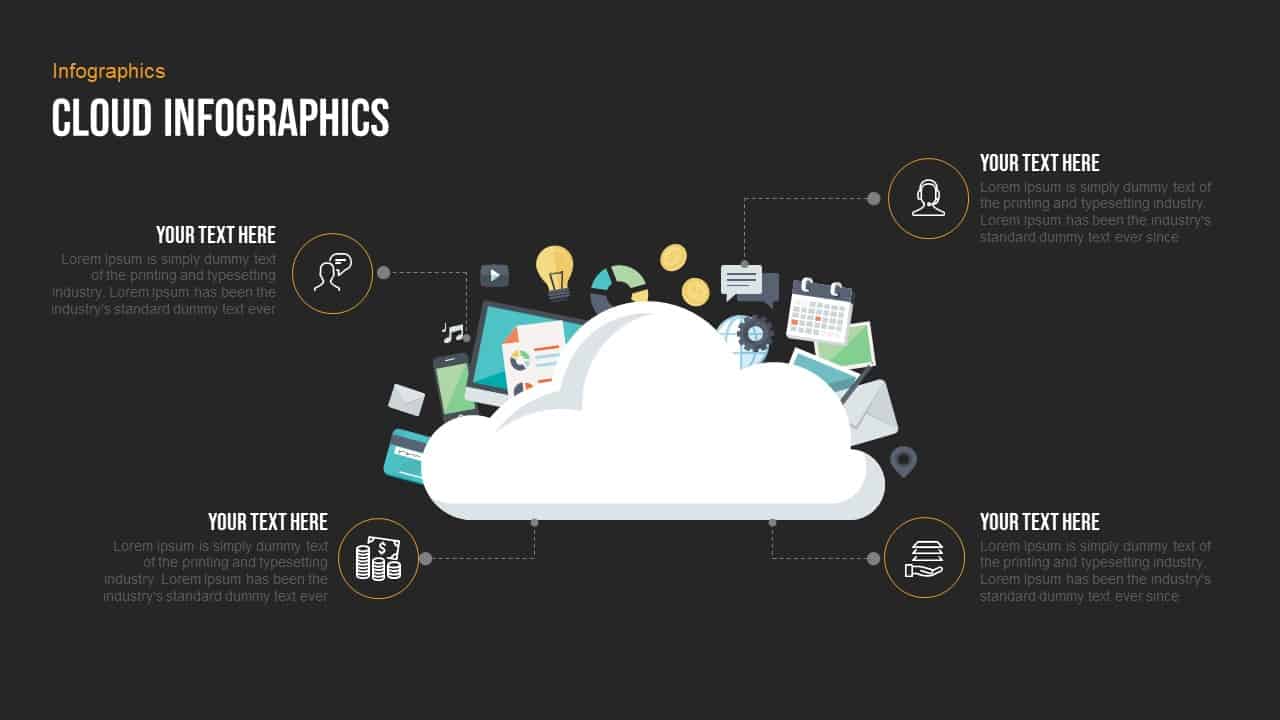
Free Professional Cloud Infographics Template for PowerPoint & Google Slides
Process
Free
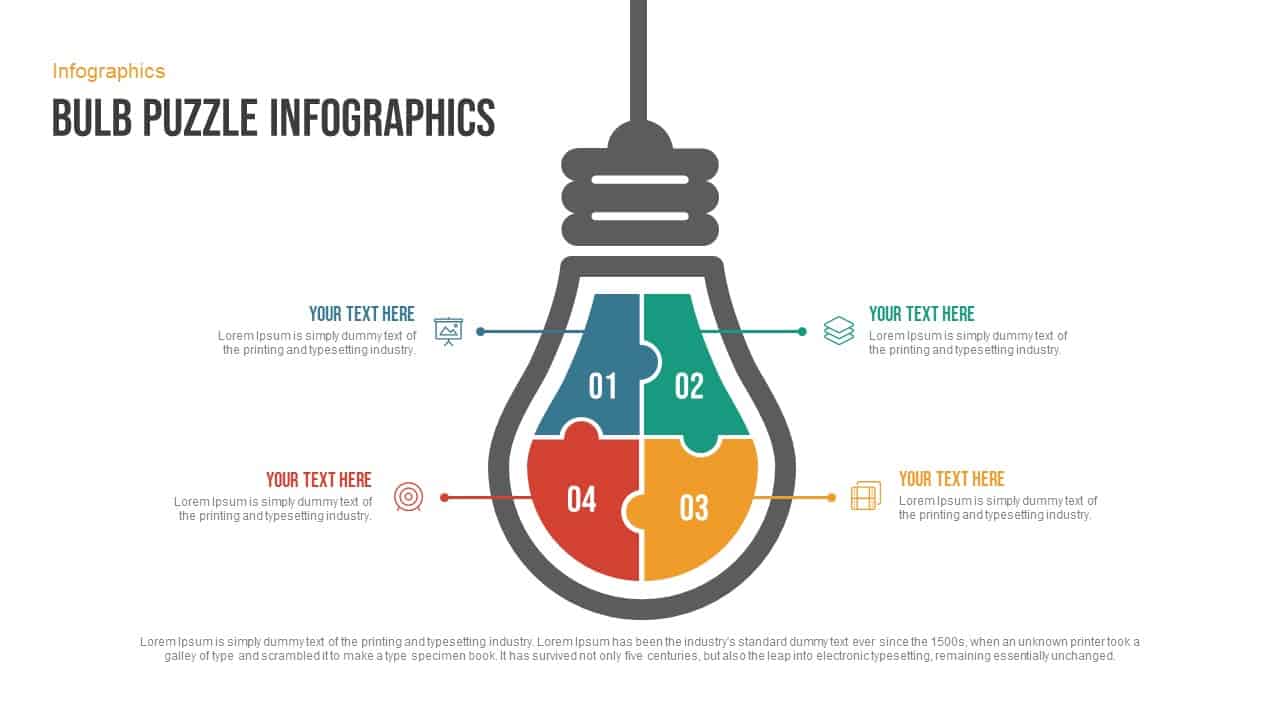
Free Bulb Puzzle Infographics Diagram Template for PowerPoint & Google Slides
Process
Free
Business Innovation Infographics template for PowerPoint & Google Slides
Process
Pipe Water Infographics Flow Diagram Template for PowerPoint & Google Slides
Process
Five-Stage Pyramid Infographics Process Template for PowerPoint & Google Slides
Pyramid
Mobile Infographics Data Visualization Template for PowerPoint & Google Slides
Infographics
Canada Population Infographics Template for PowerPoint & Google Slides
World Maps
Business Growth Infographics Template for PowerPoint & Google Slides
Roadmap
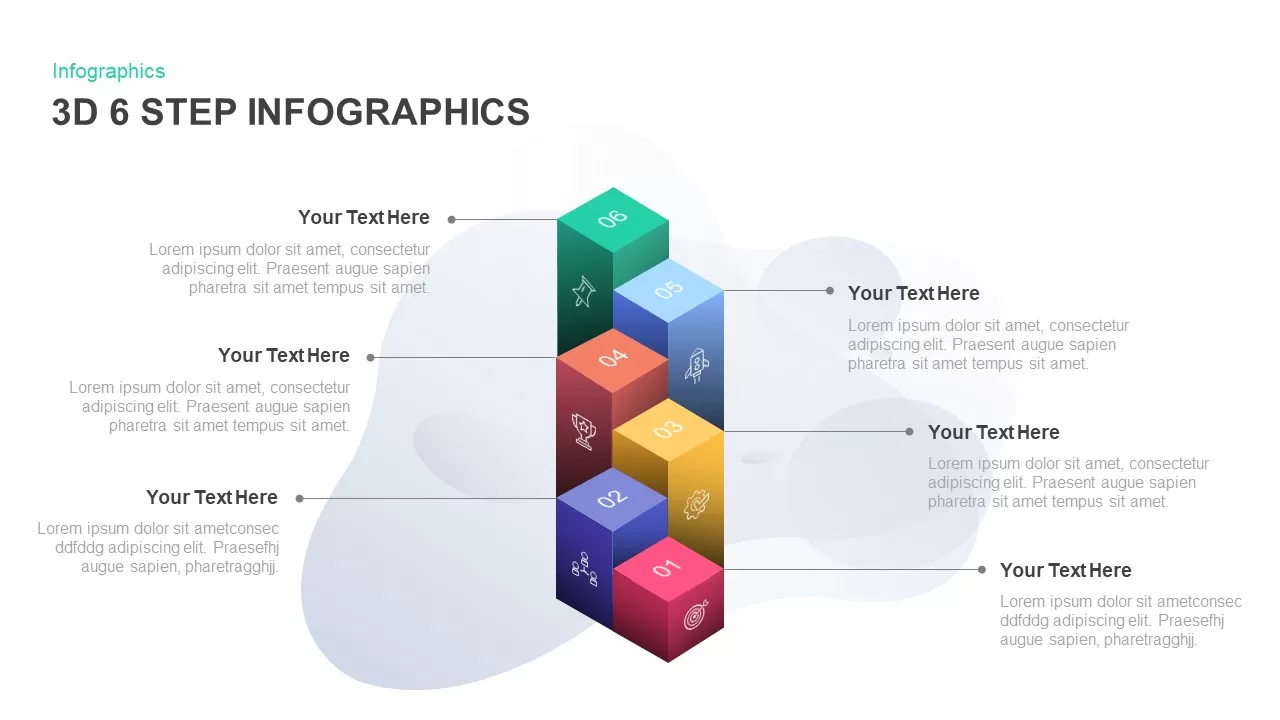
3D 6-Step Infographics Process Diagram Template for PowerPoint & Google Slides
Infographics
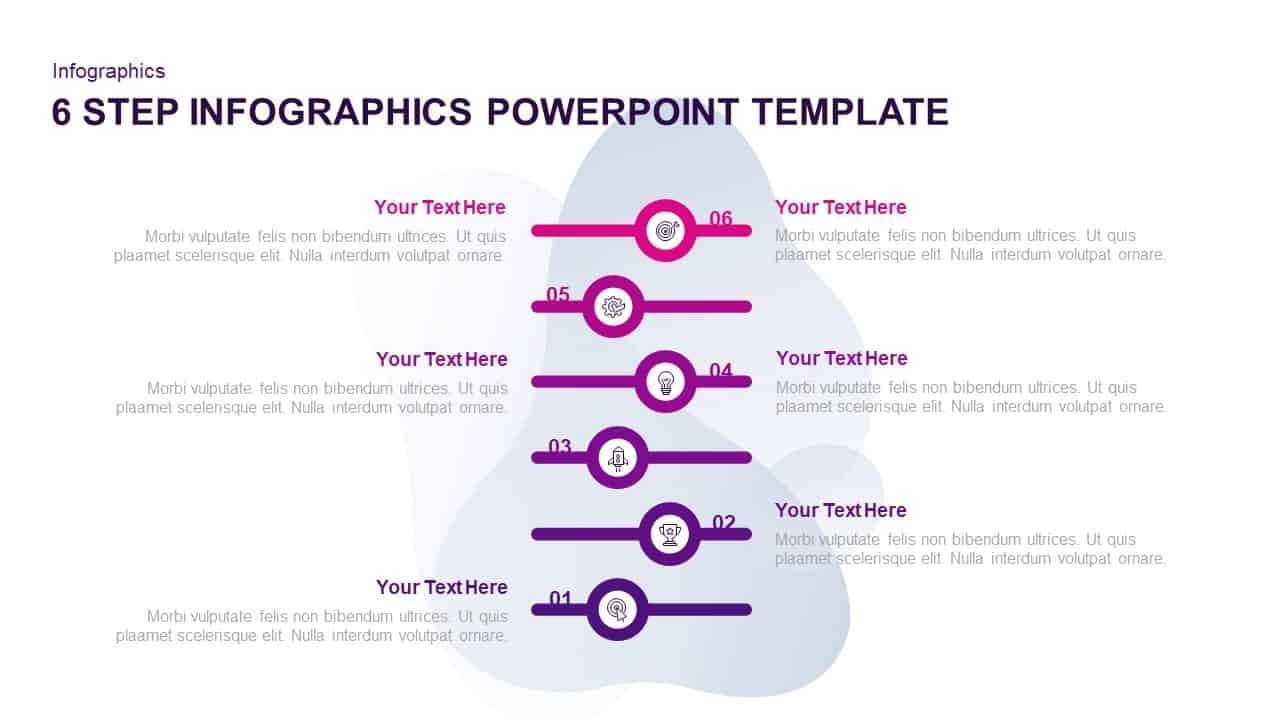
Six-Step Purple Gradient Infographics Template for PowerPoint & Google Slides
Process
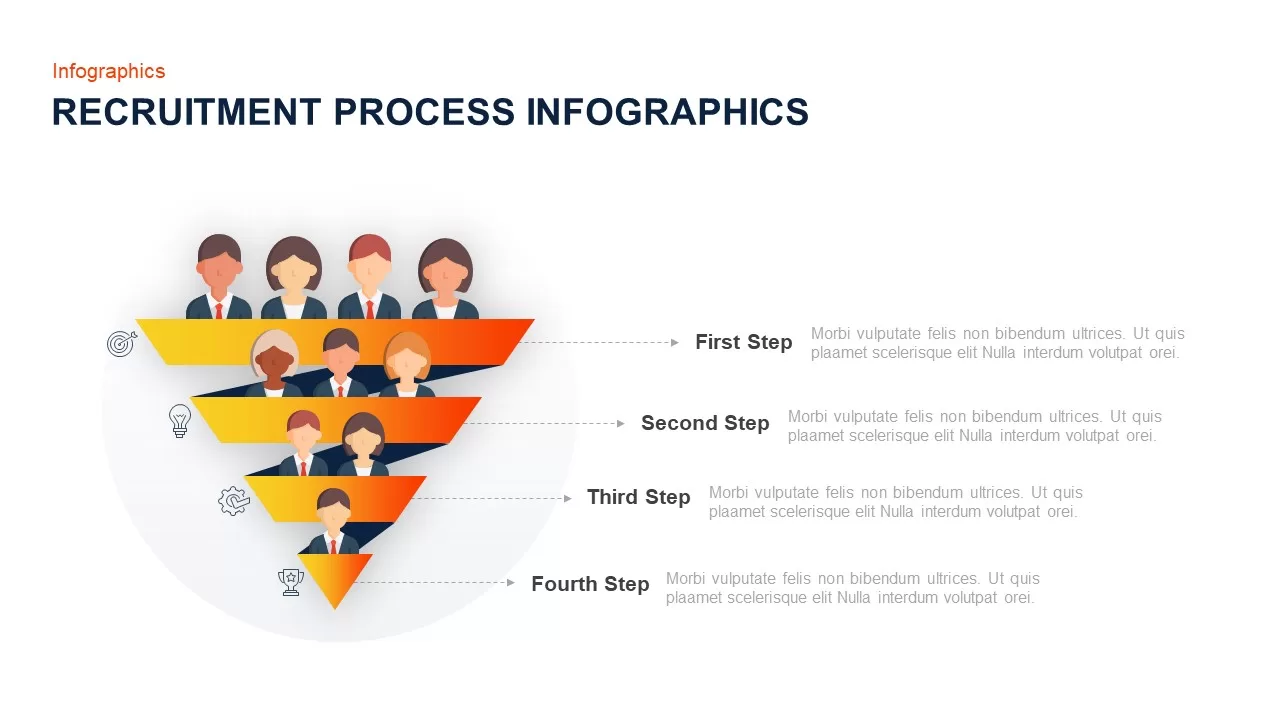
Recruitment Process Funnel Infographics Template for PowerPoint & Google Slides
Recruitment
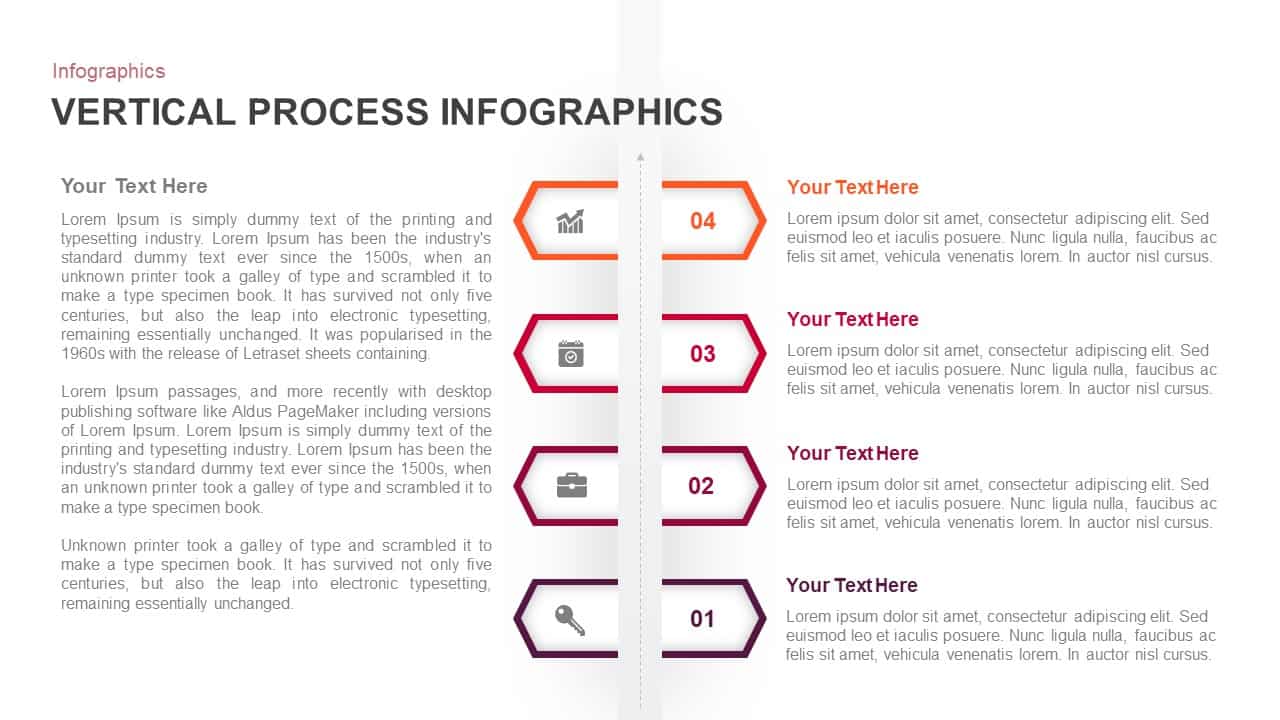
Vertical Process Infographics Template for PowerPoint & Google Slides
Process
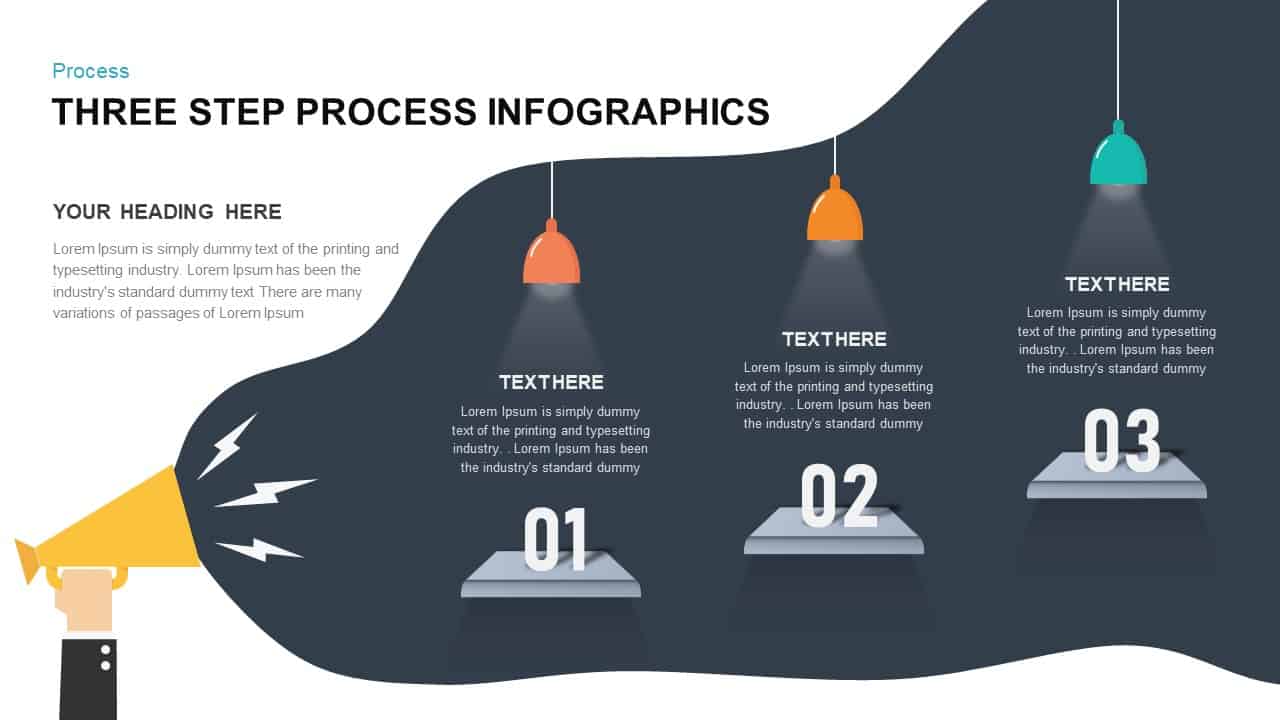
Three-Step Process Infographics Template for PowerPoint & Google Slides
Process
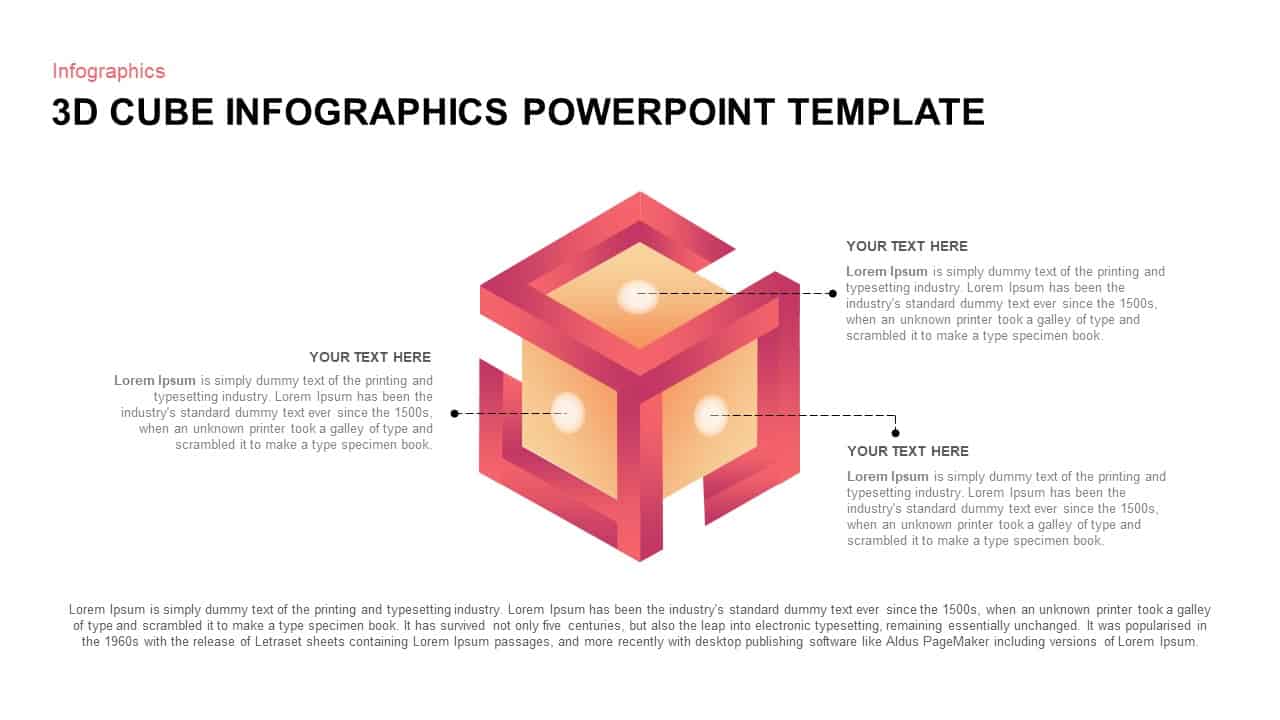
3D Cube Infographics template for PowerPoint & Google Slides
Process
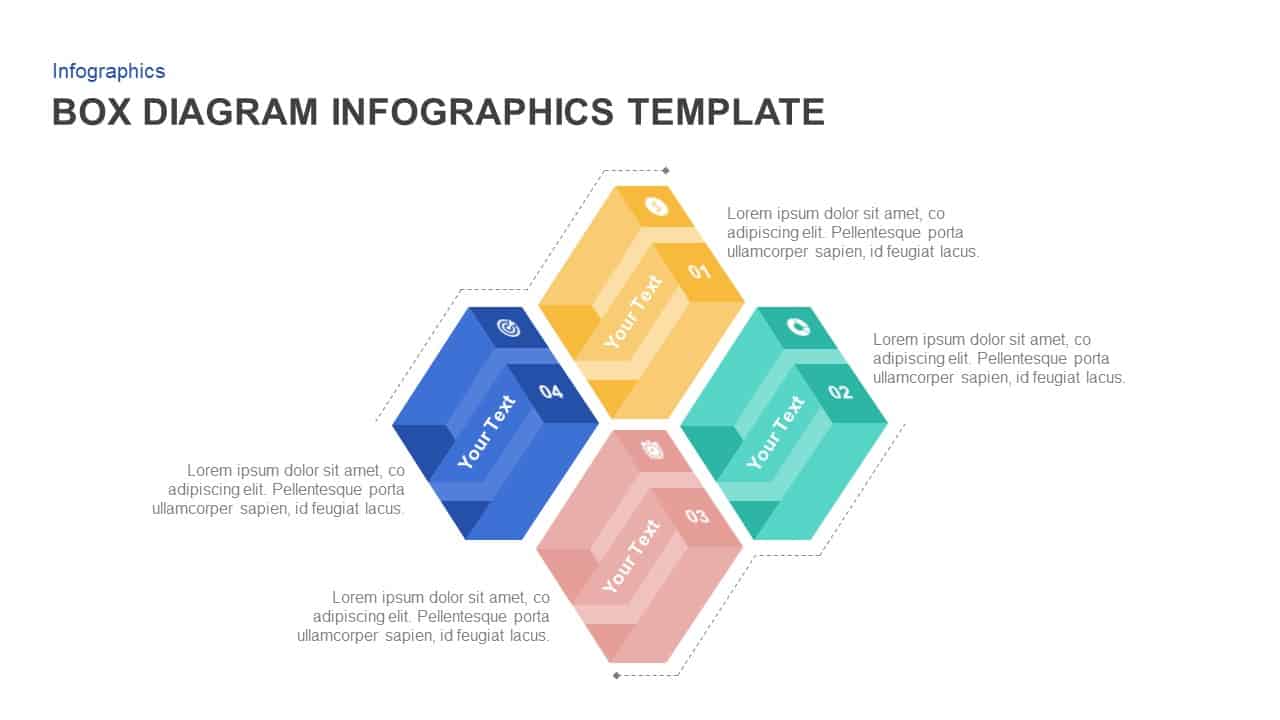
Box Diagram Infographics template for PowerPoint & Google Slides
Business

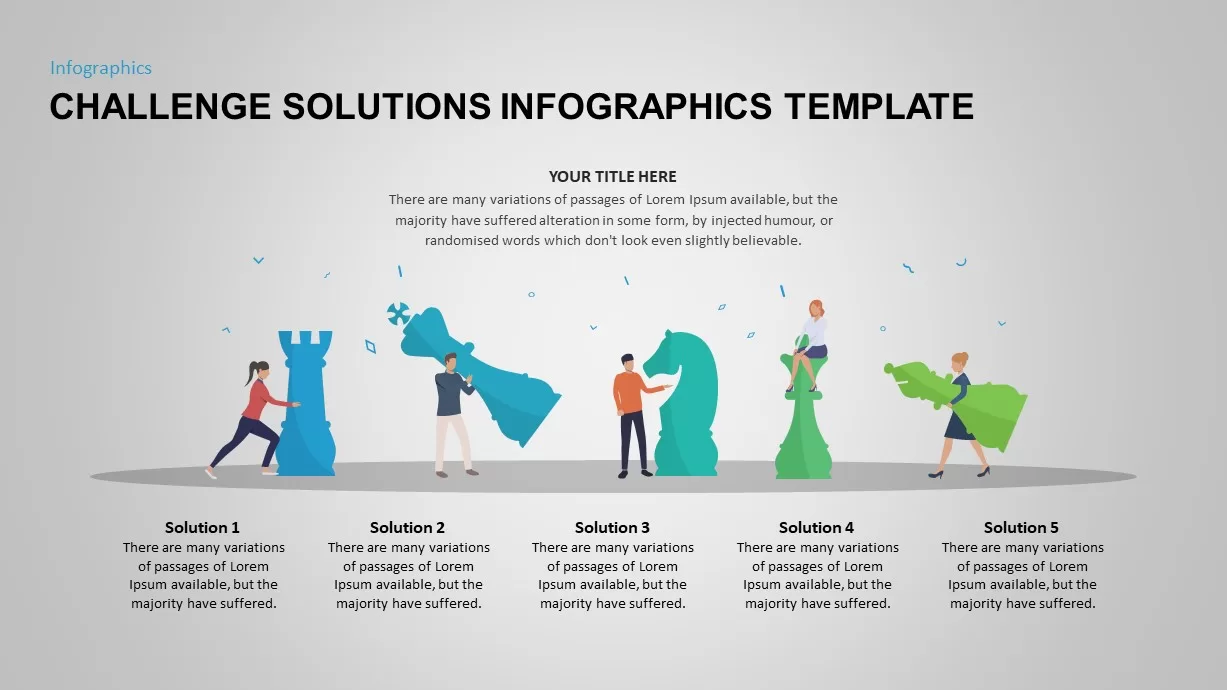
Challenge Solutions Infographics Template for PowerPoint & Google Slides
Opportunities Challenges
Modern Circular Infographics Template for PowerPoint & Google Slides
Circular
Five-Step Circular Badge Infographics Template for PowerPoint & Google Slides
Circular
Four-Step Business Plan Infographics Template for PowerPoint & Google Slides
Business Plan
5 Step Sales Planning Infographics Template for PowerPoint & Google Slides
Process
Opposing Ideas Infographics Pack Template for PowerPoint & Google Slides
Comparison
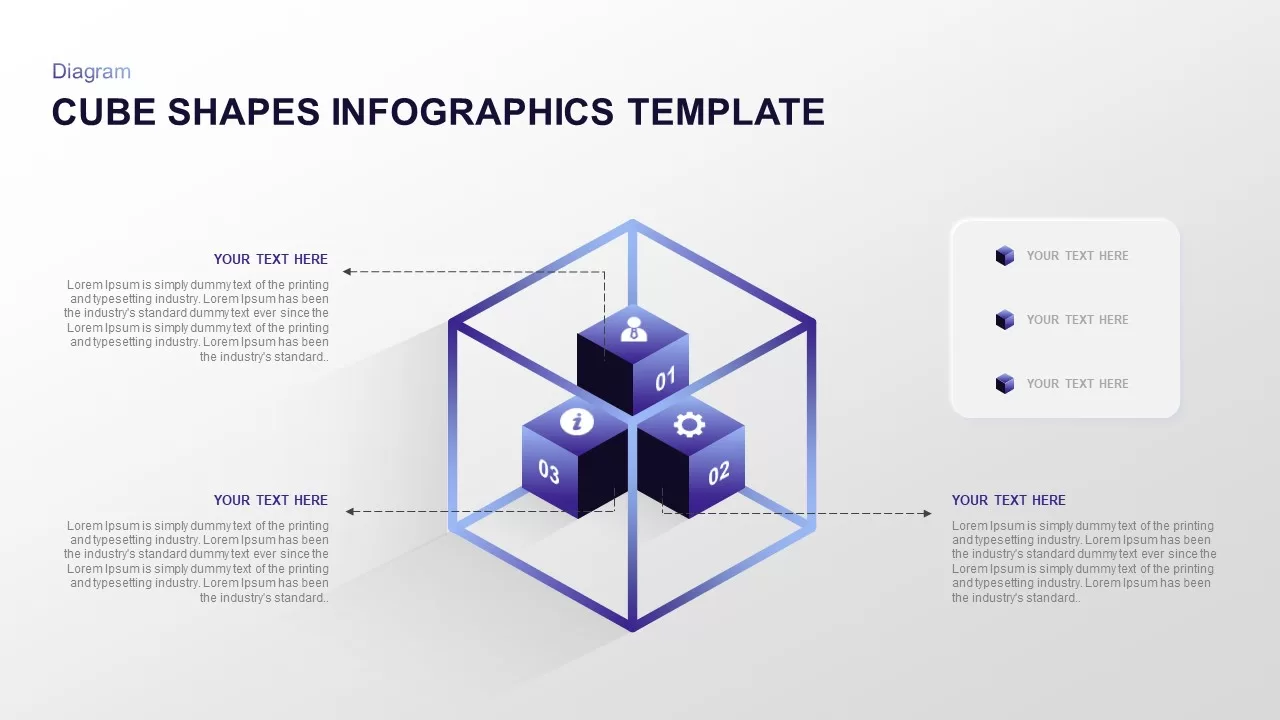
Isometric 3D Cube Shapes Infographics Template for PowerPoint & Google Slides
Infographics
8-Step Circular Diagram Infographics Template for PowerPoint & Google Slides
Circular
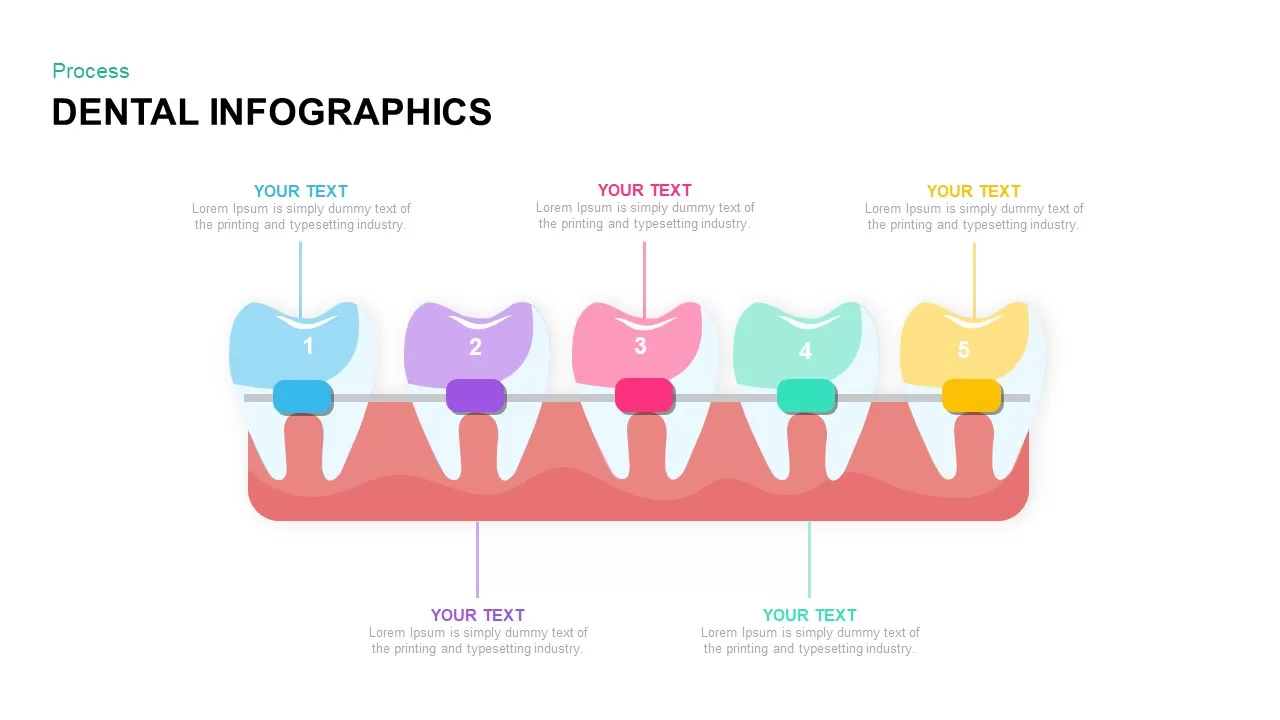
Dental Infographics Process template for PowerPoint & Google Slides
Health
Doodle Infographics Template for PowerPoint & Google Slides
Infographics
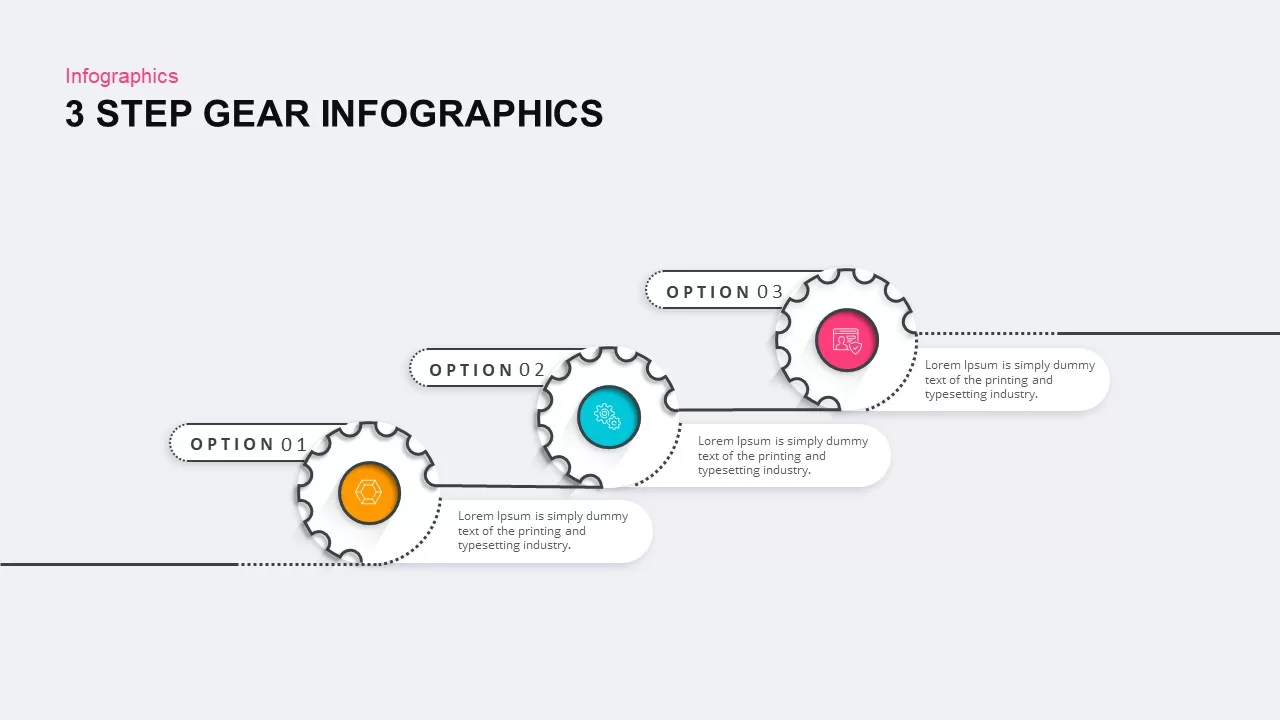
3, 4, and 5 Step Gear Infographics Template for PowerPoint & Google Slides
Process

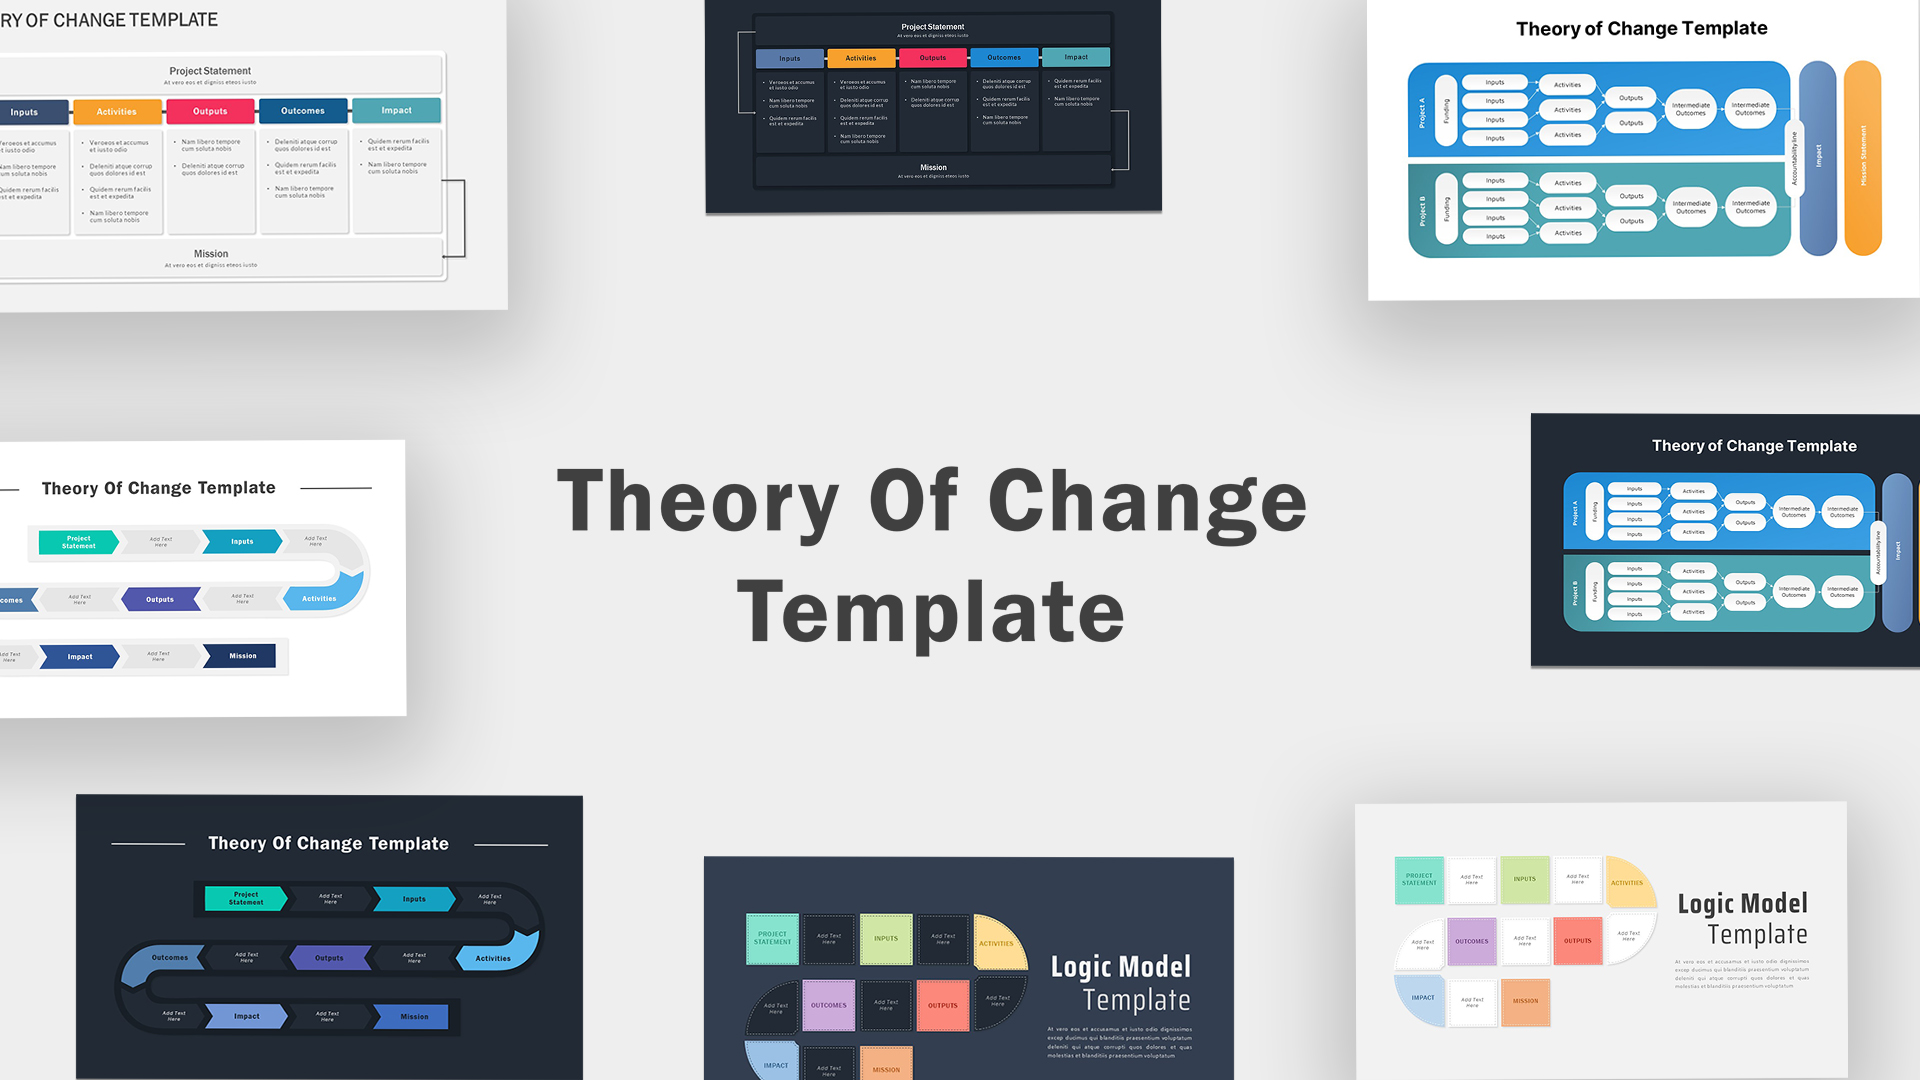
Theory of Change Infographics Pack Template for PowerPoint & Google Slides
Process
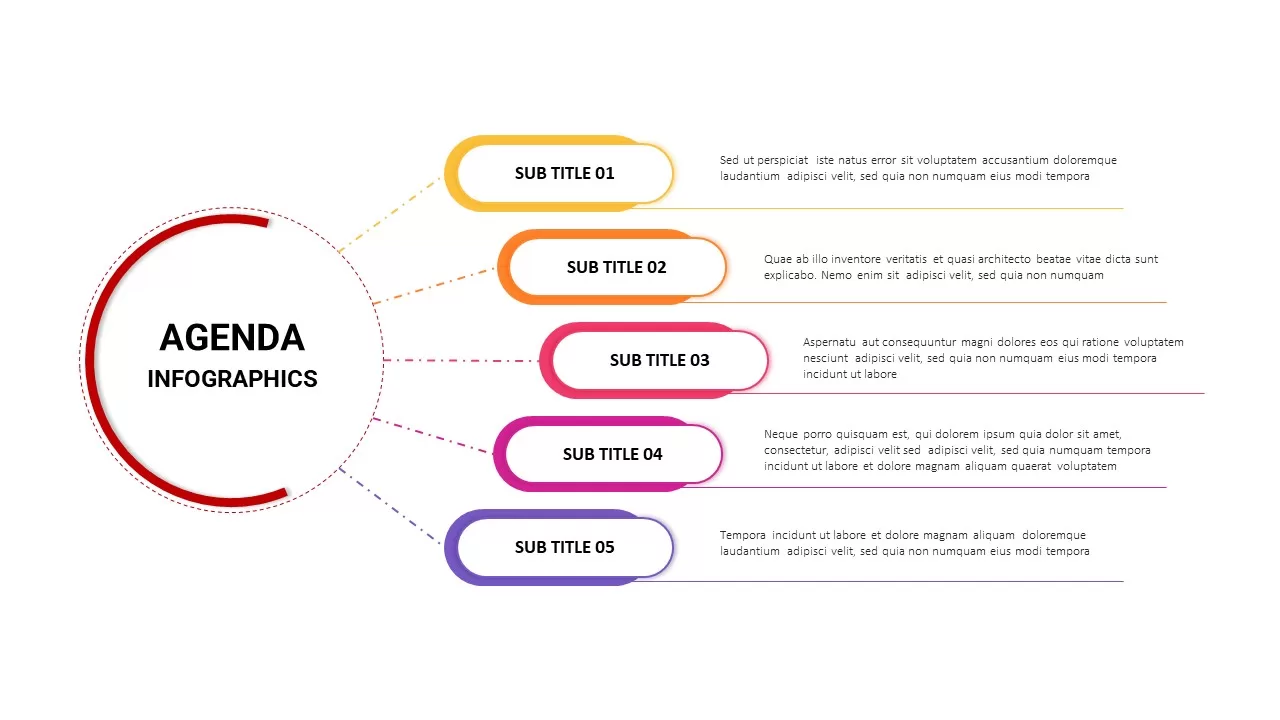
Agenda Infographics Structure template for PowerPoint & Google Slides
Business Plan
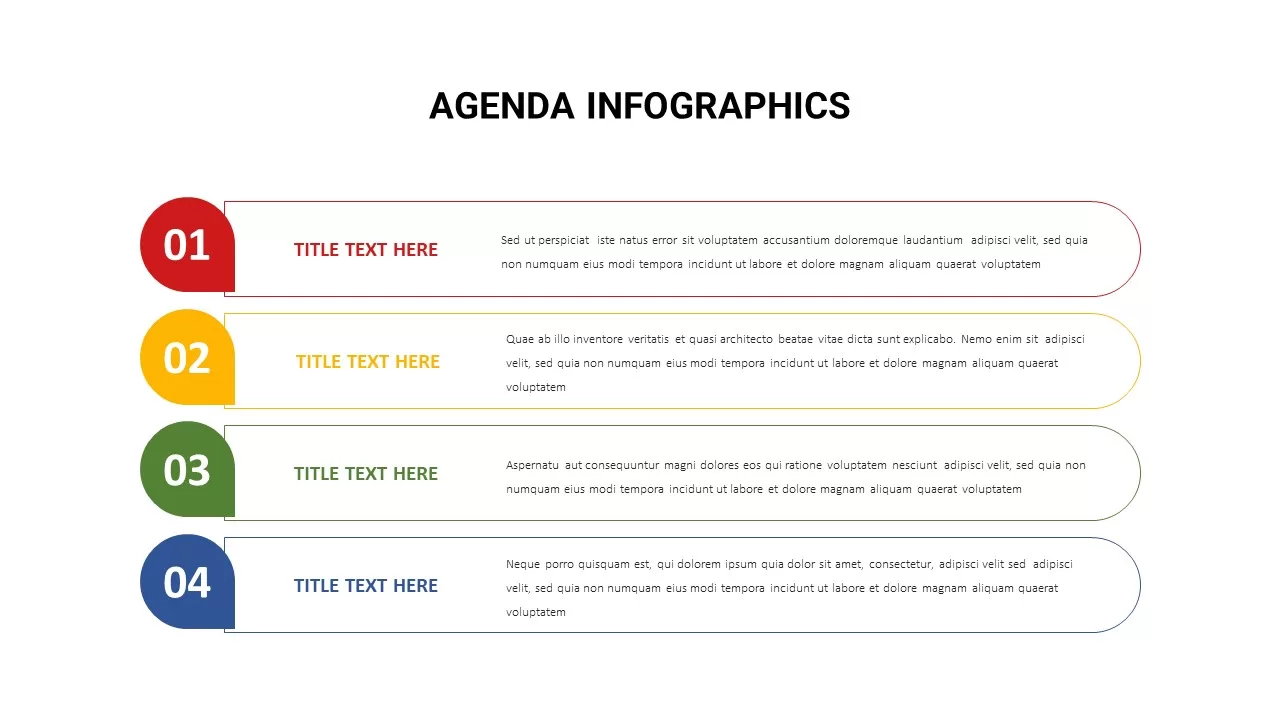
Agenda Infographics List template for PowerPoint & Google Slides
Business Plan
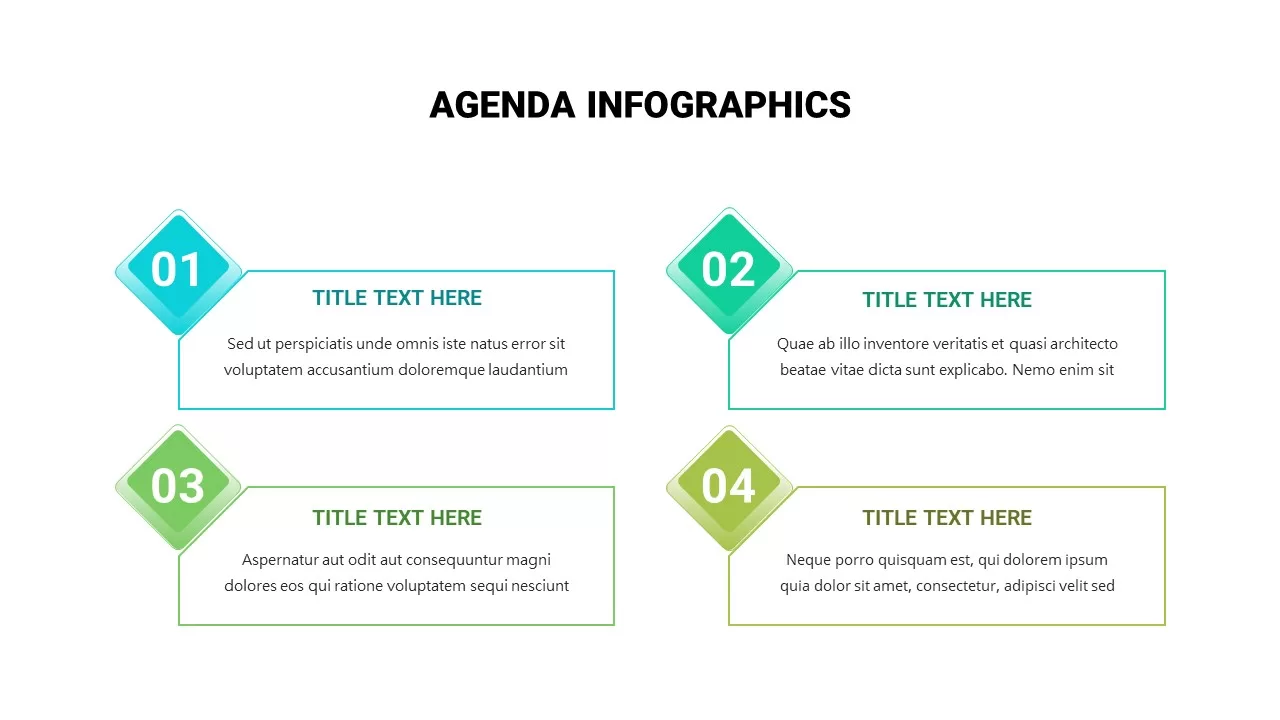
Agenda Infographics Diamond template for PowerPoint & Google Slides
Business Plan
Colorful Process Flow Infographics Template for PowerPoint & Google Slides
Process
Timeline Infographics template for PowerPoint & Google Slides
Timeline
Population Infographics template for PowerPoint & Google Slides
Comparison
Free Percentage Infographics template for PowerPoint & Google Slides
Comparison
Free
Before and After Comparison Infographics Template for PowerPoint & Google Slides
Comparison
Turtle Diagram Infographics Template for PowerPoint & Google Slides
Process
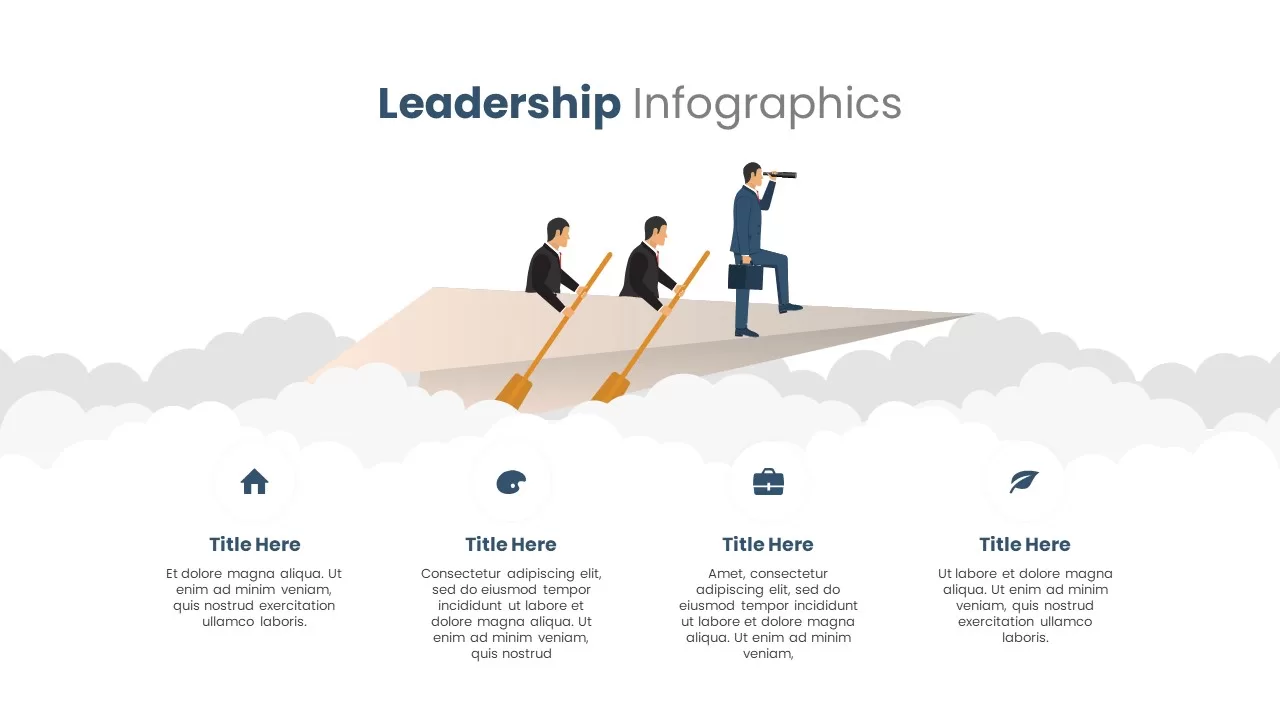
Versatile Leadership Infographics Template for PowerPoint & Google Slides
Infographics
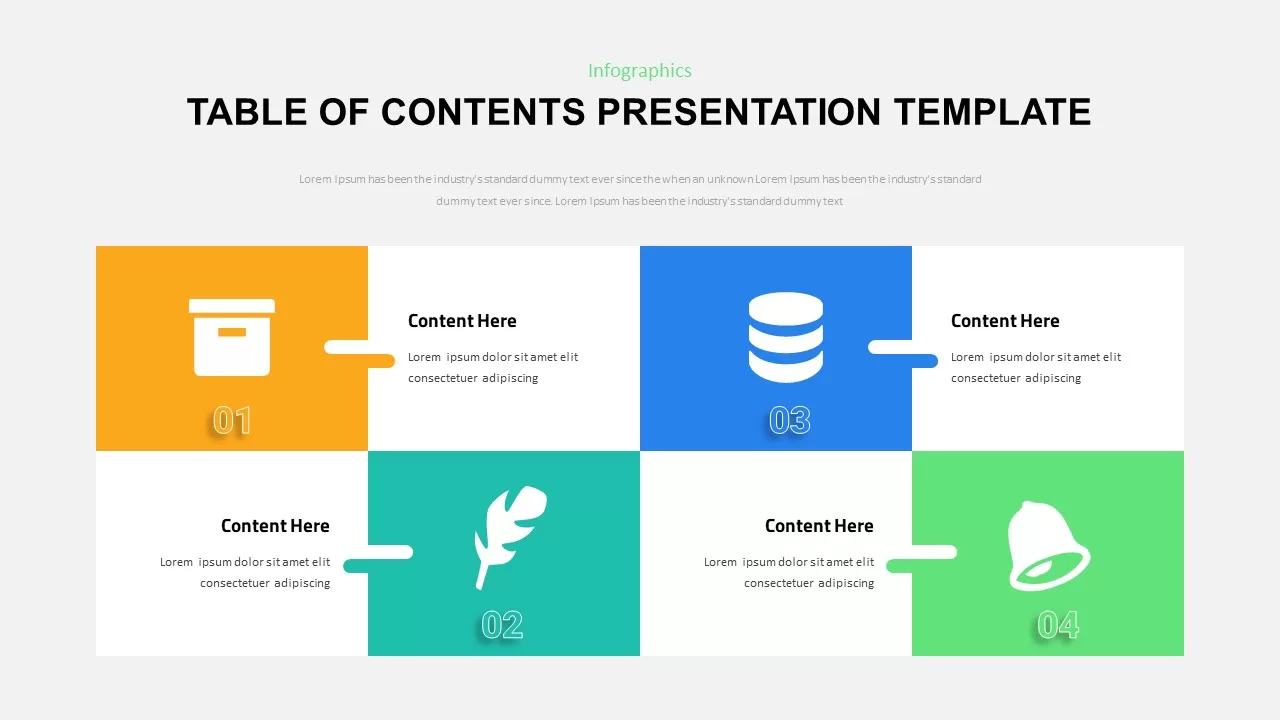
Table of Contents Infographics template for PowerPoint & Google Slides
Company Profile
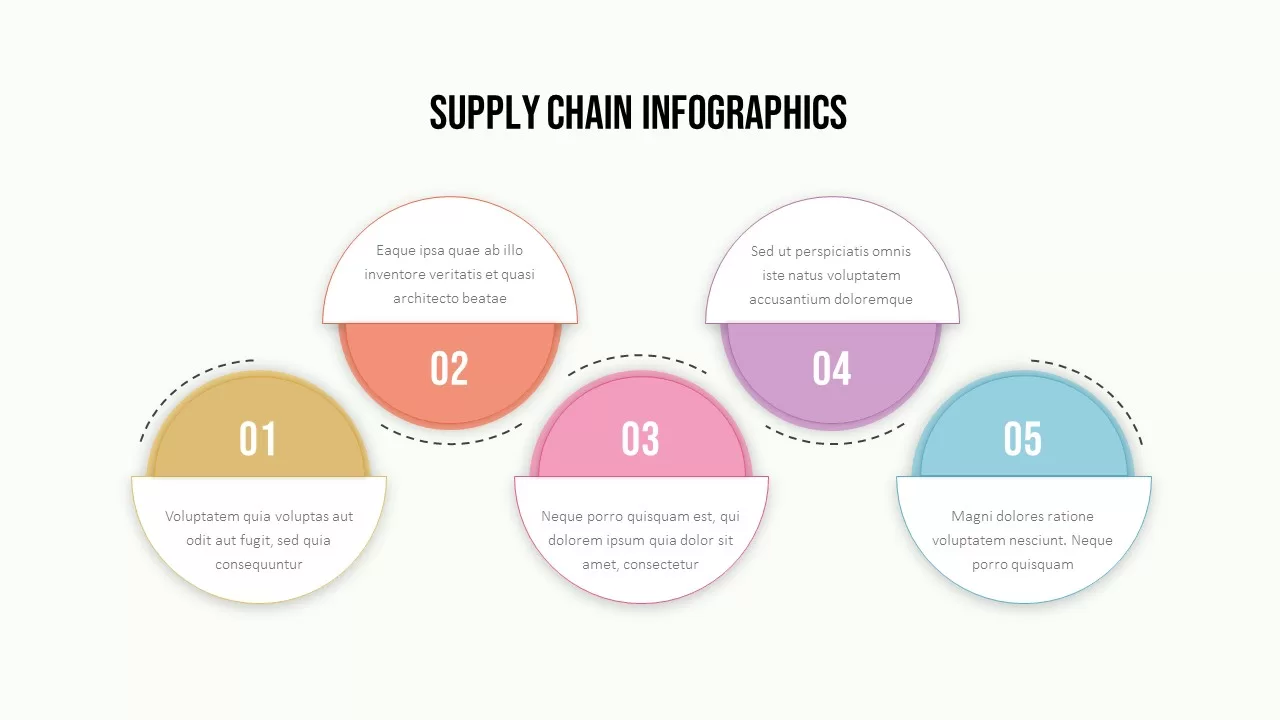
Supply Chain Circular Process Infographics Template for PowerPoint & Google Slides
Business Strategy
Agriculture Infographics Slide with Progress Rings & Metrics Template for PowerPoint & Google Slides
Pie/Donut
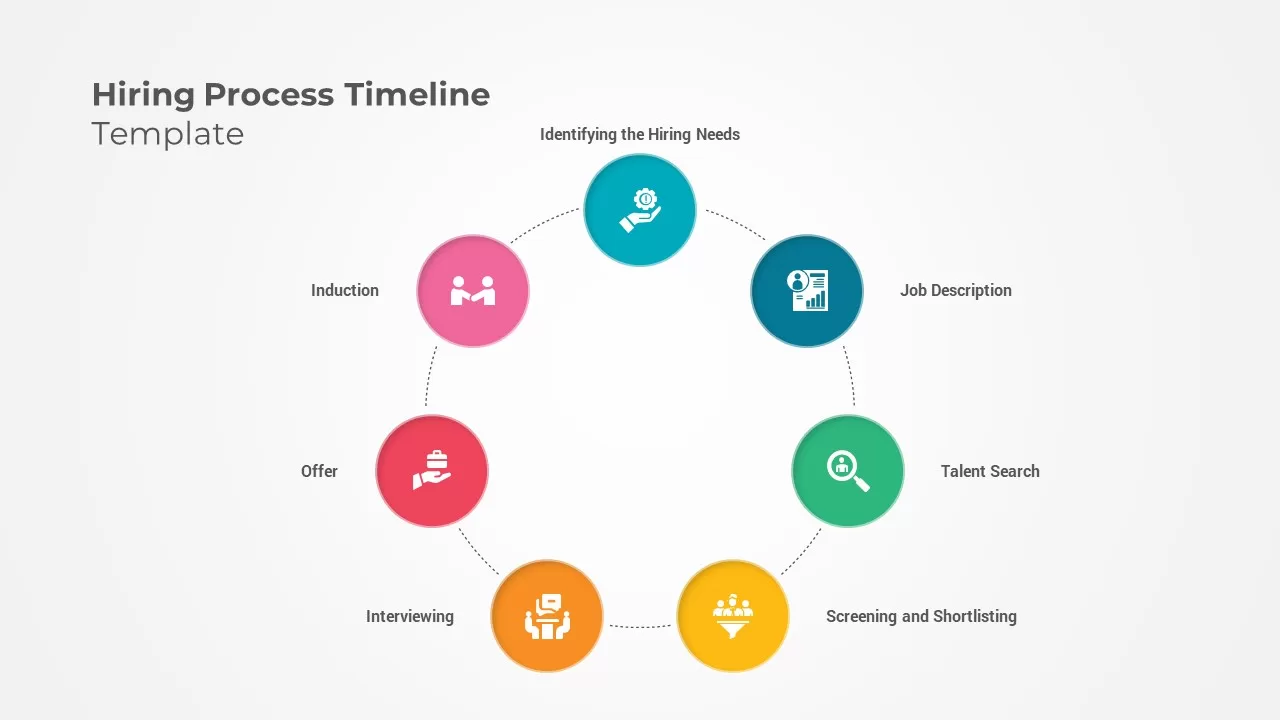
Hiring Process Timeline Infographics Template for PowerPoint & Google Slides
Recruitment
5 Layer Concentric Circles Infographics Template for PowerPoint & Google Slides
Circular
Flywheel Infographics Pack Template for PowerPoint & Google Slides
Circular
Flywheel Infographics template for PowerPoint & Google Slides
Business Strategy
Modern Social Media Infographics Template for PowerPoint & Google Slides
Digital Marketing
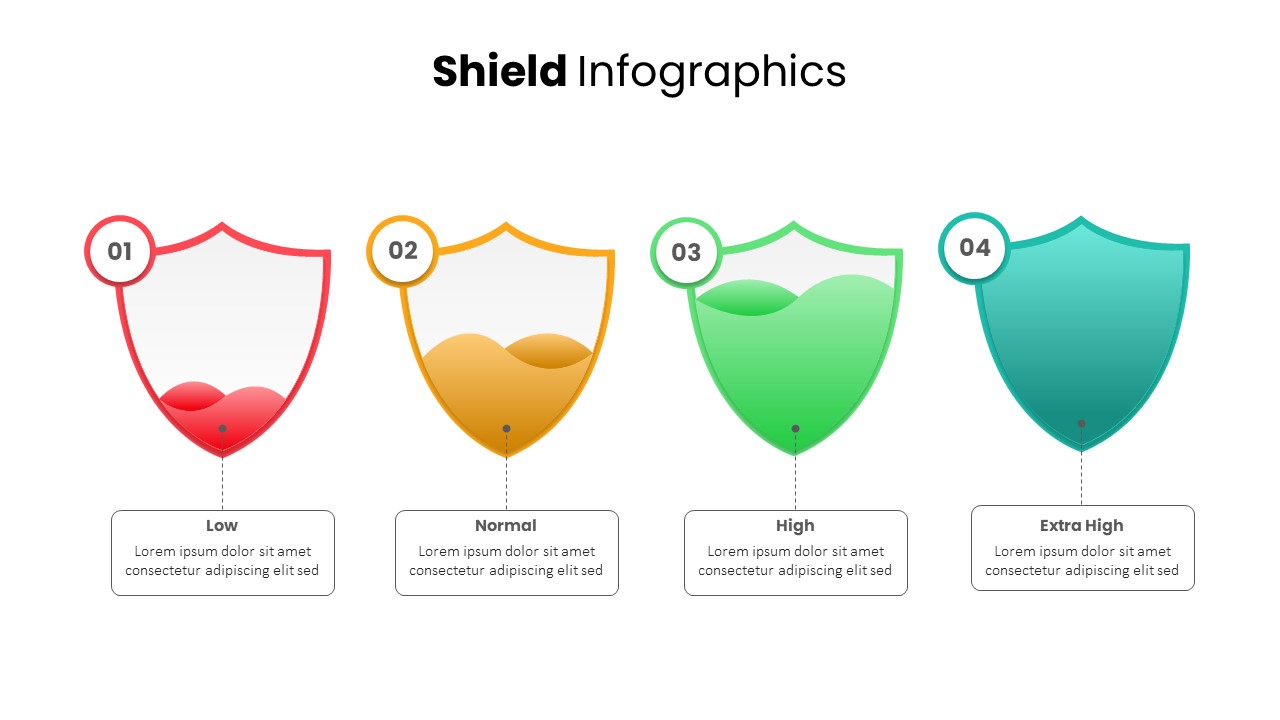
Shield Infographics Four-Part Framework Template for PowerPoint & Google Slides
Process
Shield Infographics Risk Indicators Template for PowerPoint & Google Slides
Infographics
Conflict Infographics Comparison Template for PowerPoint & Google Slides
Infographics

DevOps Infographics & Process Flow Template for PowerPoint & Google Slides
Information Technology
Pharmacology Infographics Slide Template for PowerPoint & Google Slides
Health
Free Colorful Timeline Infographics Template for PowerPoint & Google Slides
Timeline
Free
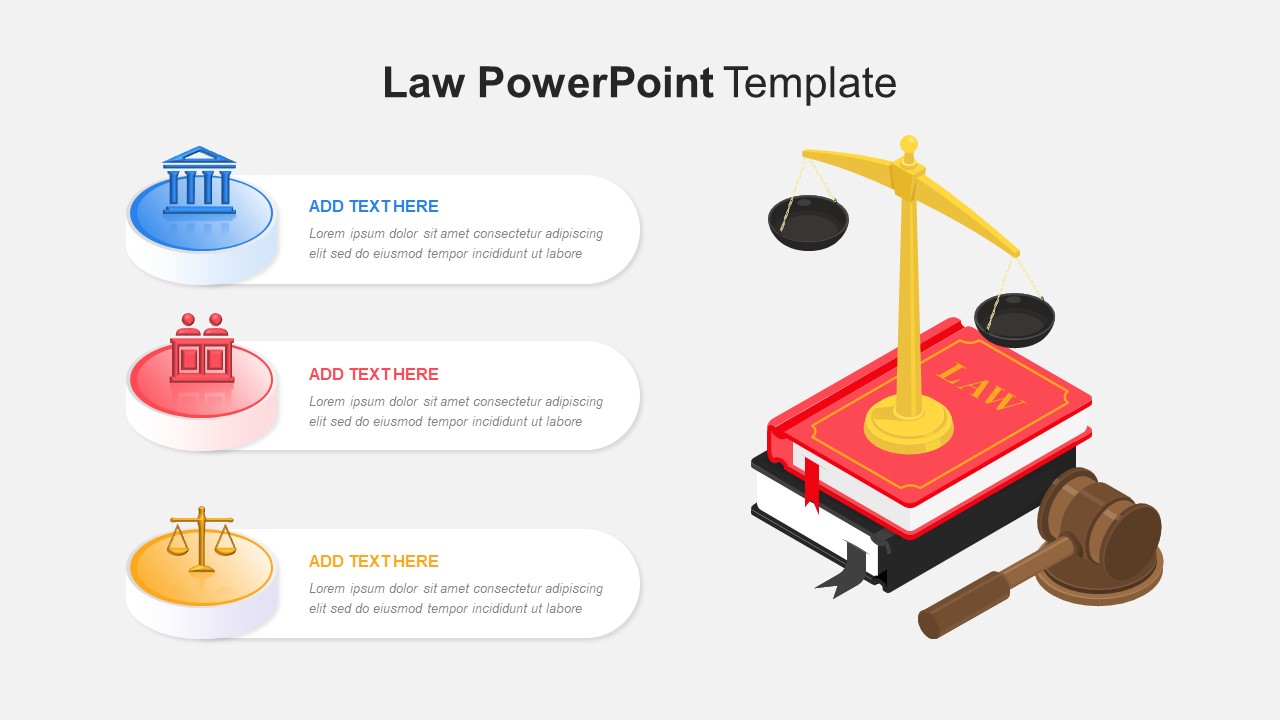
Free Law Infographics Slide Pack Collection Template for PowerPoint & Google Slides
Infographics
Free
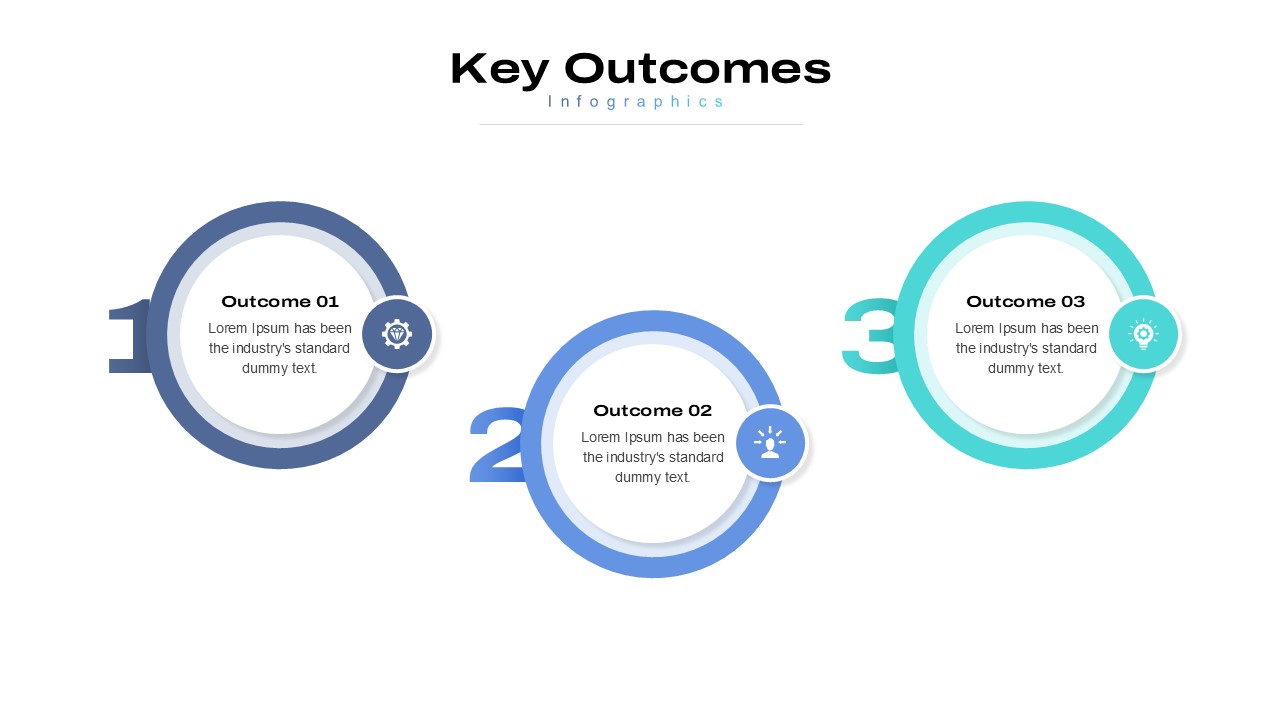
5 Styles Key Outcomes Infographics Pack Template for PowerPoint & Google Slides
Infographics
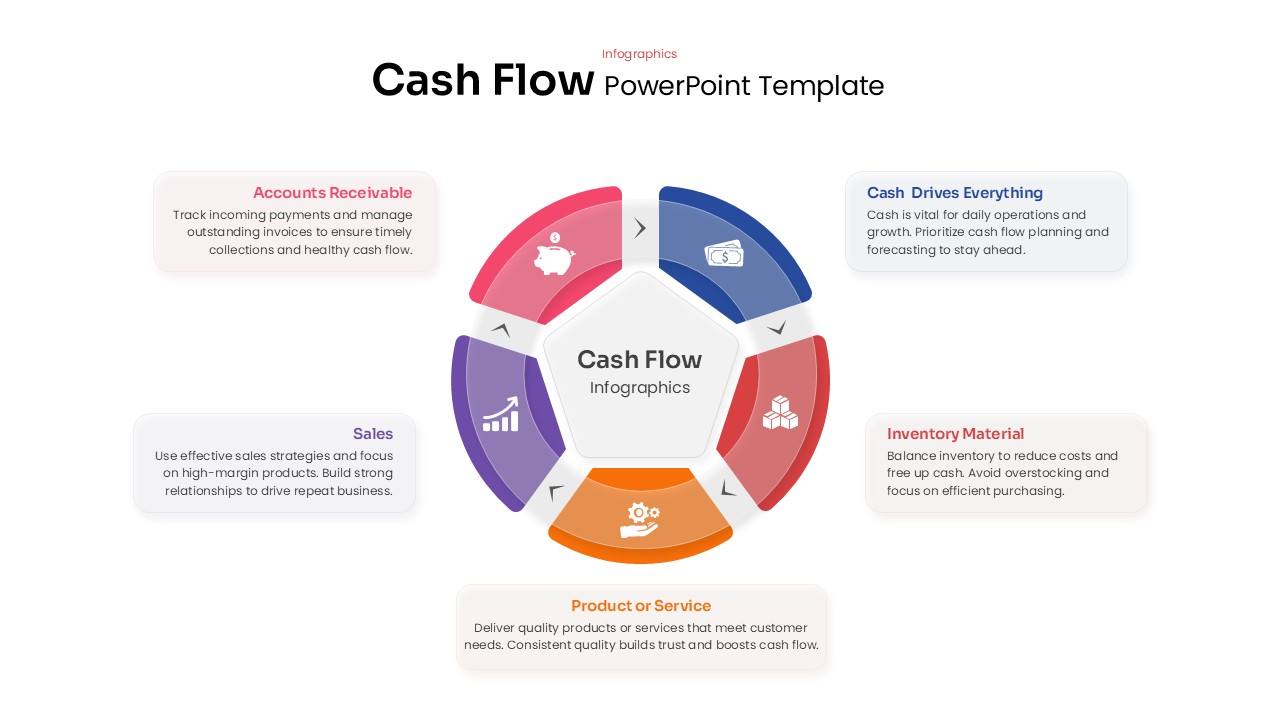
Cash Flow Infographics template for PowerPoint & Google Slides
Business
Technology Tree Infographics Template for PowerPoint & Google Slides
AI