Digital Ecosystem Circular Model Template for PowerPoint & Google Slides


Description
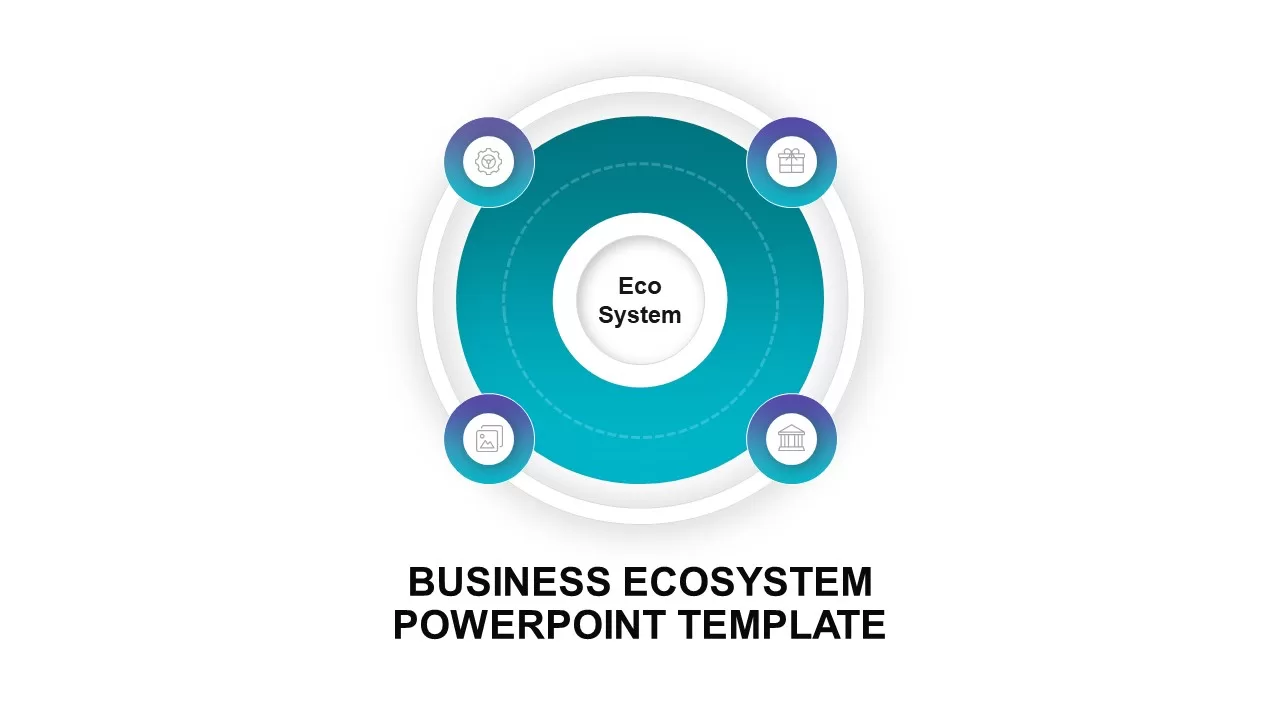
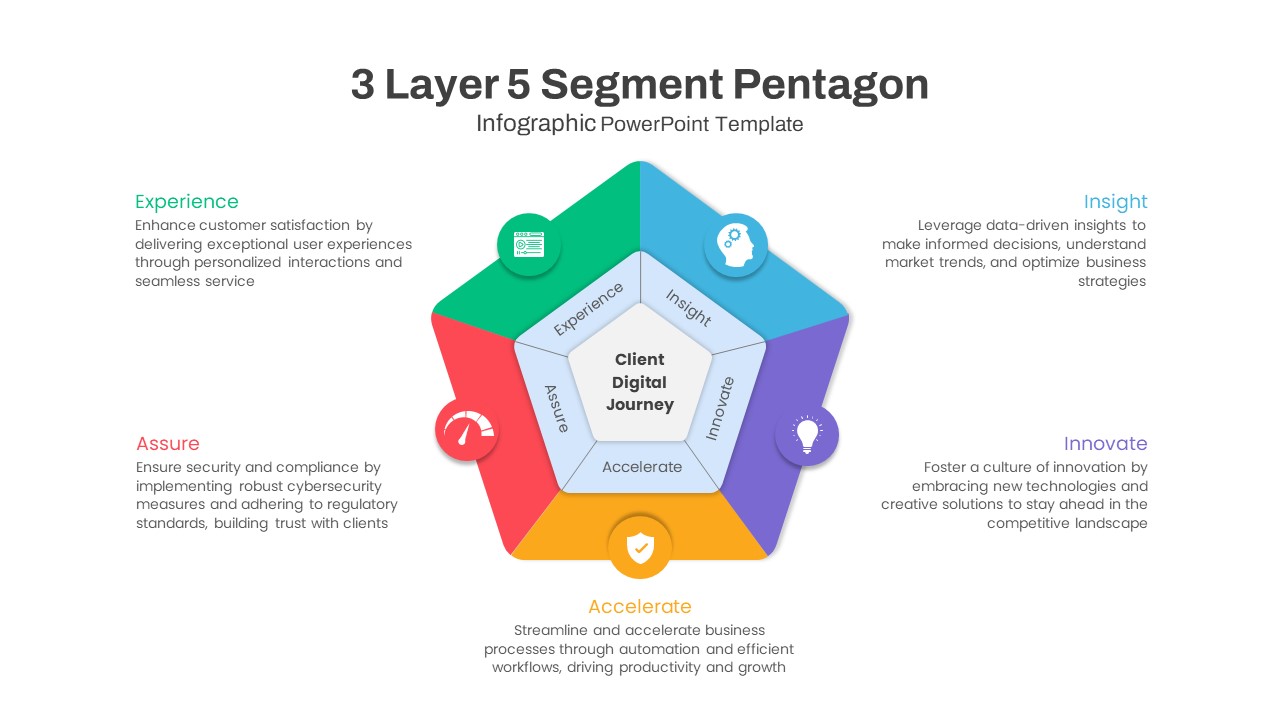
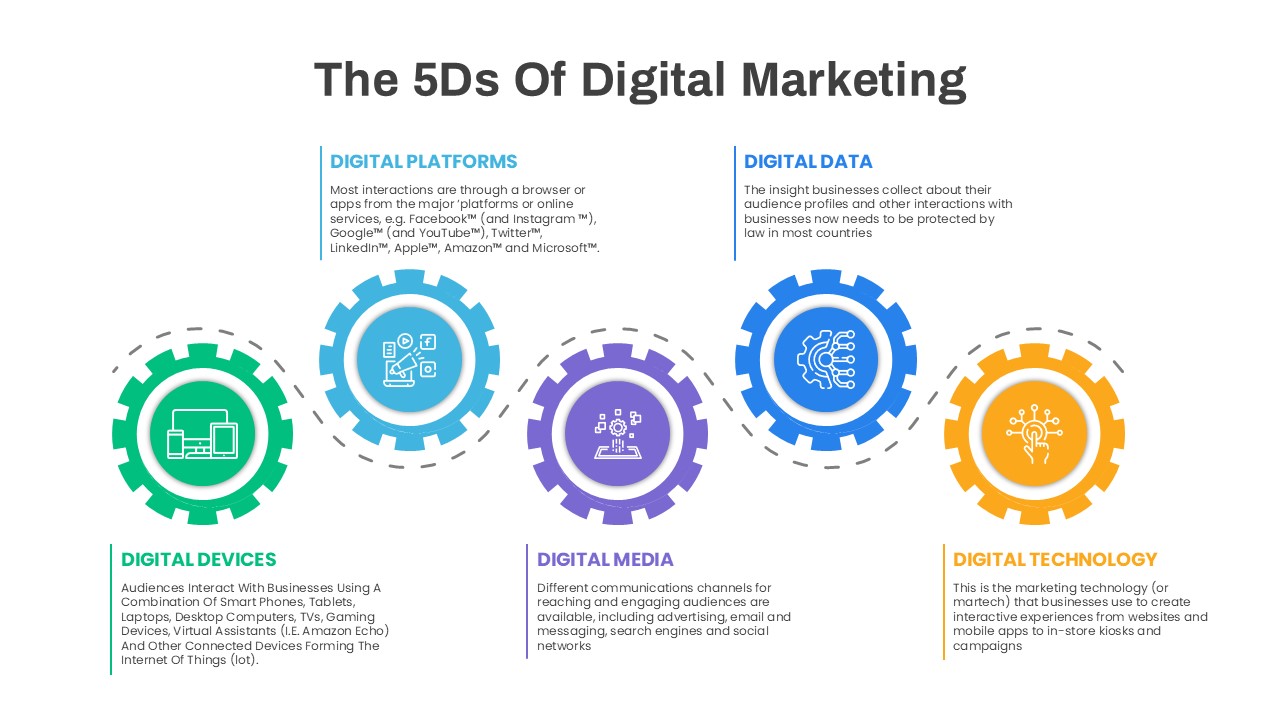
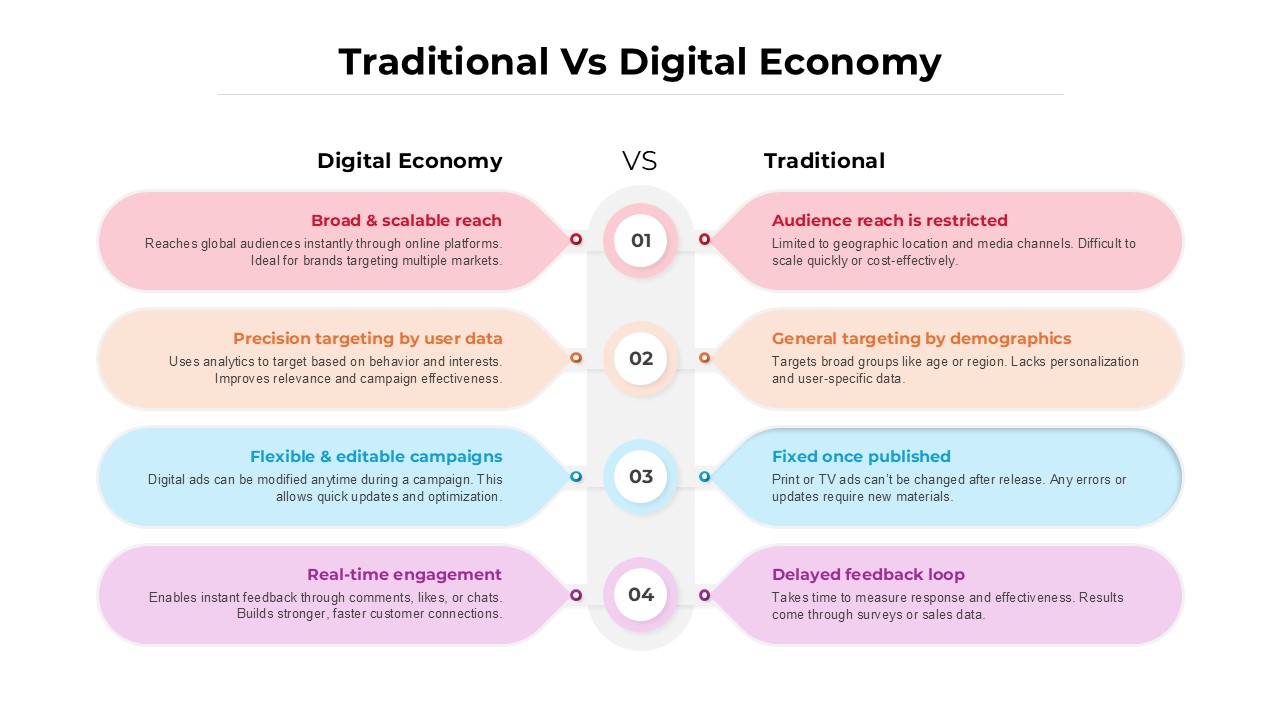
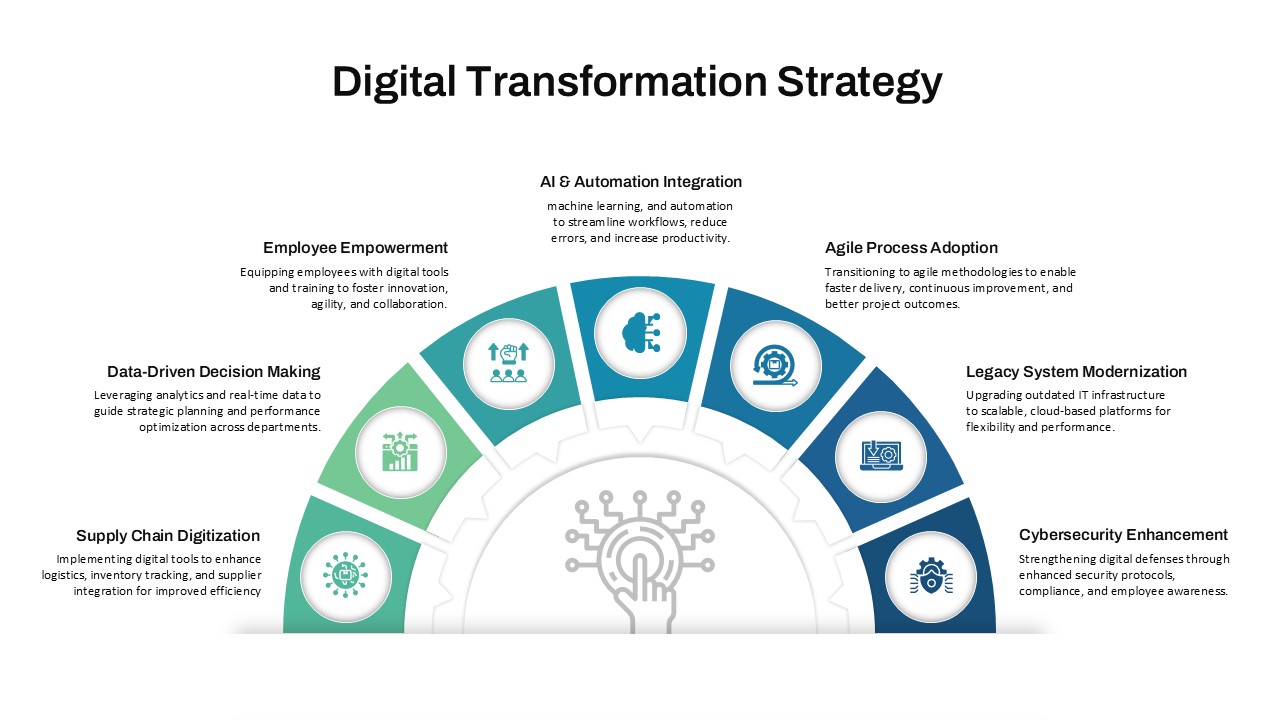
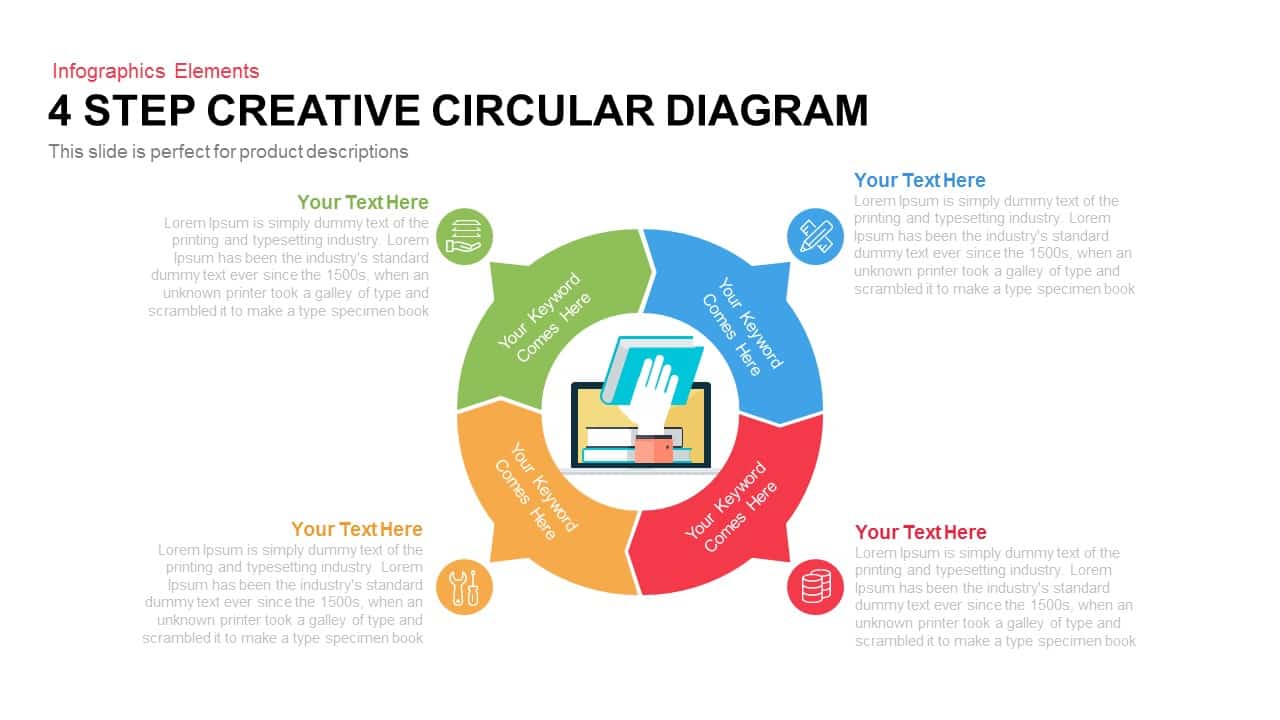
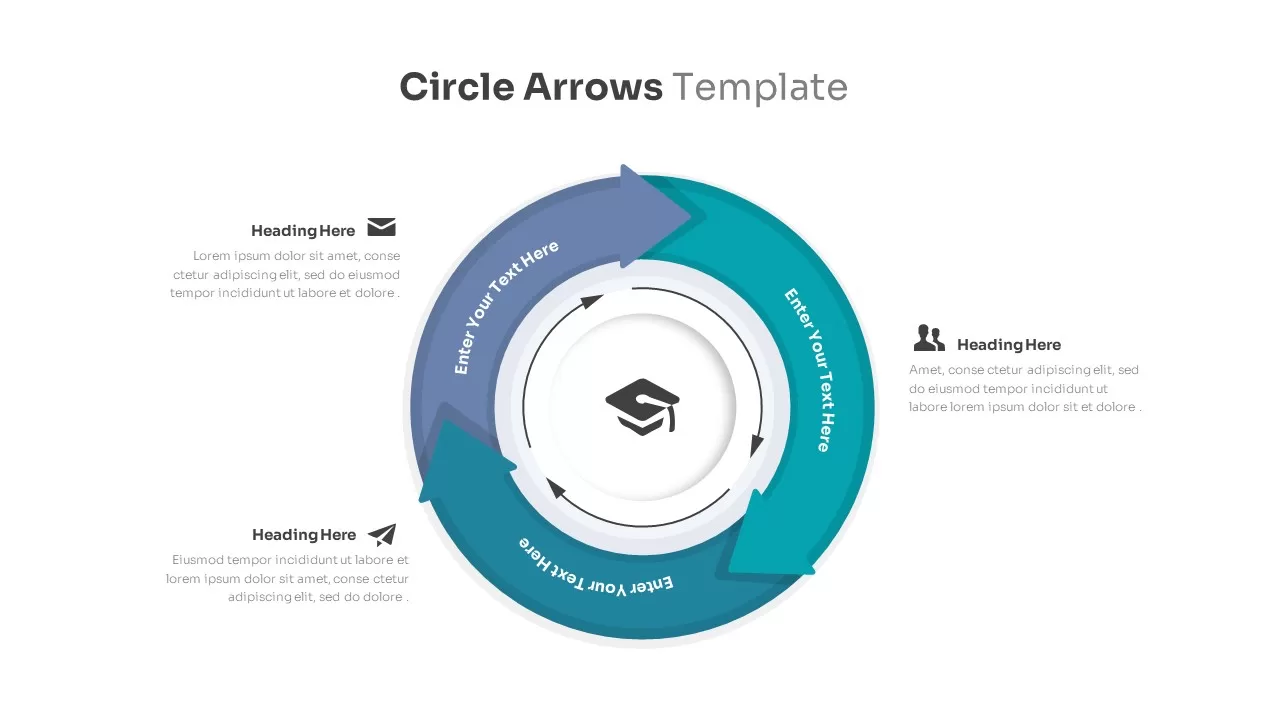
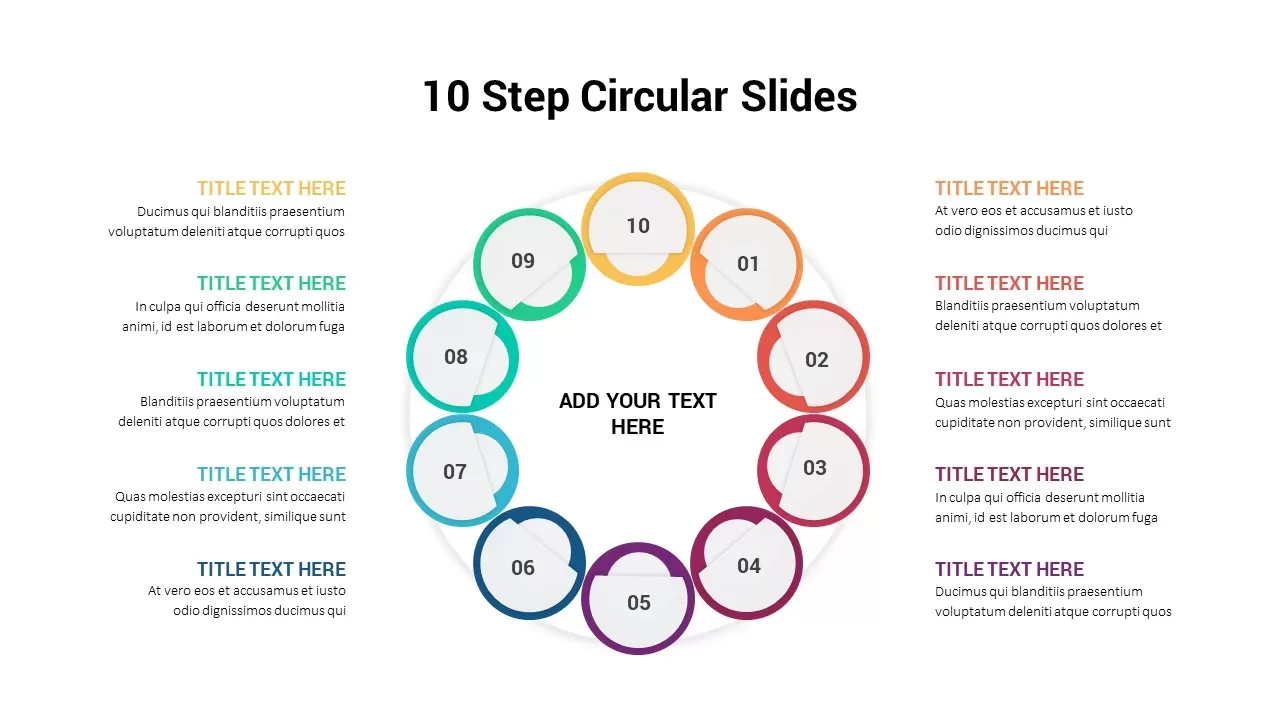
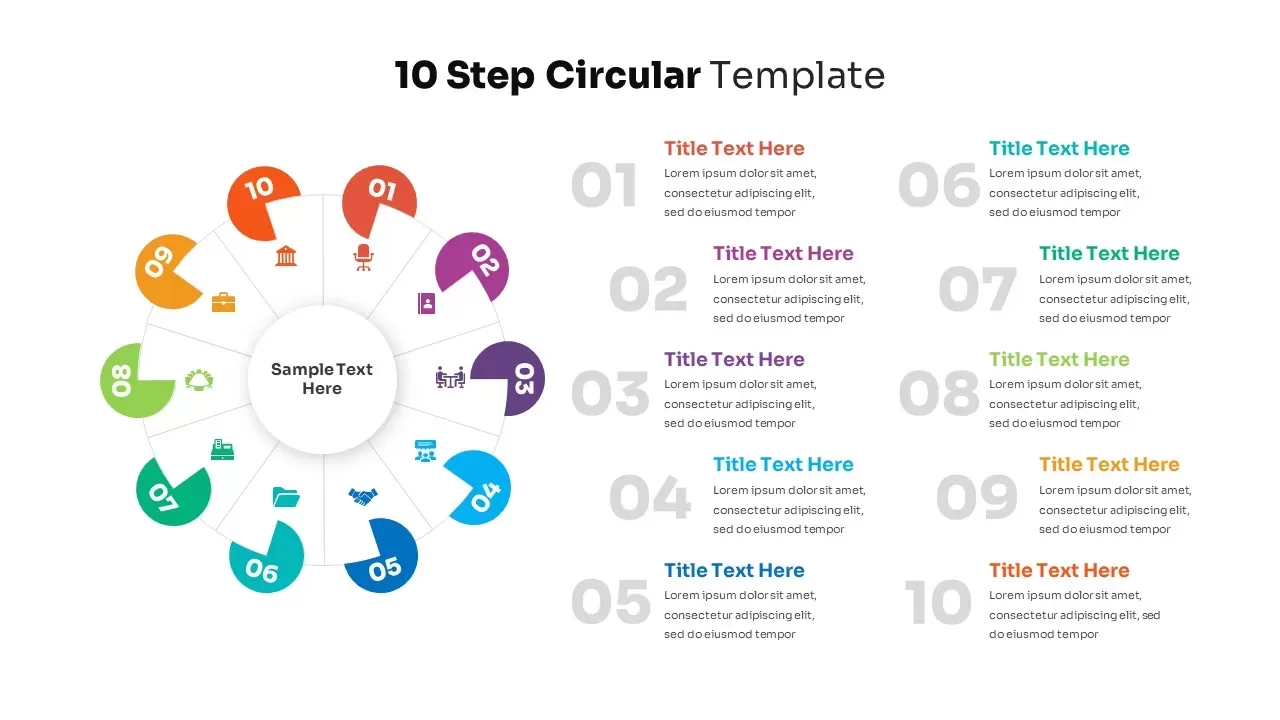
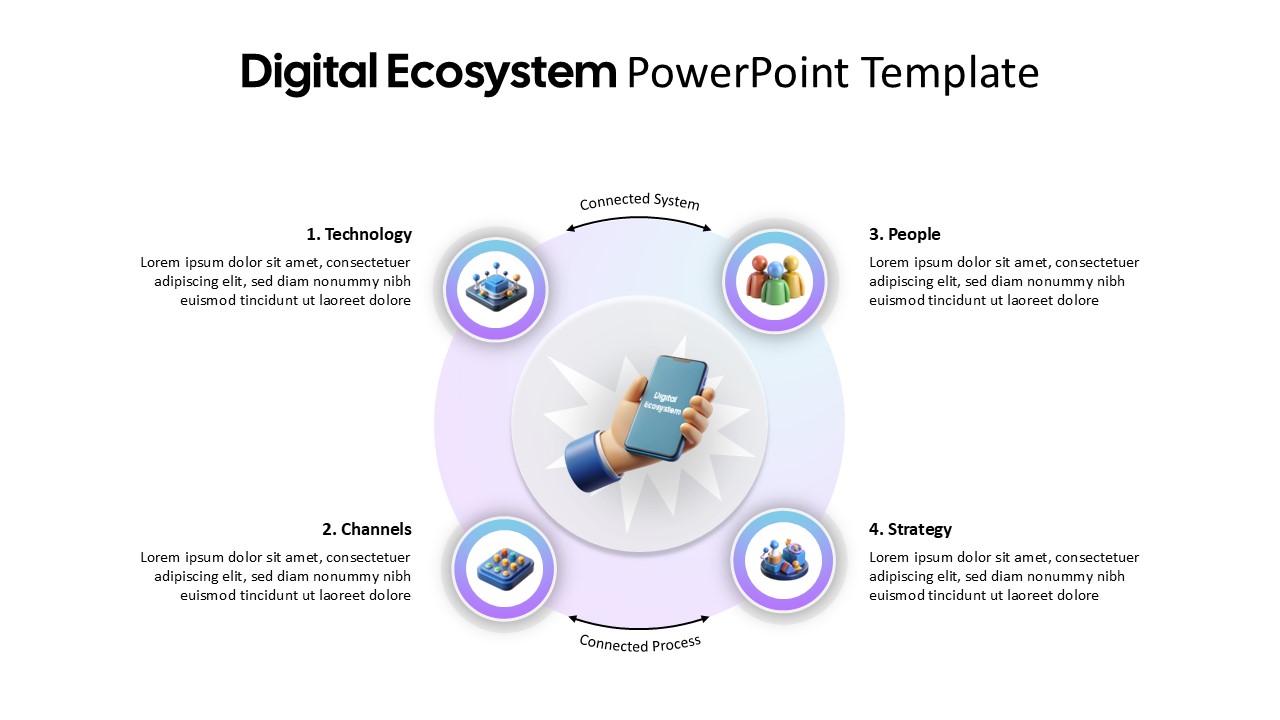
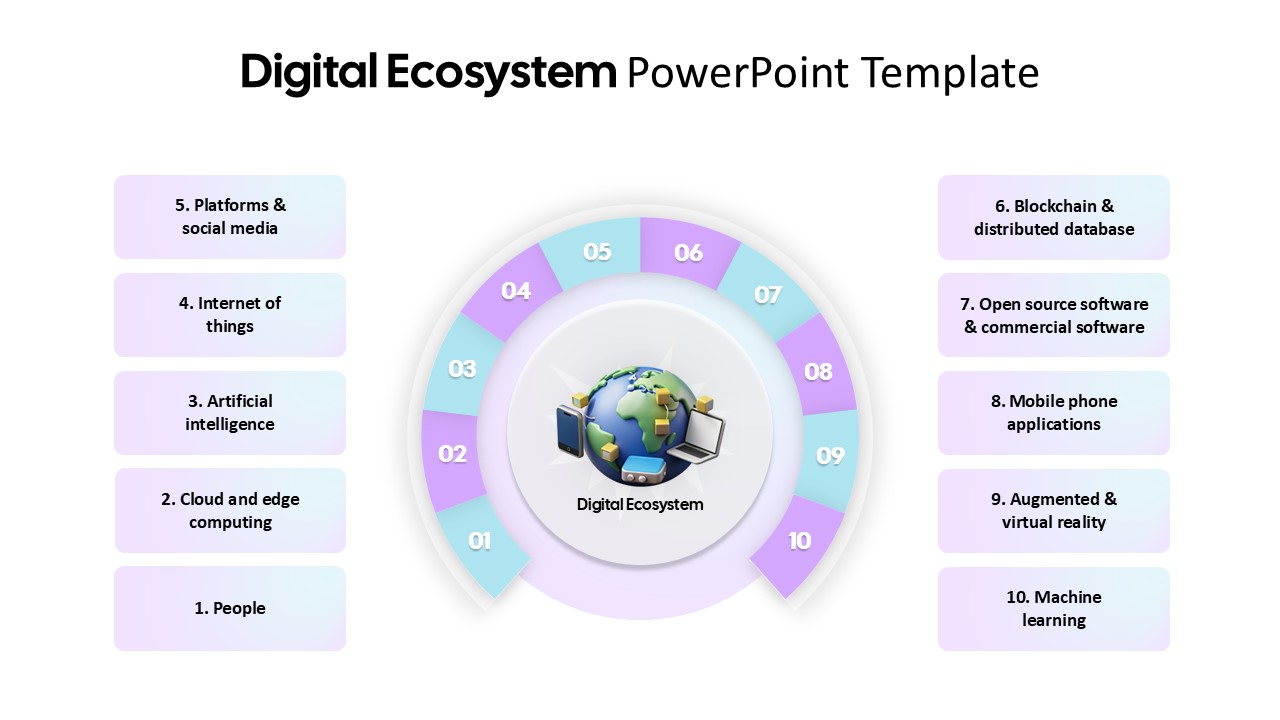
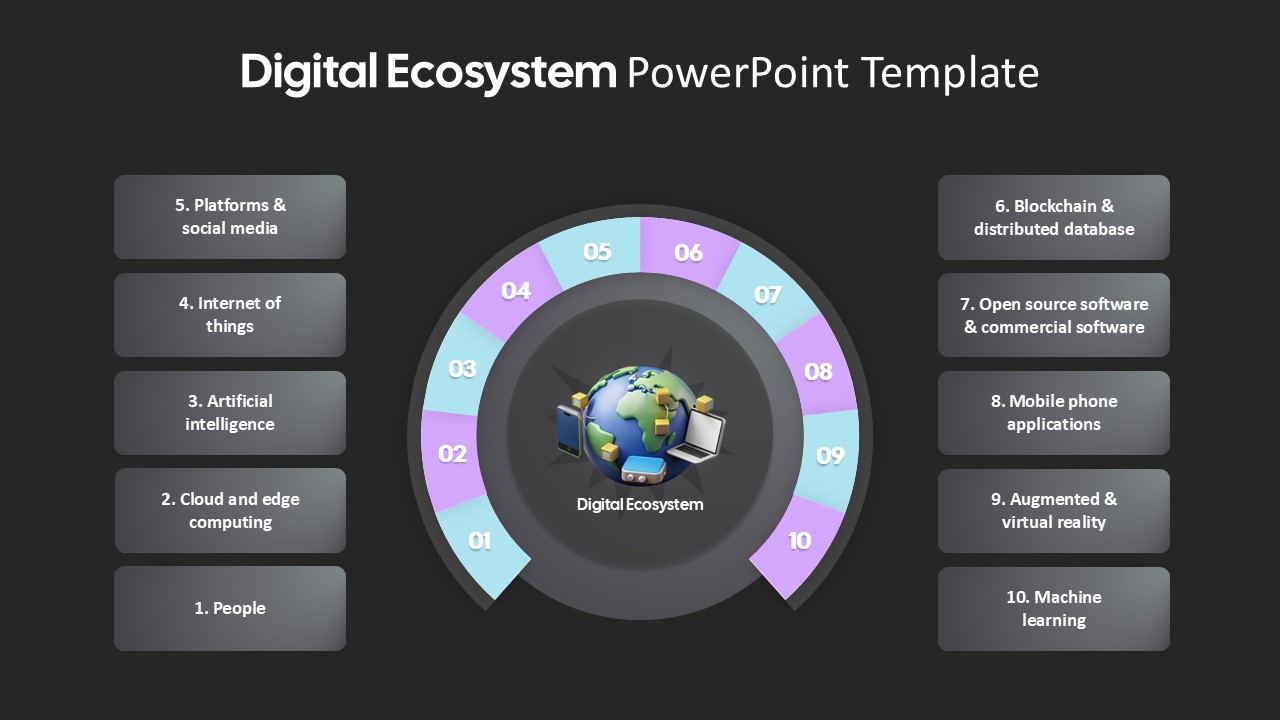
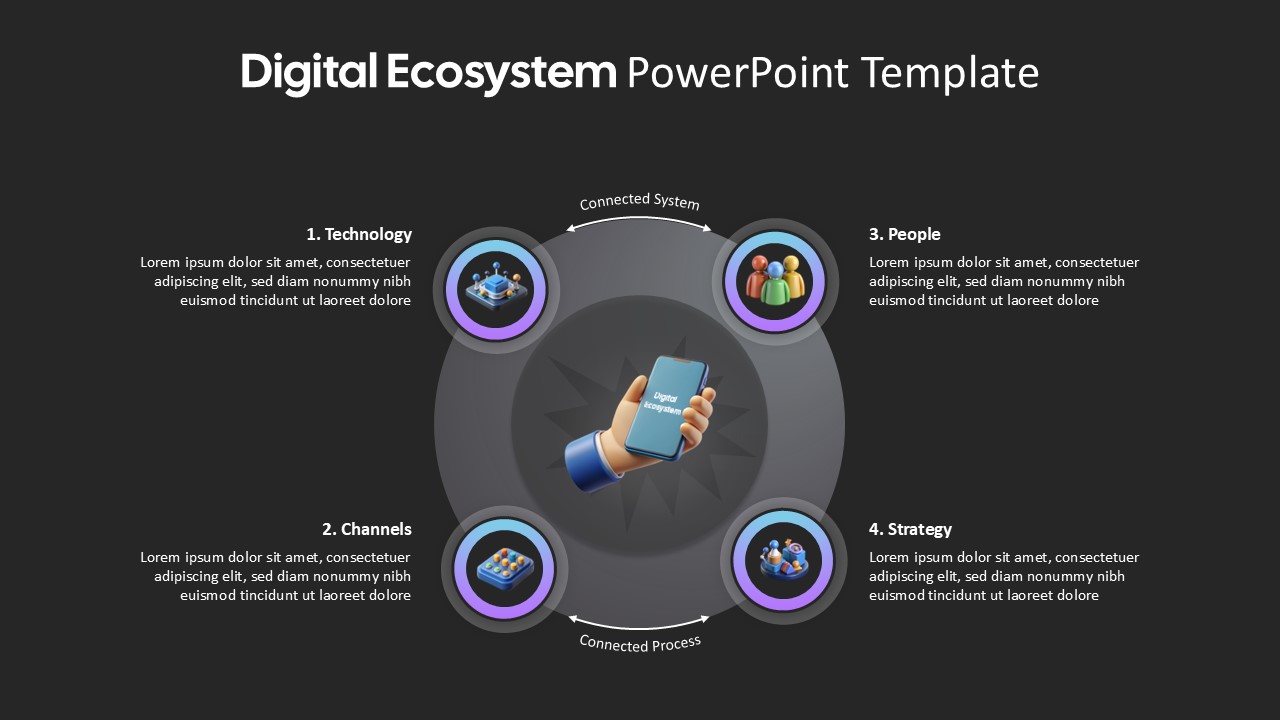
Organize complex digital ecosystems using this versatile dual-layout template. The first slide features a 3D smartphone icon at the center of a softly gradient circular ring segmented into four orbiting nodes—Technology, Channels, People, and Strategy. Each node uses vibrant 3D-style icons and labels to highlight key ecosystem pillars, connected by curved arrows and anchored by concise text placeholders. The second slide expands the framework into a ten-step radial diagram, with alternating pastel blue and purple segments surrounding a central global icon. Numbered labels correspond to customizable legend panels—covering People, Cloud & Edge Computing, Artificial Intelligence, Internet of Things, Social Platforms, Blockchain & Distributed Database, Open Source & Commercial Software, Mobile Apps, Augmented & Virtual Reality, and Machine Learning—ideal for deep dives into each digital domain.
Built on both PowerPoint and Google Slides master layouts, every element is fully editable: swap icons, adjust gradient fills, or relabel segments without disrupting the clean minimal aesthetic. Vector-based shapes ensure razor-sharp clarity across HD screens, mobile devices, and large-format projections, while pre-built text boxes and snap-to-guide alignment simplify collaboration and reduce setup time. The neutral white background and subtle drop shadows keep focus on the colorful icons and diagrams, making the template suitable for executive briefings, tech roadmaps, or training sessions.
Whether you’re mapping enterprise architectures, designing omnichannel strategies, or teaching digital literacy, the modular structure adapts to your context. Instantly duplicate or reorder segments, integrate data visualizations, or include KPI dashboards to enhance analytical presentations. Fully compatible with cloud-based collaboration tools, this template accelerates workshop preparation and empowers teams to visualize interconnected digital components with ease.
Who is it for
IT leaders, digital strategists, and innovation teams will benefit from these layouts when visualizing complex technology ecosystems. Consultants, educators, and product managers can leverage the radial diagrams to communicate platform components and phased implementation plans with clarity.
Other Uses
Adapt the circular and segmented layouts for technological roadmaps, cybersecurity frameworks, marketing tech stack overviews, or organizational networks. Use the radial structure for KPI dashboards, maturity models, service catalogs, or academic presentations on emerging technologies.
Login to download this file

Item ID
SB05003
Related Templates

Circular Business Ecosystem Diagram Template for PowerPoint & Google Slides
Business Strategy
Floating Island Ecosystem Infographics Template for PowerPoint & Google Slides
Graphics
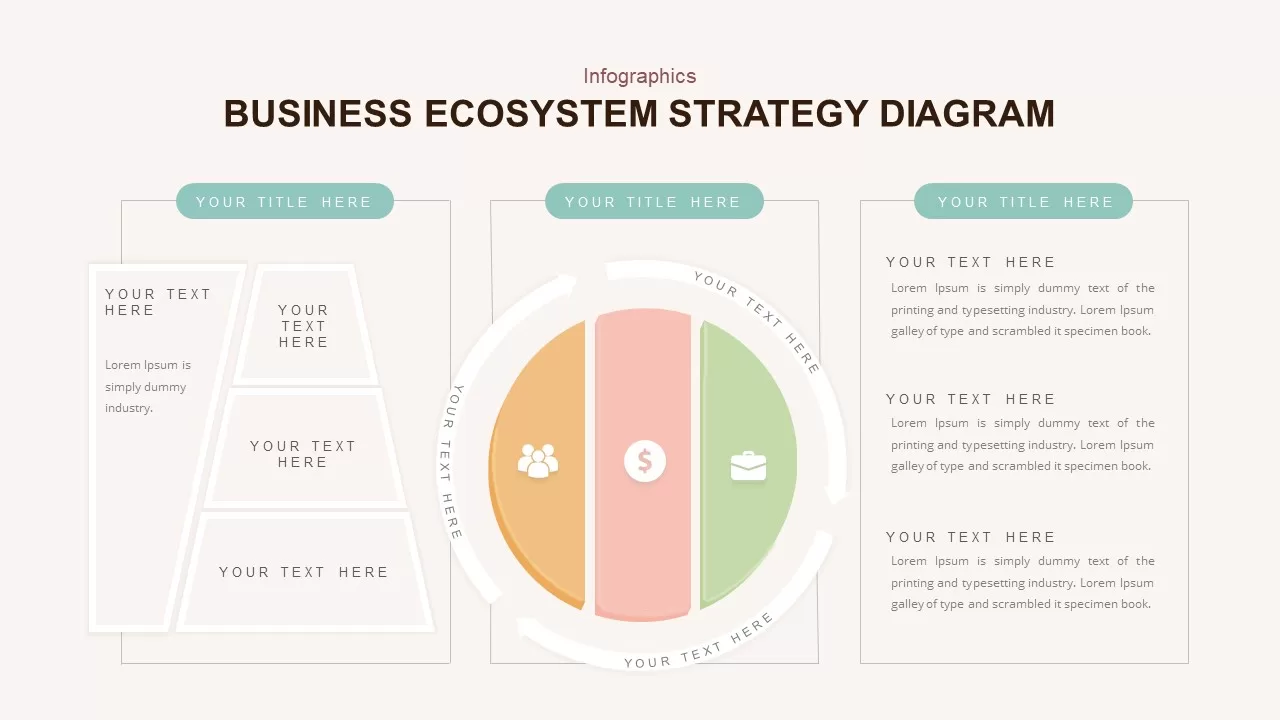
Business Ecosystem Strategy Diagram template for PowerPoint & Google Slides
Business Strategy
AI and Data Ecosystem Map Template for PowerPoint & Google Slides
AI
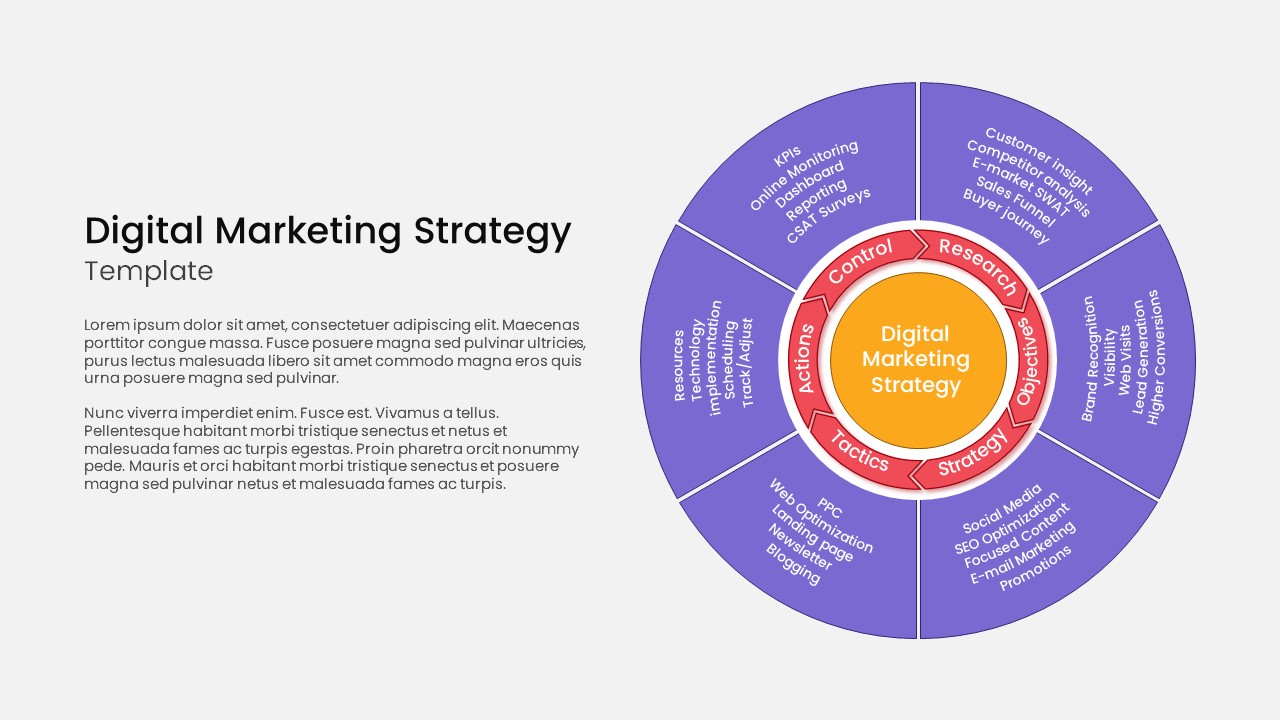
Circular Hub Digital Marketing Strategy Template for PowerPoint & Google Slides
Digital Marketing
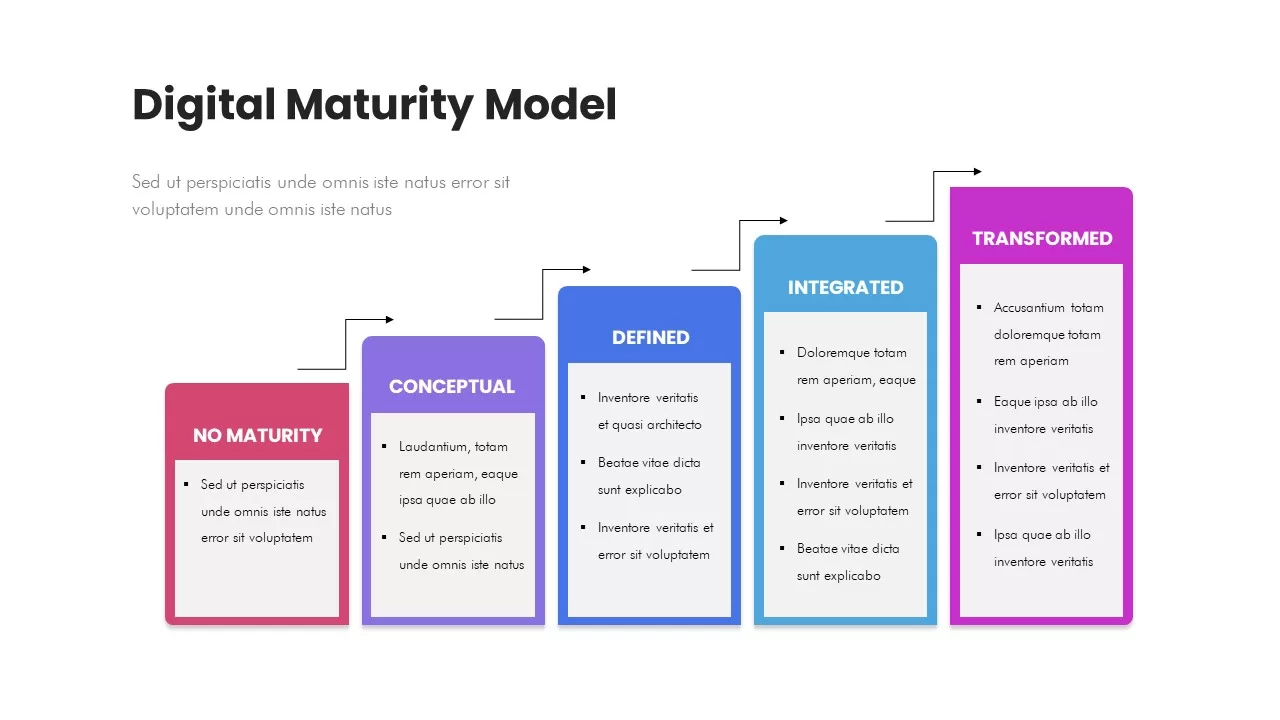
Digital Maturity Model Stages Diagram Template for PowerPoint & Google Slides
Process
Five-Stage Digital Maturity Model Diagram Template for PowerPoint & Google Slides
Process
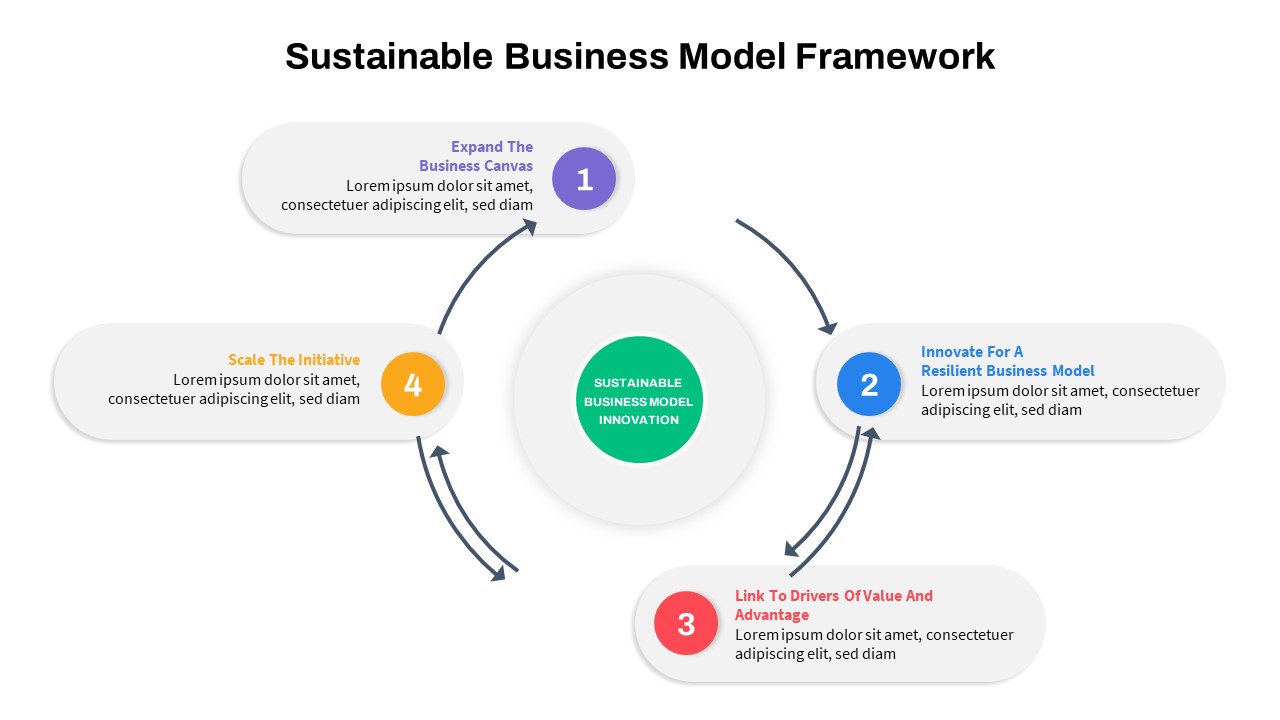
Sustainable Business Model Circular Infographic Template for PowerPoint & Google Slides
Business Strategy
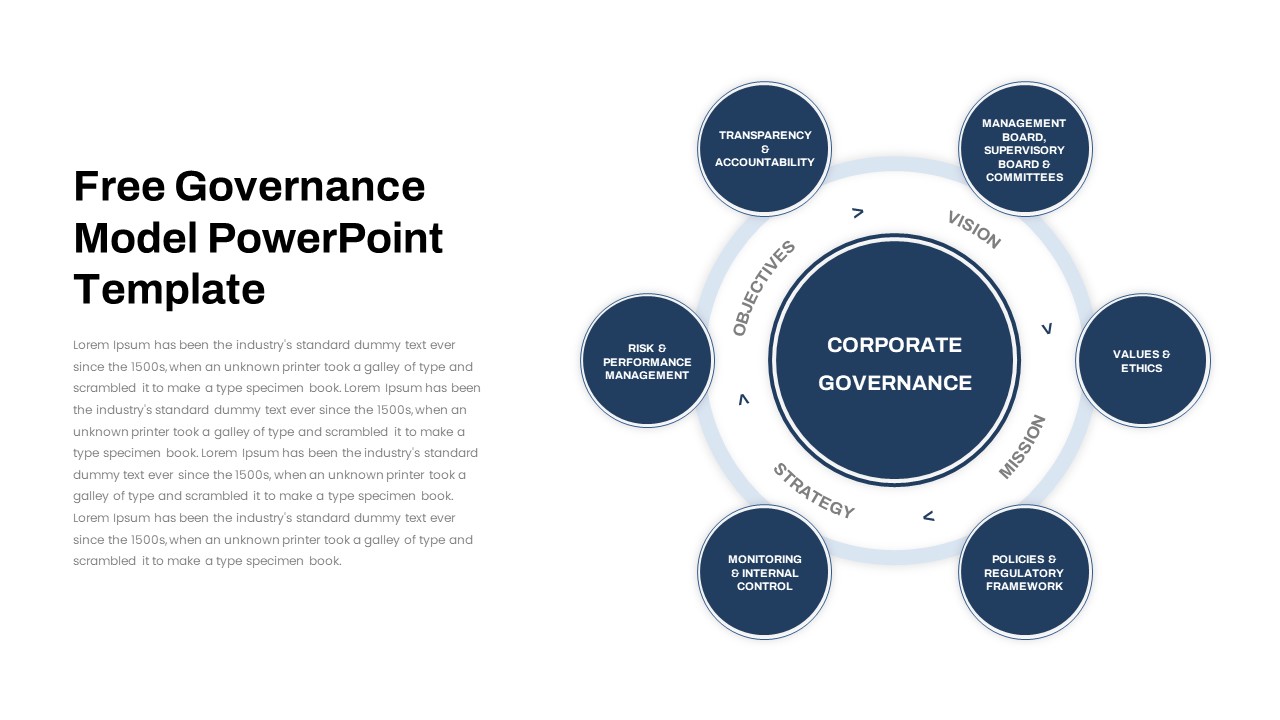
Free Corporate Governance Circular Model Template for PowerPoint & Google Slides
Circular
Free
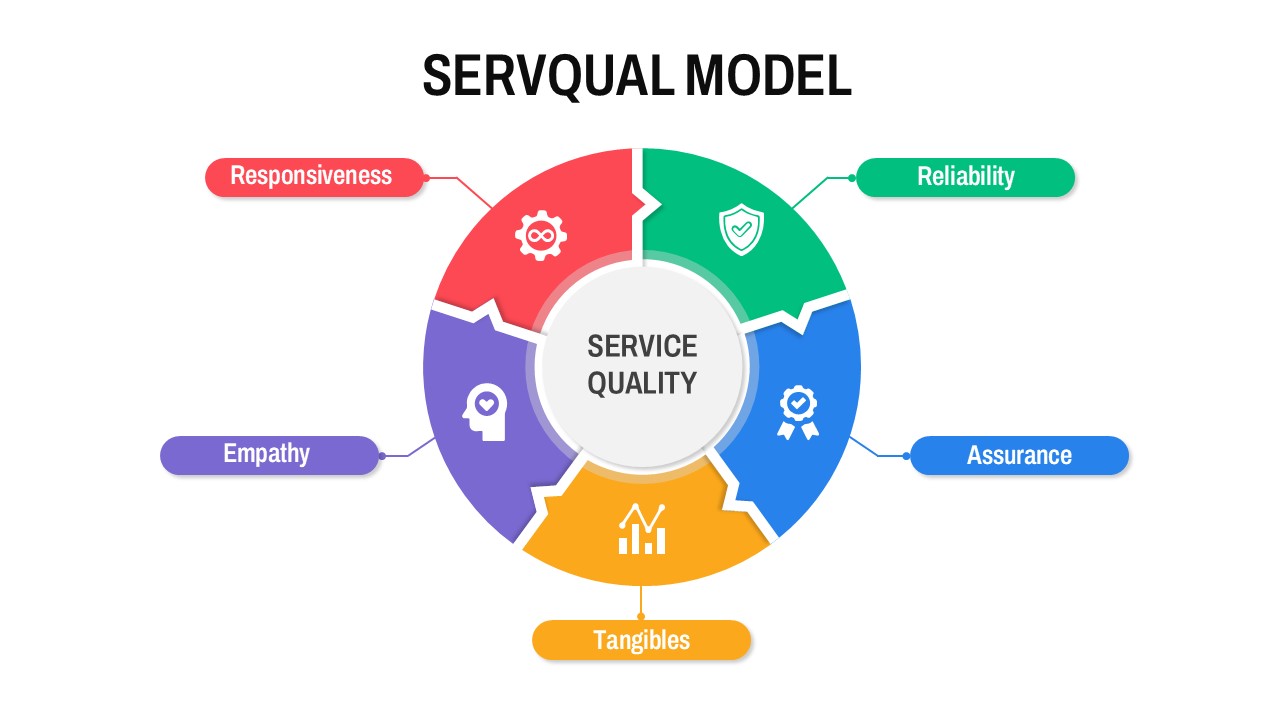
Circular SERVQUAL Model Diagram Template for PowerPoint & Google Slides
Business Strategy
Digital Marketing Roadmap PowerPoint Template for PowerPoint & Google Slides
Digital Marketing

Maximum Digital Presentation Template for PowerPoint & Google Slides
Company Profile
Free

Digital Marketing Report Deck Template for PowerPoint & Google Slides
Pitch Deck
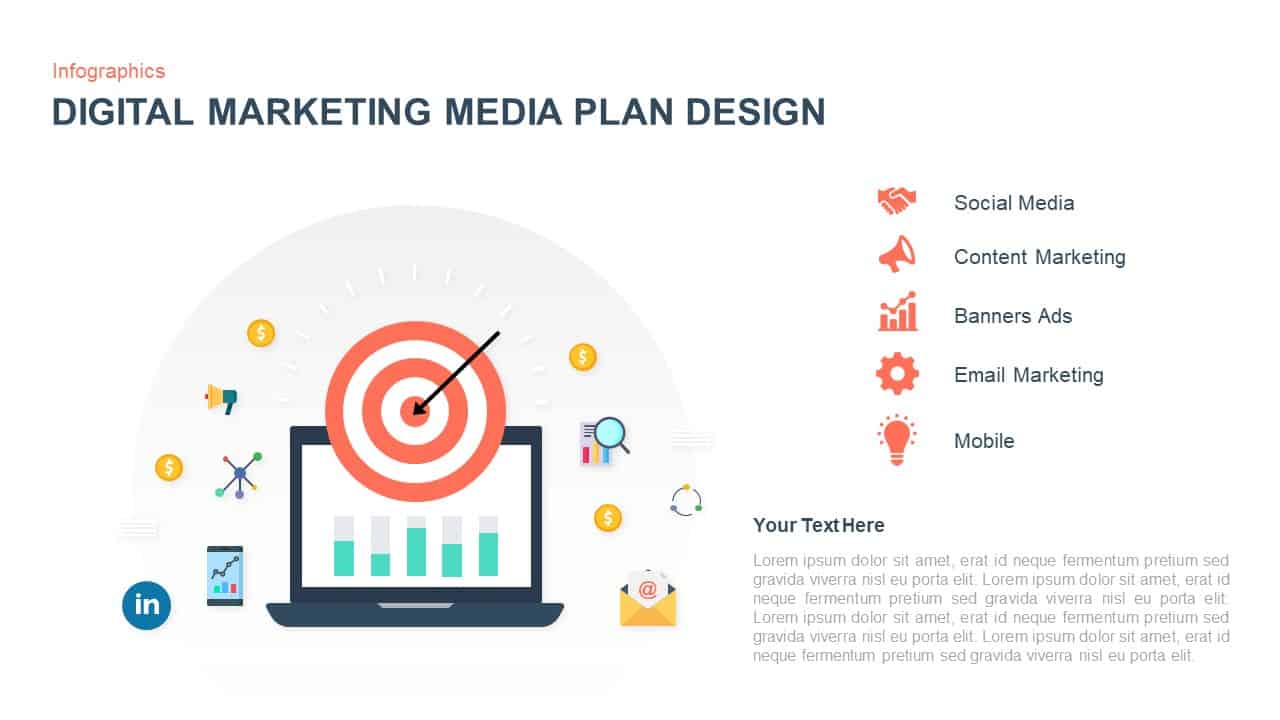
Digital Marketing Media Plan Infographic Template for PowerPoint & Google Slides
Digital Marketing
Vibrant Digital Marketing Metaphor Template for PowerPoint & Google Slides
Advertising

Modern Digital Marketing Strategy Template for PowerPoint & Google Slides
Pitch Deck
Digital Marketing Analytics Presentation Template for PowerPoint & Google Slides
Digital Marketing
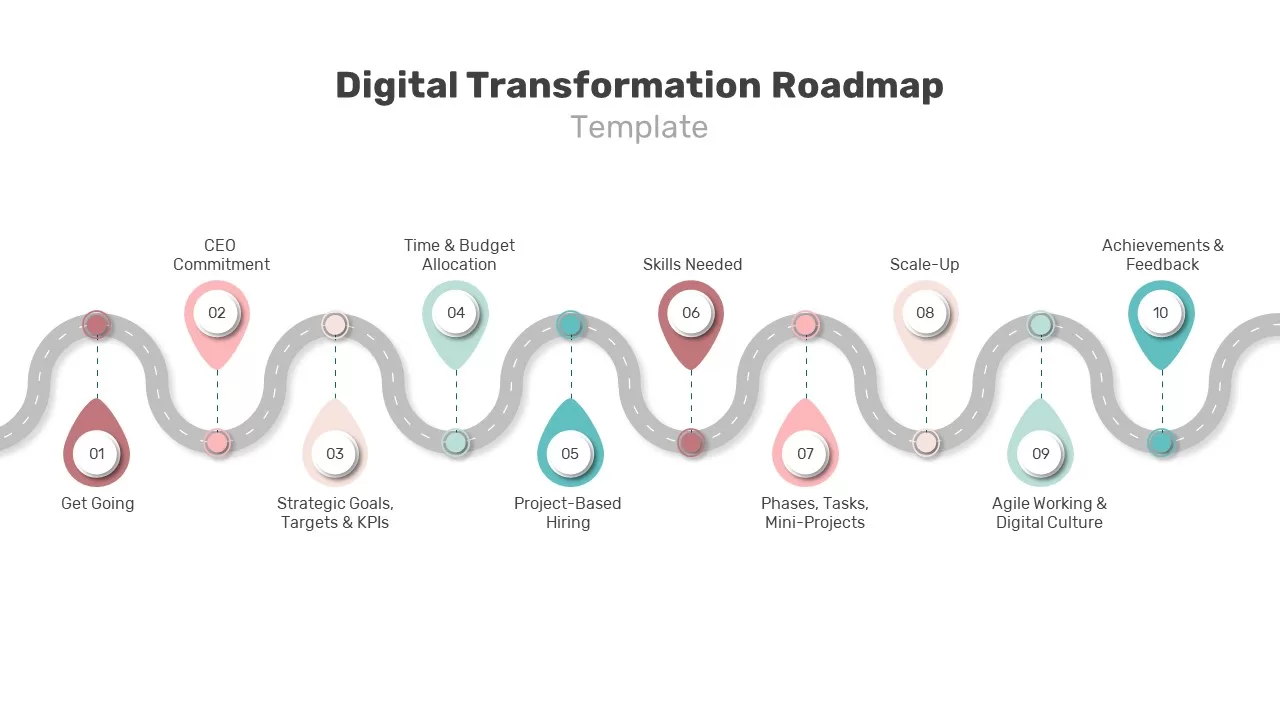
Digital Transformation Roadmap Slide Template for PowerPoint & Google Slides
Roadmap
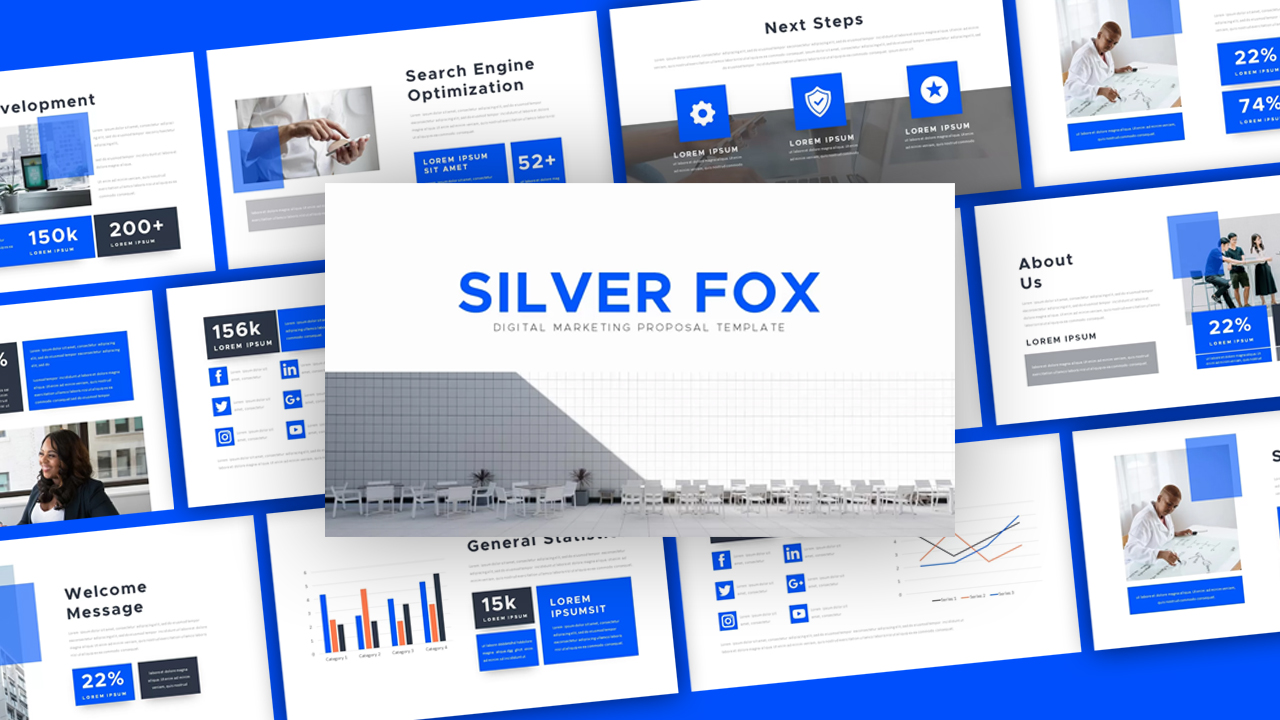
Silver Fox Digital Marketing Proposal template for PowerPoint & Google Slides
Company Profile
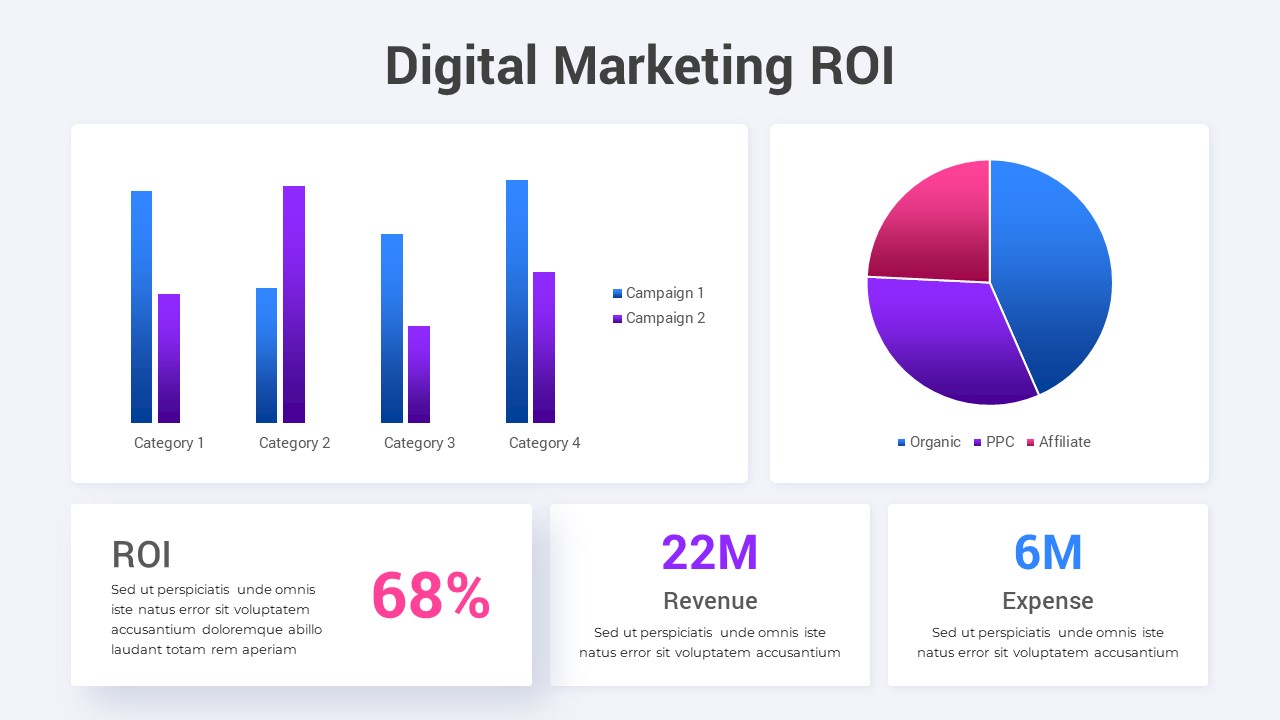
Digital Marketing ROI Analysis template for PowerPoint & Google Slides
Digital Marketing
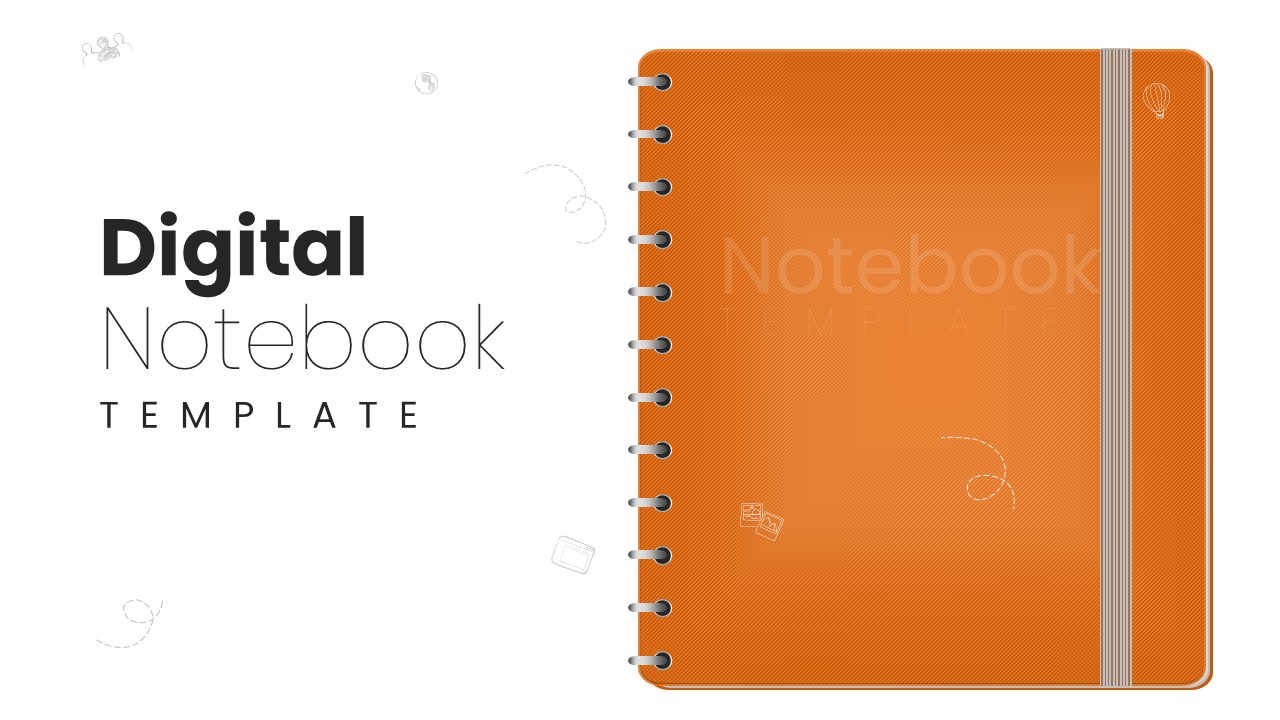
Digital Notebook Presentation Deck Template for PowerPoint & Google Slides
Decks

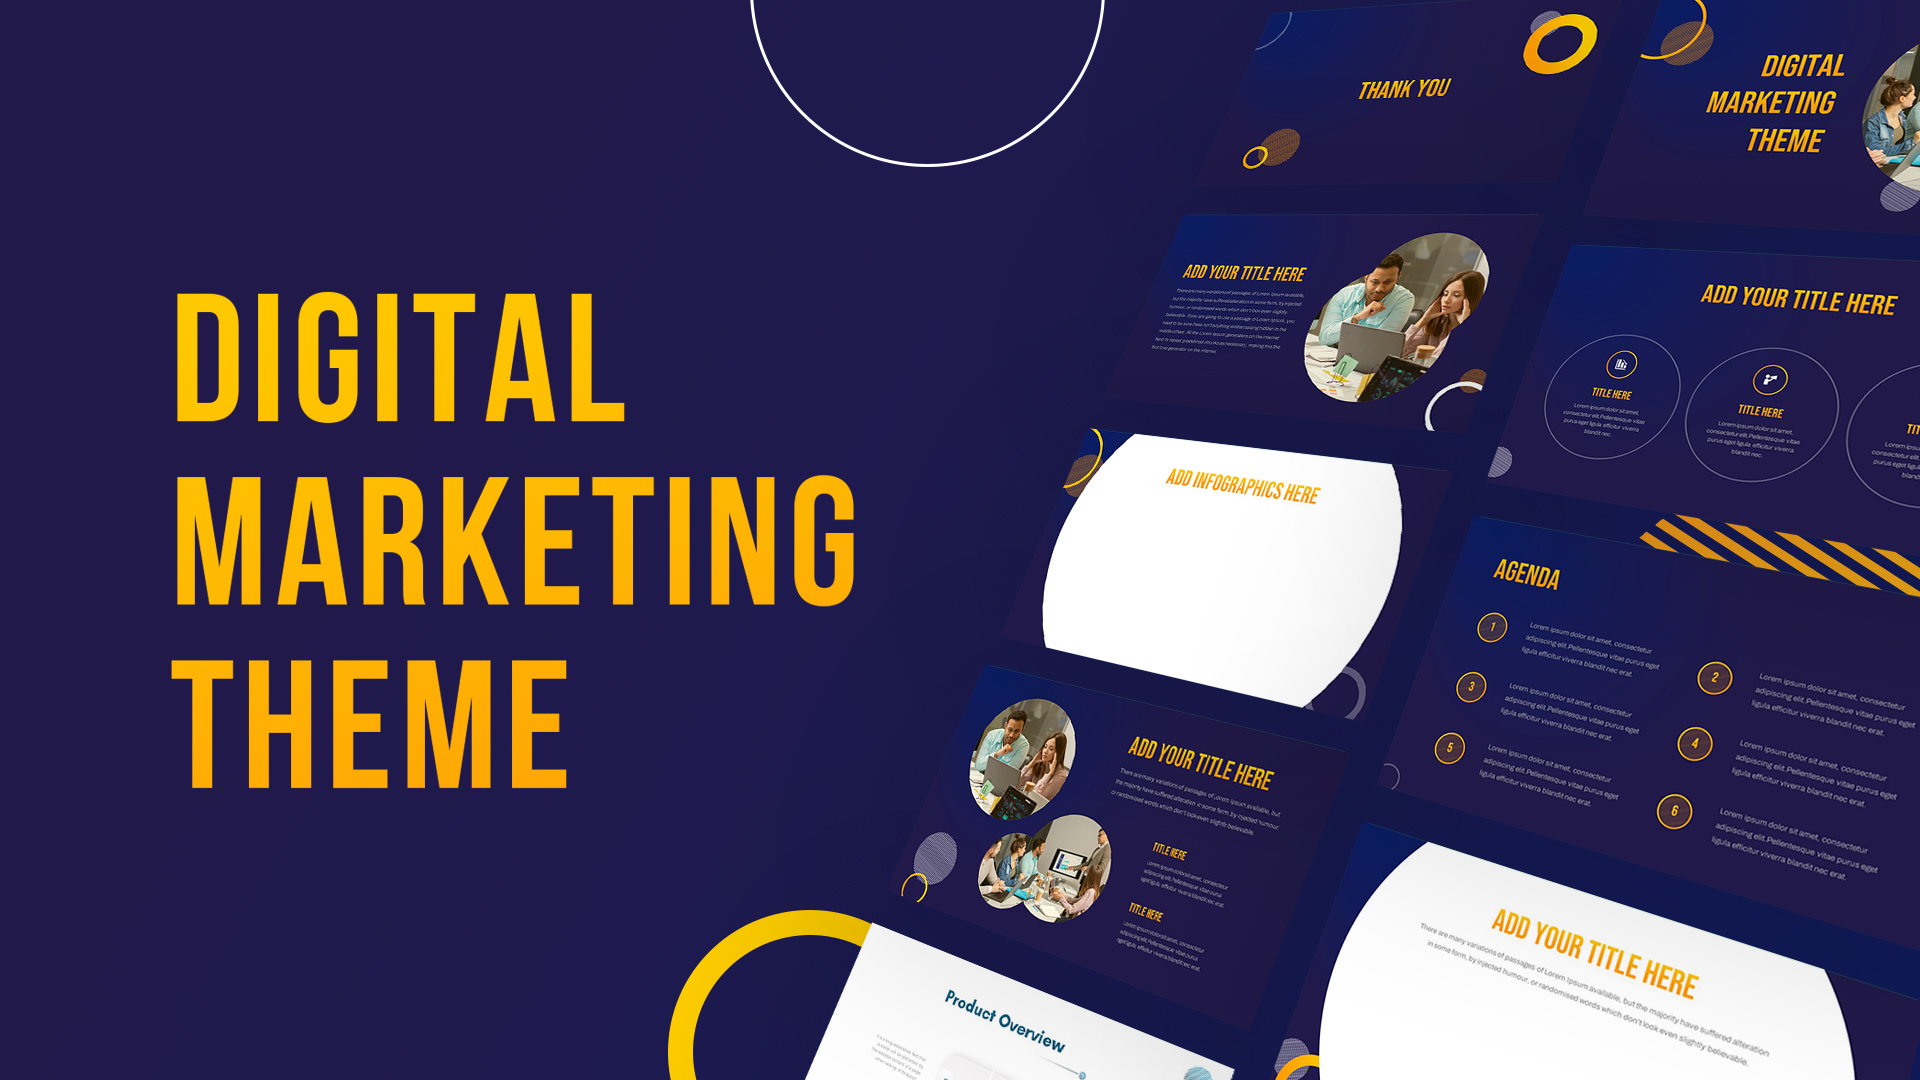
Modern Dark Digital Marketing Theme Template for PowerPoint & Google Slides
Digital Marketing
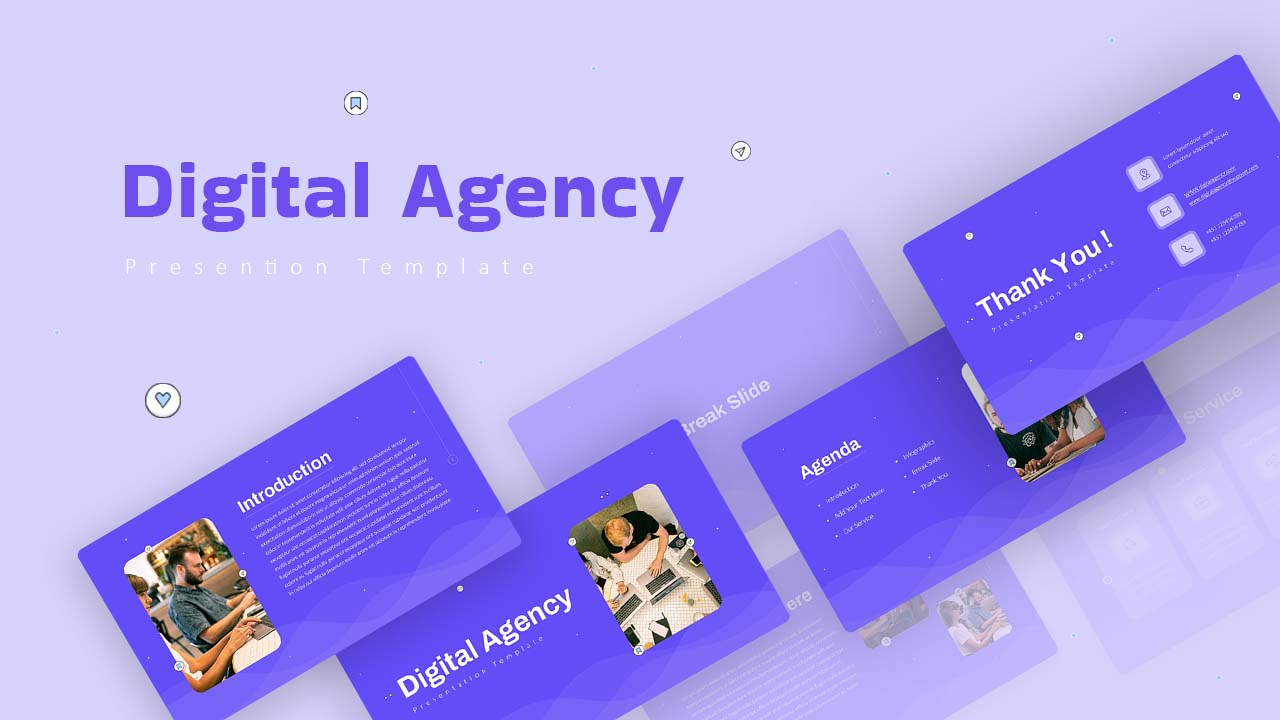
Modern Digital Agency Presentation Template for PowerPoint & Google Slides
Digital Marketing
Five-Segment Pentagon Digital Journey Template for PowerPoint & Google Slides
Process
5D Digital Marketing Flow Diagram Template for PowerPoint & Google Slides
Digital Marketing
Traditional vs Digital Economy Template for PowerPoint & Google Slides
Comparison
Digital Transformation Strategy Template for PowerPoint & Google Slides
Circular
Digital Marketing KPIs Dashboard Dark Template for PowerPoint & Google Slides
Business Report
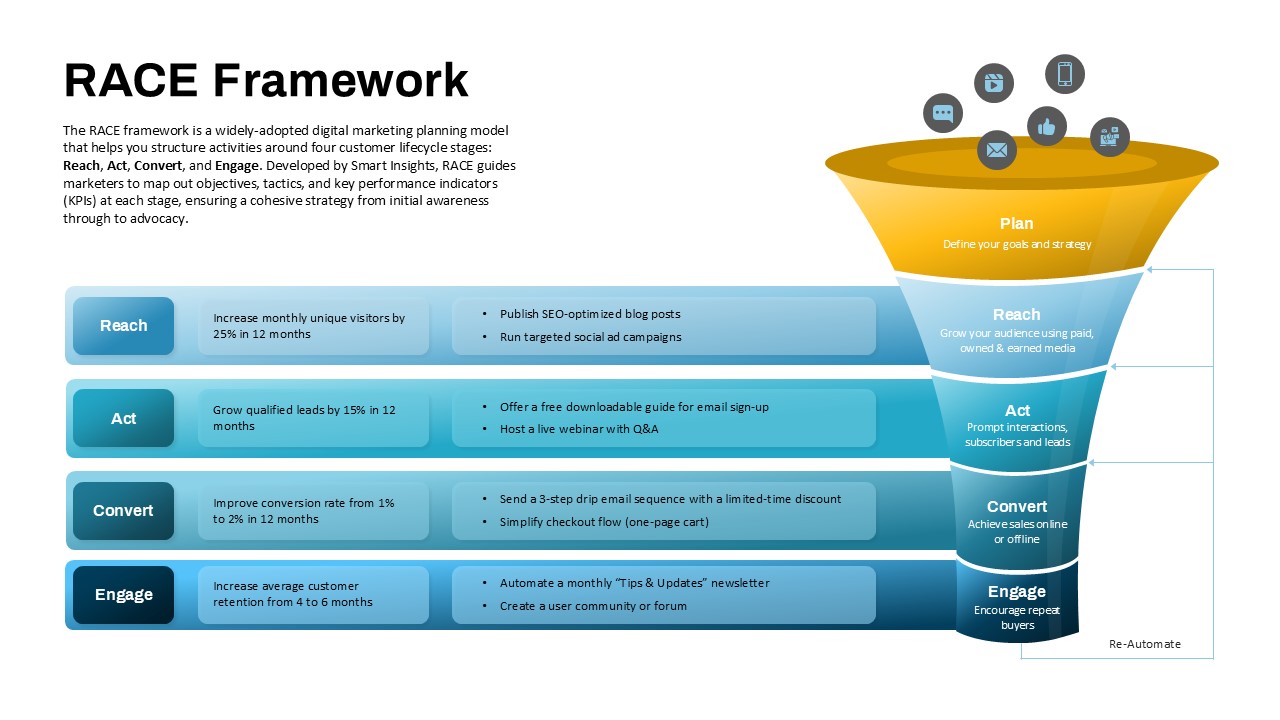
RACE Framework for Digital Marketing Strategy template for PowerPoint & Google Slides
Funnel
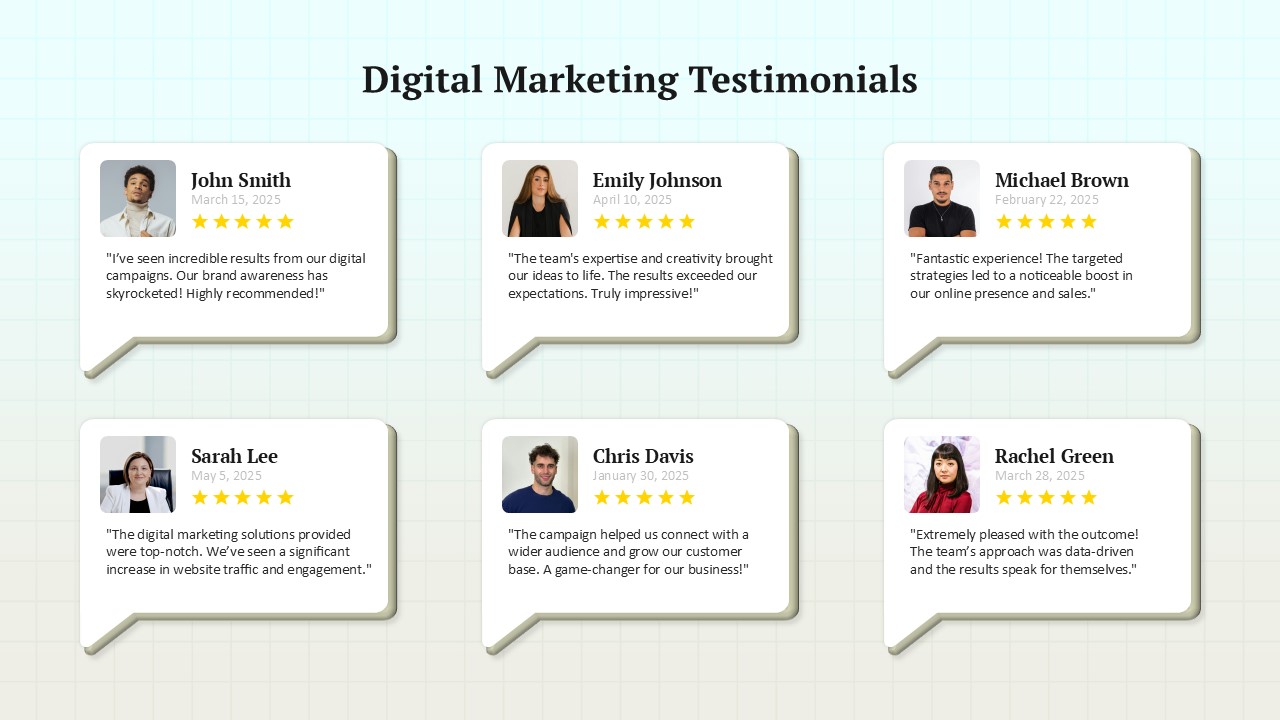
Digital Marketing Client Testimonials Template for PowerPoint & Google Slides
Accomplishment
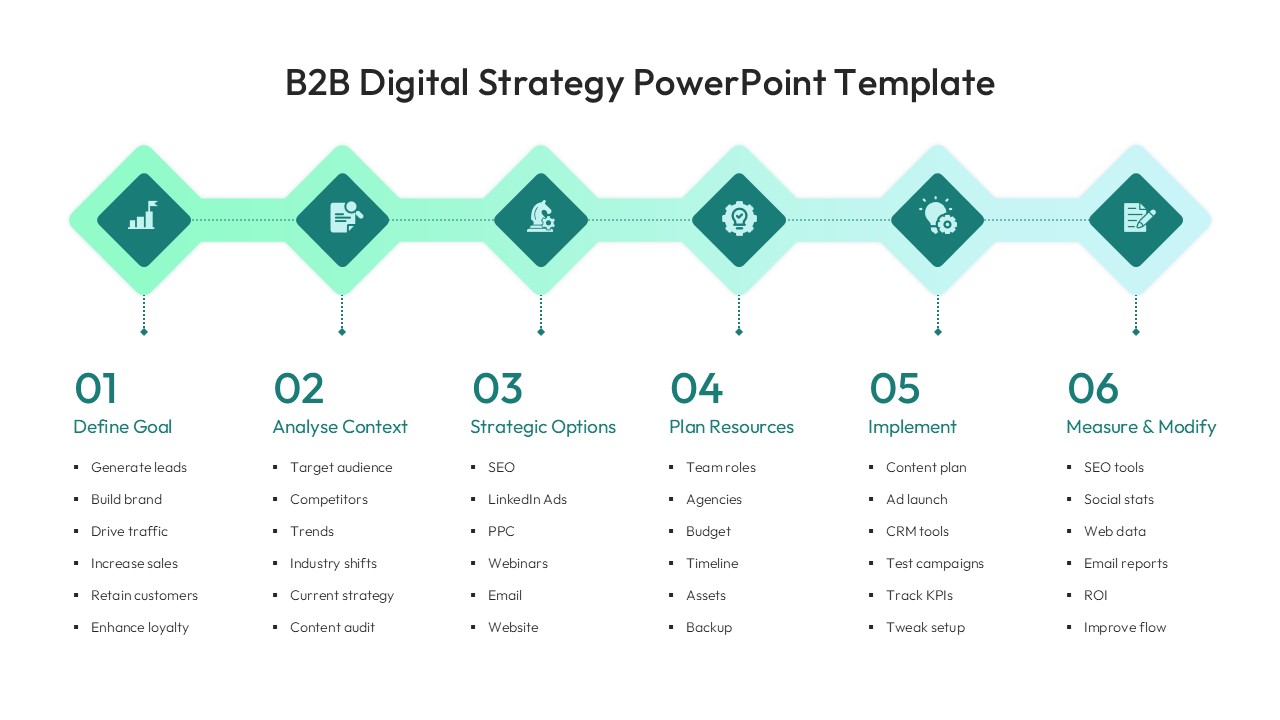
Elegant B2B Digital Strategy Timeline Template for PowerPoint & Google Slides
Digital Marketing
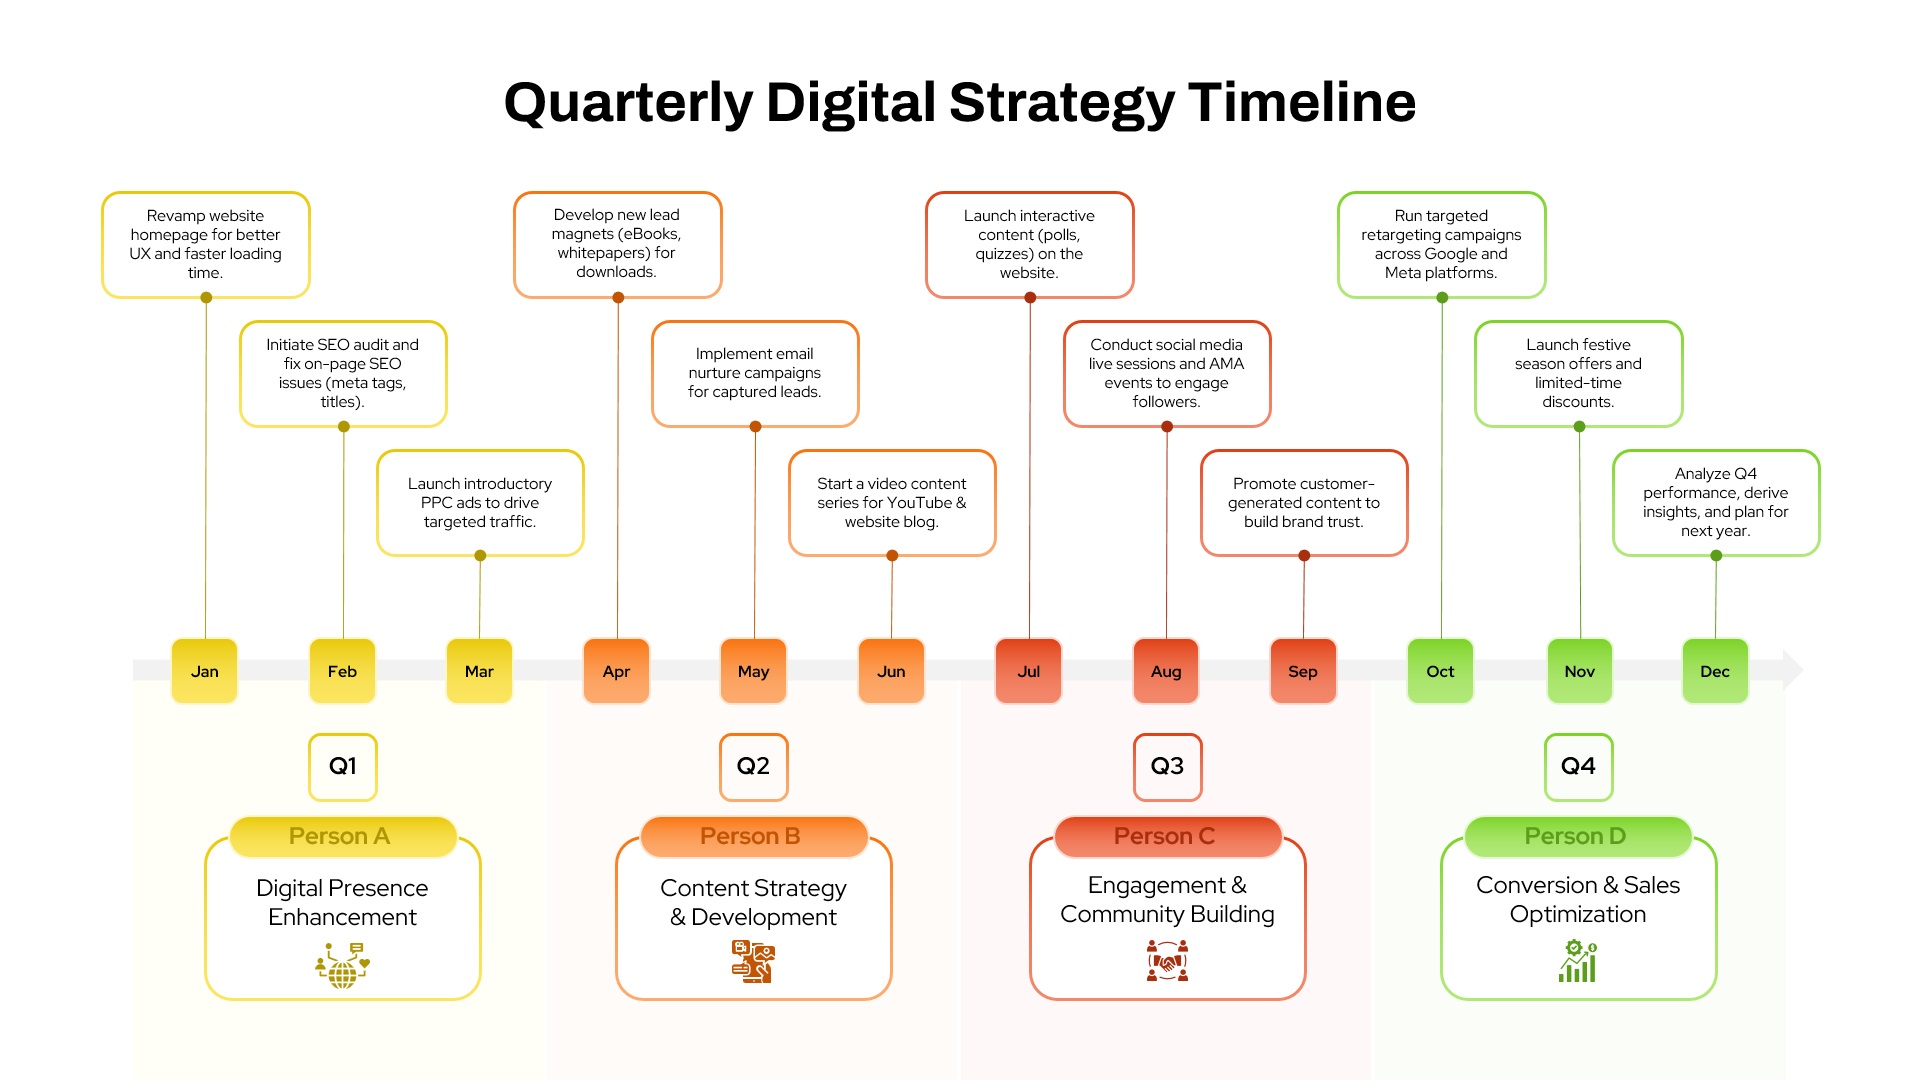
Quarterly Digital Strategy Timeline template for PowerPoint & Google Slides
Digital Marketing
B2C Digital Strategy Five-Step Template for PowerPoint & Google Slides
Digital Marketing
AI in Digital Marketing Use Cases Template for PowerPoint & Google Slides
AI
Digital Transformation Consulting Overview Template for PowerPoint & Google Slides
Information Technology
Digital Marketing Channels Comparison template for PowerPoint & Google Slides
Business
Digital Marketing Company Profile Template for PowerPoint & Google Slides
Digital Marketing
Digital Marketing Infographics Overview for PowerPoint & Google Slides
Digital Marketing
Race Digital Marketing Planning Templates for PowerPoint & Google Slides
Digital Marketing
Digital Marketing Presentation for PowerPoint & Google Slides
Digital Marketing
3D Circular Diagram template for PowerPoint & Google Slides
Circular
4 Step Creative Circular Diagram Template for PowerPoint & Google Slides
Infographics
8 Steps Circular Process Diagram Template for PowerPoint & Google Slides
Process
Six Step Creative Circular Diagram Template for PowerPoint & Google Slides
Circular
Six Steps Circular CRM Diagram Template for PowerPoint & Google Slides
Customer Journey
Six Section Circular Infographic Diagram Template for PowerPoint & Google Slides
Circular
Four-Stage Business Circular Diagram Template for PowerPoint & Google Slides
Process
Five-Section Circular Arrow Diagram Template for PowerPoint & Google Slides
Circular
Four Section Circular Text Boxes Diagram Template for PowerPoint & Google Slides
Circular
Eight-Step Circular Diagram Infographic Template for PowerPoint & Google Slides
Circular
8-Step Puzzle Circular Diagram Template for PowerPoint & Google Slides
Circular
Circular Timeline Infographics Template for PowerPoint & Google Slides
Timeline
4 Staged Circular Business Process Diagram template for PowerPoint & Google Slides
Process
8 Steps Circular Process Diagram Template for PowerPoint & Google Slides
Circular
Five-Stage Circular Process Flow Diagram Template for PowerPoint & Google Slides
Circular
Six-Stage Clockwise Circular Diagram Template for PowerPoint & Google Slides
Circular
Circular Three-Step Infographic Diagram Template for PowerPoint & Google Slides
Circular
8 Step Circular Process Flow Diagram Template for PowerPoint & Google Slides
Process
6-Step Circular Process Flow Diagram Template for PowerPoint & Google Slides
Process
4-Step Circular Roadmap Infographic Template for PowerPoint & Google Slides
Roadmap
6-Part Circular Gear Infographic Diagram Template for PowerPoint & Google Slides
Process
4-Step Circular Infographic Diagram Template for PowerPoint & Google Slides
Circular
4-Step Circular PDCA Cycle Diagram Template for PowerPoint & Google Slides
Process
Quality Management System Circular Diagram template for PowerPoint & Google Slides
Process
Six-Step Circular Diagram Infographics Template for PowerPoint & Google Slides
Circular
Free Five-Step Circular Timeline Infographic Template for PowerPoint & Google Slides
Timeline
Free
Circular Mind Map Template for PowerPoint & Google Slides
Mind Maps
Concentric Circular Arrow Cycle Diagram Template for PowerPoint & Google Slides
Process
Four-Segment Circular Arrow Cycle Template for PowerPoint & Google Slides
Circular
Circular Arrows Process Flow template for PowerPoint & Google Slides
Process
Three-Step Circular Arrows Diagram Template for PowerPoint & Google Slides
Process
Healthcare Nursing Circular Infographic Template for PowerPoint & Google Slides
Nursing
Ten Step Circular Process Infographic Template for PowerPoint & Google Slides
Process
Ten-Step Circular Process Infographic Template for PowerPoint & Google Slides
Circular
10-Step Colorful Circular Diagram Template for PowerPoint & Google Slides
Circular
10 Step Circular Process Diagram Template for PowerPoint & Google Slides
Circular
Circular Image Gallery & KPI Metrics Template for PowerPoint & Google Slides
Pie/Donut
Negotiation Process Circular Diagram Template for PowerPoint & Google Slides
Circular
Circular Sustainability Infographic Template for PowerPoint & Google Slides
Process
Circular Timeline Infographic Template for PowerPoint & Google Slides
Timeline
Multi-Variation Circular Chart Diagram Template for PowerPoint & Google Slides
Circular
HROps Hub and Spoke Circular Diagram Template for PowerPoint & Google Slides
Circular
Circular Business Strategy Infographic Template for PowerPoint & Google Slides
Circular
Professional Circular Pain Points Template for PowerPoint & Google Slides
Circular
Entry Strategy Circular Diagram Template for PowerPoint & Google Slides
Circular
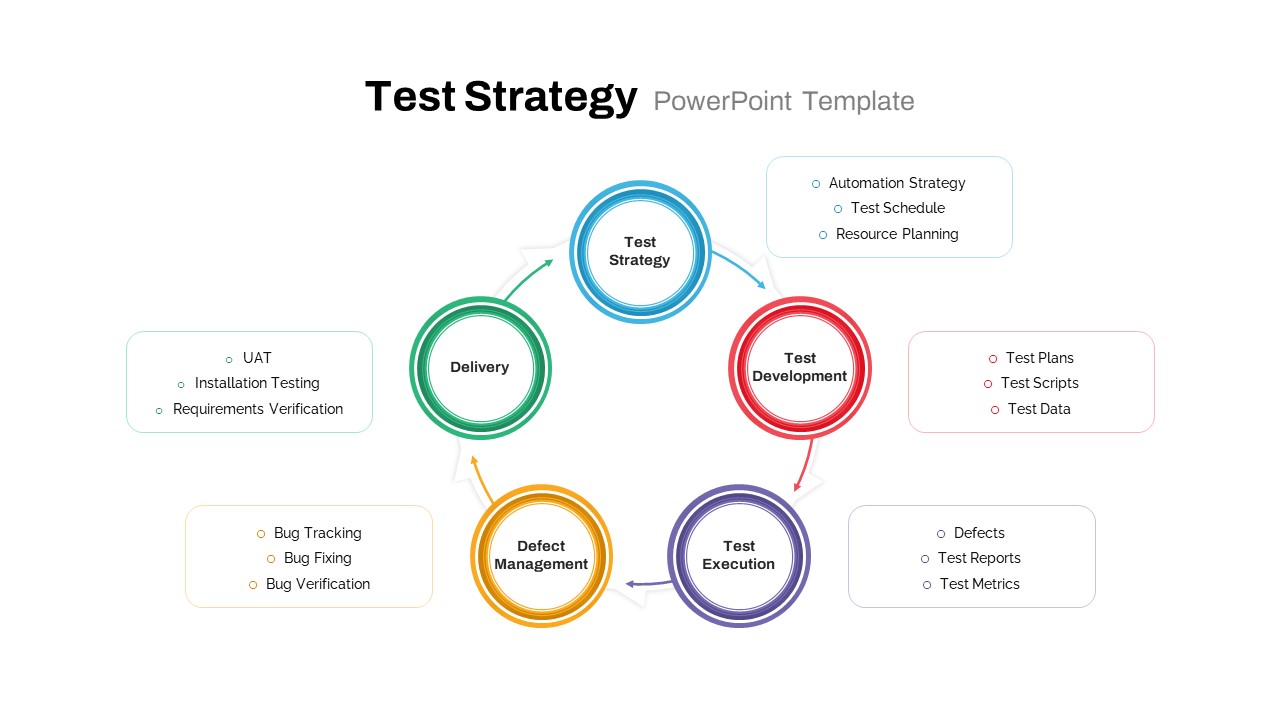
Test Strategy Circular Diagram Template for PowerPoint & Google Slides
Circular
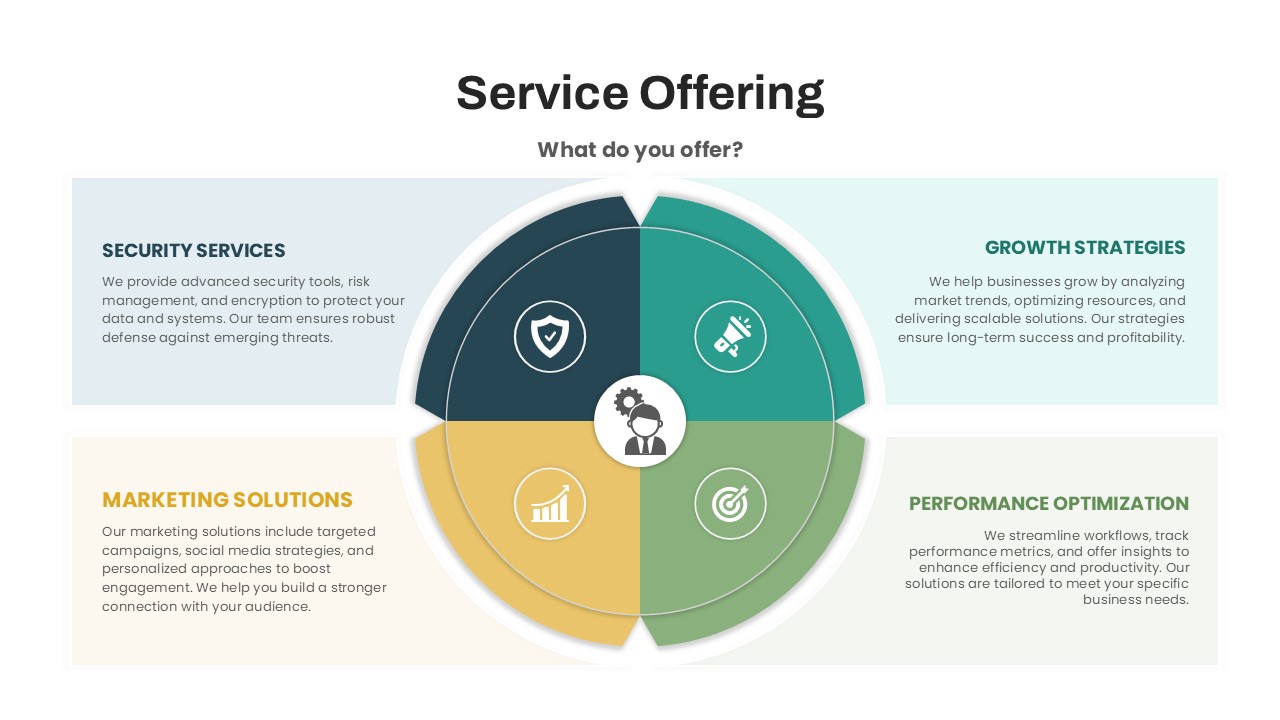
Circular Service Offering Diagram Template for PowerPoint & Google Slides
Circular
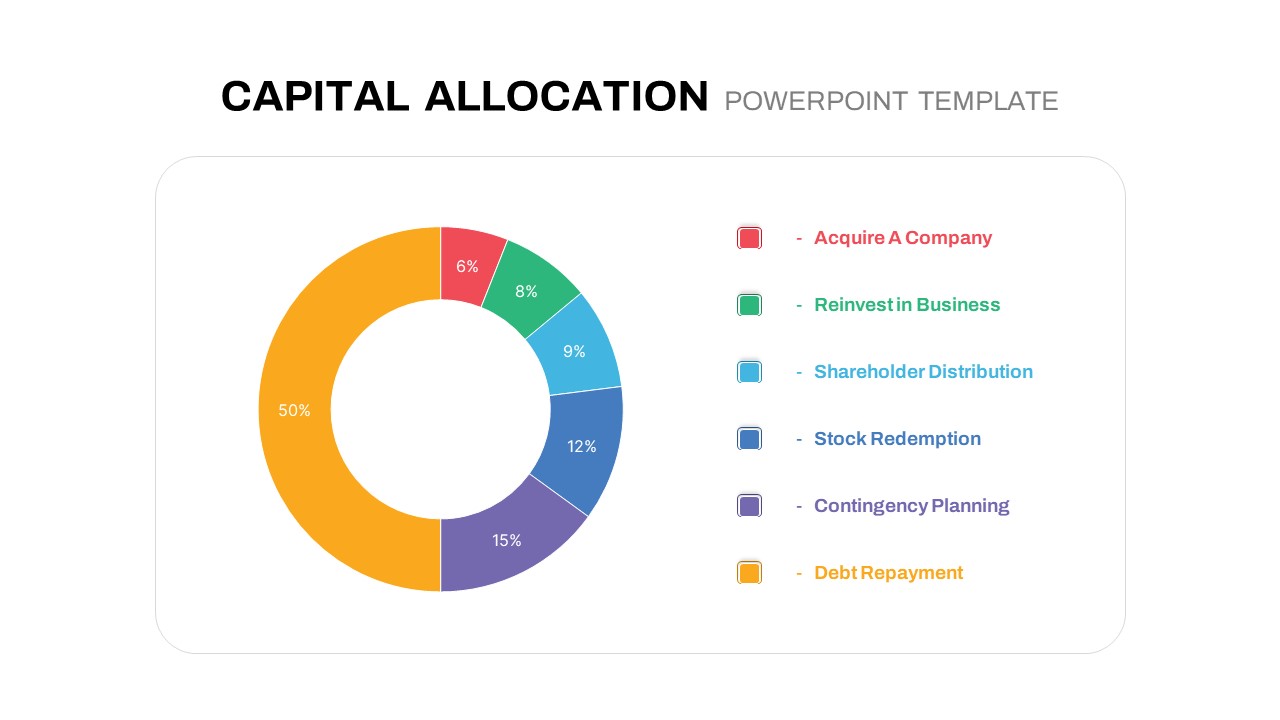
Circular Capital Allocation Diagram Template for PowerPoint & Google Slides
Business Models
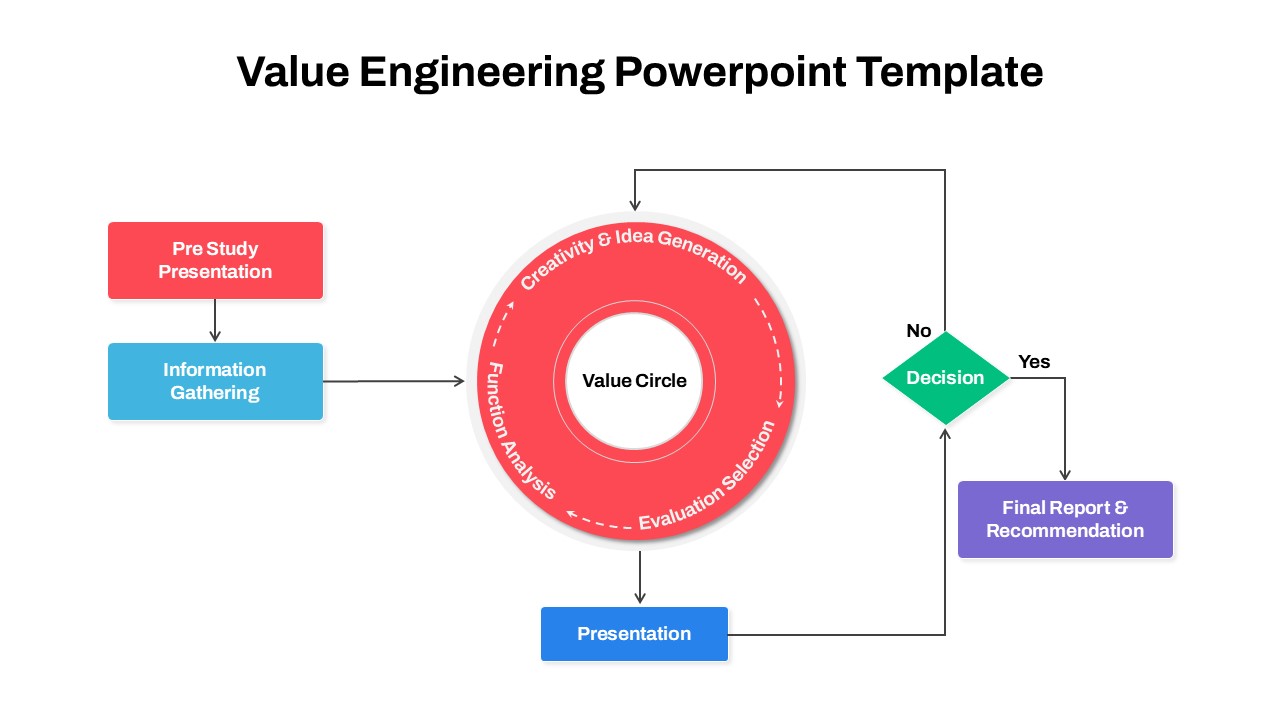
Circular Value Engineering Diagram Template for PowerPoint & Google Slides
Process
Culture Change Circular Process Diagram Template for PowerPoint & Google Slides
Process
Service Catalog Circular Infographic Template for PowerPoint & Google Slides
Circular
Product Marketing Framework Circular Template for PowerPoint & Google Slides
Circular
Agile Pods Team Roles Circular Diagram Template for PowerPoint & Google Slides
Circular
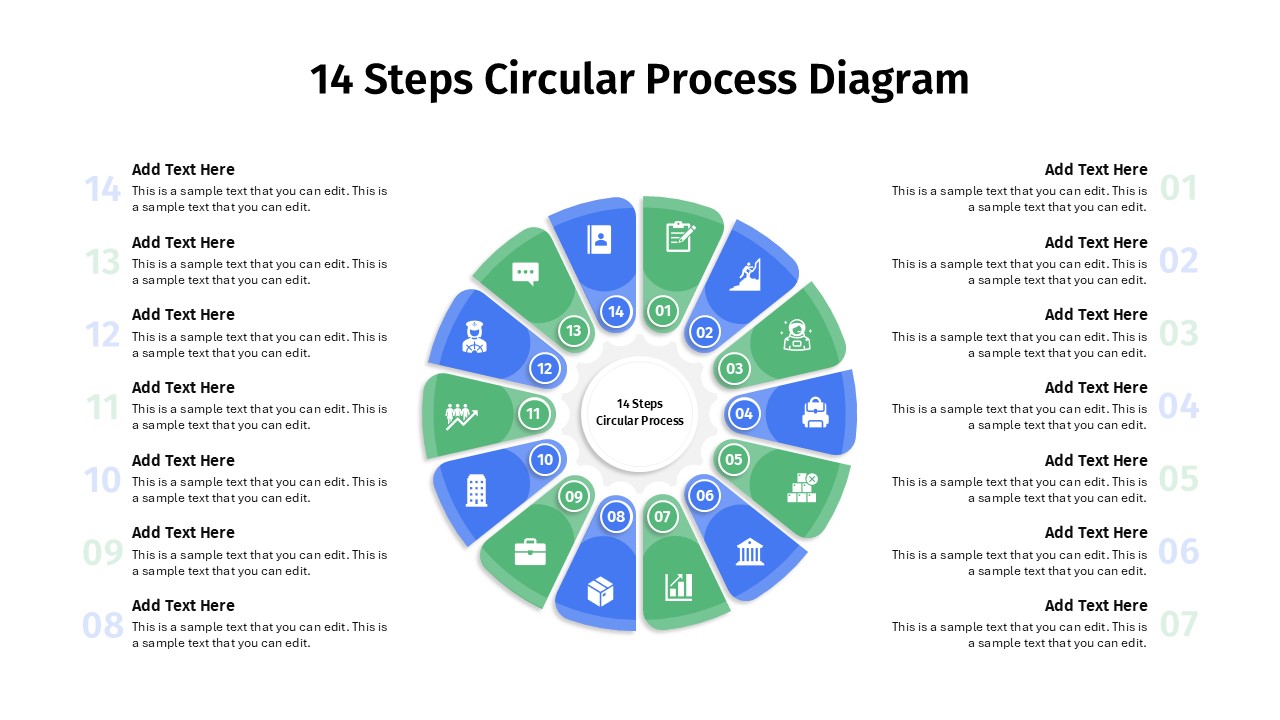
14 Steps Circular Process Diagram Template for PowerPoint & Google Slides
Circular
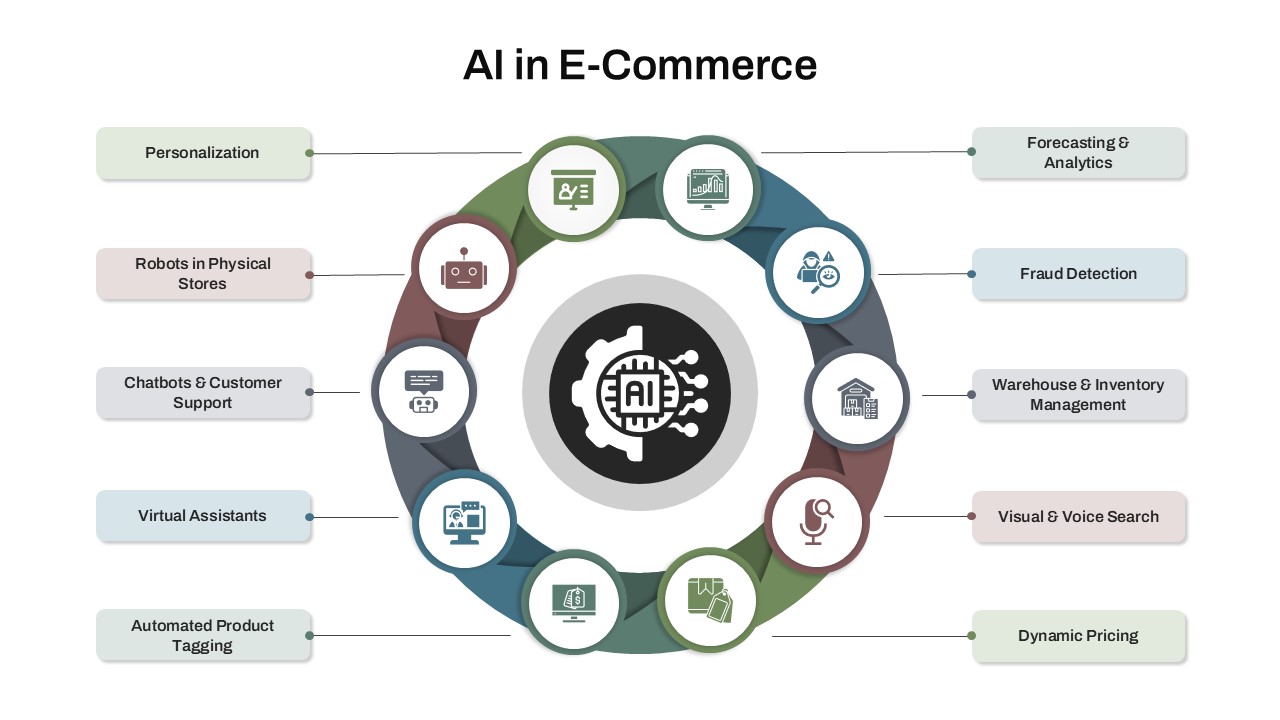
AI in E-Commerce Circular Infographic Template for PowerPoint & Google Slides
AI
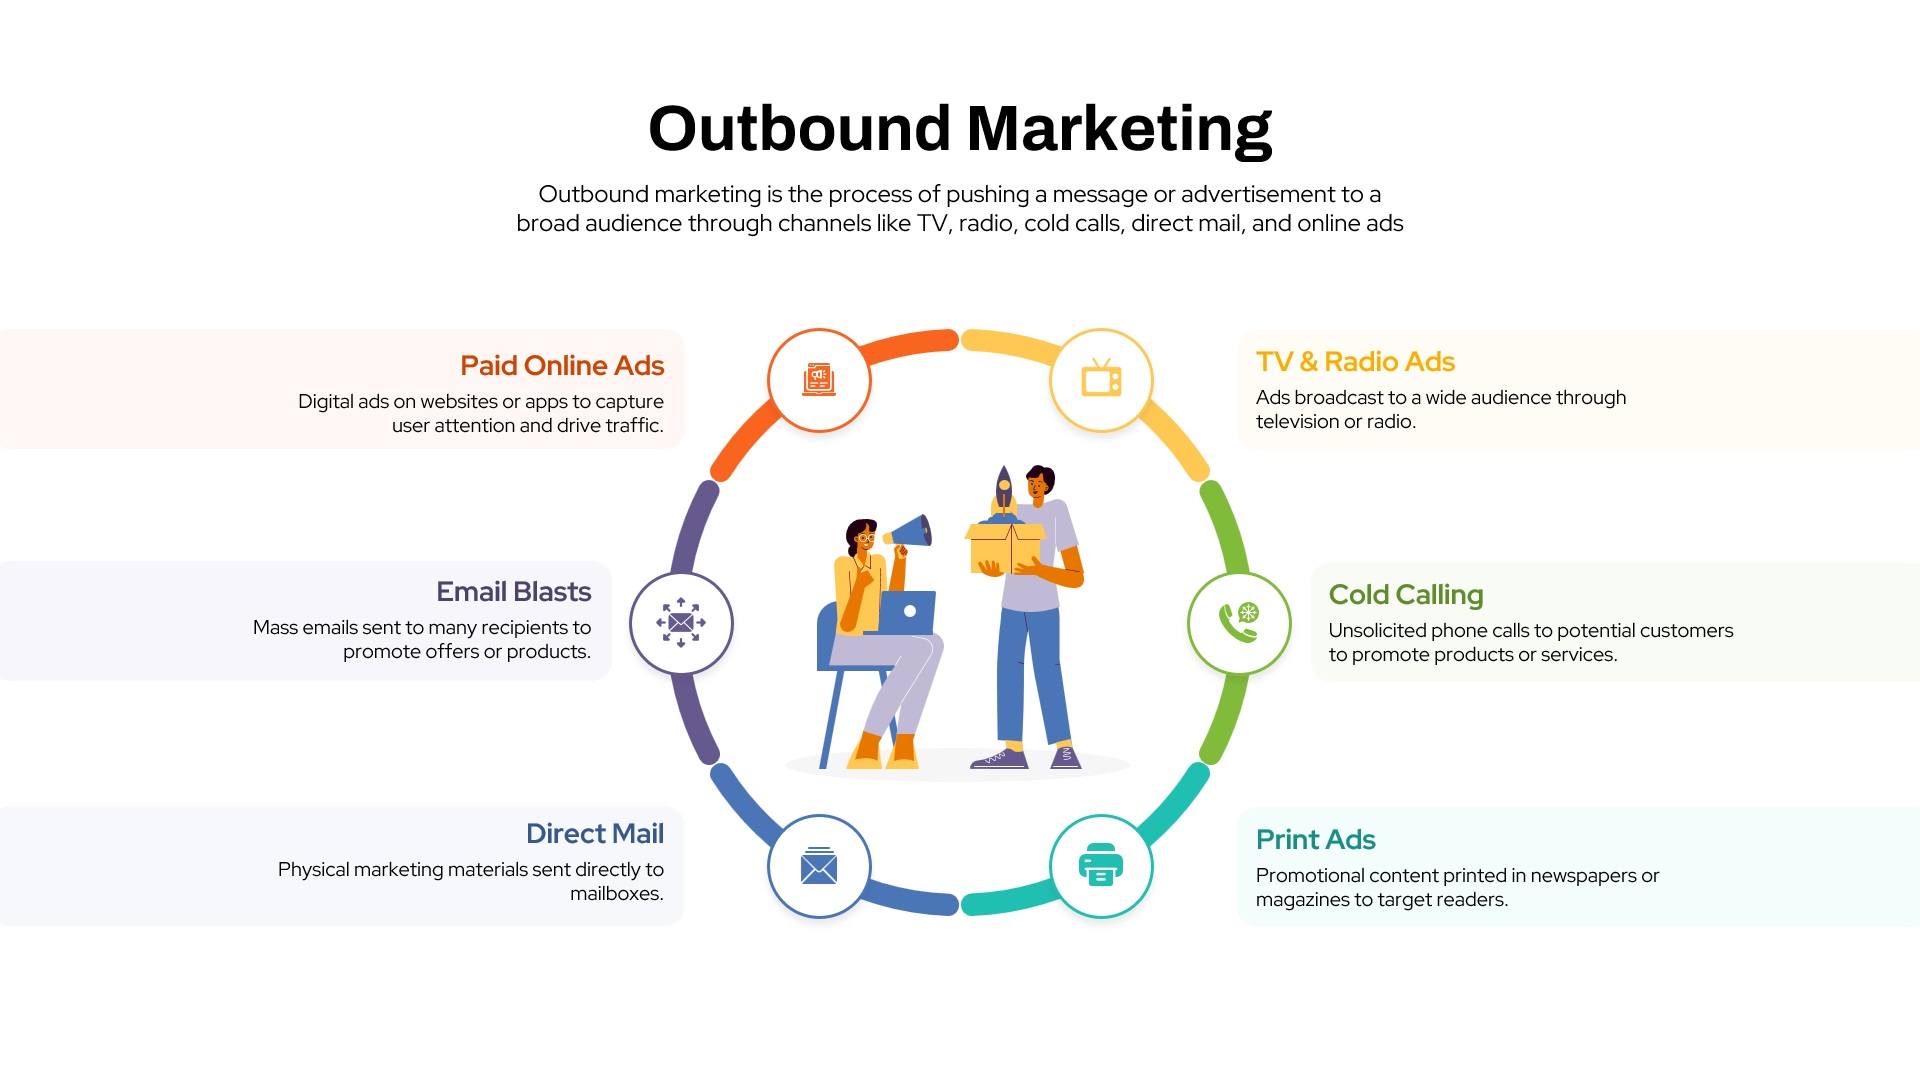
Outbound Marketing Circular Diagram Template for PowerPoint & Google Slides
Advertising
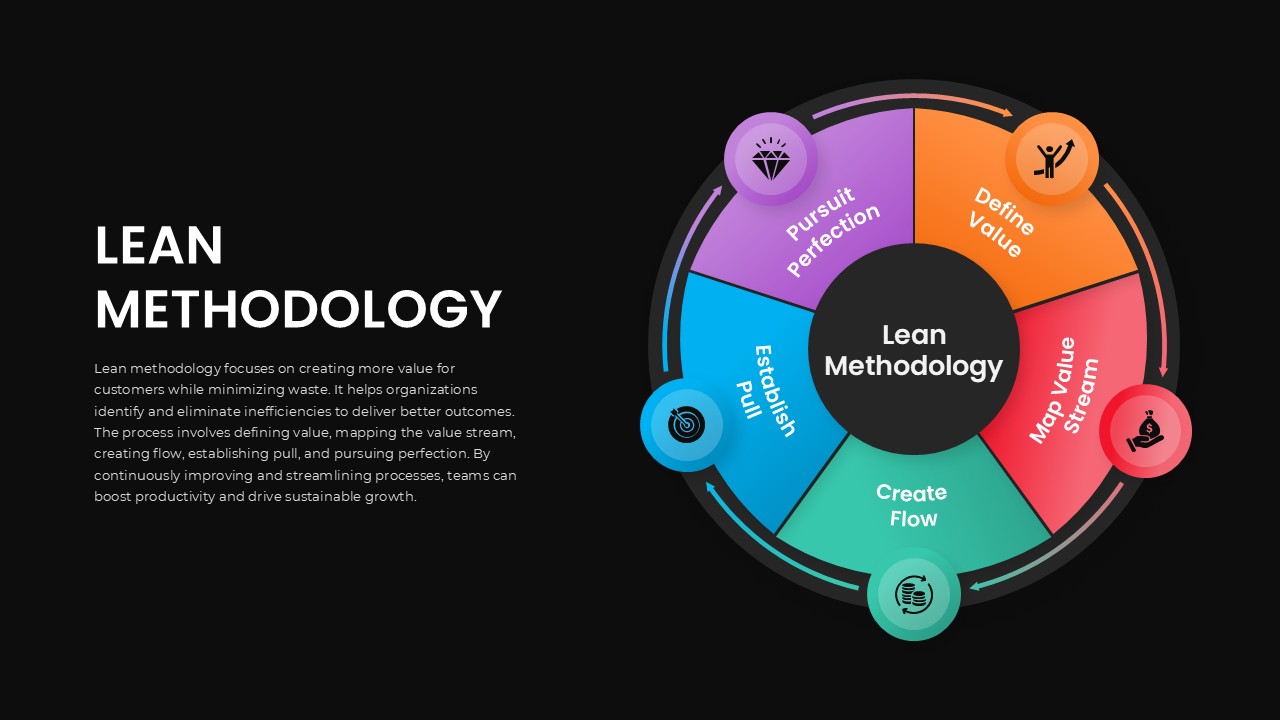
Lean Methodology Circular Process Template for PowerPoint & Google Slides
Process
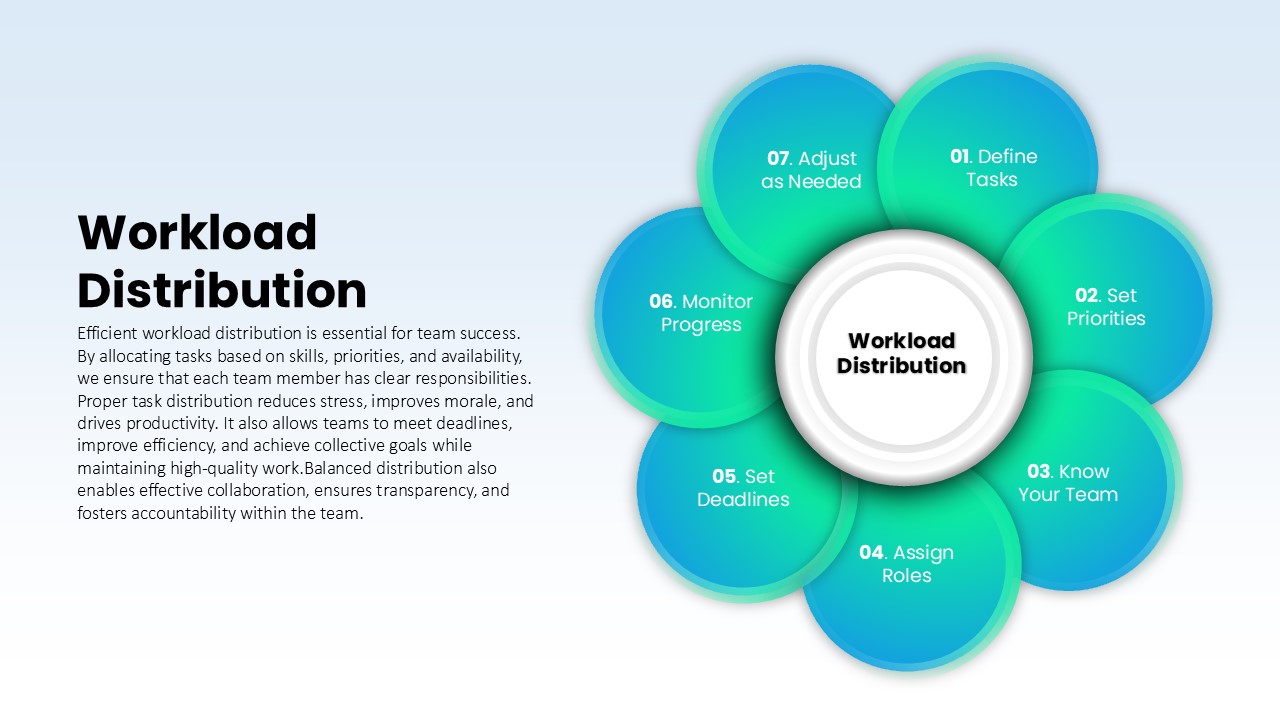
Workload Distribution Circular Diagram Template for PowerPoint & Google Slides
Circular
SWOT Analysis Infographic with Circular Icons Template for PowerPoint & Google Slides
SWOT
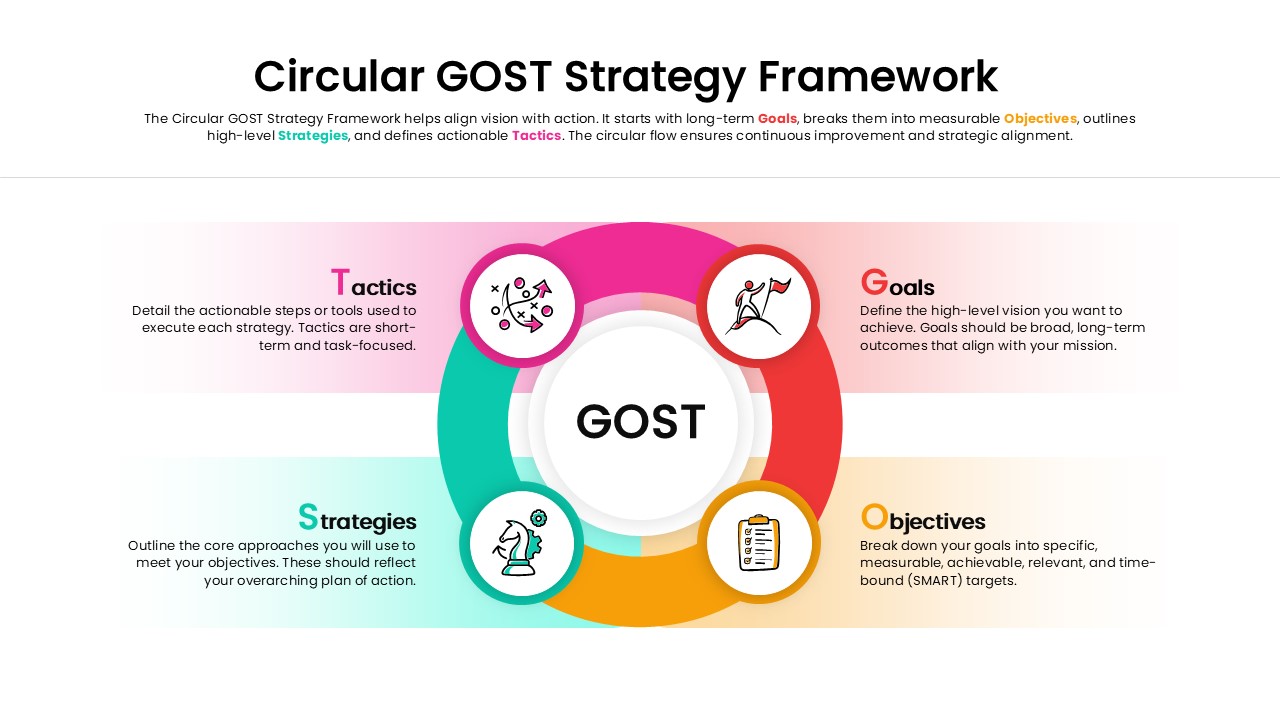
Circular GOST Strategy Framework Template for PowerPoint & Google Slides
Goals