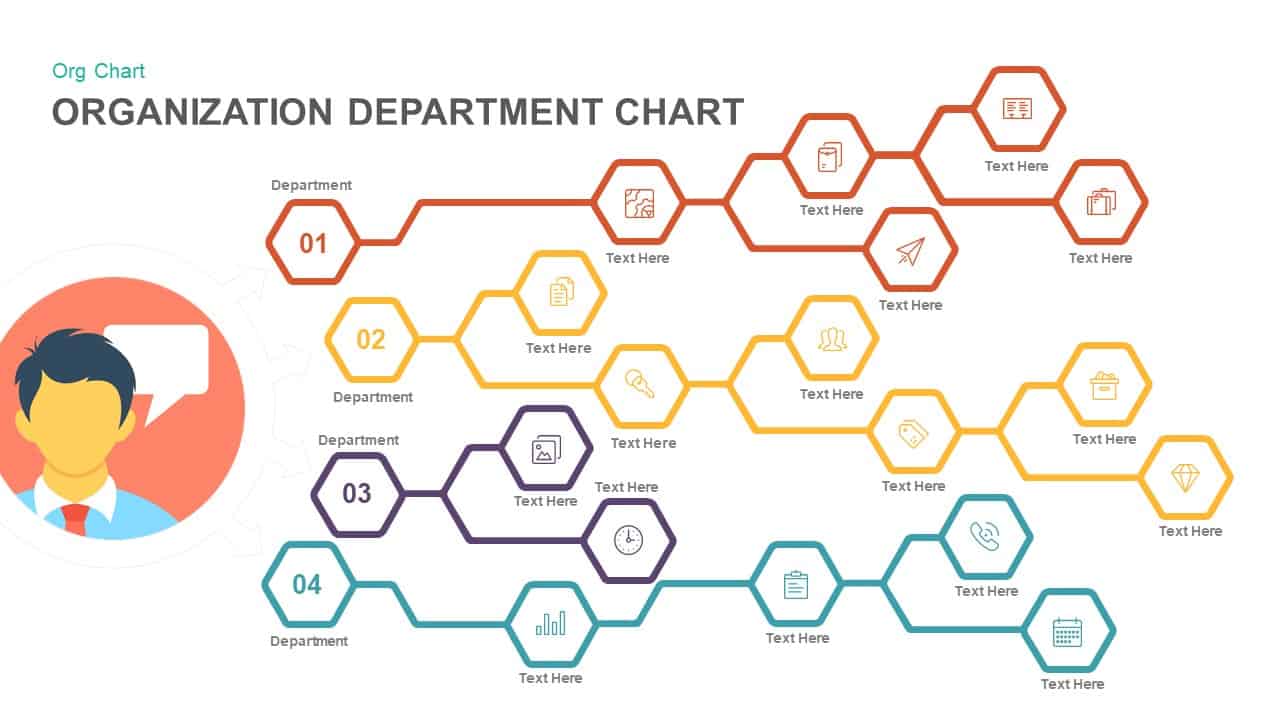
Organization Department Hexagon Chart Template for PowerPoint & Google Slides
Description
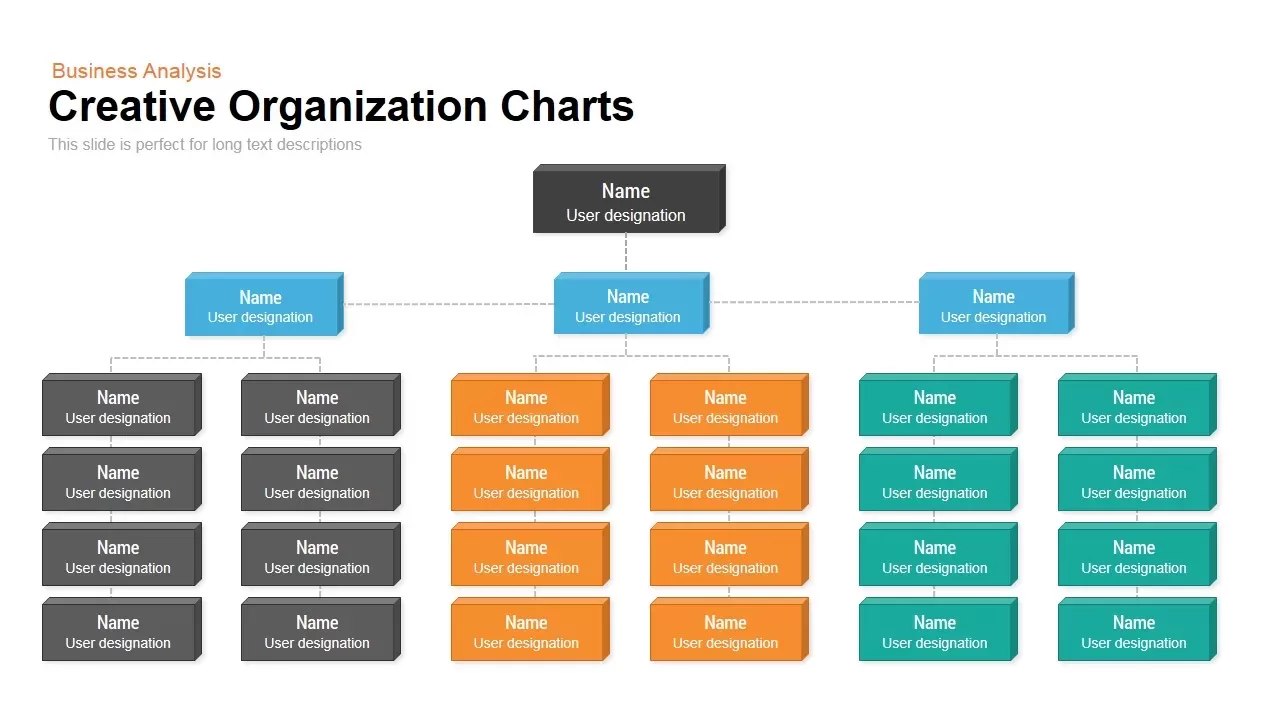
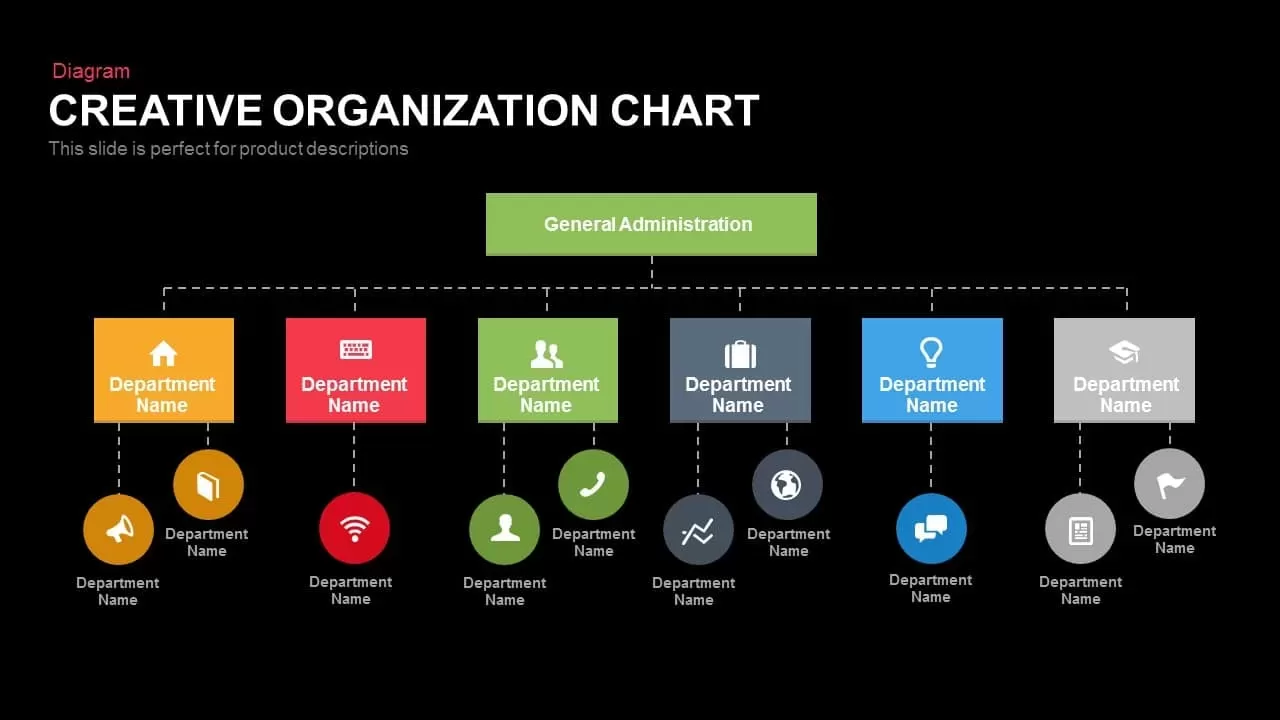
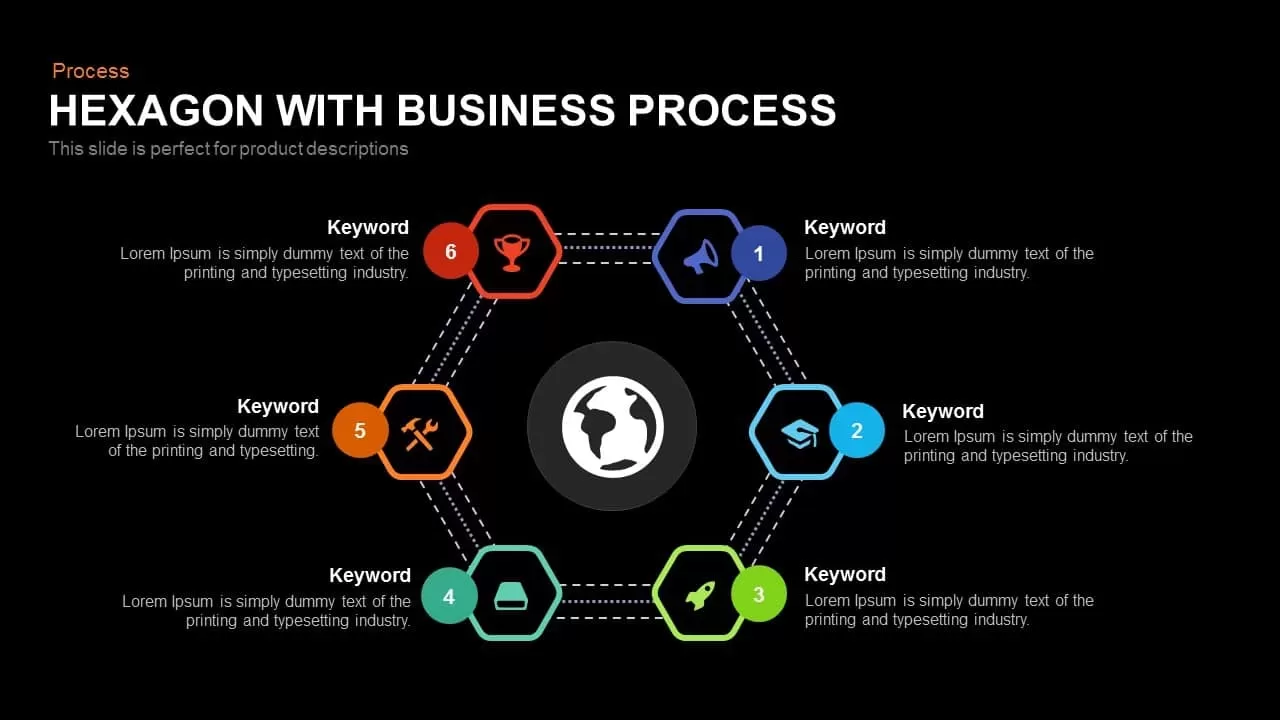
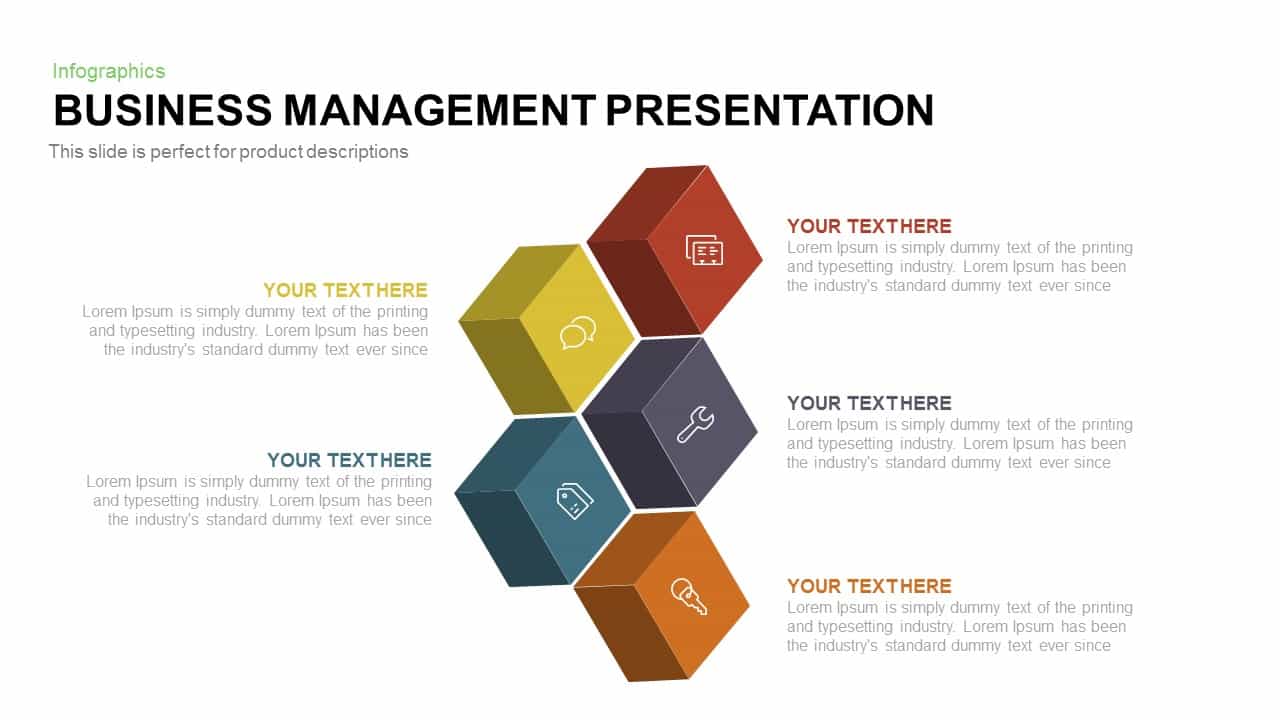
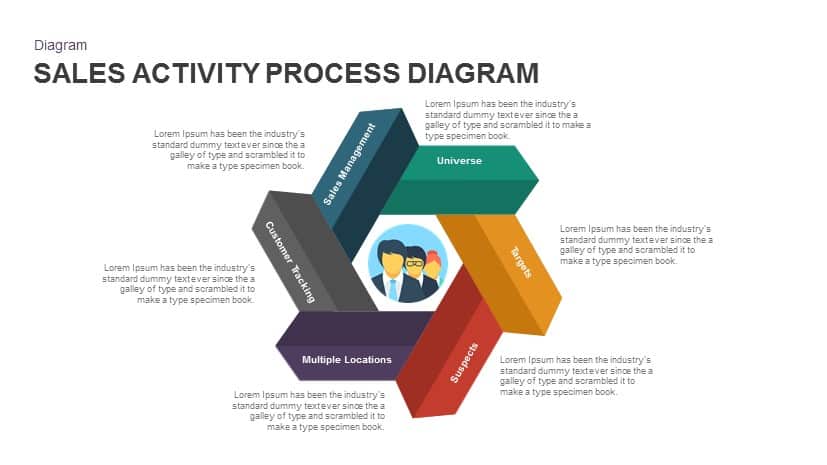
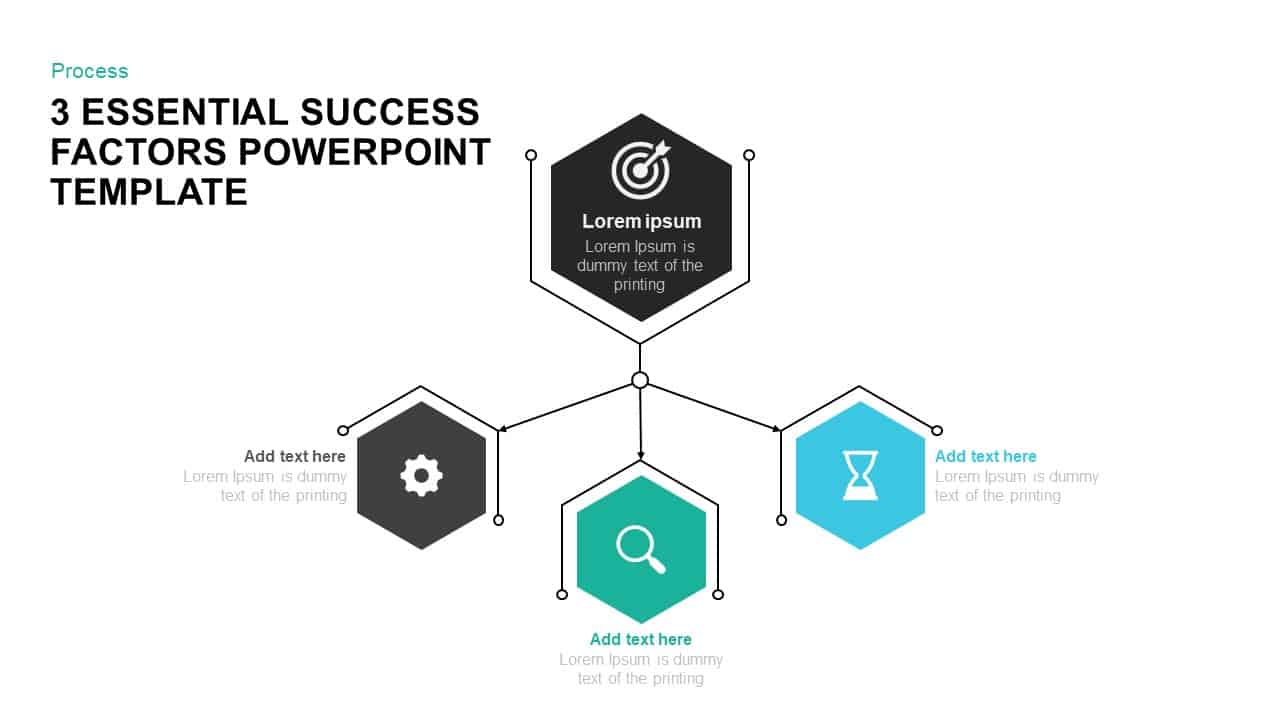
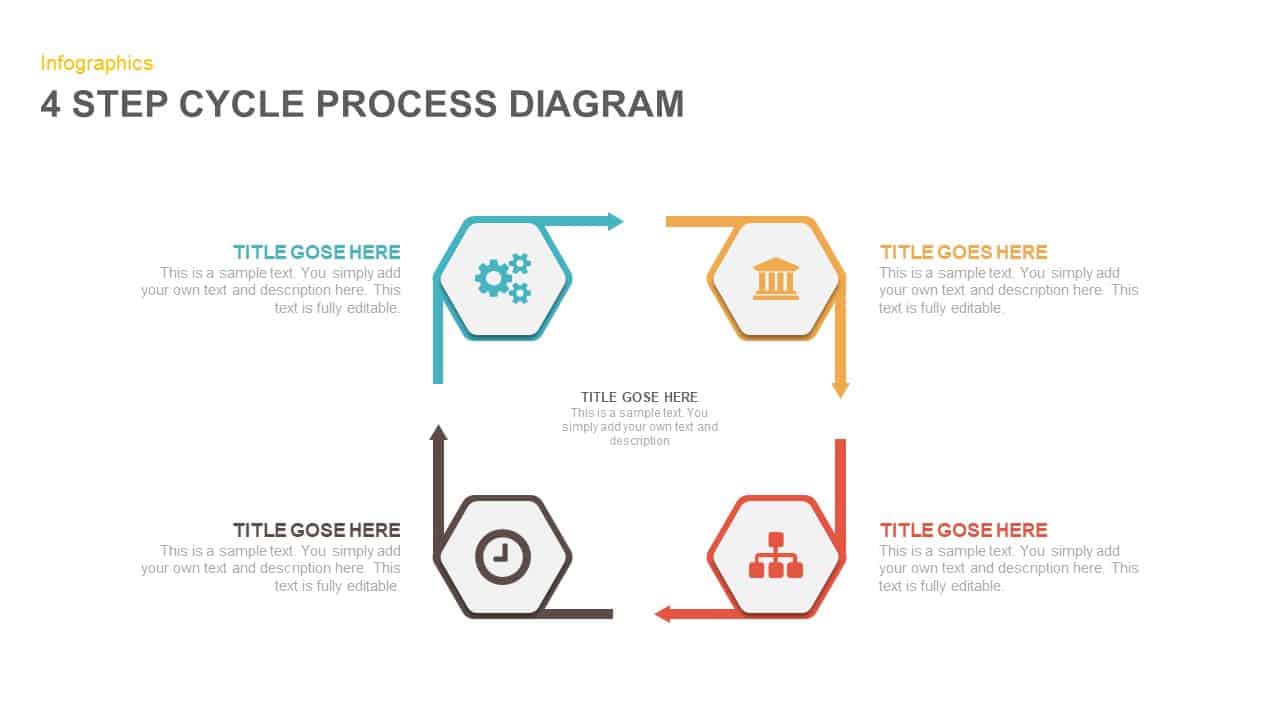
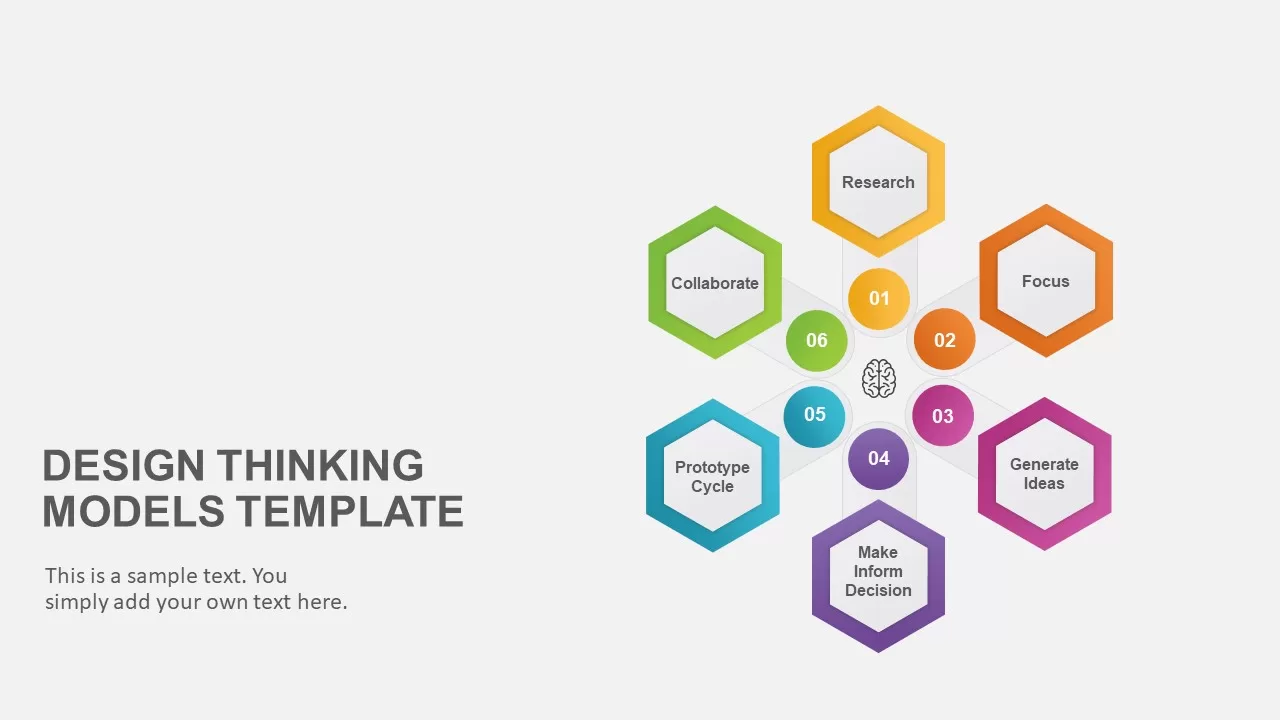
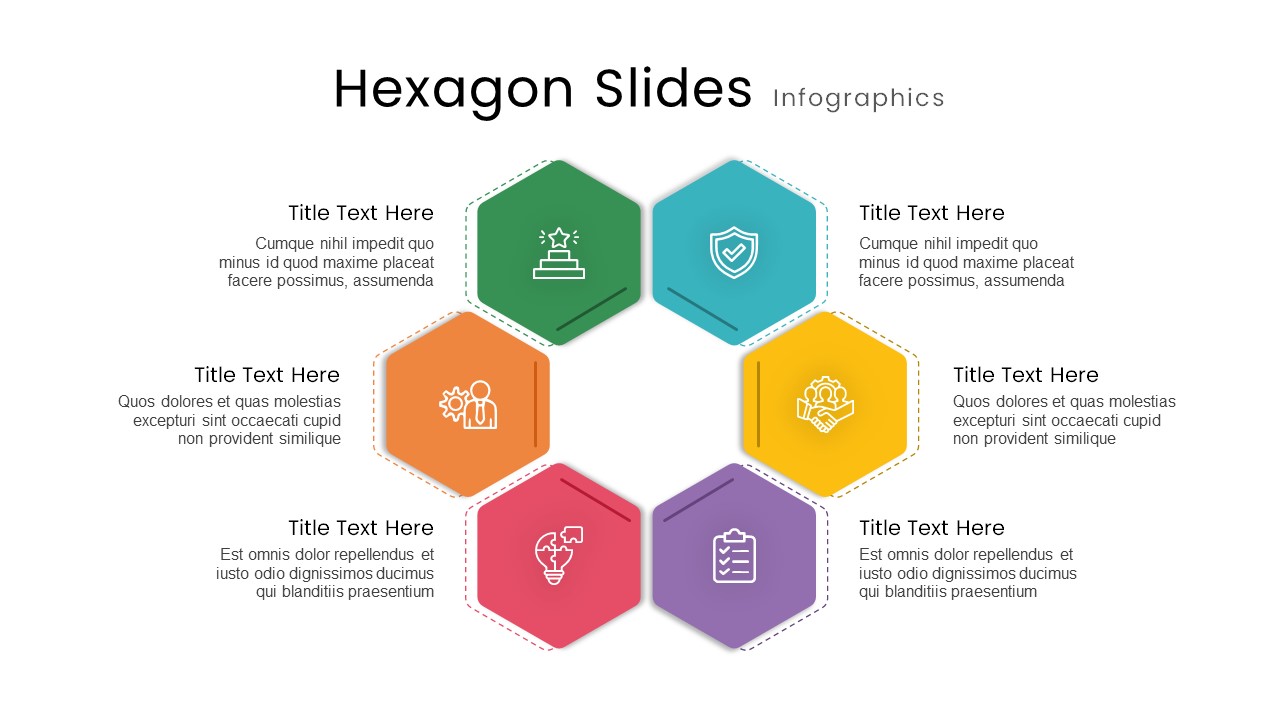
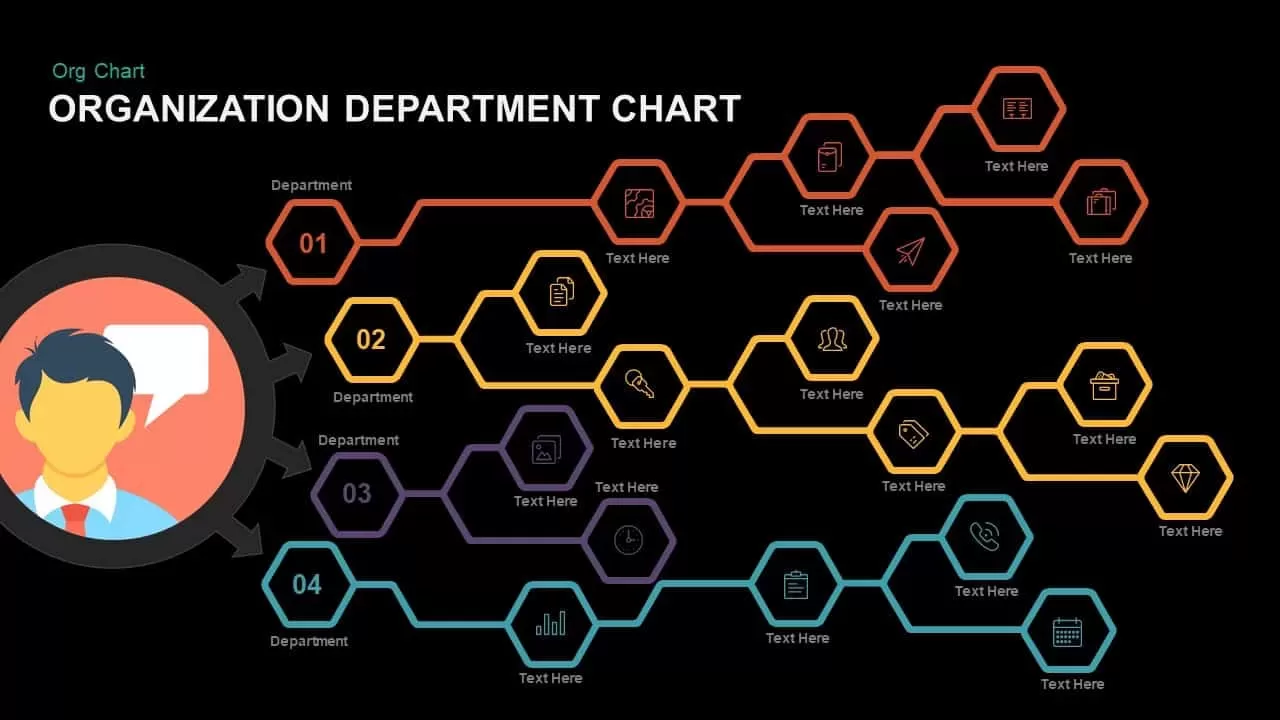
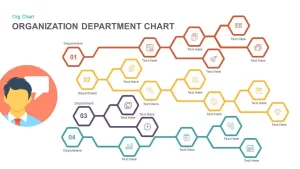
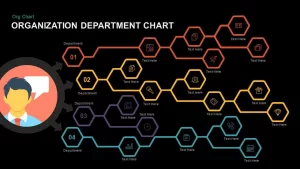
The editable organizational department chart slide leverages a modern hexagonal framework to visualize hierarchical relationships, departmental functions, or team member clusters in a single, cohesive design. Four primary branches stem from numbered nodes (01–04), each distinguished by bold hexagon outlines and icon placeholders for clear differentiation. A clean white canvas accentuates the color‐coded connectors—burnt orange, golden yellow, deep purple, and vivid teal—guiding viewers smoothly through each department’s flow. Each hexagonal node houses a descriptive label and symbolic icon, enabling concise depiction of department names, strategic objectives, or performance metrics.
Built on master slides for both PowerPoint and Google Slides, this template provides fully editable vector shapes, customizable fonts, and adaptable color schemes. Swiftly personalize your chart by swapping icons, resizing hexagons, or reassigning color accents to align with corporate branding. The flat, minimal aesthetic ensures maximum readability in boardrooms, webinars, or printed reports, while optional entrance animations direct audience attention to each branch.
Leverage the hexagon network to reinforce thematic groupings or performance tiers, integrating inline data charts or KPI indicators within node placeholders for immediate visual reference. The high‐contrast numbering and iconography enhances retention, making this slide ideal for executive briefings, investor pitches, or departmental onboarding sessions. Light and dark theme variations support seamless adaptation to diverse brand guidelines or existing slide decks.
Export‐ready vector quality ensures high‐resolution clarity for print, PDF distribution, or large‐format displays. Combine this org chart with complementary layouts to create a unified presentation, streamline content updates, and maintain consistent design language throughout your organization’s communications.
Who is it for
Business leaders, HR managers, and project coordinators can utilize this chart to clearly map team structures, reporting lines, or cross‐functional collaborations. Corporate executives, department heads, and startup founders benefit from the intuitive hexagonal layout to communicate roles and responsibilities. Trainers, consultants, and educators can leverage the slide to demonstrate organizational models, resource allocation, or departmental workflows.
Other Uses
Beyond organizational mapping, repurpose this slide to illustrate product development stages, process workflows, or project milestones. Use hexagonal nodes to display service offerings, customer segments, or strategic priorities. Expand branches to showcase budget allocations, risk assessments, or vendor networks, adapting the chart to diverse business scenarios.
Login to download this file

Item ID
SB00916
Related Templates

Corporate Organization Chart template for PowerPoint & Google Slides
Org Chart

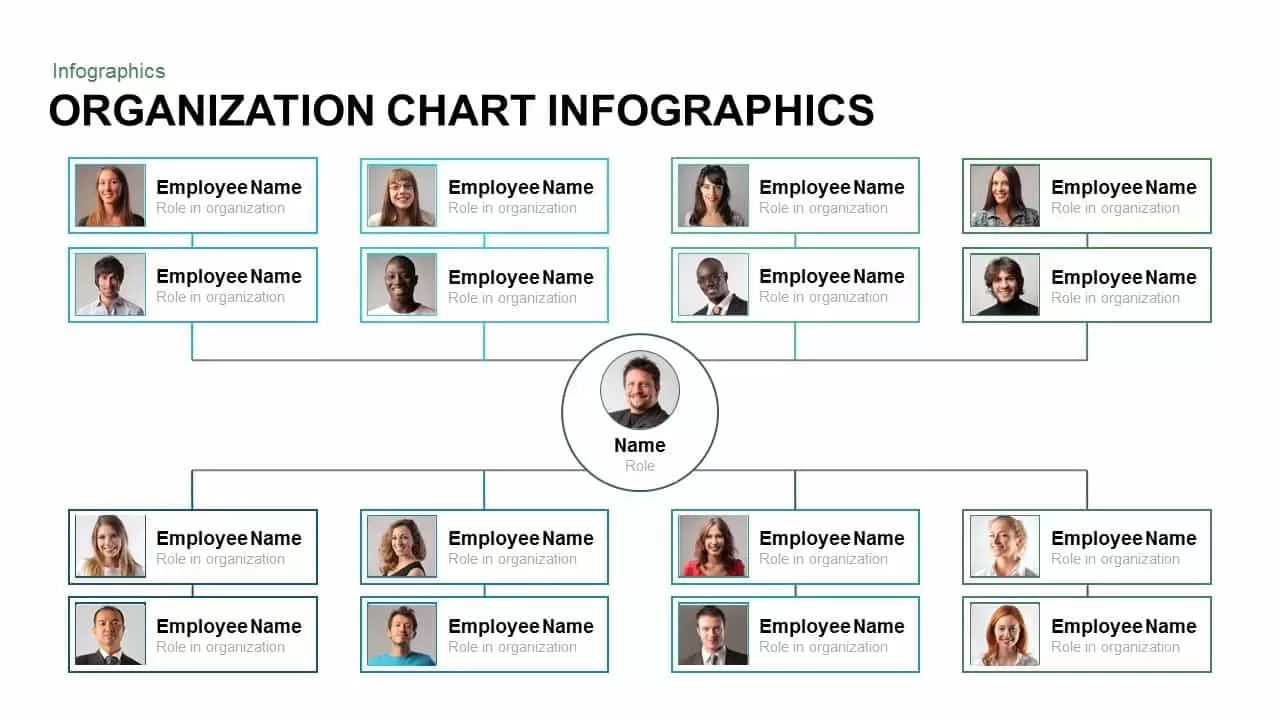
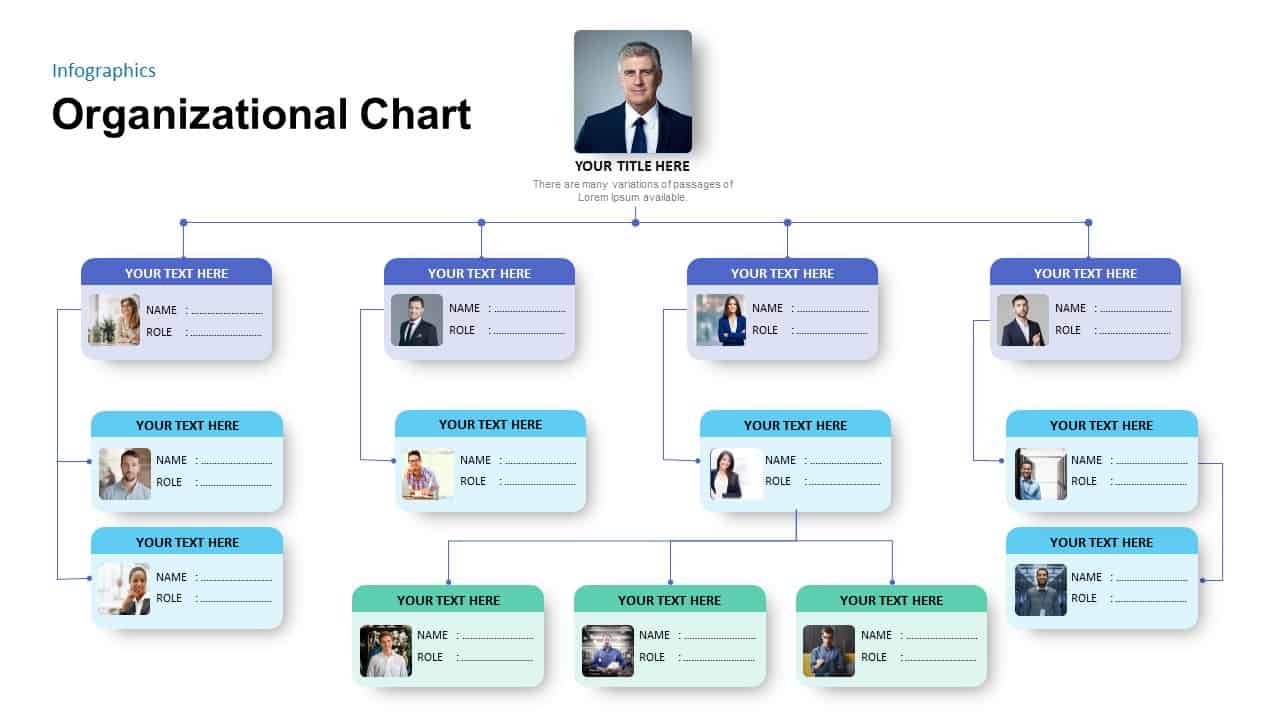
Organization Chart template for PowerPoint & Google Slides
Org Chart
Business Organization Chart Hierarchy Template for PowerPoint & Google Slides
Org Chart
Isometric Organization Chart Diagram Template for PowerPoint & Google Slides
Org Chart
Creative Organization Chart Diagram Template for PowerPoint & Google Slides
Org Chart

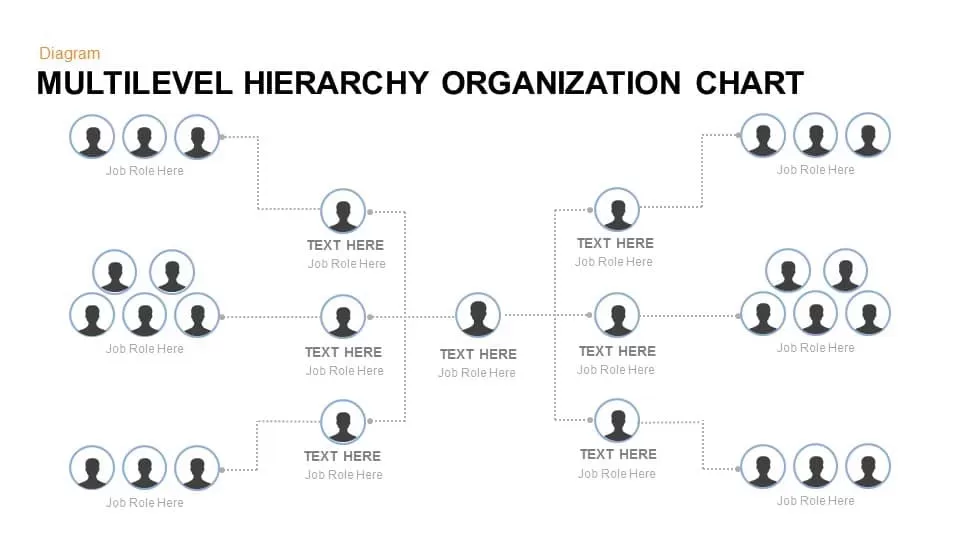
Multilevel Hierarchy Organization Chart template for PowerPoint & Google Slides
Org Chart
Organization Chart Overview template for PowerPoint & Google Slides
Org Chart
3D Organization Hierarchy Chart Template for PowerPoint & Google Slides
Org Chart
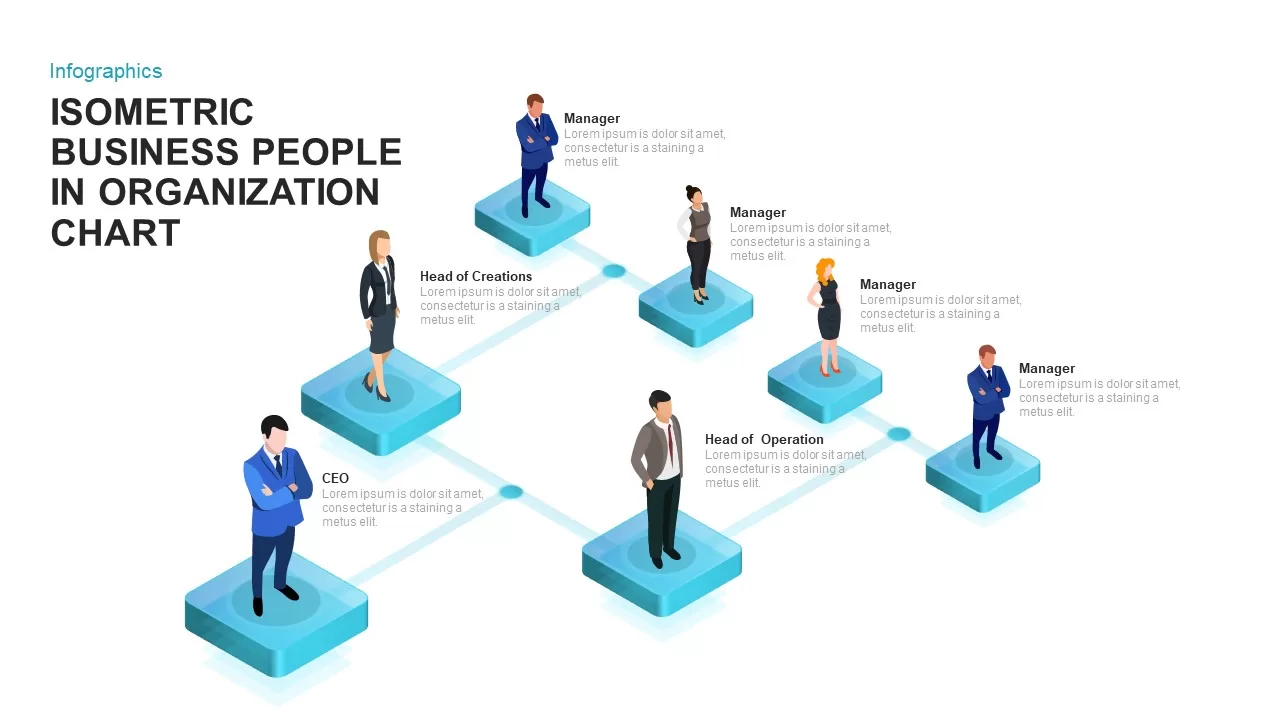
Isometric Business Organization Chart Template for PowerPoint & Google Slides
Org Chart
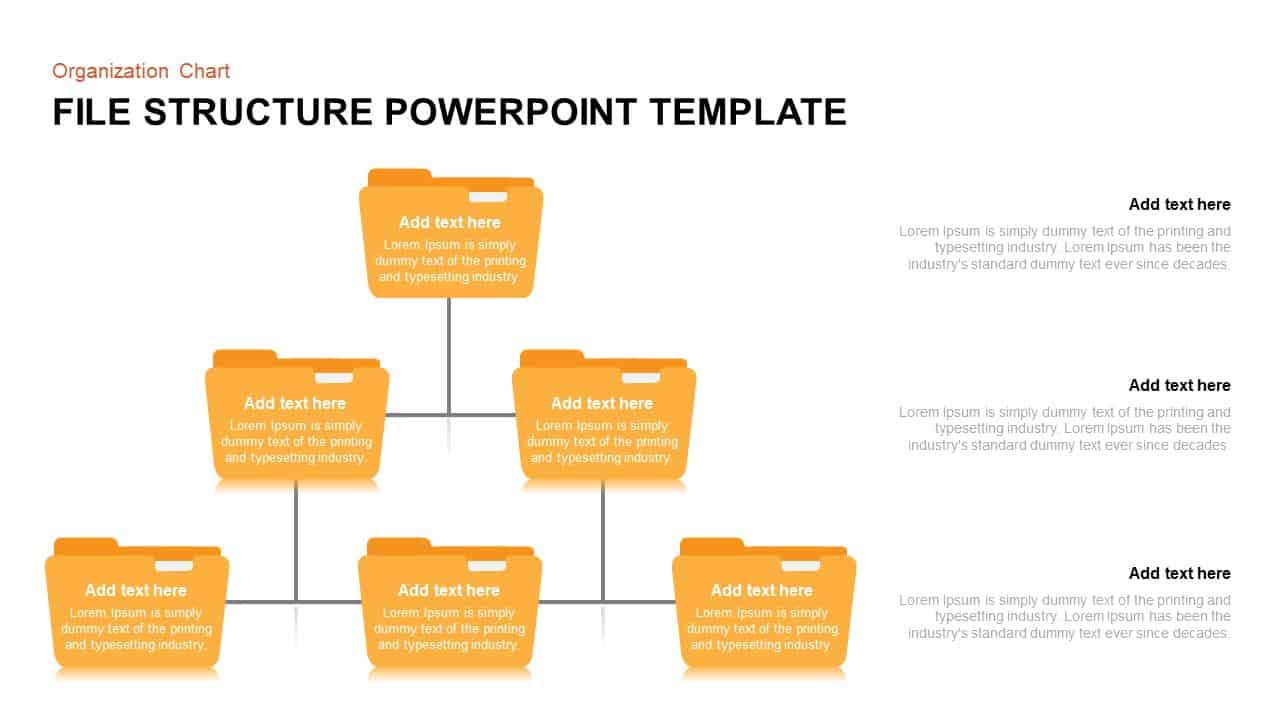
File Structure Organization Chart Template for PowerPoint & Google Slides
Org Chart
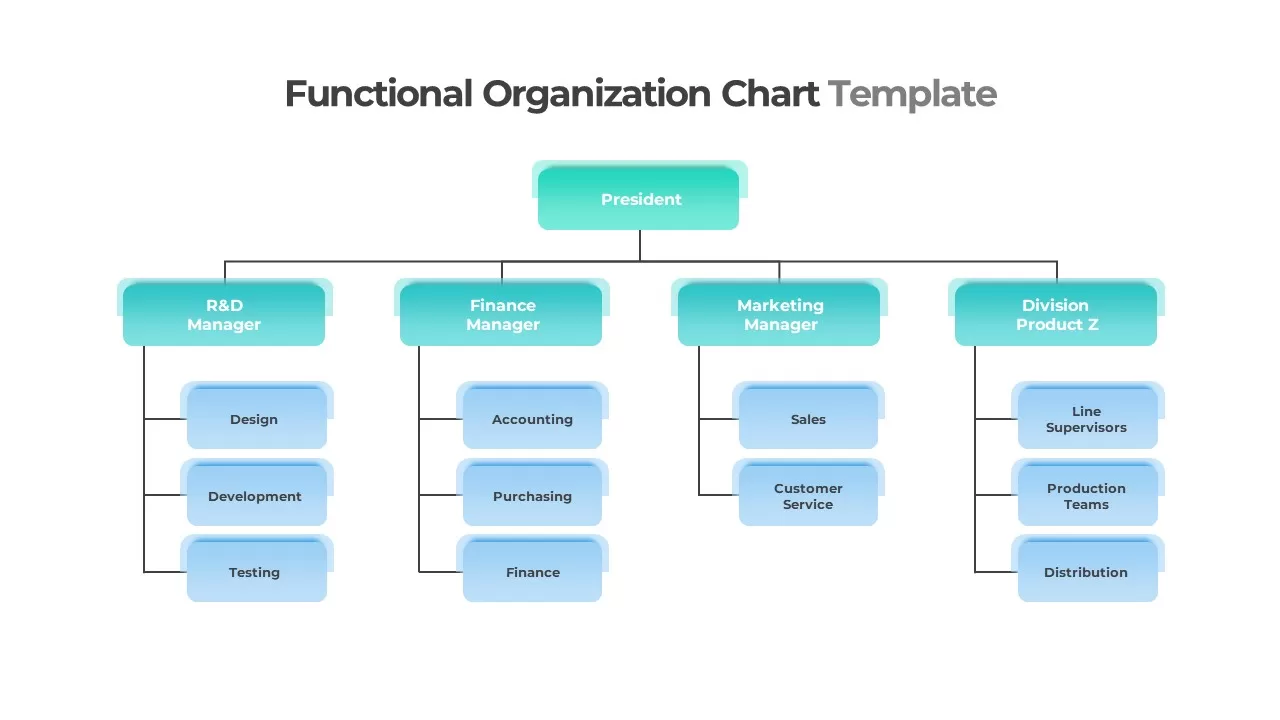
Functional Organization Chart Structure Template for PowerPoint & Google Slides
Org Chart
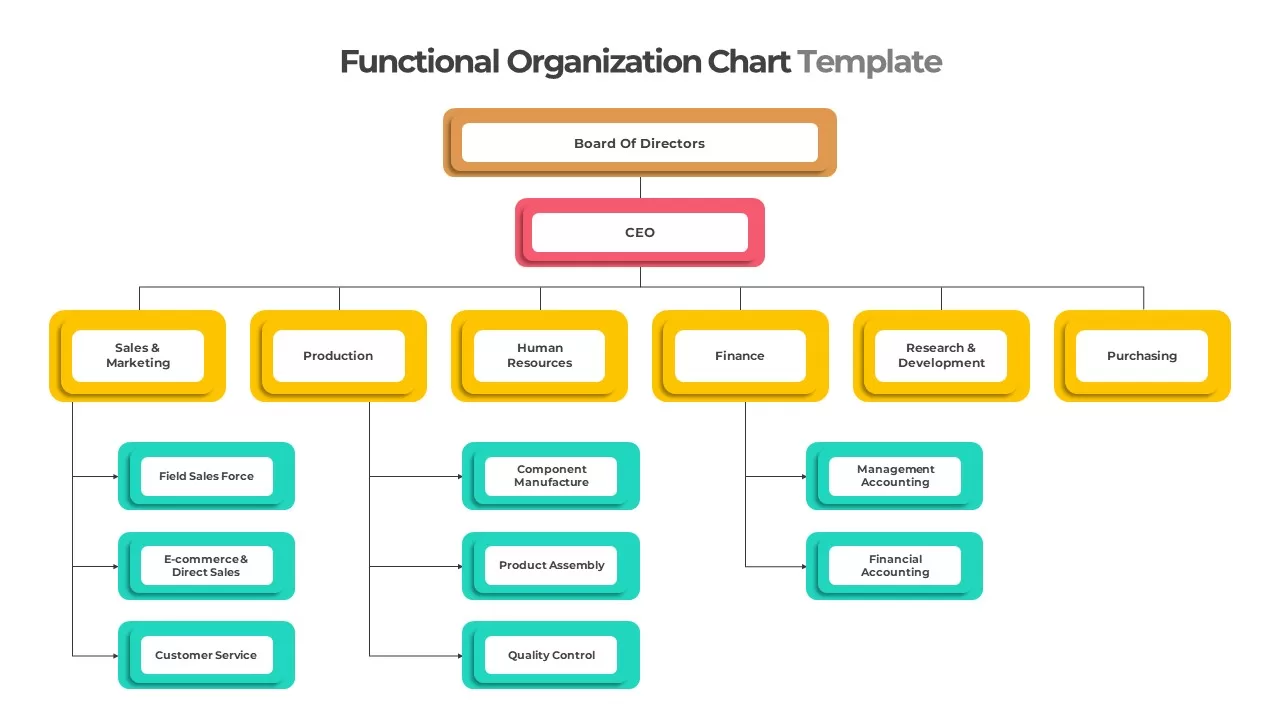
Colorful Functional Organization Chart Template for PowerPoint & Google Slides
Org Chart
Modern Divisional Organization Chart Template for PowerPoint & Google Slides
Org Chart
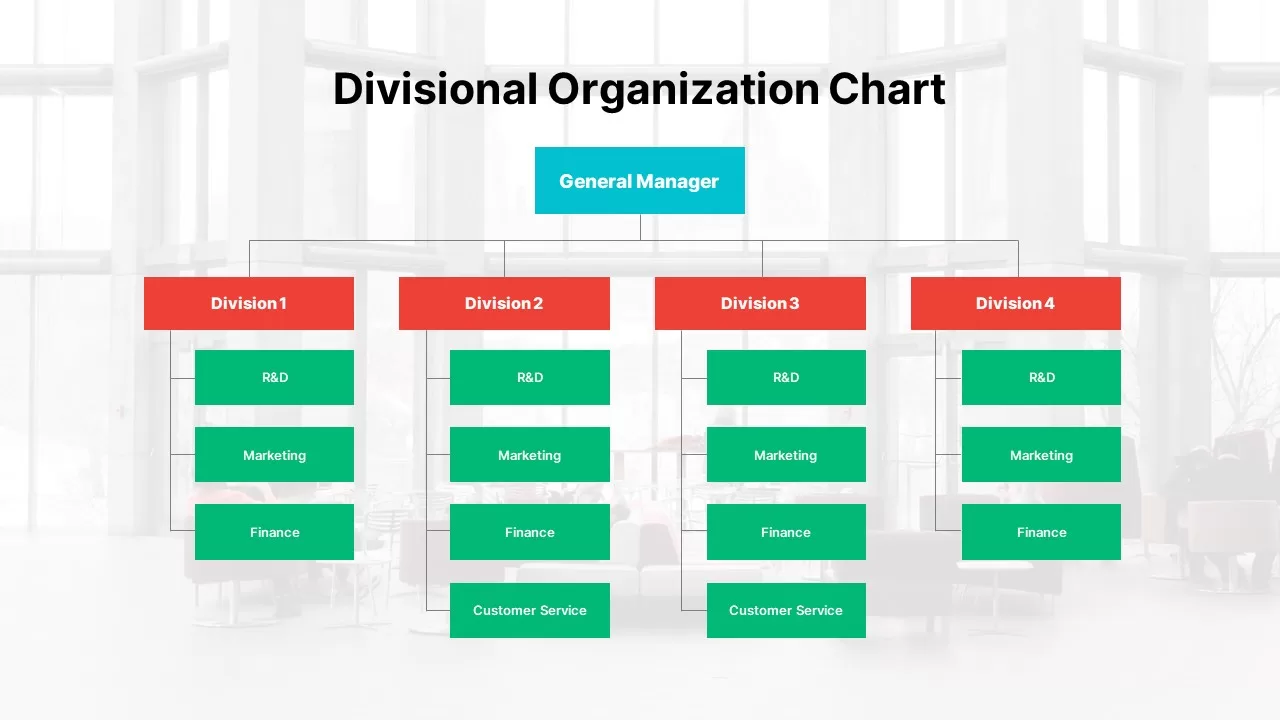
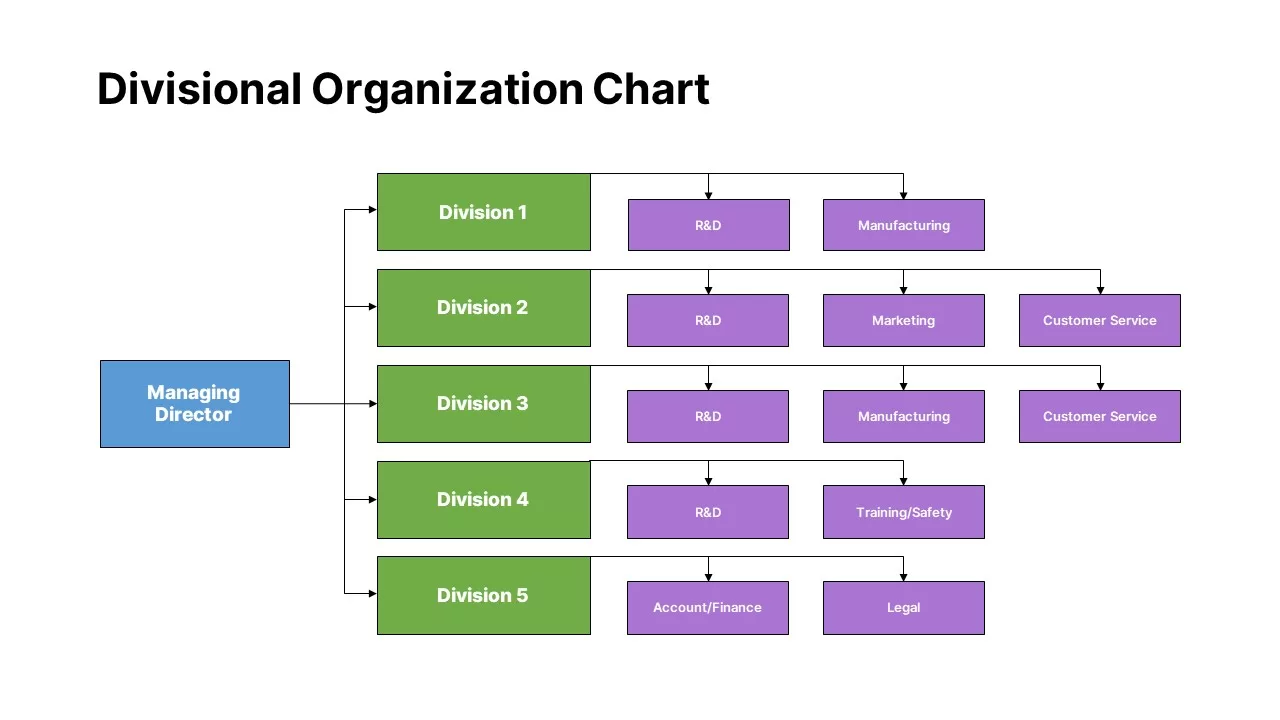
Divisional Organization Chart Template for PowerPoint & Google Slides
Org Chart
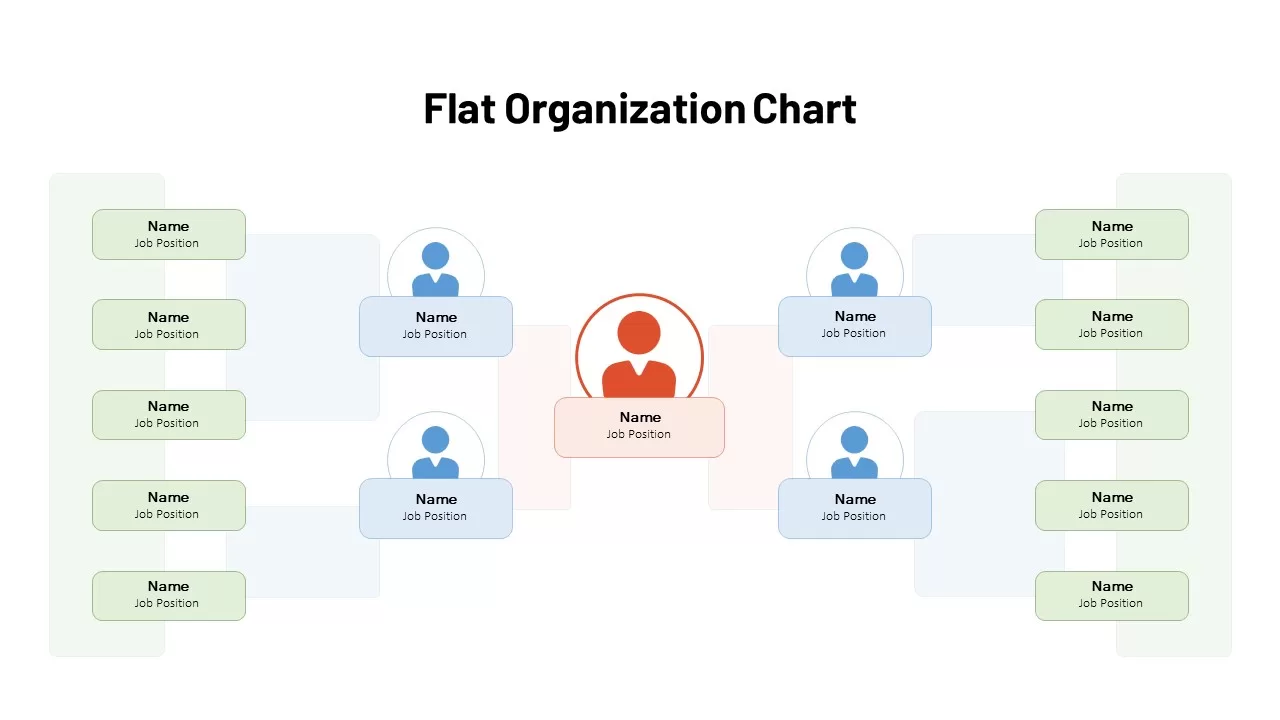
Flat Organization Chart Diagram Template for PowerPoint & Google Slides
Org Chart
Flat Organization Chart Diagram Template for PowerPoint & Google Slides
Org Chart
Professional HR Organization Chart Template for PowerPoint & Google Slides
Org Chart
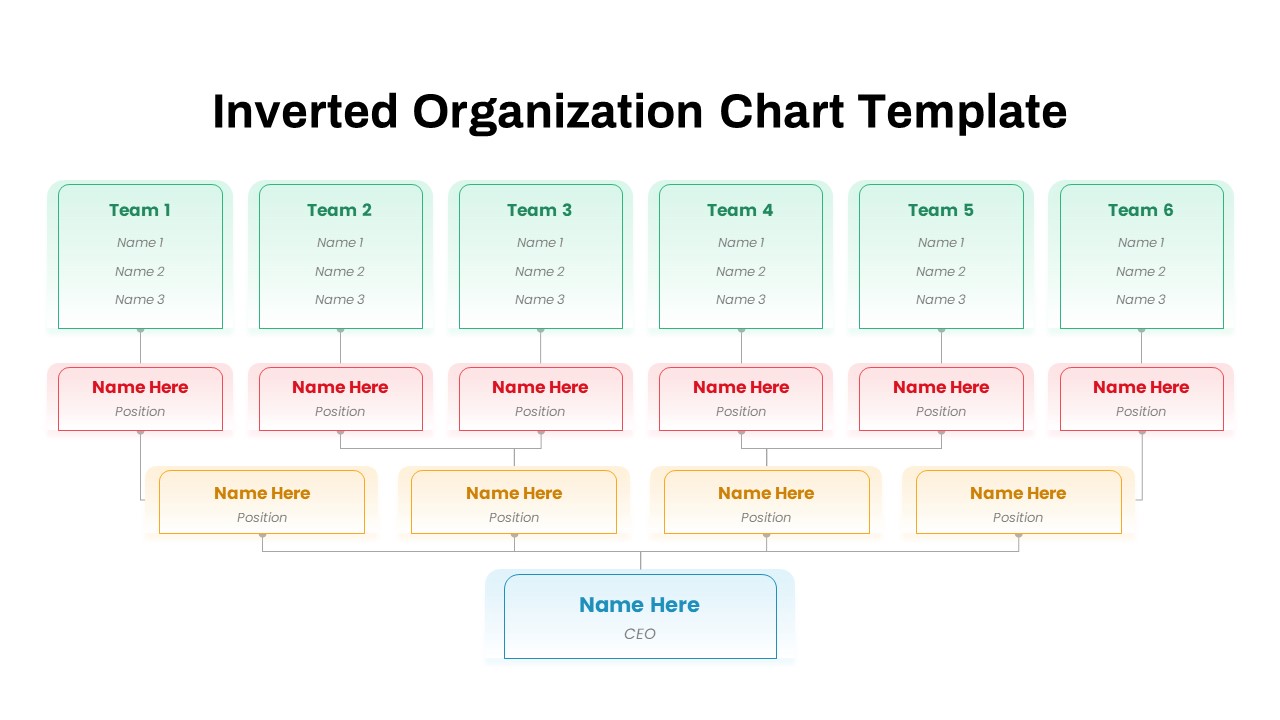
Inverted Organization Chart Diagram Template for PowerPoint & Google Slides
Org Chart
Professional Table of Organization Chart Template for PowerPoint & Google Slides
Org Chart
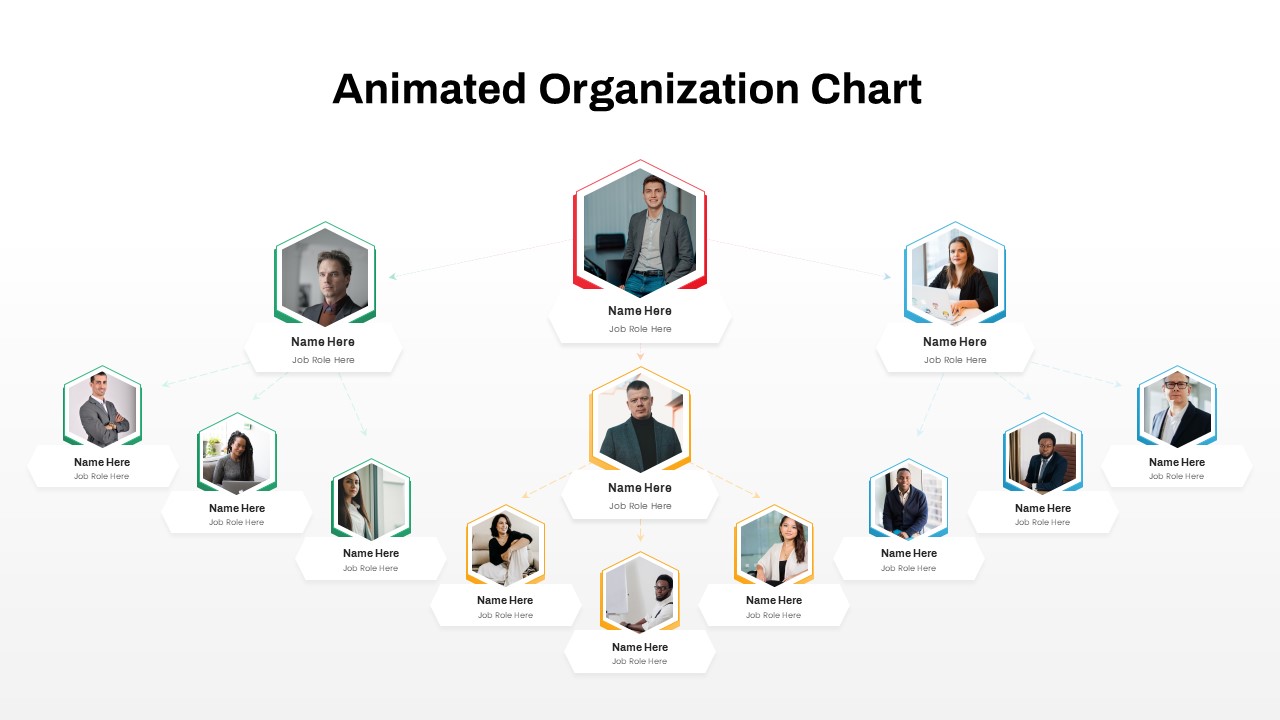
Animated Hexagon Org Chart Diagram Template for PowerPoint & Google Slides
Org Chart
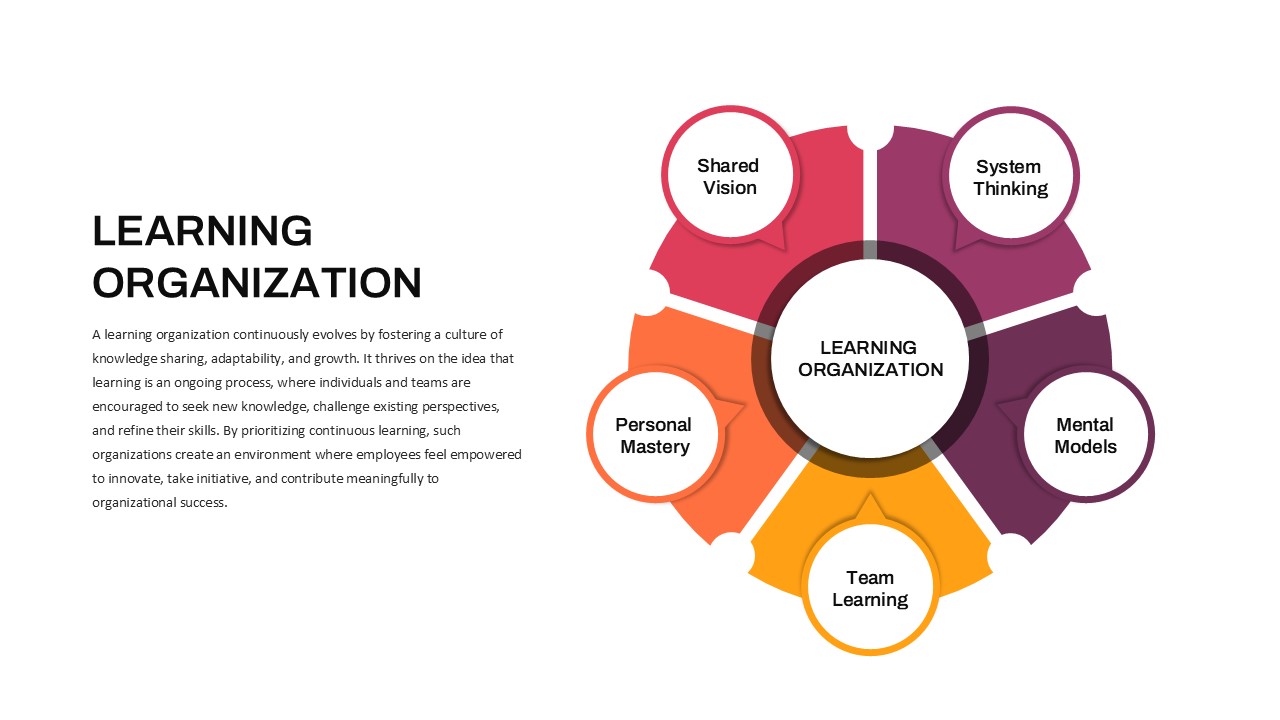
Learning Organization PowerPoint Template for PowerPoint & Google Slides
Business Strategy
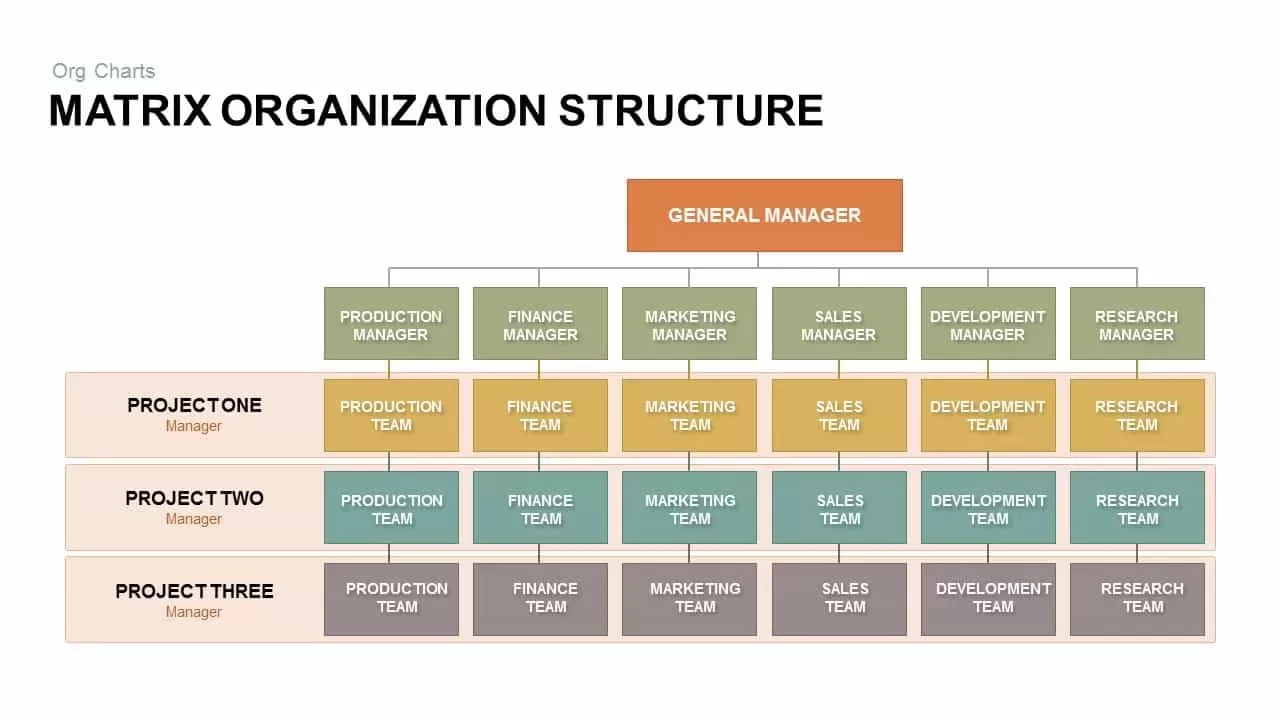
Matrix Organization Structure template for PowerPoint & Google Slides
Org Chart

Non-Profit Organization Profile Deck Template for PowerPoint & Google Slides
Pitch Deck
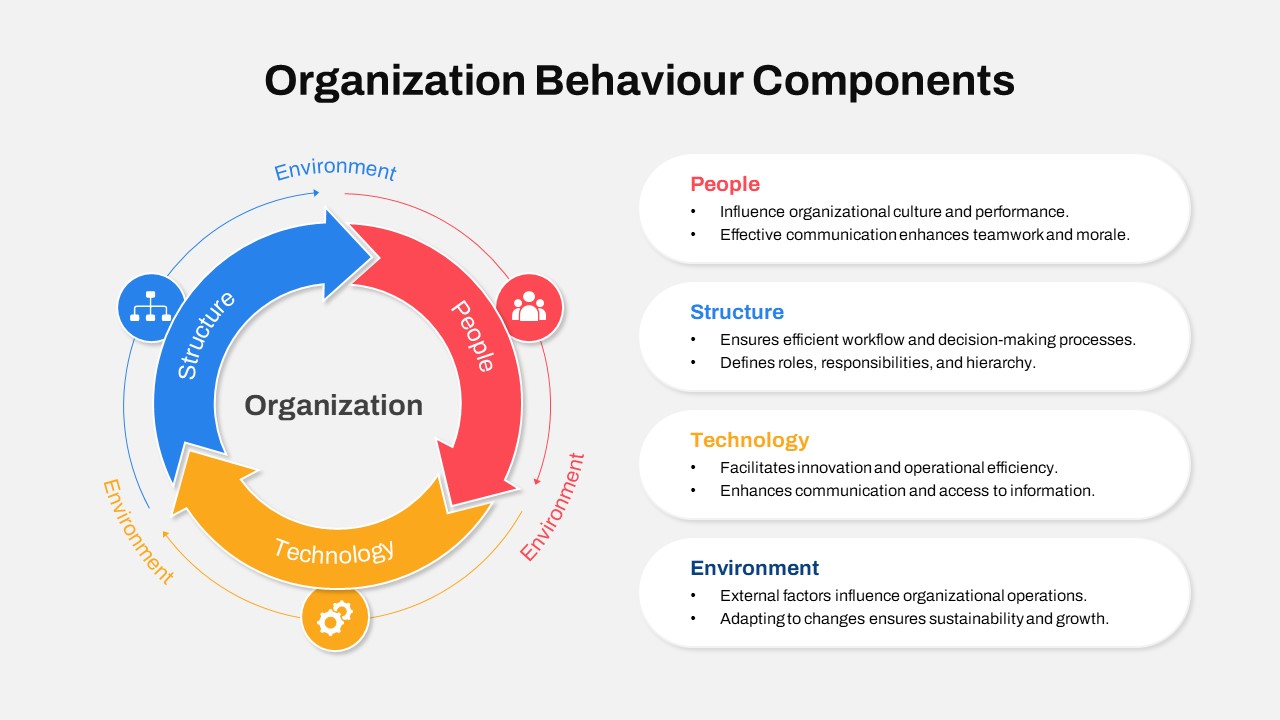
Organization Behaviour Circular Template for PowerPoint & Google Slides
Circular
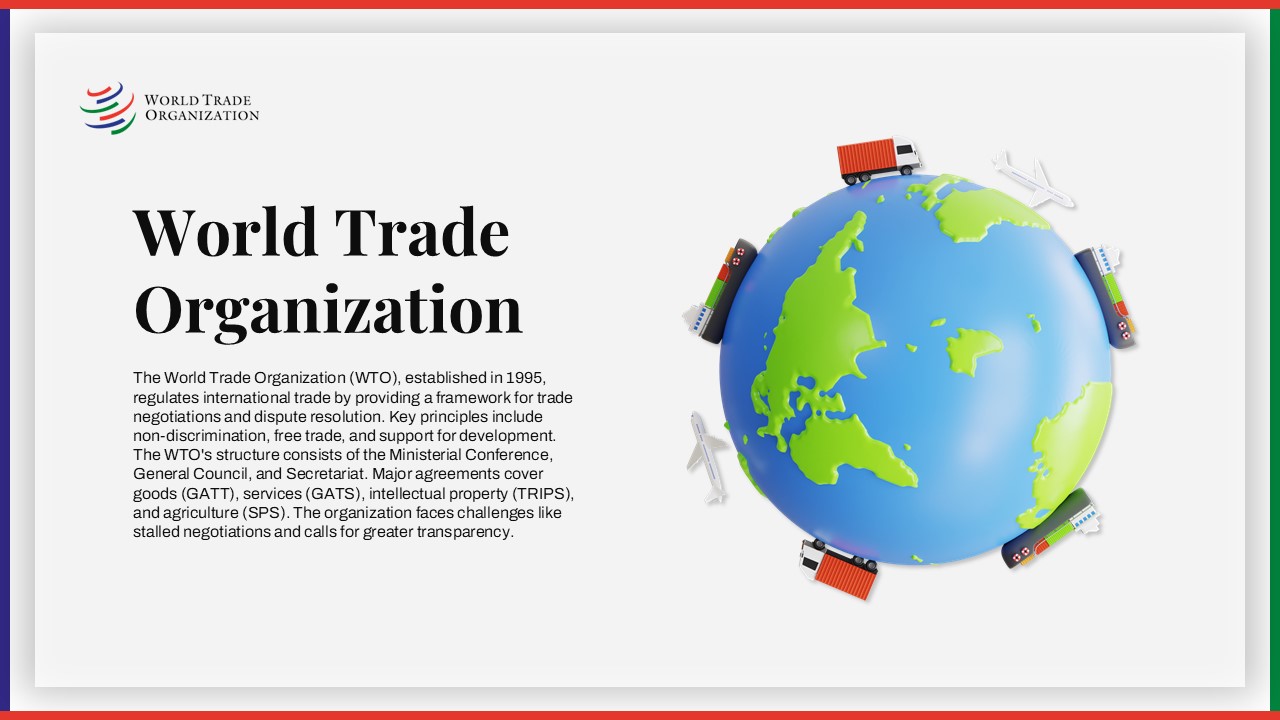
World Trade Organization Profile Template for PowerPoint & Google Slides
Business
Free World Health Organization Presentation Deck for PowerPoint & Google Slides
Decks
Free
Hexagon Infographic template for PowerPoint & Google Slides
Infographics
Six-Stage Hexagon template for PowerPoint & Google Slides
Process
Six Hexagon Stages Process Flow Diagram Template for PowerPoint & Google Slides
Process
Hexagon Shapes with Numbers Process Template for PowerPoint & Google Slides
Process
Annual Creative Hexagon Timeline Diagram Template for PowerPoint & Google Slides
Timeline

Hexagon Process Infographic Template for PowerPoint & Google Slides
Process
Global Hexagon Six-Step Business Process Template for PowerPoint & Google Slides
Process
Five-Stage Hexagon Process Infographics template for PowerPoint & Google Slides
Process
Business Management Hexagon Diagram Template for PowerPoint & Google Slides
Comparison
Six-Stage Hexagon Timeline Infographic Template for PowerPoint & Google Slides
Timeline
Six-Step Hexagon Process Diagram Template for PowerPoint & Google Slides
Process
Six Hexagon Hub-and-Spoke Diagram Template for PowerPoint & Google Slides
Process

Sales Activity Hexagon Process Diagram Template for PowerPoint & Google Slides
Process
Six Segment Hexagon Circular Diagram Template for PowerPoint & Google Slides
Circular
3 Stages Hexagon Shaped Diagram template for PowerPoint & Google Slides
Infographics
Six-Step Hexagon Process Flow Diagram Template for PowerPoint & Google Slides
Process
Six Stage Hexagon Process Diagram Template for PowerPoint & Google Slides
Process
30-60-90 Day Plan with Hexagon Icons Template for PowerPoint & Google Slides
Timeline
Core Values SmartArt Hexagon Diagram Template for PowerPoint & Google Slides
Circular
3 Success Factors Hexagon Process Template for PowerPoint & Google Slides
Process
Seven-Stage Hexagon Timeline Infographic Template for PowerPoint & Google Slides
Timeline
Four-Step Hexagon Process Infographic Template for PowerPoint & Google Slides
Process
6 Step Hexagon Diagram template for PowerPoint & Google Slides
Process
Six-Step Hexagon Design Thinking Models Template for PowerPoint & Google Slides
Circular
Staggered Five-Hexagon Agenda Layout Template for PowerPoint & Google Slides
Agenda
Hexagon 7S Strategic Alignment Model Template for PowerPoint & Google Slides
Business Strategy
Six-Step Hexagon Infographic Layout Template for PowerPoint & Google Slides
Infographics
Six-Part Hexagon Infographic Layout Template for PowerPoint & Google Slides
Infographics
Five-Step Hexagon Infographic Process Template for PowerPoint & Google Slides
Process
Free Five-Part Hexagon Infographic Cluster Template for PowerPoint & Google Slides
Infographics
Free
Three-Step Hexagon Infographic Process Template for PowerPoint & Google Slides
Process

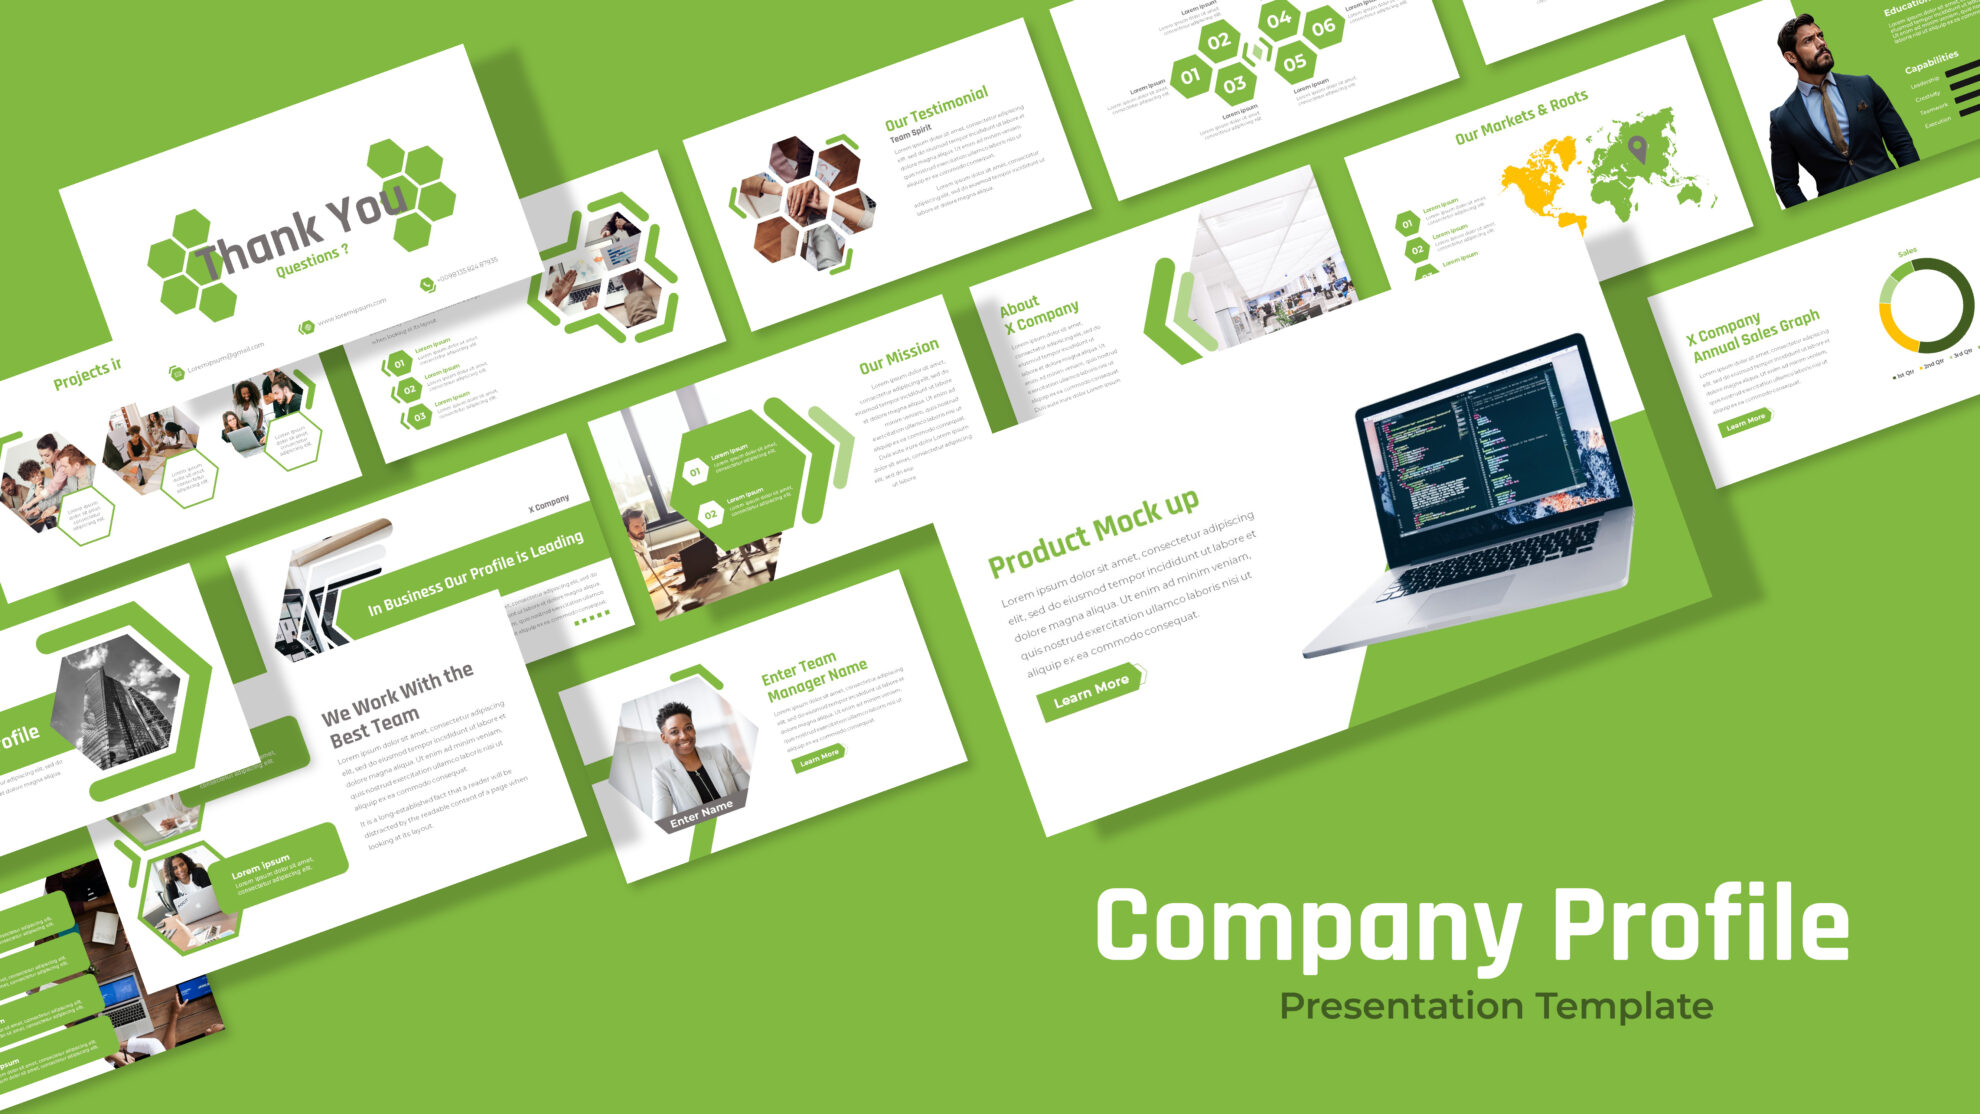
Free Green Hexagon Company Profile Template for PowerPoint & Google Slides
Company Profile
Free
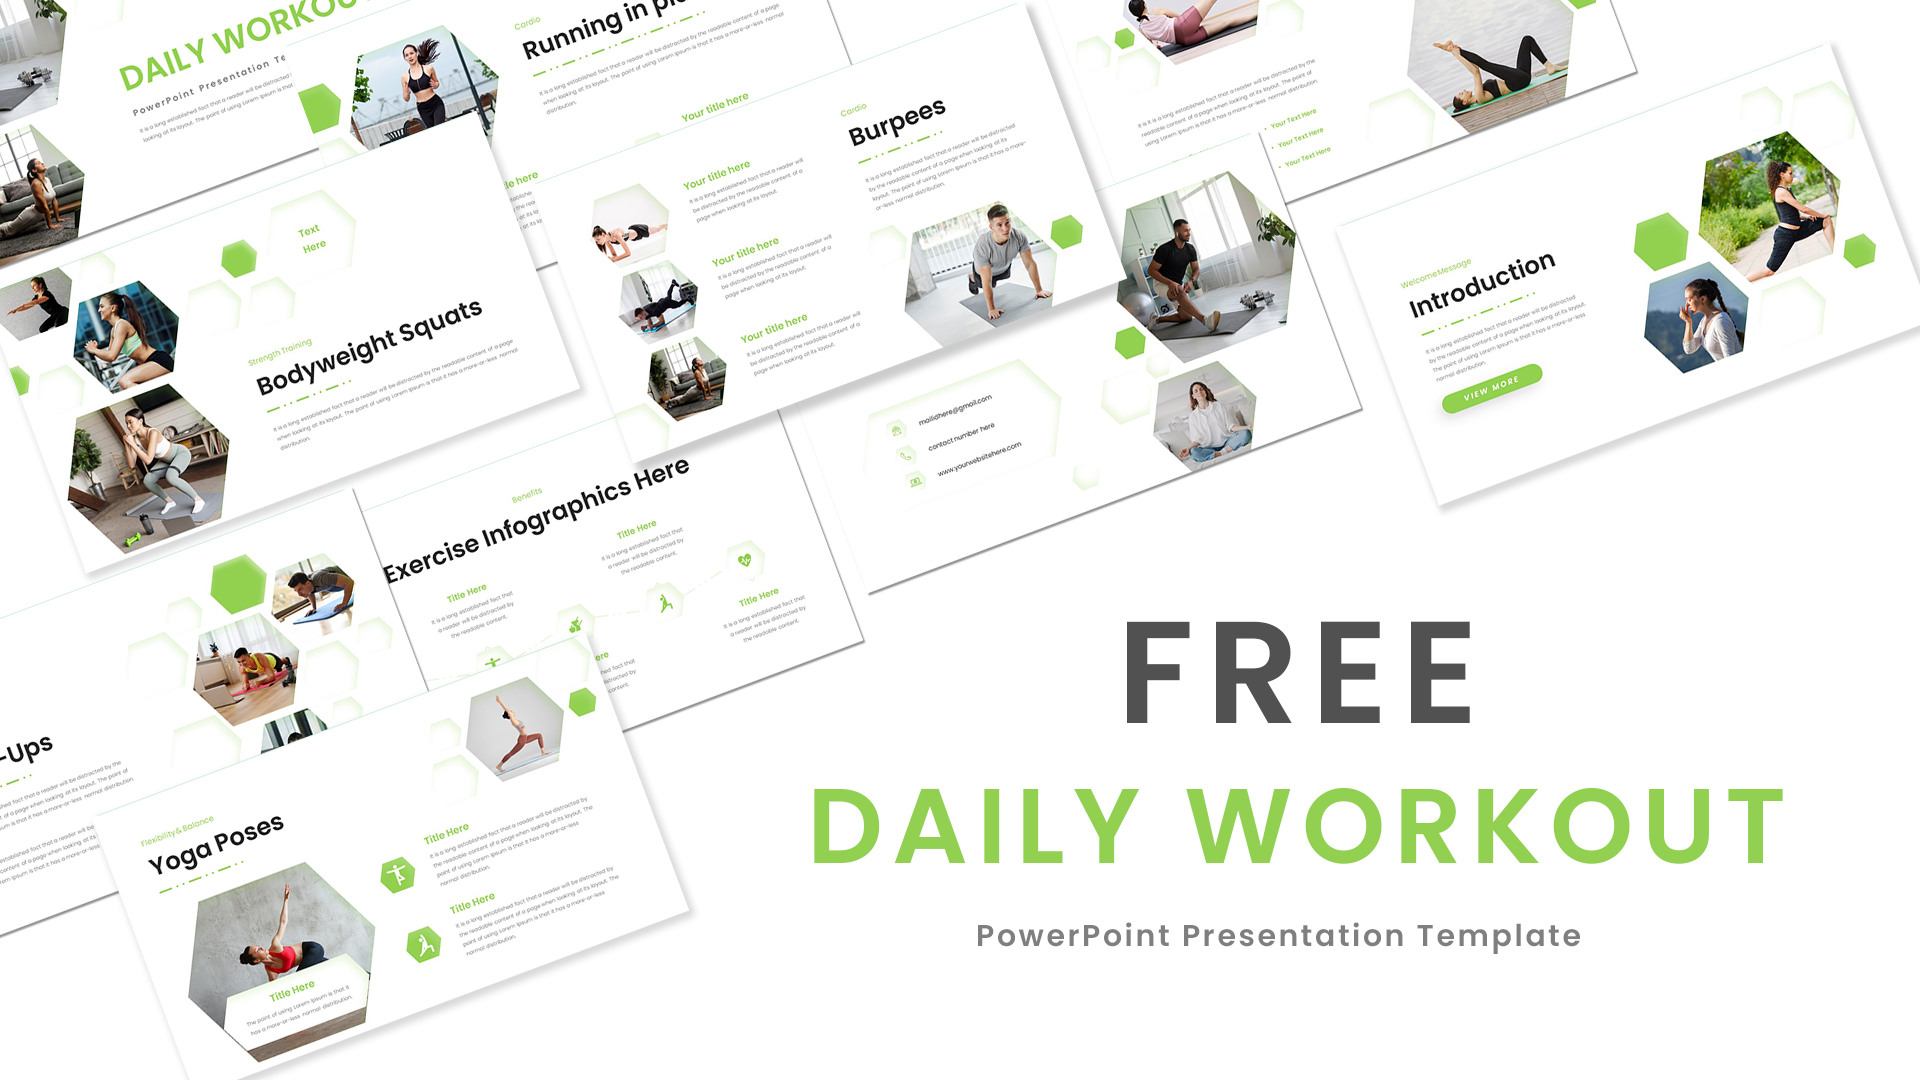
Free Green Hexagon Daily Workout Routine Template for PowerPoint & Google Slides
Pitch Deck
Free
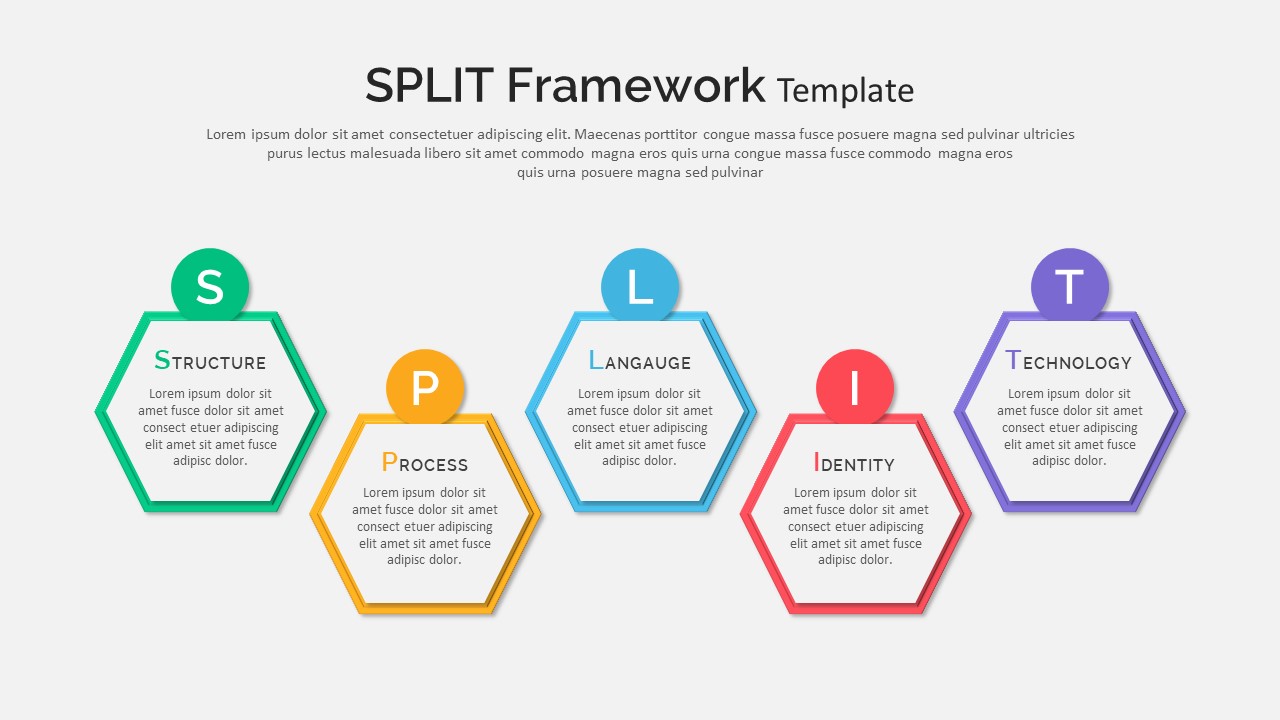
Split Framework Hexagon Diagram Slide Template for PowerPoint & Google Slides
Process
Cybersecurity Shield Hexagon Tech Template for PowerPoint & Google Slides
Information Technology
Medical Hexagon Layout Presentation Template for PowerPoint & Google Slides
Health
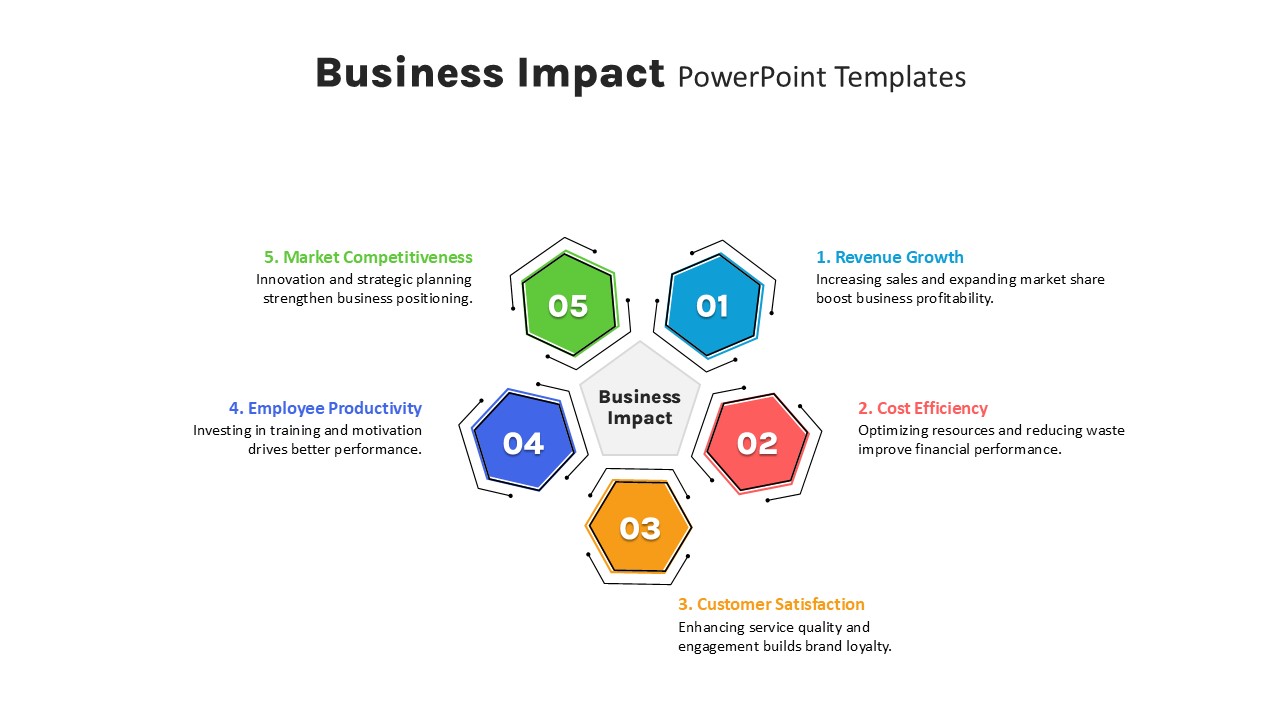
Five-Step Hexagon Business Impact Template for PowerPoint & Google Slides
Circular
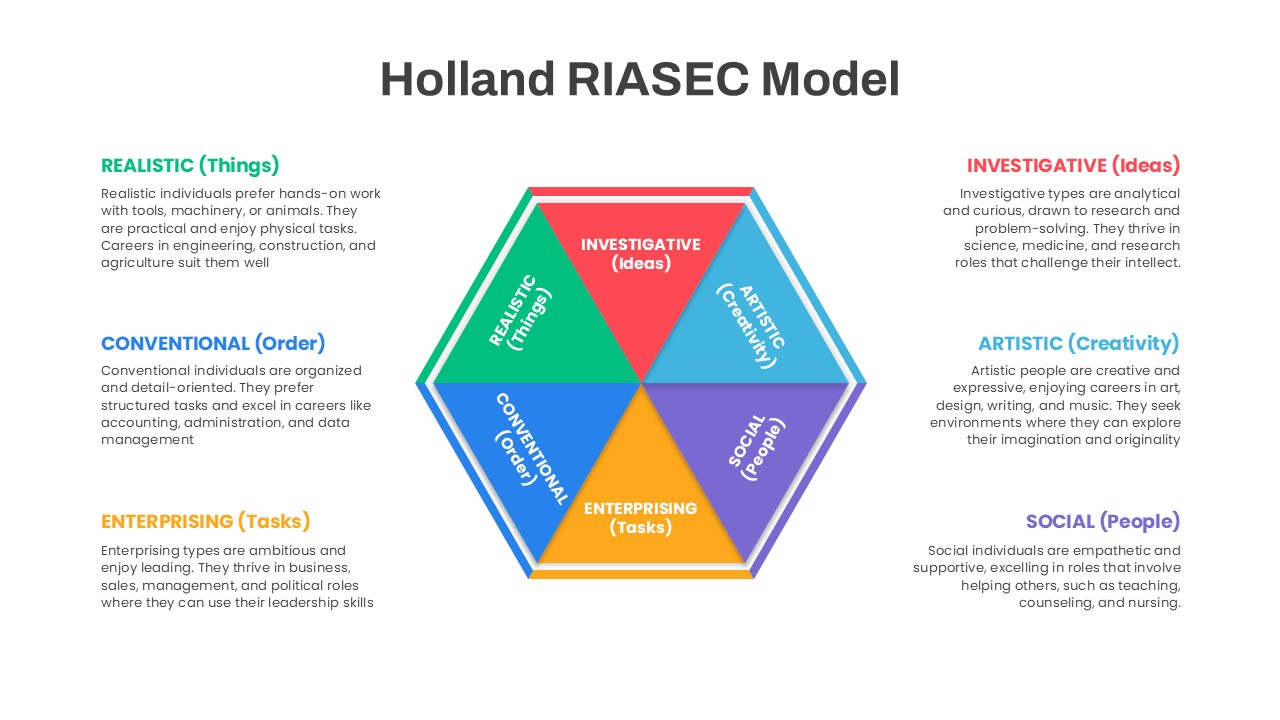
Holland RIASEC Hexagon Diagram Template for PowerPoint & Google Slides
Circular
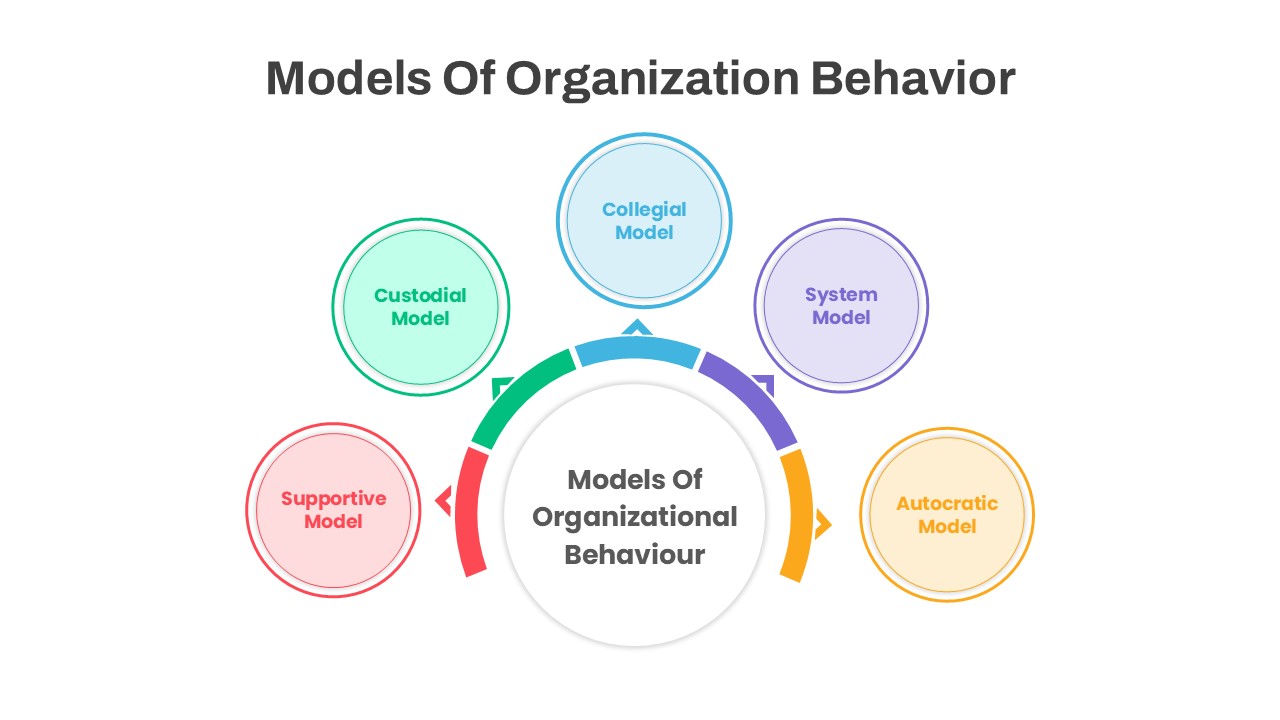
Organizational Behavior Hexagon Diagram Template for PowerPoint & Google Slides
Circular
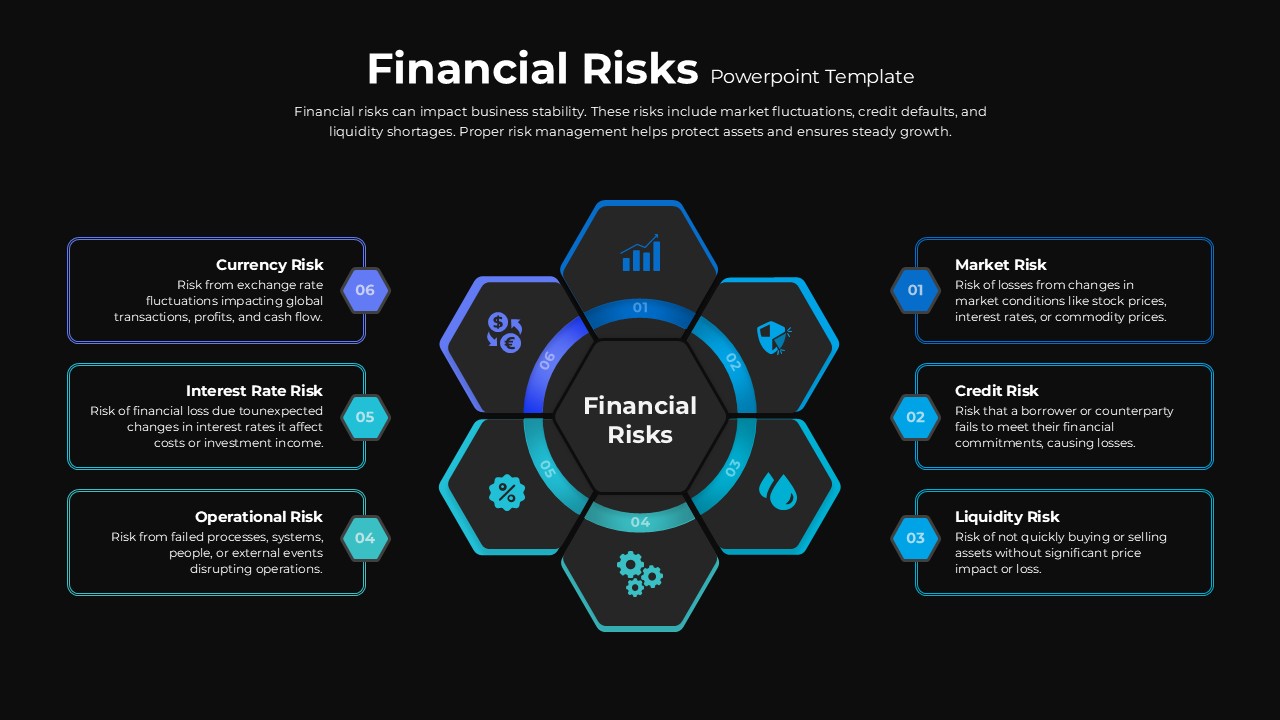
Financial Risks Hexagon Diagram Template for PowerPoint & Google Slides
Risk Management
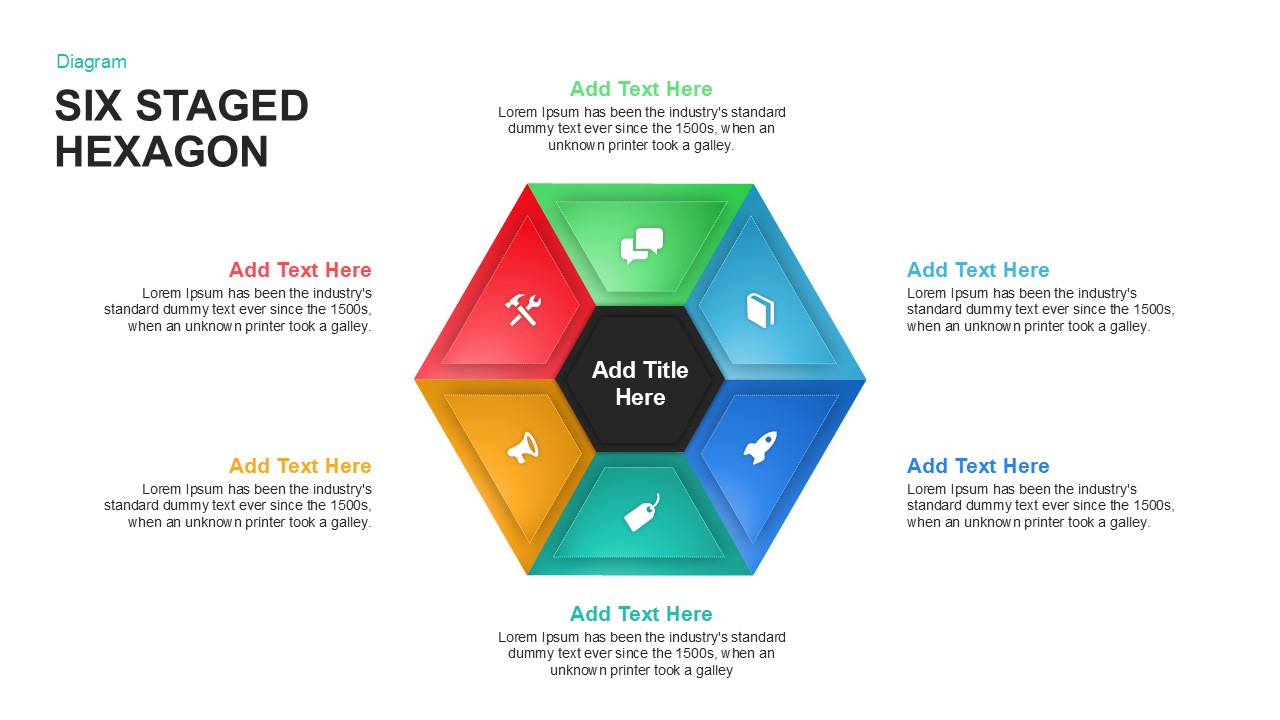
Six Staged Hexagon Diagram for PowerPoint & Google Slides
Process
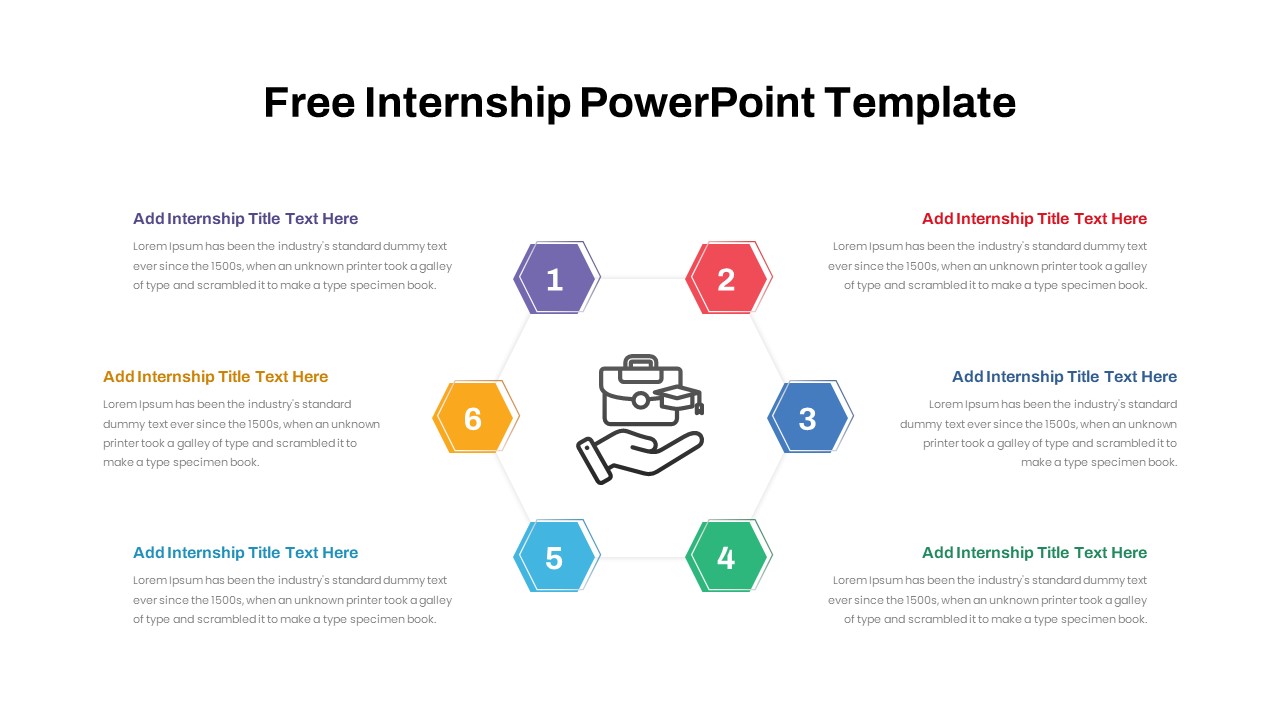
Free Internship Program Hexagon Layout for PowerPoint & Google Slides
Recruitment
Free
Quad Chart Infographic Pack of 8 Slides Template for PowerPoint & Google Slides
Comparison Chart
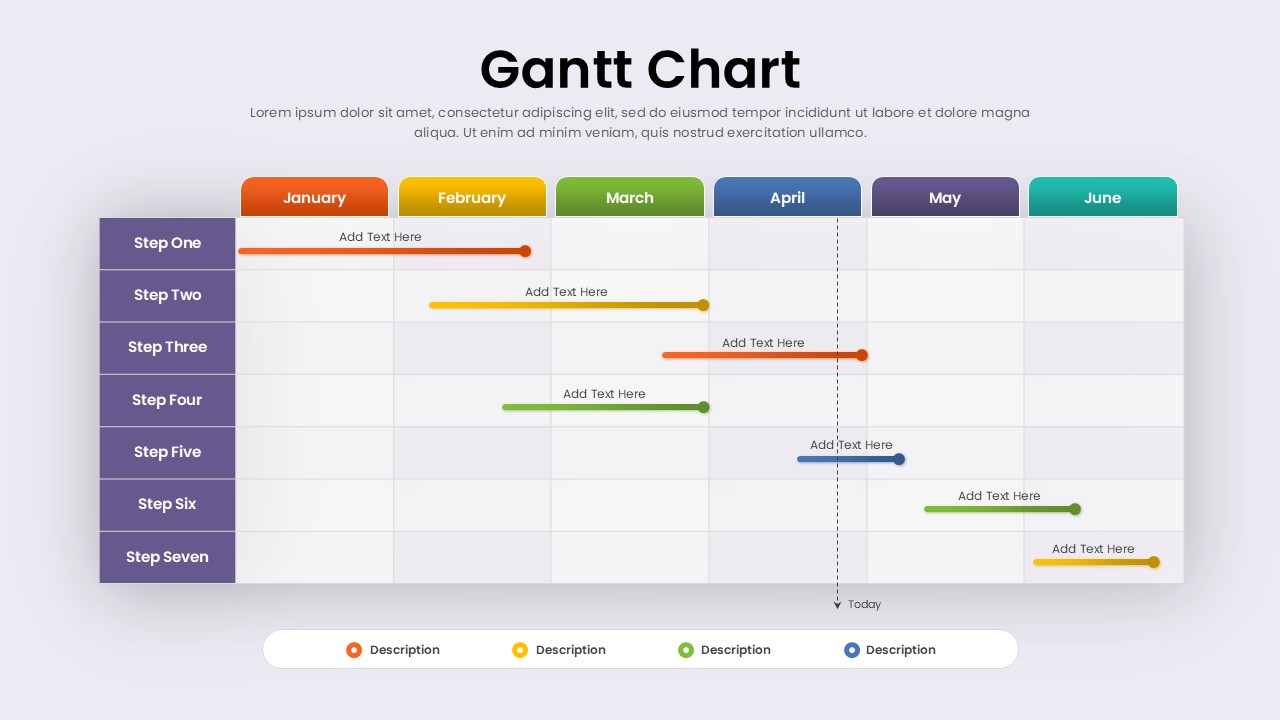
Free Professional Gantt Chart Pack – 4 Slides Template for PowerPoint & Google Slides
Gantt Chart
Free
Circle Strategy Creative Chart template for PowerPoint & Google Slides
Business Strategy
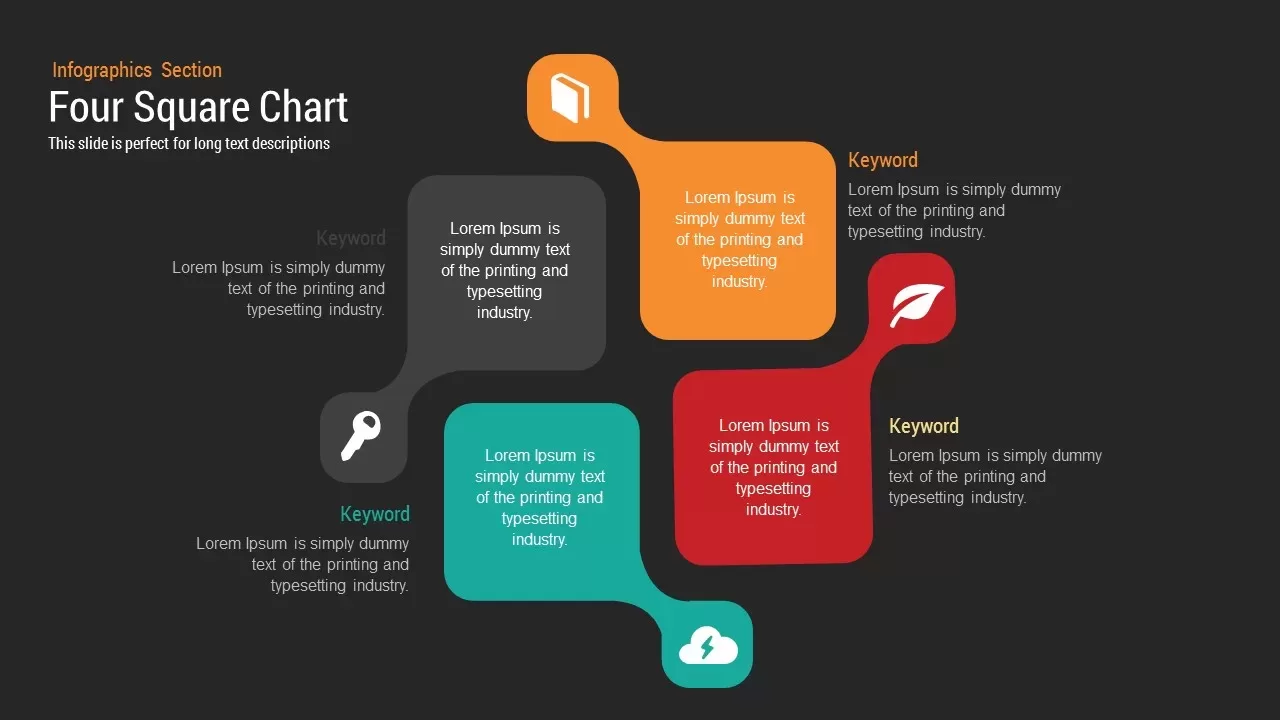
Four Square Chart template for PowerPoint & Google Slides
Charts
Creative SWOT Chart template for PowerPoint & Google Slides
SWOT
Donut Chart template for PowerPoint & Google Slides
Pie/Donut
Creative Dynamic Gantt Chart Timeline Template for PowerPoint & Google Slides
Timeline
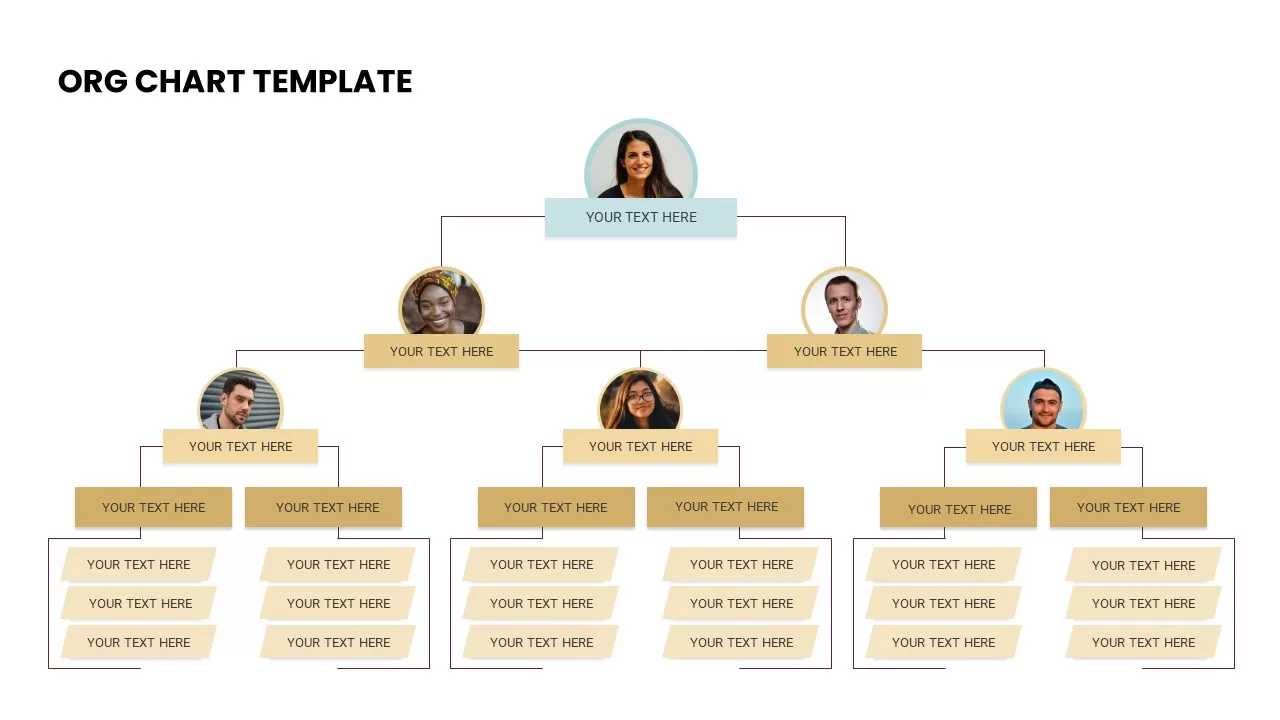
Corporate Org Chart template for PowerPoint & Google Slides
Org Chart

Fully Editable Gantt Chart Timeline template for PowerPoint & Google Slides
Gantt Chart
Interactive Product Comparison Bar Chart Template for PowerPoint & Google Slides
Bar/Column

Application Revenue Line Chart KPI Template for PowerPoint & Google Slides
Revenue
Modern Colorful Circular Org Chart Template for PowerPoint & Google Slides
Org Chart
Radar Chart Product Comparison Template for PowerPoint & Google Slides
Comparison Chart
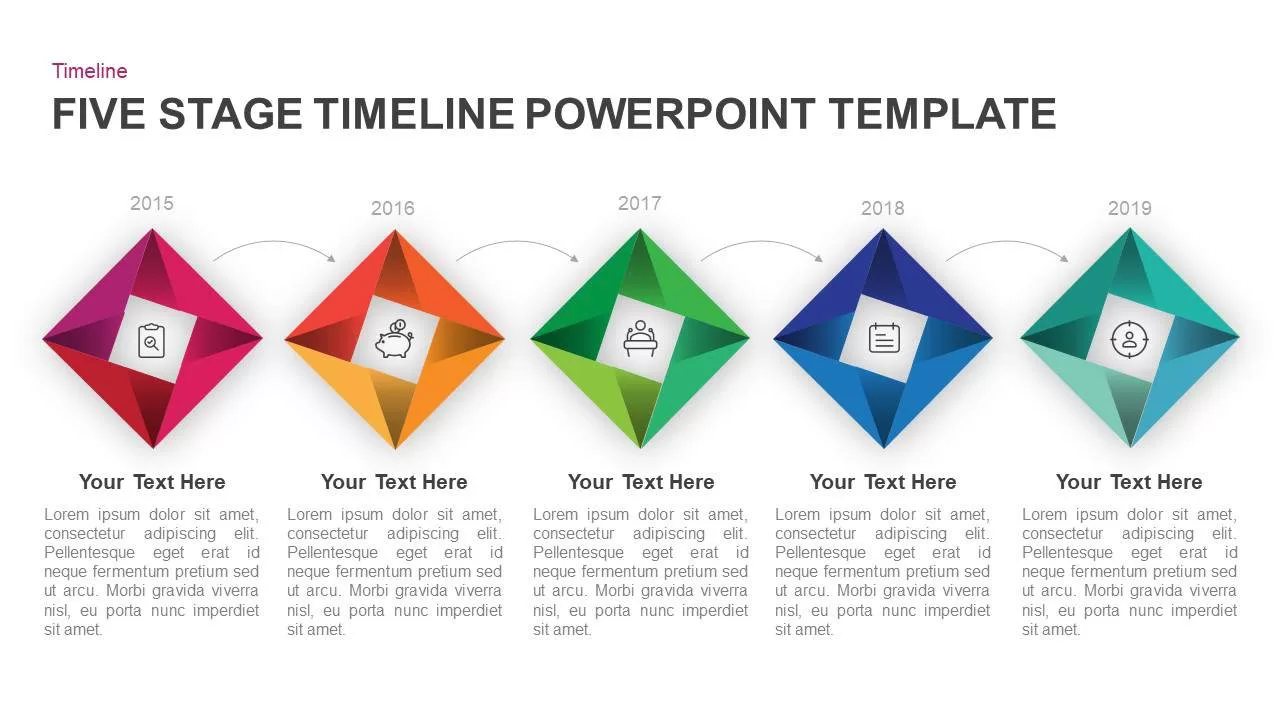
Five-Stage Diamond Timeline Chart Template for PowerPoint & Google Slides
Timeline
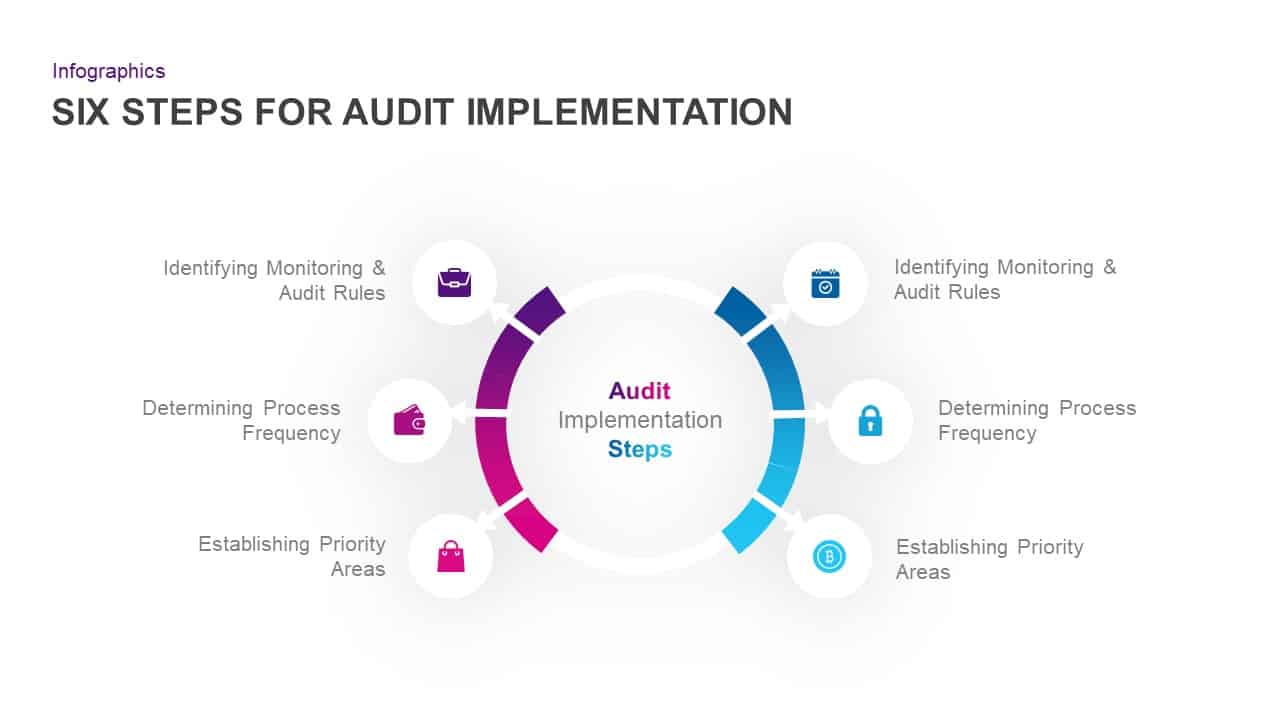
Six-Step Audit Implementation Chart Template for PowerPoint & Google Slides
Circular
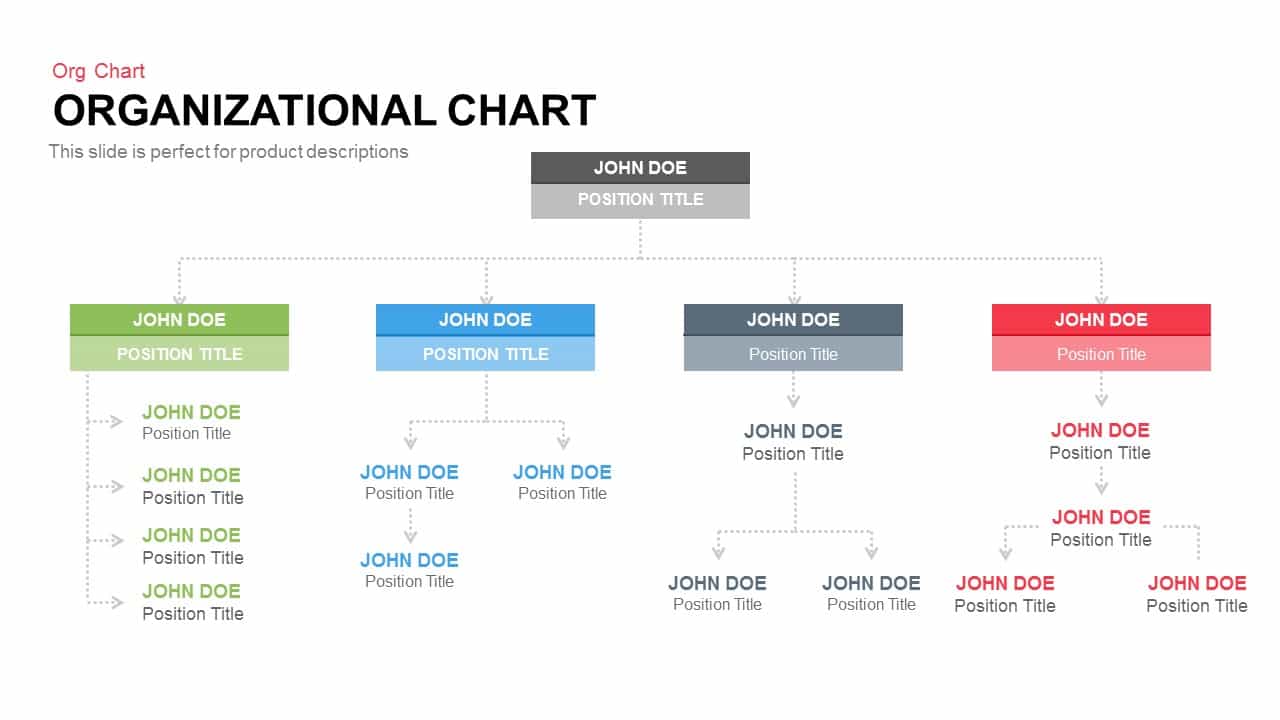
Modern Organizational Chart Hierarchy Template for PowerPoint & Google Slides
Org Chart
Org Chart Structure template for PowerPoint & Google Slides
Org Chart
Interactive Project Gantt Chart Timeline Template for PowerPoint & Google Slides
Gantt Chart
Dynamic Benchmarking Comparison Chart Template for PowerPoint & Google Slides
Comparison Chart
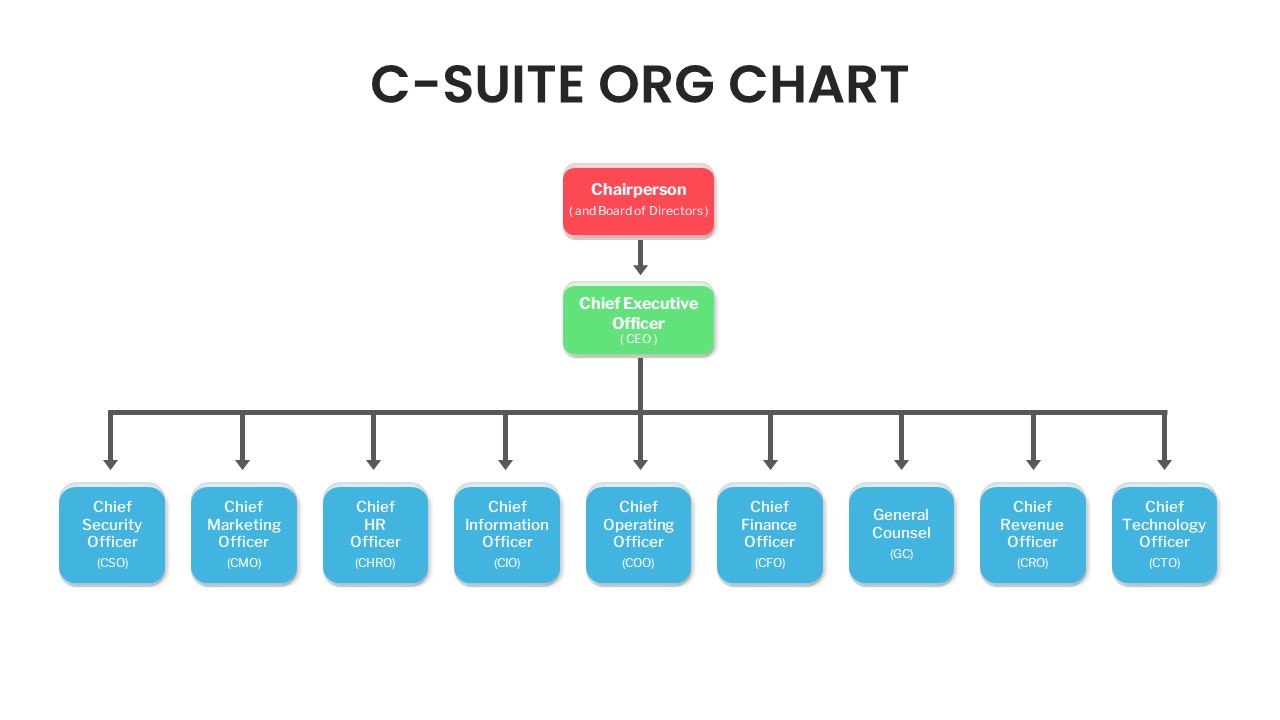
C-Suite Executive Org Chart Diagram Template for PowerPoint & Google Slides
Org Chart
Editable Multi-Series Peak Line Chart Template for PowerPoint & Google Slides
Comparison Chart
Business Timeline Comparison Bar Chart Template for PowerPoint & Google Slides
Comparison Chart
Grouped Column Chart Comparison Template for PowerPoint & Google Slides
Bar/Column
Multiple Line Chart Comparison Template for PowerPoint & Google Slides
Comparison Chart
Multi-Series Line Chart with Icons Template for PowerPoint & Google Slides
Comparison Chart
Wastewater Treatment Process Flow Chart Template for PowerPoint & Google Slides
Flow Charts
Free Versatile Product Comparison Chart Template for PowerPoint & Google Slides
Charts
Free
Annual Growth Trend Analysis Chart template for PowerPoint & Google Slides
Business Report
Competitor Comparison Chart Design Template for PowerPoint & Google Slides
Comparison
Event Planning Gantt Chart template for PowerPoint & Google Slides
Business
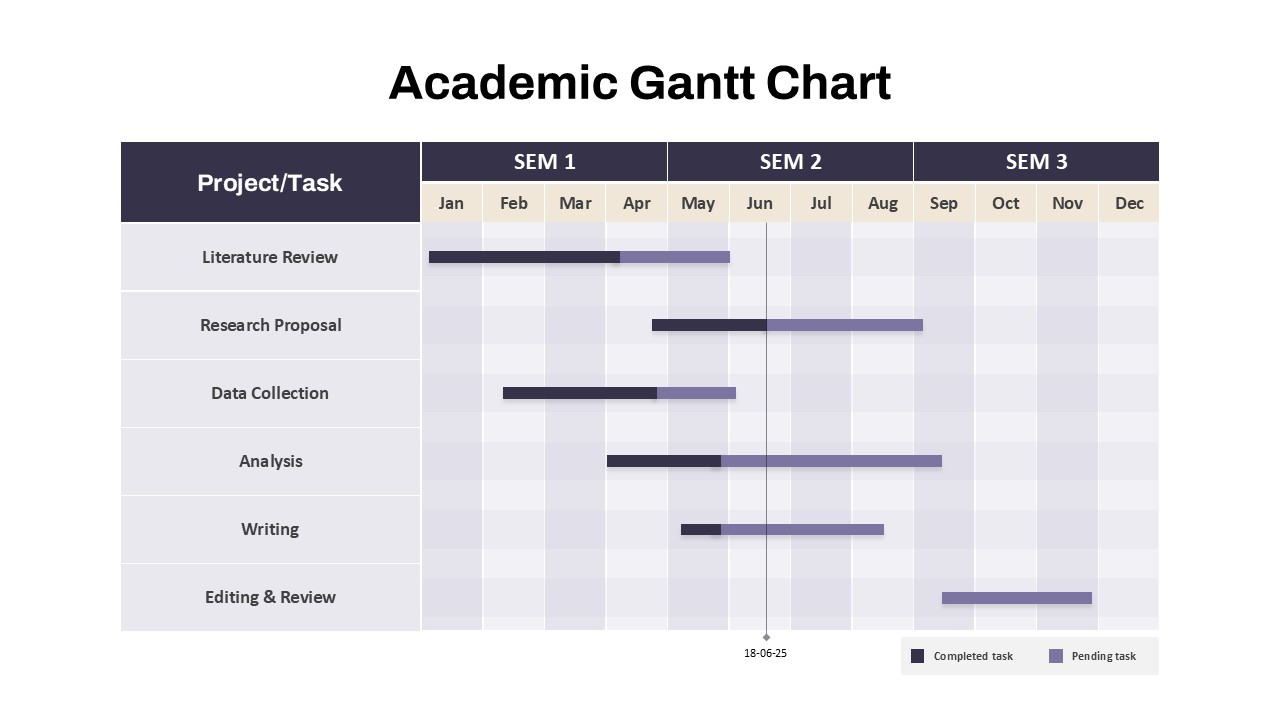
Academic Gantt Chart template for PowerPoint & Google Slides
Business
7 Step 6 Month Gantt Chart Timeline Template for PowerPoint & Google Slides
Gantt Chart