Demographic Transition Model Template for PowerPoint & Google Slides


Description
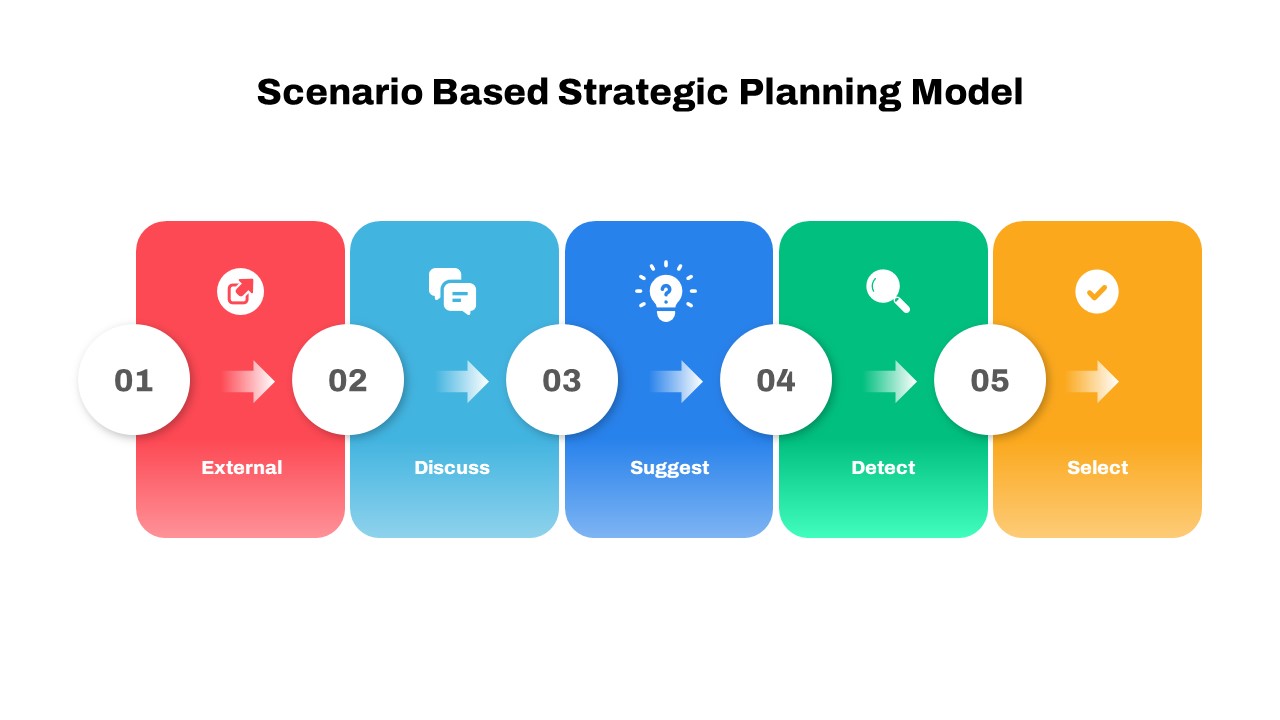
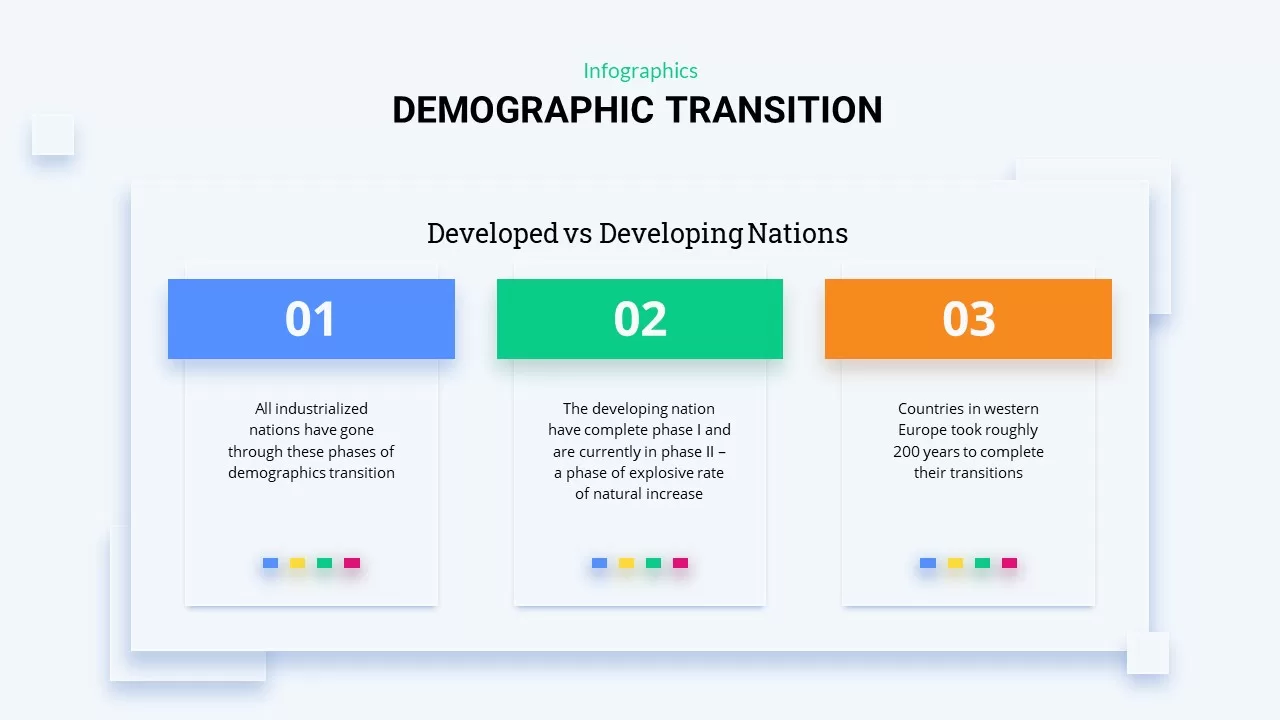
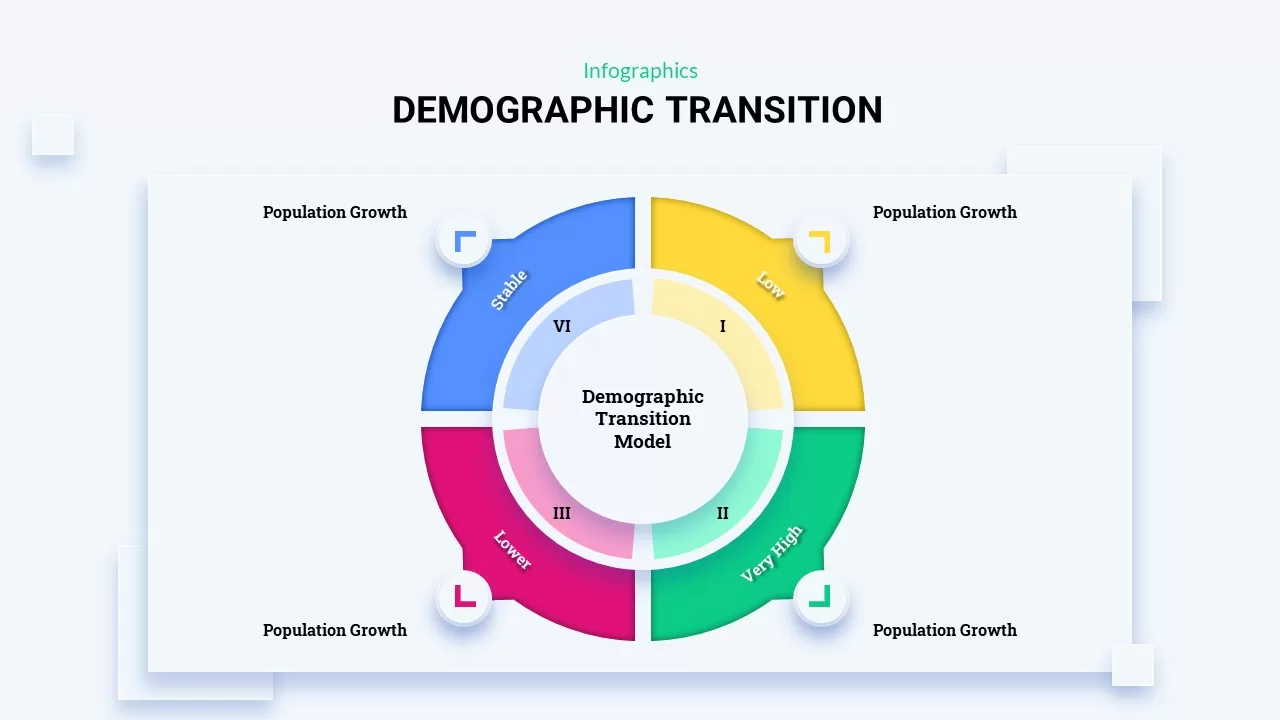
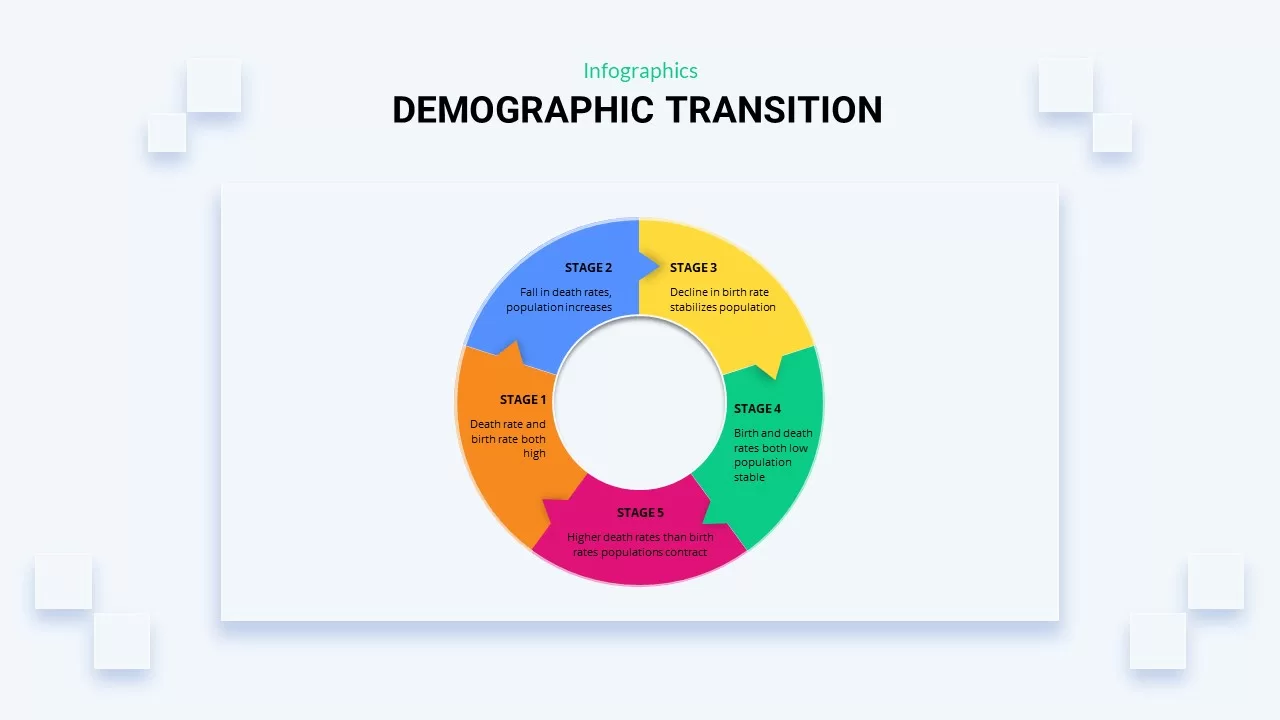
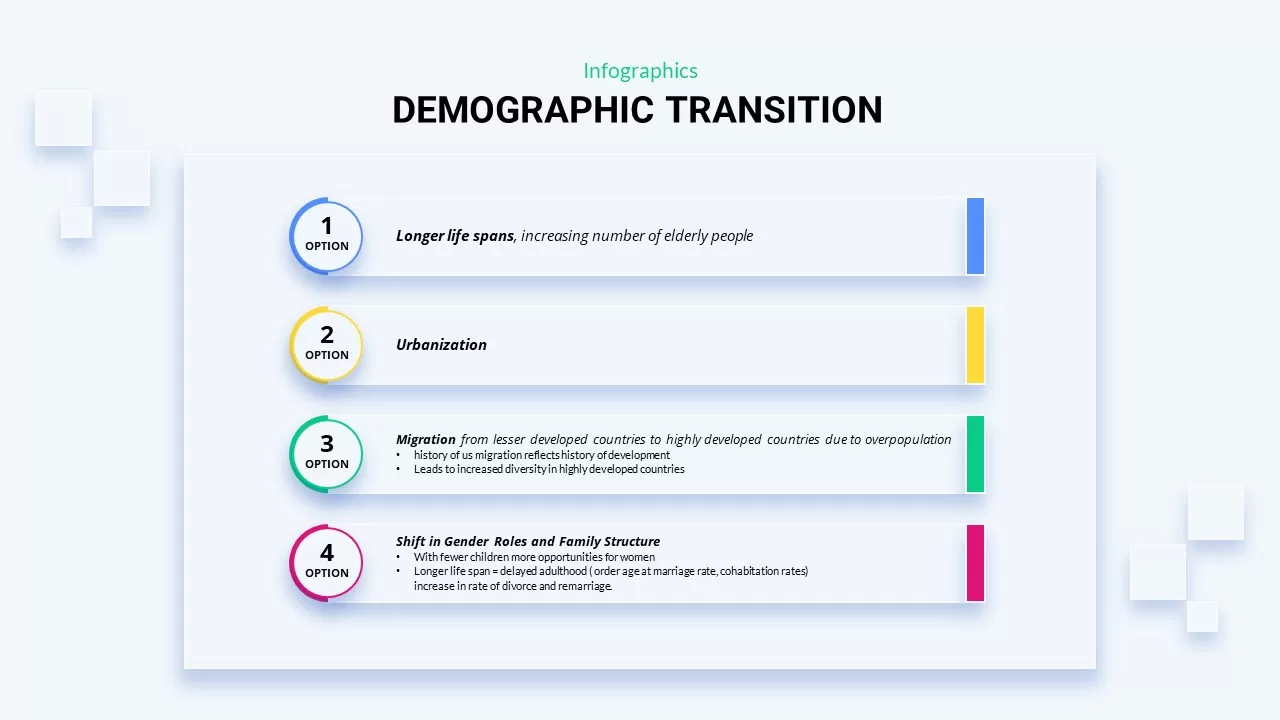
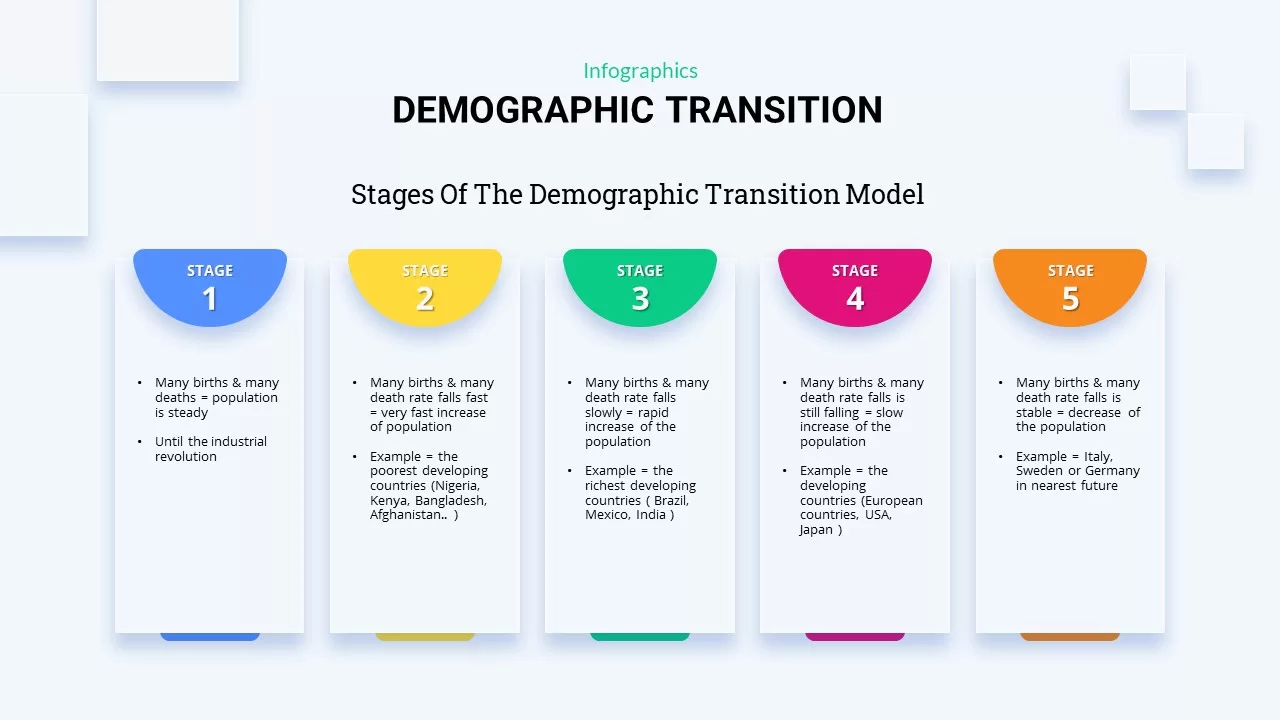
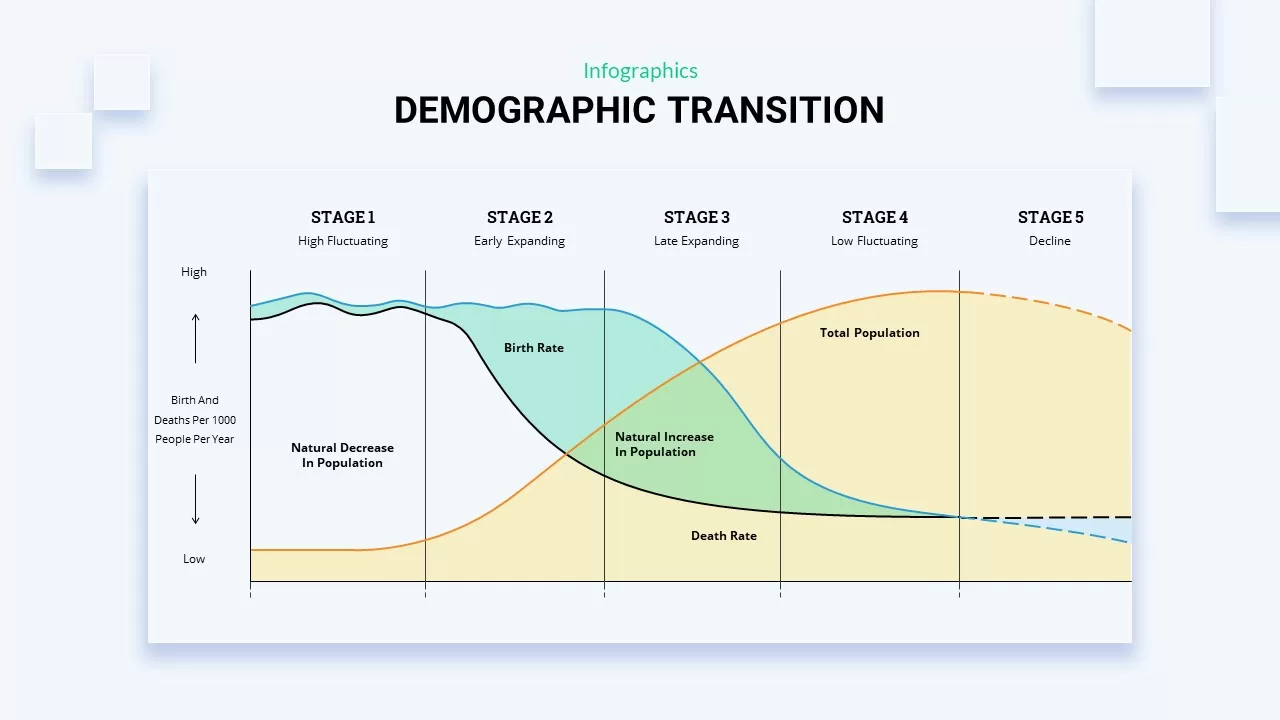
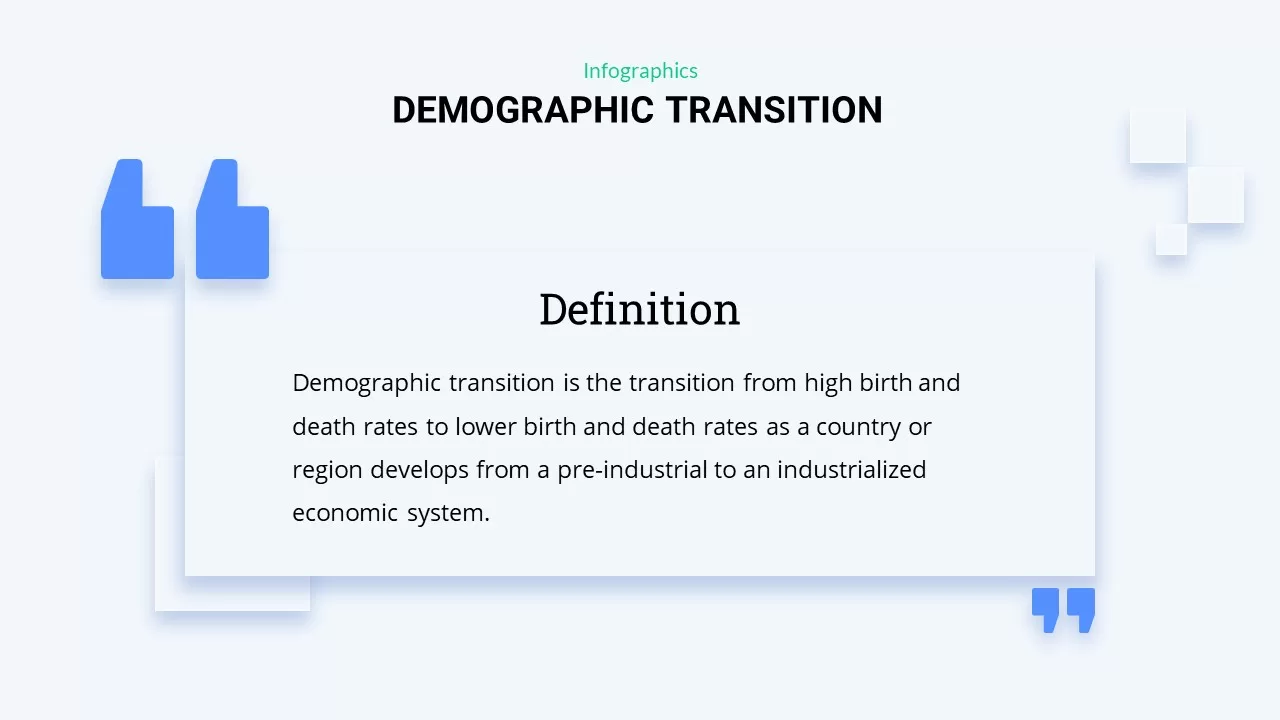
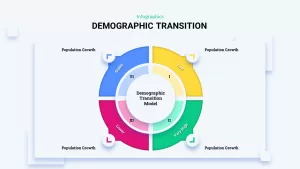
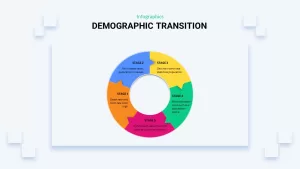
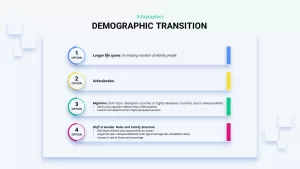
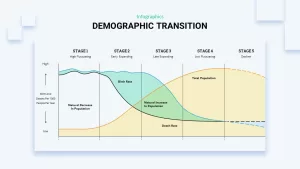
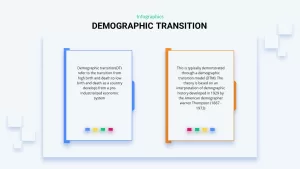
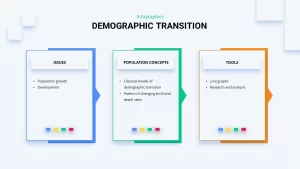
Use this vivid demographic transition infographic to visualize population evolution across five sequential stages, from pre-industrial high birth and death rates to modern low birth and death rates. Each stage is represented by a distinct, semi-circular card—blue for Stage 1, yellow for Stage 2, green for Stage 3, magenta for Stage 4, and orange for Stage 5—arranged horizontally against a clean, minimalist background. Customizable placeholders for stage labels and bullet-style text blocks enable you to clearly convey key metrics and historical examples, while subtle drop shadows and consistent typography maintain a polished, professional look that aligns with corporate branding guidelines.
Built on master slides and fully editable in both PowerPoint and Google Slides, this template simplifies slide creation by providing pre-configured layouts, vector shapes, and icon placeholders. Adjust colors, modify text fields, or duplicate cards in seconds without disrupting the overall design integrity. Whether you need to compare demographic trends, demonstrate population policy impacts, or support academic research, this slide accelerates your workflow and ensures visual consistency across presentations.
Each card includes a title header and bullet points by default, but can be transformed into graph sections, data-driven visuals, or narrative callouts. Use the stage-by-stage layout to guide audiences through demographic histories, regional comparisons, or policy scenario analyses. The clean white canvas and grouped elements reduce editing friction, while built-in guides ensure precise alignment for on-brand slide decks. Compatible with theme color palettes and accessible typography standards, this infographic is ideal for both academic lectures and executive board presentations. Leverage built-in master layouts to maintain consistency across multiple slides and easily update regional case studies without manual repositioning.
Who is it for
Demographers, population scientists, sociologists, economic analysts, policy advisors, business strategists, academic researchers, and presentation designers.
Other Uses
Repurpose to illustrate product life cycles, map market expansion phases, structure project maturity roadmaps, compare regional trends, or visualize resource allocation timelines.
Login to download this file

Item ID
SB02121
Related Templates

People Demographic Comparison Chart Template for PowerPoint & Google Slides
Comparison
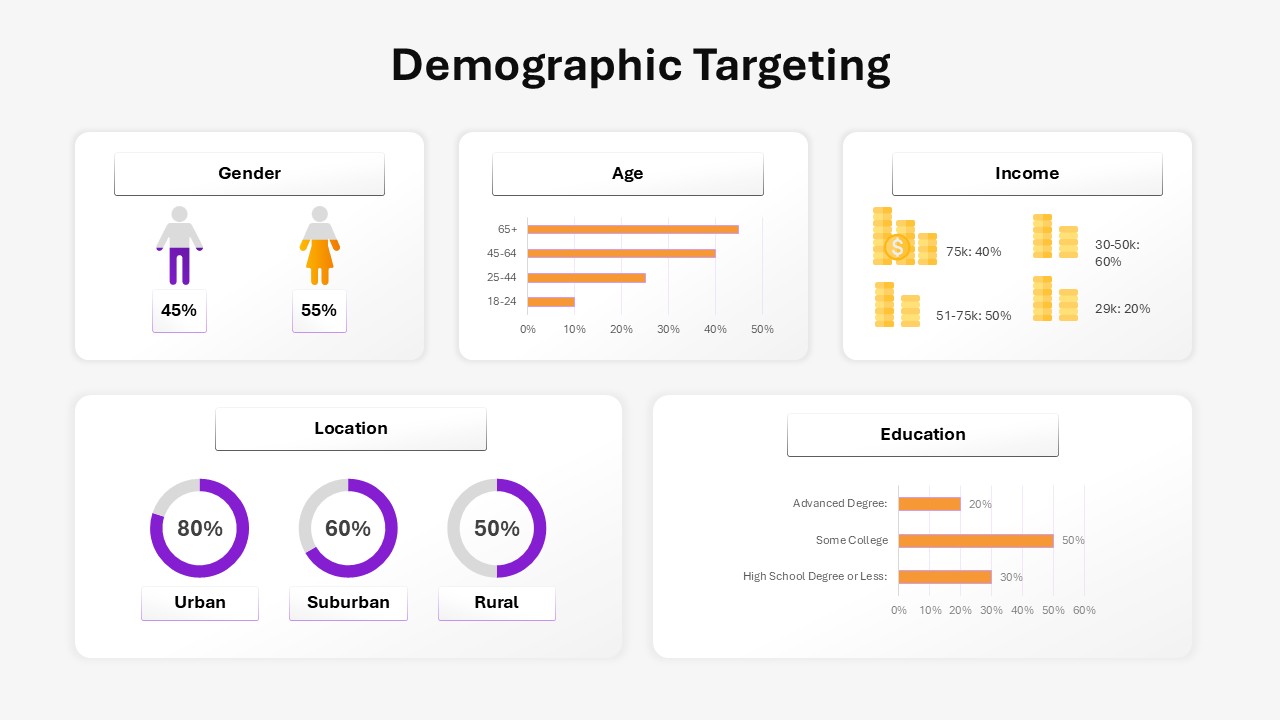
Demographic Targeting Template for PowerPoint & Google Slides
Infographics
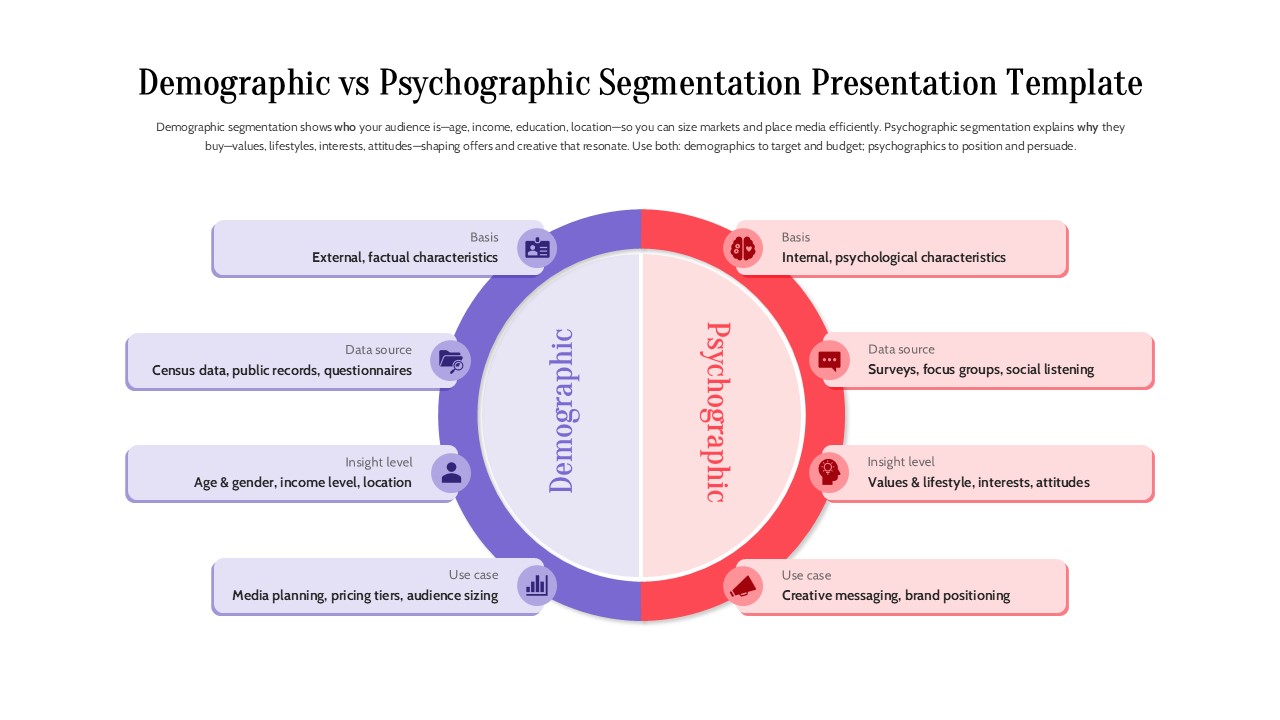
Demographic vs Psychographic Segmentation Template for PowerPoint & Google Slides
Comparison
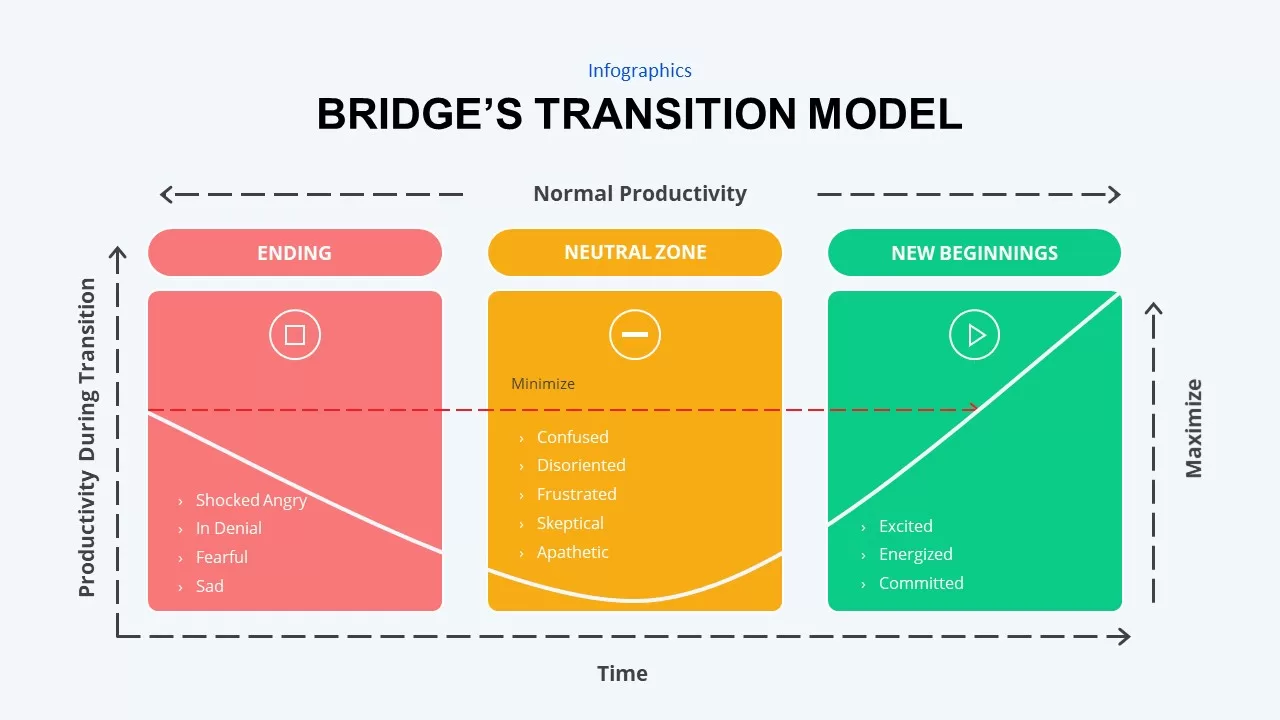
Bridge’s Transition Model Infographic Template for PowerPoint & Google Slides
HR
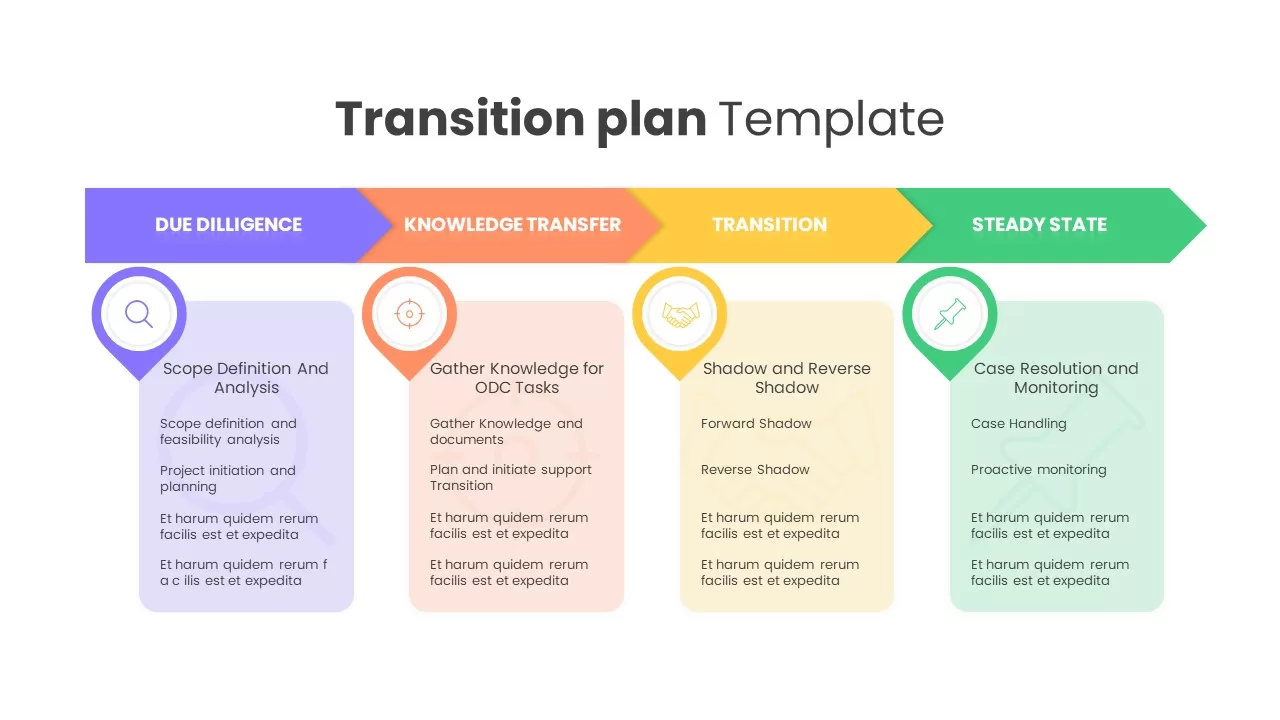
Transition Plan template for PowerPoint & Google Slides
Infographics
Open Door Transition Slide Design Template for PowerPoint & Google Slides
Opportunities Challenges
Interactive Slide Zoom & Transition Template for PowerPoint & Google Slides
Decks

Free Morph Transition Bundle Template for PowerPoint & Google Slides
Graphics
Free
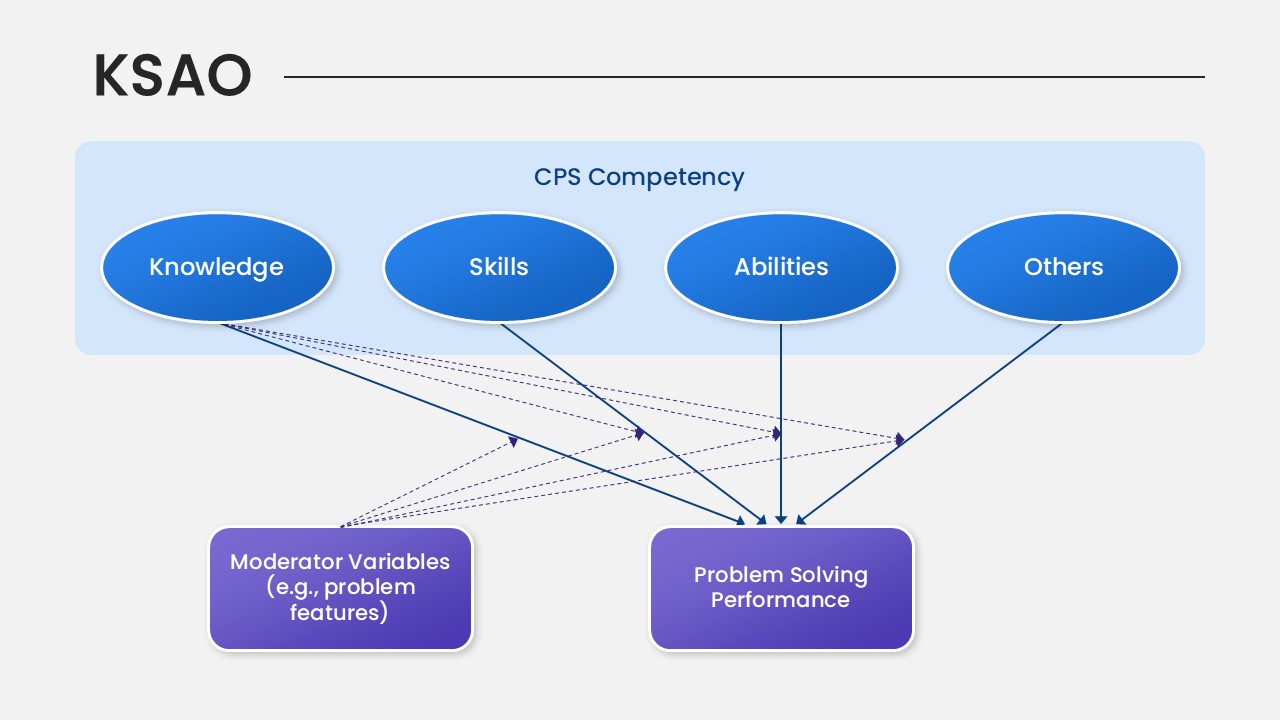
KSAO Model PowerPoint Template for PowerPoint & Google Slides
Business Strategy
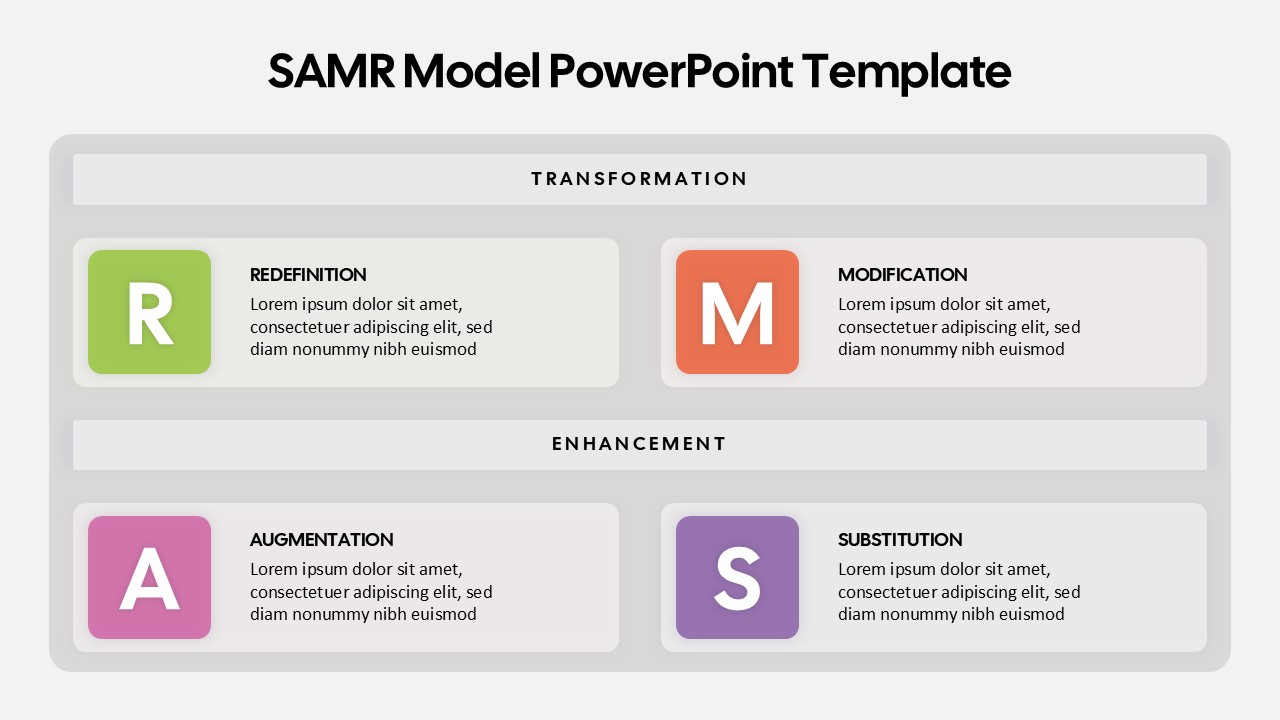
SAMR Model PowerPoint Template for PowerPoint & Google Slides
Business

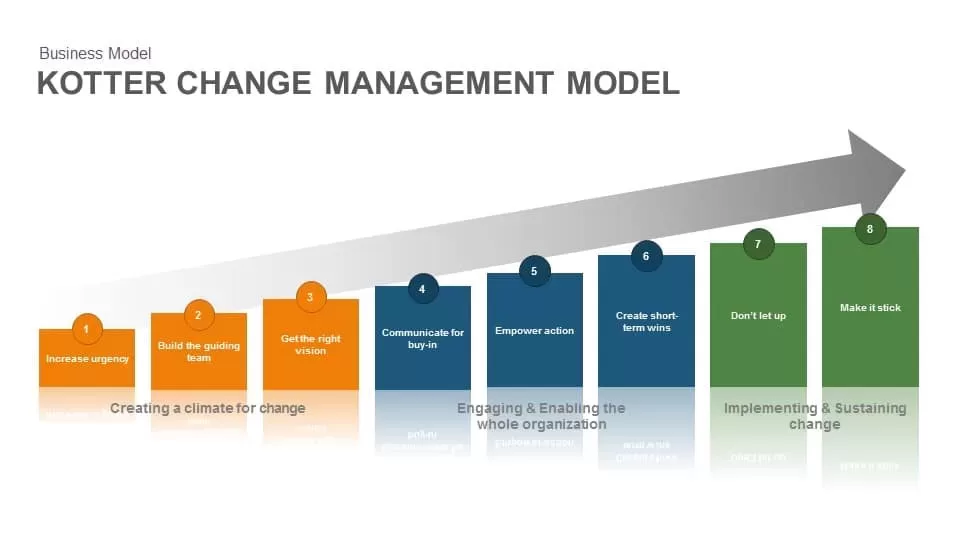
Kotter Change Management Model template for PowerPoint & Google Slides
Business Strategy
Ansoff Matrix Growth Strategy Model Template for PowerPoint & Google Slides
BCG
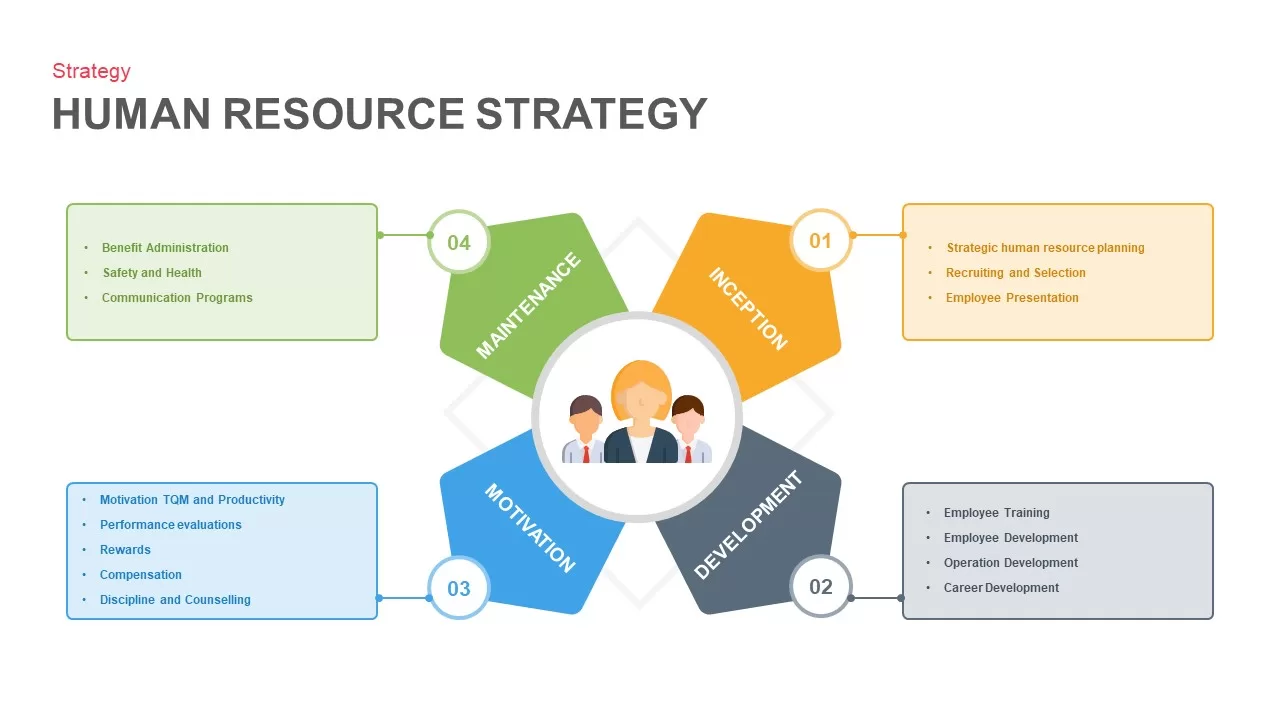
Human Resource Strategy Model Pack Template for PowerPoint & Google Slides
HR

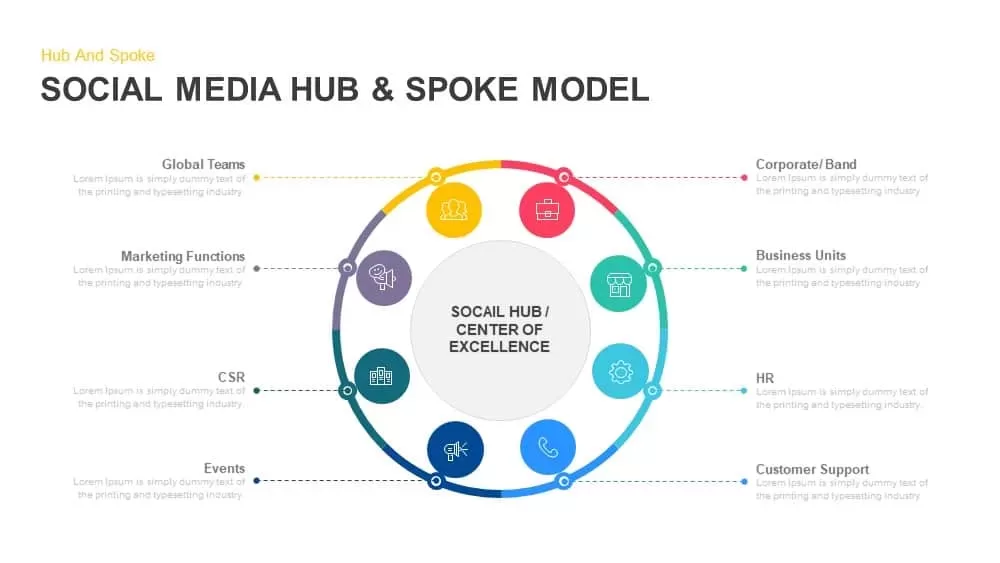
Social Media Hub & Spoke Model Template for PowerPoint & Google Slides
Process

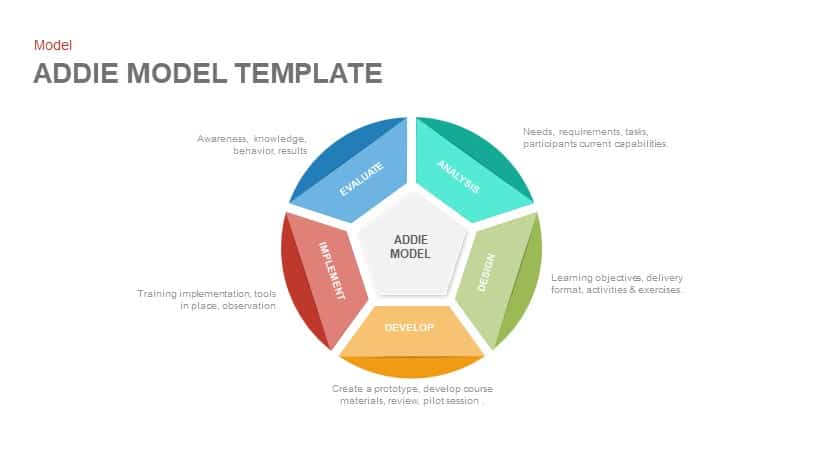
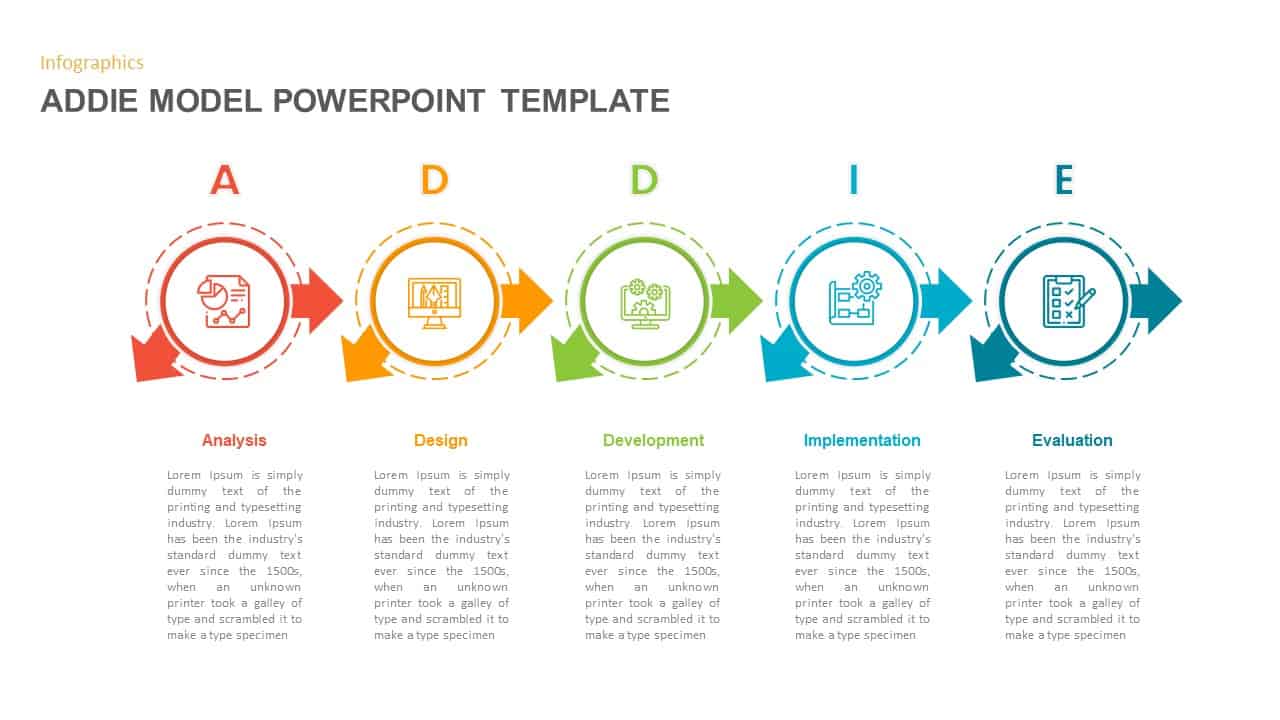
ADDIE Model Instructional Design Template for PowerPoint & Google Slides
Circular
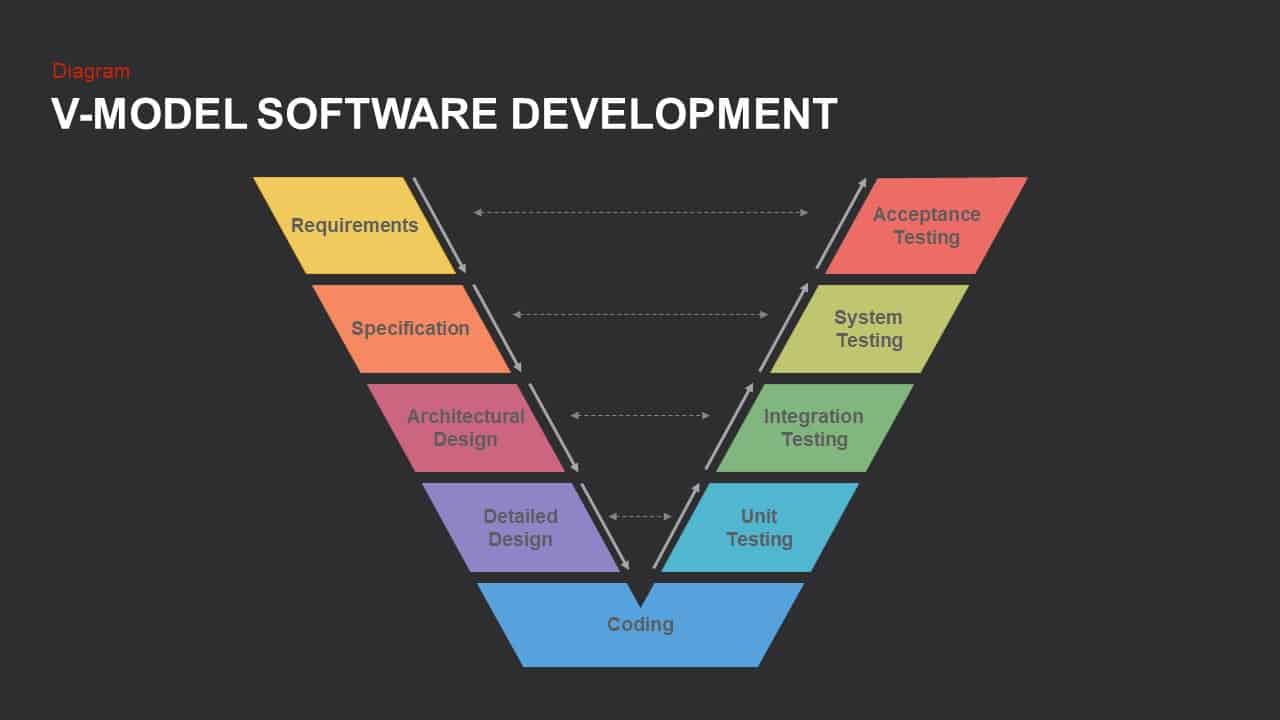
V-Model Software Development Diagram Template for PowerPoint & Google Slides
Software Development
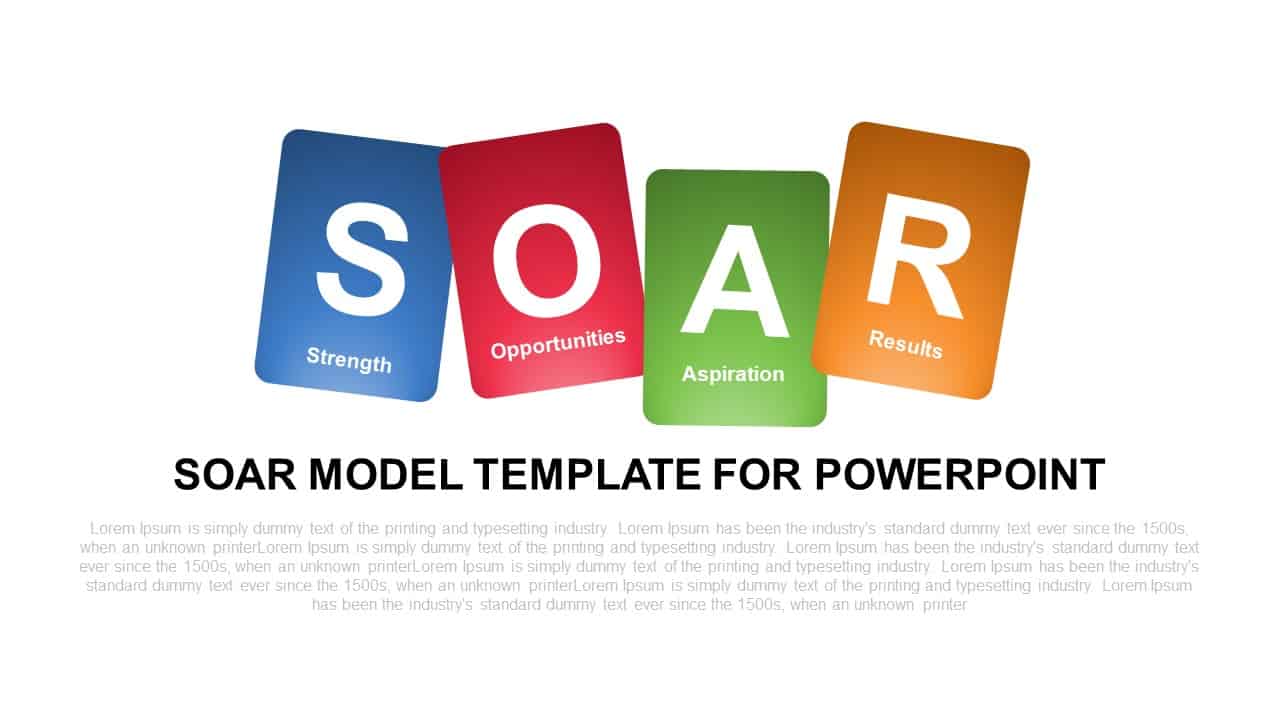
SOAR Strategic Model Card Diagram Template for PowerPoint & Google Slides
Process
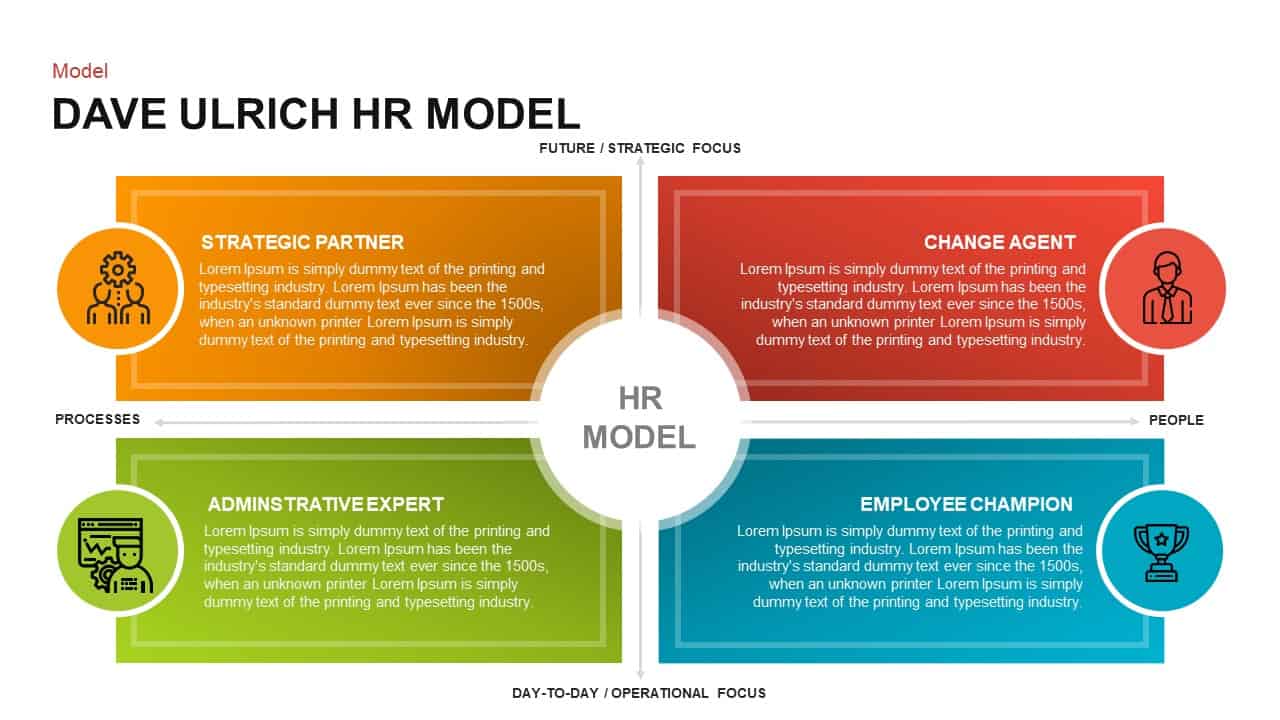
Dave Ulrich Strategic HR Model Quadrant Template for PowerPoint & Google Slides
Employee Performance
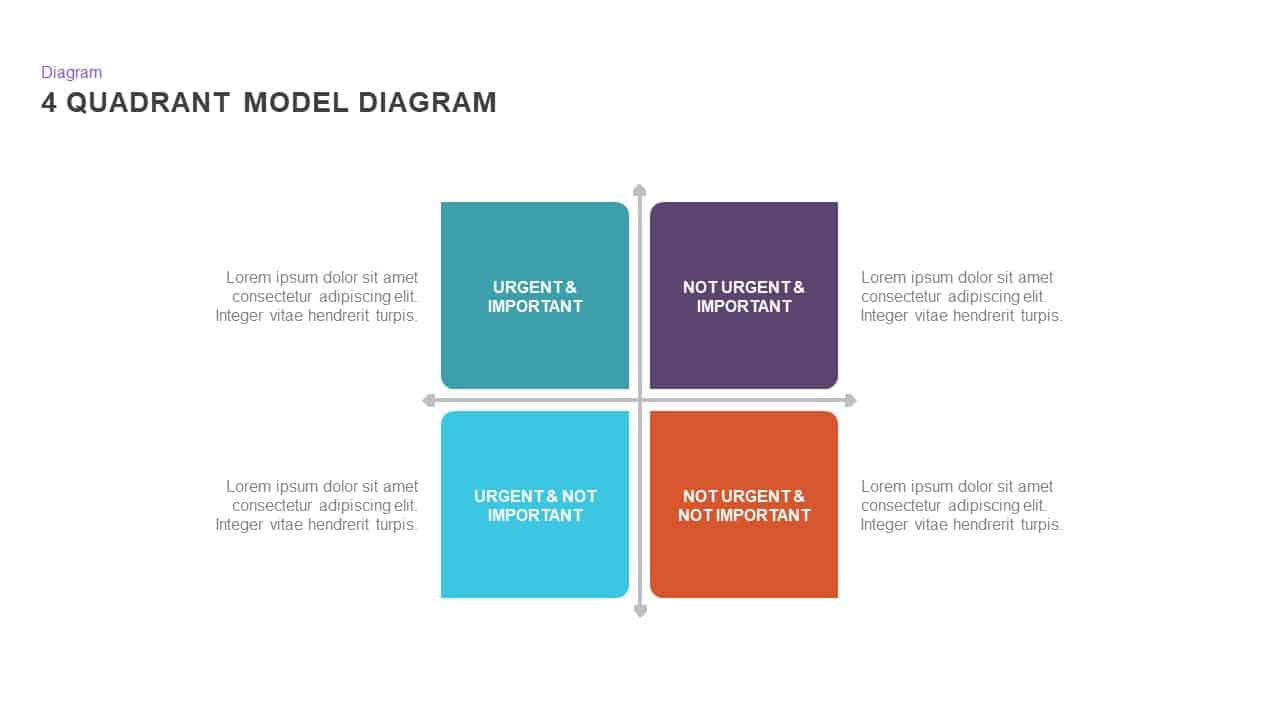
4 Quadrant Model Diagram template for PowerPoint & Google Slides
Process
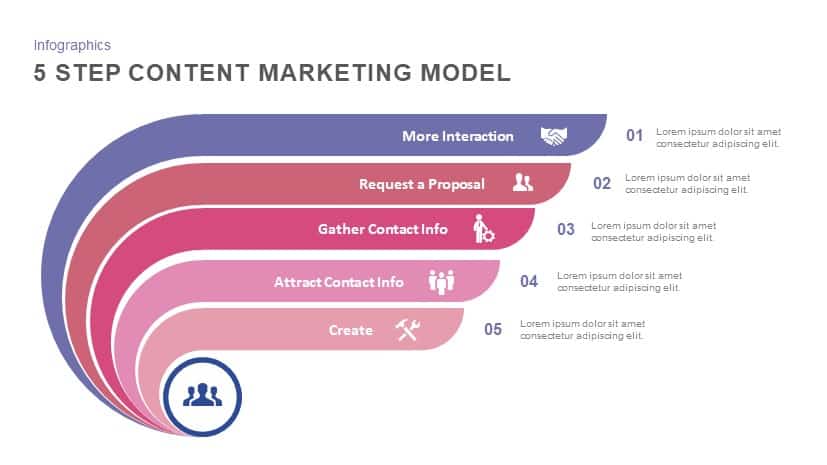
5 Step Content Marketing Model template for PowerPoint & Google Slides
Marketing
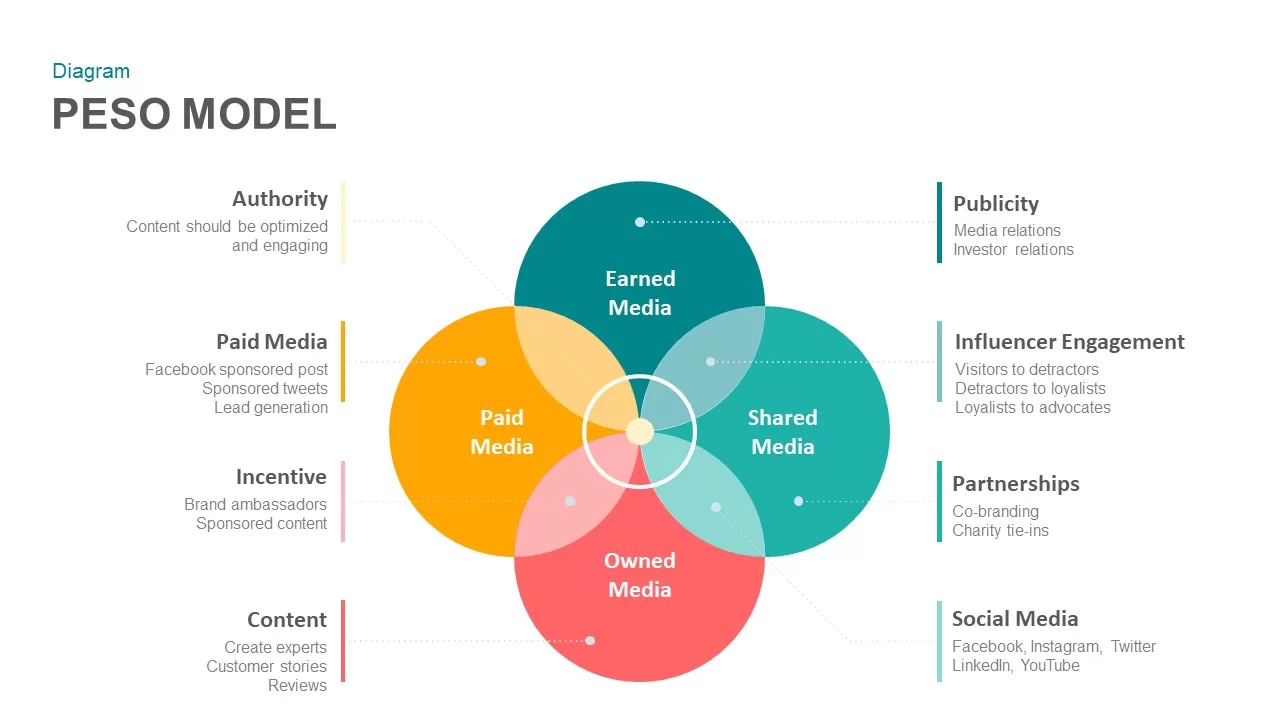
PESO Model Marketing Diagram Template for PowerPoint & Google Slides
Digital Marketing

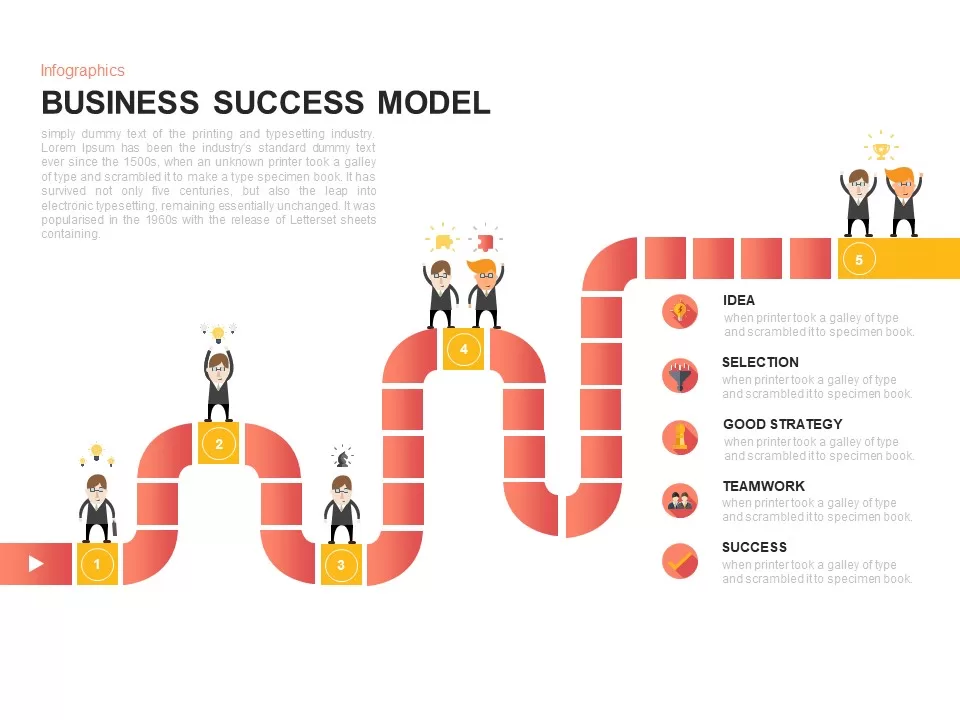
Business Success Model Infographic Template for PowerPoint & Google Slides
Roadmap
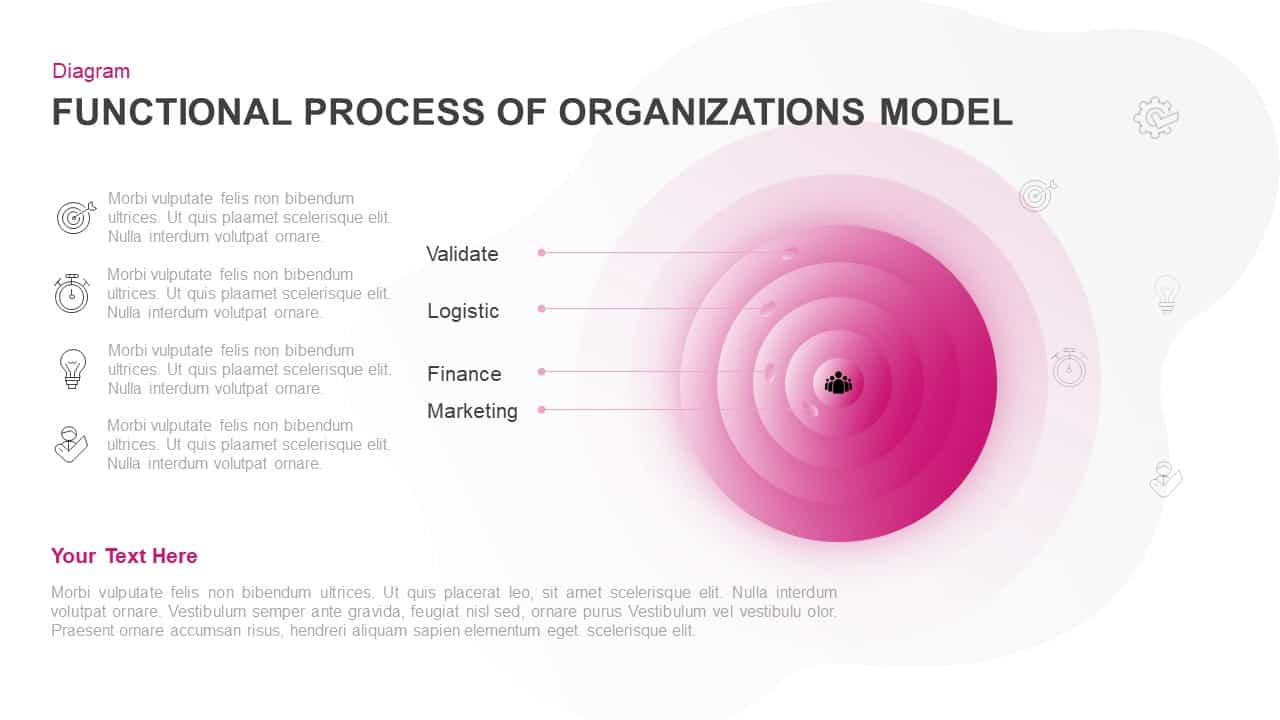
Concentric Functional Process Model Template for PowerPoint & Google Slides
Circular
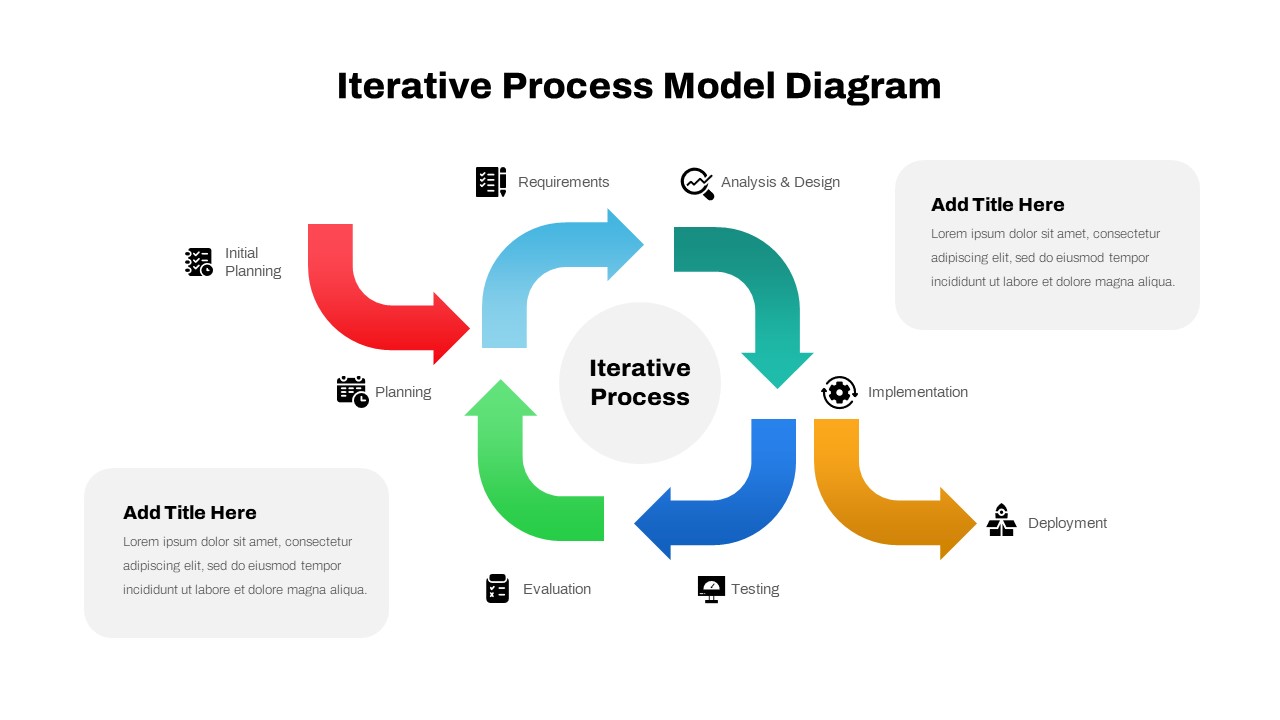
Iterative Process Model Diagram Template for PowerPoint & Google Slides
Process
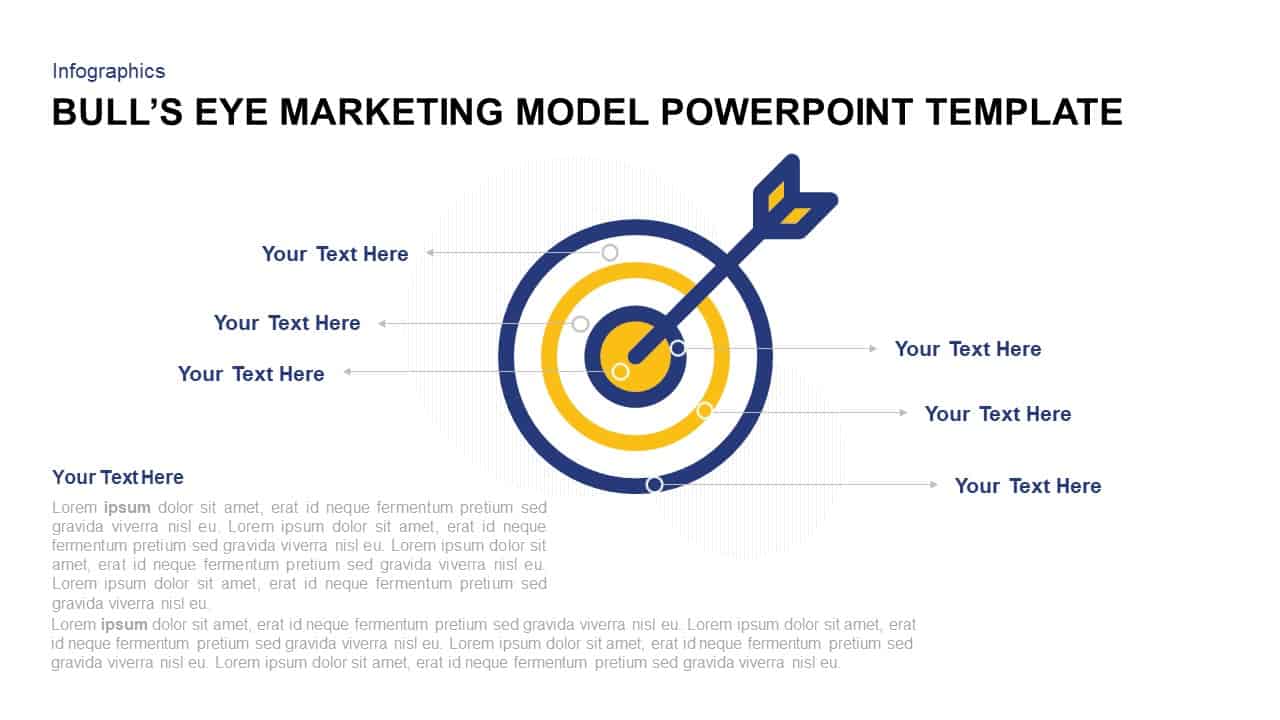
Bull’s Eye Marketing Model Infographic Template for PowerPoint & Google Slides
Circular
ADDIE Instructional Design Model Template for PowerPoint & Google Slides
Process
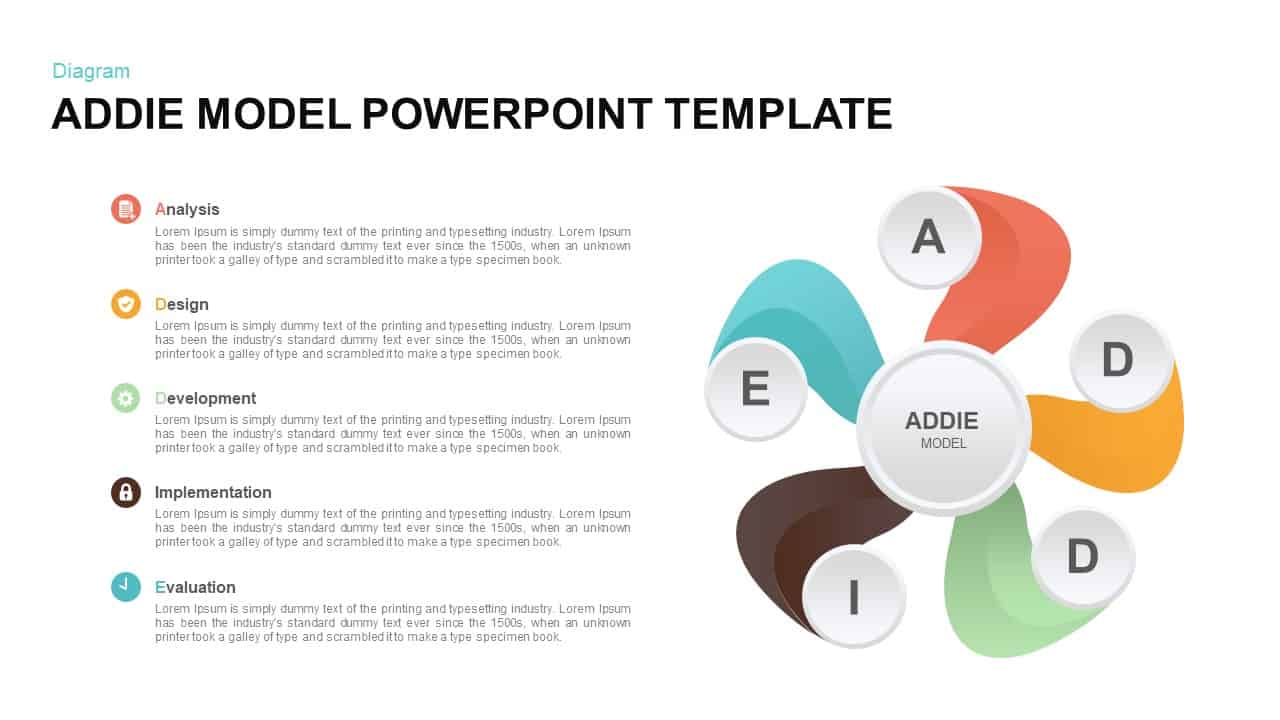
ADDIE Model Hub and Spoke Diagram Template for PowerPoint & Google Slides
Process
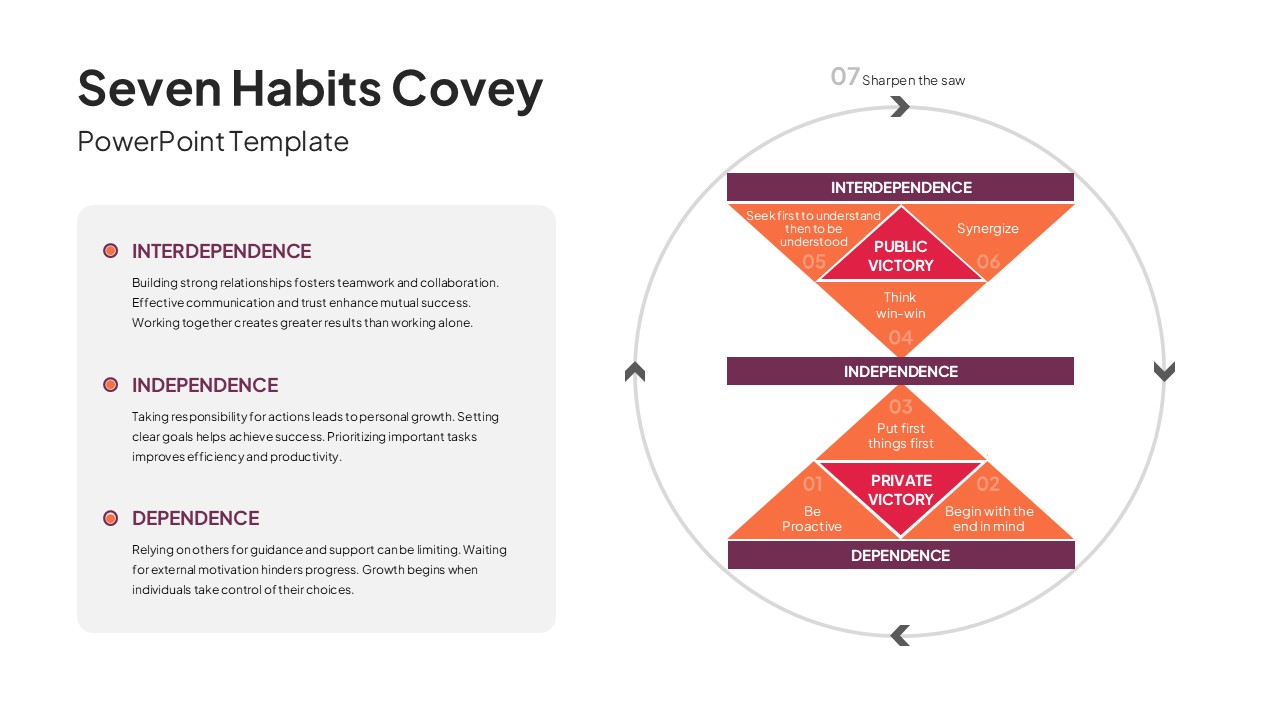
7 Habits of Highly Effective People Covey Model Template for PowerPoint & Google Slides
Leadership

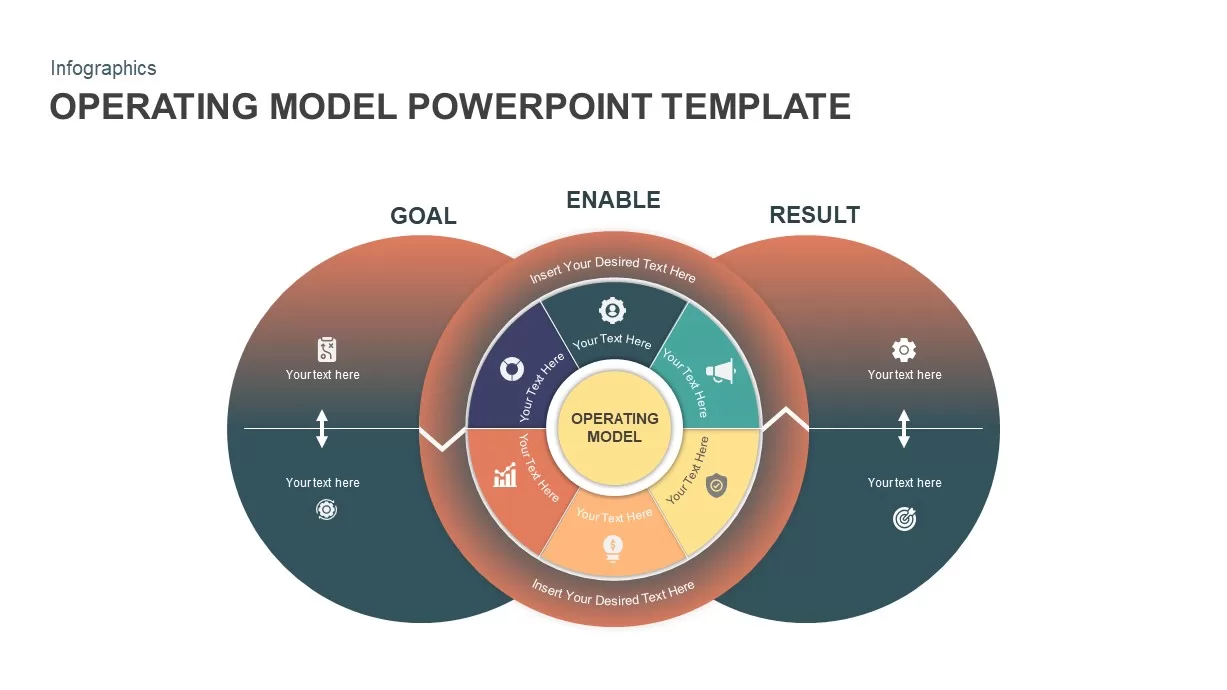
Operating Model Hub-and-Spoke Diagram Template for PowerPoint & Google Slides
Business Models
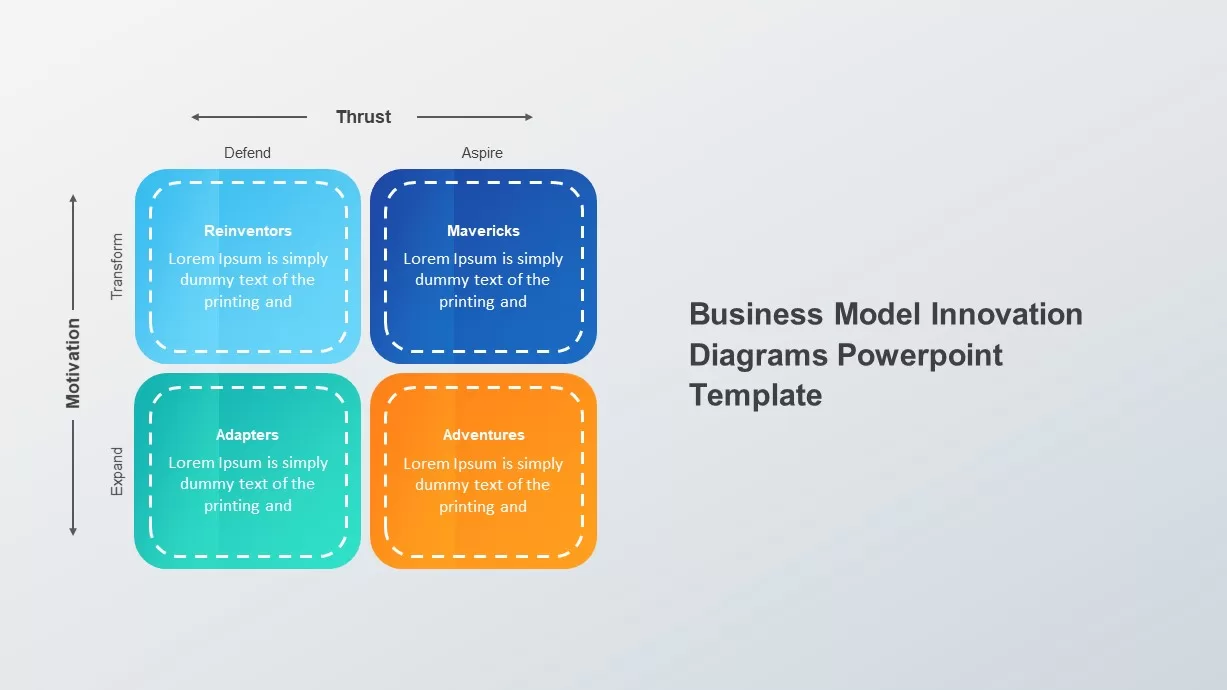
Business Model Innovation Diagrams template for PowerPoint & Google Slides
Process
Four-Phase Maturity Model Diagram Template for PowerPoint & Google Slides
Process
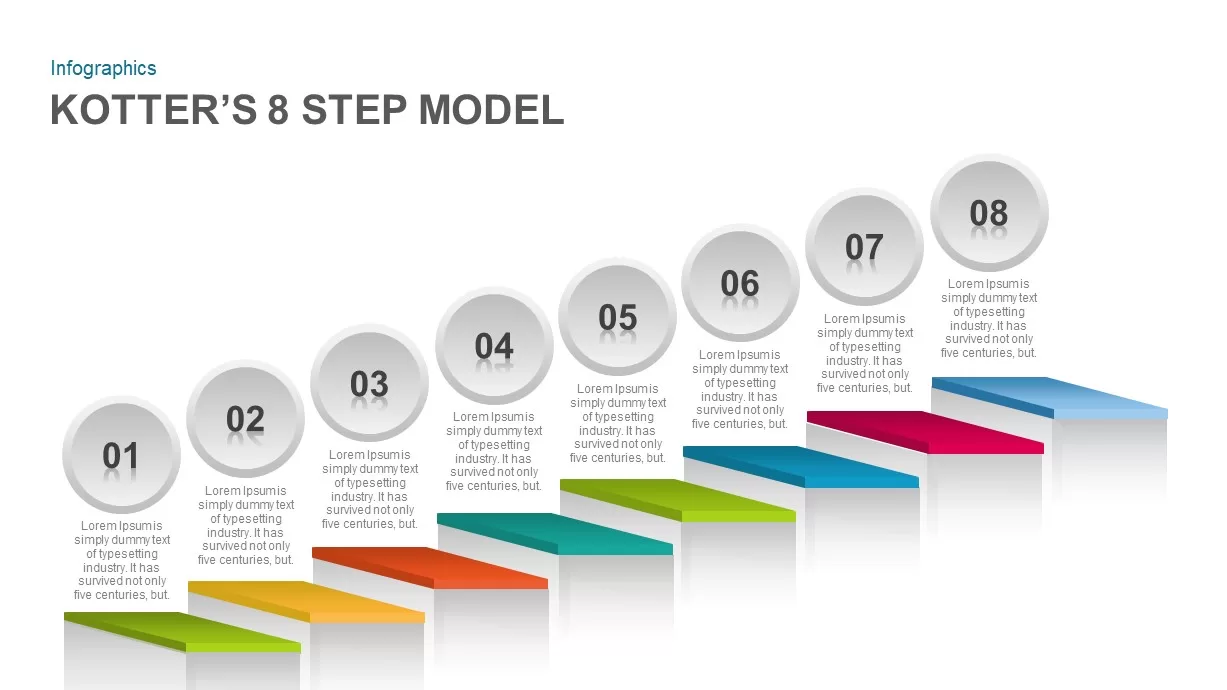
Kotter’s 8-Step Model Infographic Template for PowerPoint & Google Slides
Process
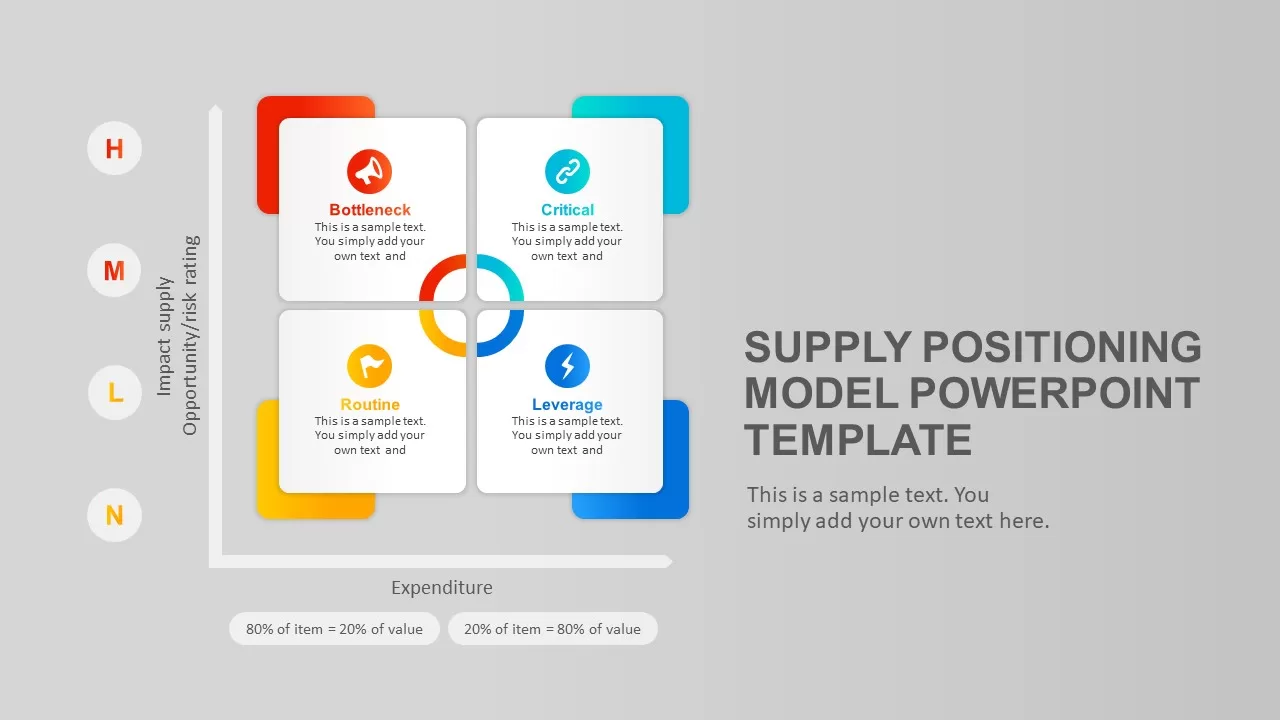
Supply Positioning Model Template for PowerPoint & Google Slides
Business Models
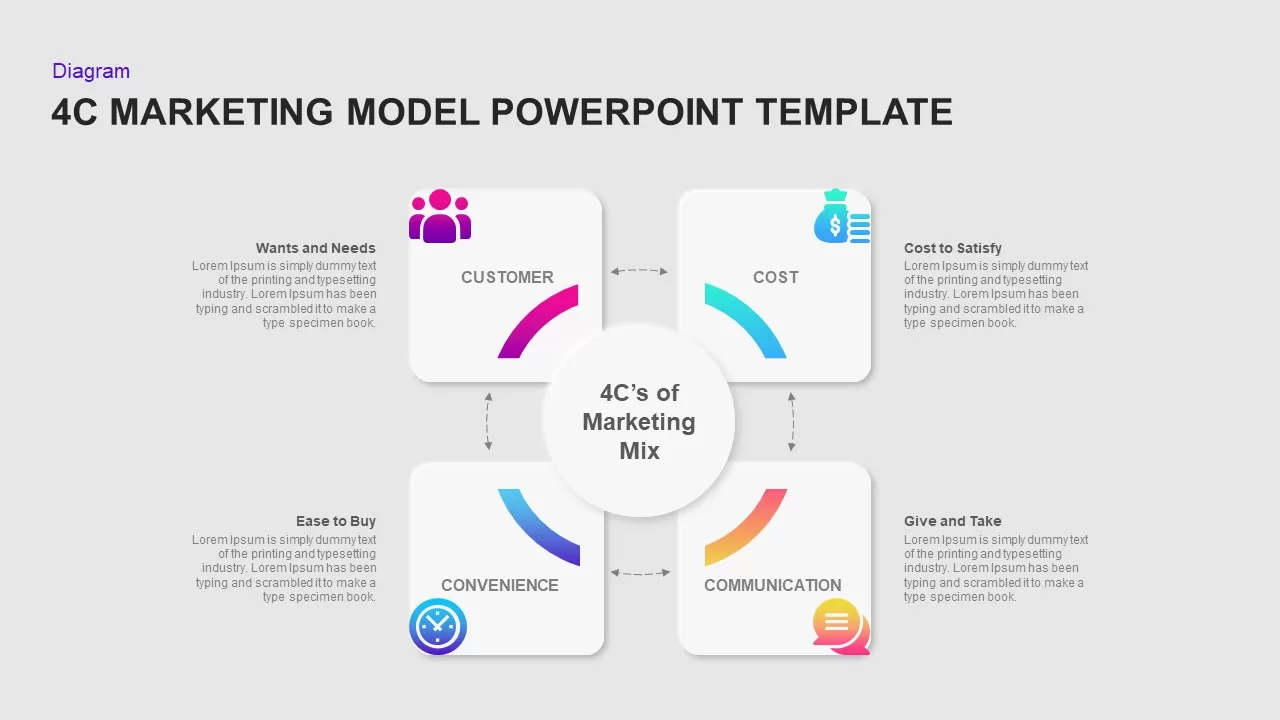
4C Marketing Model Overview Template for PowerPoint & Google Slides
Marketing
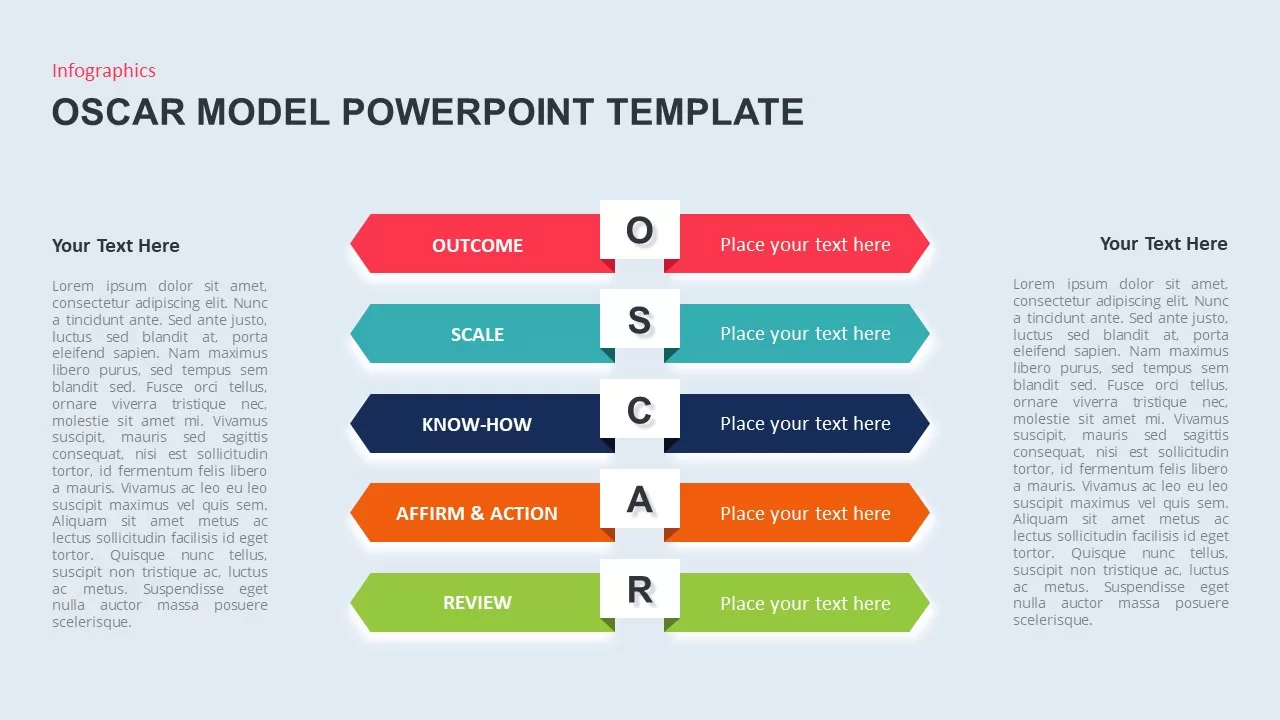
OSCAR Behavior Model Infographic Template for PowerPoint & Google Slides
HR
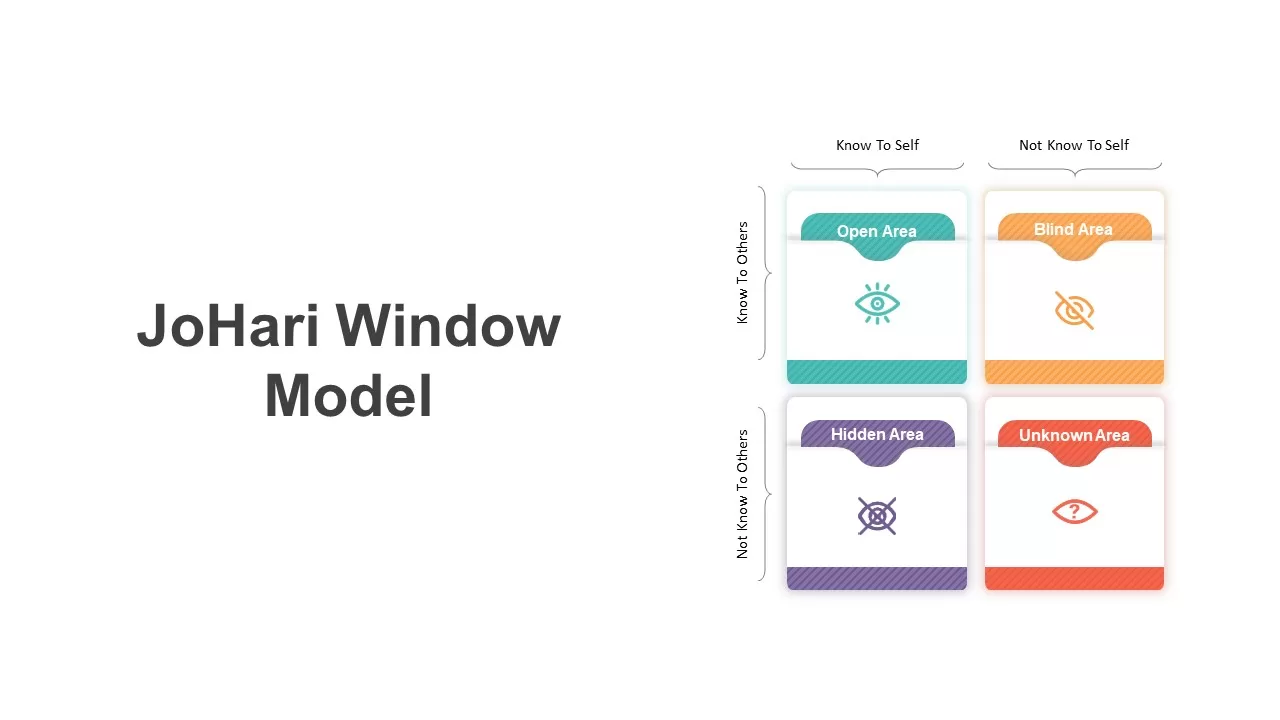
JoHari Window Model Template for PowerPoint & Google Slides
Employee Performance
Lewin’s Change Model Overview Template for PowerPoint & Google Slides
Gap
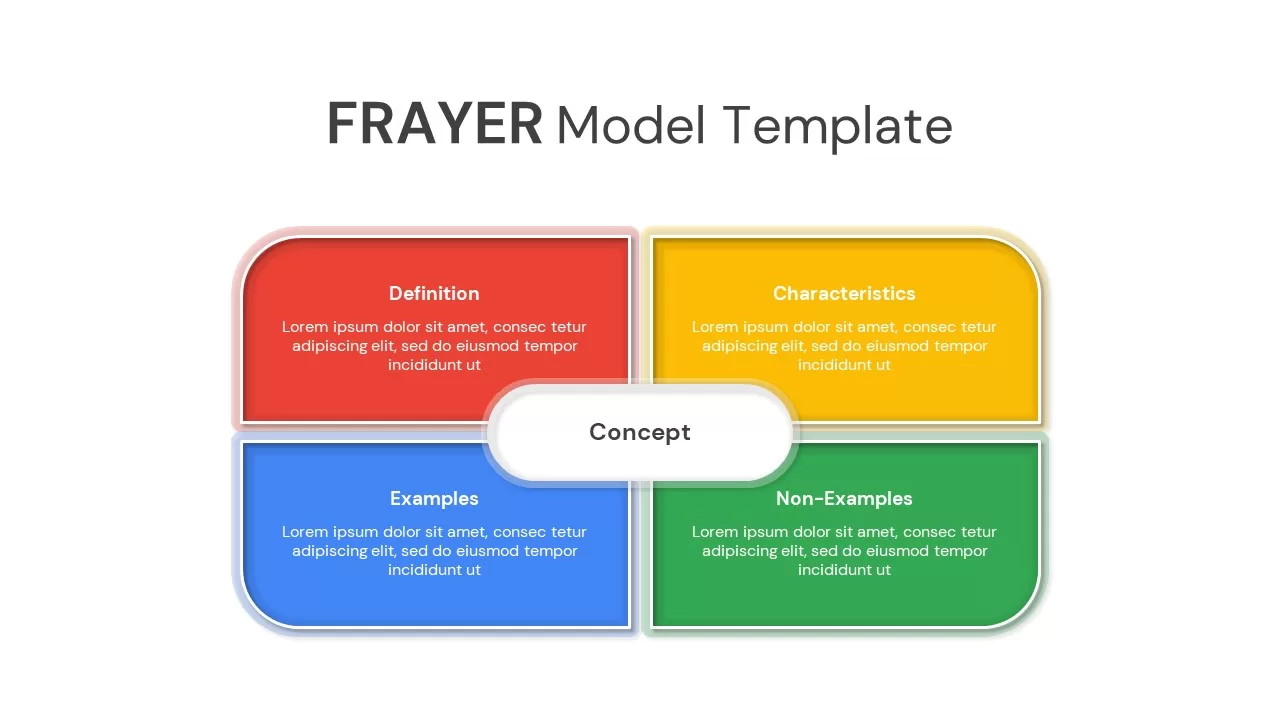
FRAYER Model template for PowerPoint & Google Slides
Infographics
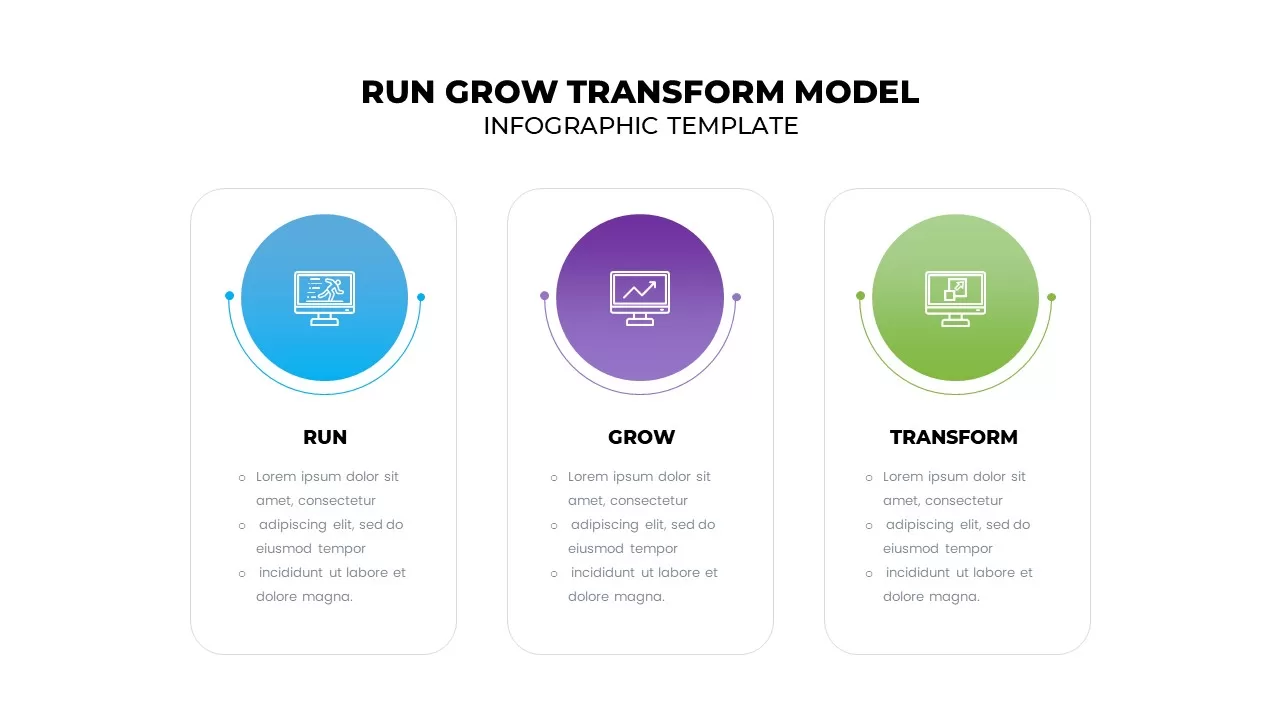
Run Grow Transform Model Infographic Template for PowerPoint & Google Slides
Business
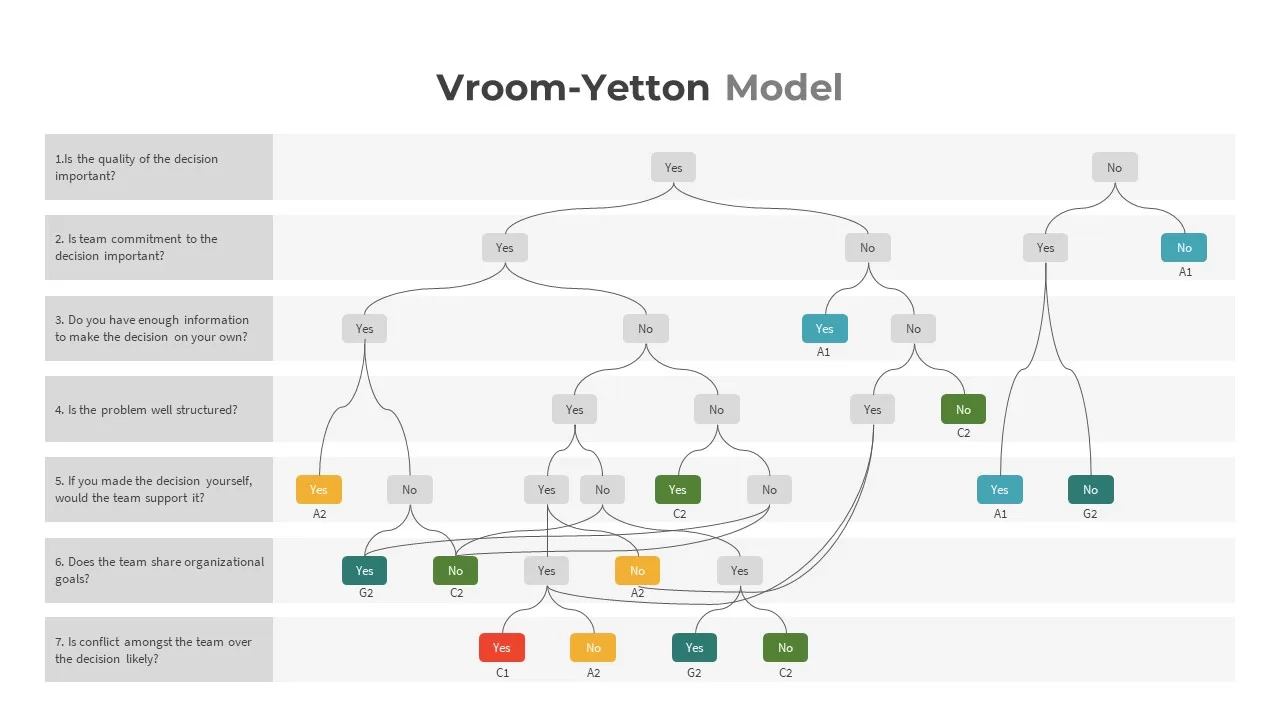
Vroom Yetton Model Template for PowerPoint & Google Slides
Business
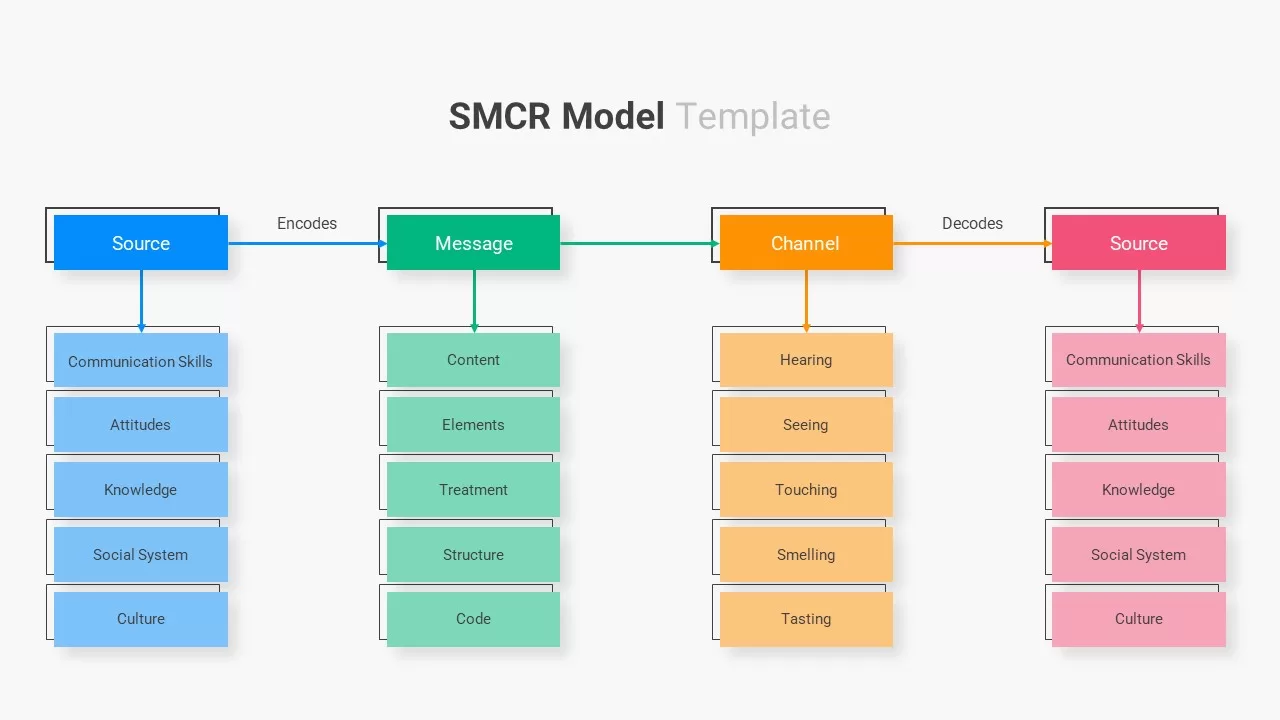
SMCR Model Template for PowerPoint & Google Slides
Infographics
DIKW Data to Wisdom Pyramid Model Template for PowerPoint & Google Slides
Pyramid
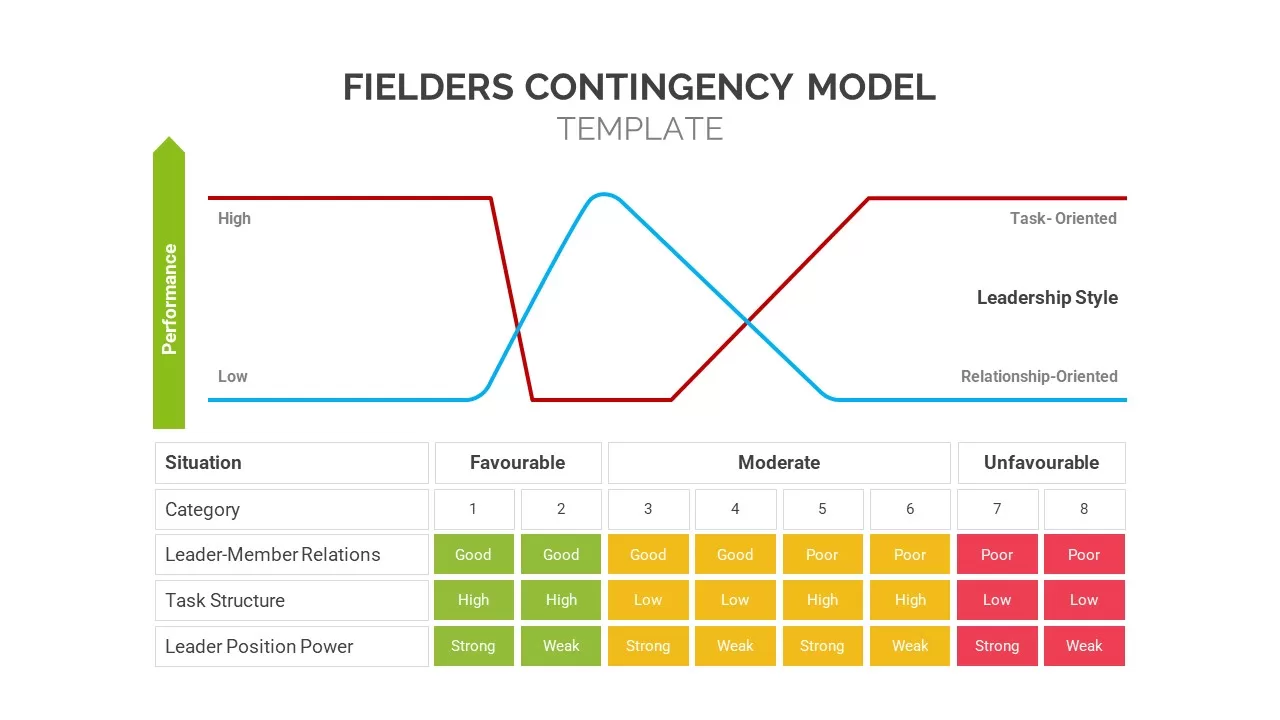
Fiedler’s Contingency Model template for PowerPoint & Google Slides
Business Strategy
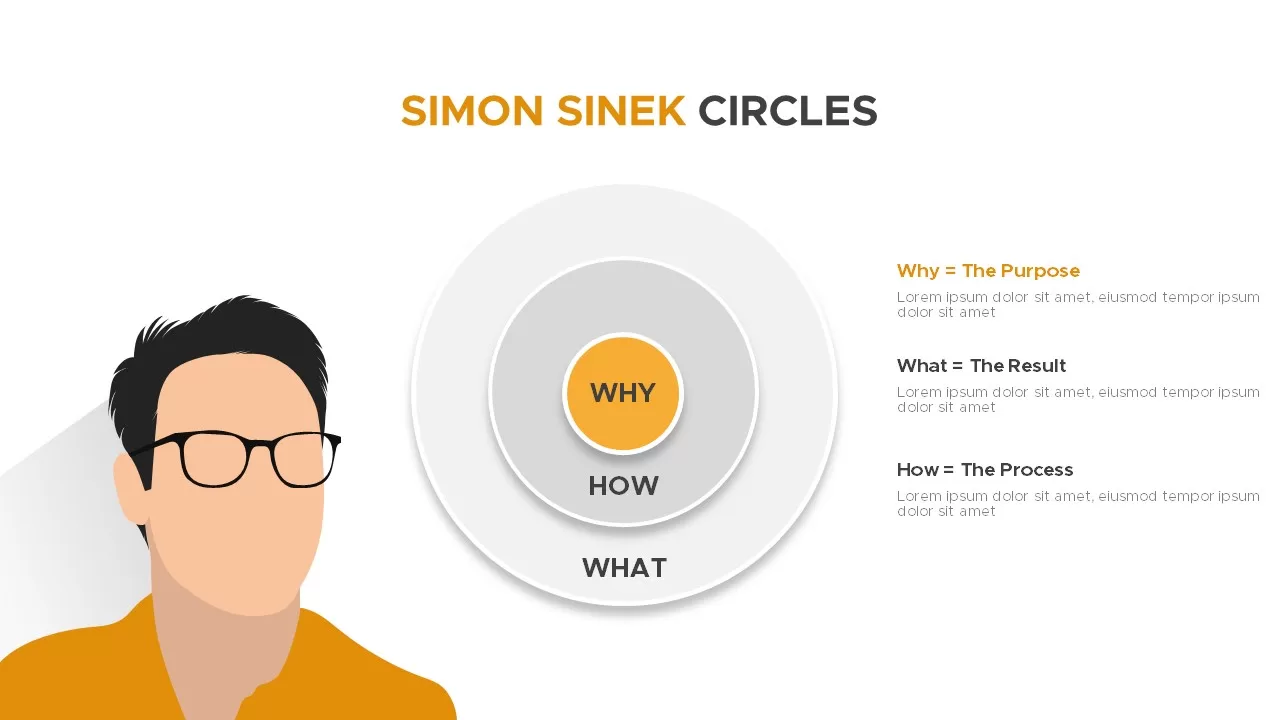
Simon Sinek Circles Model Infographic template for PowerPoint & Google Slides
Business Strategy
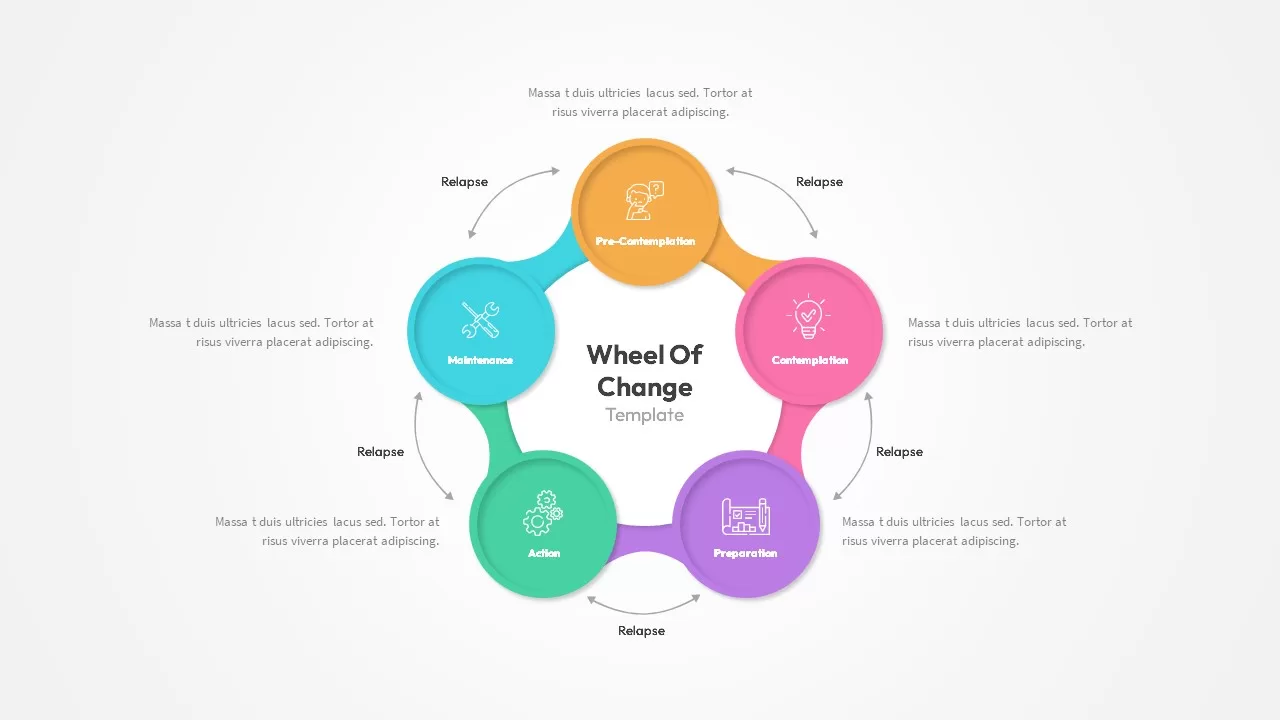
Wheel of Change Model template for PowerPoint & Google Slides
Business Strategy
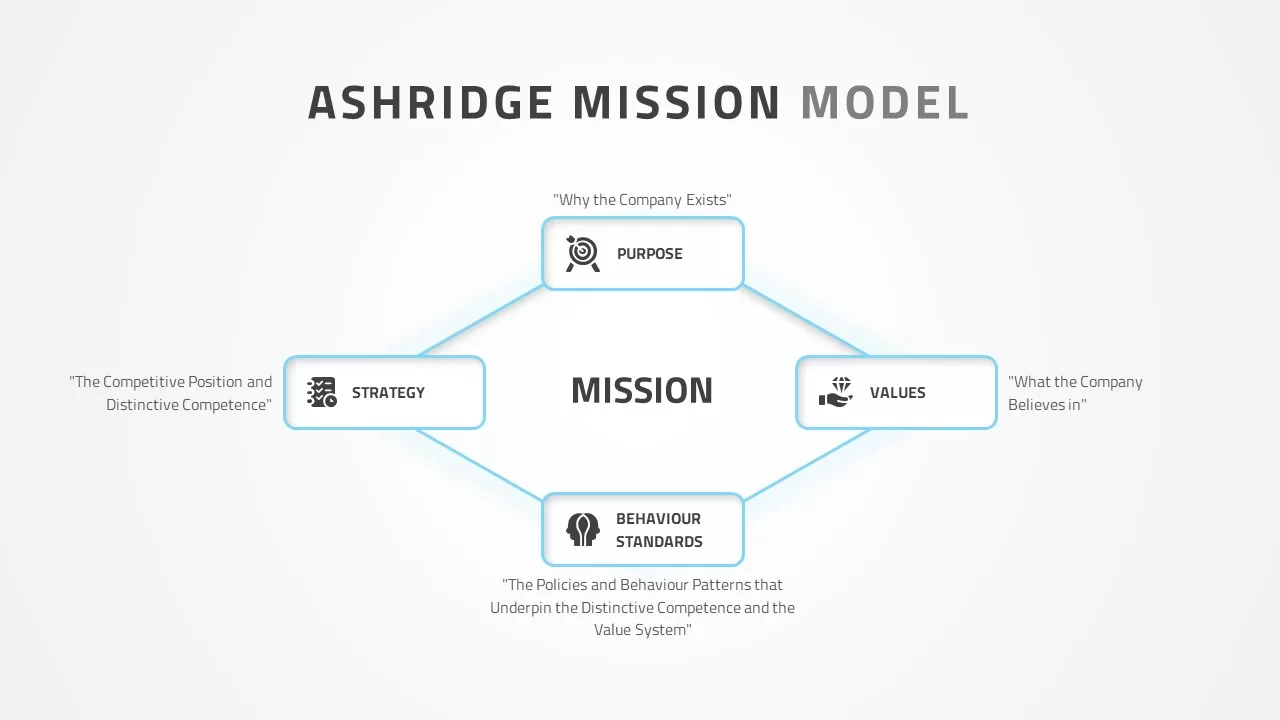
Ashridge Mission Model template for PowerPoint & Google Slides
Competitor Analysis
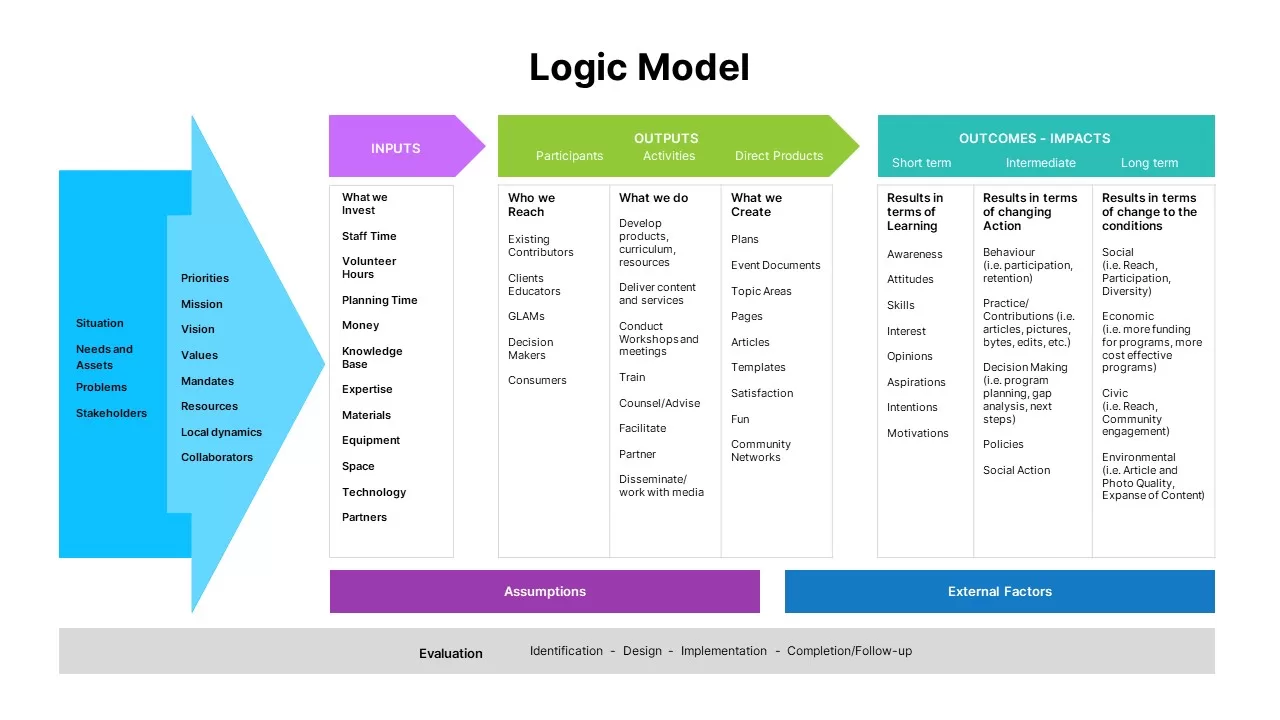
Logic Model template for PowerPoint & Google Slides
Infographics
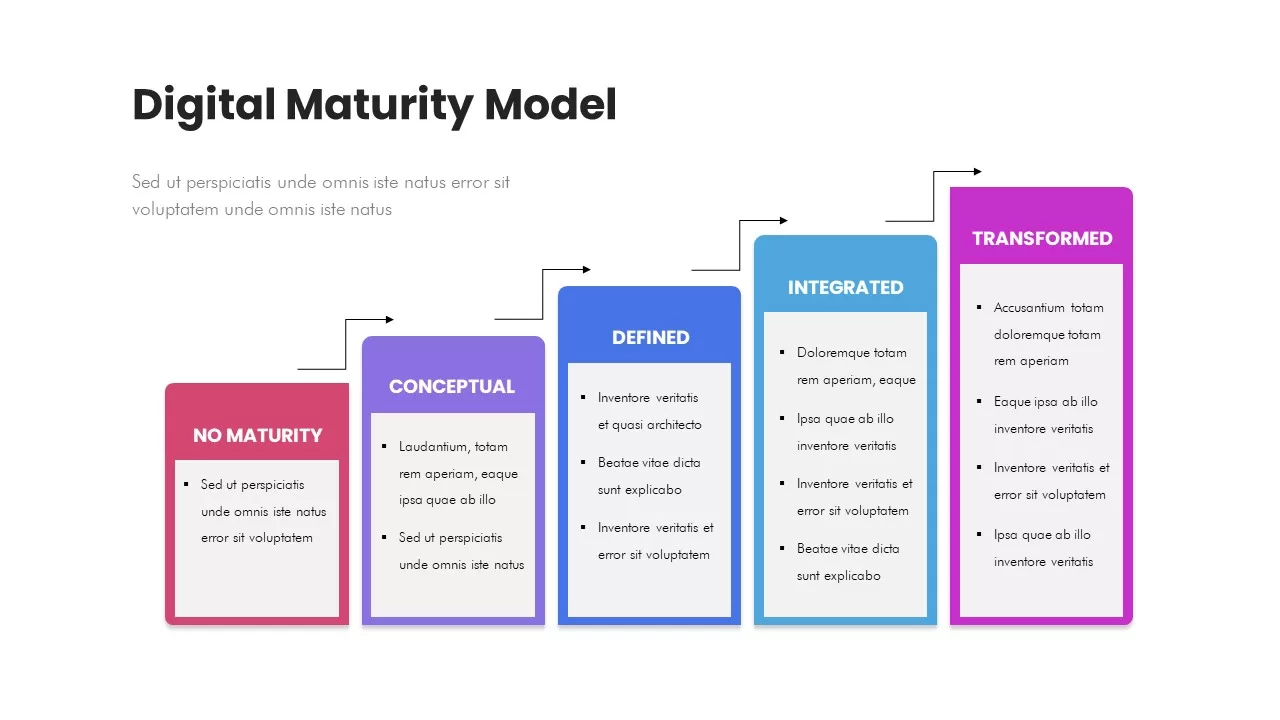
Digital Maturity Model Stages Diagram Template for PowerPoint & Google Slides
Process
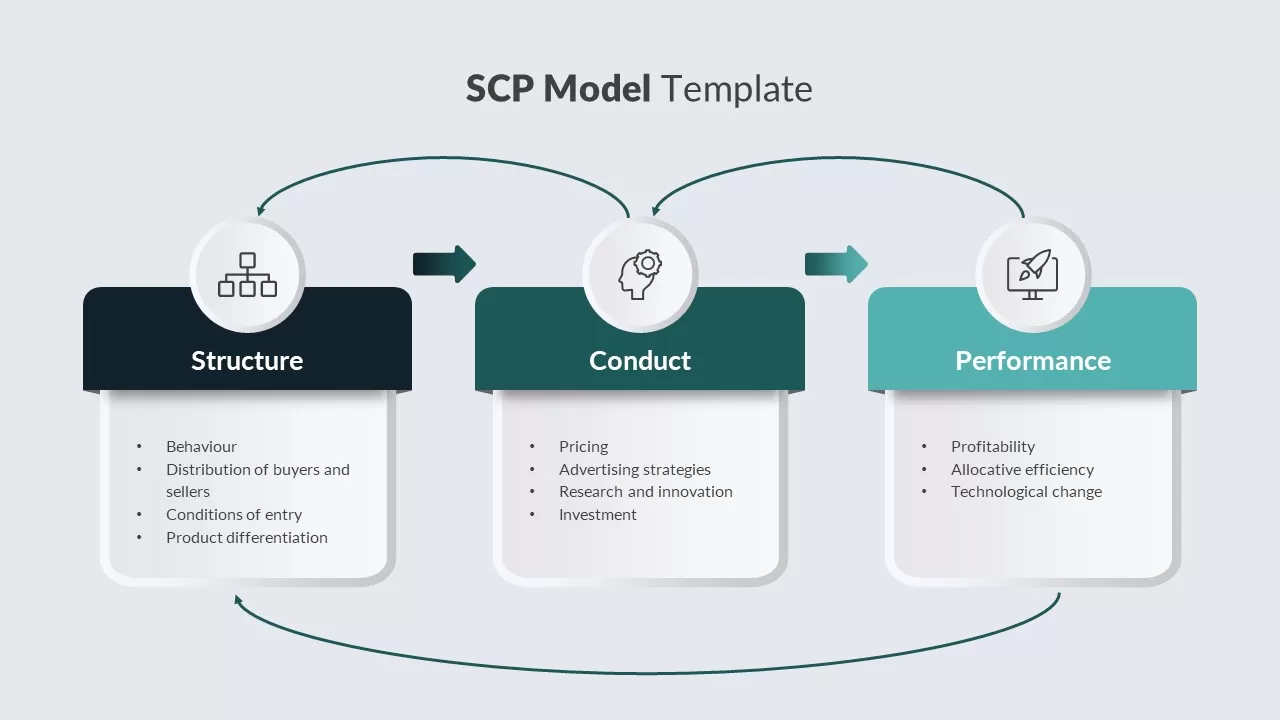
SCP Model Template for PowerPoint & Google Slides
Process
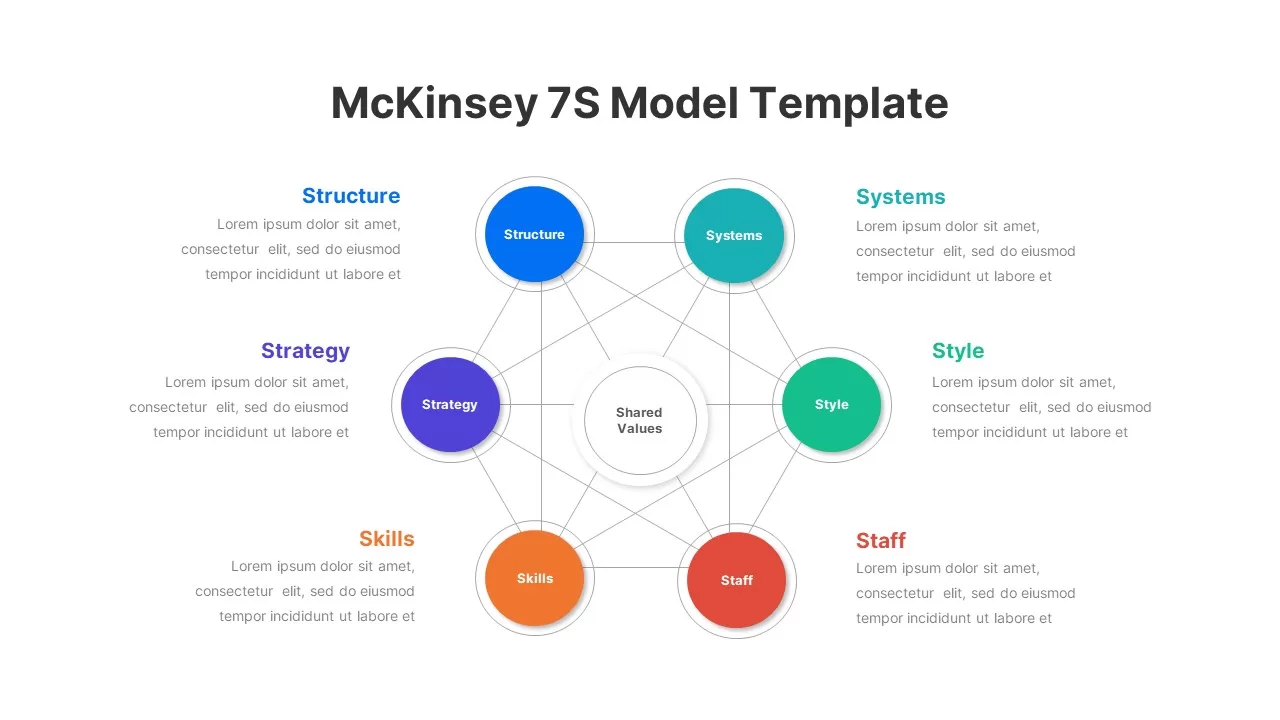
McKinsey 7S Model Strategic Alignment Template for PowerPoint & Google Slides
Circular
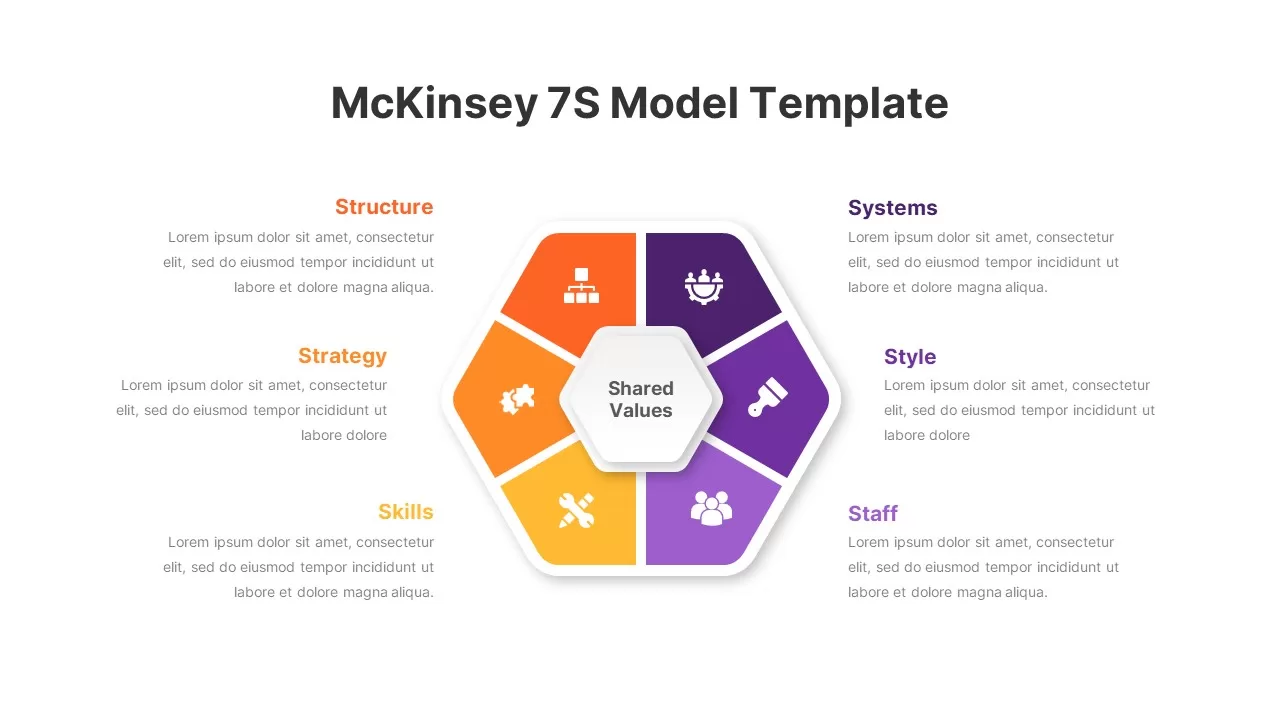
Hexagon 7S Strategic Alignment Model Template for PowerPoint & Google Slides
Business Strategy
Five-Stage Digital Maturity Model Diagram Template for PowerPoint & Google Slides
Process
Business Strategy House Model Diagram Template for PowerPoint & Google Slides
Business Strategy
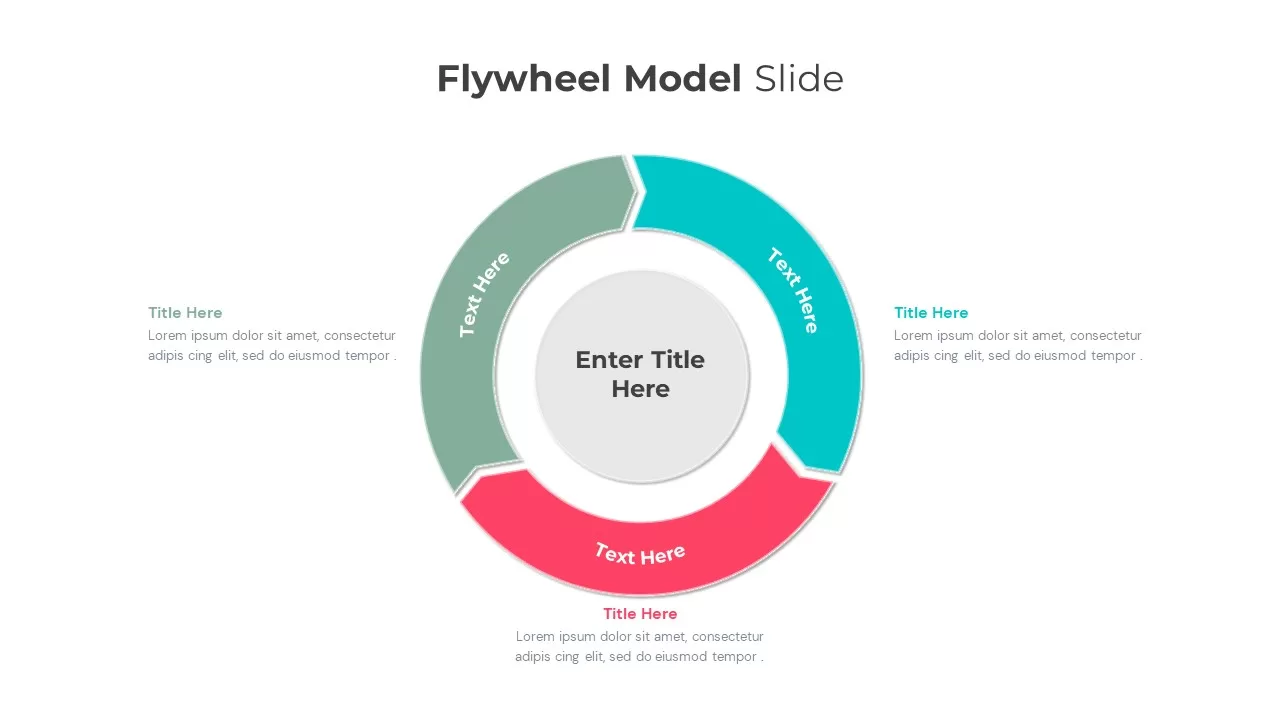
Flywheel Model Infographic Template for PowerPoint & Google Slides
Process
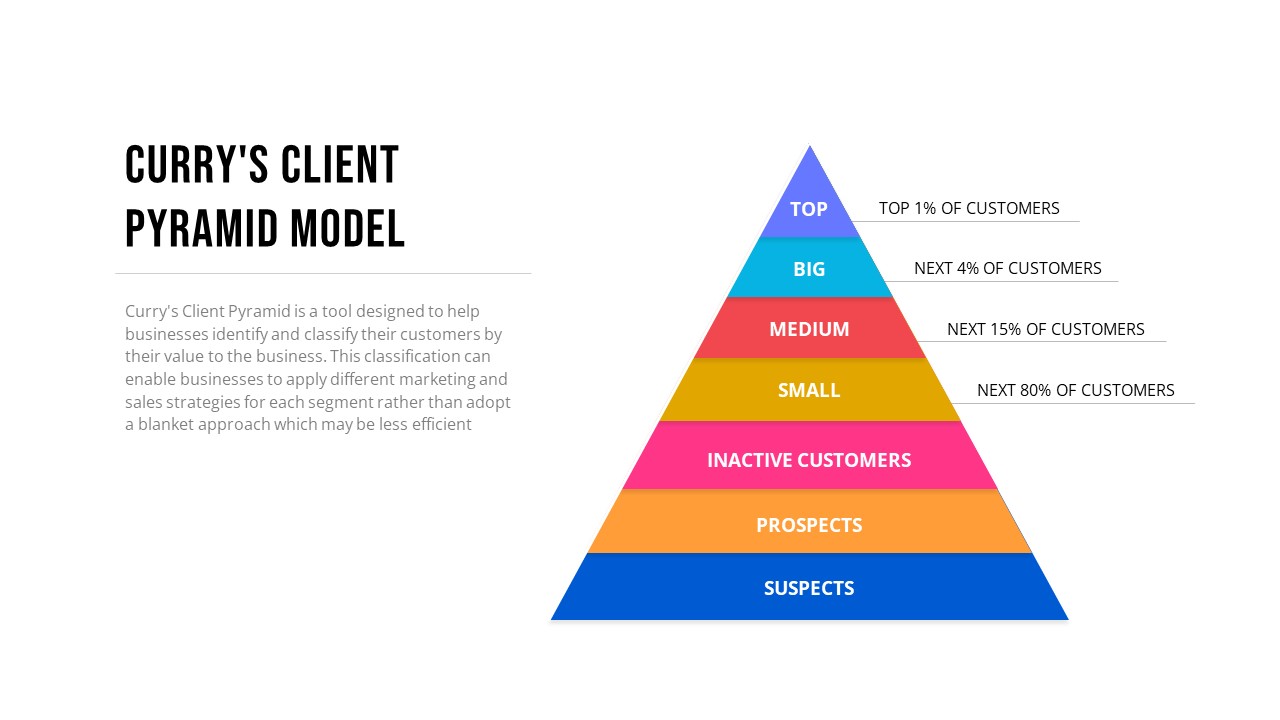
Curry’s Client Segmentation Pyramid Model Template for PowerPoint & Google Slides
Pyramid
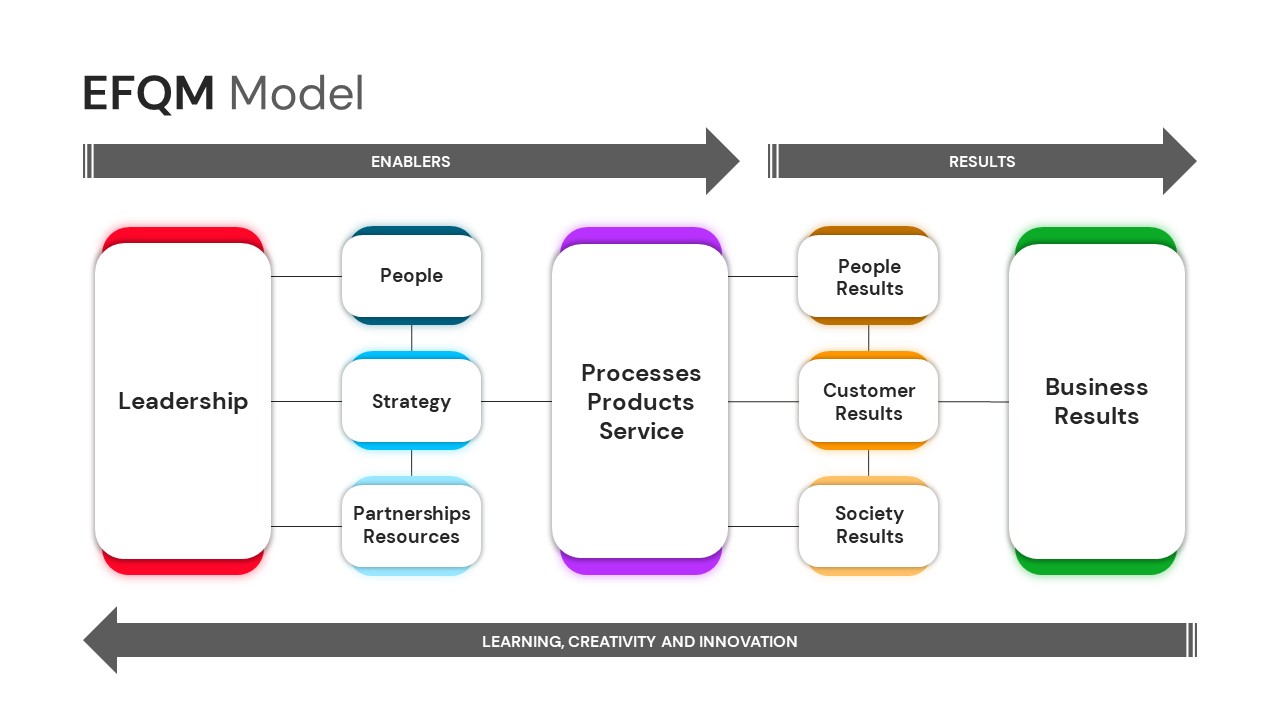
EFQM Excellence Framework Model Template for PowerPoint & Google Slides
Process
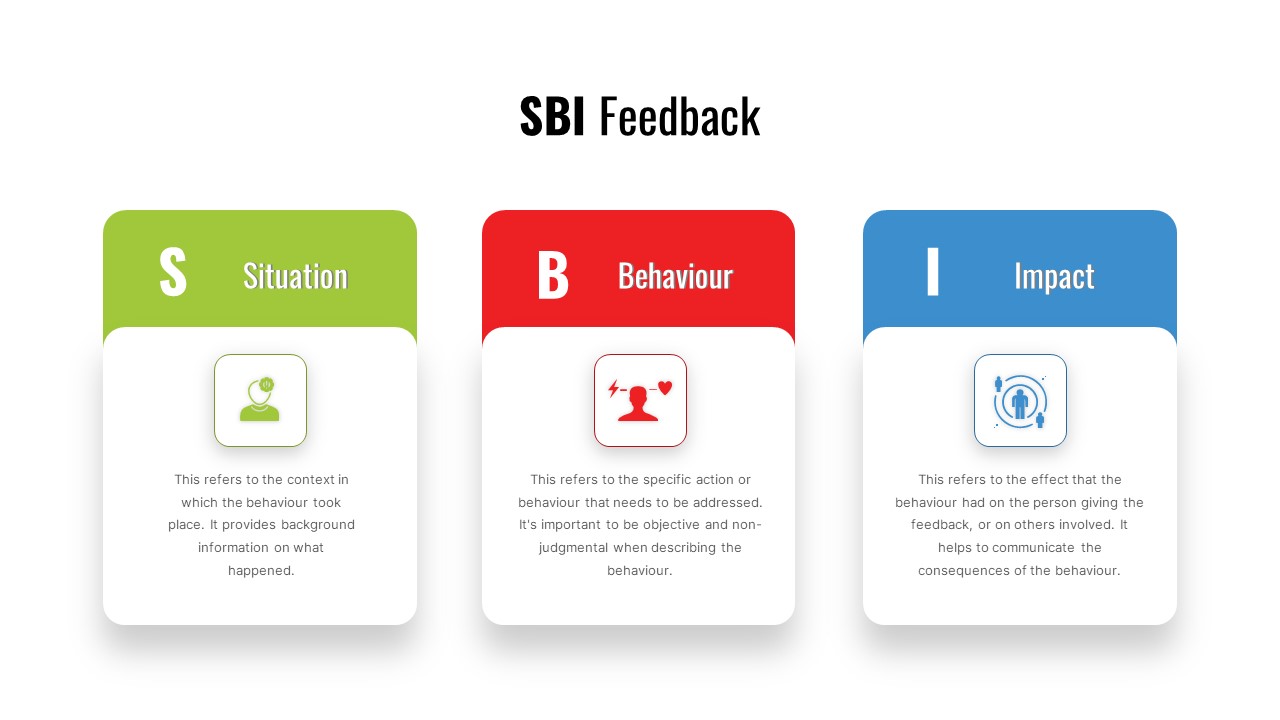
SBI Feedback Model Process Diagram Template for PowerPoint & Google Slides
Process
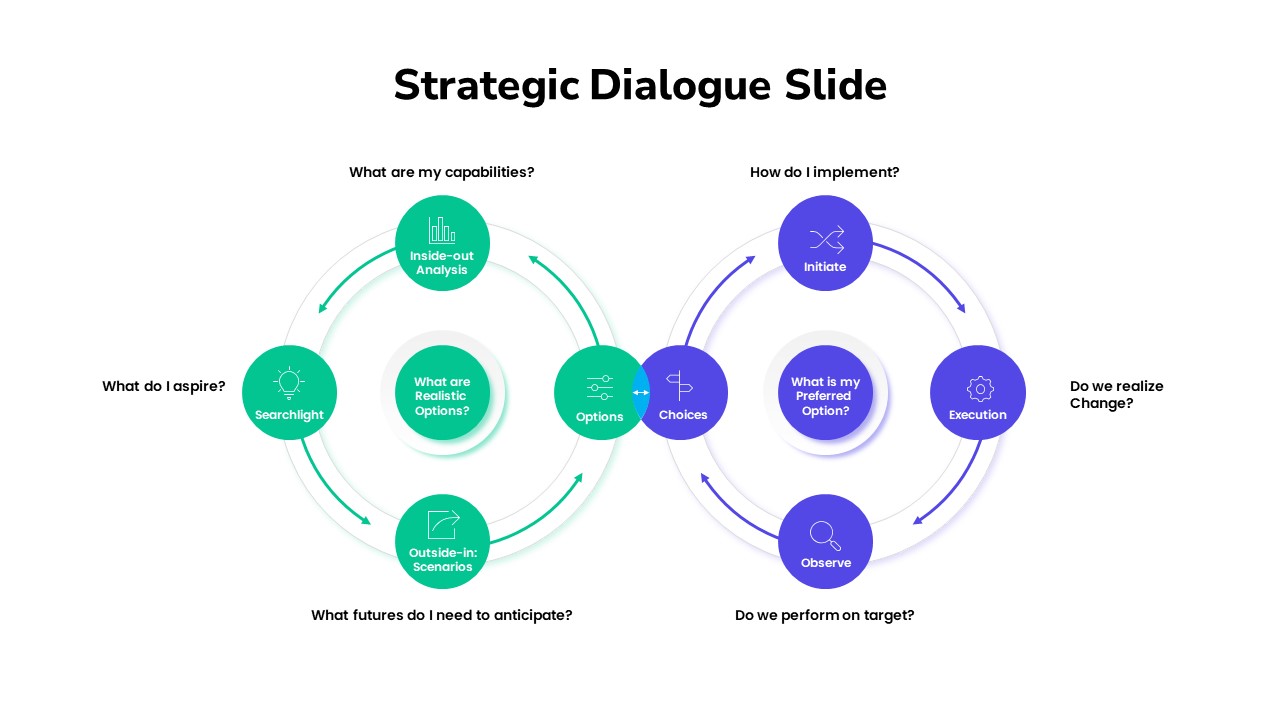
Strategic Dialogue Model Cycle Template for PowerPoint & Google Slides
Circular
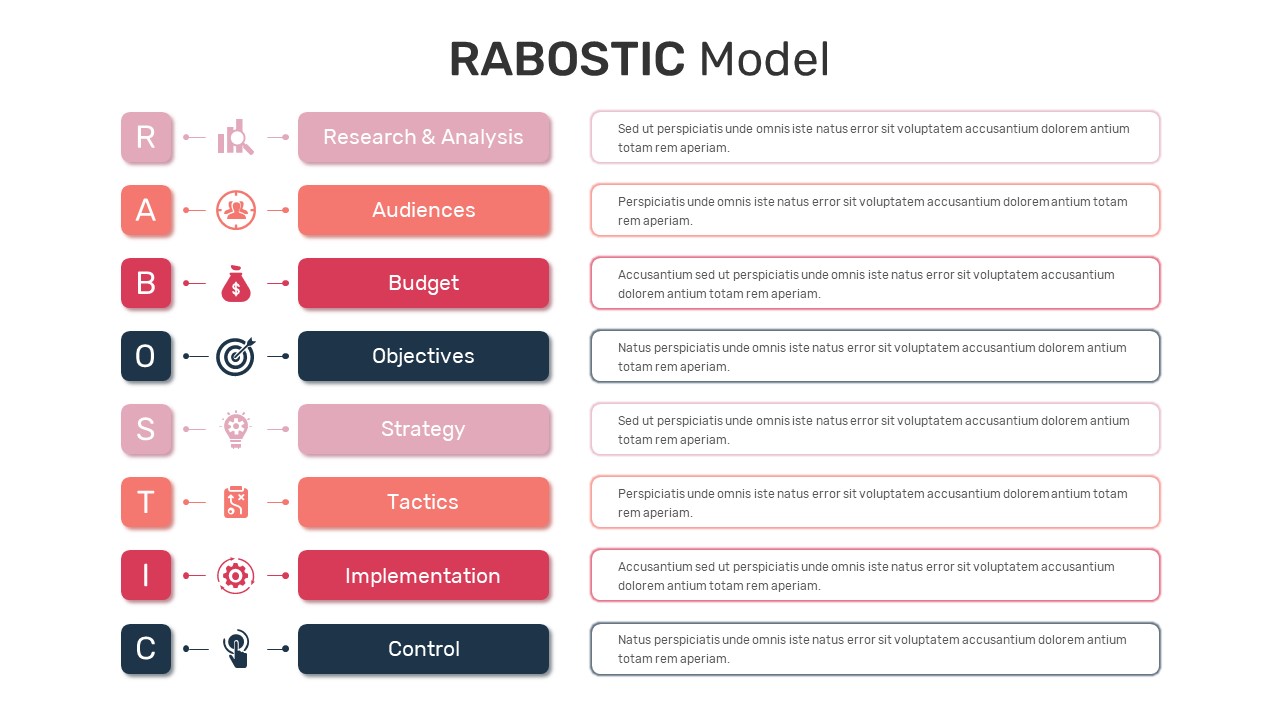
RABOSTIC Marketing Model Process Diagram Template for PowerPoint & Google Slides
Process
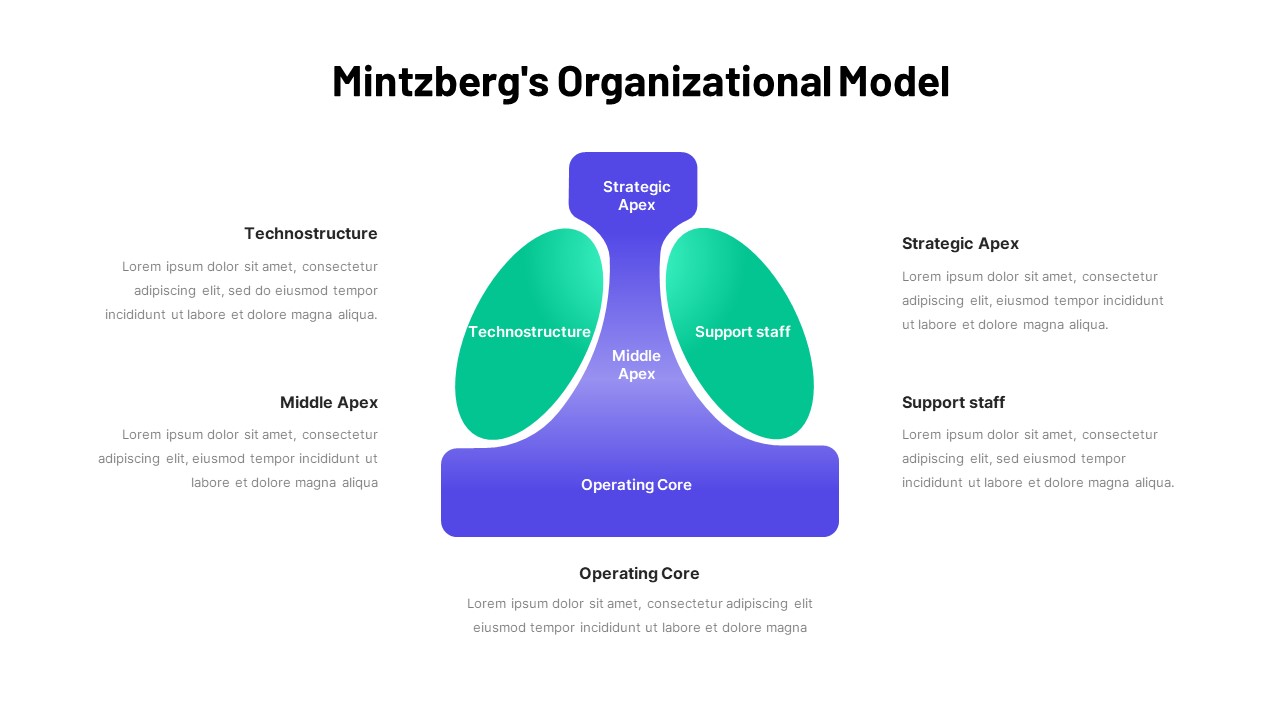
Mintzberg Organizational Model Gradient Template for PowerPoint & Google Slides
Business
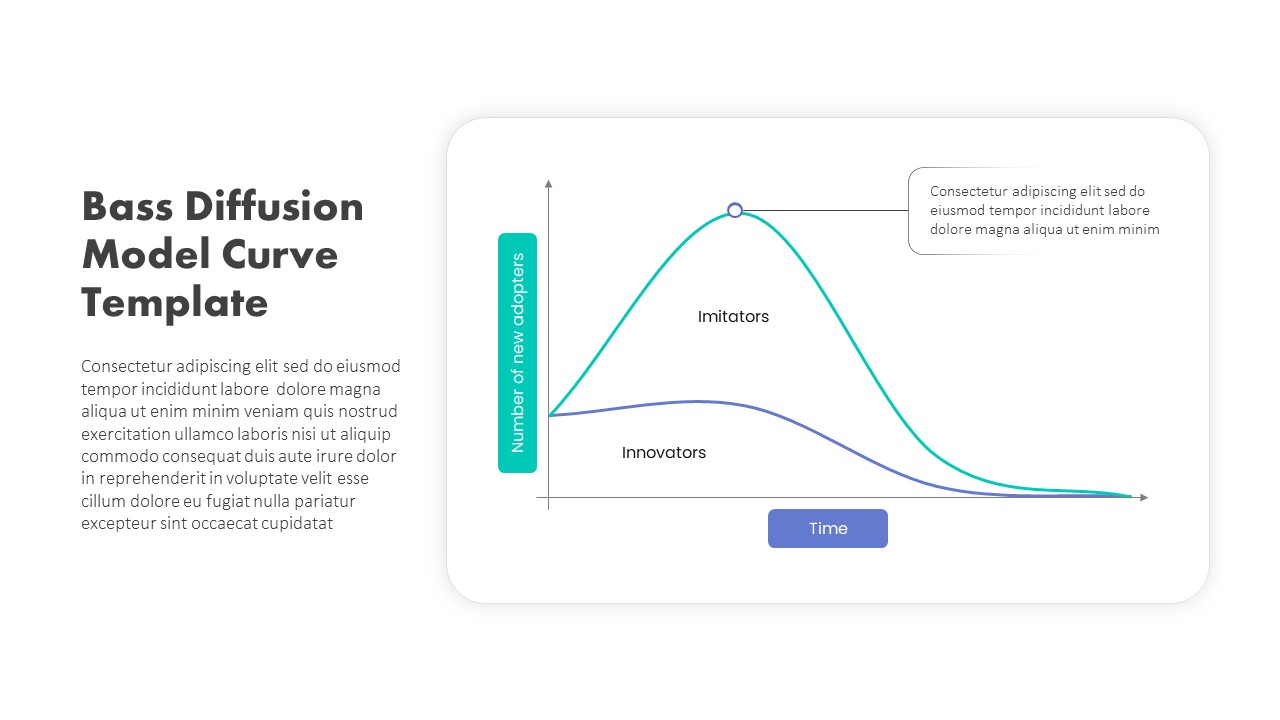
Bass Diffusion Model Curve for Adoption Template for PowerPoint & Google Slides
Comparison Chart
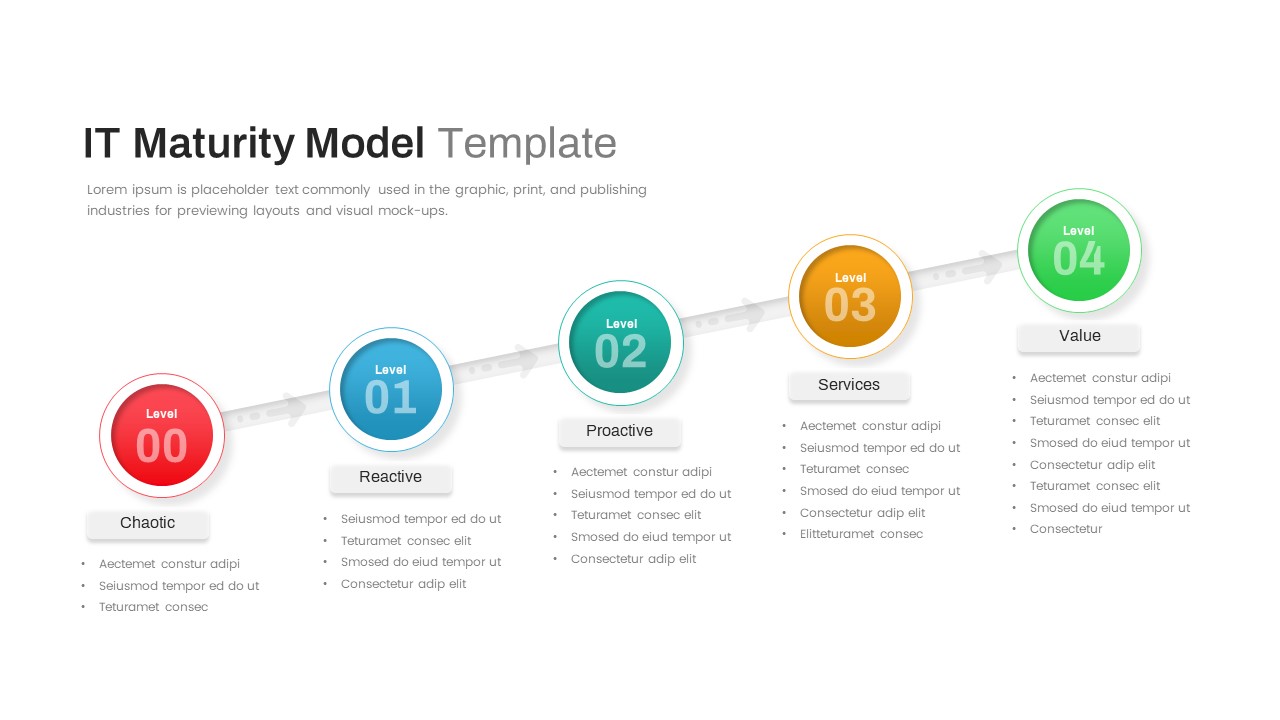
IT Maturity Model with Five Stages Template for PowerPoint & Google Slides
Timeline
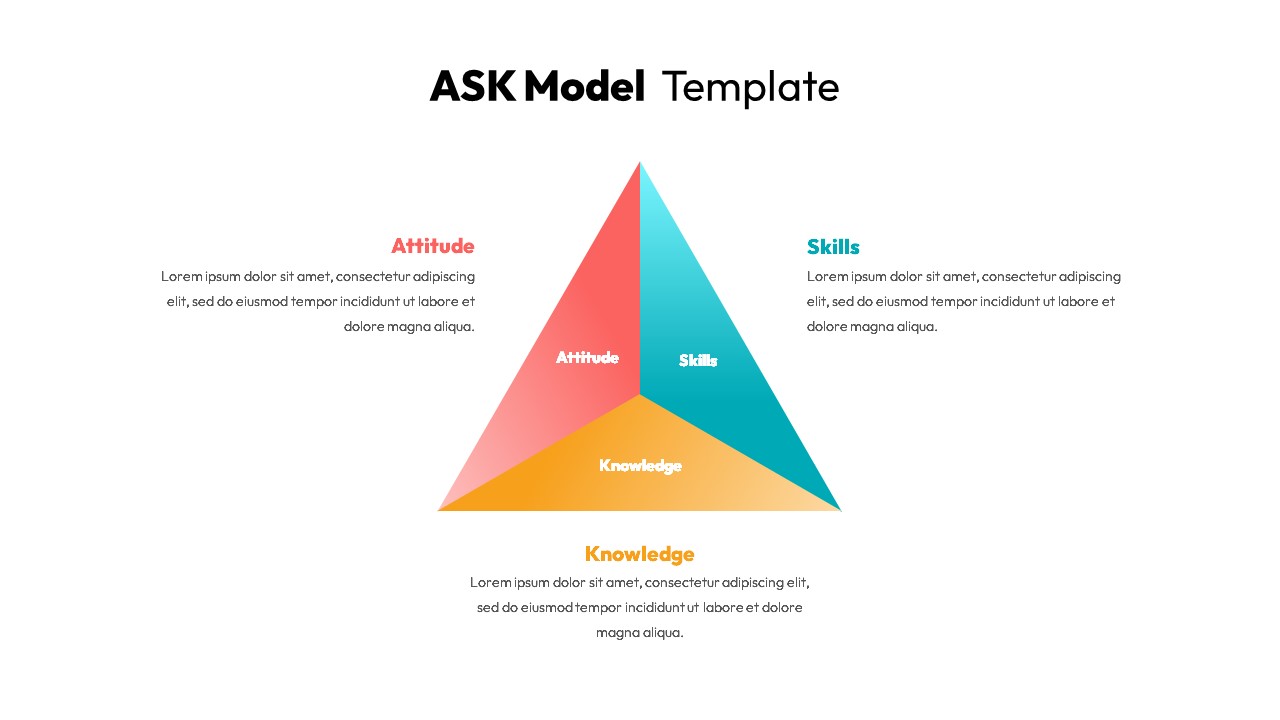
Professional ASK Model Template for PowerPoint & Google Slides
Employee Performance
Layered Data Governance Maturity Model Template for PowerPoint & Google Slides
Process
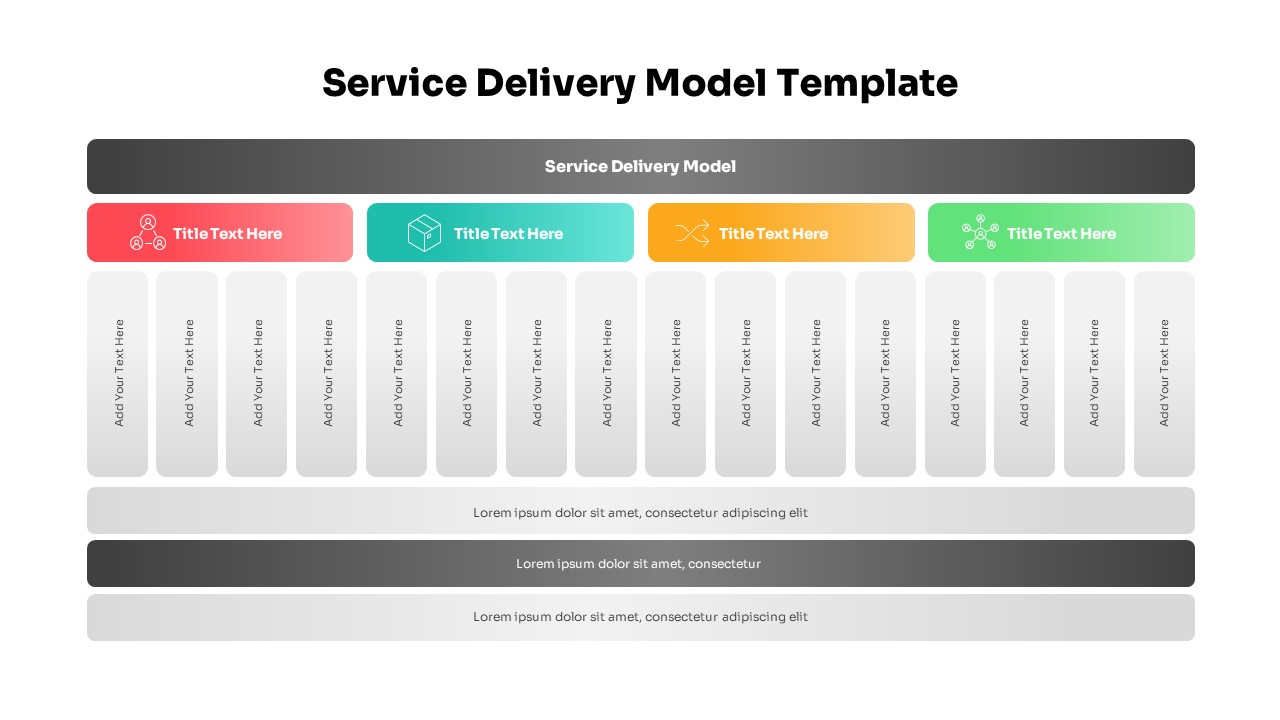
Comprehensive Service Delivery Model Template for PowerPoint & Google Slides
Project
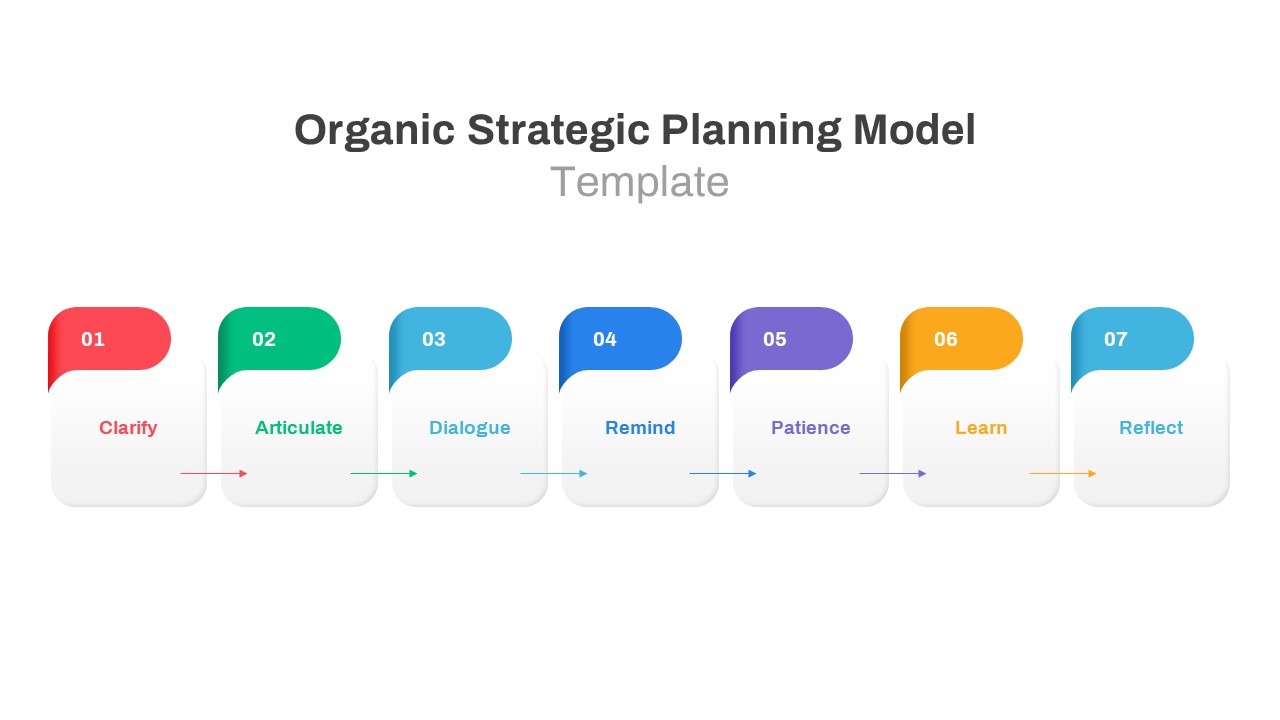
Organic Strategic Planning Model Template for PowerPoint & Google Slides
Business Strategy
Scenario-Based Strategic Plan Model Template for PowerPoint & Google Slides
Business Plan
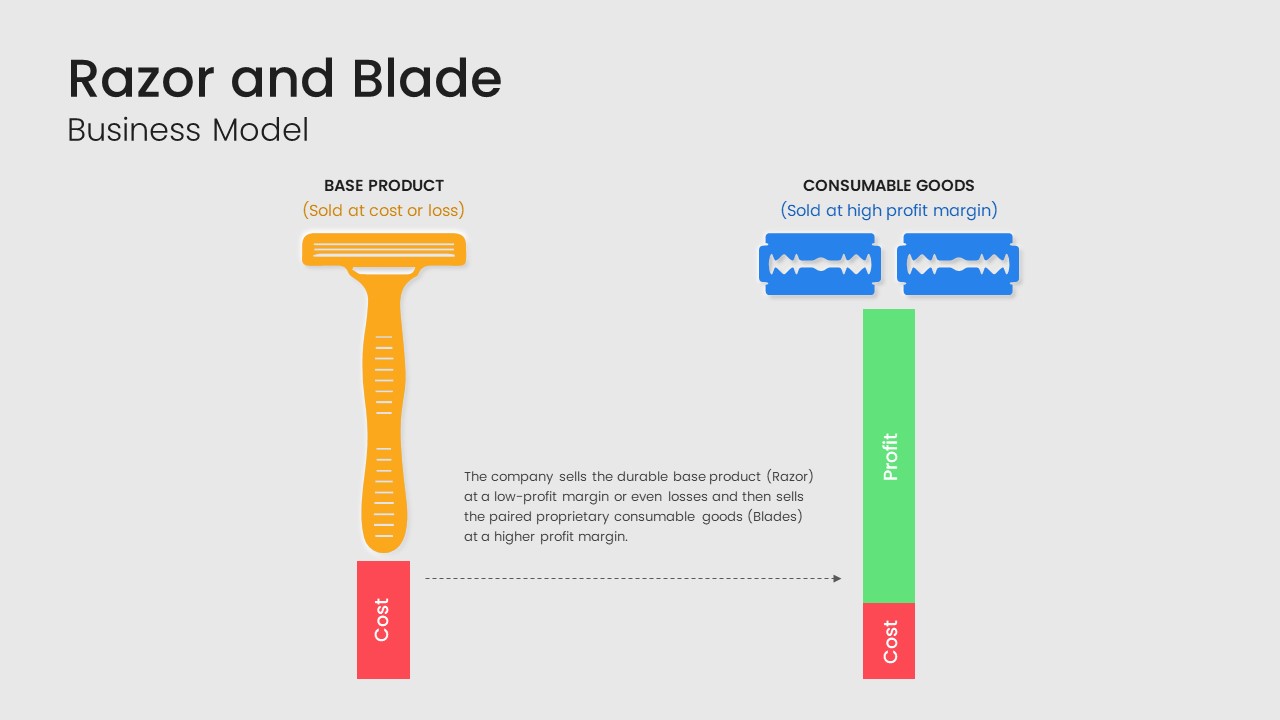
Razor and Blade Business Model Diagram Template for PowerPoint & Google Slides
Business Models
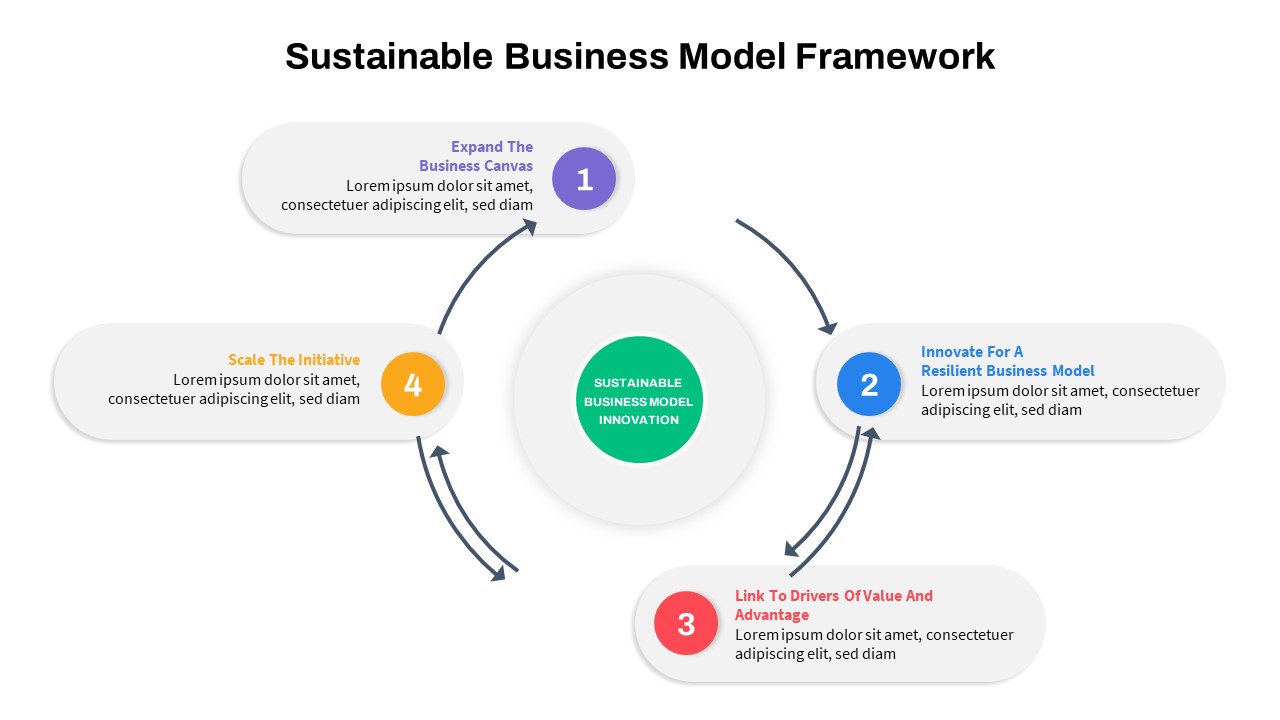
Sustainable Business Model Circular Infographic Template for PowerPoint & Google Slides
Business Strategy
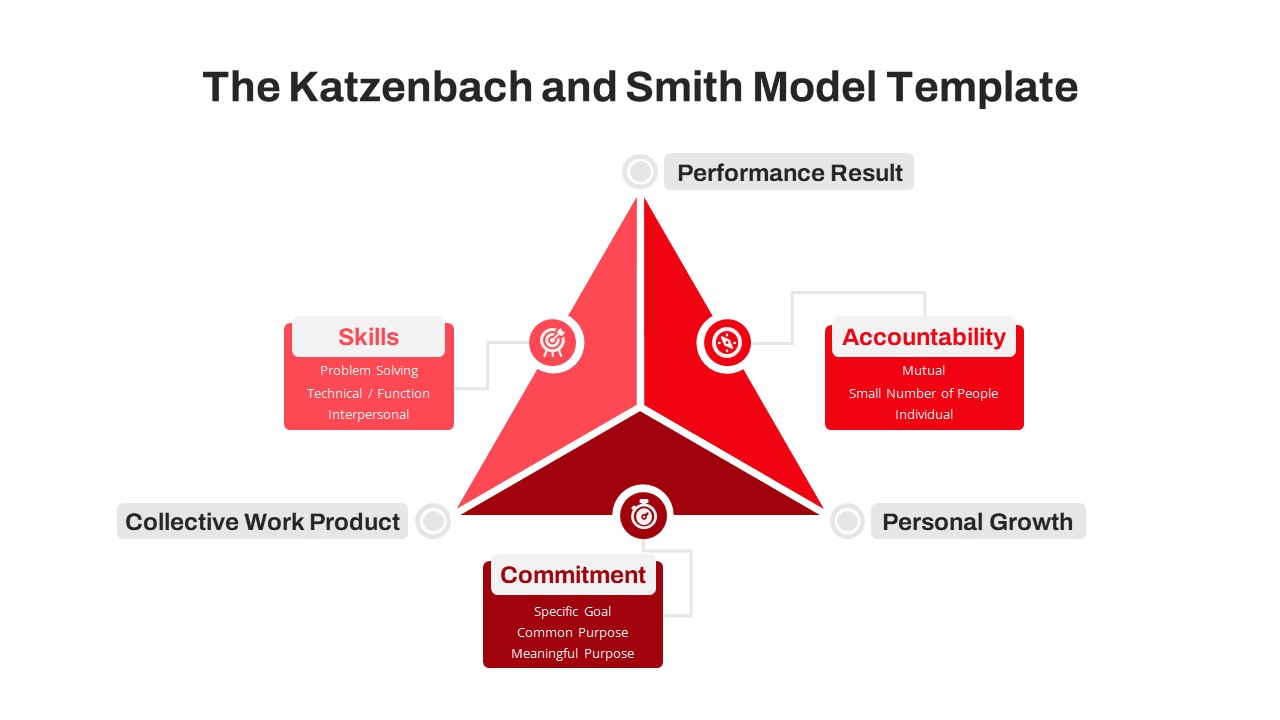
Katzenbach & Smith Model Pyramid Template for PowerPoint & Google Slides
Pyramid
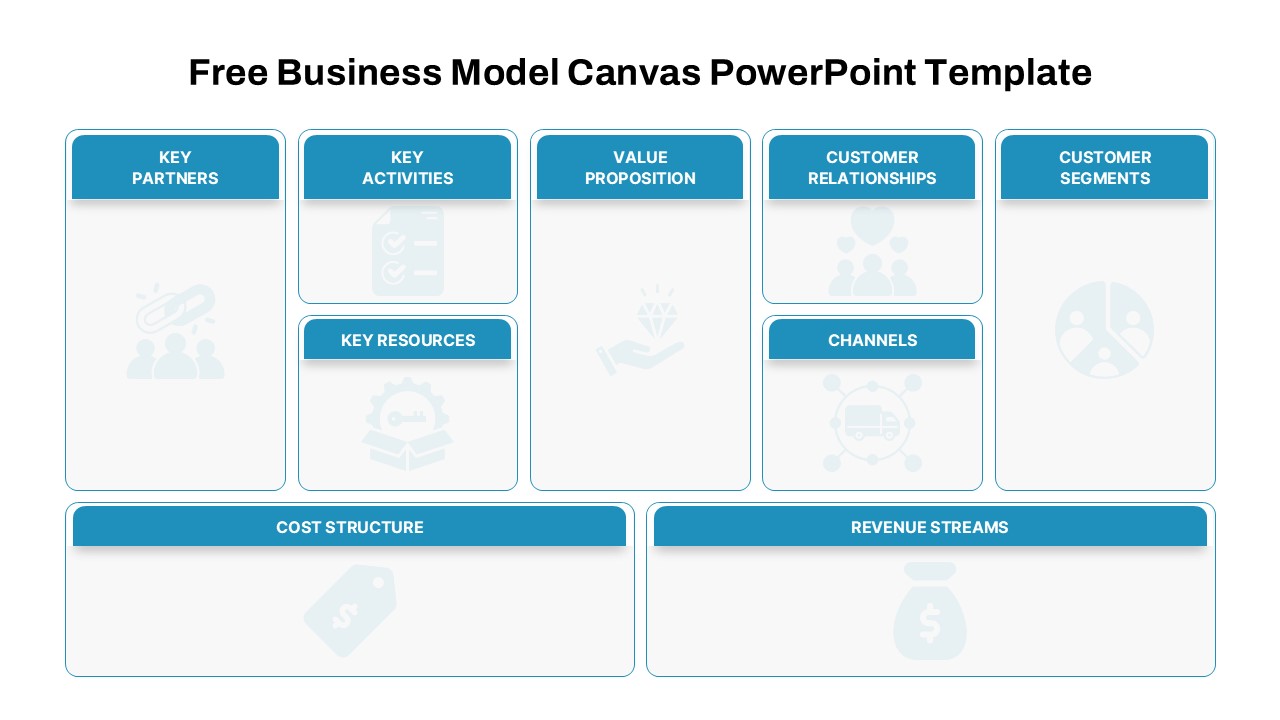
Free Business Model Canvas Diagram Slide Template for PowerPoint & Google Slides
Business Models
Free
Salience Model Venn Diagram Infographic Template for PowerPoint & Google Slides
Circular
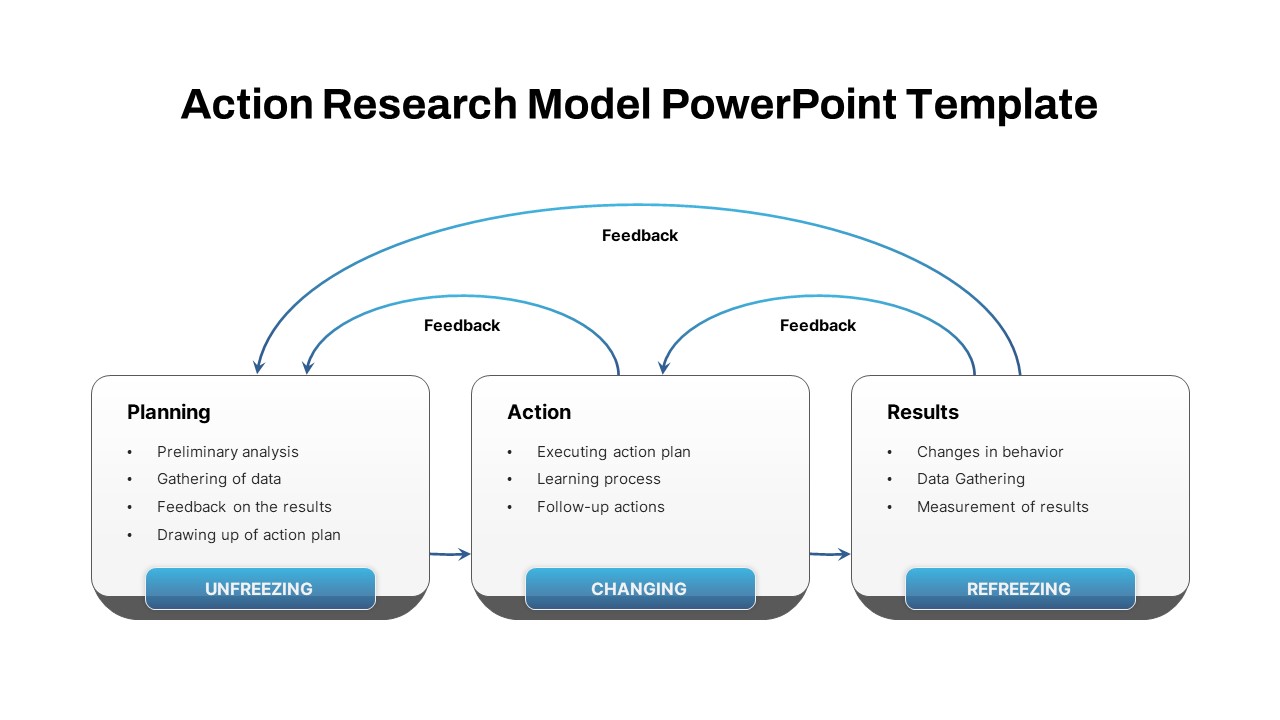
Action Research Feedback Process Model Template for PowerPoint & Google Slides
Process
Pricing Model Types Comparison Infographic Template for PowerPoint & Google Slides
Pitch Deck
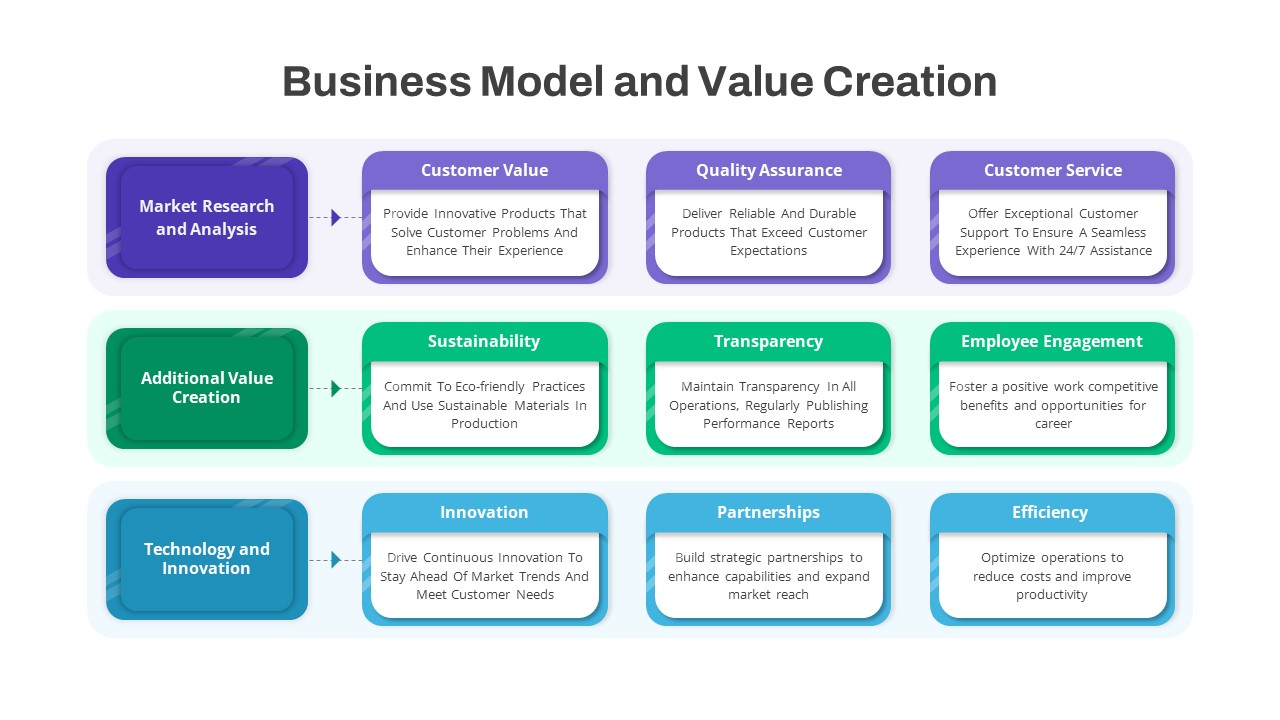
Business Model & Value Creation Template for PowerPoint & Google Slides
Process
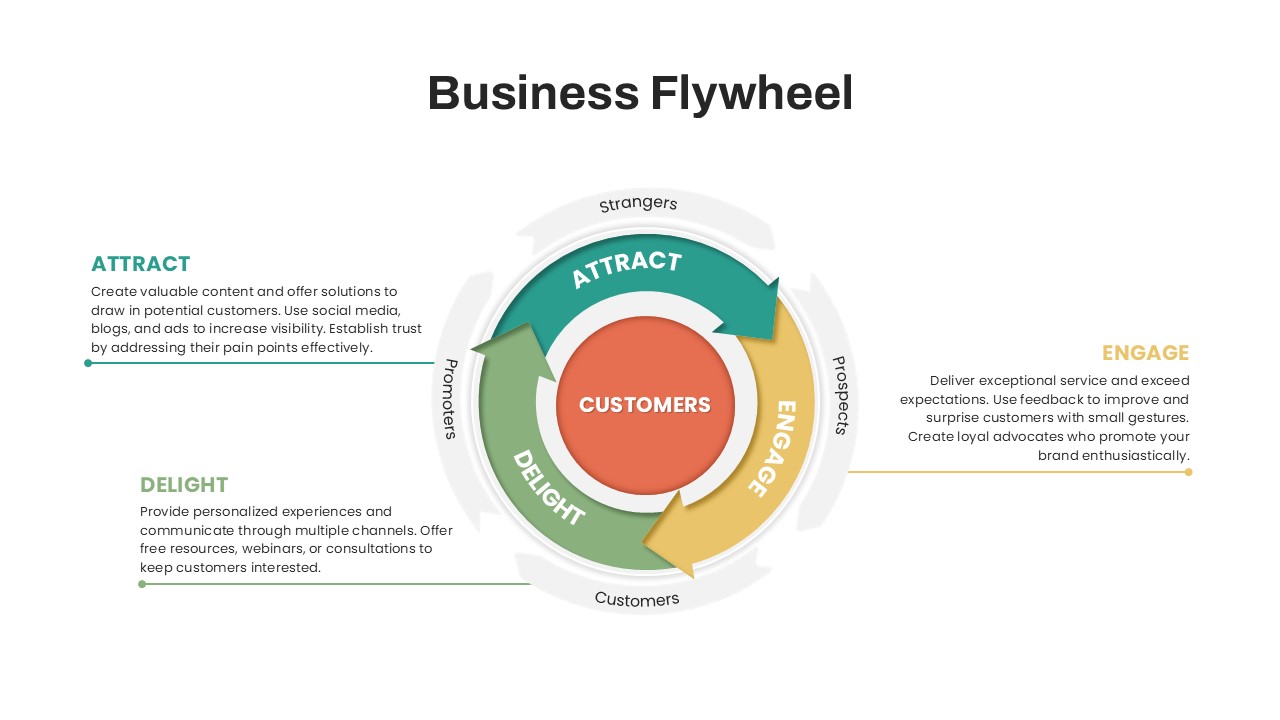
Business Flywheel Lifecycle Model Template for PowerPoint & Google Slides
Circular
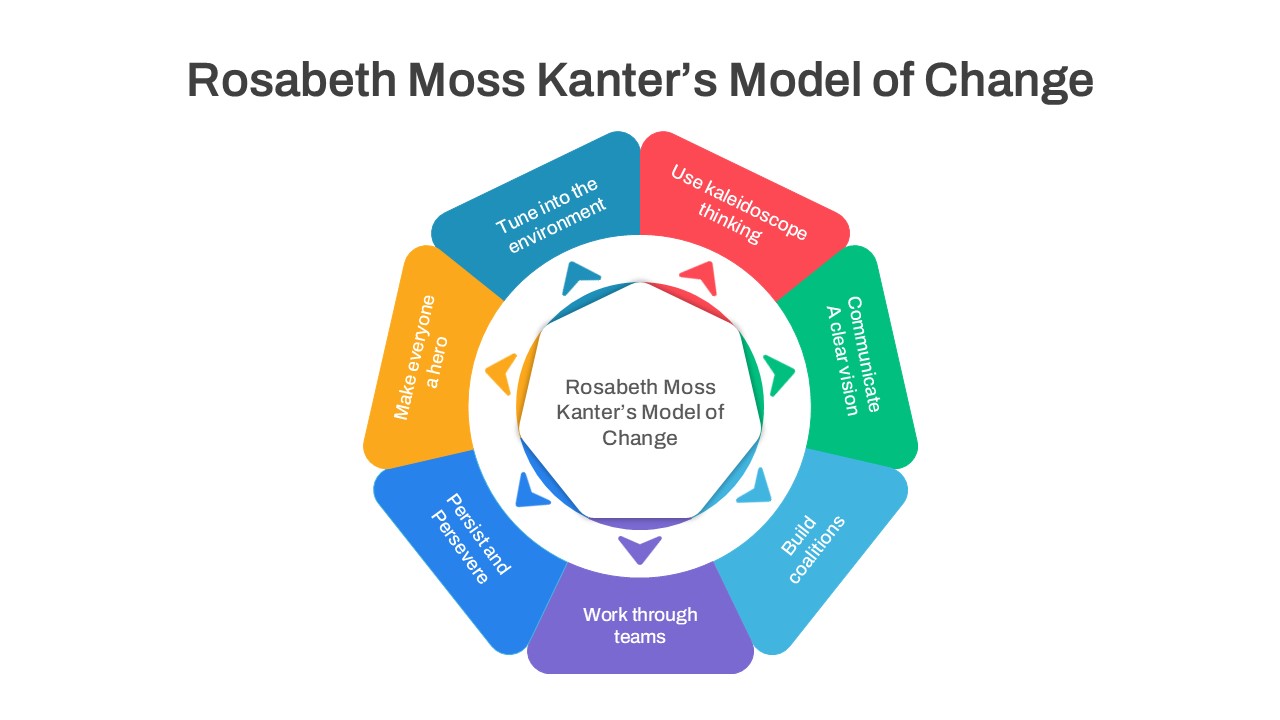
Rosabeth Moss Kanter’s Model of Change Template for PowerPoint & Google Slides
Circular
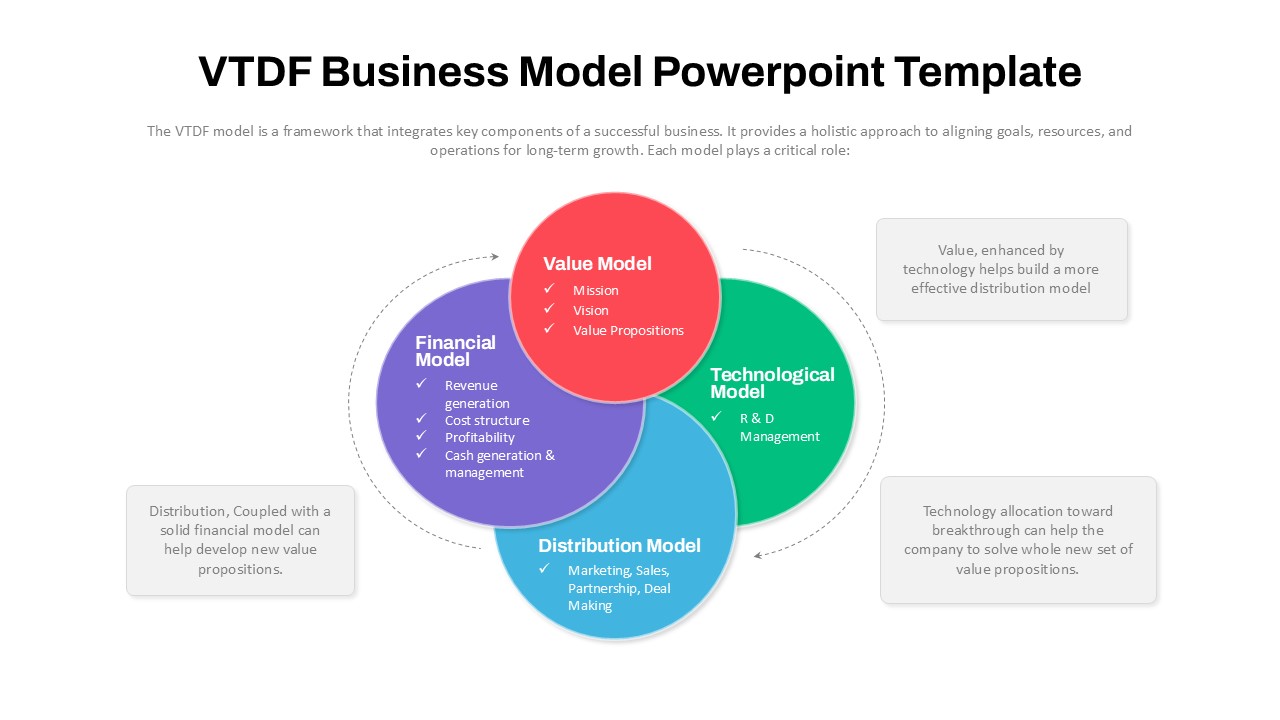
VTDF Business Model Framework Diagram Template for PowerPoint & Google Slides
Business Models
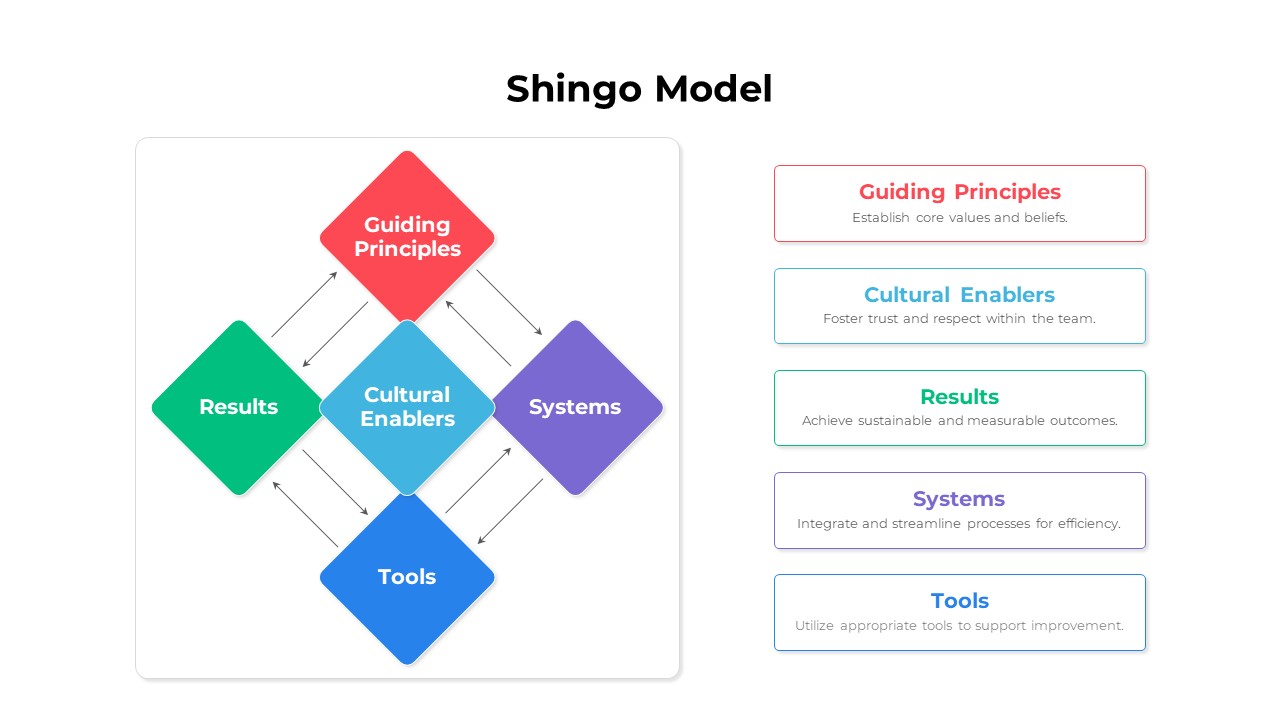
Shingo Model Diagram Template for PowerPoint & Google Slides
Process
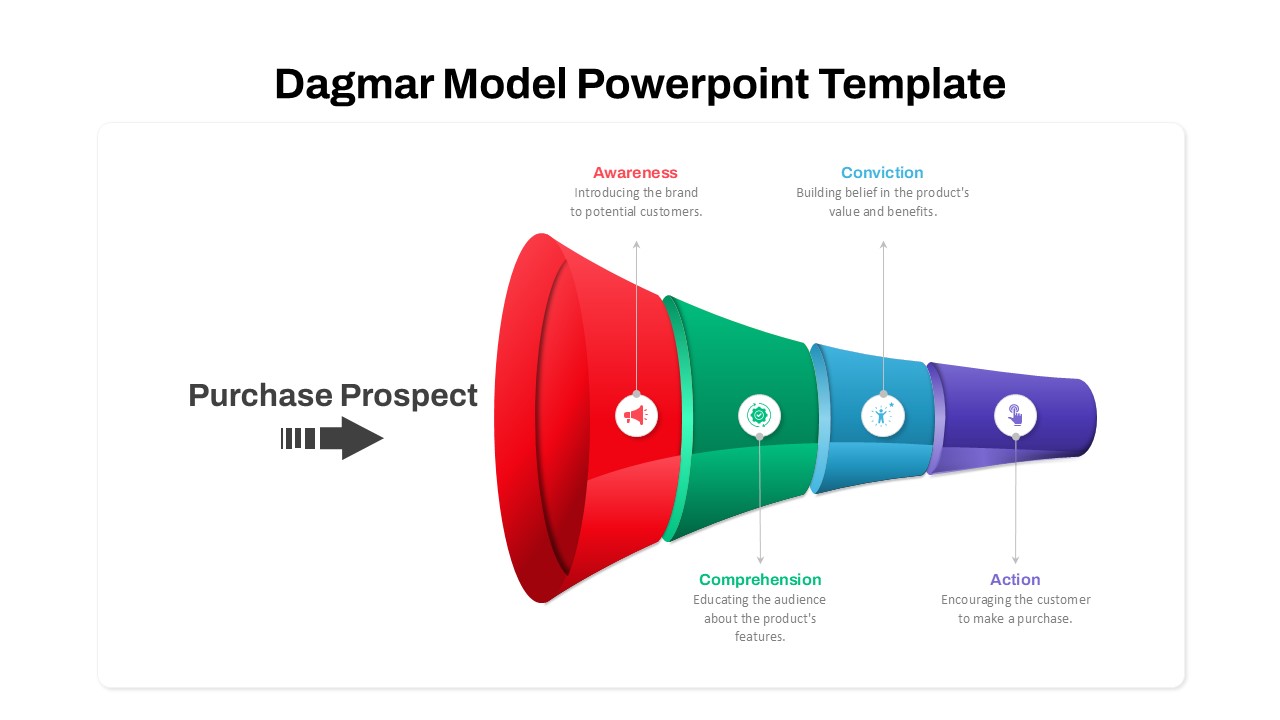
Dagmar Model Marketing Funnel Diagram Template for PowerPoint & Google Slides
Funnel
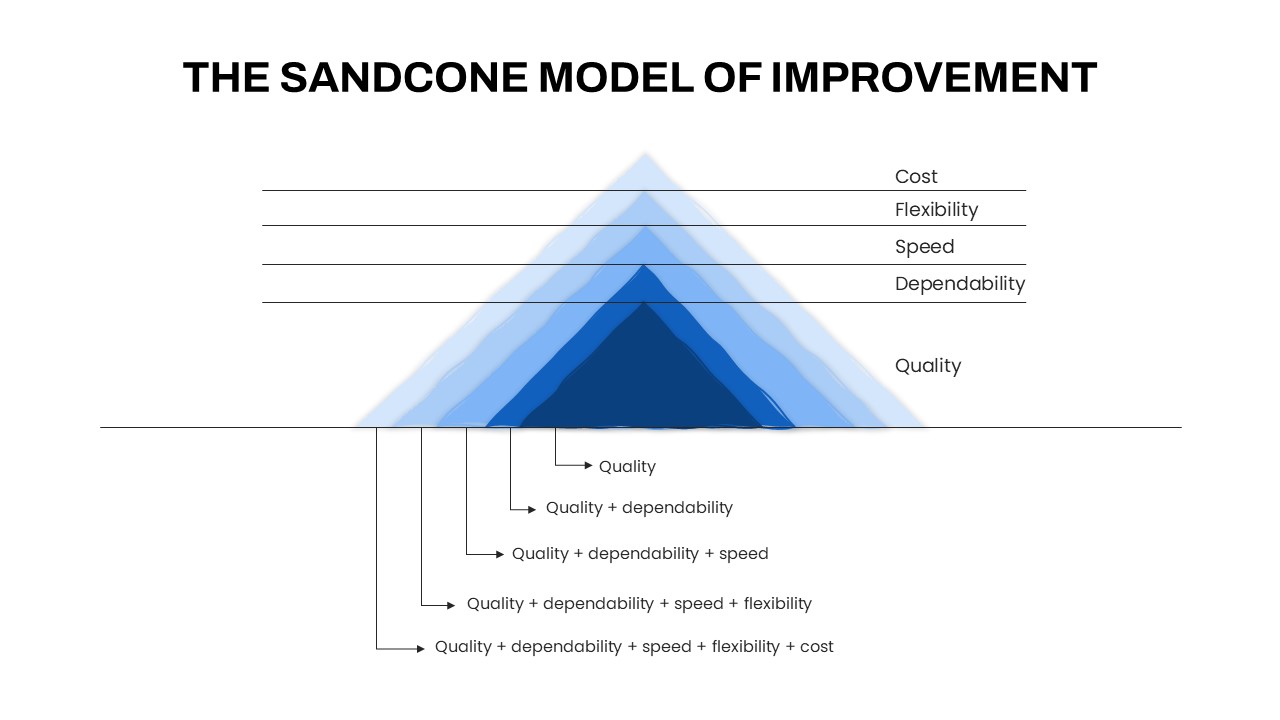
Sandcone Model of Improvement Diagram Template for PowerPoint & Google Slides
Pyramid
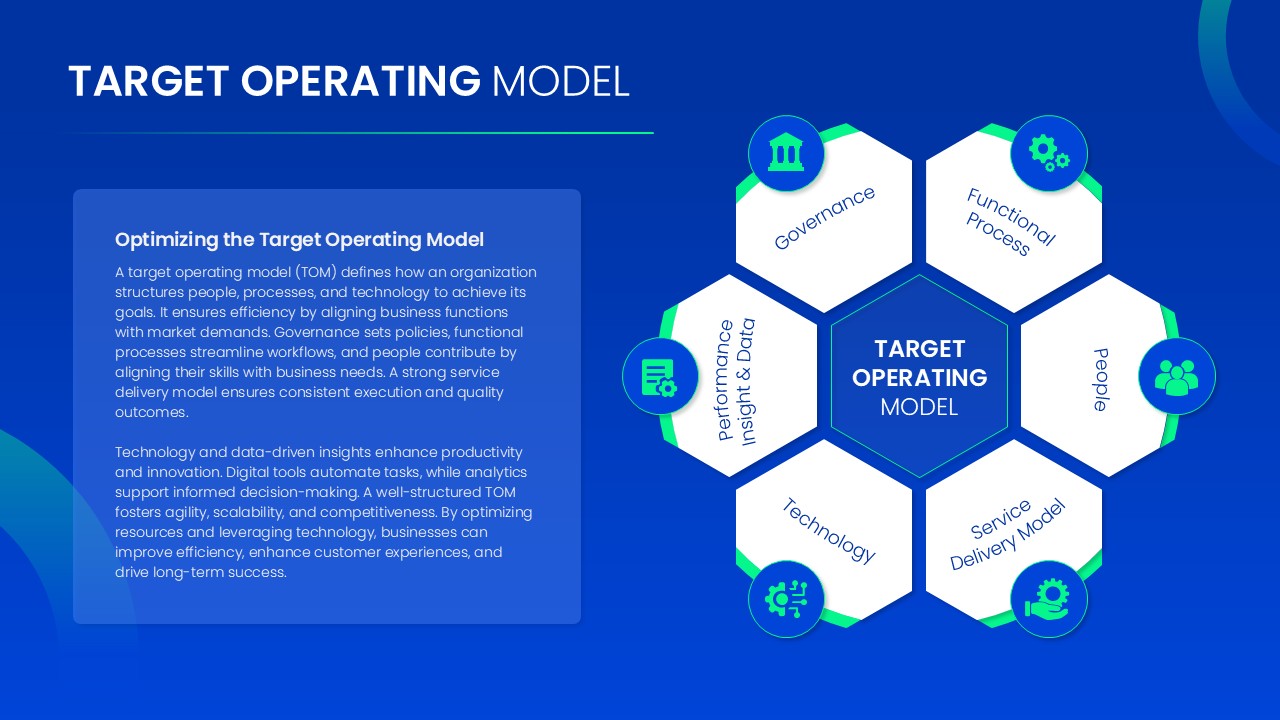
Target Operating Model Diagram Template for PowerPoint & Google Slides
Business Strategy
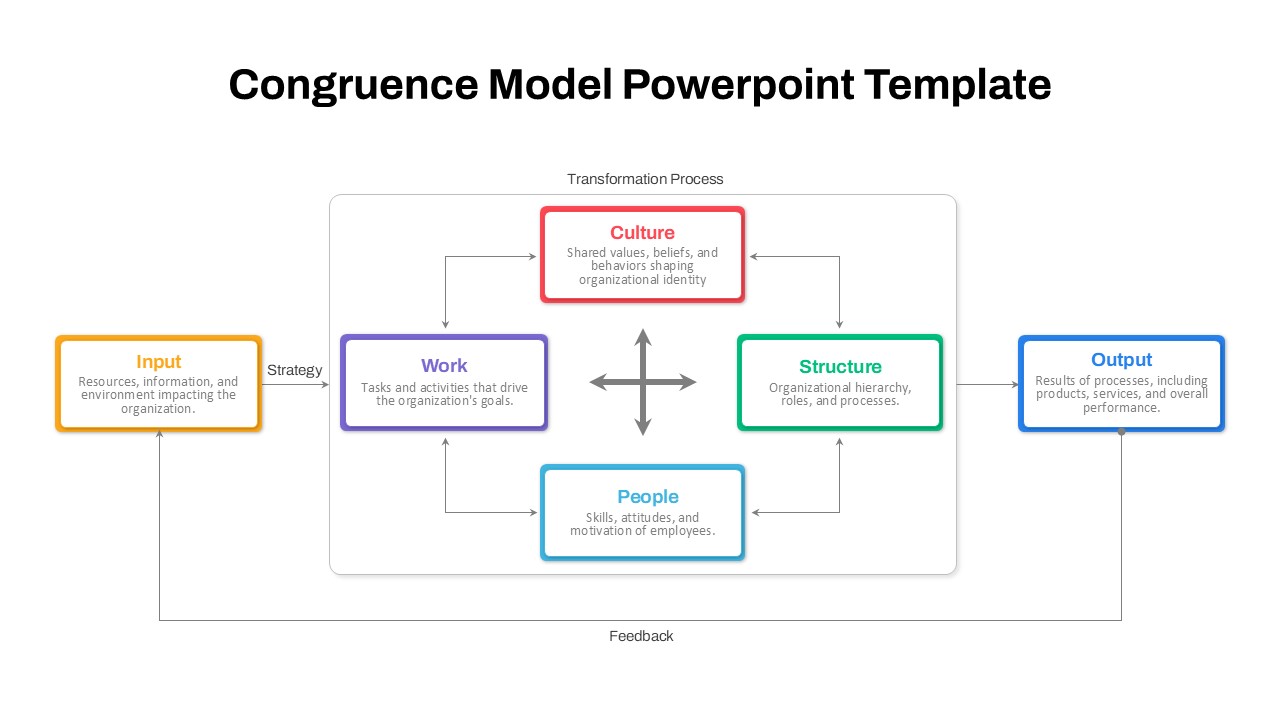
Organizational Congruence Model Diagram Template for PowerPoint & Google Slides
Process
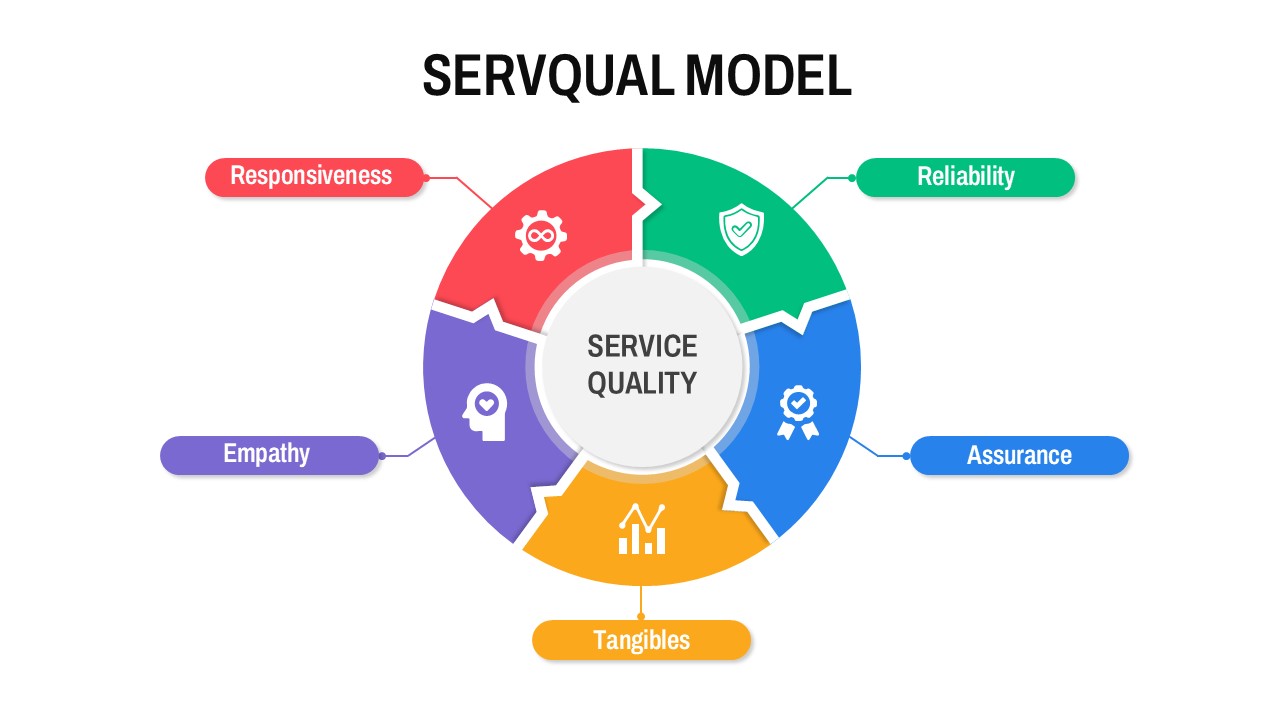
Circular SERVQUAL Model Diagram Template for PowerPoint & Google Slides
Business Strategy
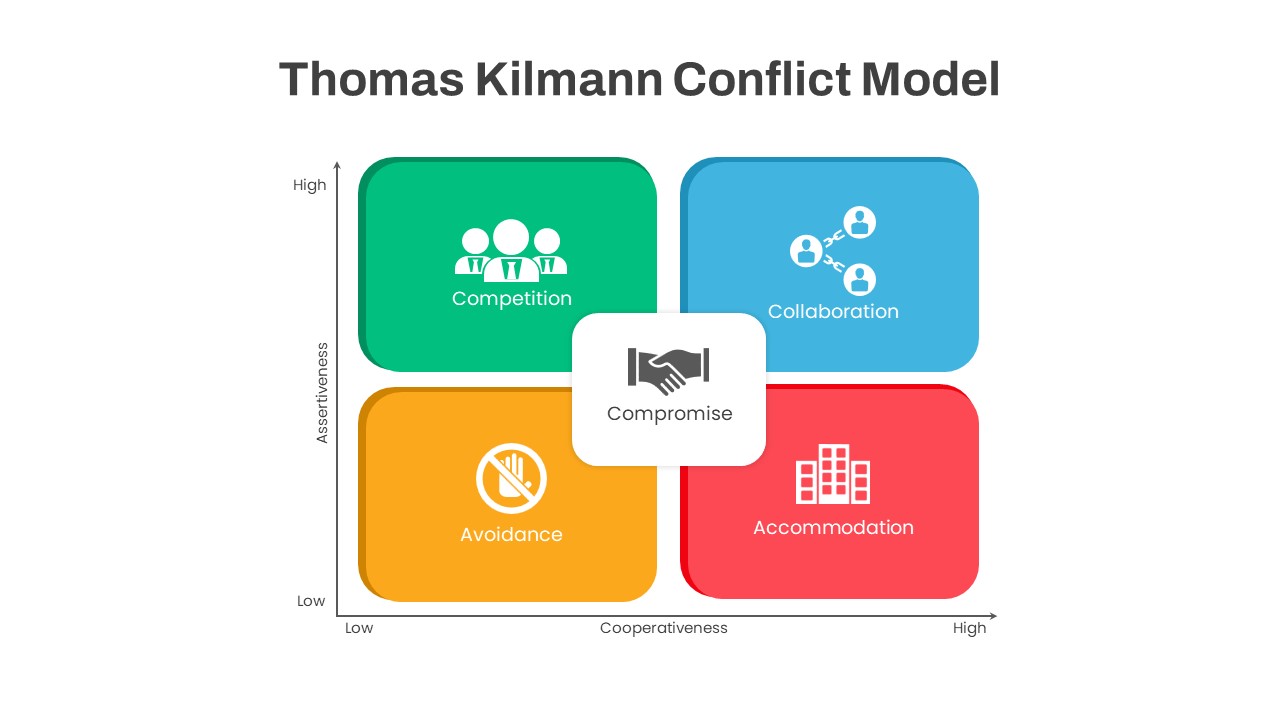
Thomas Kilmann Conflict Model Diagram Template for PowerPoint & Google Slides
Leadership
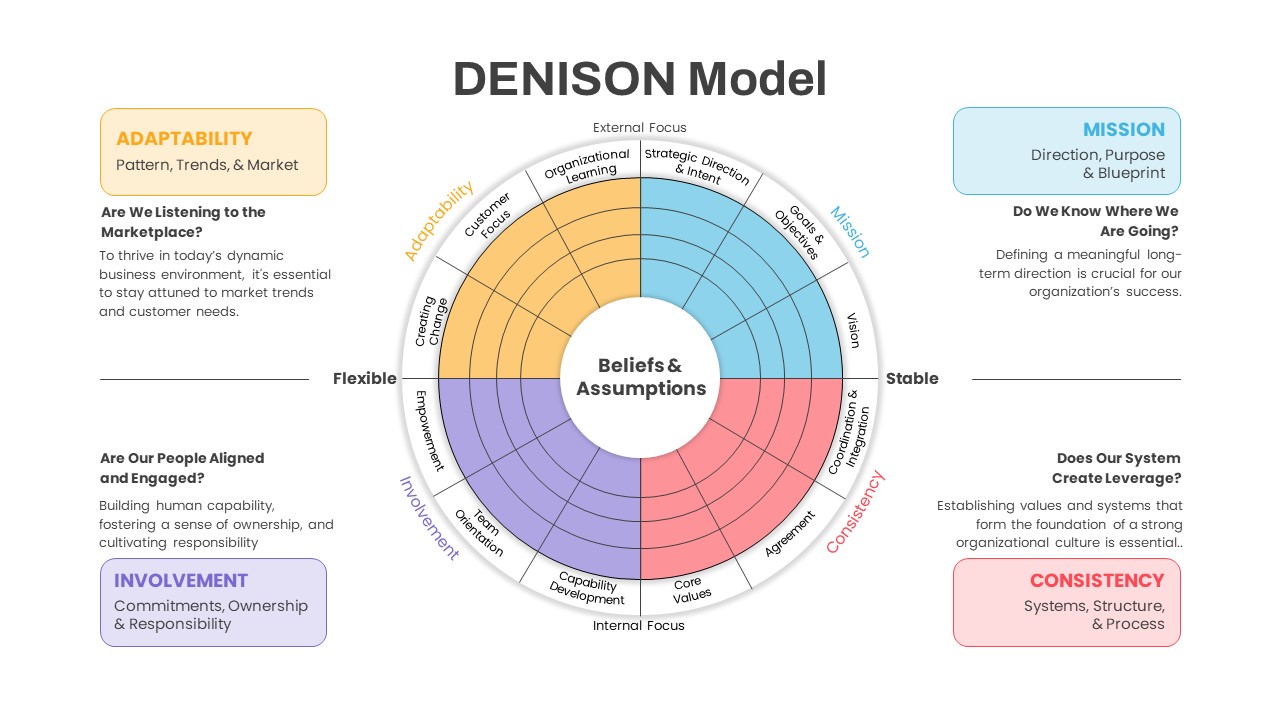
Denison Culture Model Wheel template for PowerPoint & Google Slides
Leadership
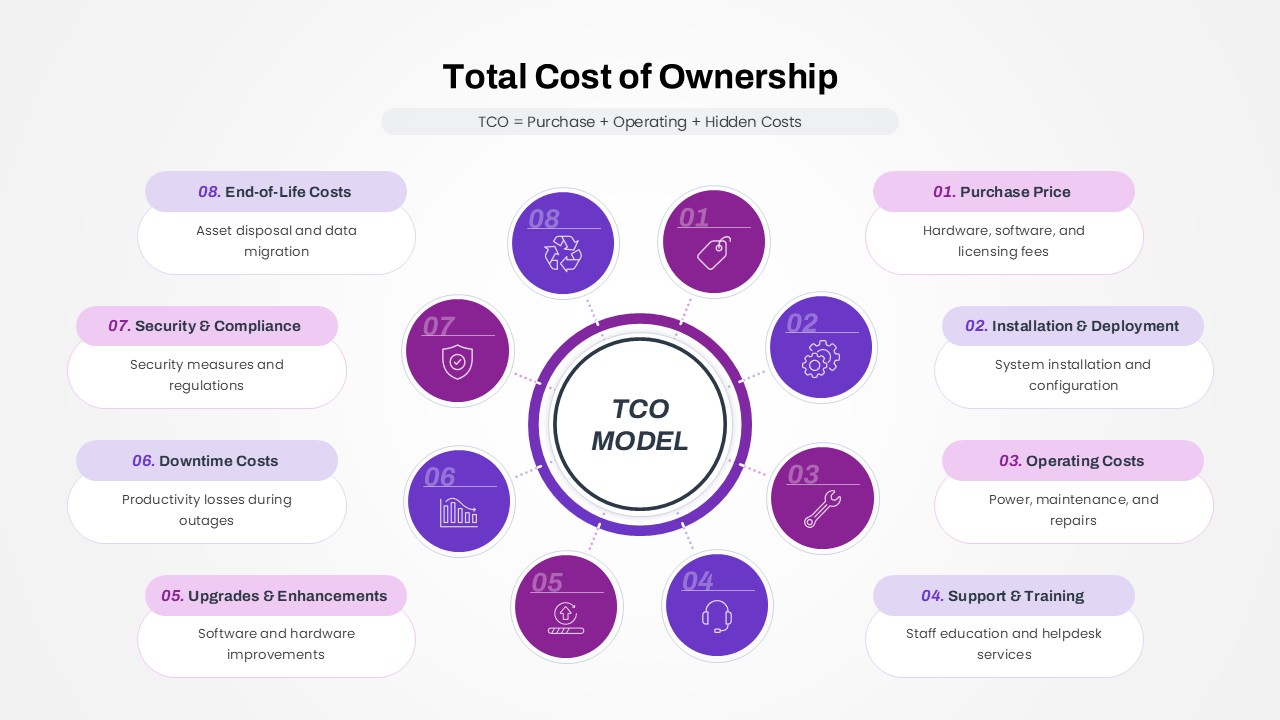
Total Cost of Ownership (TCO) Model template for PowerPoint & Google Slides
Business
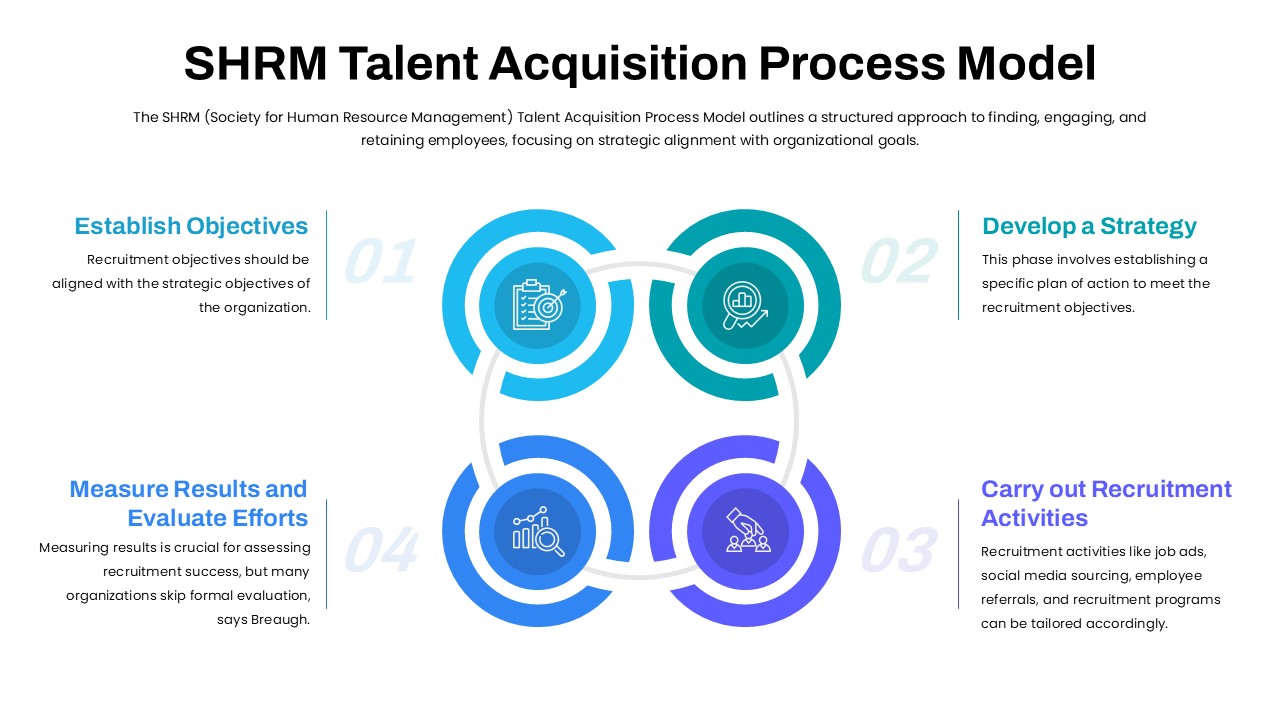
SHRM Talent Acquisition Process Model Template for PowerPoint & Google Slides
Business Models
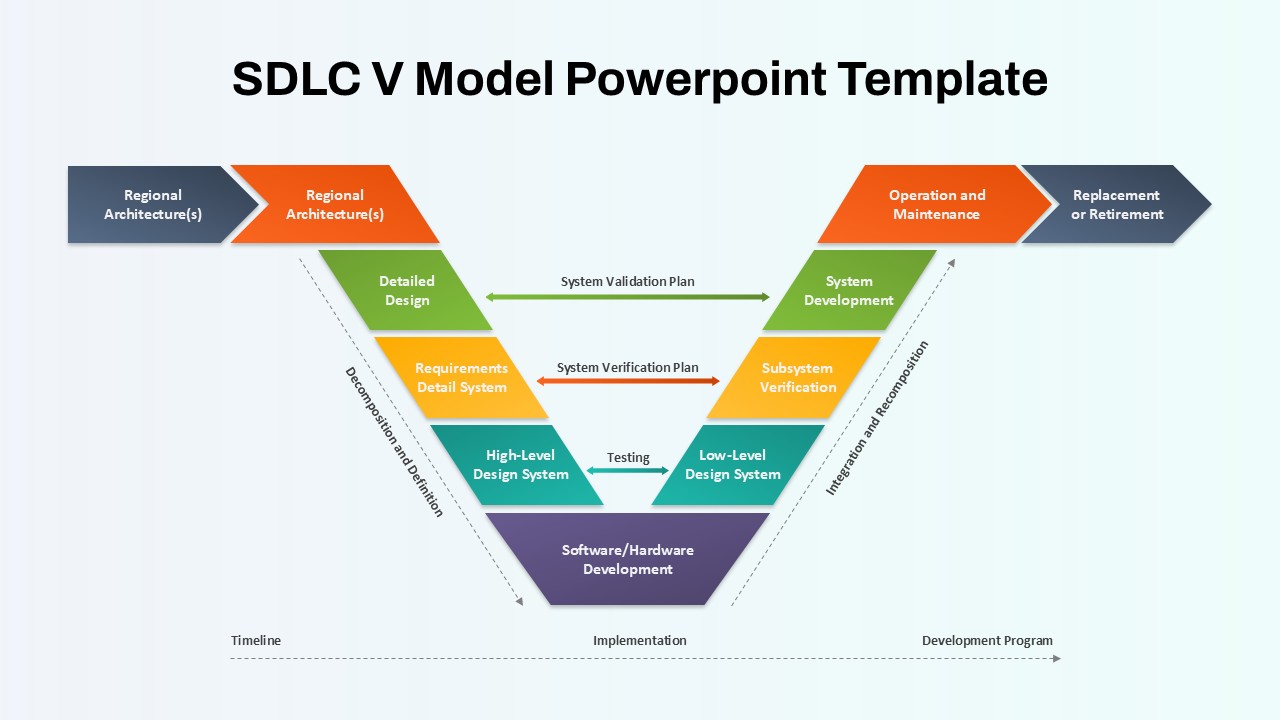
SDLC V Model Lifecycle Diagram Template for PowerPoint & Google Slides
Process
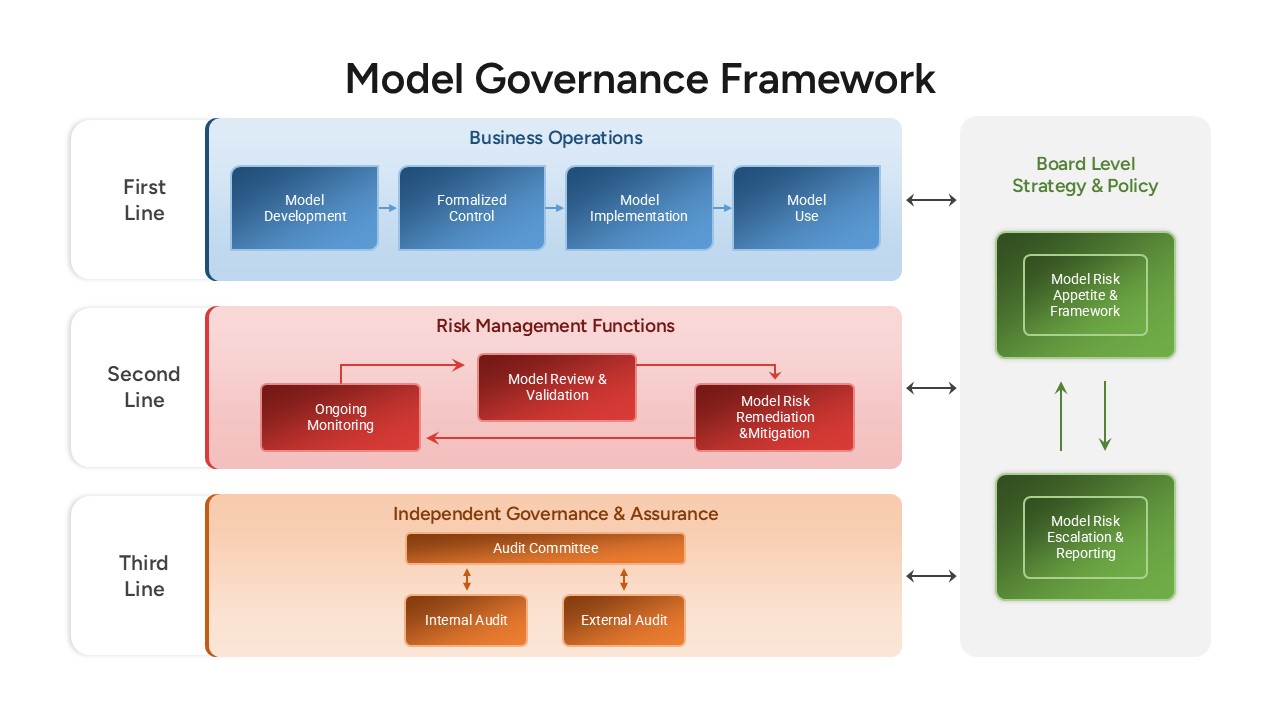
Model Governance Framework Template for PowerPoint & Google Slides
Risk Management
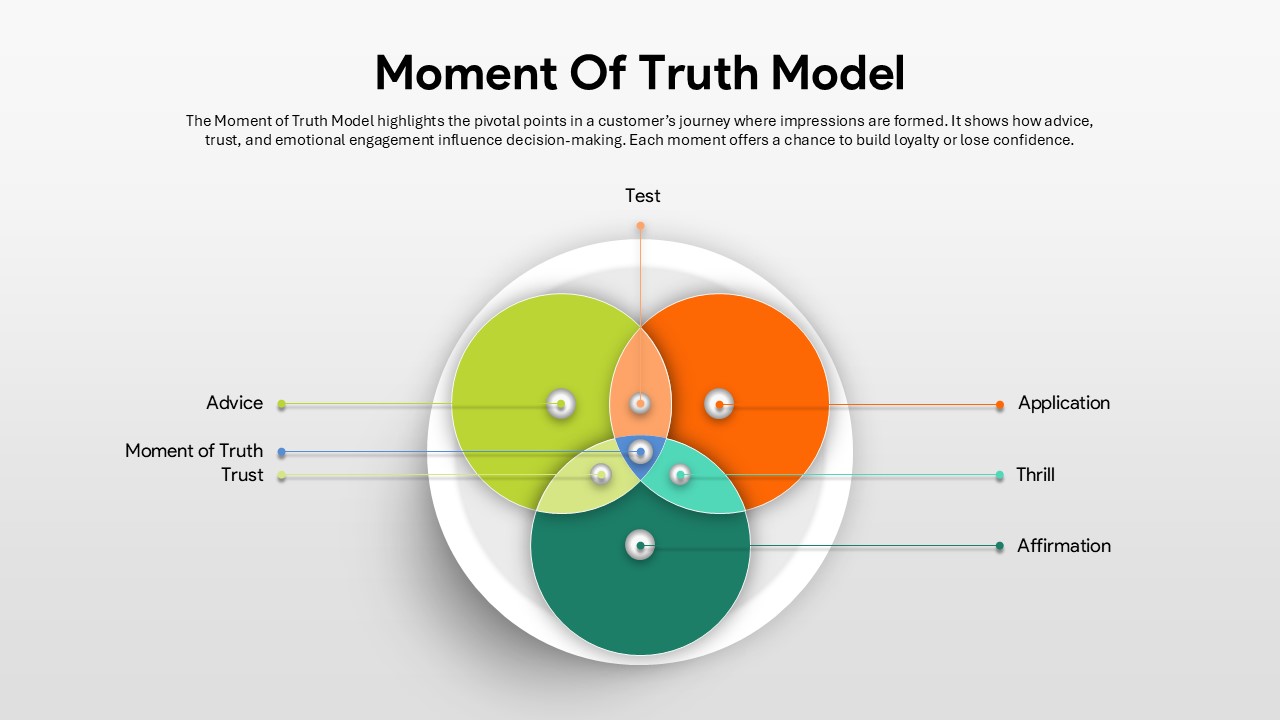
Moment of Truth Model Overview template for PowerPoint & Google Slides
Process
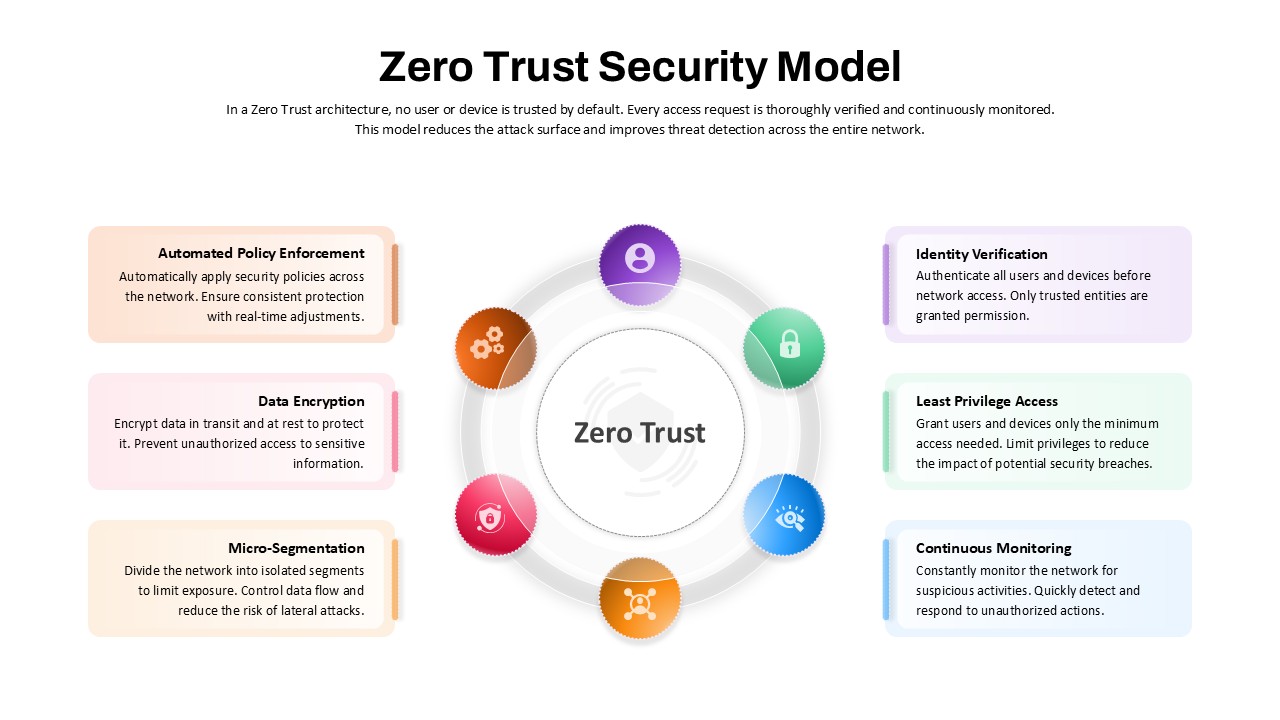
Zero Trust Security Model Overview template for PowerPoint & Google Slides
Risk Management
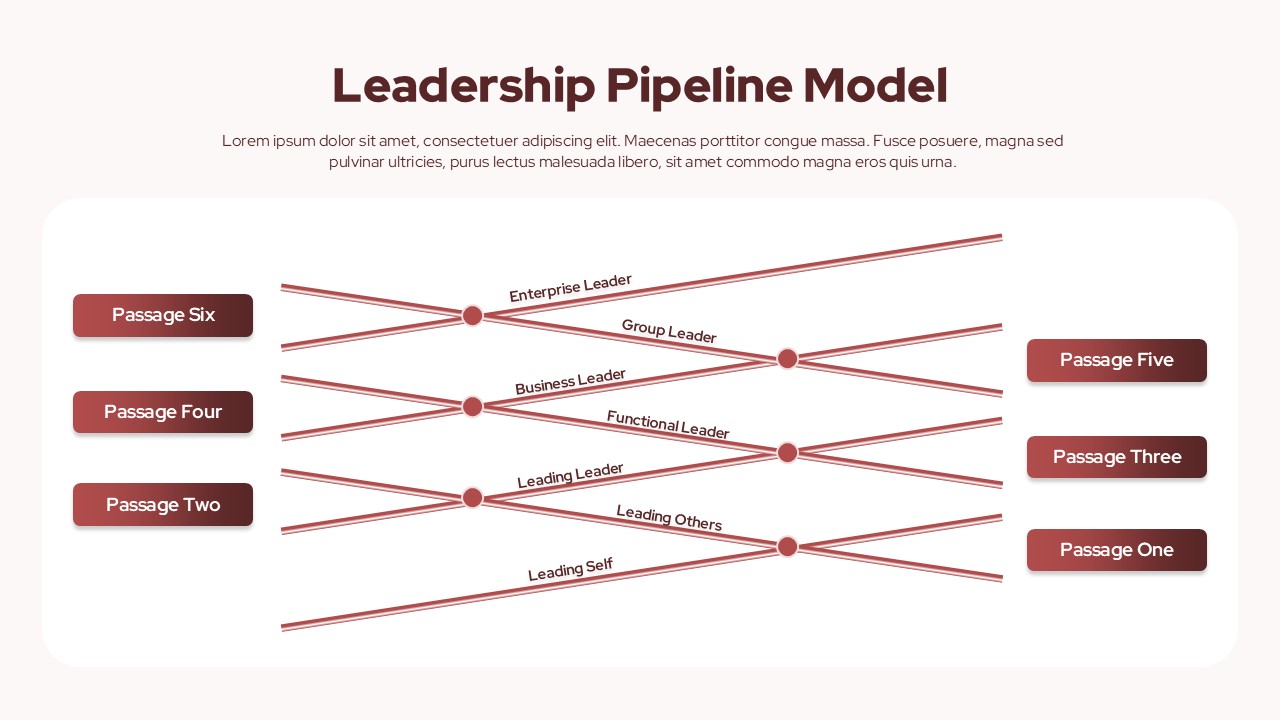
Leadership Pipeline Model Overview template for PowerPoint & Google Slides
Leadership
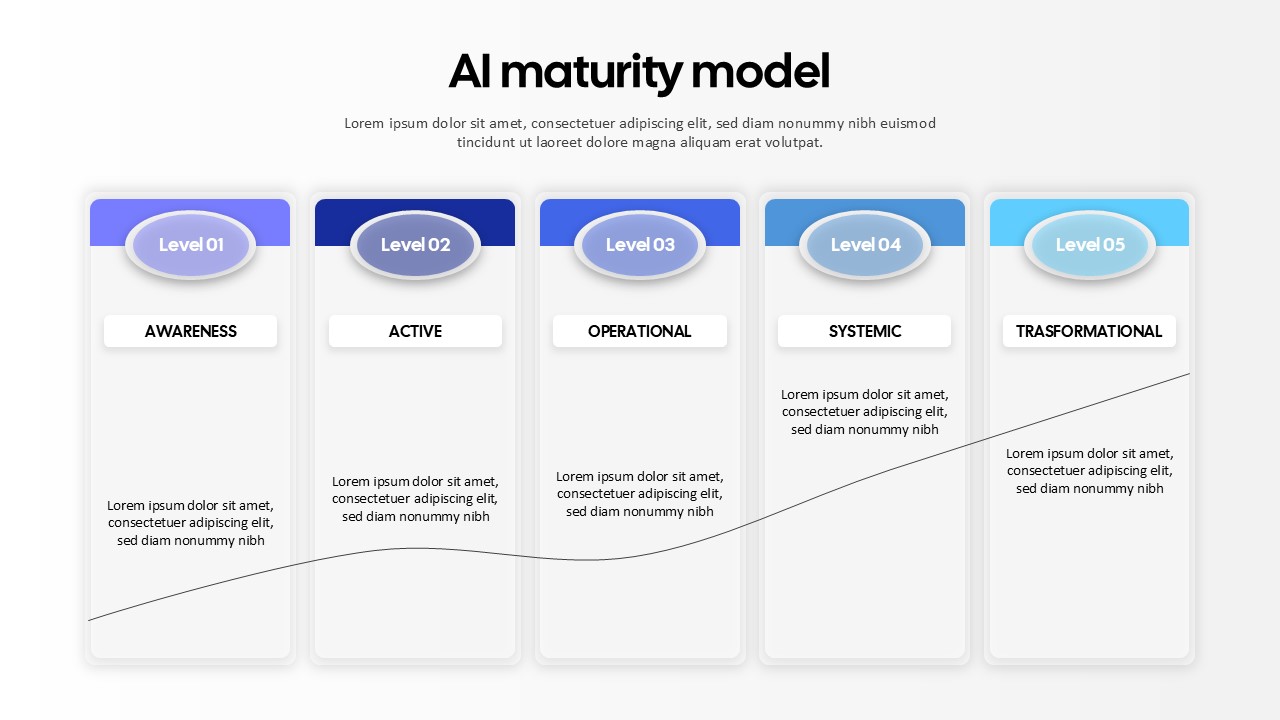
AI Maturity Model Levels template for PowerPoint & Google Slides
Technology
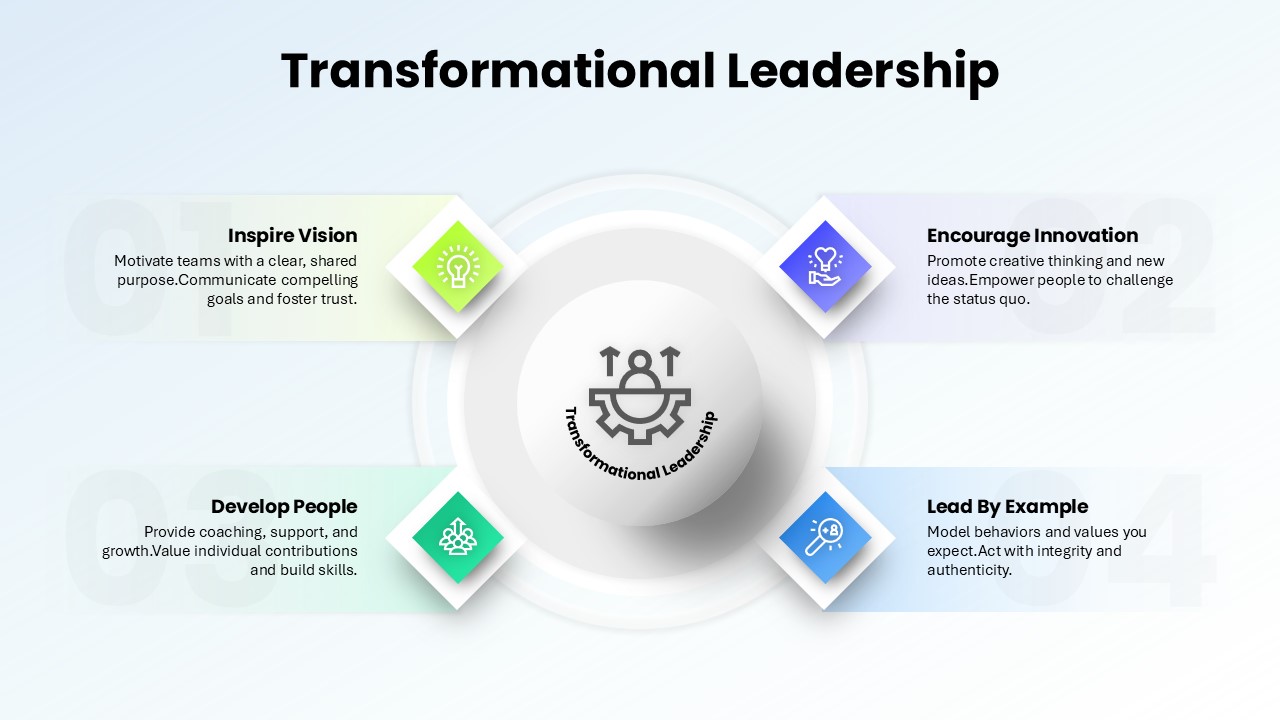
Transformational Leadership Model Template for PowerPoint & Google Slides
Leadership
Machine Learning Model Management Template for PowerPoint & Google Slides
Machine Learning
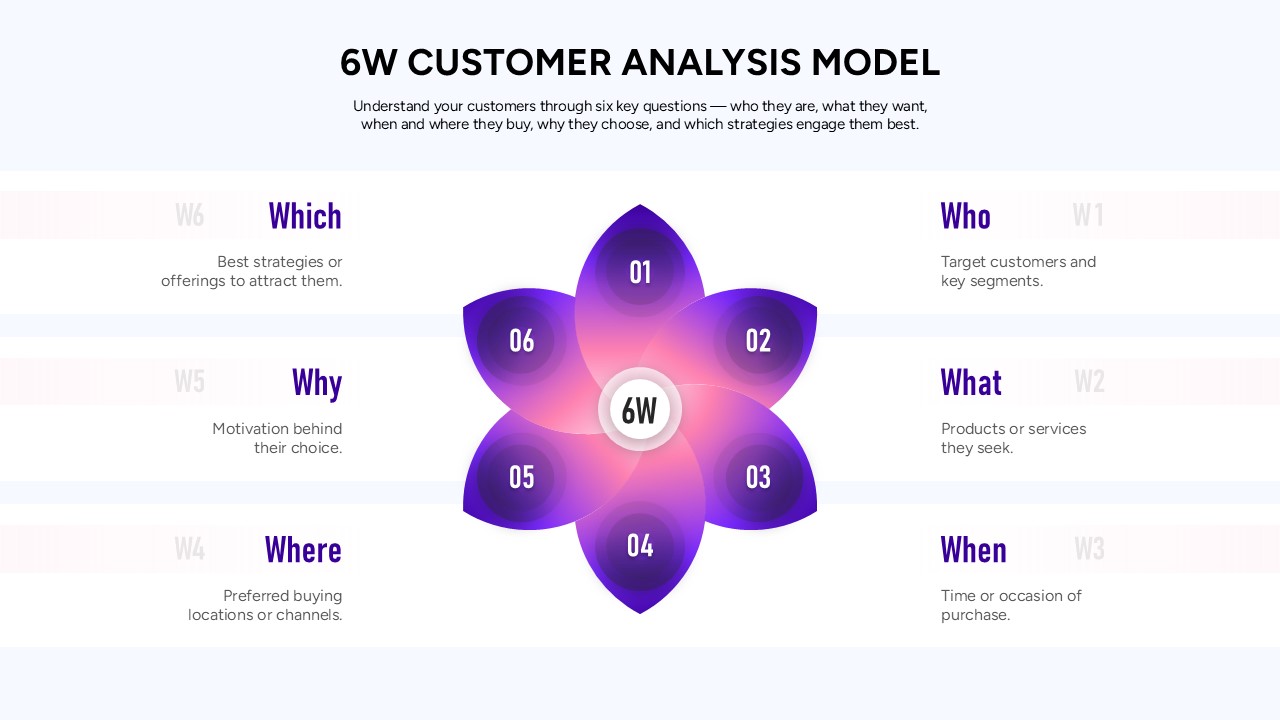
6W Customer Analysis Model Template for PowerPoint & Google Slides
Customer Experience
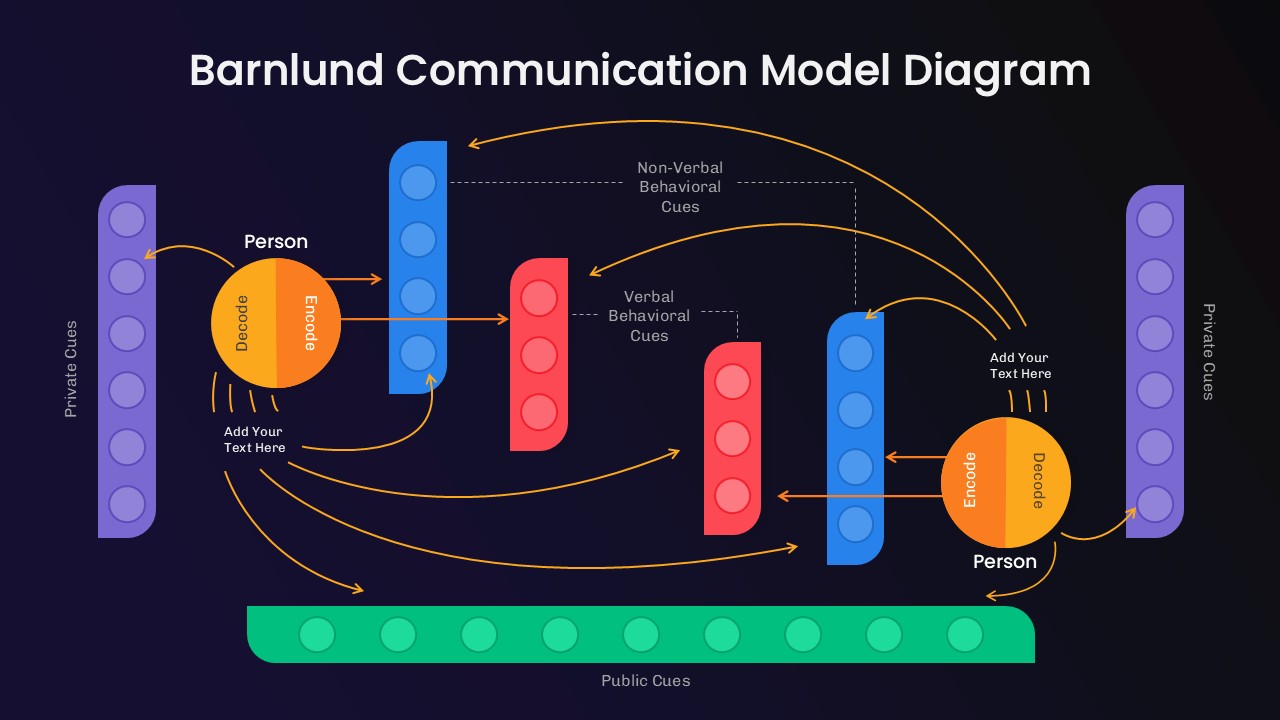
Barnlund Communication Model Diagram Template for PowerPoint & Google Slides
Process
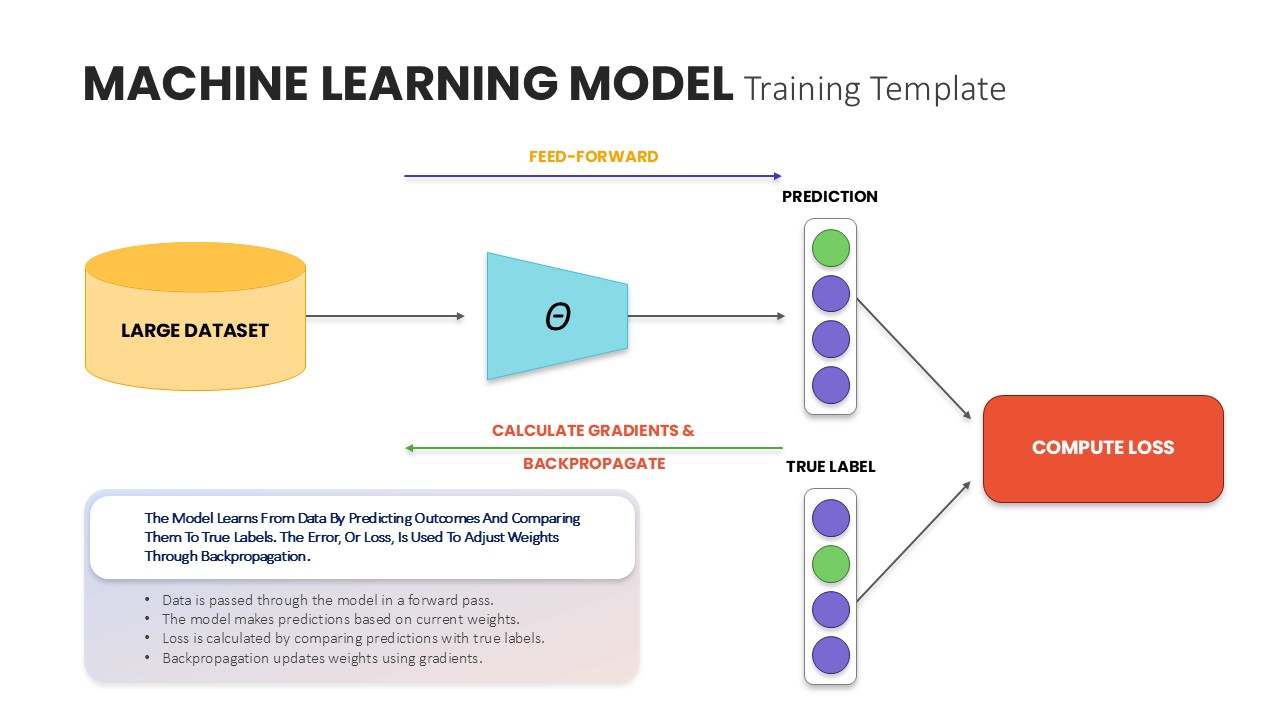
Machine Learning Model Training Template for PowerPoint & Google Slides
Machine Learning
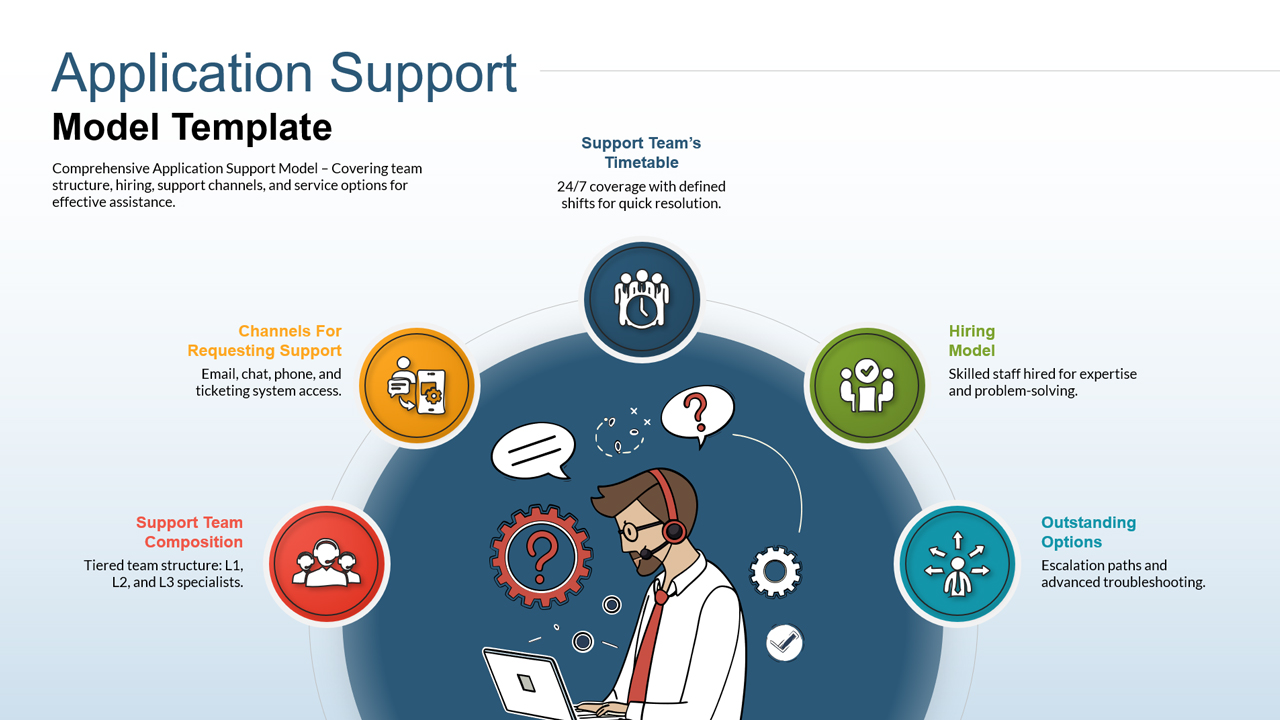
Application Support Operating Model Framework Slide Template for PowerPoint & Google Slides
Information Technology