Data-Driven Marketing Cycle Diagram Template for PowerPoint & Google Slides

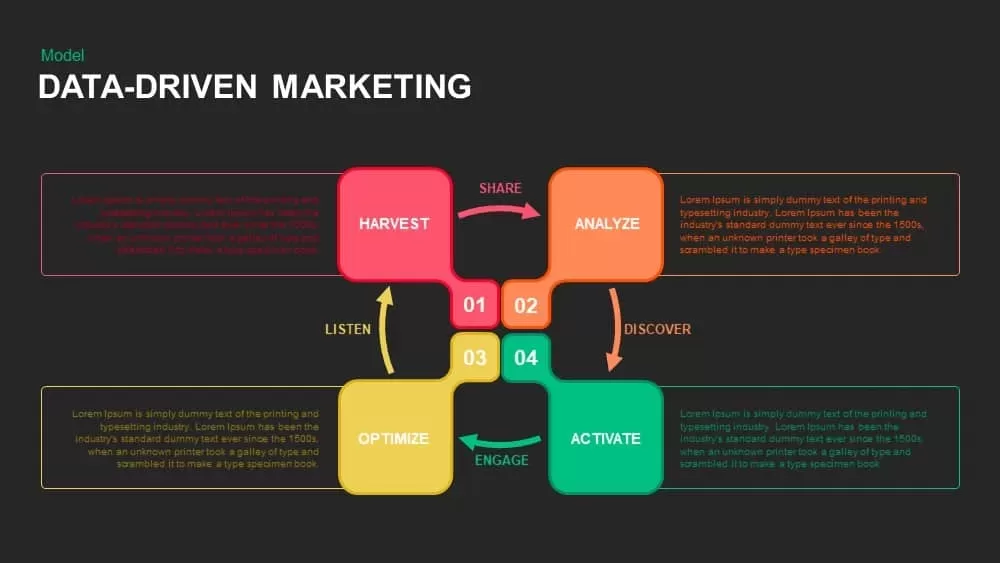
Leverage this data-driven marketing model to illustrate a continuous four-phase digital marketing cycle, emphasizing the flow of customer engagement and optimization. The slide features four bold, interlocking squares—Harvest (vibrant red), Analyze (bright orange), Activate (emerald green), and Optimize (sunny yellow)—arranged in a clockwise loop. Each quadrant is clearly labeled with a numeric badge and flanked by textual callouts that extend at right angles, creating a balanced layout that highlights strategic insights at a glance. Dynamic curved arrows labeled SHARE, DISCOVER, ENGAGE, and LISTEN interconnect the segments, guiding viewers through the process path. Crisp typography, flat iconography, and a pristine white background ensure maximum readability and a modern aesthetic.
Customize every element with ease in PowerPoint and Google Slides. Replace placeholder icons with custom graphics from the integrated library, update text placeholders with campaign details, and tailor color themes to match corporate branding. Vector-based shapes guarantee razor-sharp visuals at any size, while master slide layouts ensure consistent styling throughout your presentation. Use grouped and named objects to accelerate editing, and apply built-in transitions or custom animations to reveal each stage sequentially for added impact.
This template supports advanced annotations and data overlays. Insert smart text boxes to call out key performance indicators or campaign metrics directly next to each quadrant. Leverage connector lines and arrowheads to depict customer touchpoints, feedback loops, or integration points with analytics platforms. Add subtle drop shadows or gradient overlays to emphasize priority stages, or adjust opacity for layered comparisons. All fonts, icons, and color palettes are fully editable, enabling swift adaptation for stakeholder workshops, boardroom briefings, or client pitches.
Who is it for
Marketing managers, digital strategists, and data analysts will benefit from this diagram when crafting and presenting data-intensive marketing strategies. Growth marketers, campaign managers, and customer experience teams can leverage the clear four-phase layout to align on acquisition tactics, engagement workflows, and optimization roadmaps. Consultants and trainers can also use this slide to illustrate continuous improvement models in executive briefings and workshops.
Other Uses
Beyond marketing, repurpose this layout to map product development cycles, customer journey loops, or operational feedback processes. Use the four-stage loop to depict software release sprints, training modules, or risk management frameworks. Simply swap labels, icons, and callout text to visualize any cyclical workflow or strategic model across industries.
Login to download this file

Item ID
SB00852
Related Templates

Data-Driven Marketing Lifecycle Diagram Template for PowerPoint & Google Slides
Process
Data-Driven Sales Strategy Diagram Template for PowerPoint & Google Slides
Marketing

Data-Driven Line Chart Diagram Template for PowerPoint
Comparison Chart
Data-driven GDP Growth Infographic Pack Template for PowerPoint & Google Slides
Infographics
Data-Driven AI in Insurance Infographic Template for PowerPoint & Google Slides
Circular
Data-Driven Decision Making overview template for PowerPoint & Google Slides
Business
Data Migration Life Cycle Curved Diagram Template for PowerPoint & Google Slides
Process
Excel-Driven Gradient Timeline Chart Template for PowerPoint & Google Slides
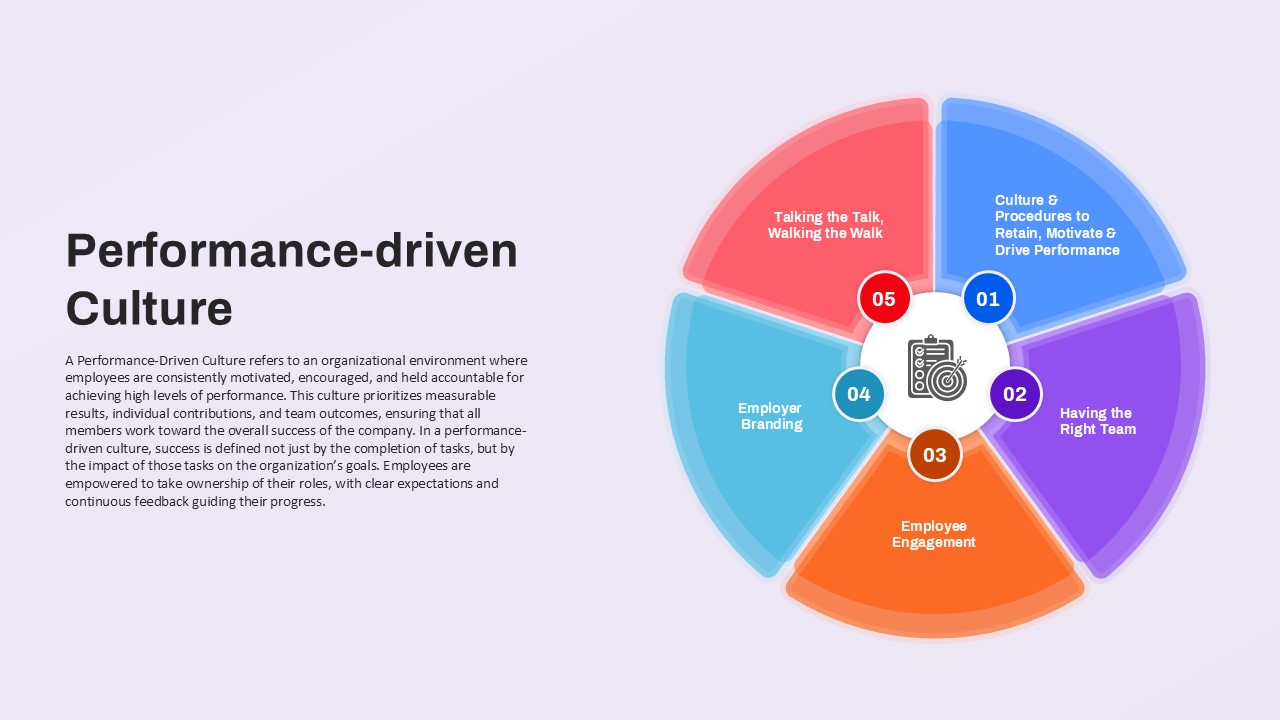
Performance-driven Culture framework template for PowerPoint & Google Slides
Leadership
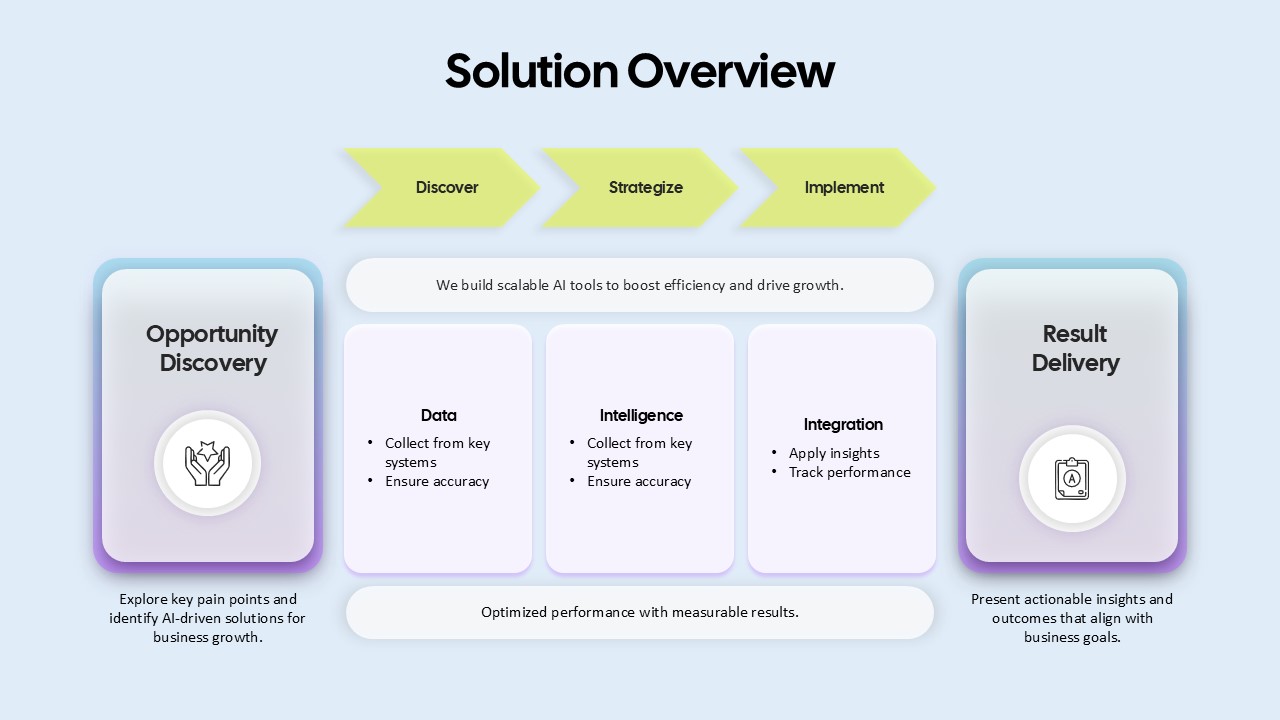
AI-Driven Solution Overview for PowerPoint & Google Slides
AI
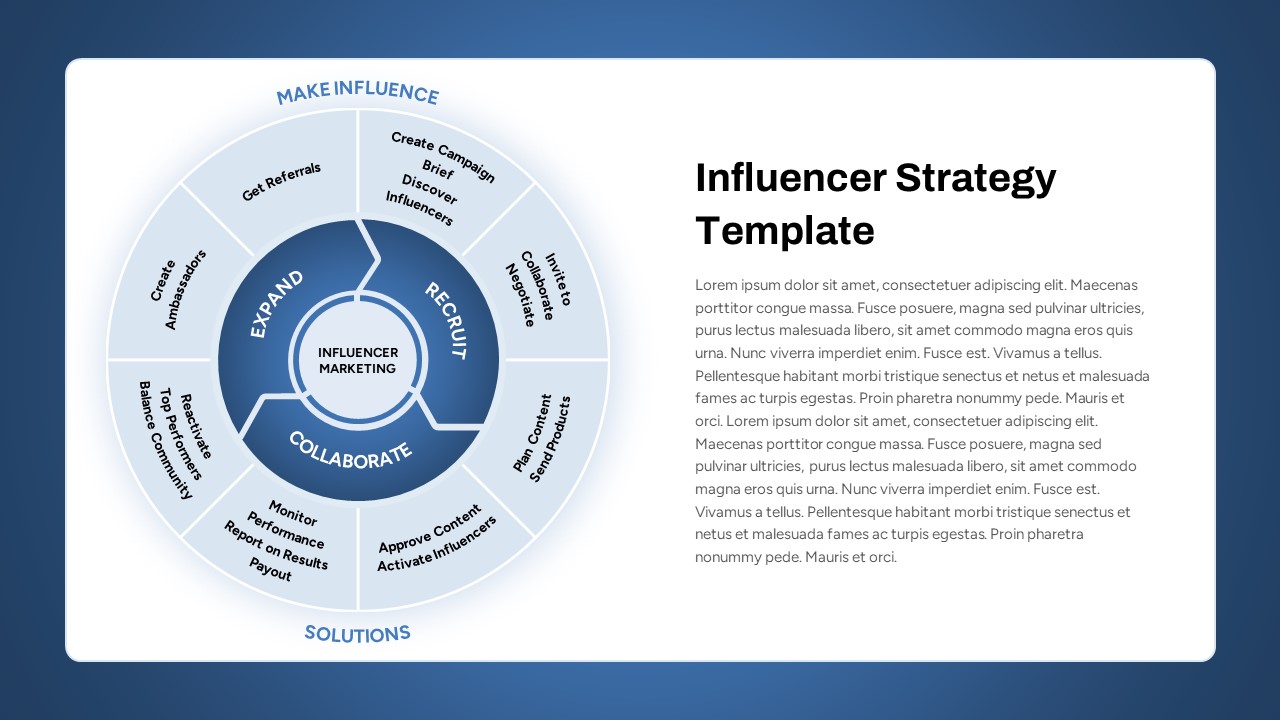
Influencer Marketing Cycle Strategy Template for PowerPoint & Google Slides
Circular
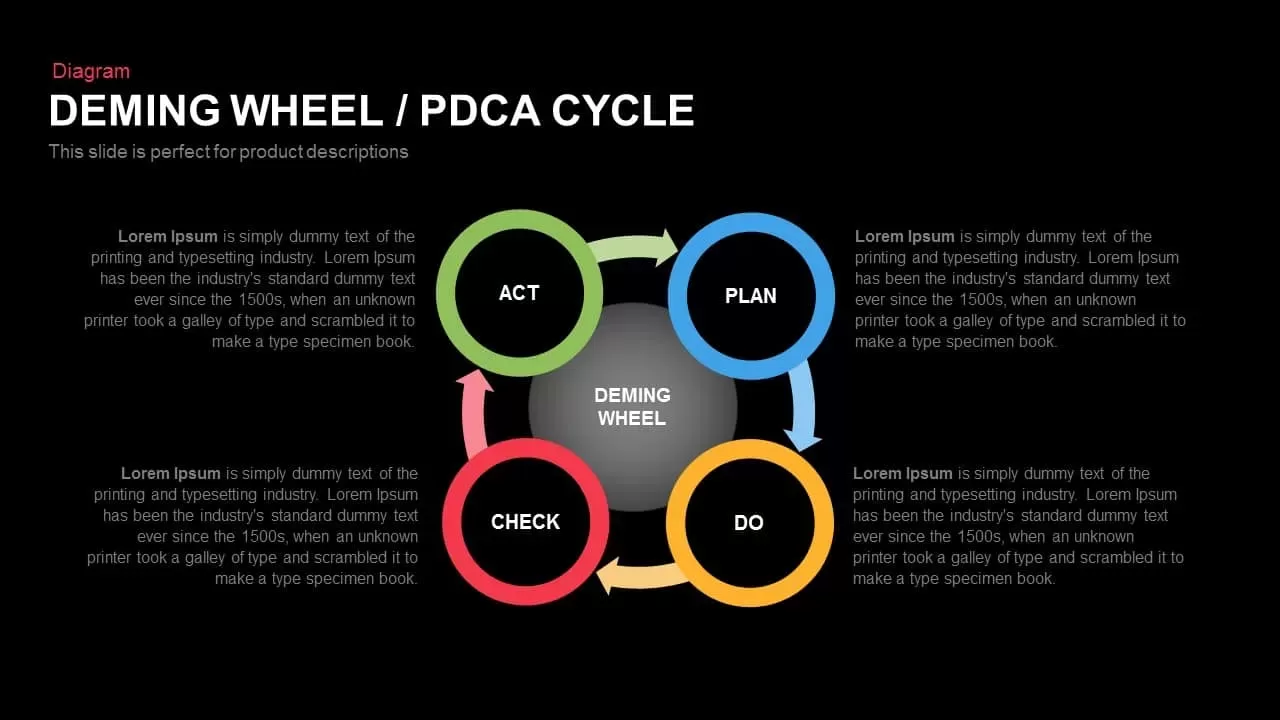
Deming Wheel PDCA Cycle Diagram Template for PowerPoint & Google Slides
Business Plan
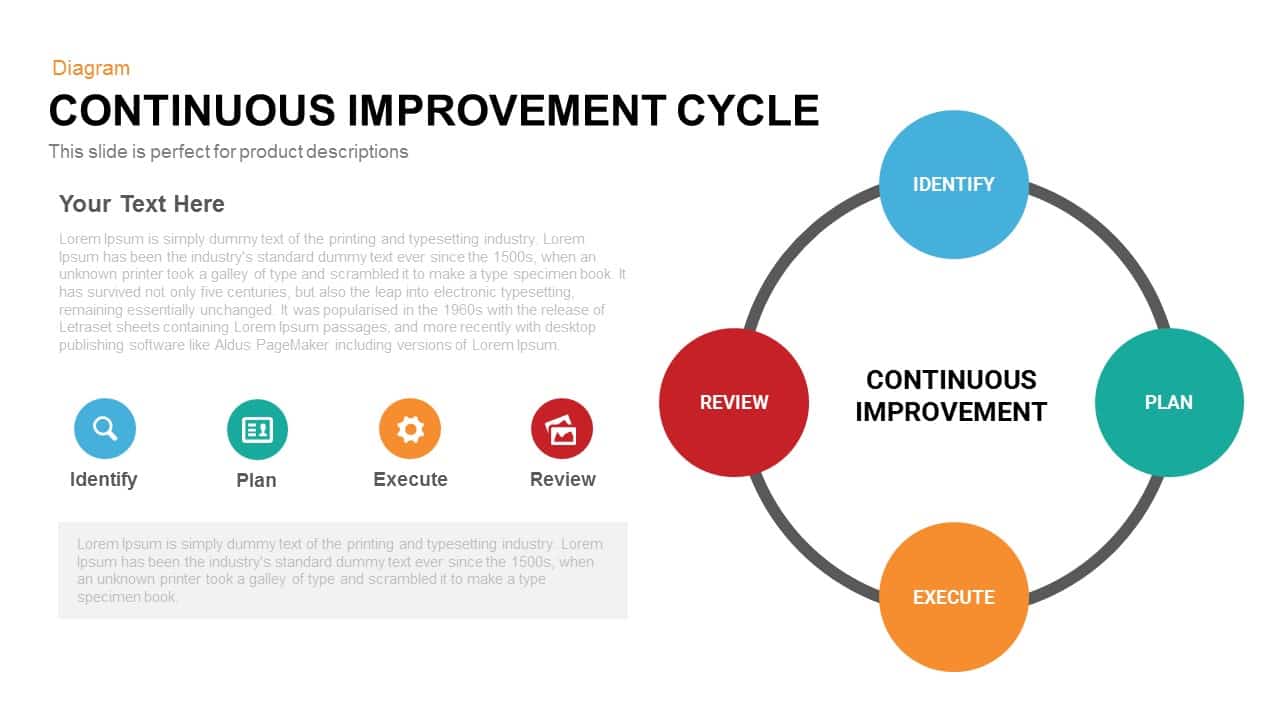
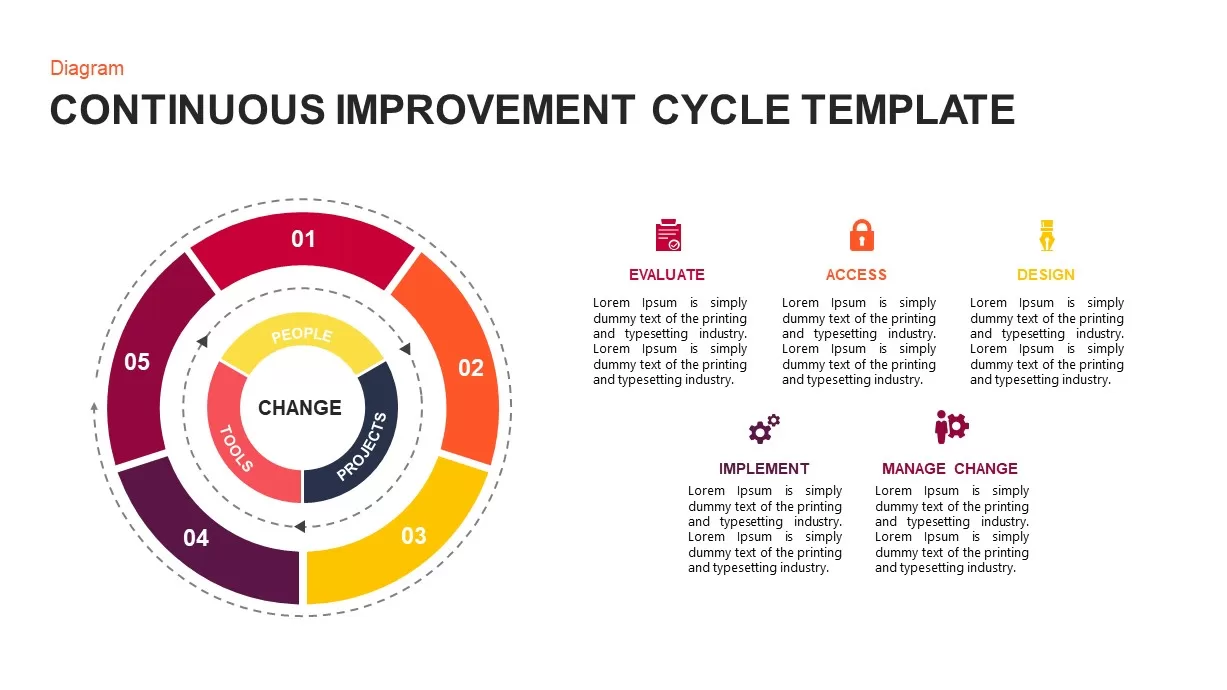
Continuous Improvement Cycle Diagram Template for PowerPoint & Google Slides
Circular
Modern Five-Stage Cycle Process Diagram Template for PowerPoint & Google Slides
Process
Six-Stage Circular Cycle Diagram Template for PowerPoint & Google Slides
Process
Four-Point Arrow Cycle Diagram Template for PowerPoint & Google Slides
Arrow
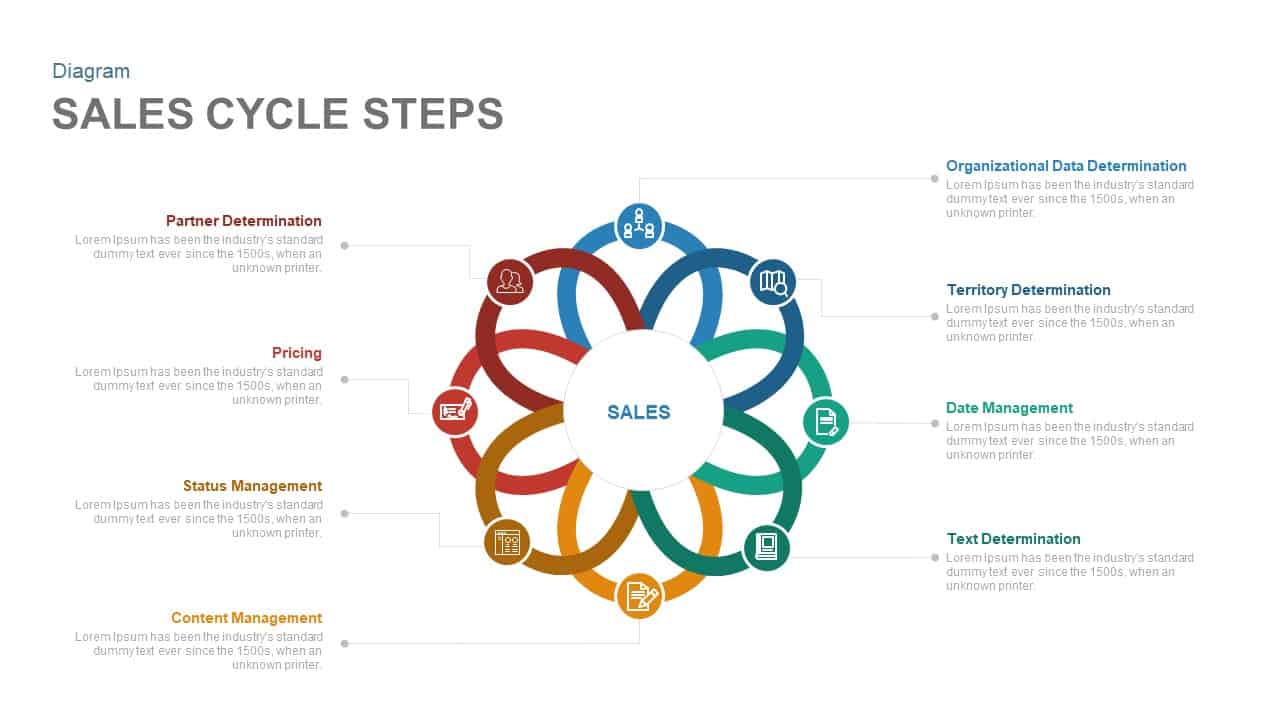
Eight-Step Sales Cycle Diagram Template for PowerPoint & Google Slides
Process
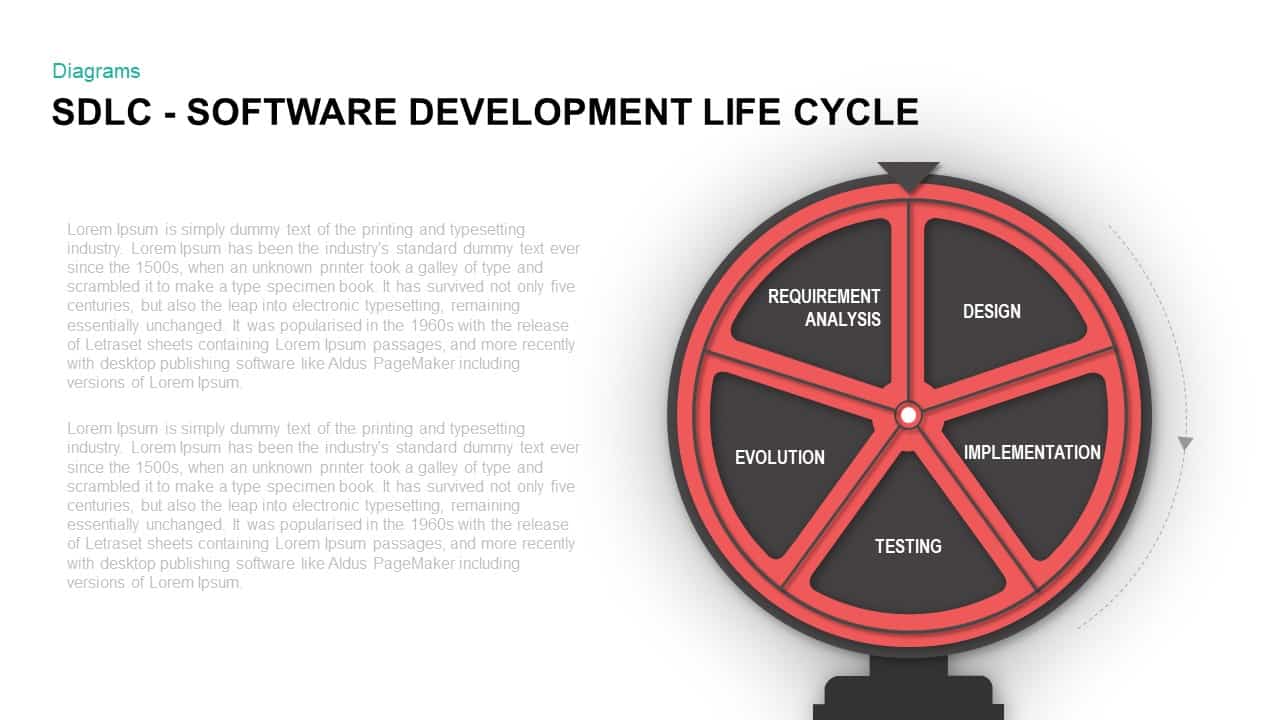
Software Development Life Cycle Diagram Template for PowerPoint & Google Slides
Circular
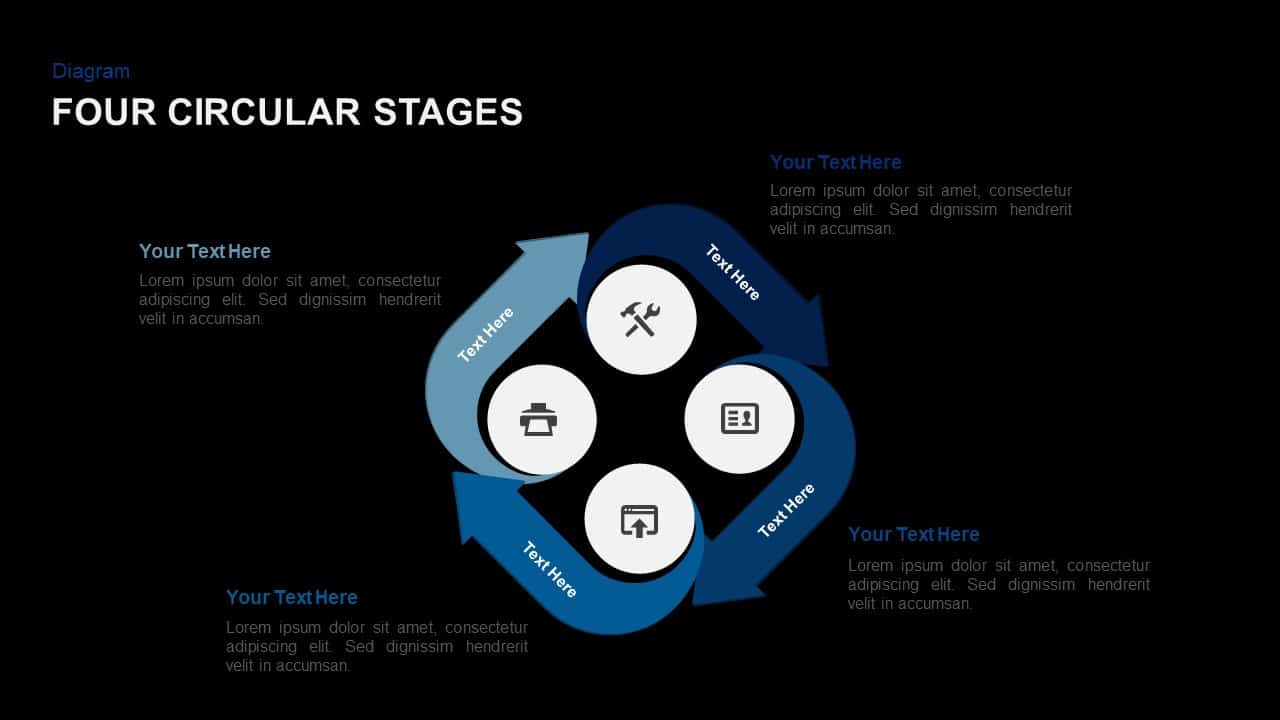
3, 4 & 5 Circular Stages Cycle Diagram Deck Template for PowerPoint & Google Slides
Circular
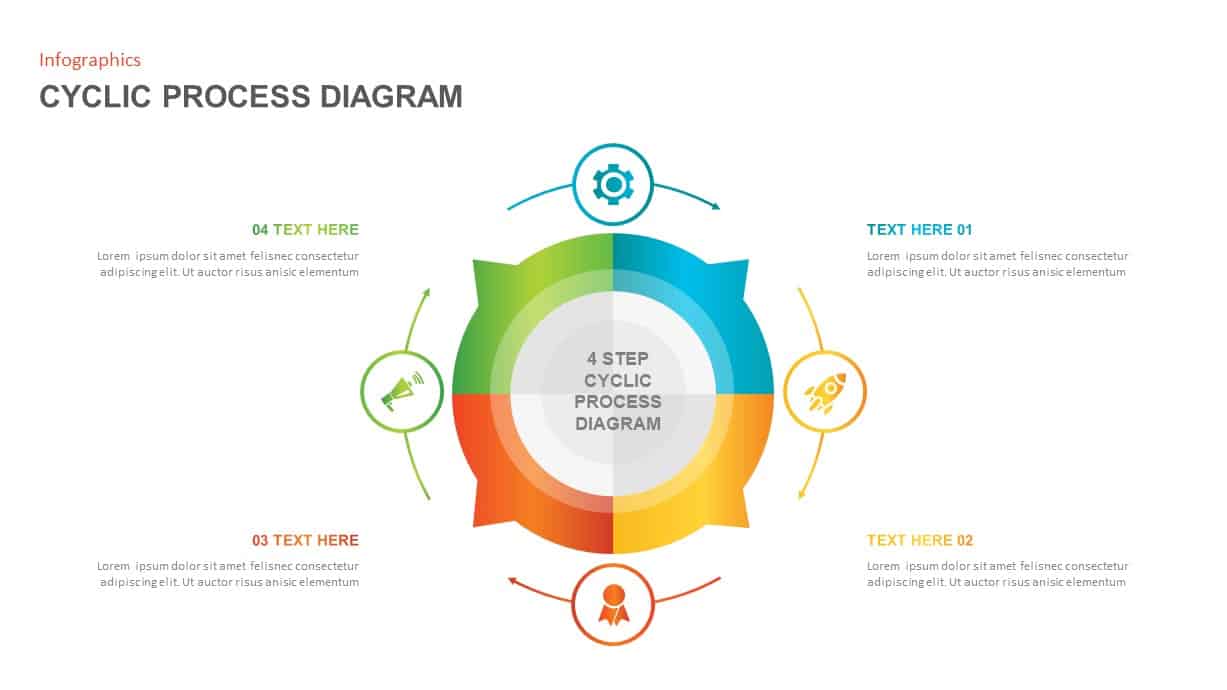
Four-Stage Cycle Process Diagram Template for PowerPoint & Google Slides
Process
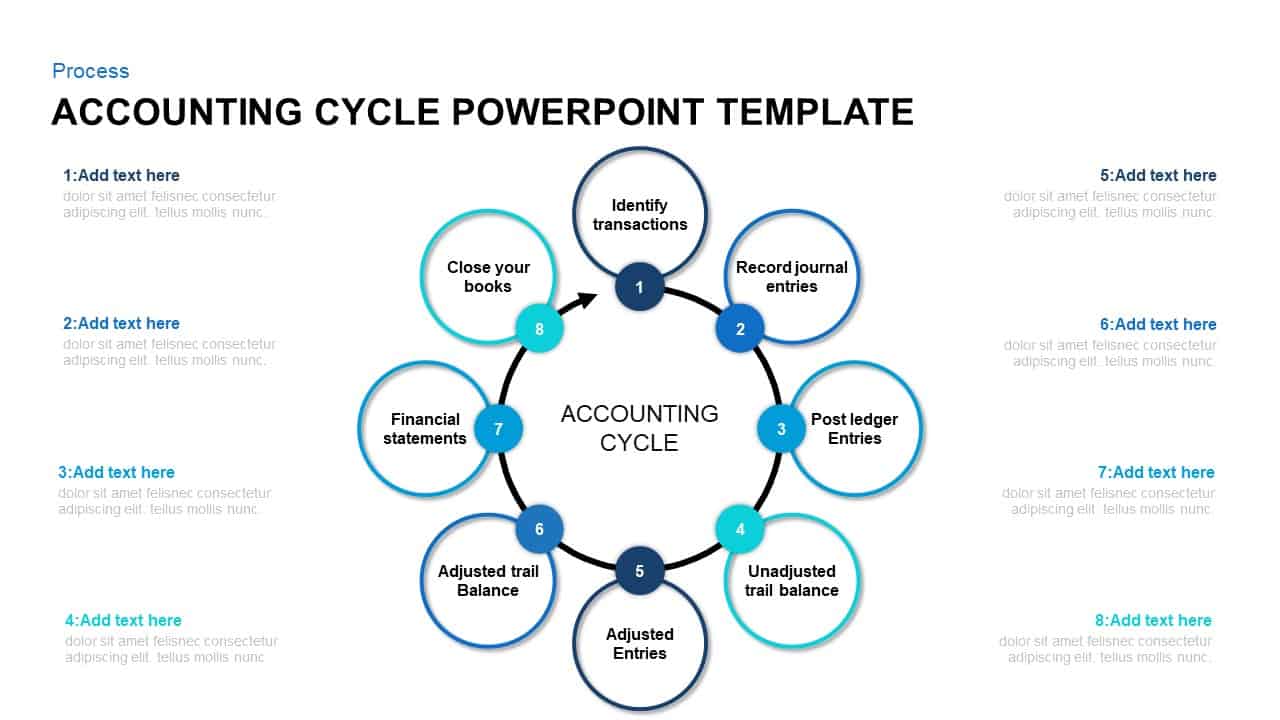
8-Step Circular Accounting Cycle Diagram Template for PowerPoint & Google Slides
Accounting
Multi-Style Project Life Cycle Diagram Template for PowerPoint & Google Slides
Process
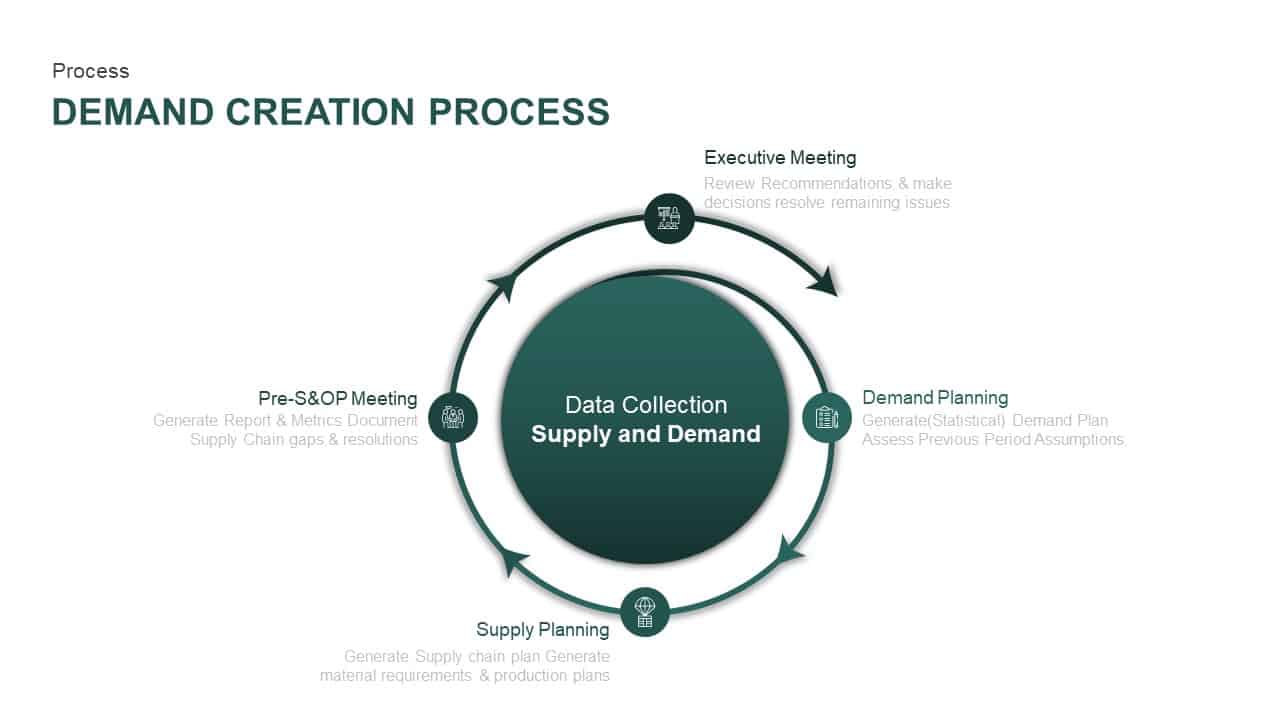
Supply and Demand Creation Cycle Diagram Template for PowerPoint & Google Slides
Process

Modern 6-Step Cycle Diagram Slide Deck Template for PowerPoint & Google Slides
Process
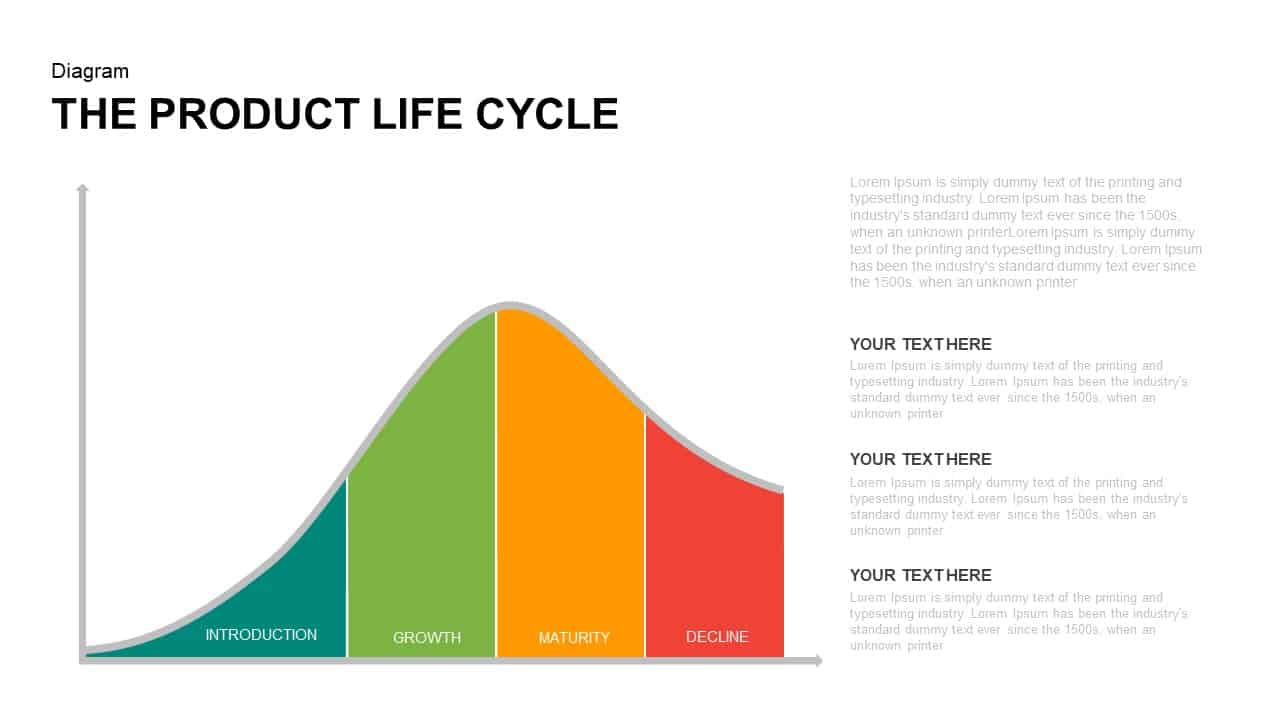
Corporate Product Life Cycle Diagram Template for PowerPoint & Google Slides
Process
Enterprise Risk Management Cycle Diagram Template for PowerPoint & Google Slides
Process
4MAT Learning Cycle Circular Diagram Template for PowerPoint & Google Slides
Circular
4-Step Circular PDCA Cycle Diagram Template for PowerPoint & Google Slides
Process
Continuous Improvement Cycle Diagram Template for PowerPoint & Google Slides
Process
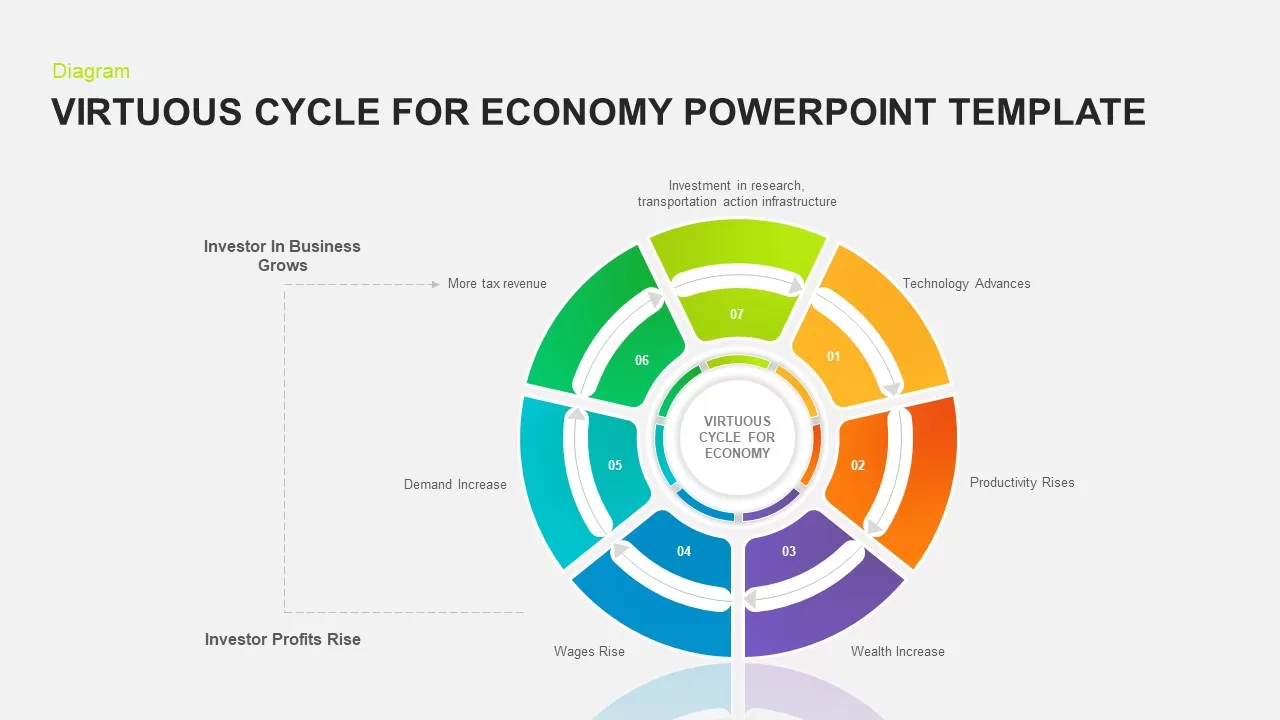
7-Step Virtuous Economy Cycle Diagram Template for PowerPoint & Google Slides
Process
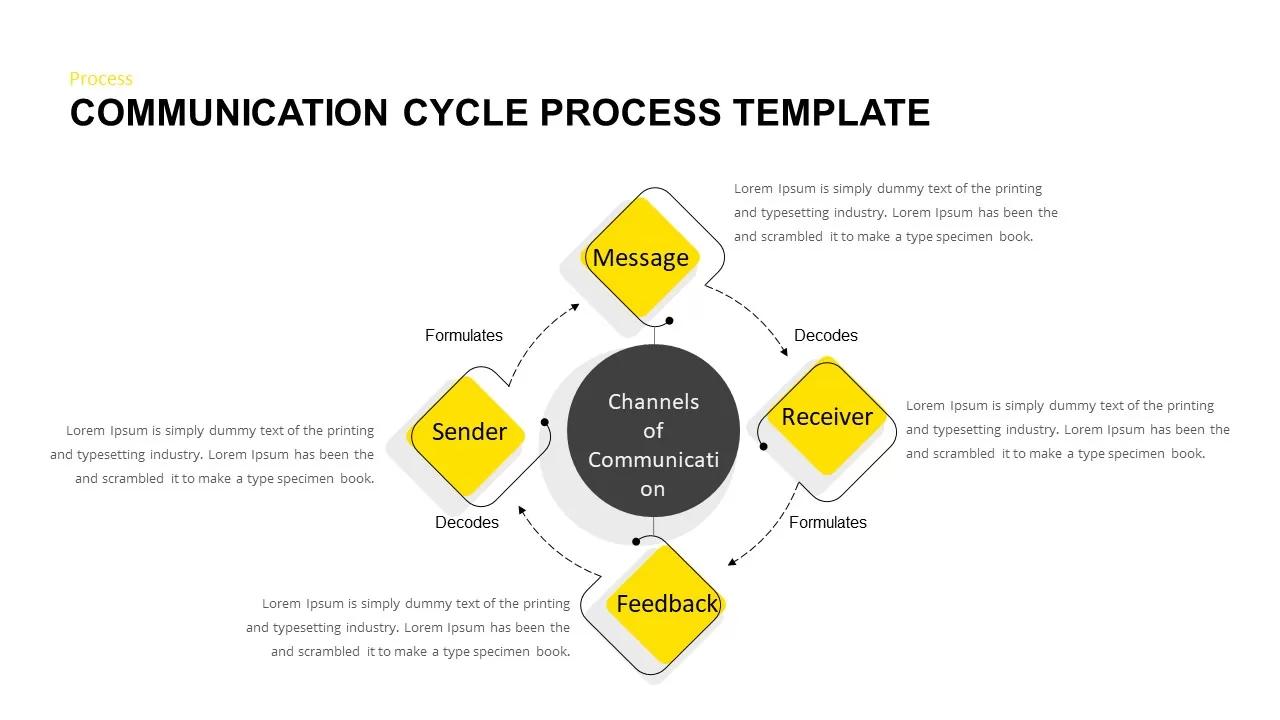
Communication Cycle Process Diagram template for PowerPoint & Google Slides
Business
Concentric Circular Arrow Cycle Diagram Template for PowerPoint & Google Slides
Process
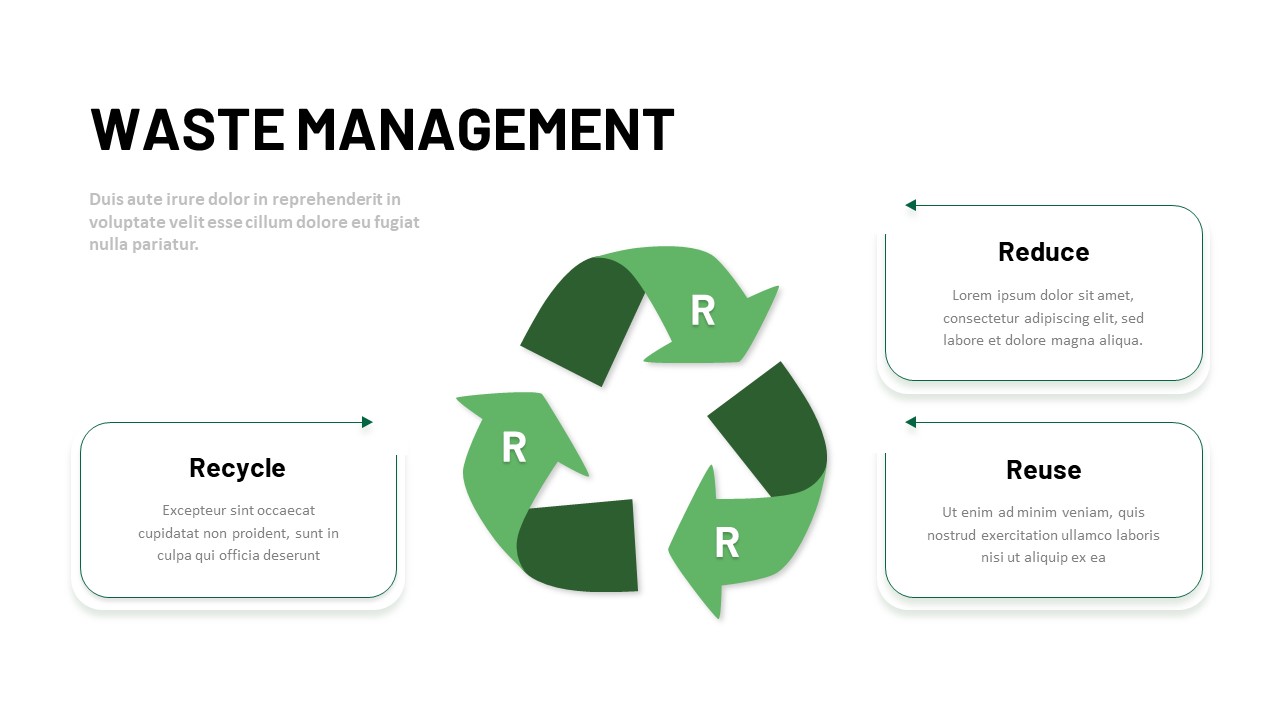
3R Waste Management Cycle Diagram Template for PowerPoint & Google Slides
Circular
Release Management Cycle Circular Diagram Template for PowerPoint & Google Slides
Software Development
Business Process Analysis Cycle Diagram Template for PowerPoint & Google Slides
Business Strategy
Free Time Management Clock Cycle Diagram Template for PowerPoint & Google Slides
Process
Free
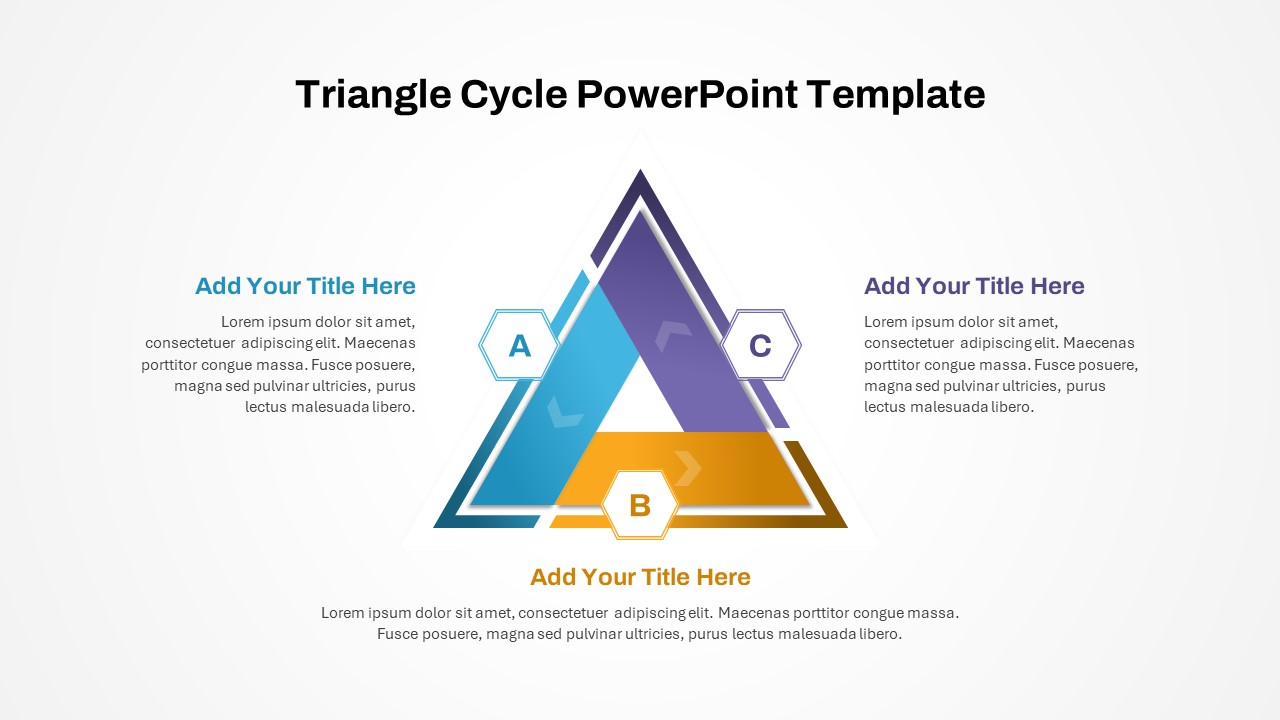
Three-Phase Triangle Cycle Diagram Template for PowerPoint & Google Slides
Infographics
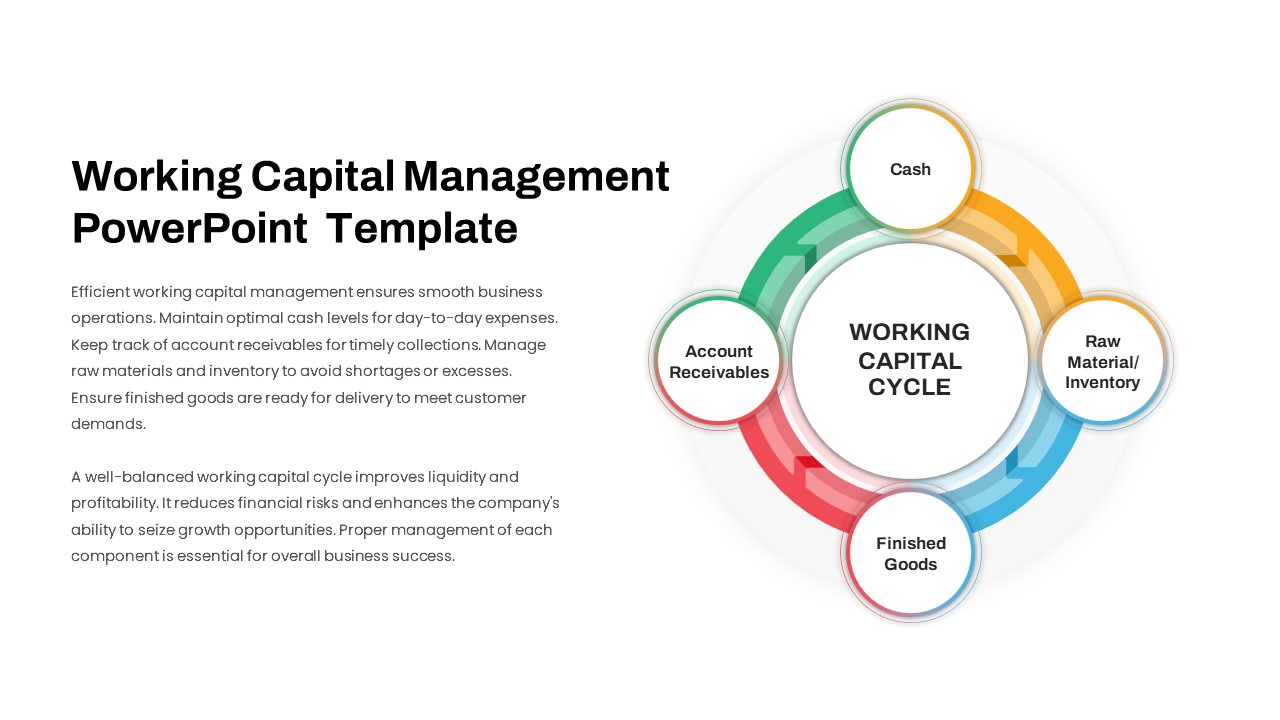
Working Capital Cycle Diagram Template for PowerPoint & Google Slides
Circular
Gartner Hype Cycle Adoption Curve Diagram Template for PowerPoint & Google Slides
Infographics
Colorful Startup Financing Cycle Diagram Template for PowerPoint & Google Slides
Finance
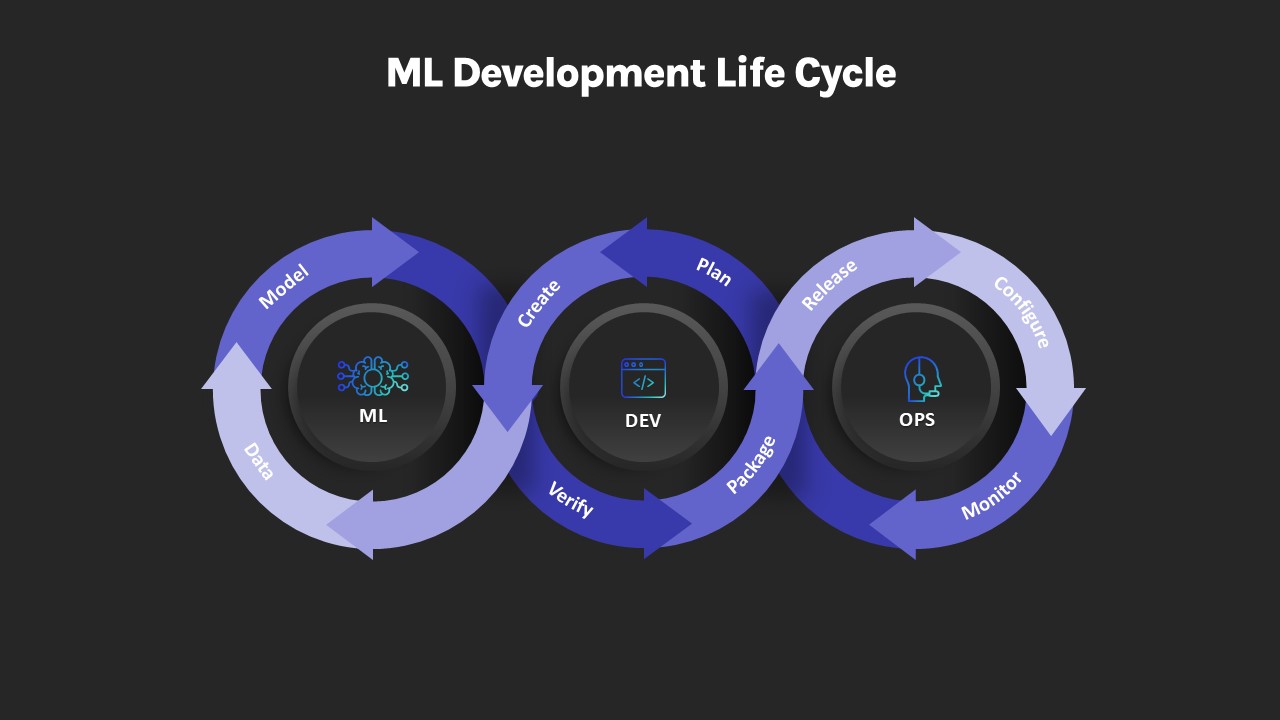
ML Development Life Cycle Diagram Template for PowerPoint & Google Slides
Machine Learning
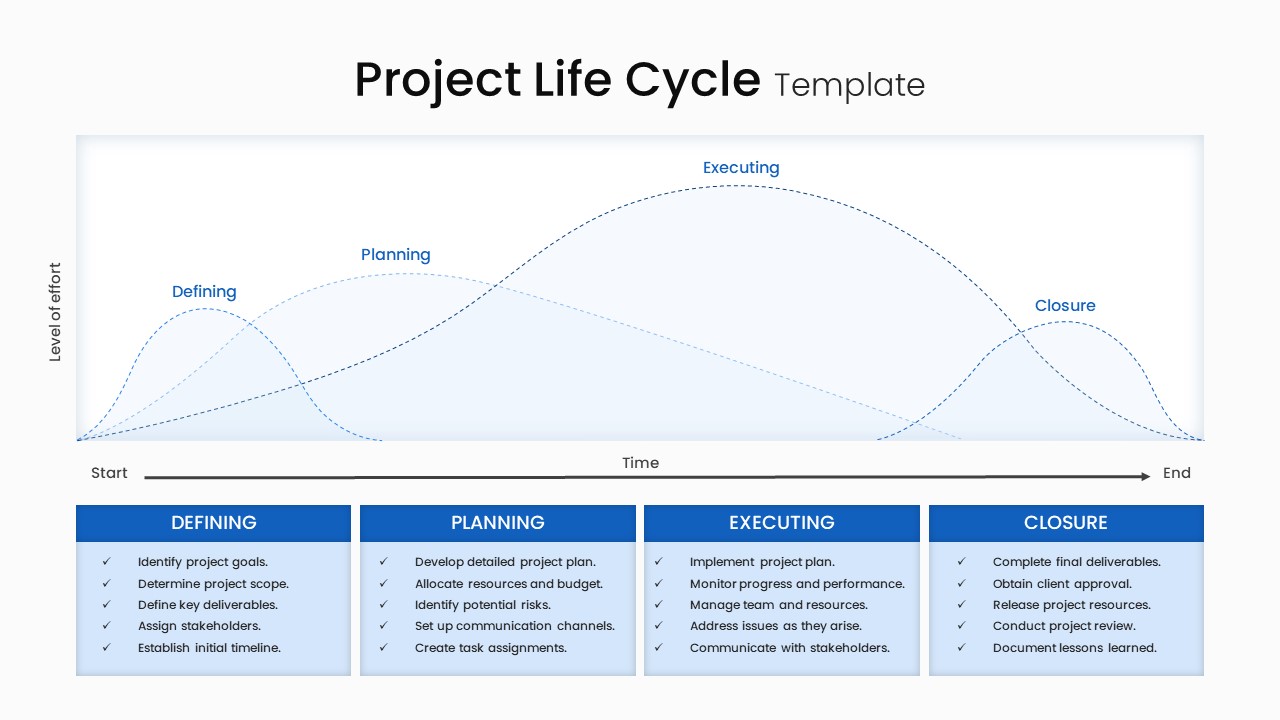
Project Life Cycle Workflow Diagram Template for PowerPoint & Google Slides
Process
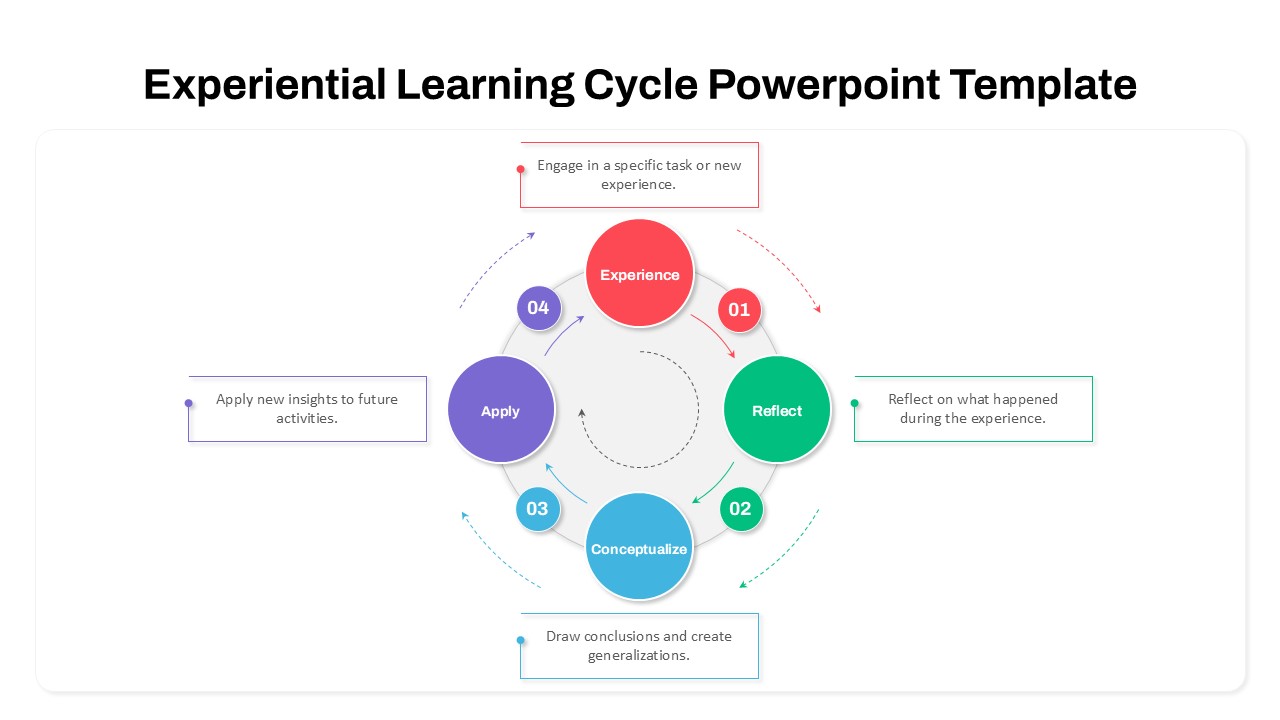
Experiential Learning Cycle Diagram Template for PowerPoint & Google Slides
Circular
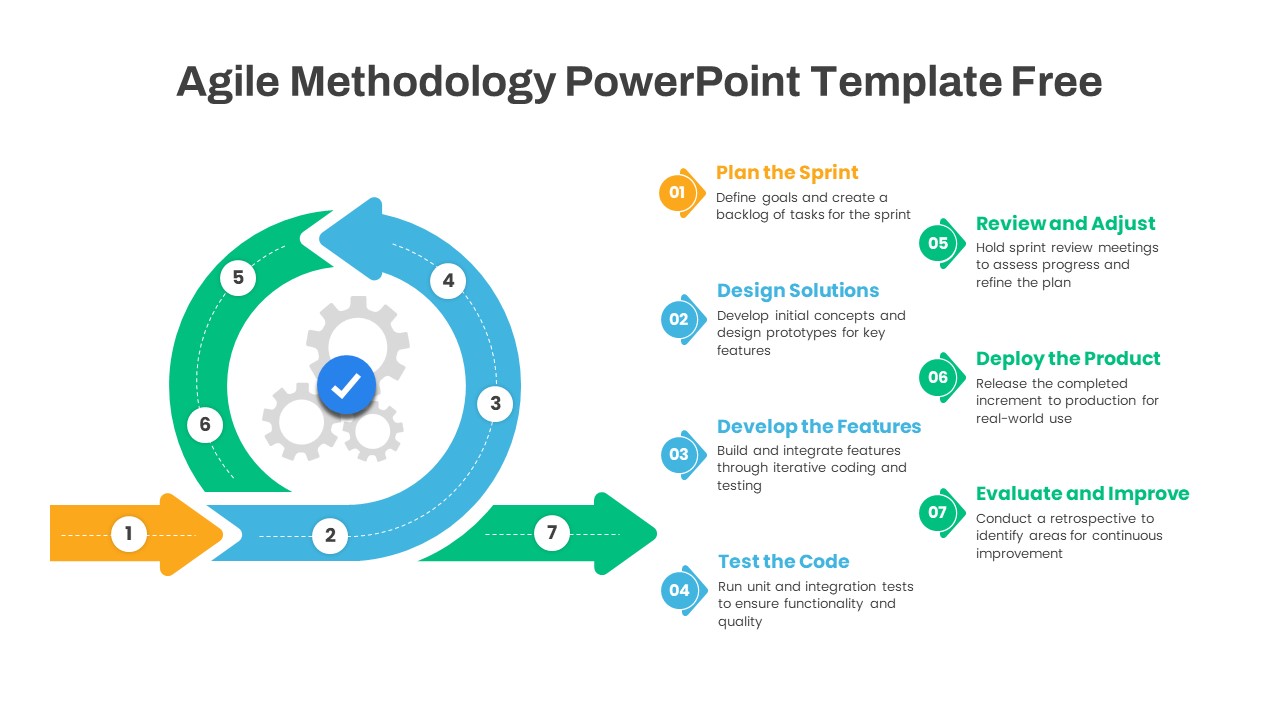
Agile Methodology Cycle Diagram Template for PowerPoint & Google Slides
Project
Free
Change Management Process Cycle Diagram Template for PowerPoint & Google Slides
Process
Flywheel Growth Cycle Diagram Template for PowerPoint & Google Slides
Circular
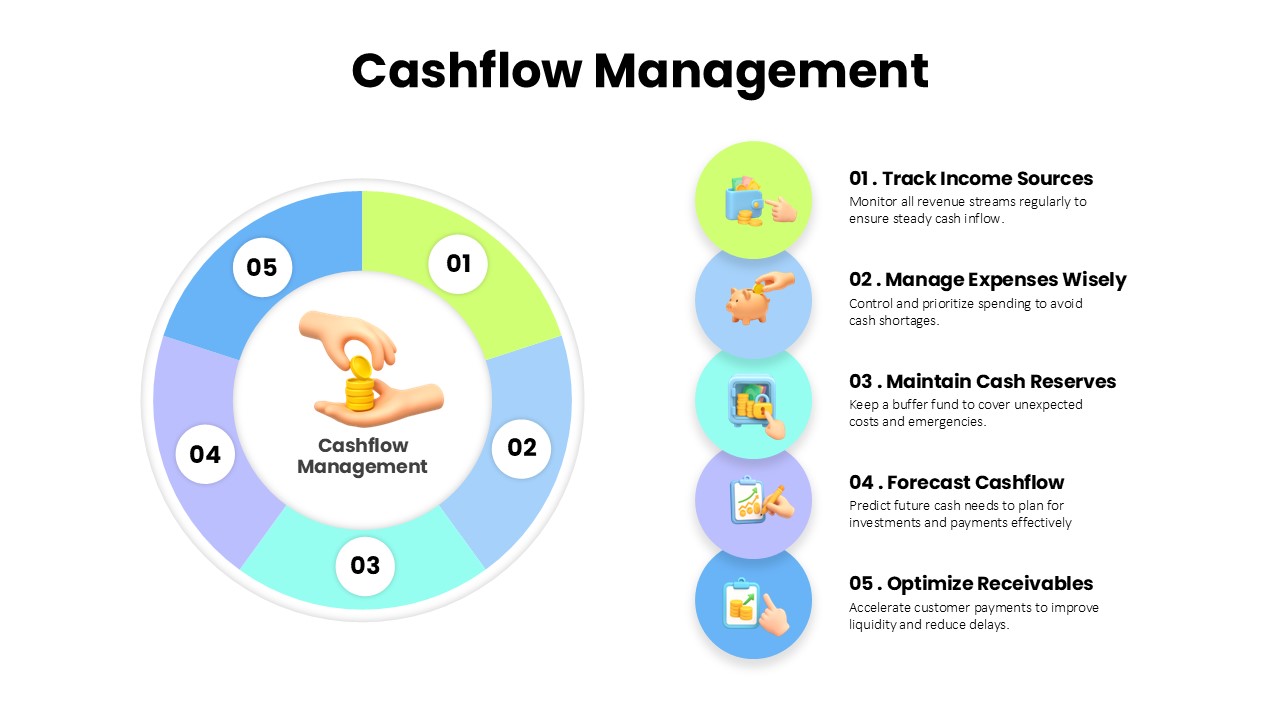
Cashflow Management Cycle Diagram Template for PowerPoint & Google Slides
Finance
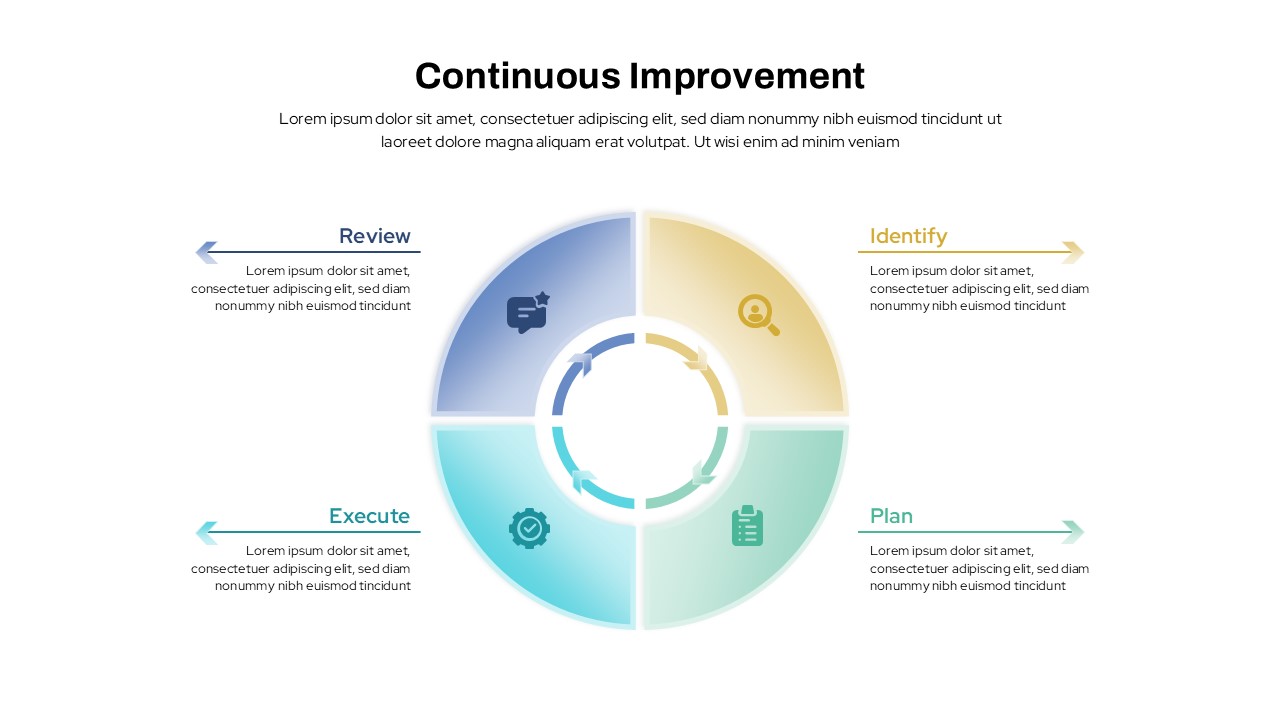
Continuous Improvement Cycle Diagram Template for PowerPoint & Google Slides
Process
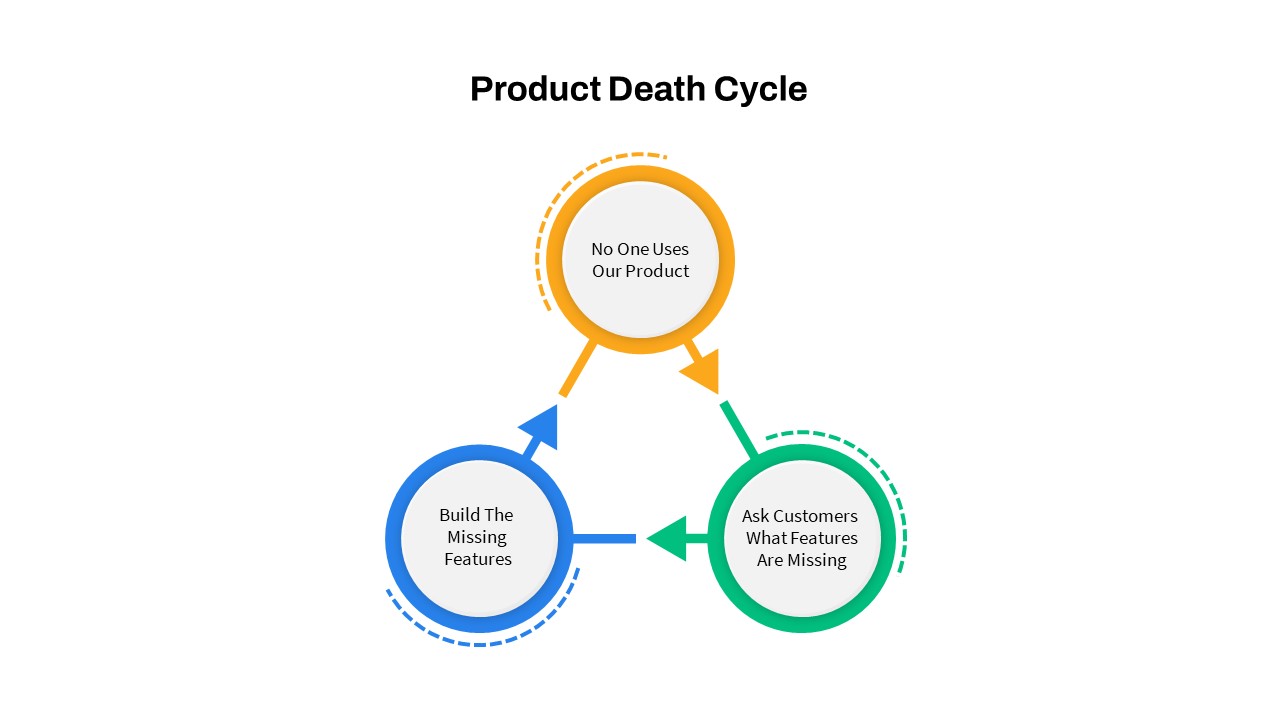
Product Death Cycle Diagram Slide for PowerPoint & Google Slides
Circular
Gear Pie Diagram Data Visualization Template for PowerPoint & Google Slides
Pie/Donut
Data Management and Analytics Diagram Template for PowerPoint & Google Slides
Circular
Advanced Data Flow Diagram Pack Template for PowerPoint & Google Slides
Flow Charts
Data Lake Hub-and-Spoke Diagram Template for PowerPoint & Google Slides
Cloud Computing
ETL Data Pipeline Workflow Diagram Template for PowerPoint & Google Slides
Process
Customer Data Platform Workflow Diagram Template for PowerPoint & Google Slides
Information Technology
Data Governance Roles Pyramid Diagram Template for PowerPoint & Google Slides
Pyramid
4 Business Data Infographics Diagram for PowerPoint & Google Slides
Process
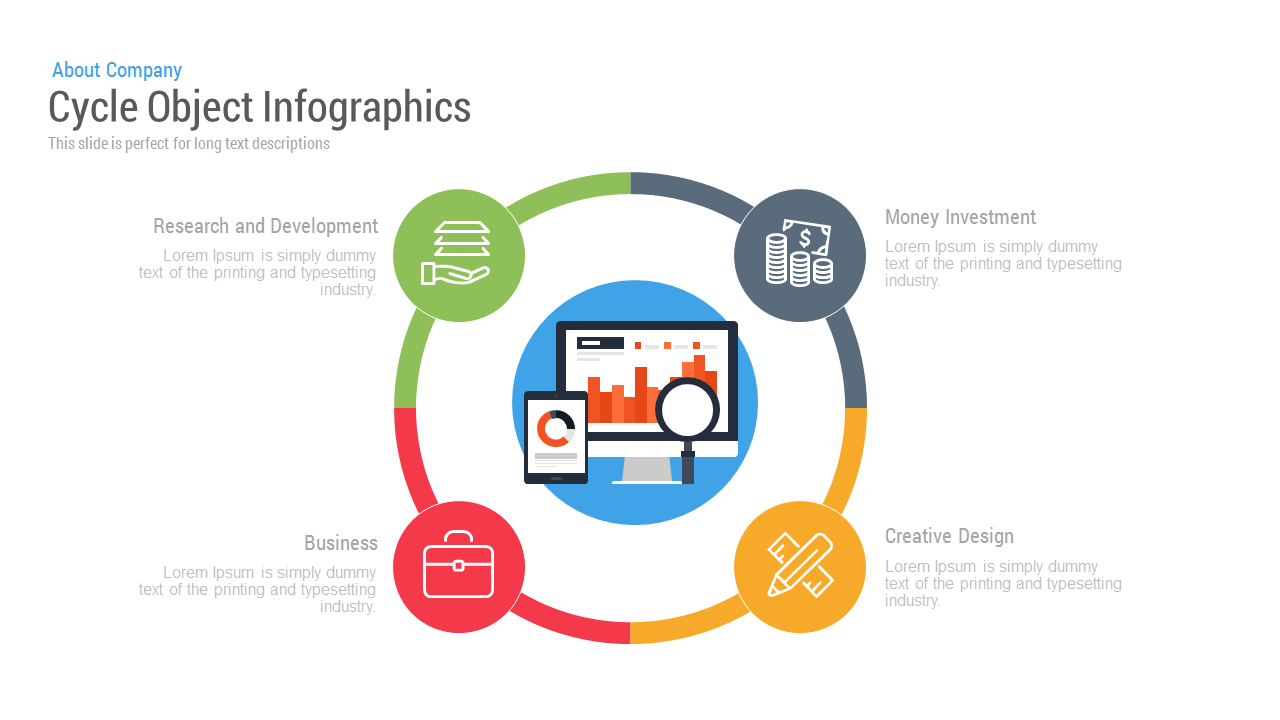
Free Cycle Object Infographics template for PowerPoint & Google Slides
Process
Free
Performance Review Process Management Cycle template for PowerPoint & Google Slides
Employee Performance
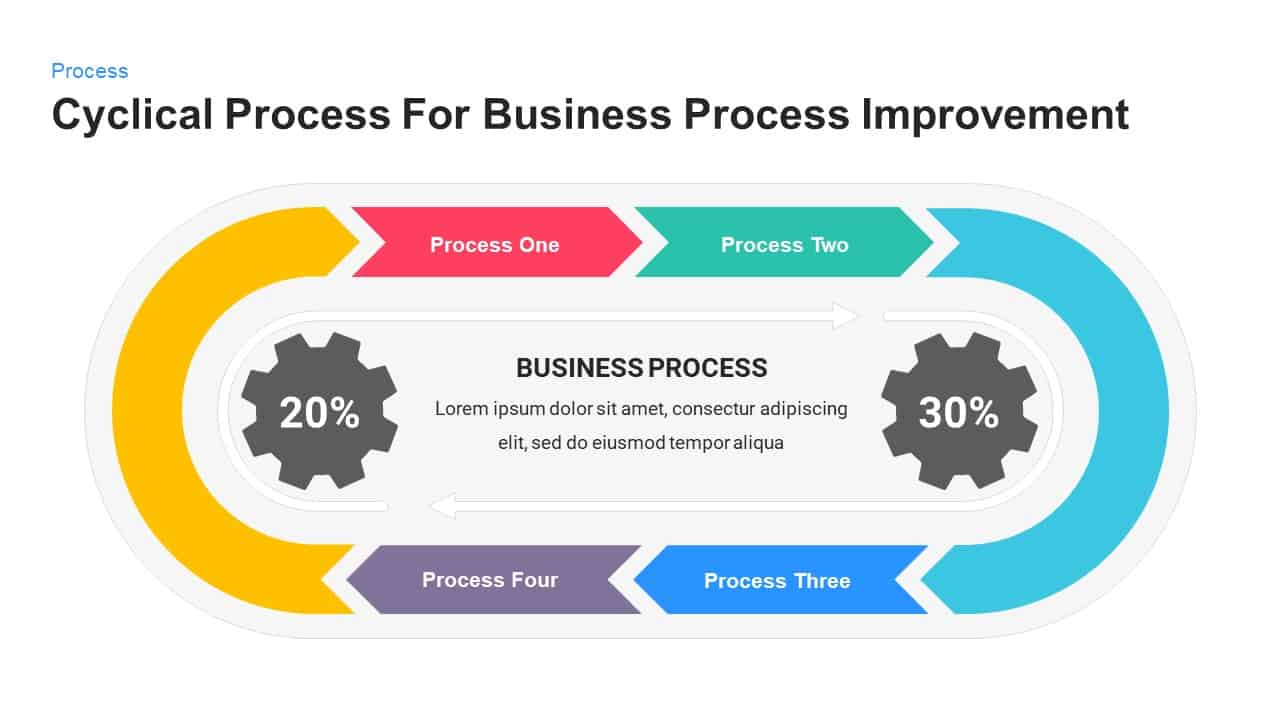
Business Process Improvement Cycle Template for PowerPoint & Google Slides
Process
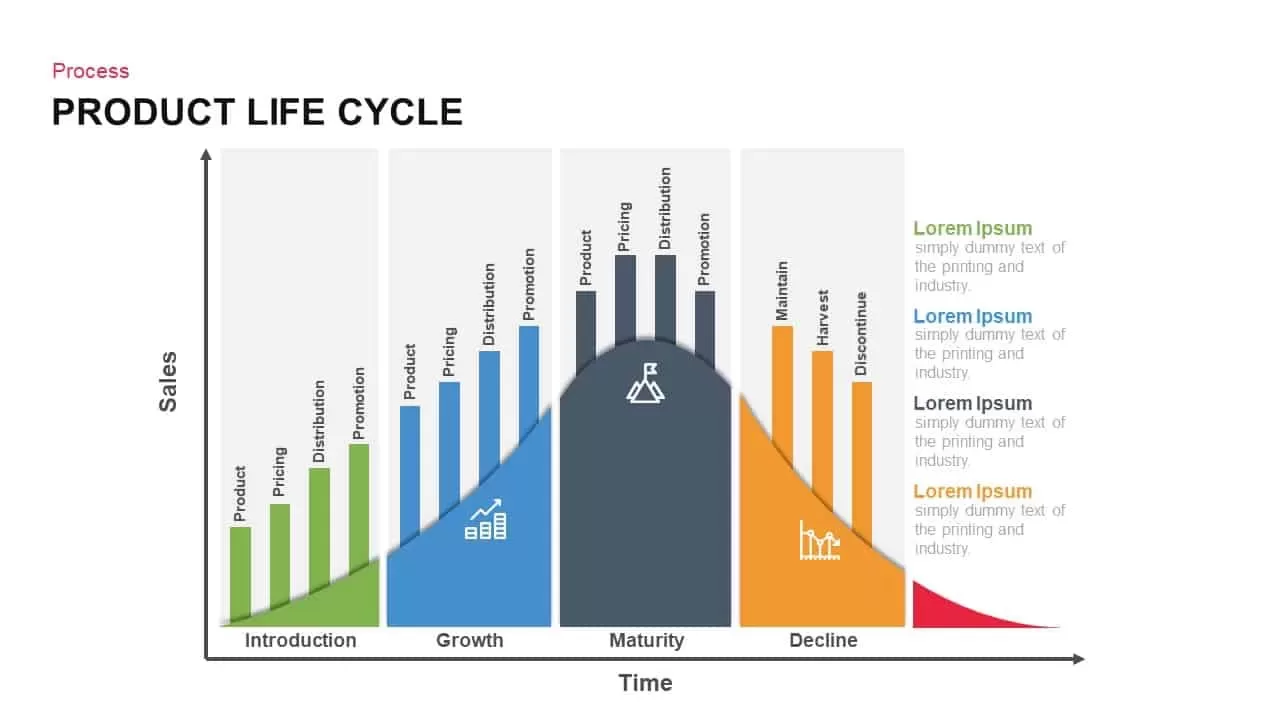
Product Life Cycle Infographics template for PowerPoint & Google Slides
Business
Water Cycle Process Infographic Template for PowerPoint & Google Slides
Process
Four-Stage Process Cycle Variations Pack Template for PowerPoint & Google Slides
Process
Employee Life Cycle Activities Template for PowerPoint & Google Slides
Timeline
Employee Life Cycle Activities Process Template for PowerPoint & Google Slides
Employee Performance
Business Process Improvement Cycle Template for PowerPoint & Google Slides
Circular
Strategic ADL Matrix by Industry Life Cycle & Position Template for PowerPoint & Google Slides
Business Strategy
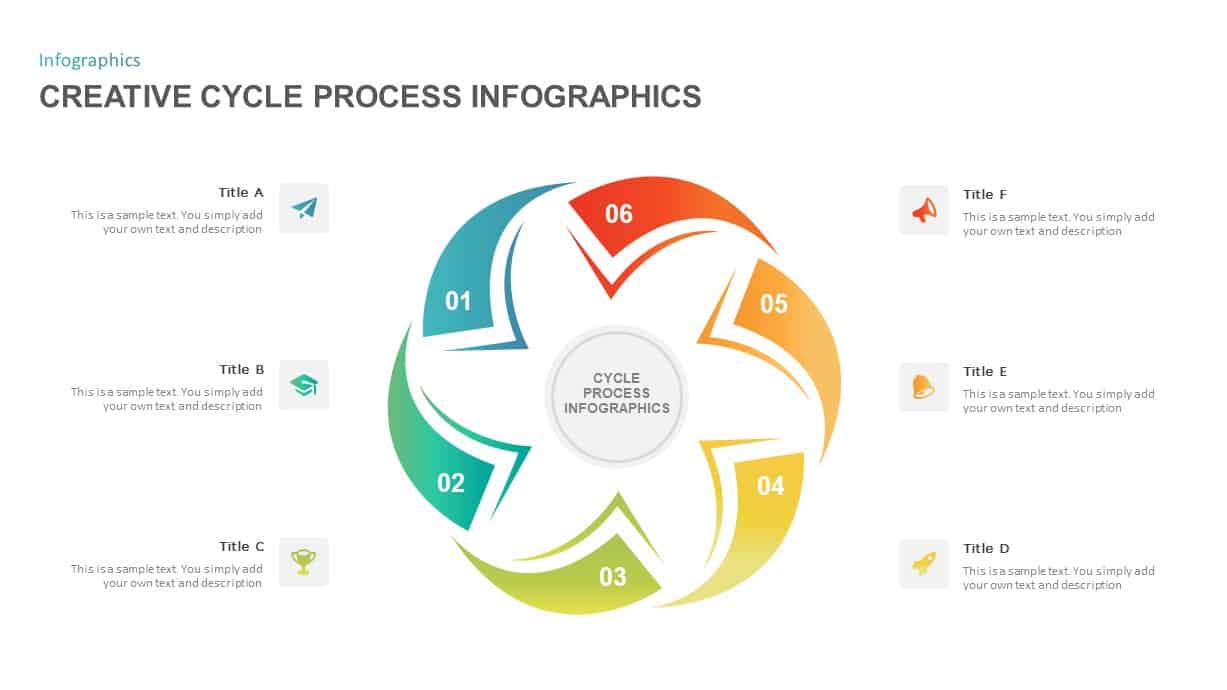
Creative Cycle Process Infographics Template for PowerPoint & Google Slides
Process
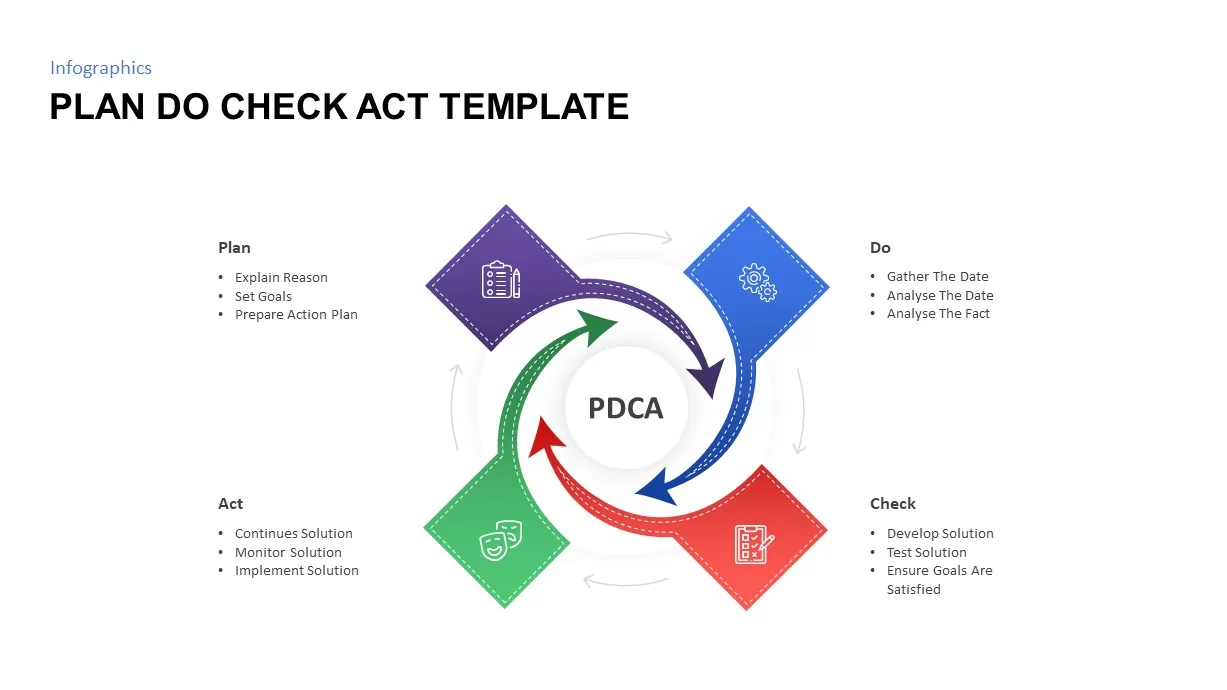
Plan Do Check Act PDCA Cycle Infographic Template for PowerPoint & Google Slides
Process
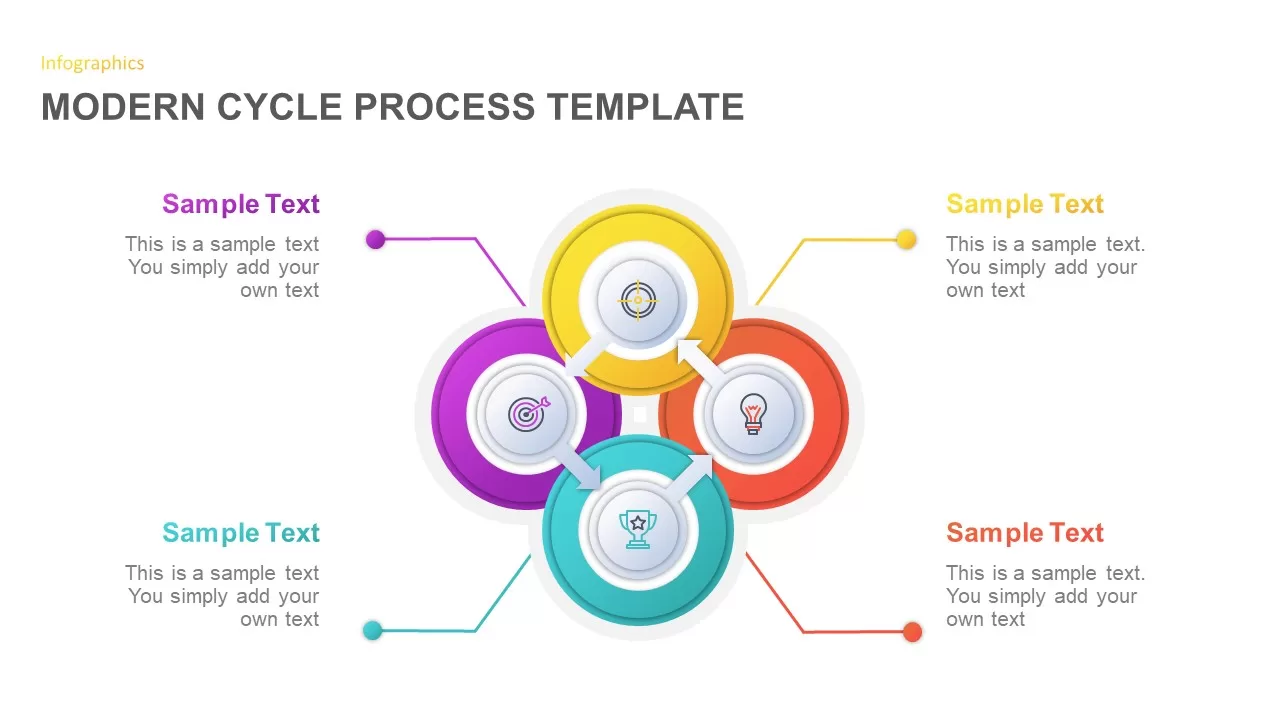
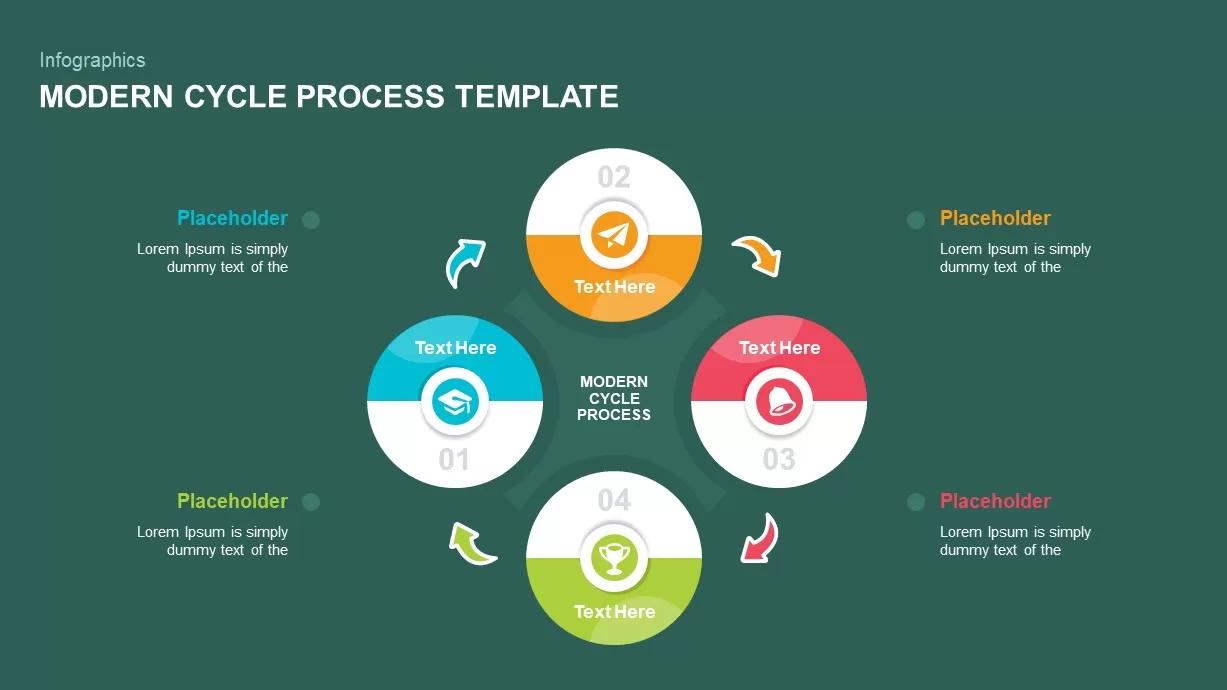
Modern Cycle Process Template for PowerPoint & Google Slides
Business Proposal
Gibbs Reflective Cycle Overview Template for PowerPoint & Google Slides
Process
Dual-Stage Circular Arrow Cycle Template for PowerPoint & Google Slides
Process
Three-Segment Circular Arrow Cycle Template for PowerPoint & Google Slides
Circular
Four-Segment Circular Arrow Cycle Template for PowerPoint & Google Slides
Circular
Six-Segment Circular Arrow Cycle Template for PowerPoint & Google Slides
Circular
PDCA Cycle Infographic with Four Stages Template for PowerPoint & Google Slides
Process
PDCA Plan Do Check Act Cycle Infographic Template for PowerPoint & Google Slides
Process
PDCA Four-Stage Cycle Infographic Template for PowerPoint & Google Slides
Process
Robotics Process Cycle Infographic Template for PowerPoint & Google Slides
Process
Design Thinking Process Cycle Slide Template for PowerPoint & Google Slides
Process
Hexagonal Design Thinking Cycle Template for PowerPoint & Google Slides
Process
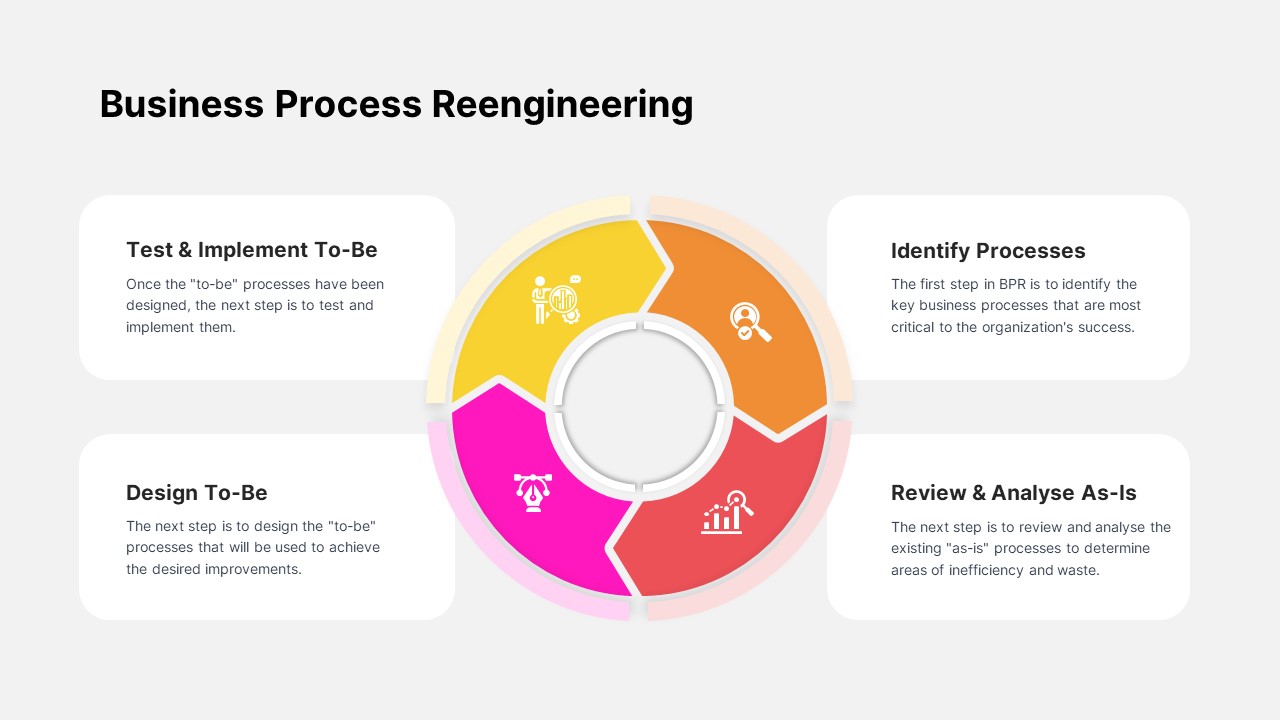
Business Process Reengineering Cycle Template for PowerPoint & Google Slides
Circular
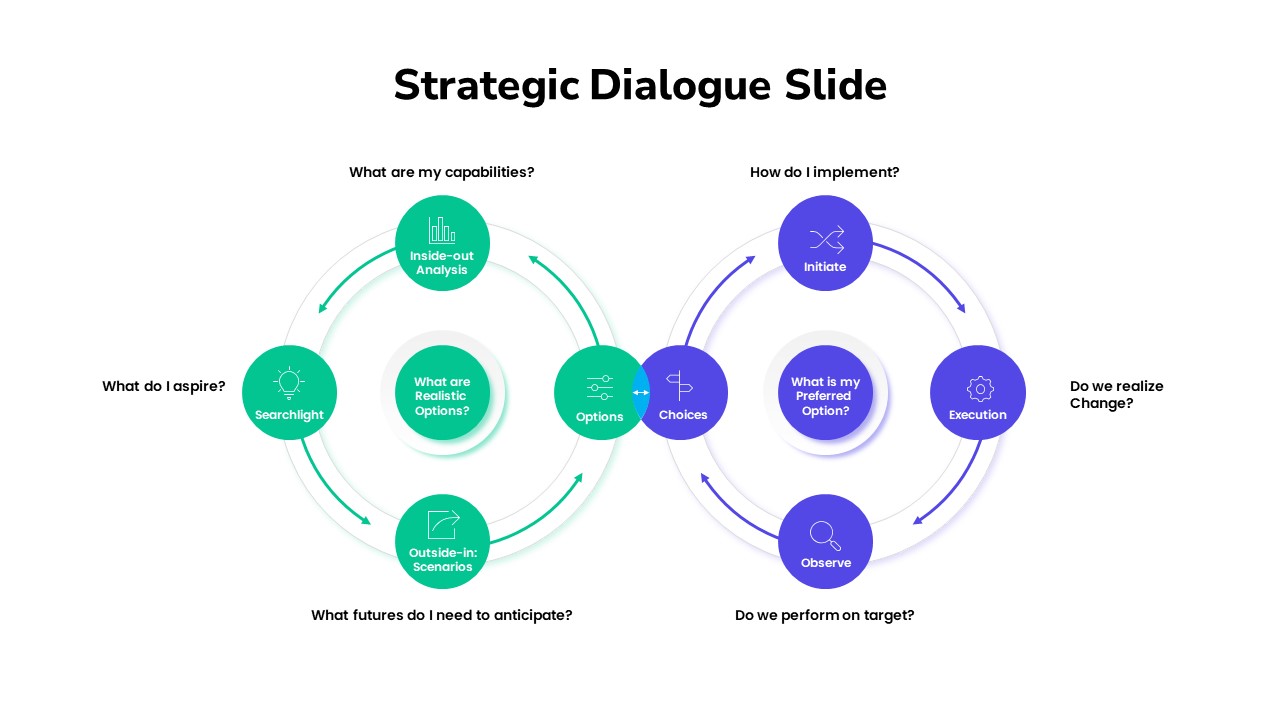
Strategic Dialogue Model Cycle Template for PowerPoint & Google Slides
Circular
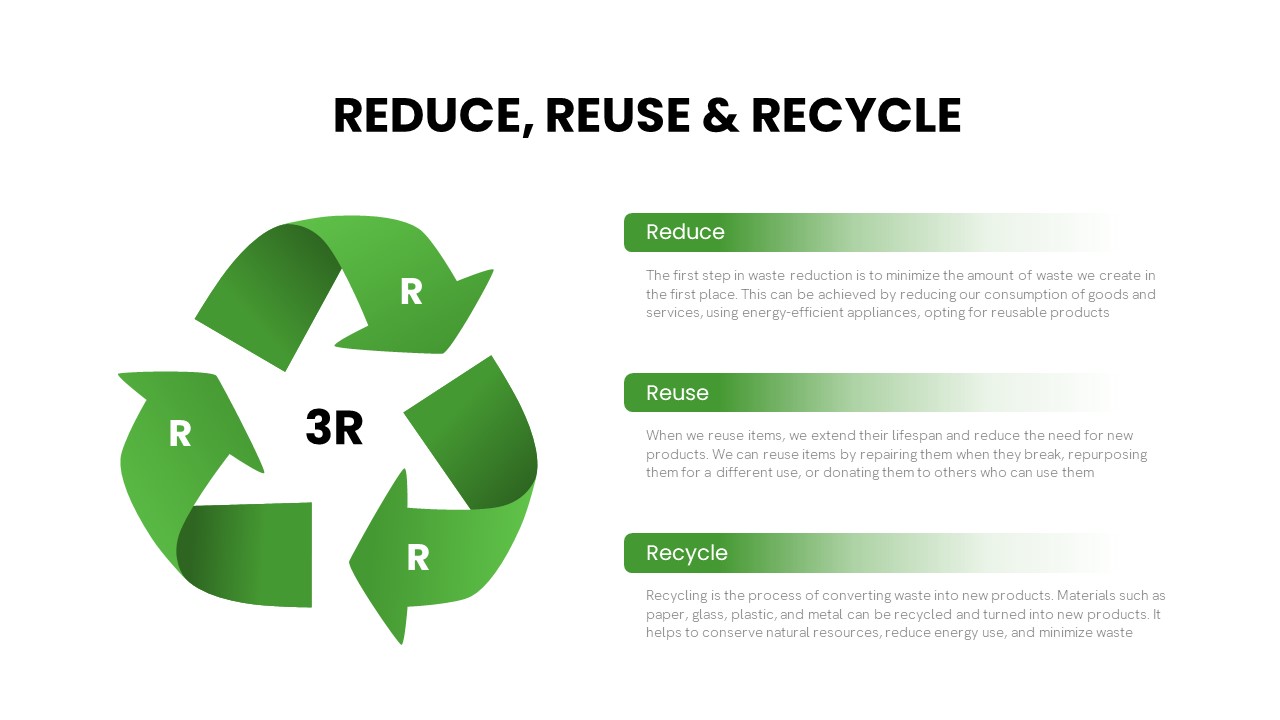
3R Waste Management Cycle Overview template for PowerPoint & Google Slides
Process
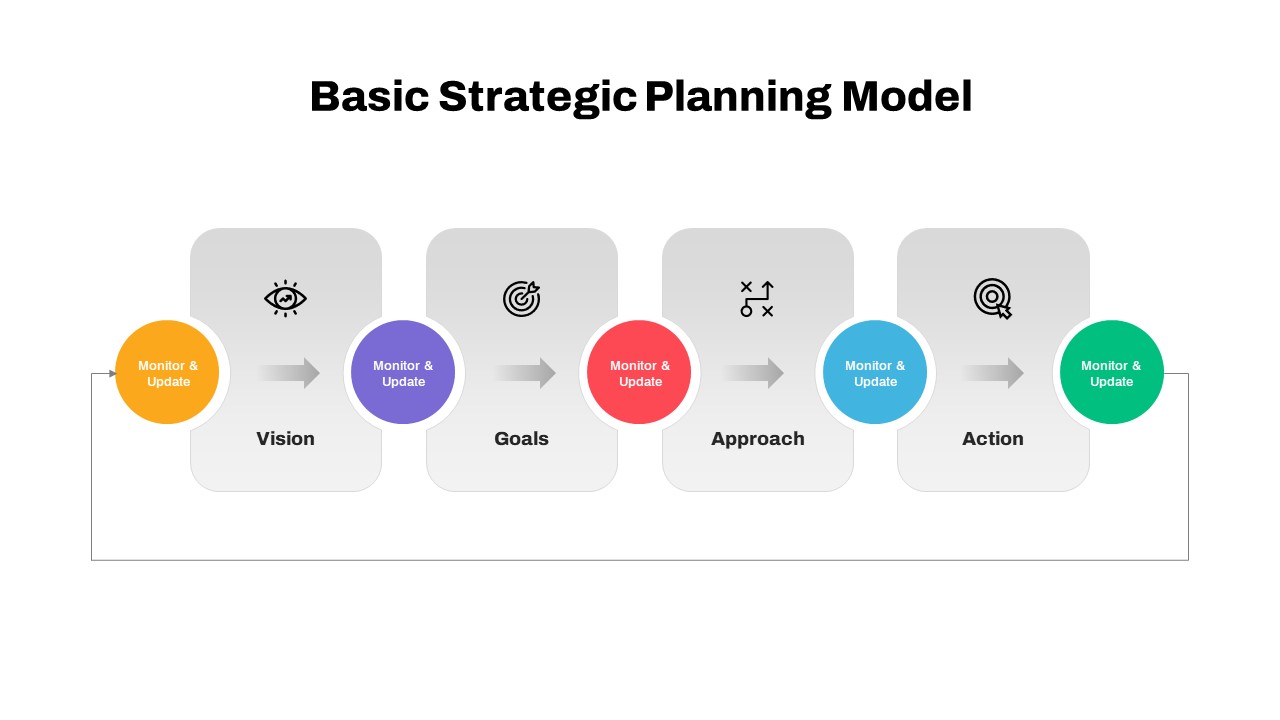
Iterative Strategic Planning Cycle Template for PowerPoint & Google Slides
Business Strategy
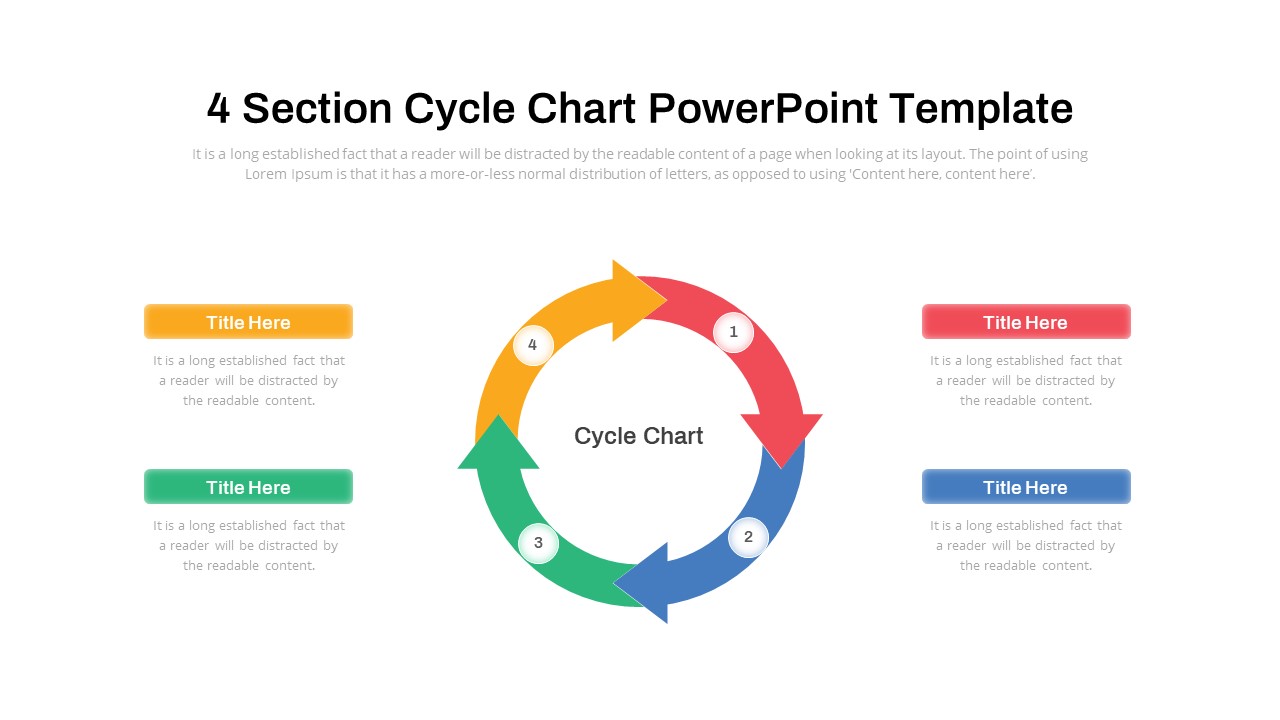
Cycle Chart Template for PowerPoint & Google Slides
Circular
Seeds Growth Cycle Business Model Template for PowerPoint & Google Slides
Process
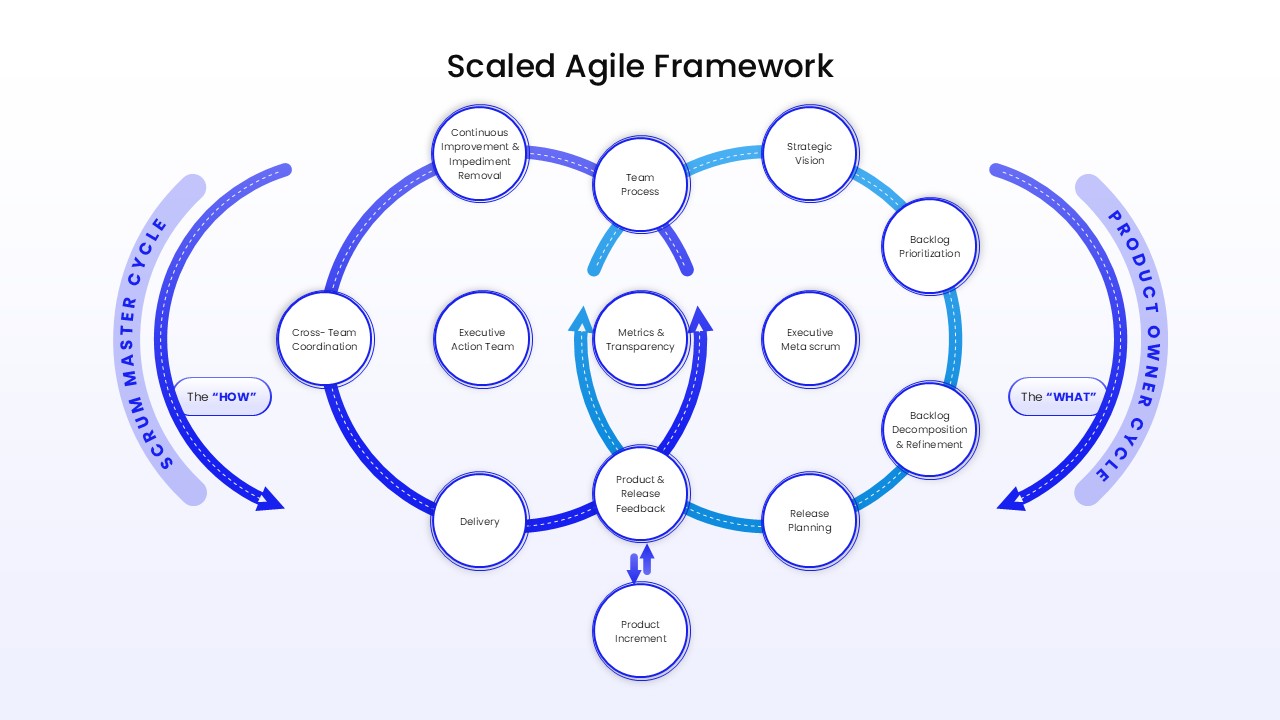
Two-Cycle Scaled Agile Framework Template for PowerPoint & Google Slides
Scrum
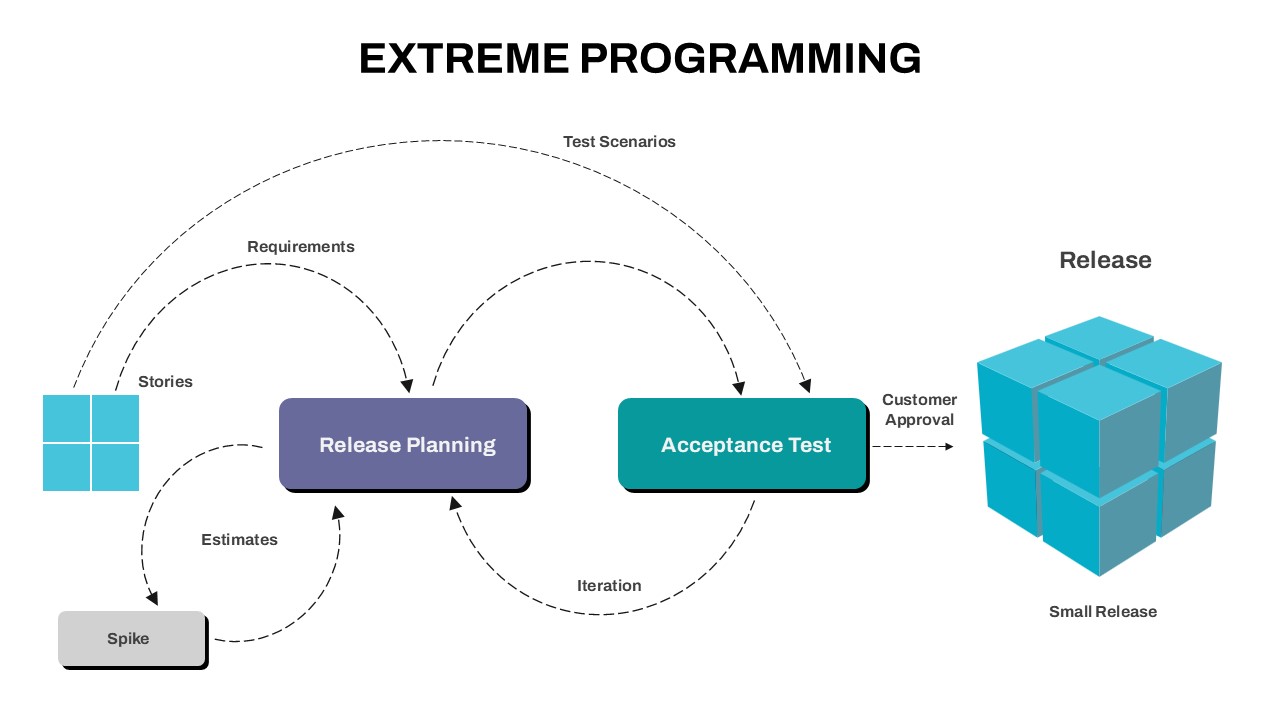
Extreme Programming Process Cycle Template for PowerPoint & Google Slides
Software Development
Modern Cycle Process for PowerPoint & Google Slides
Infographics
Data Science PowerPoint Presentation Template for PowerPoint & Google Slides
Pitch Deck
Data Center PowerPoint Template for PowerPoint & Google Slides
Information Technology

Smartphone Data User template for PowerPoint & Google Slides
Charts
Circle Graph Data Visualization Template for PowerPoint & Google Slides
Circular
Data Analytics Dashboard Design template for PowerPoint & Google Slides
Bar/Column
Simple Area Chart Data Trends Analysis Template for PowerPoint & Google Slides
Comparison Chart
Data Over Time Line Chart template for PowerPoint & Google Slides
Charts
Free Big Data Network Visualization Template for PowerPoint & Google Slides
Circular
Free
Syria Regional Data Map Infographic Template for PowerPoint & Google Slides
World Maps
First Party Data Overview Template for PowerPoint & Google Slides
Business