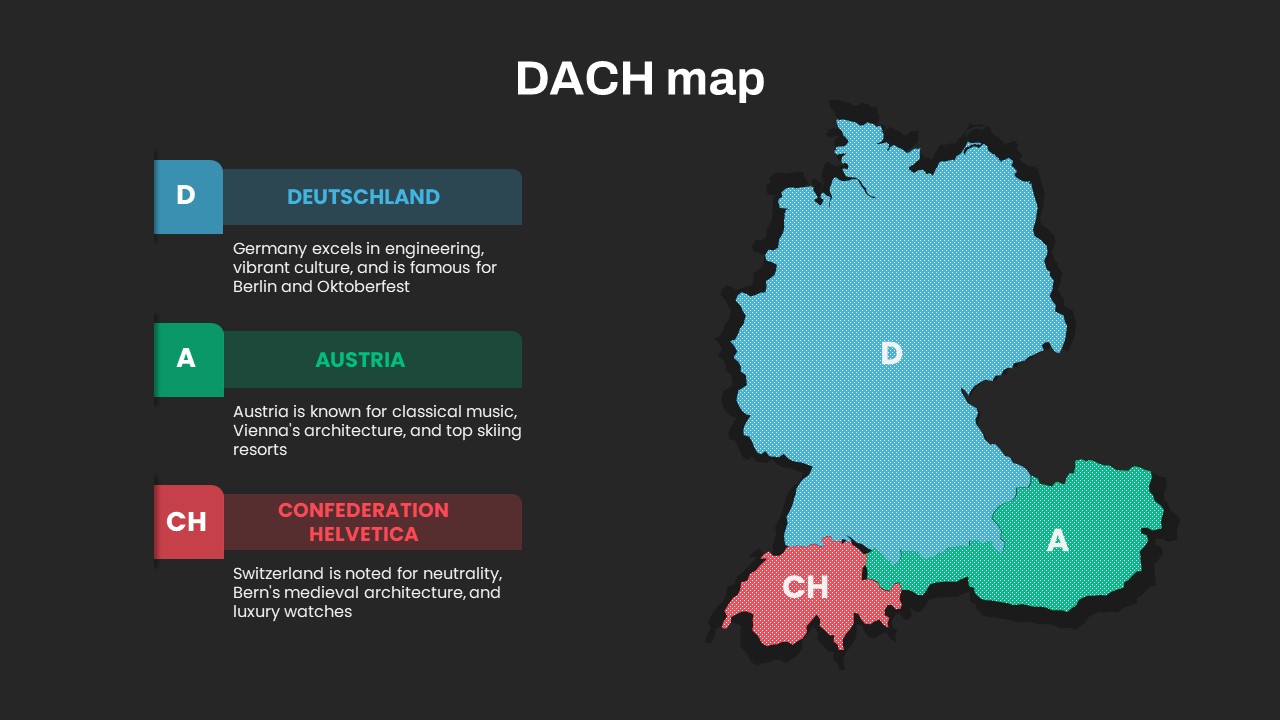
DACH Region Map with Country Highlights Template for PowerPoint & Google Slides


Description
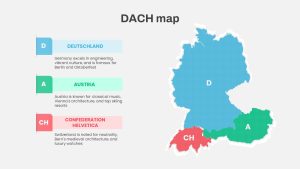
This slide showcases the DACH region map through a clean, color-coded layout that highlights Germany (D), Austria (A), and Switzerland (CH) with distinct blue, green, and red halftone overlays. On the left, three horizontal panels display country codes, bold regional names, and concise cultural notes—including Germany’s engineering excellence and Oktoberfest, Austria’s classical music heritage and alpine resorts, and Switzerland’s neutrality and luxury watchmaking. The right-hand side features a high-resolution vector map with labeled segments, crisp white borders, and subtle drop shadows that maintain visual hierarchy against the light gray backdrop. The minimalist design ensures audience focus remains on regional insights, while intuitive layout elements guide viewers seamlessly from descriptive callouts to geographic context. Customizable placeholders allow easy text, icon, and color adjustments to match any corporate branding or presentation theme. Bold typography and balanced negative space create a professional aesthetic that adapts to both in-person and virtual formats.
Built on fully editable master slides and layered vector shapes, this template guarantees crisp clarity at any resolution while offering drag-and-drop ease for icons, labels, and color themes. Presenters can utilize built-in entrance animations to sequentially reveal each country, reinforcing storytelling cadence and audience engagement. The slide supports seamless integration into broader decks or standalone use for targeted regional reports and marketing presentations. With structured placeholders for bullet points, speakers can annotate additional metrics or market insights directly beside each map segment. Light typography, consistent spacing, and subtle soft shadows contribute to a modern, professional aesthetic. Optimized for both PowerPoint and Google Slides, the template preserves layout fidelity across platforms and devices, eliminating version-control challenges and ensuring rapid preparation for executive briefings, strategy workshops, or educational sessions.
Who is it for
Regional planners, marketing managers, and consultants can leverage this DACH map slide to highlight market insights, cultural overviews, and strategic opportunities. It is ideal for investor presentations, market-entry proposals, and corporate decks focused on German-speaking Europe.
Other Uses
Beyond regional mapping, repurpose this design for sales territory breakdowns, competitor landscapes, supply chain visualizations, and demographic reports. Edit labels and overlays to showcase performance metrics, customer segmentation, or logistical routes in any business or educational context.
Login to download this file

Item ID
SB04451
Related Templates

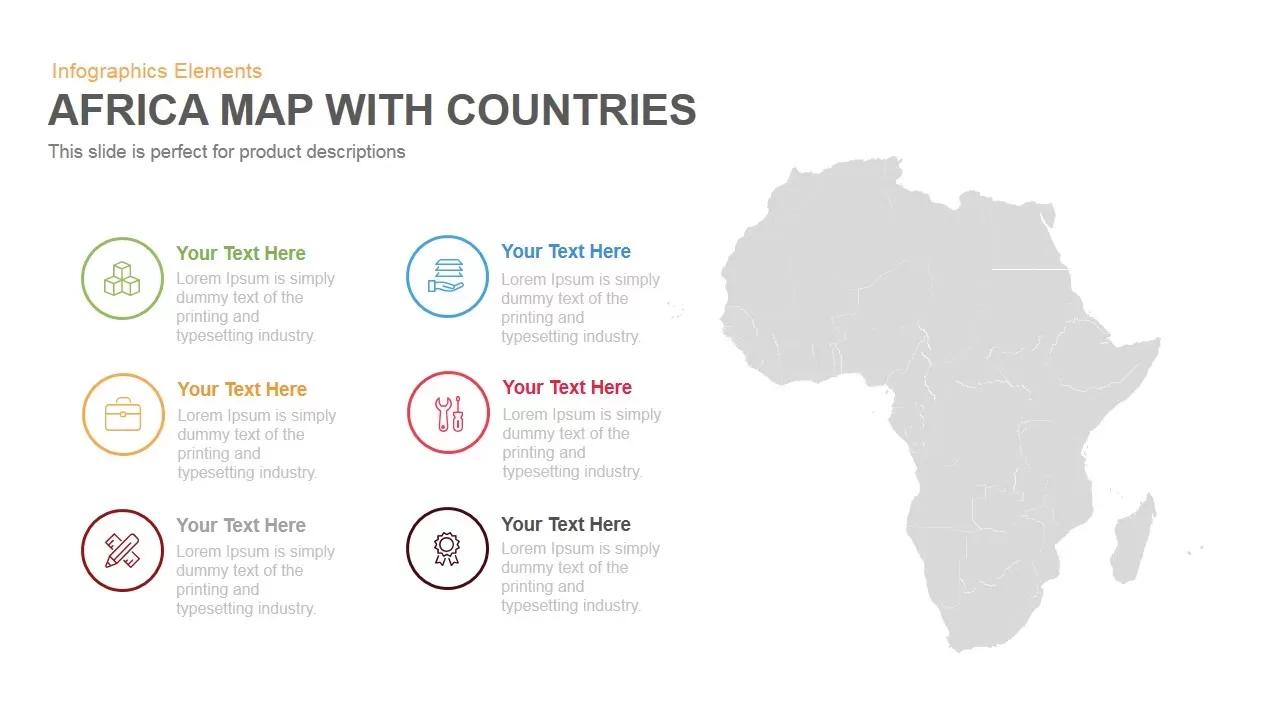
Africa Country Map Infographic Template for PowerPoint & Google Slides
World Maps
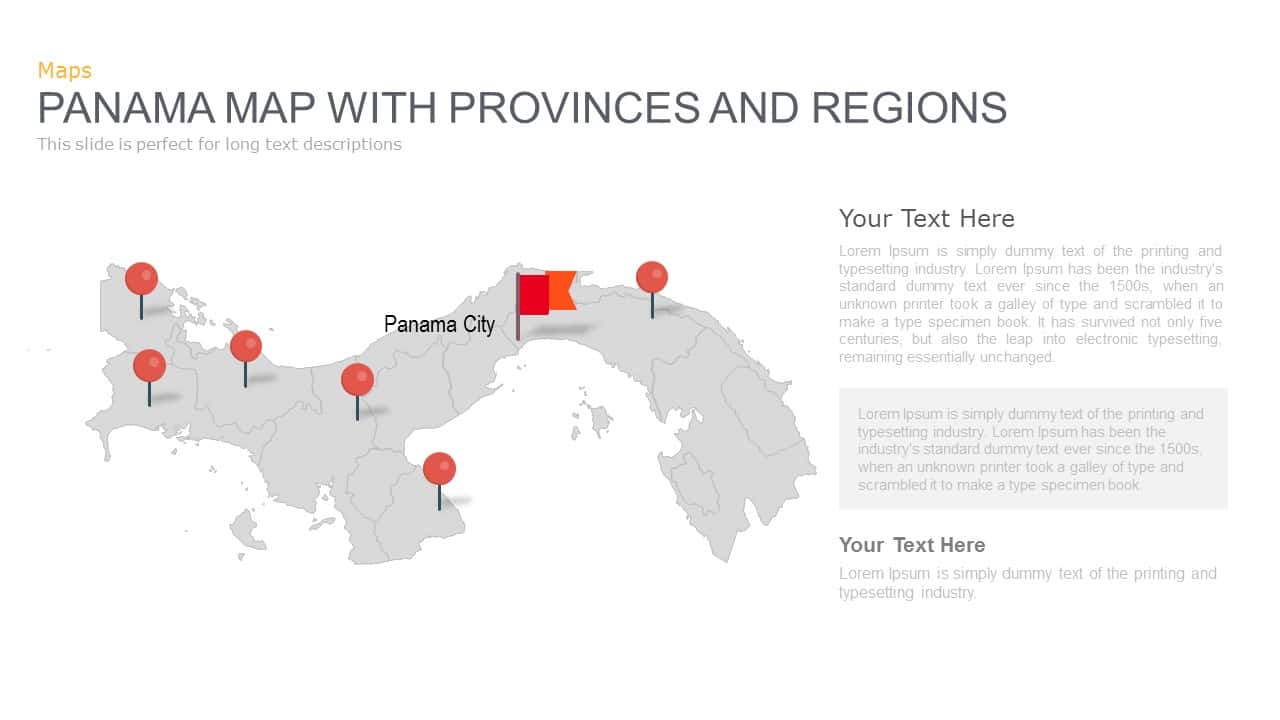
Panama Map with Region Markers Template for PowerPoint & Google Slides
World Maps
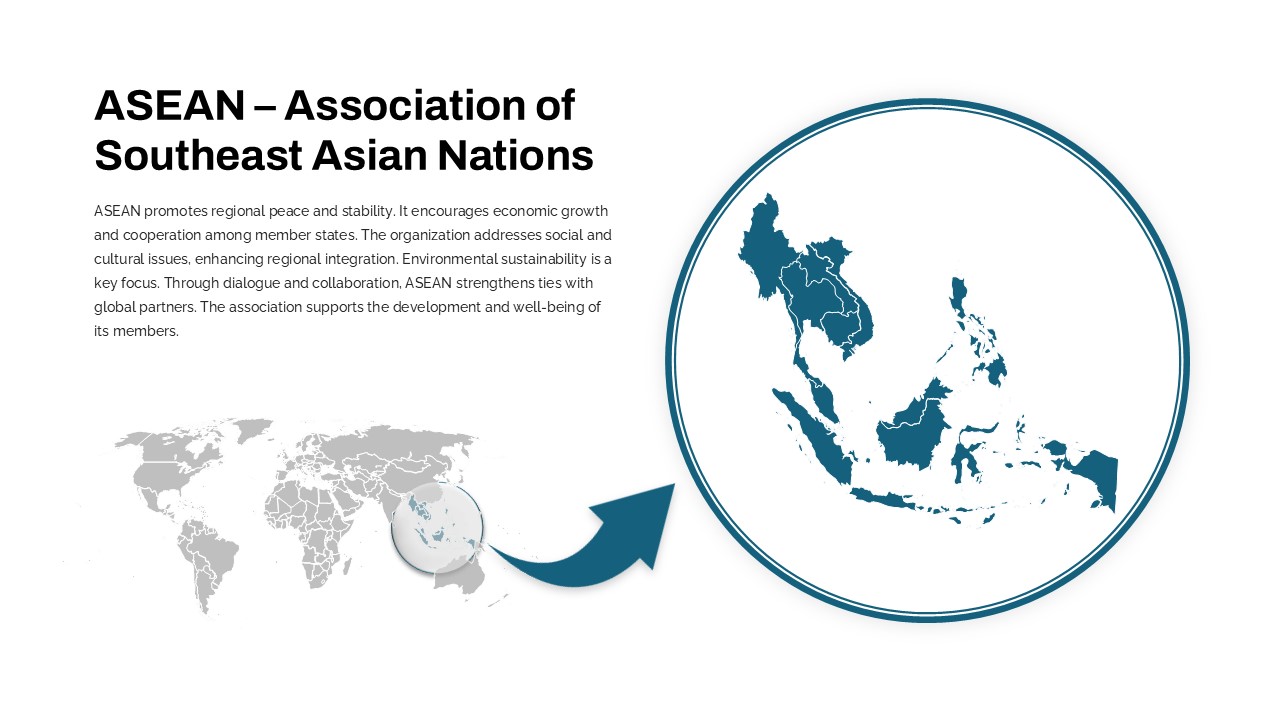
Professional ASEAN Region Zoom Map Slide Template for PowerPoint & Google Slides
World Maps

Smartphone Feature Highlights template for PowerPoint & Google Slides
Business
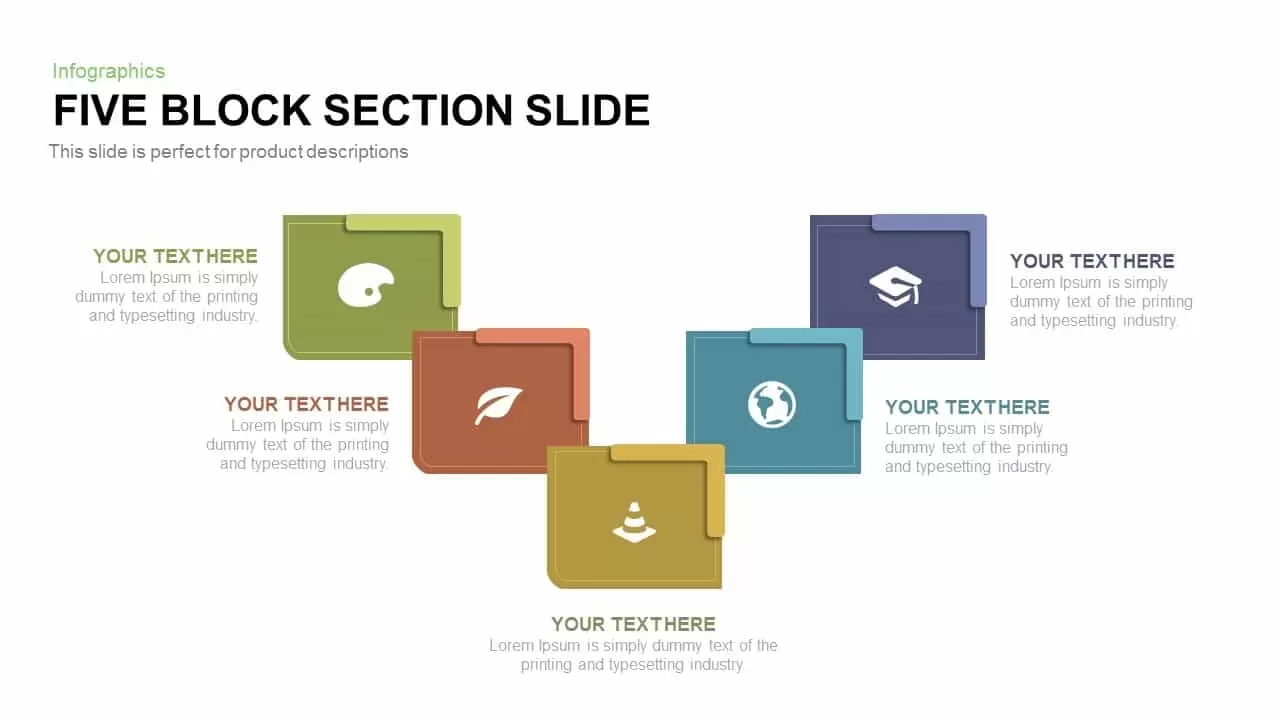
Five-Block Section Feature Highlights Template for PowerPoint & Google Slides
Comparison
About Us Slide with Feature Highlights Template for PowerPoint & Google Slides
Marketing
About Us Slide with Icon Highlights Template for PowerPoint & Google Slides
Business
Horizontal Smartphone Feature Highlights Template for PowerPoint & Google Slides
Graphics
Company Highlights Profile Presentation Template for PowerPoint & Google Slides
Business
Professional Key Highlights Layout Template for PowerPoint & Google Slides
Business
Wavy Timeline with Image Highlights Template for PowerPoint & Google Slides
Timeline
Year in Review KPI Highlights Slide for PowerPoint & Google Slides
Business Report
Free Key Highlights Business Summary Slide for PowerPoint & Google Slides
Accomplishment
Free
Stacked Area Chart with Financial Highlights for PowerPoint & Google Slides
Finance
Mind Map PowerPoint template for PowerPoint & Google Slides
Mind Maps
Editable Colombia Map PowerPoint Template for PowerPoint & Google Slides
Business Models
World Map Data template for PowerPoint & Google Slides
World Maps
Creative World Map template for PowerPoint & Google Slides
World Maps
Interactive US Population Data Map Slide Template for PowerPoint & Google Slides
World Maps
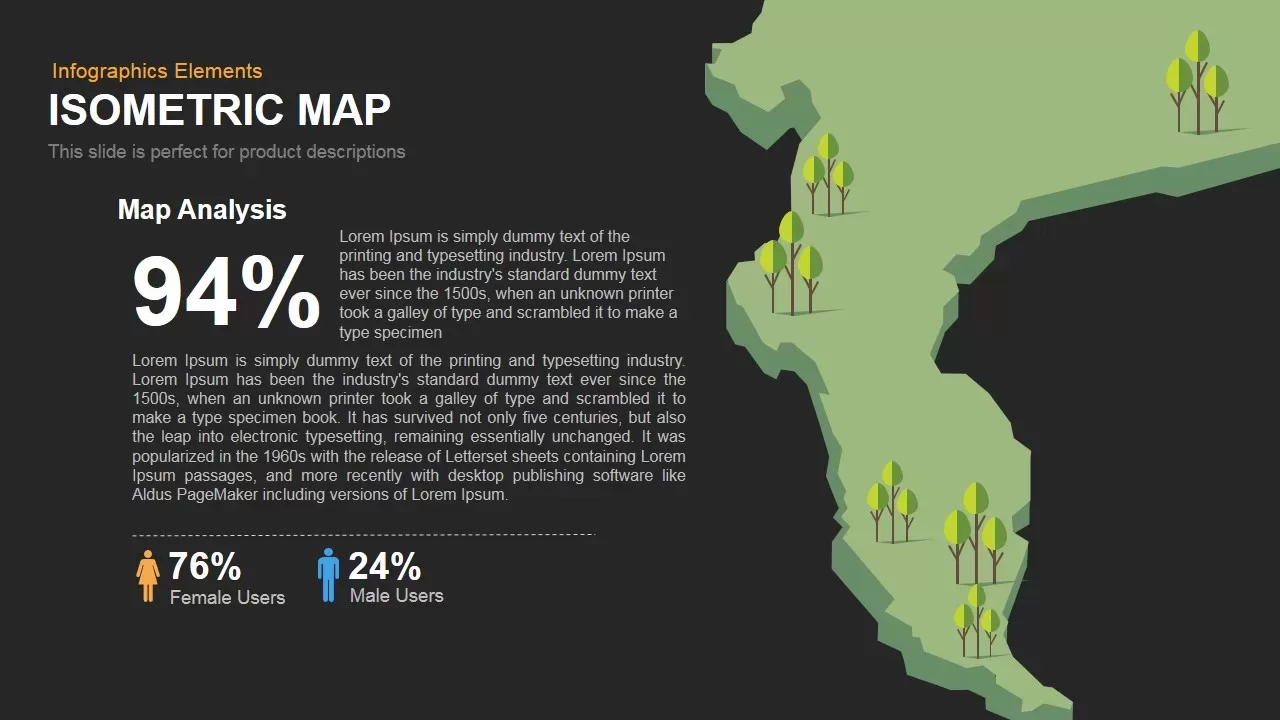
Isometric Map Analysis Slide Template for PowerPoint & Google Slides
World Maps
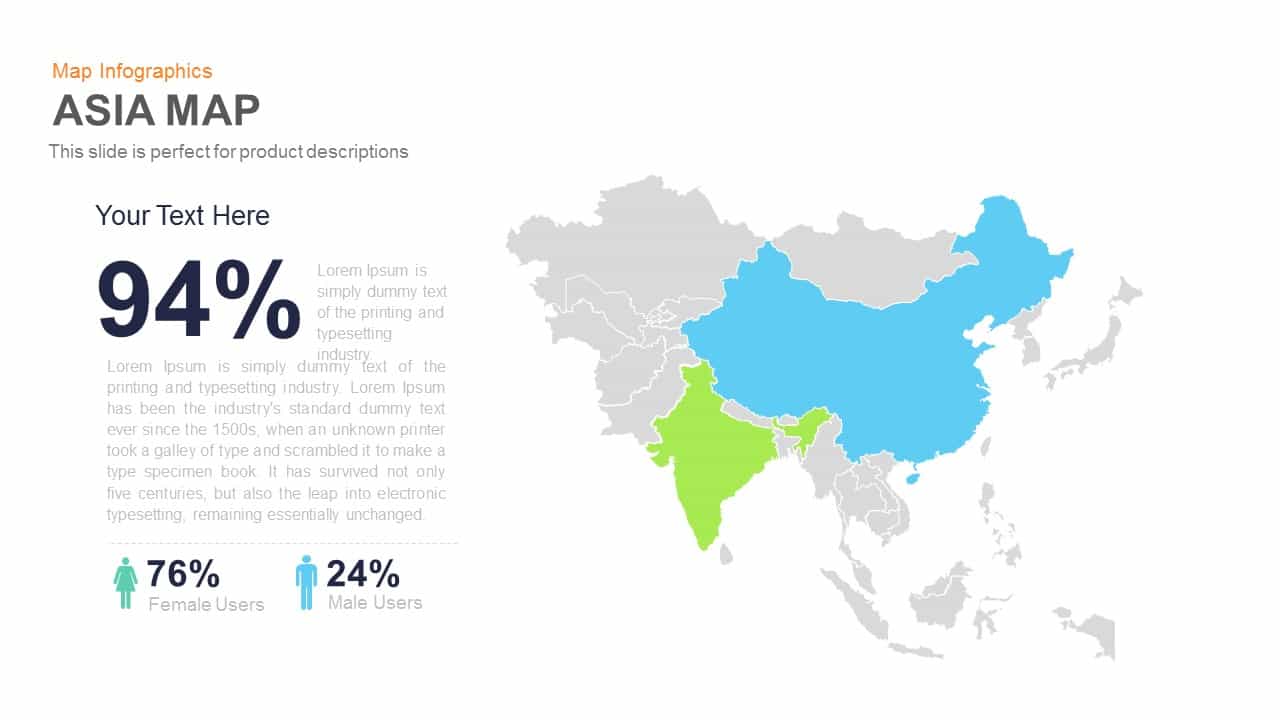
Asia Map with KPI Metrics and Legend Template for PowerPoint & Google Slides
World Maps
Diamond Mind Map Diagram Four Branches Template for PowerPoint & Google Slides
Mind Maps
Asia Map Infographic with Demographics template for PowerPoint & Google Slides
World Maps

Simple Multi-Branch Mind Map Template for PowerPoint & Google Slides
Mind Maps
Customizable USA Map With State Markers Template for PowerPoint & Google Slides
World Maps
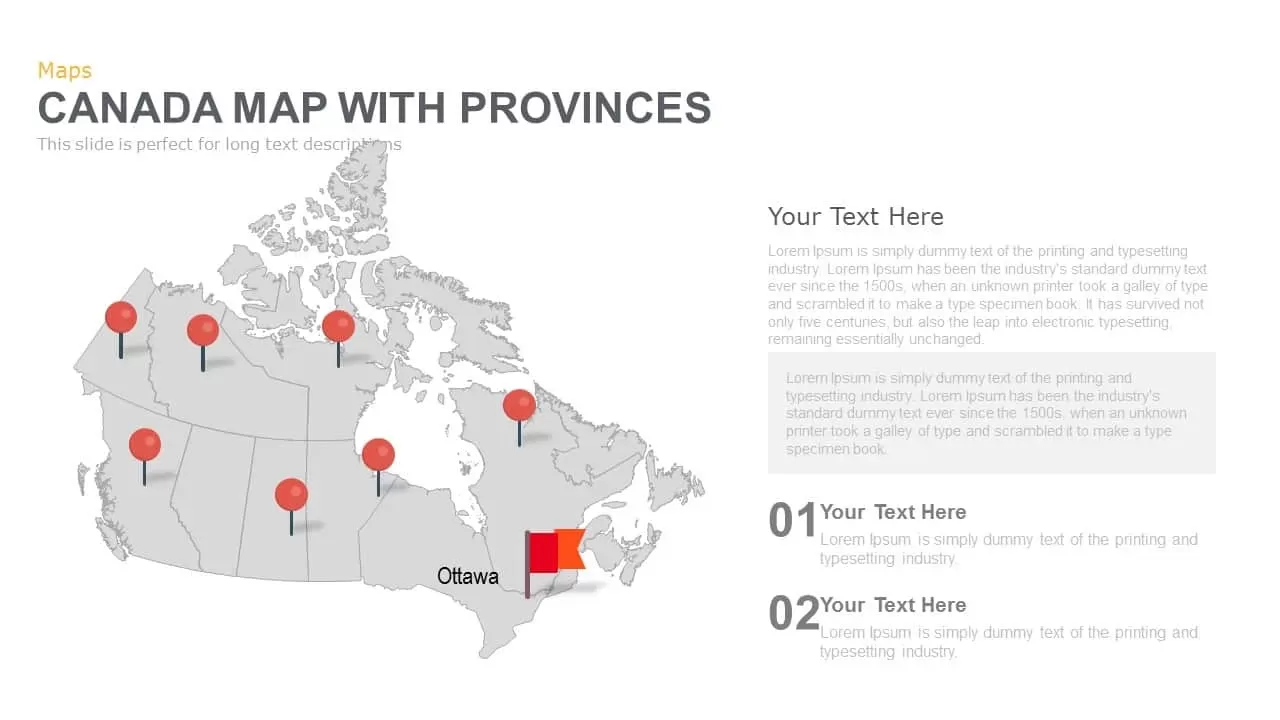
Canada Provinces Map Multi-Layout Template for PowerPoint & Google Slides
World Maps
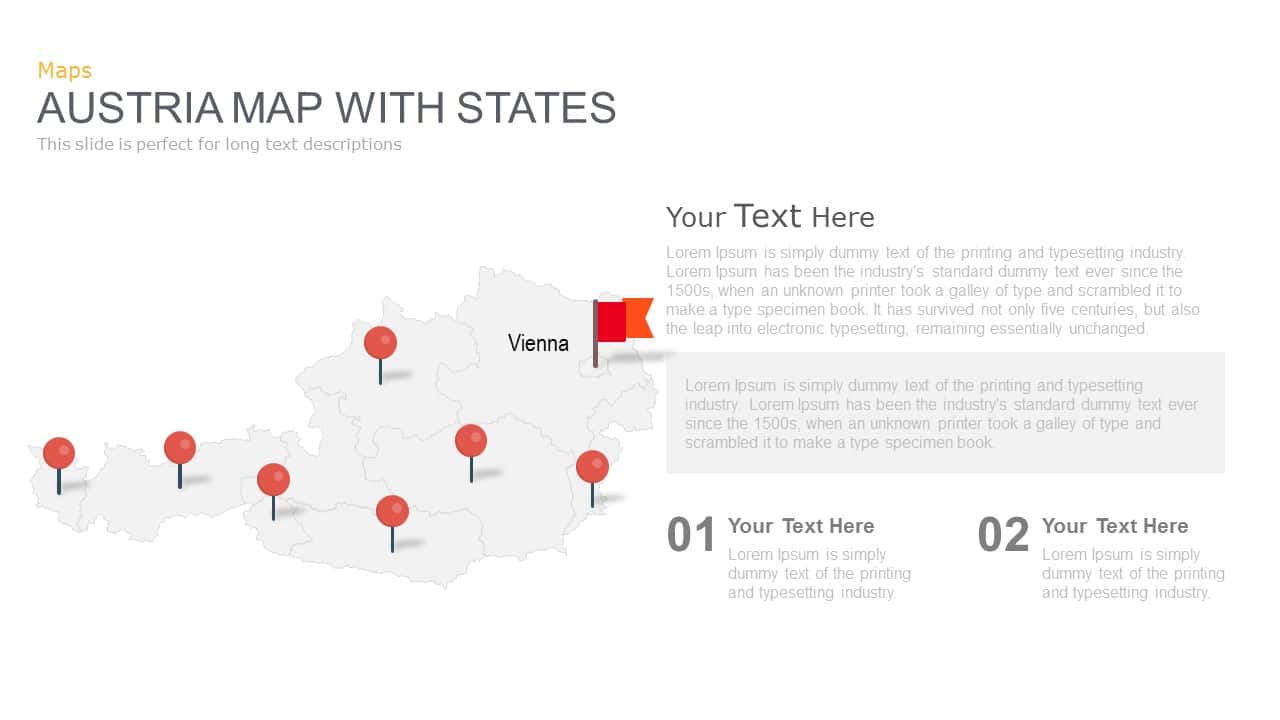
Austria Map With State Markers Template for PowerPoint & Google Slides
World Maps
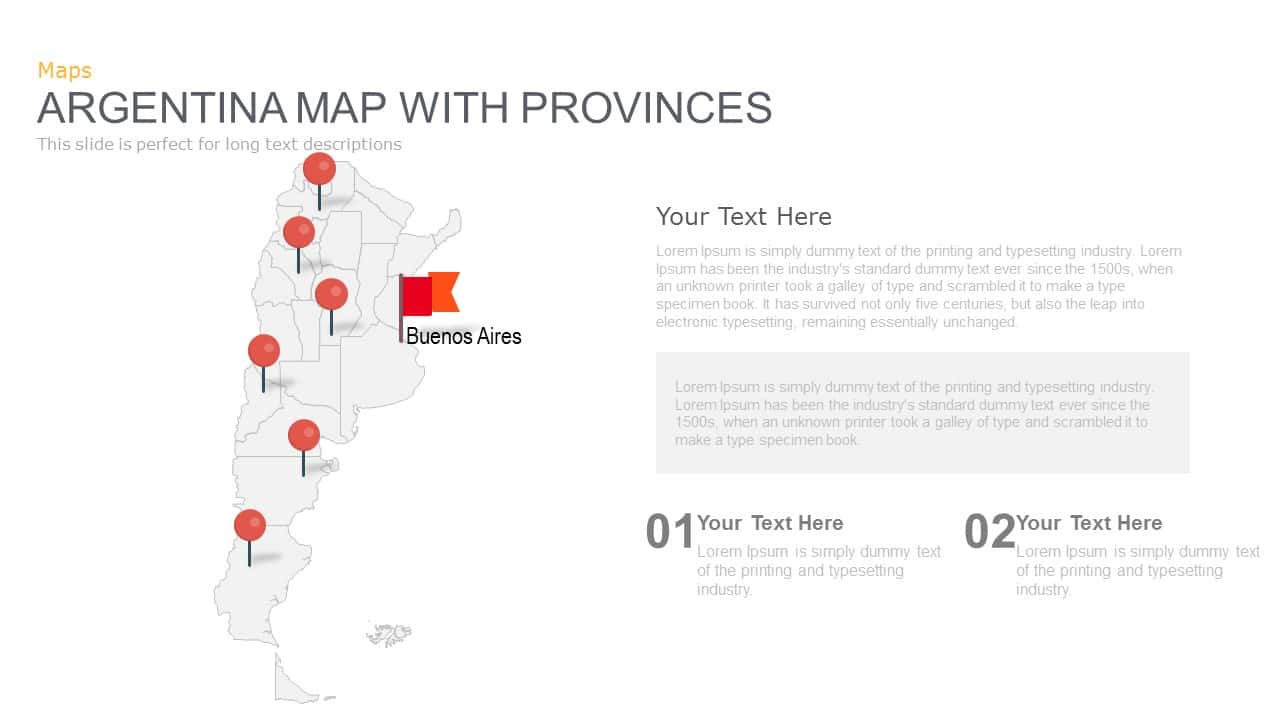
Argentina Province Map Markers Template for PowerPoint & Google Slides
World Maps
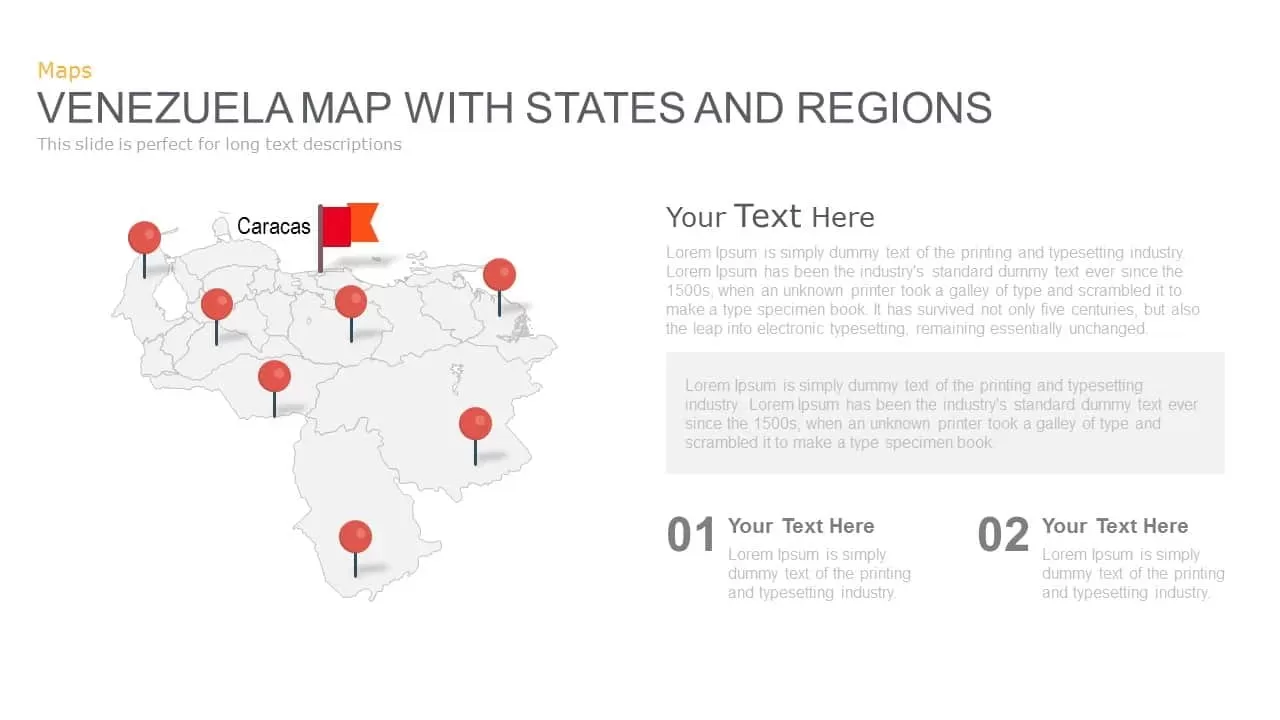
Venezuela Map with States and Regions Template for PowerPoint & Google Slides
World Maps
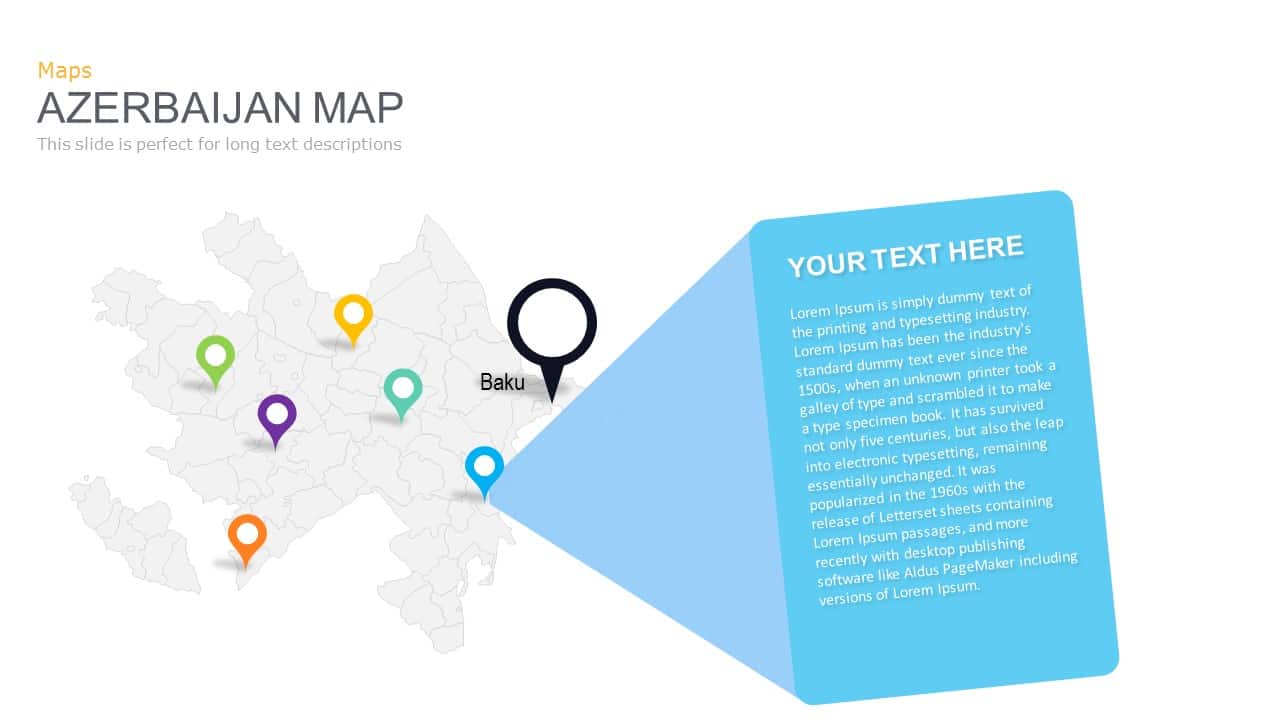
Azerbaijan Map with Provinces & Callouts Template for PowerPoint & Google Slides
World Maps
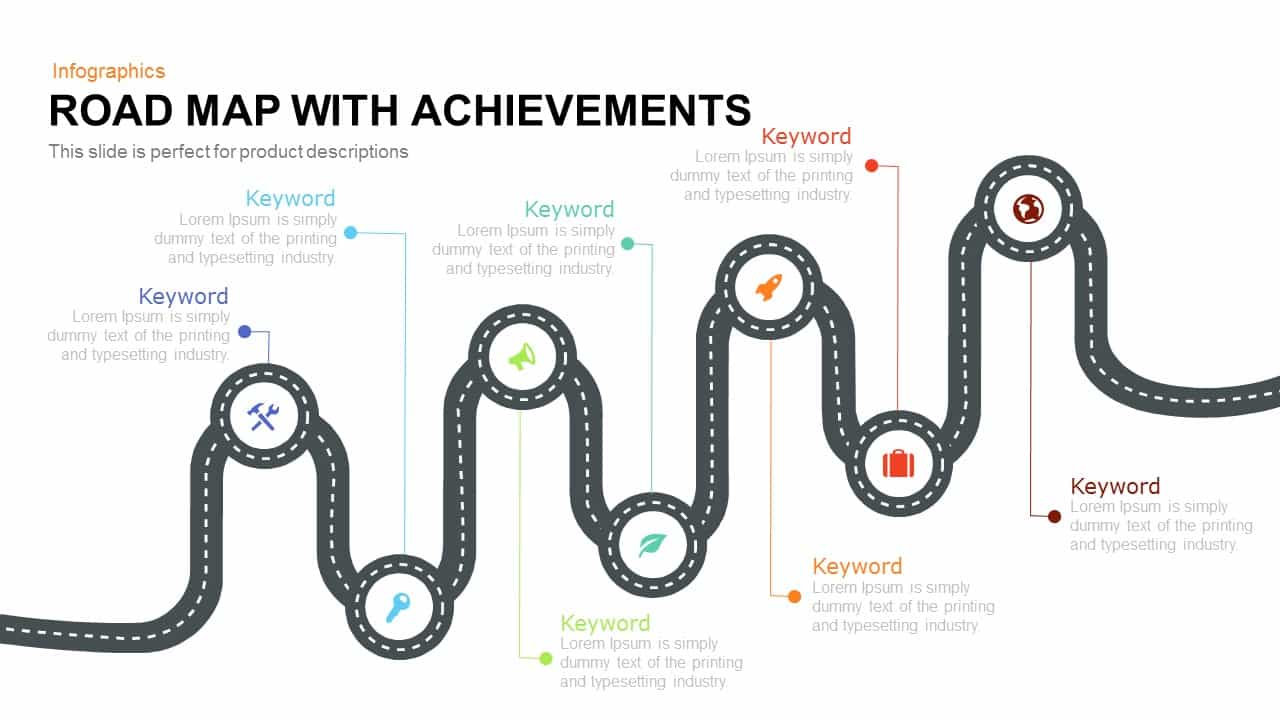
Road Map with Achievements Milestones Template for PowerPoint & Google Slides
Roadmap
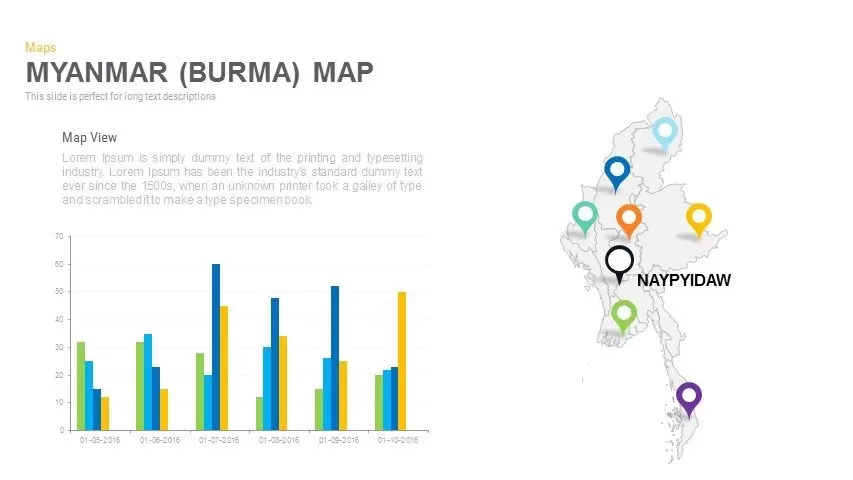
Myanmar (Burma) Provincial Map Infographic Template for PowerPoint & Google Slides
Maps
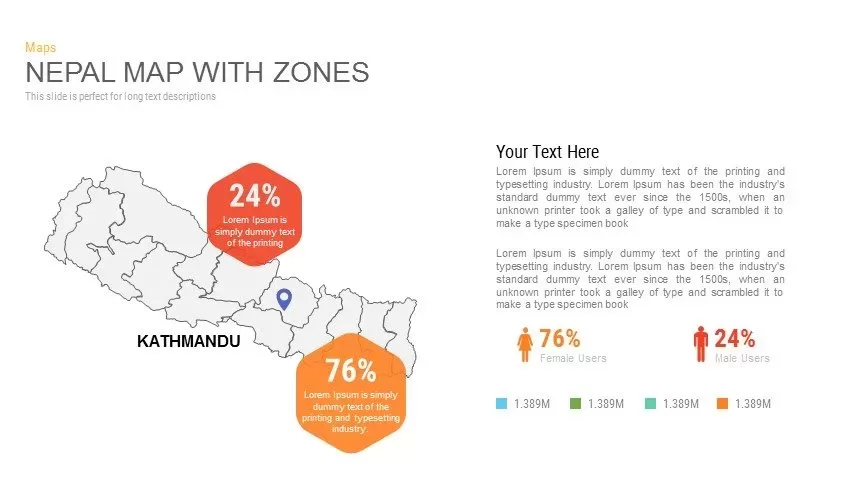
Nepal Map with Zones Infographic Template for PowerPoint & Google Slides
Maps
North Korea Map with Provinces Infographic Pack Template for PowerPoint & Google Slides
Maps
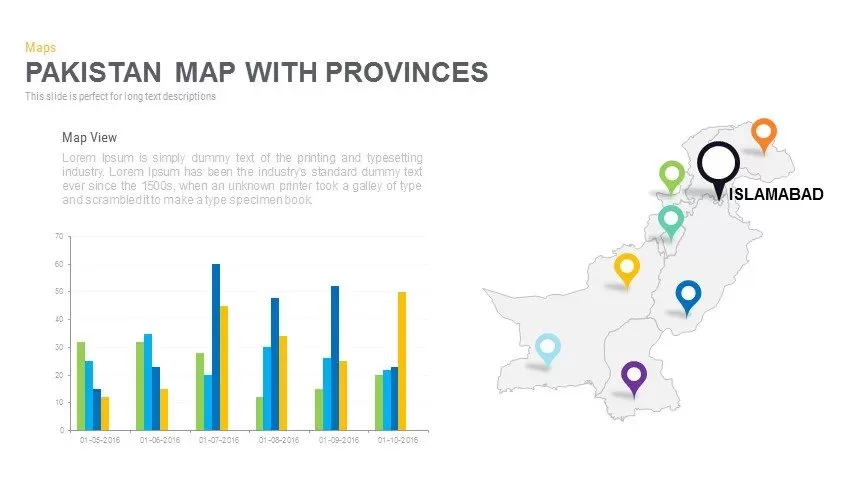
Pakistan Provinces Map Infographic Pack Template for PowerPoint & Google Slides
Maps
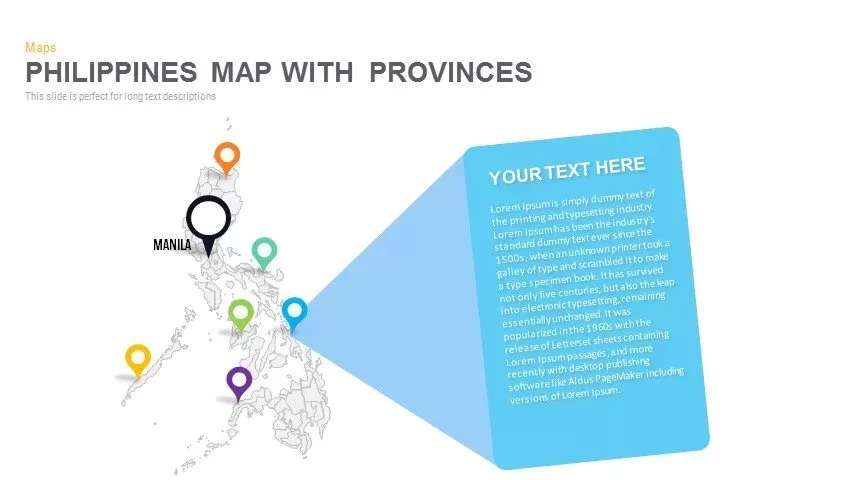
Philippines Map with Provinces Pack Template for PowerPoint & Google Slides
Maps
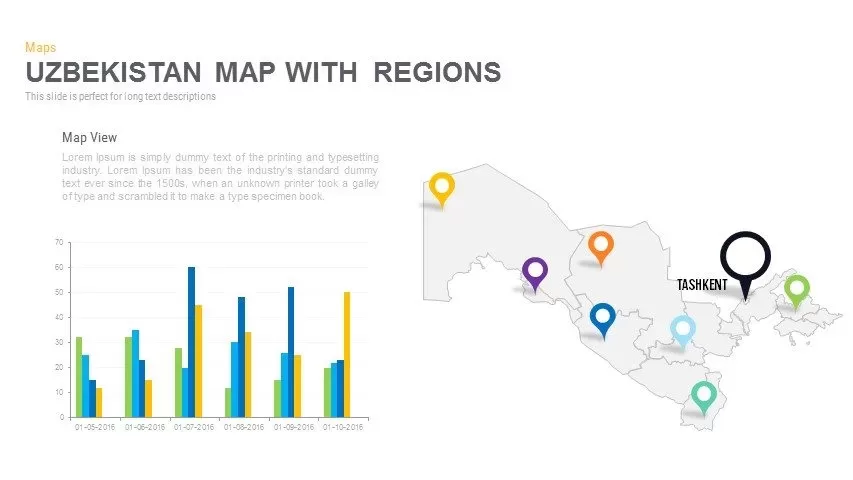
Uzbekistan Map with Regions Pack Template for PowerPoint & Google Slides
Maps
Vietnam Provinces Map Infographic Pack Template for PowerPoint & Google Slides
Maps
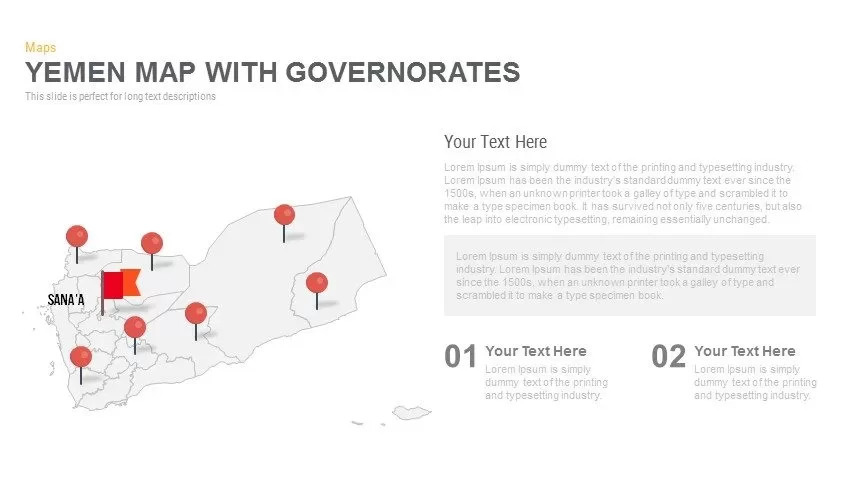
Yemen Governorates Infographic Map Template for PowerPoint & Google Slides
Maps
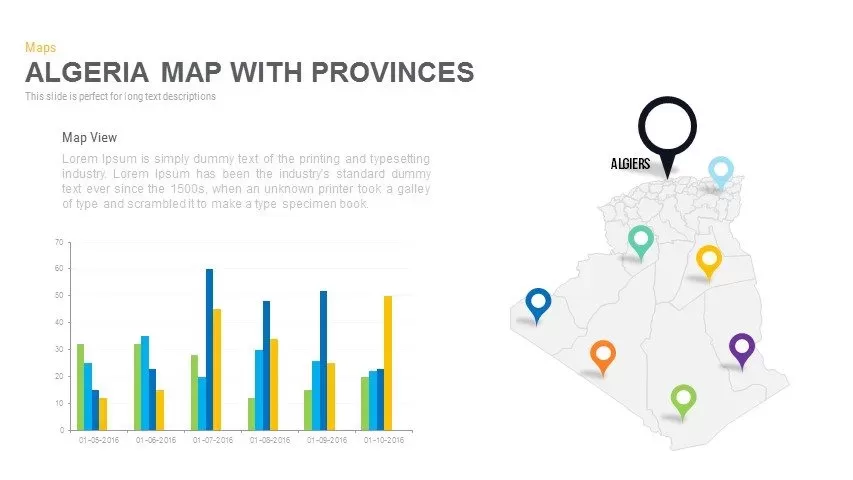
Algeria Map with Provinces Pack Template for PowerPoint & Google Slides
Maps
Angola Provinces Map Slide Pack Template for PowerPoint & Google Slides
World Maps
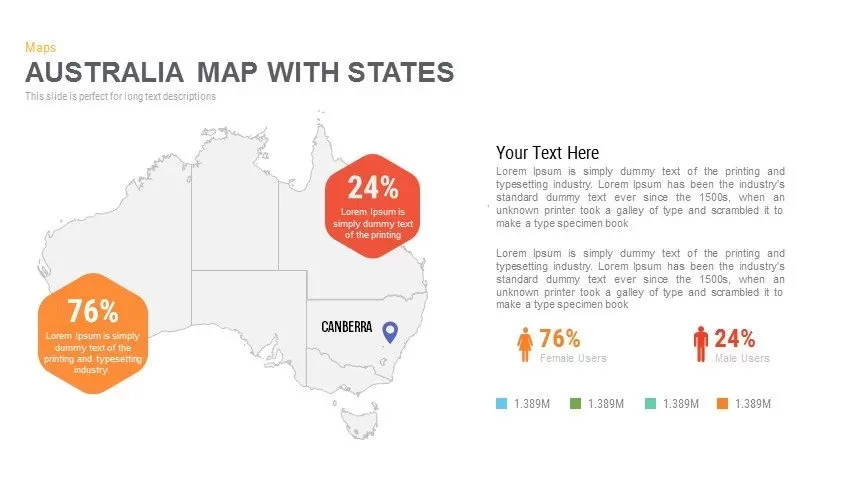
Australia Map with State Markers Template for PowerPoint & Google Slides
Maps
DR Congo Prefecture Map Slide Pack Template for PowerPoint & Google Slides
World Maps
Egypt Regional Map Slide Pack Template for PowerPoint & Google Slides
World Maps
Ethiopia Map with Regions Slide Pack Template for PowerPoint & Google Slides
World Maps
Iran Map with Provinces Slide Pack Template for PowerPoint & Google Slides
World Maps

Road Map Timeline Presentation template for PowerPoint & Google Slides
Roadmap

Global Map with Location Markers Template for PowerPoint & Google Slides
World Maps

Multi-Cluster Mind Map Infographic Template for PowerPoint & Google Slides
Mind Maps
Mind Map Infographics template for PowerPoint & Google Slides
Mind Maps

Modern World Map Callout Infographic Template for PowerPoint & Google Slides
World Maps
Eight-Node Mind Map Infographic Diagram Template for PowerPoint & Google Slides
Mind Maps
Six-Stage Road Map Infographic Timeline Template for PowerPoint & Google Slides
Roadmap
Versatile Mind Map Infographic Template for PowerPoint & Google Slides
Mind Maps
Concept Map Presentation Template for PowerPoint & Google Slides
Mind Maps
Structured Mind Map Infographic Diagram Template for PowerPoint & Google Slides
Mind Maps
Dual Topic Mind Map Infographic Template for PowerPoint & Google Slides
Mind Maps
Tri-Cluster Mind Map Infographic Template for PowerPoint & Google Slides
Mind Maps
Editable World Map Callout Infographic Template for PowerPoint & Google Slides
World Maps
Editable World Map Callout Infographic Template for PowerPoint & Google Slides
World Maps
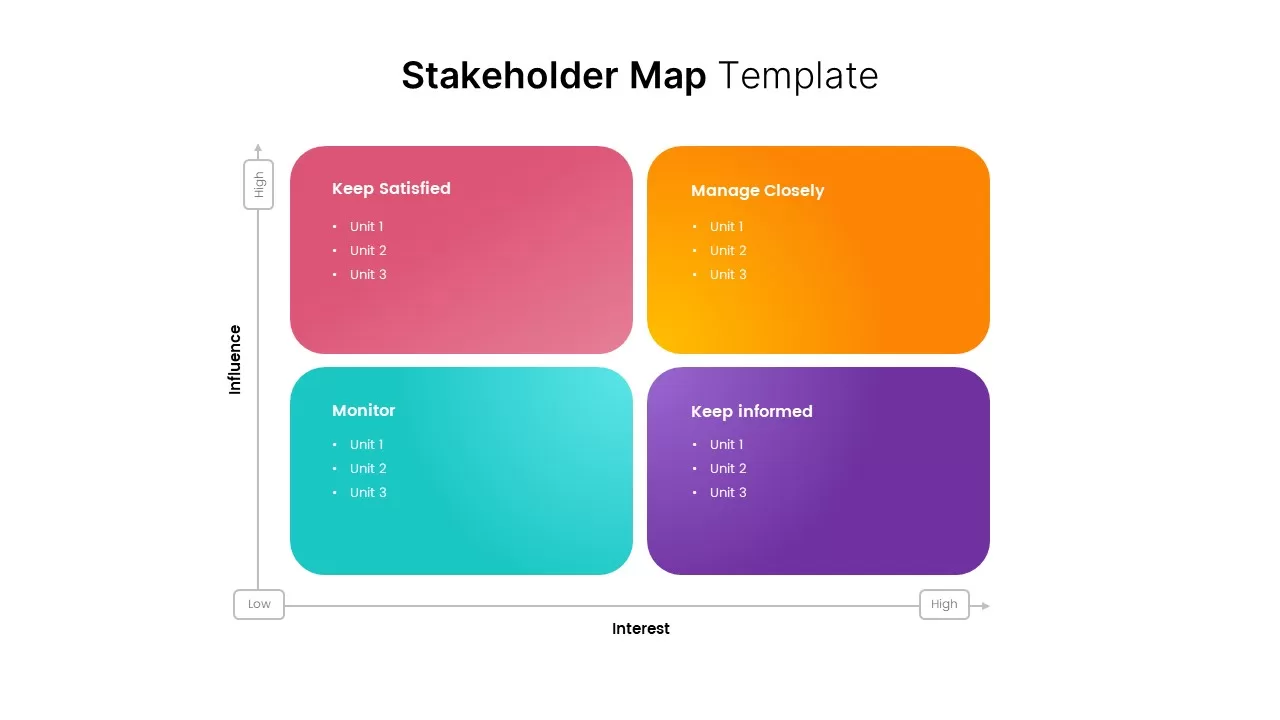
Stakeholder Map Template for PowerPoint & Google Slides
Business
Mind Map Template for PowerPoint & Google Slides
Mind Maps
Colorful Mind Map Template for PowerPoint & Google Slides
Mind Maps
Colorful Mind Map Template for PowerPoint & Google Slides
Mind Maps
North America Map Infographic Slide Template for PowerPoint & Google Slides
World Maps
North America Regional Map Overview Template for PowerPoint & Google Slides
World Maps
Customizable Canada Map Outline Template for PowerPoint & Google Slides
World Maps
Heat Map Analysis Template for PowerPoint & Google Slides
Risk Management
Heat Map Risk Assessment Presentation Template for PowerPoint & Google Slides
Risk Management
Professional Risk Heat Map Visualization Template for PowerPoint & Google Slides
Risk Management
Professional Interactive Heat Map Matrix Template for PowerPoint & Google Slides
Comparison Chart
Heat Map Risk Matrix Dashboard Template for PowerPoint & Google Slides
Comparison Chart
Connect the Dots Mind Map Diagram Template for PowerPoint & Google Slides
Mind Maps
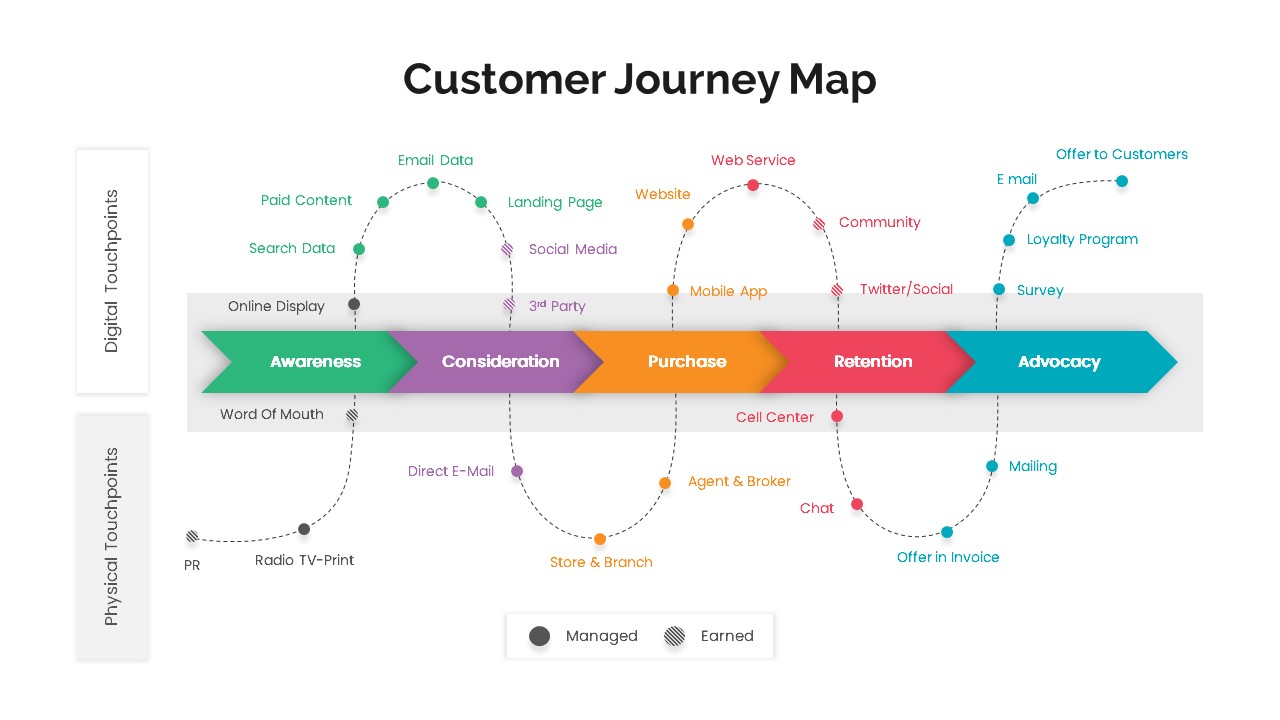
Versatile Customer Journey Map Template for PowerPoint & Google Slides
Customer Journey
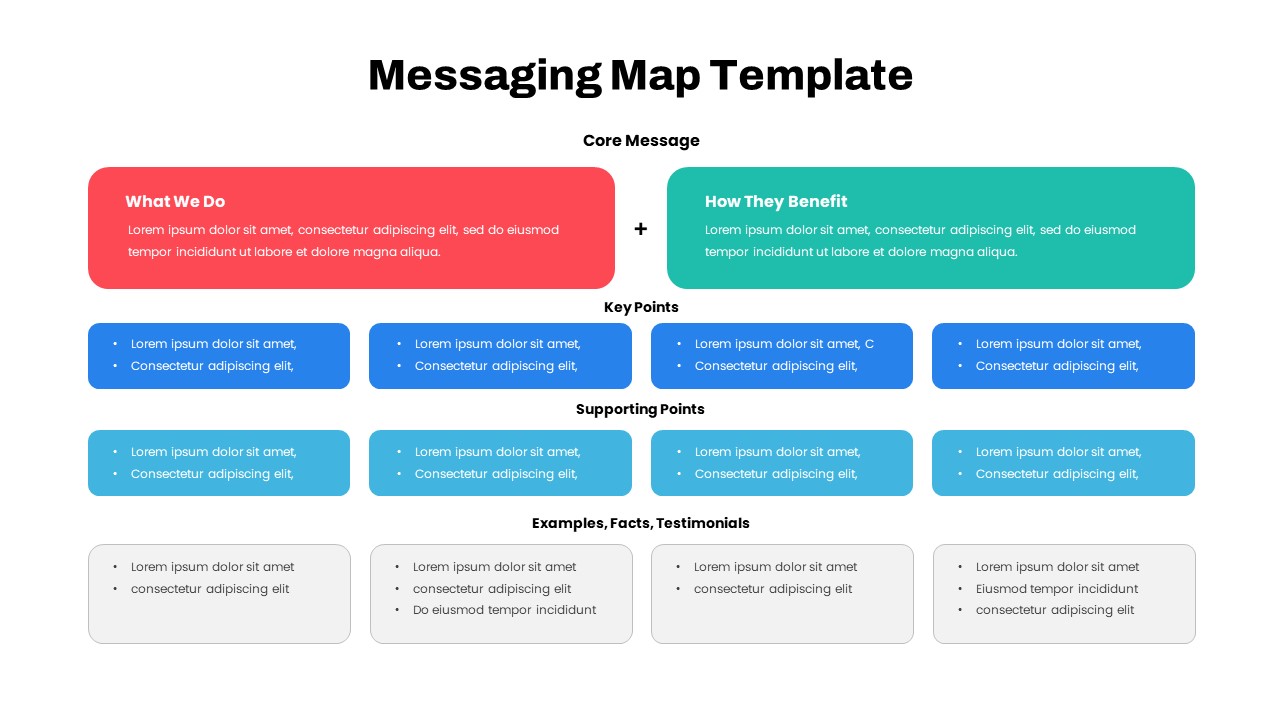
Comprehensive Messaging Map Framework Template for PowerPoint & Google Slides
Process
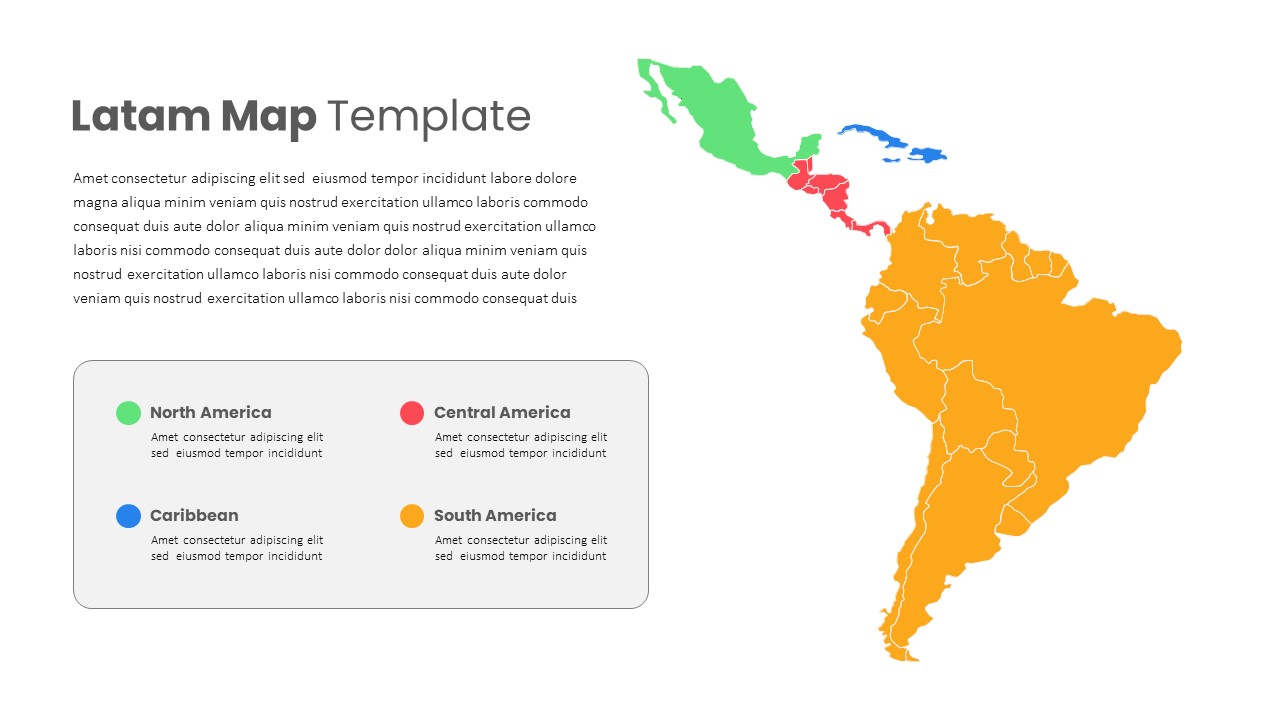
Latin America Regional Map Breakdown Template for PowerPoint & Google Slides
World Maps
Free Editable U.S. Map with Regional Metrics Template for PowerPoint & Google Slides
World Maps
Free
Free Global Market Distribution Map Template for PowerPoint & Google Slides
World Maps
Free
UK Counties Map Data Visualization Template for PowerPoint & Google Slides
World Maps
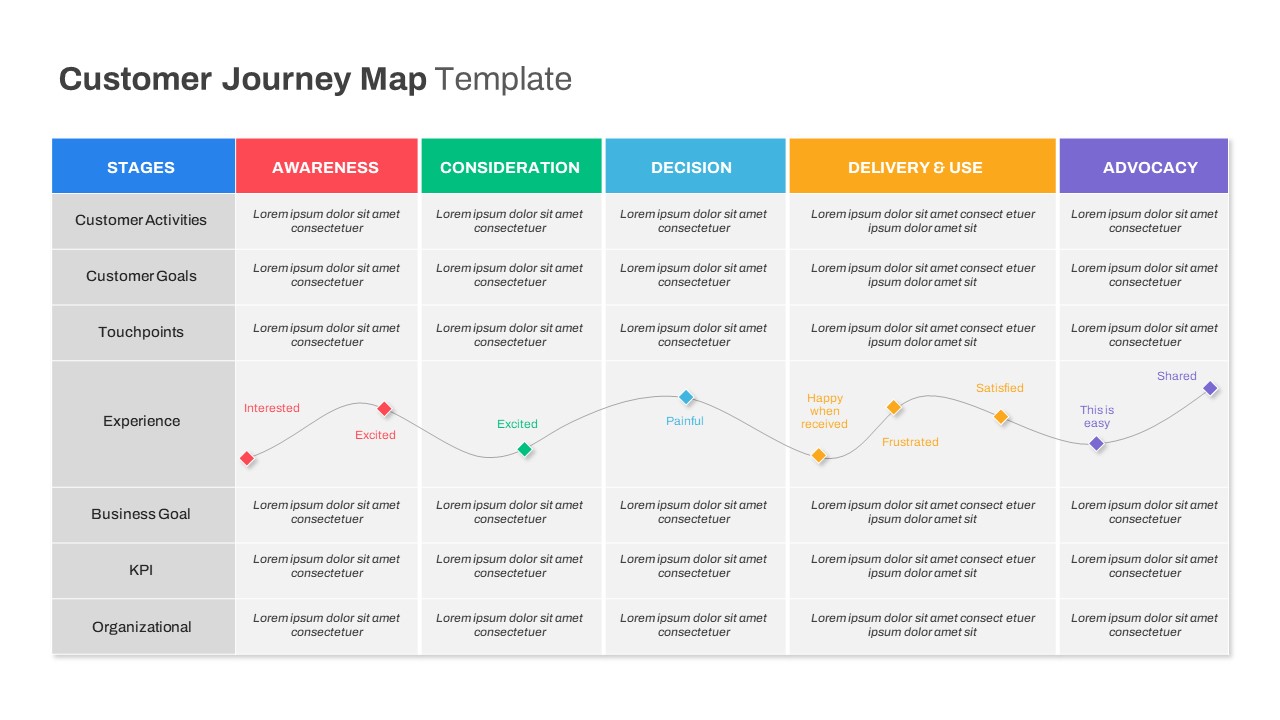
Comprehensive Customer Journey Map Template for PowerPoint & Google Slides
Customer Journey
Modern Custom Eight-Branch Mind Map Template for PowerPoint & Google Slides
Mind Maps
Louisiana Parish Map with Markers Template for PowerPoint & Google Slides
Maps
Colorful Multi-Branch Mind Map Slide Template for PowerPoint & Google Slides
Mind Maps
Eight-Step Job Hiring Mind Map Template for PowerPoint & Google Slides
Mind Maps
Michigan County Map with KPI Dashboard Template for PowerPoint & Google Slides
World Maps
Pennsylvania State Map Diagram Template for PowerPoint & Google Slides
World Maps
Editable Ireland Map Infographic Slide Template for PowerPoint & Google Slides
World Maps
Free
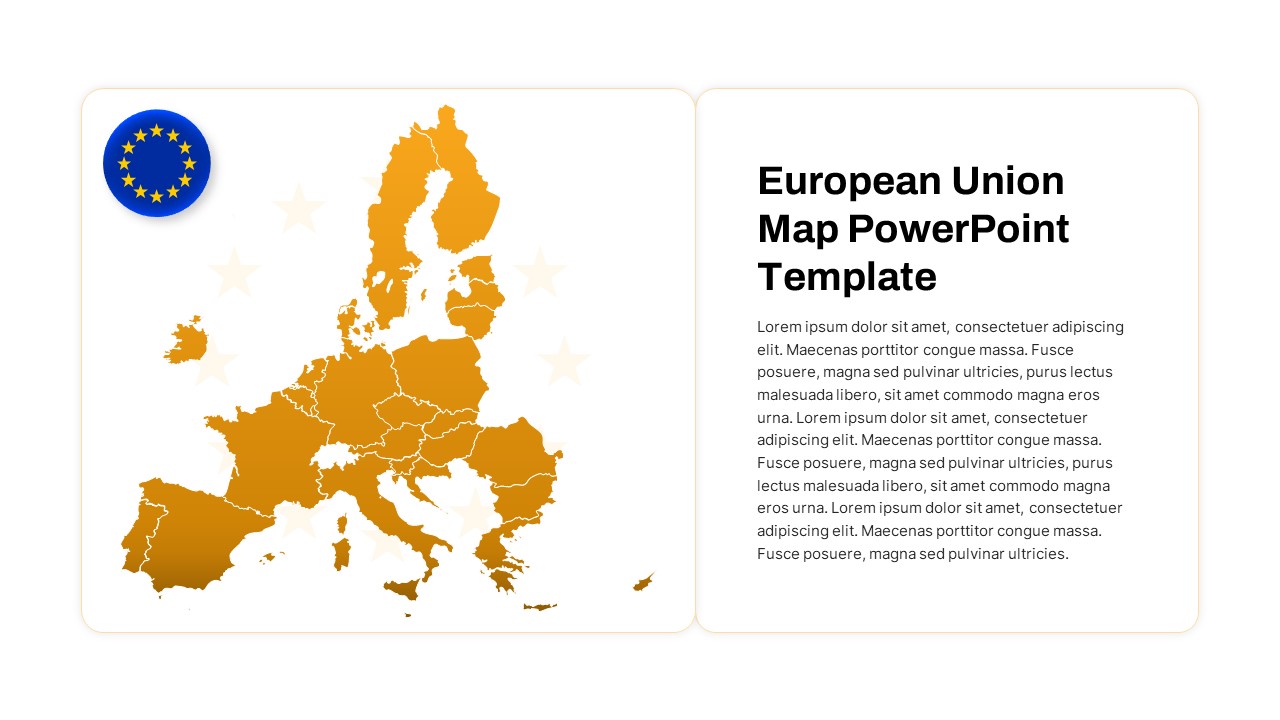
European Union Map Infographic Template for PowerPoint & Google Slides
World Maps
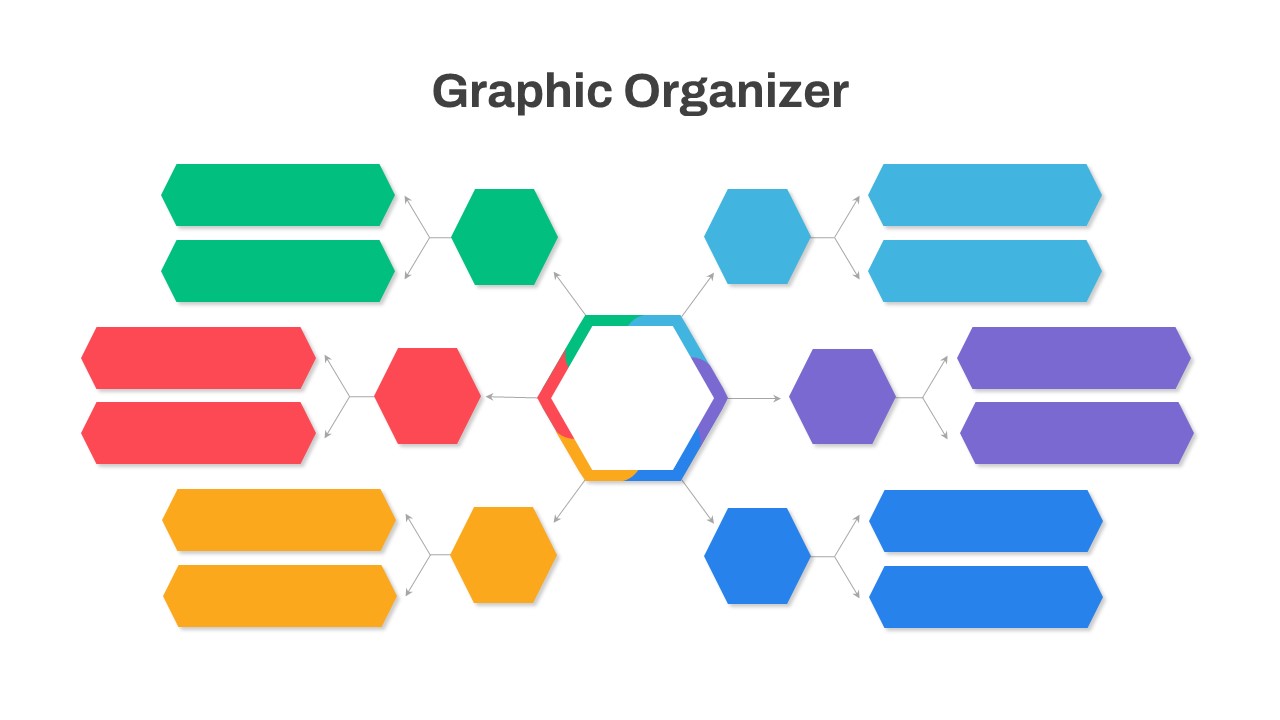
Graphic Organizer & Double Bubble Map Template for PowerPoint & Google Slides
Maps
Syria Regional Data Map Infographic Template for PowerPoint & Google Slides
World Maps
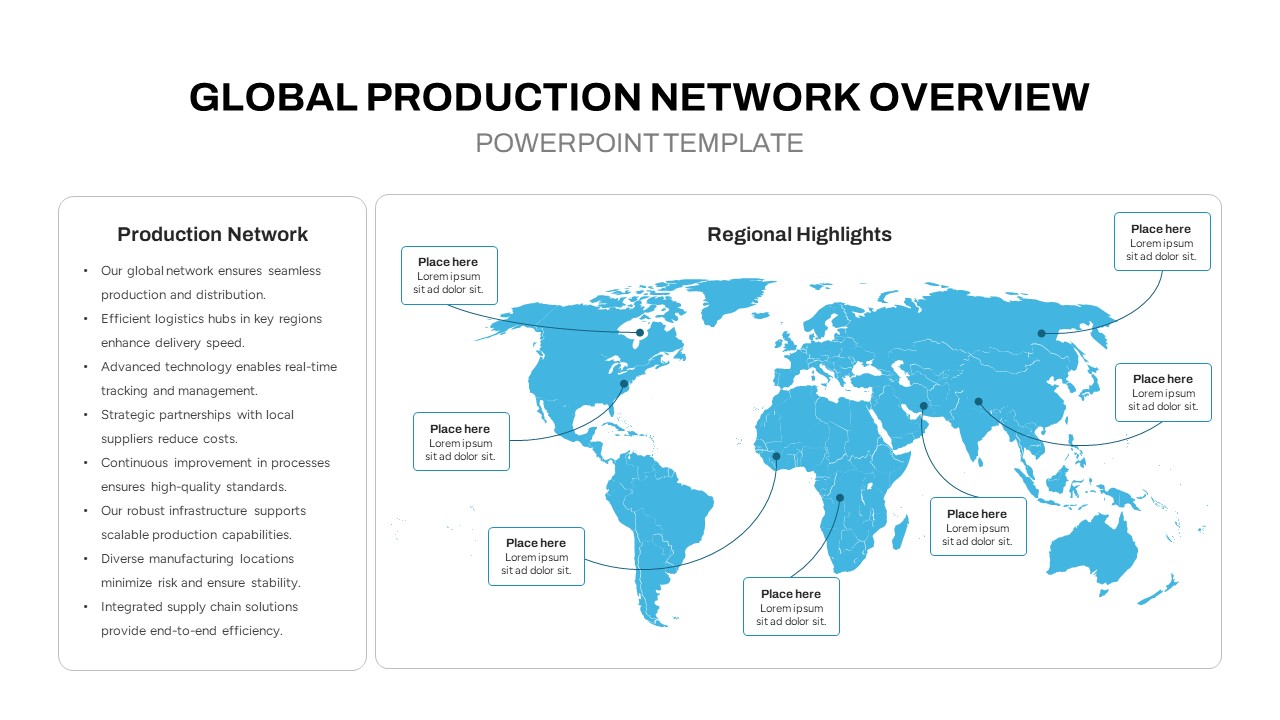
Global Production Network Overview Map Template for PowerPoint & Google Slides
World Maps
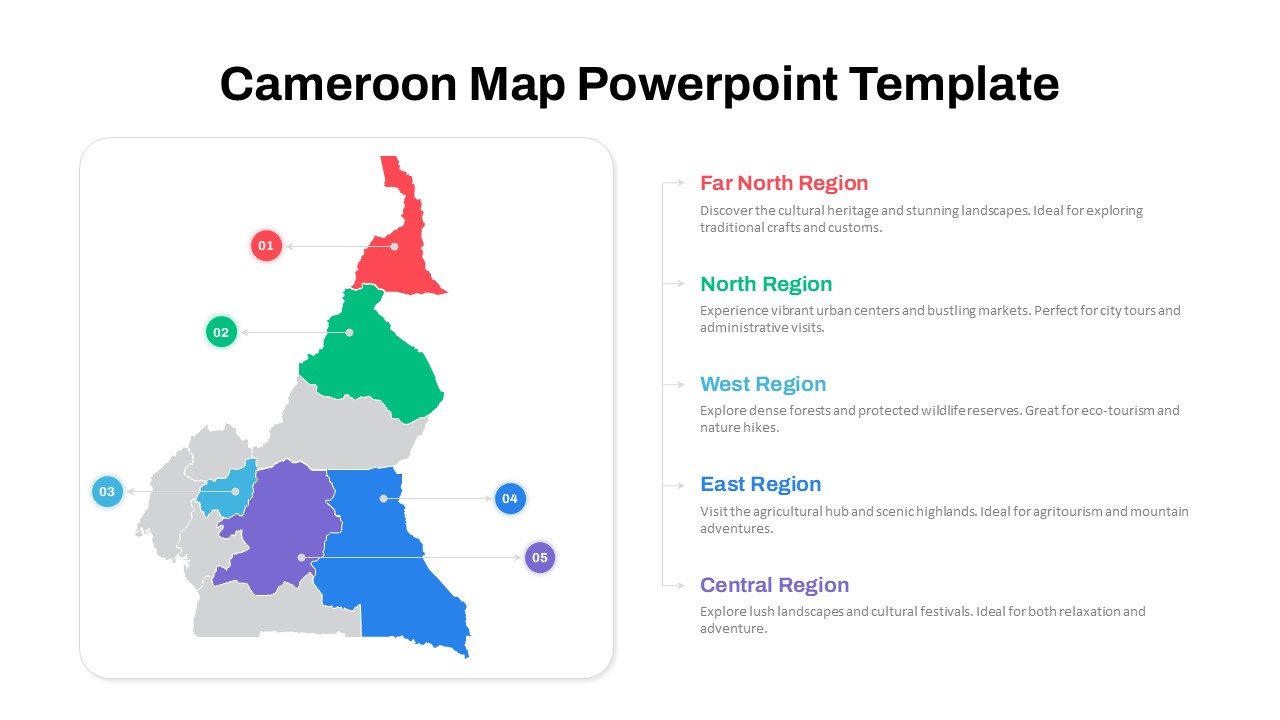
Numbered Cameroon Regional Map Slide Template for PowerPoint & Google Slides
World Maps
AI Mind Map & Hub-and-Spoke Diagram Template for PowerPoint & Google Slides
Mind Maps
Interactive Taiwan Map Highlight Template for PowerPoint & Google Slides
World Maps
South America Map template for PowerPoint & Google Slides
Maps
Editable South America Map Diagram Template for PowerPoint & Google Slides
Maps
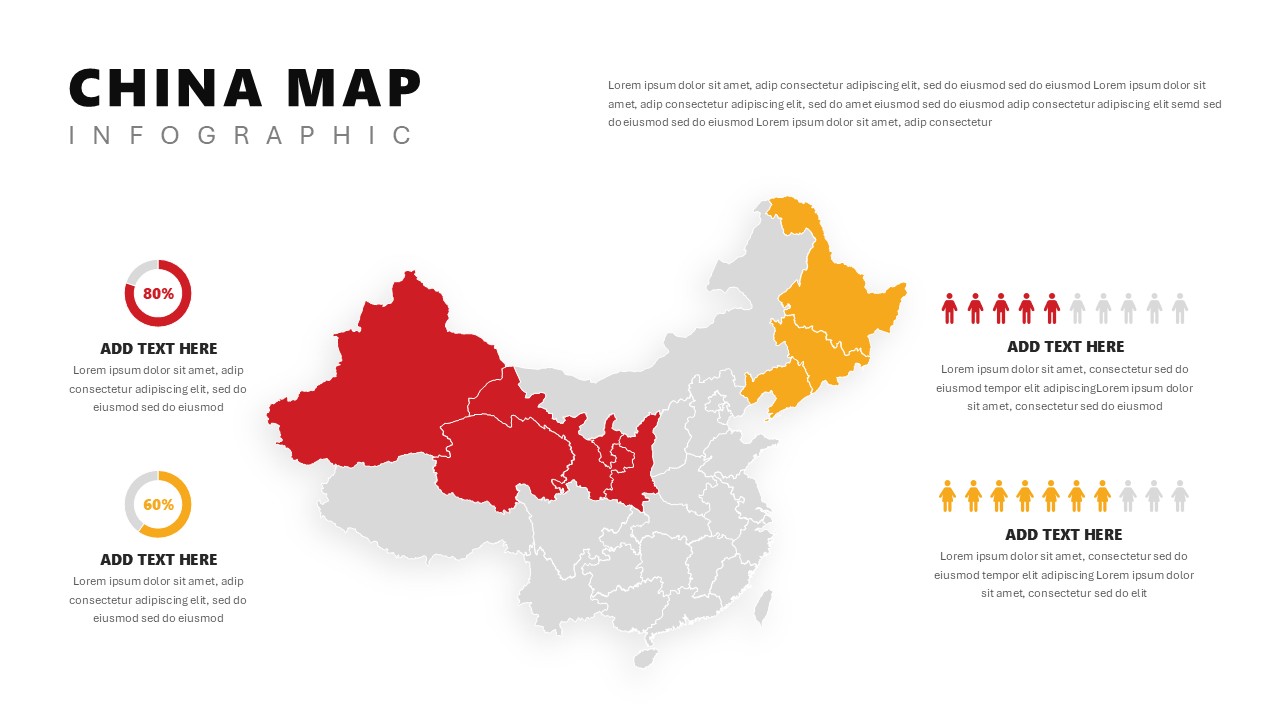
China Map Infographic Regional Stats Template for PowerPoint & Google Slides
World Maps
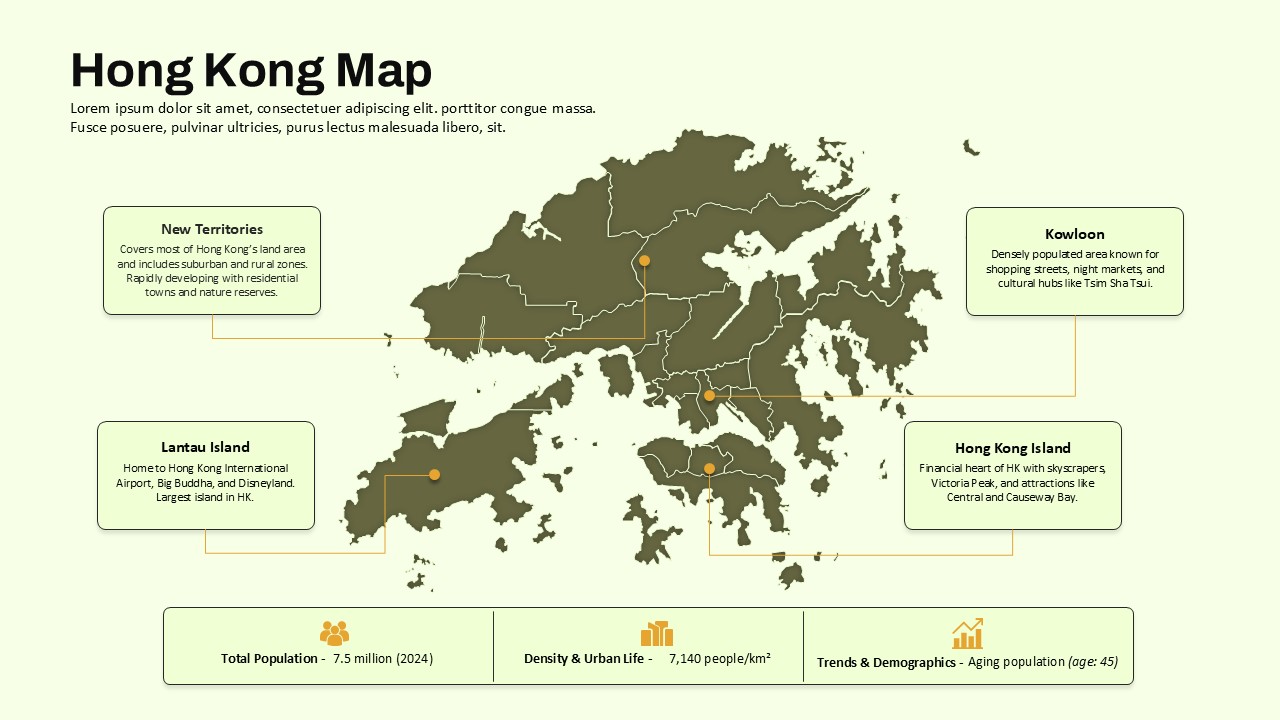
Hong Kong Geographic Map Infographic Template for PowerPoint & Google Slides
World Maps
Employee Journey Map with Stages template for PowerPoint & Google Slides
Recruitment
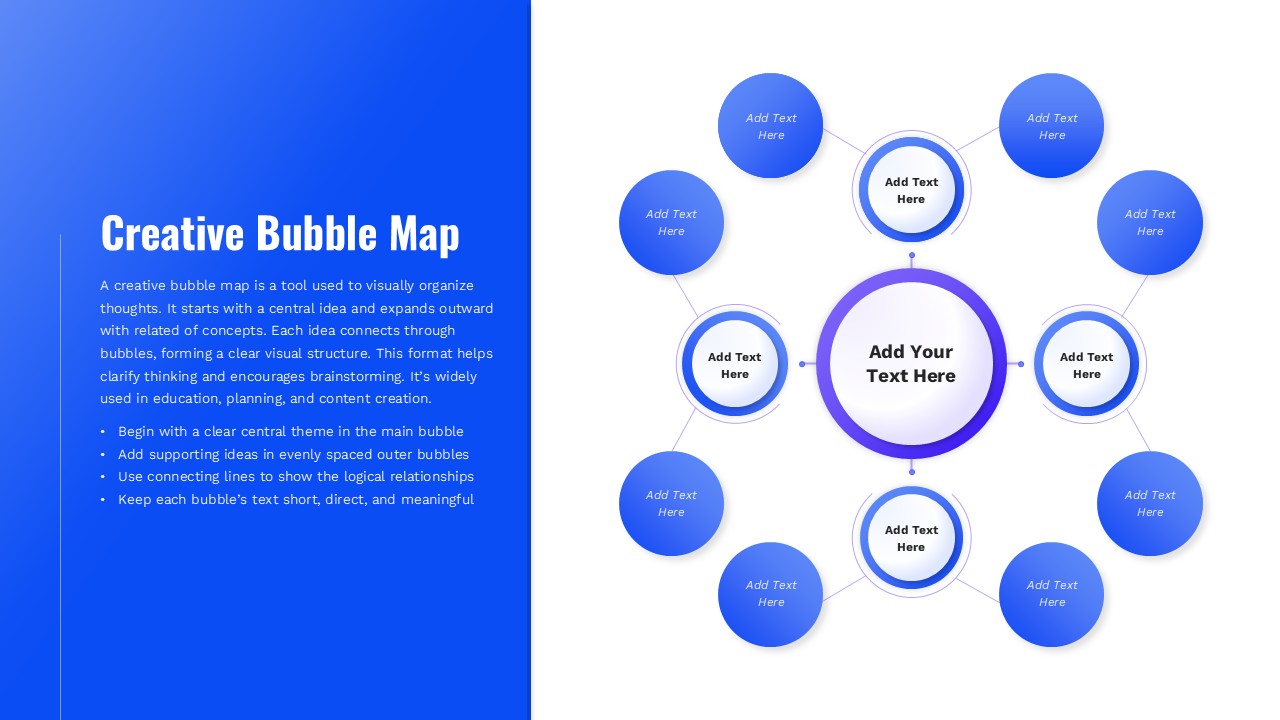
Creative Bubble Mind Map Template for PowerPoint & Google Slides
Mind Maps