Data Migration Life Cycle Curved Diagram Template for PowerPoint & Google Slides


Description
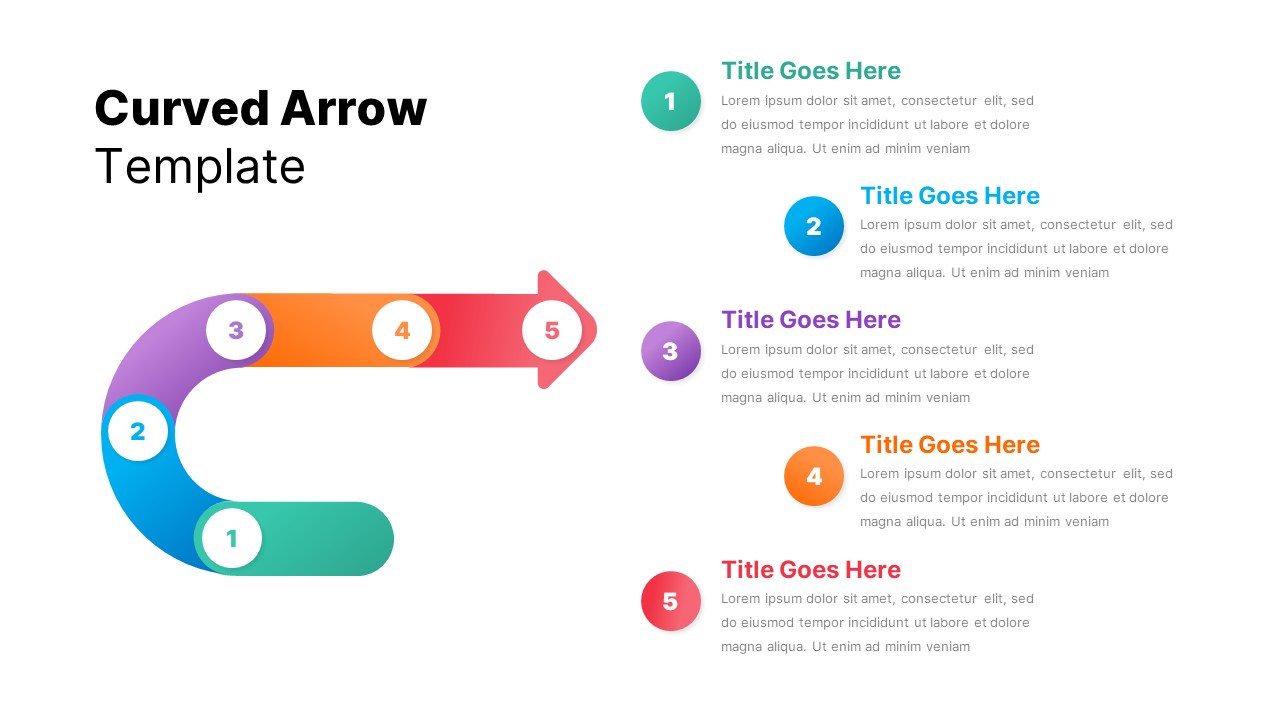
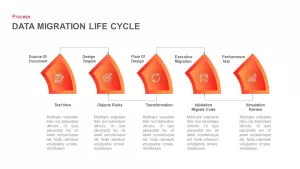
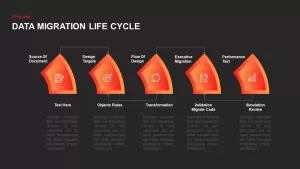
This slide visualizes the data migration life cycle through five sequential, curved segments rendered in a seamless orange-to-red gradient, mapped to each critical phase: Source of Document, Design Targets, Flow of Design, Executive Migration, and Performance Test. Intuitive icons anchor each segment, while arrows and connector lines highlight inter-phase dependencies and data flow. The crisp white backdrop, modern sans-serif typography, and subtle drop shadows reinforce a polished, professional aesthetic. Fully editable vector shapes, intuitive text placeholders, and master-slide integration empower you to swap icons, update phase titles, tweak gradient hues, or refine annotations in seconds—without disrupting alignment or design integrity. Whether you’re mapping ETL workflows, planning legacy system migrations, or training cross-functional teams on transfer protocols, this infographic communicates complex processes with clarity and visual impact. The balanced composition and consistent spacing guide stakeholders effortlessly from one step to the next, making it ideal for executive briefings, technical workshops, project kickoffs, or boardroom presentations. Compatible with both PowerPoint and Google Slides, the slide maintains full-resolution fidelity and eliminates formatting conflicts. For greater flexibility, extend or condense the cycle by duplicating or removing curved segments and relabeling connectors to adapt the diagram to any five-step or variable-length process. Additionally, repurpose this layout for five-phase roadmaps, change-management plans, compliance checklists, or quality-assurance cycles by customizing labels and icons to suit diverse contexts and industries.
Who is it for
Process improvement specialists, project managers, operations teams, quality engineers, and data architects will leverage this diagram to illustrate migration workflows. It also serves IT consultants, systems integrators, technical trainers, and executive sponsors who need to convey structured, multi-phase initiatives.
Other Uses
Beyond data migration, this template can illustrate five-stage roadmaps, product launch schedules, training program agendas, risk assessment cycles, or compliance frameworks. Simply relabel segments and swap icons to adapt the diagram for marketing funnels, onboarding sequences, performance review processes, or any linear workflow.
Login to download this file

Item ID
SB01326
Related Templates

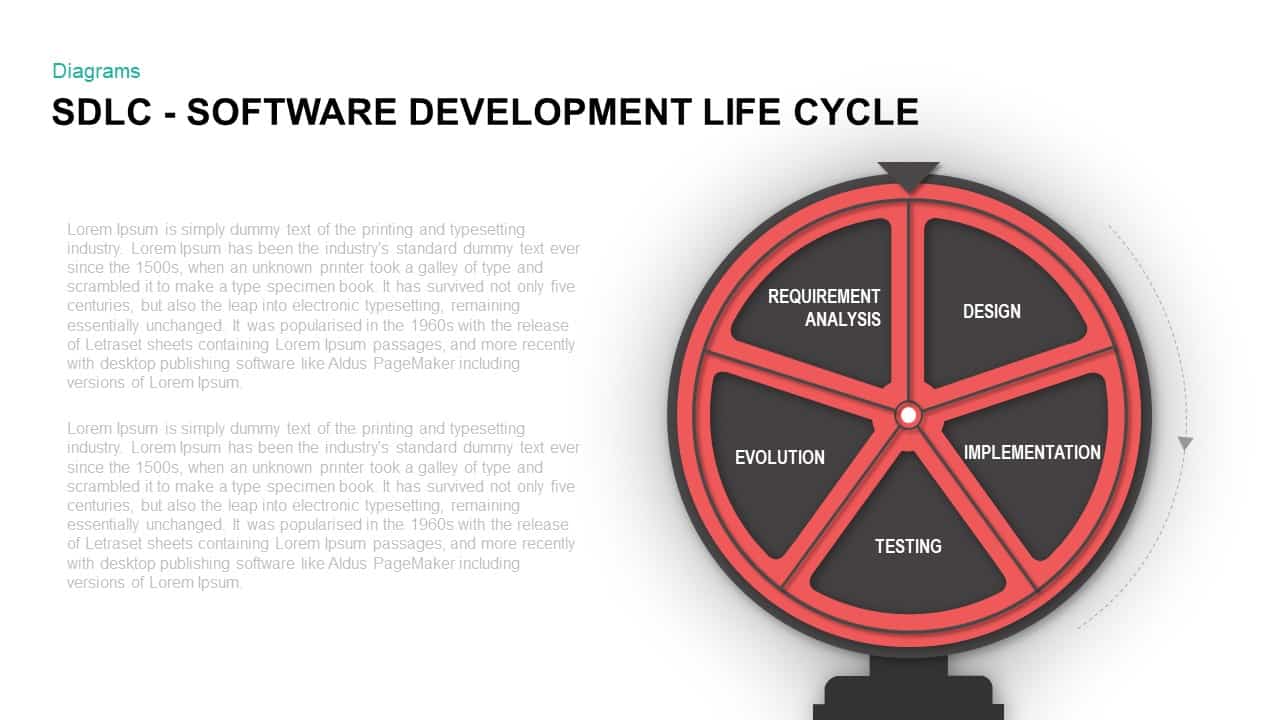
Software Development Life Cycle Diagram Template for PowerPoint & Google Slides
Circular
Multi-Style Project Life Cycle Diagram Template for PowerPoint & Google Slides
Process
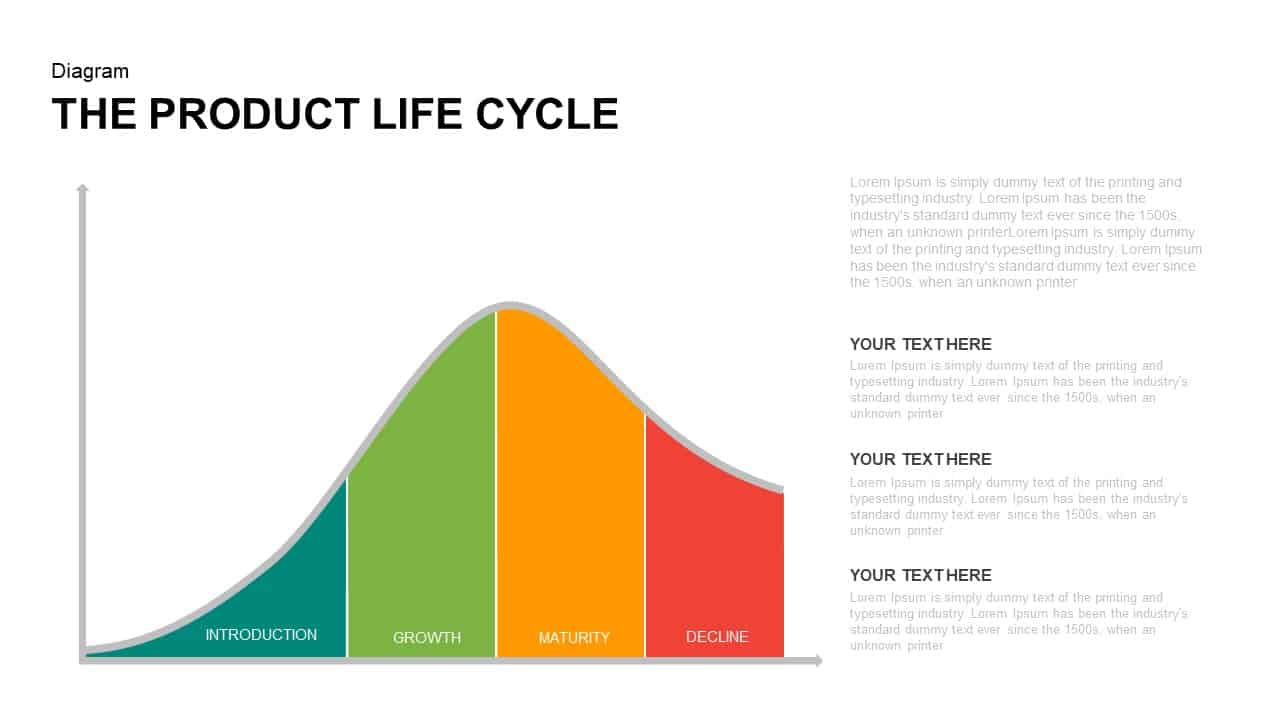
Corporate Product Life Cycle Diagram Template for PowerPoint & Google Slides
Process
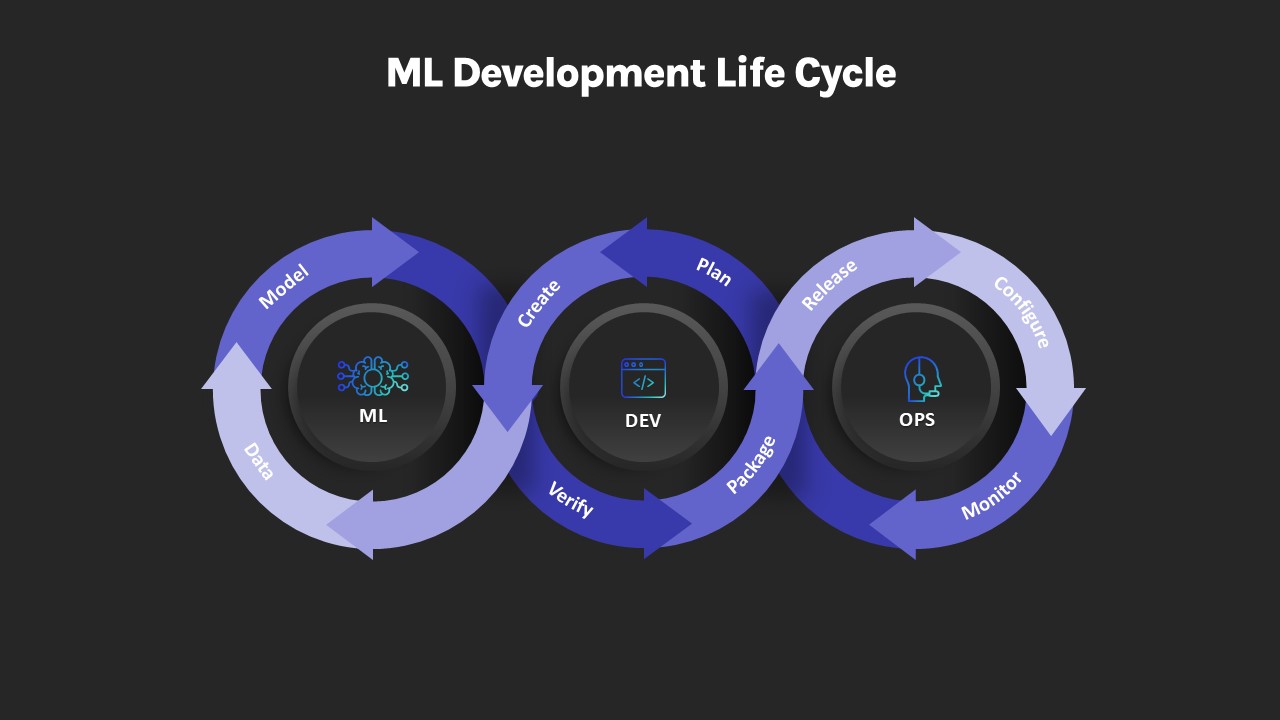
ML Development Life Cycle Diagram Template for PowerPoint & Google Slides
Machine Learning
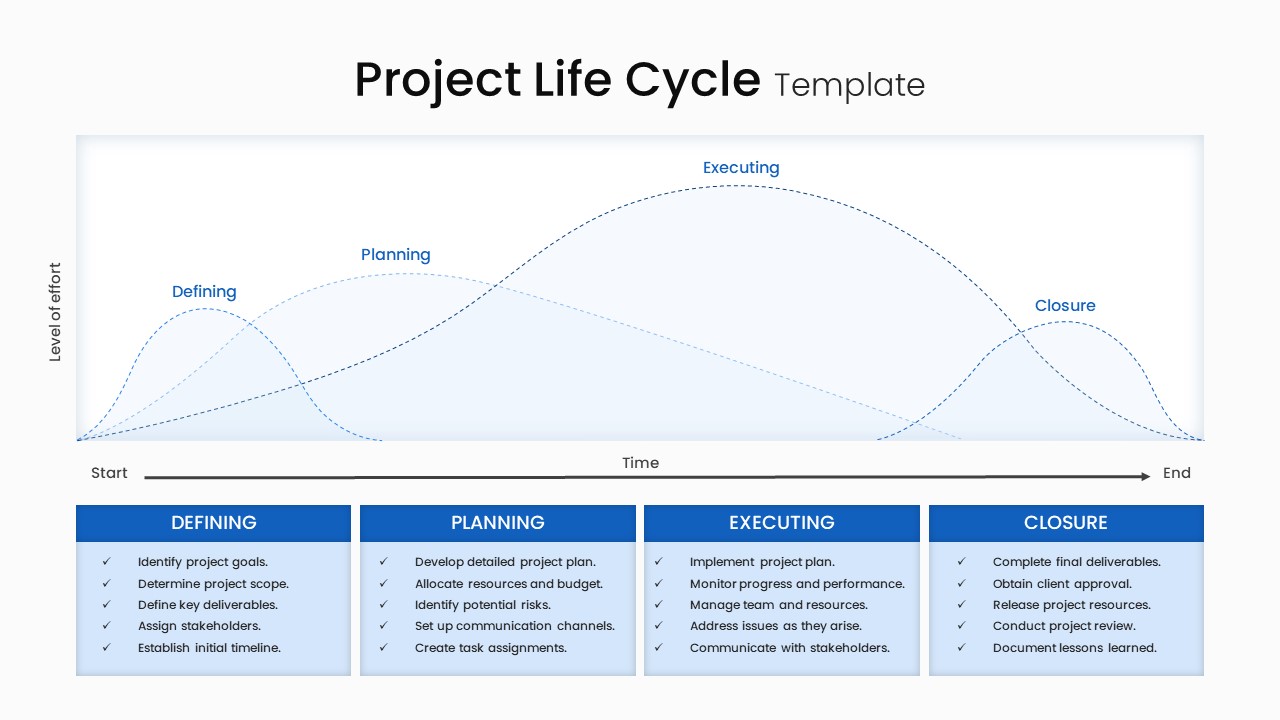
Project Life Cycle Workflow Diagram Template for PowerPoint & Google Slides
Process
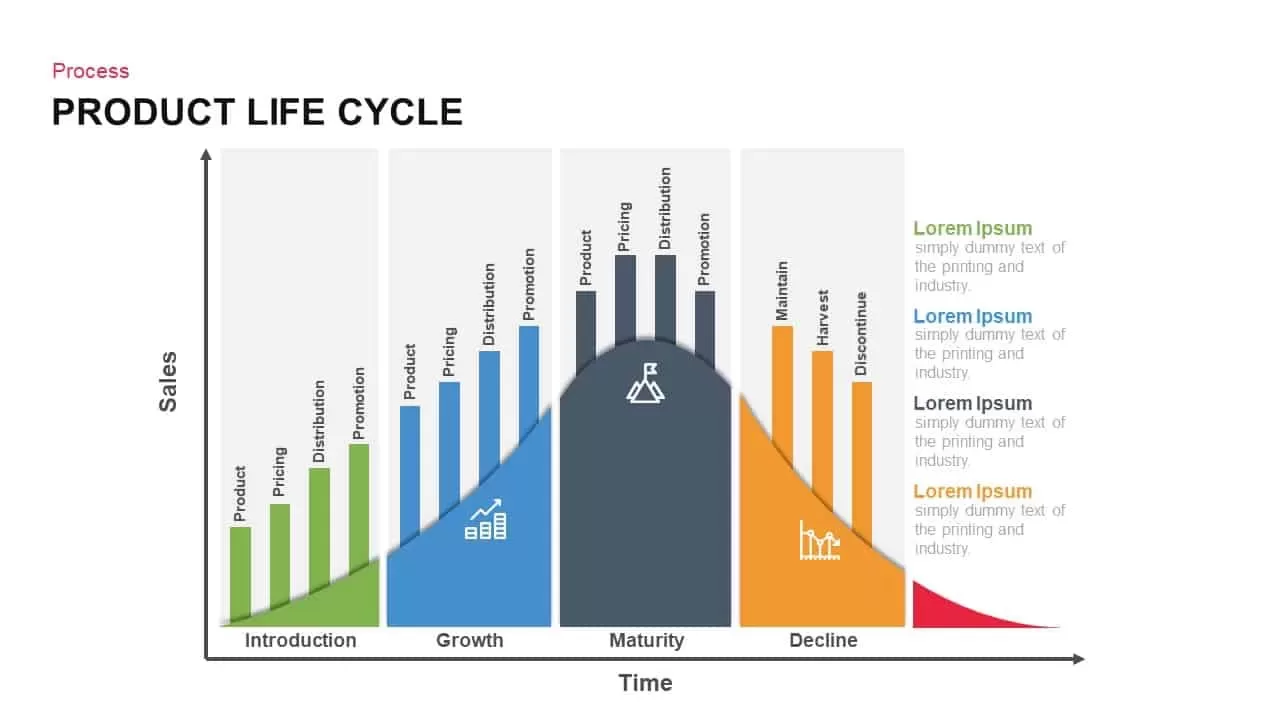
Product Life Cycle Infographics template for PowerPoint & Google Slides
Business
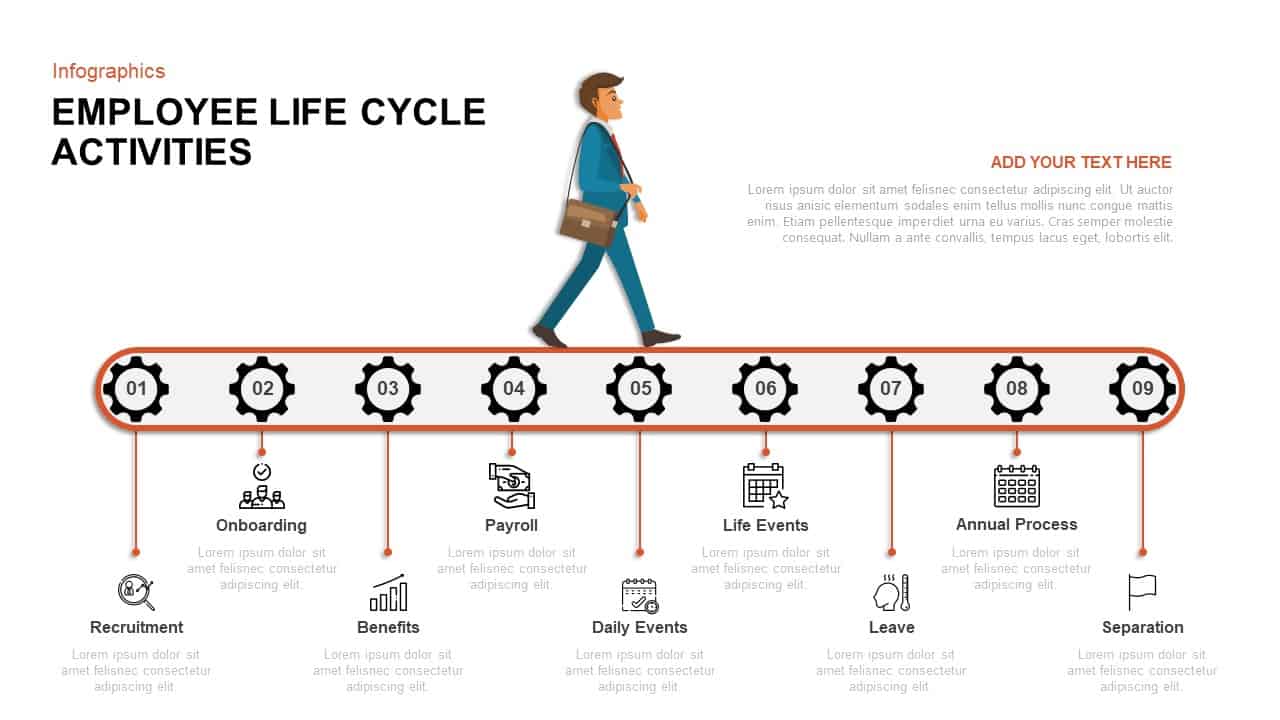
Employee Life Cycle Activities Template for PowerPoint & Google Slides
Timeline
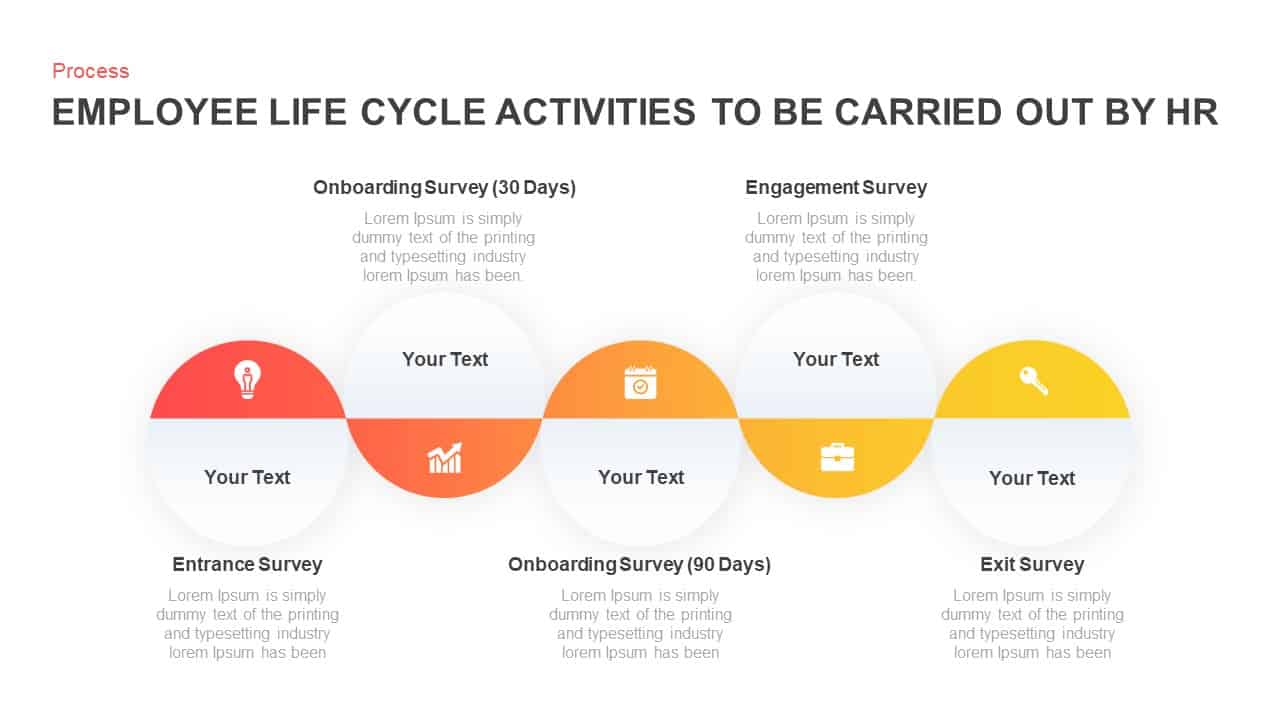
Employee Life Cycle Activities Process Template for PowerPoint & Google Slides
Employee Performance
Strategic ADL Matrix by Industry Life Cycle & Position Template for PowerPoint & Google Slides
Business Strategy
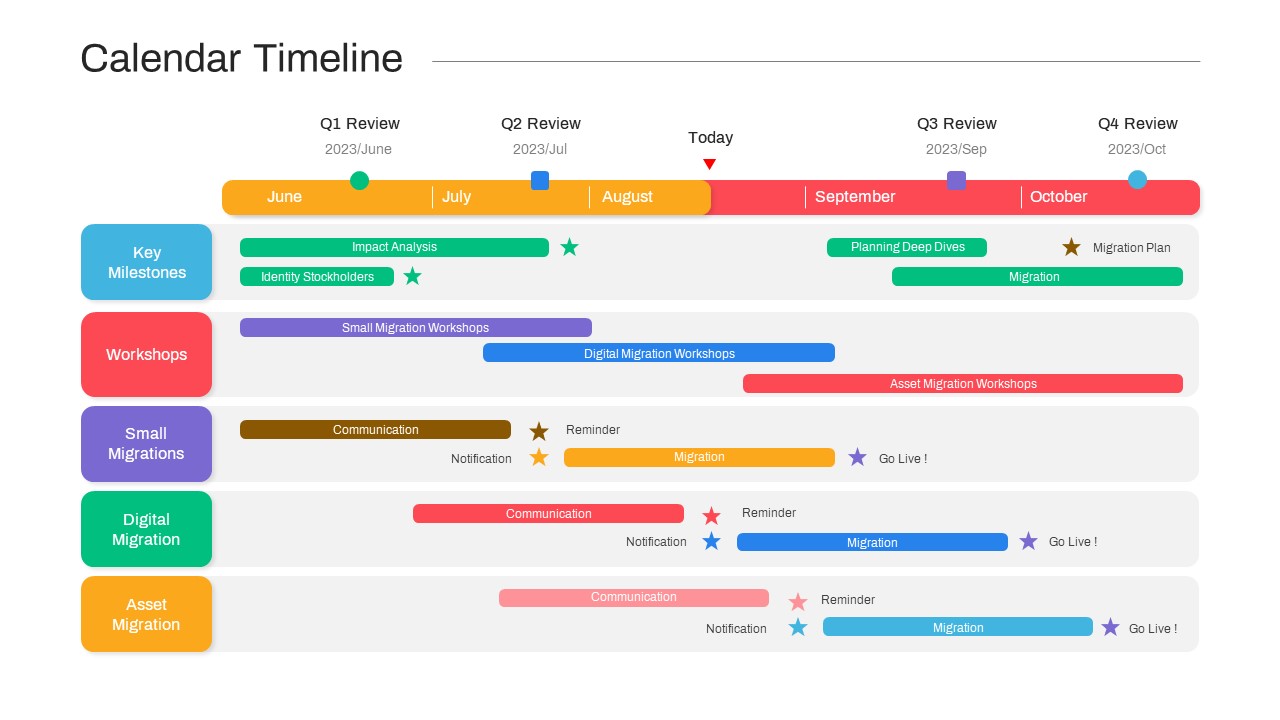
Calendar Migration Project Timeline Template for PowerPoint & Google Slides
Timeline
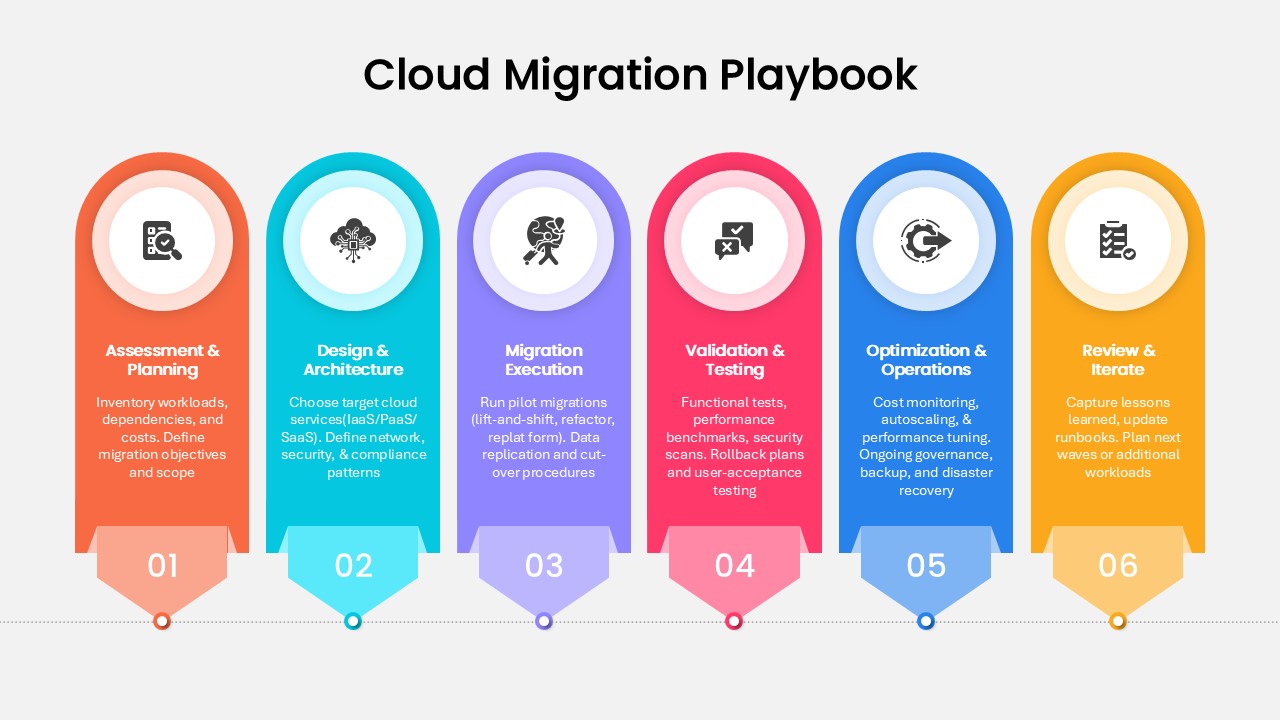
Step-by-Step Cloud Migration Playbook Template for PowerPoint & Google Slides
Cloud Computing
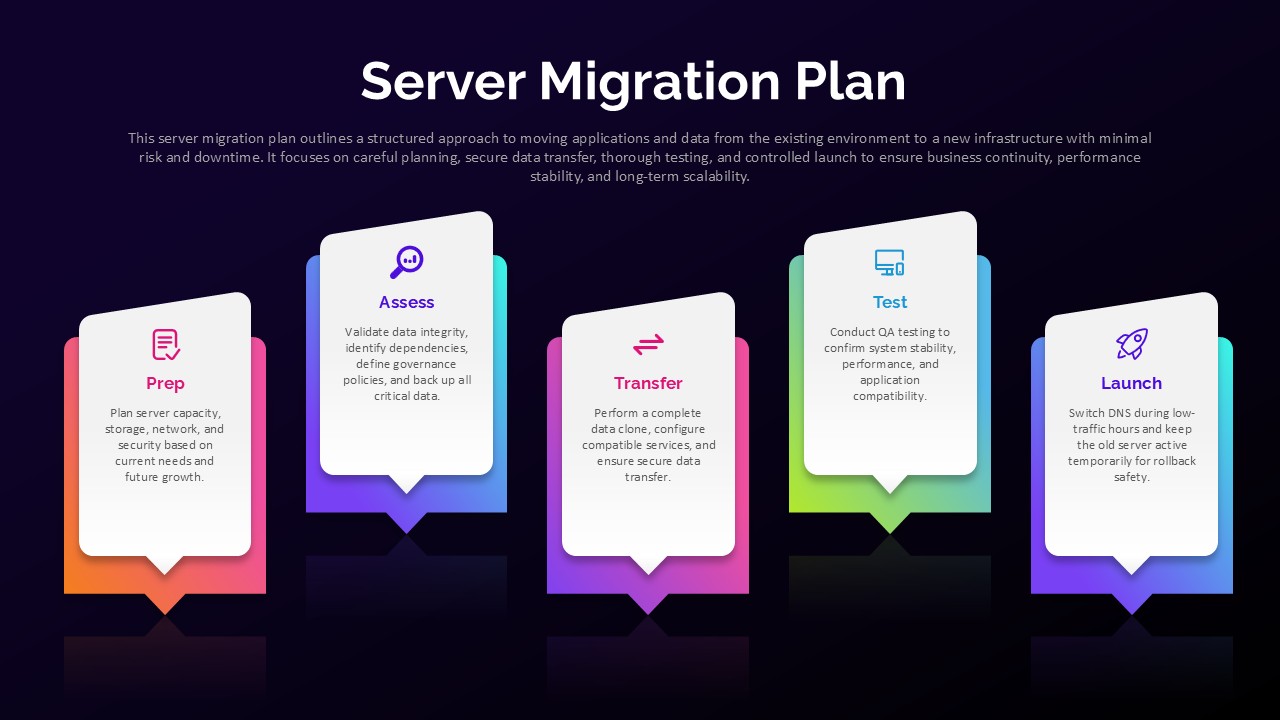
Server Migration Plan Workflow Template for PowerPoint & Google Slides
Information Technology

Data-Driven Marketing Cycle Diagram Template for PowerPoint & Google Slides
Customer Journey
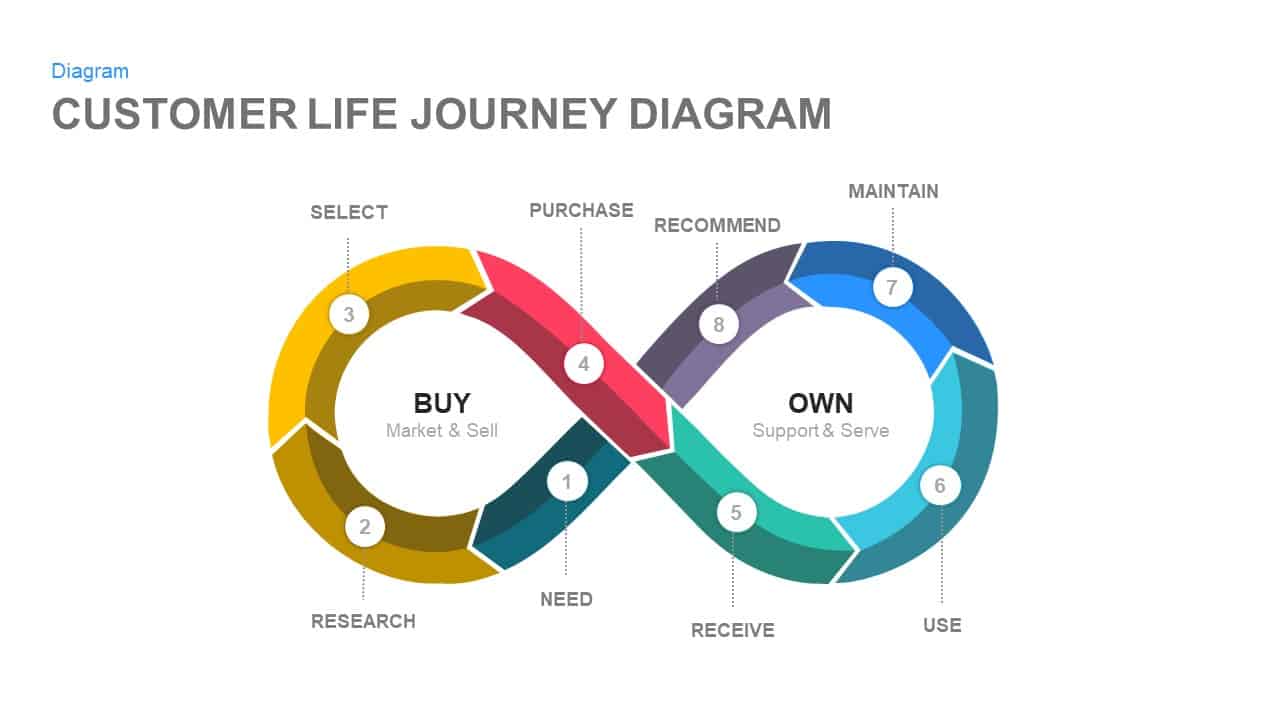
Customer Life Journey Infinity Diagram Template for PowerPoint & Google Slides
Customer Journey
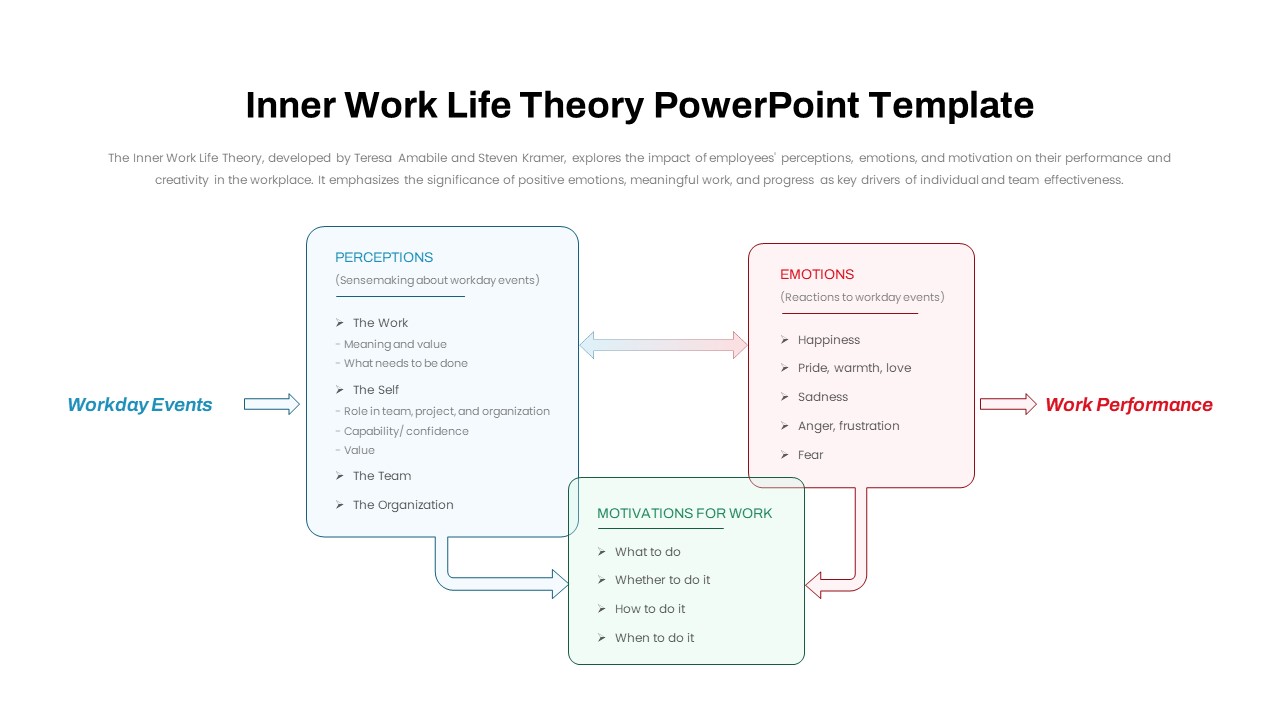
Inner Work Life Theory Diagram Slide for PowerPoint & Google Slides
Employee Performance
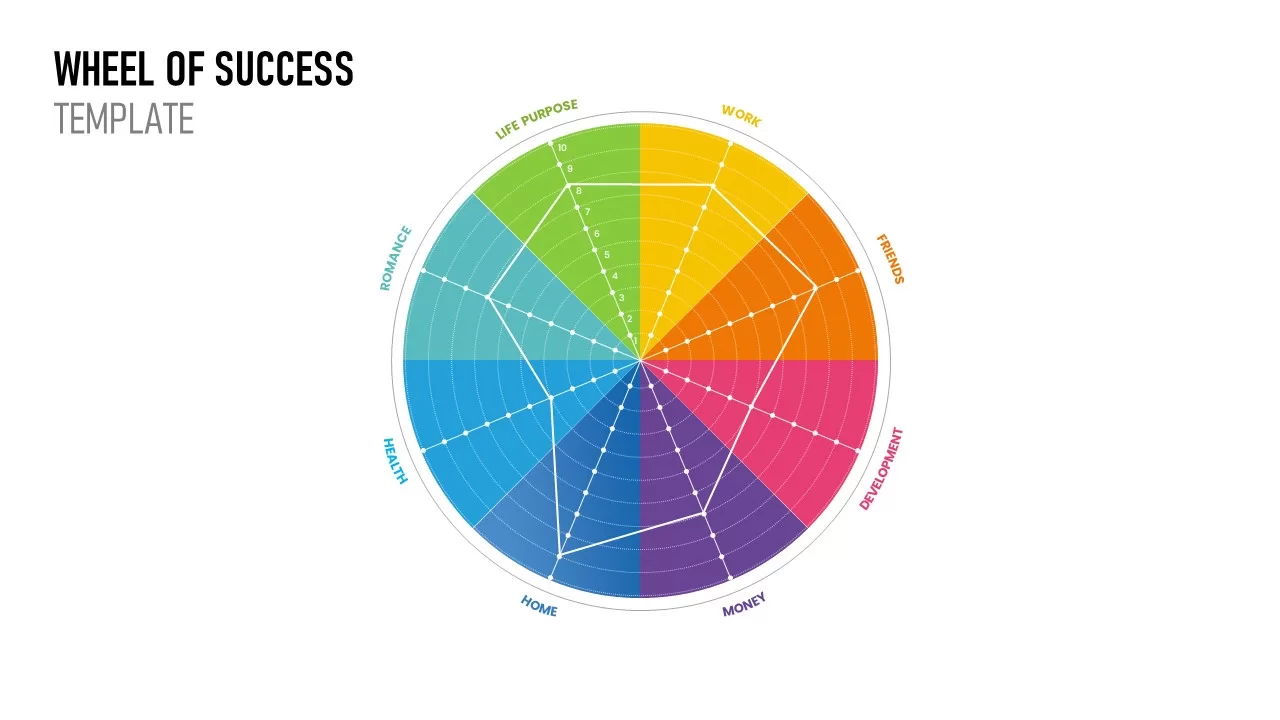
Wheel of Life template for PowerPoint & Google Slides
Business
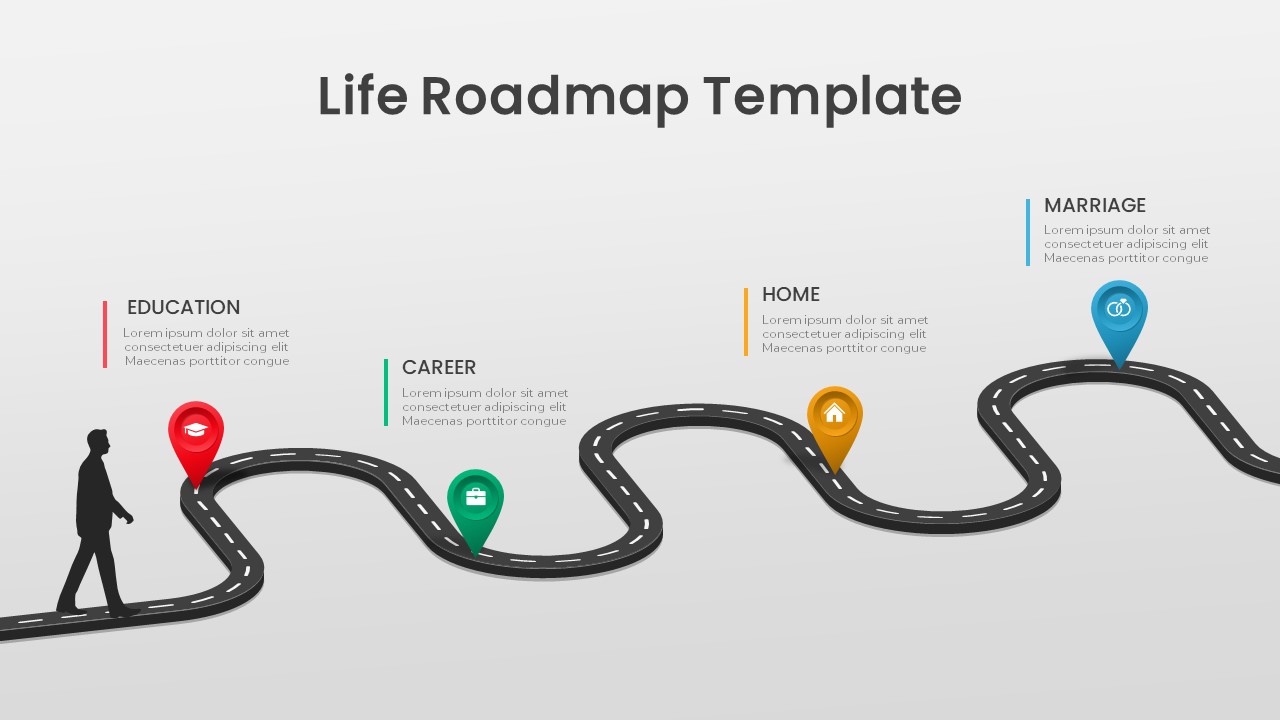
Life Roadmap for PowerPoint & Google Slides
Infographics
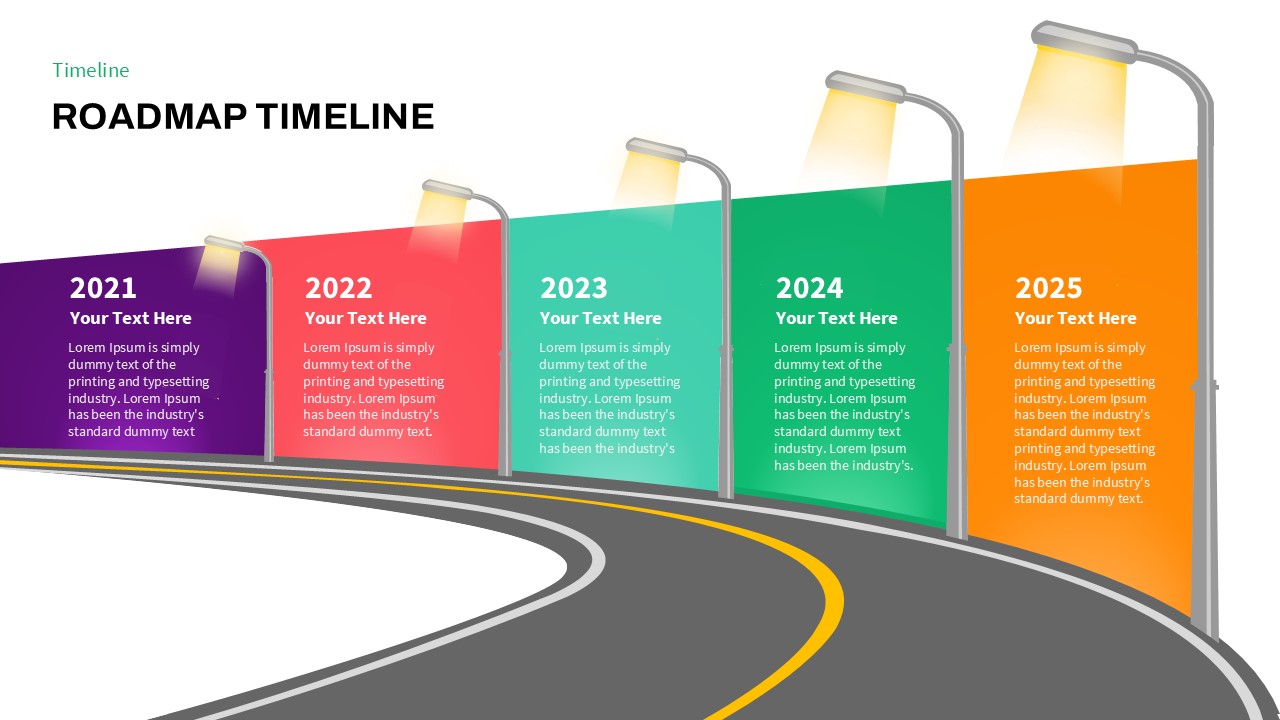
Curved Road Roadmap Timeline Diagram Template for PowerPoint & Google Slides
Roadmap
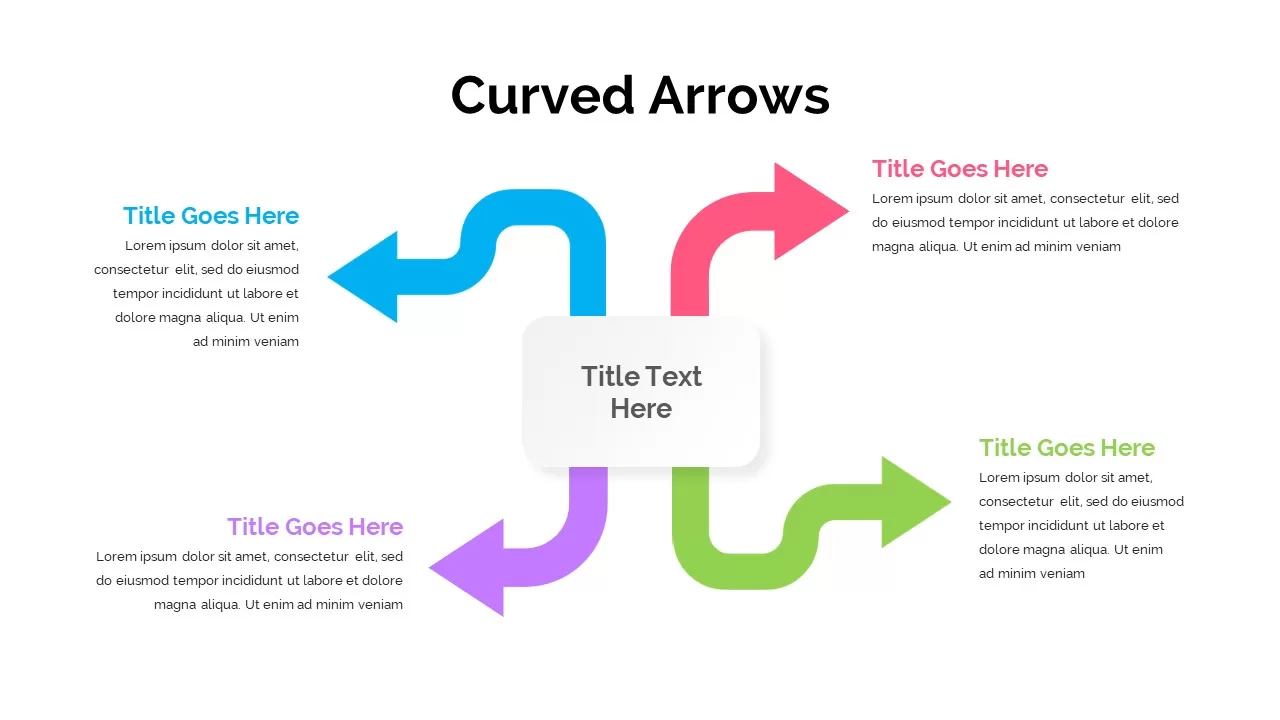
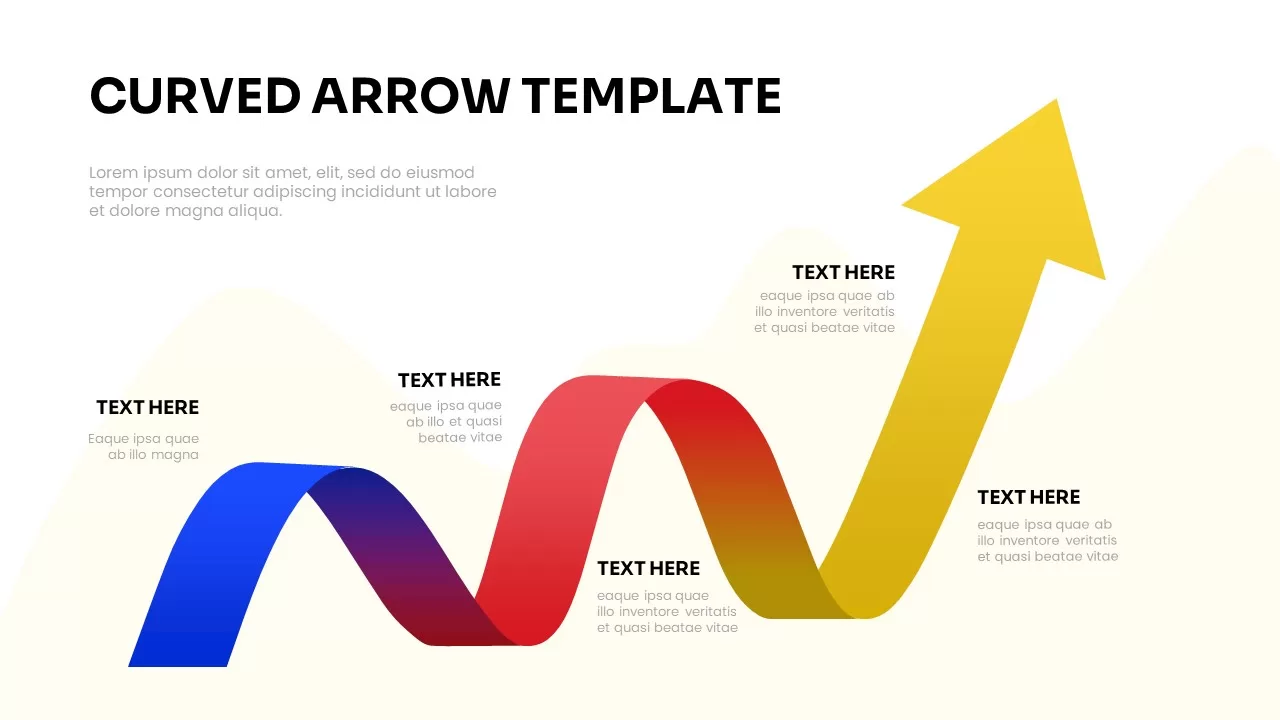
Curved Arrow Process Flow Diagram Template for PowerPoint & Google Slides
Process
Free Curved Arrow Infographic Diagram Template for PowerPoint & Google Slides
Arrow
Free
Curved Arrow Process Flow Diagram Template for PowerPoint & Google Slides
Arrow
Curved Arrow Flow Diagram template for PowerPoint & Google Slides
Business
Three-Step Curved Arrow Process Diagram Template for PowerPoint & Google Slides
Arrow
Four-Arrow Curved Hub-and-Spoke Diagram Template for PowerPoint & Google Slides
Arrow
Hand-Drawn Four-Step Curved Arrow Diagram Template for PowerPoint & Google Slides
Arrow
Four-Step Curved Arrow Diagram Template for PowerPoint & Google Slides
Arrow
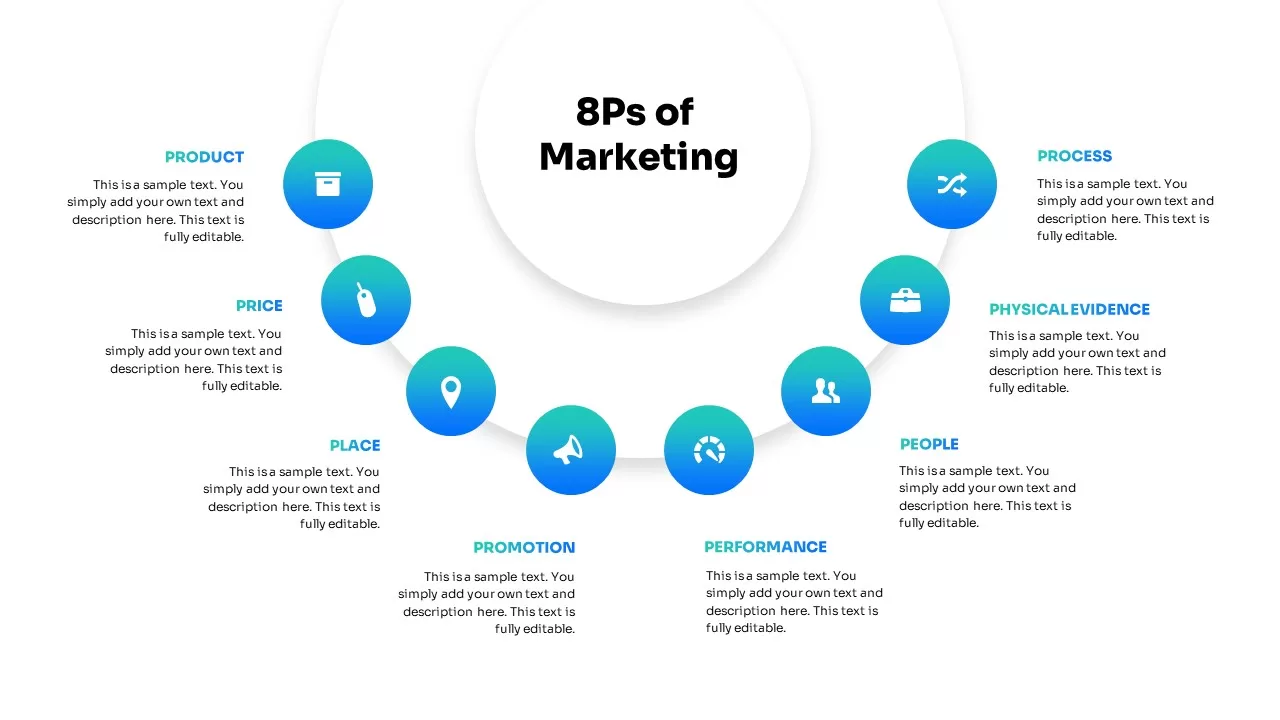
Curved 8Ps of Marketing Diagram Template for PowerPoint & Google Slides
Marketing
Multi-Series Curved Line Graph Analytics Template for PowerPoint & Google Slides
Comparison Chart
Curved Five-Section Timeline Infographic template for PowerPoint & Google Slides
Timeline
Curved Road Map Timeline Infographic Template for PowerPoint & Google Slides
Roadmap
Colorful Curved Roadmap Phases Template for PowerPoint & Google Slides
Roadmap
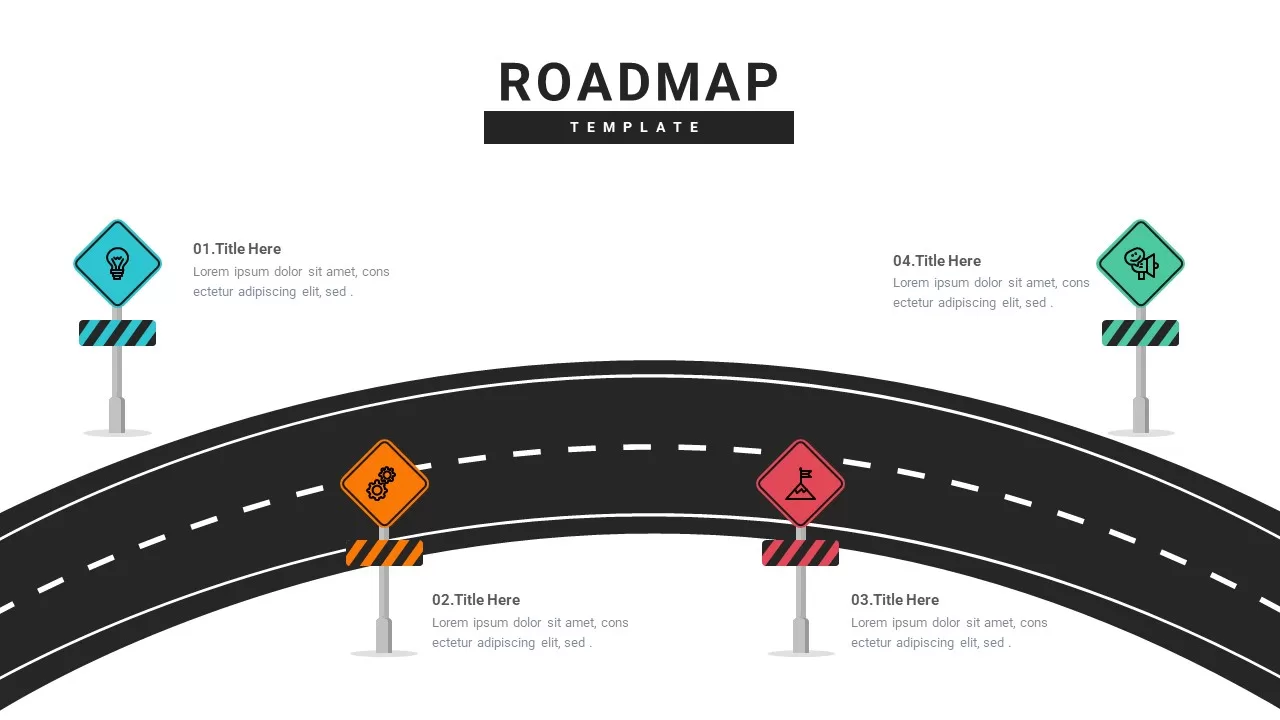
Curved Roadmap with Iconic Signposts Template for PowerPoint & Google Slides
Roadmap
Curved Arrow Process Flow Infographic Template for PowerPoint & Google Slides
Process
Multi-Color Five-Step Curved Arrow Template for PowerPoint & Google Slides
Process
Dynamic Curved Arrow Process Roadmap Template for PowerPoint & Google Slides
Process
Free Curved Arrow Progress Chart template for PowerPoint & Google Slides
Project
Free
5-Step Curved Arrow Infographic Template for PowerPoint & Google Slides
Arrow
3D Curved Arrow Growth Process Slide Template for PowerPoint & Google Slides
Process
Curved Arrow Flow Template for PowerPoint & Google Slides
Process
Four-Step Curved Arrow Process Template for PowerPoint & Google Slides
Process
Three-Path Curved Arrow Infographic Template for PowerPoint & Google Slides
Arrow
Curved Arrow Process Flow template for PowerPoint & Google Slides
Process
Curved Arrow Process Flow template for PowerPoint & Google Slides
Process
Curved Arrow Roadmap template for PowerPoint & Google Slides
Roadmap
Curved Arrow Progression template for PowerPoint & Google Slides
Process
Curved Roadmap Infographic Vision Journey Template for PowerPoint & Google Slides
Business Strategy
Multi-color Curved Timeline Roadmap Template for PowerPoint & Google Slides
Timeline
Curved Road Timeline Infographic Template for PowerPoint & Google Slides
Timeline
Curved Line Graph for PowerPoint & Google Slides
Timeline
Curved Roadmap with Milestones Slide for PowerPoint & Google Slides
Roadmap
Free
Free 6-Step Curved Workflow Timeline for PowerPoint & Google Slides
Timeline
Free
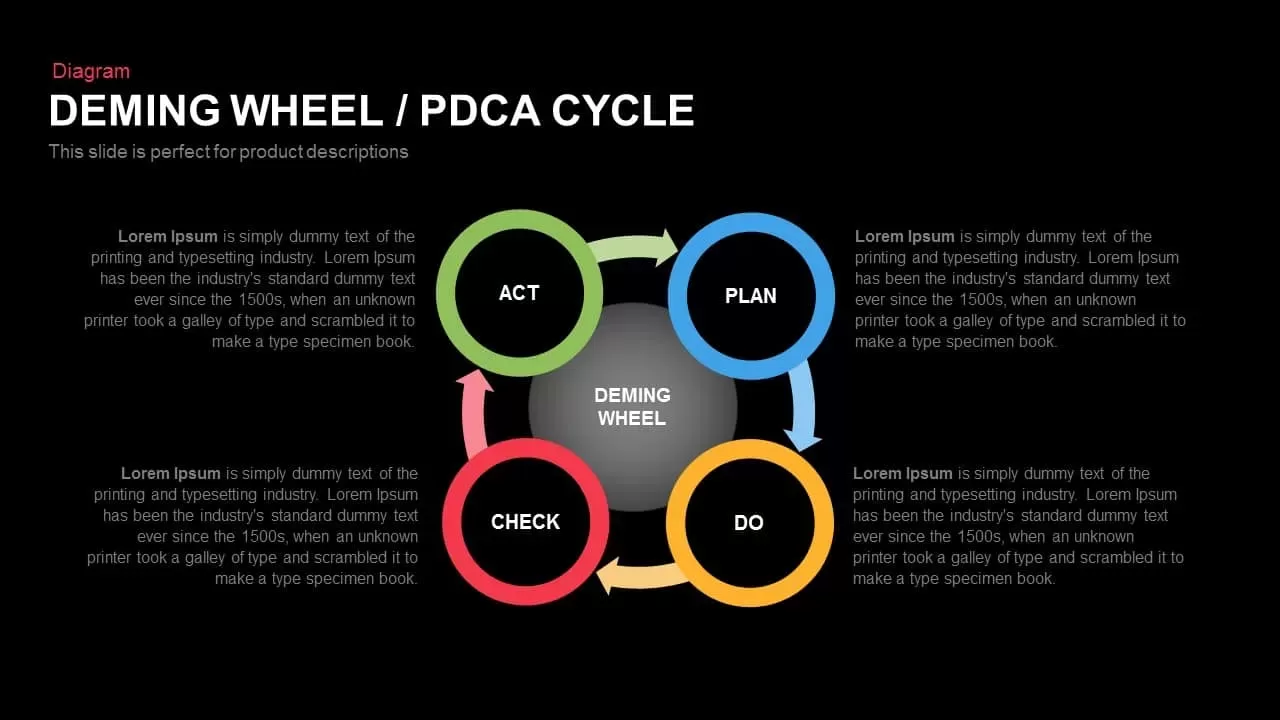
Deming Wheel PDCA Cycle Diagram Template for PowerPoint & Google Slides
Business Plan
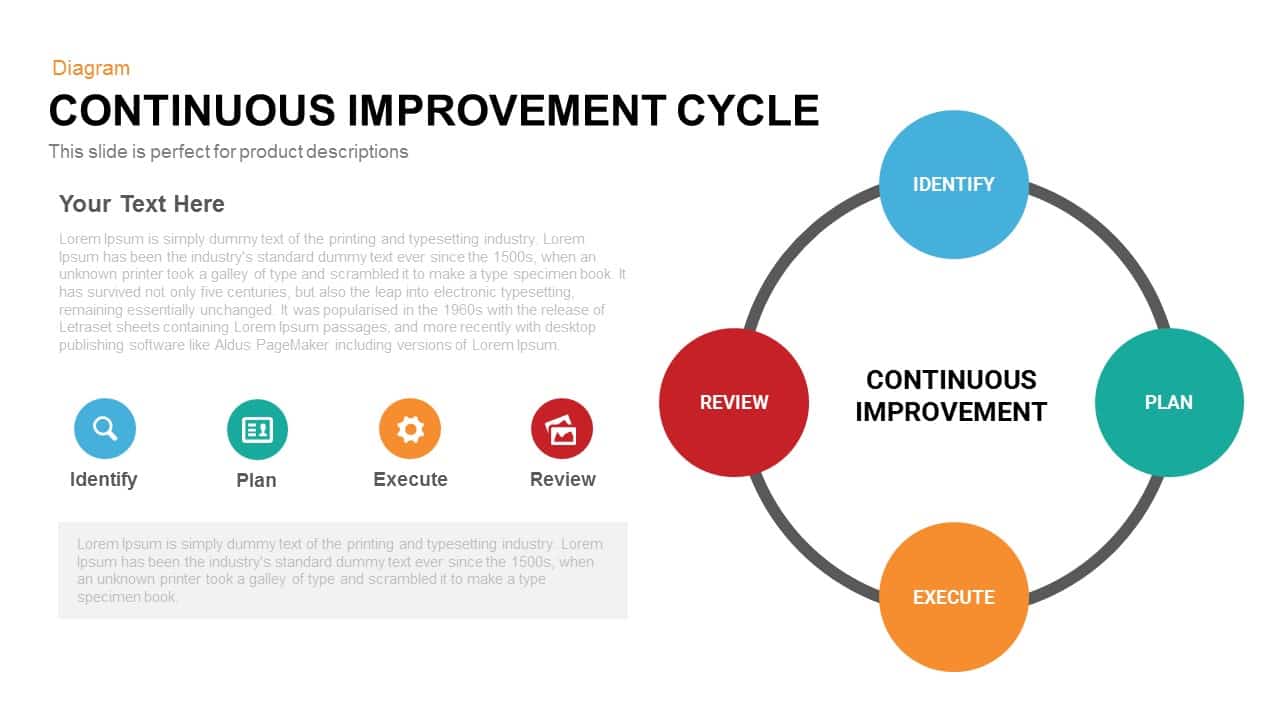
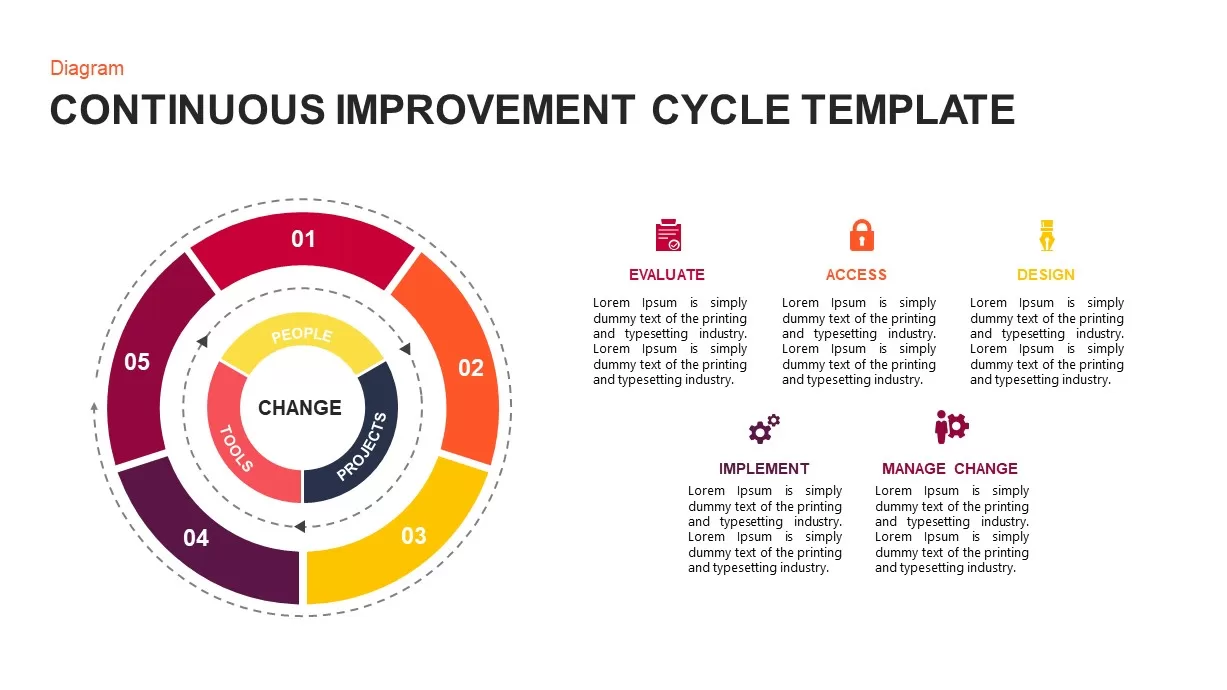
Continuous Improvement Cycle Diagram Template for PowerPoint & Google Slides
Circular
Modern Five-Stage Cycle Process Diagram Template for PowerPoint & Google Slides
Process
Six-Stage Circular Cycle Diagram Template for PowerPoint & Google Slides
Process
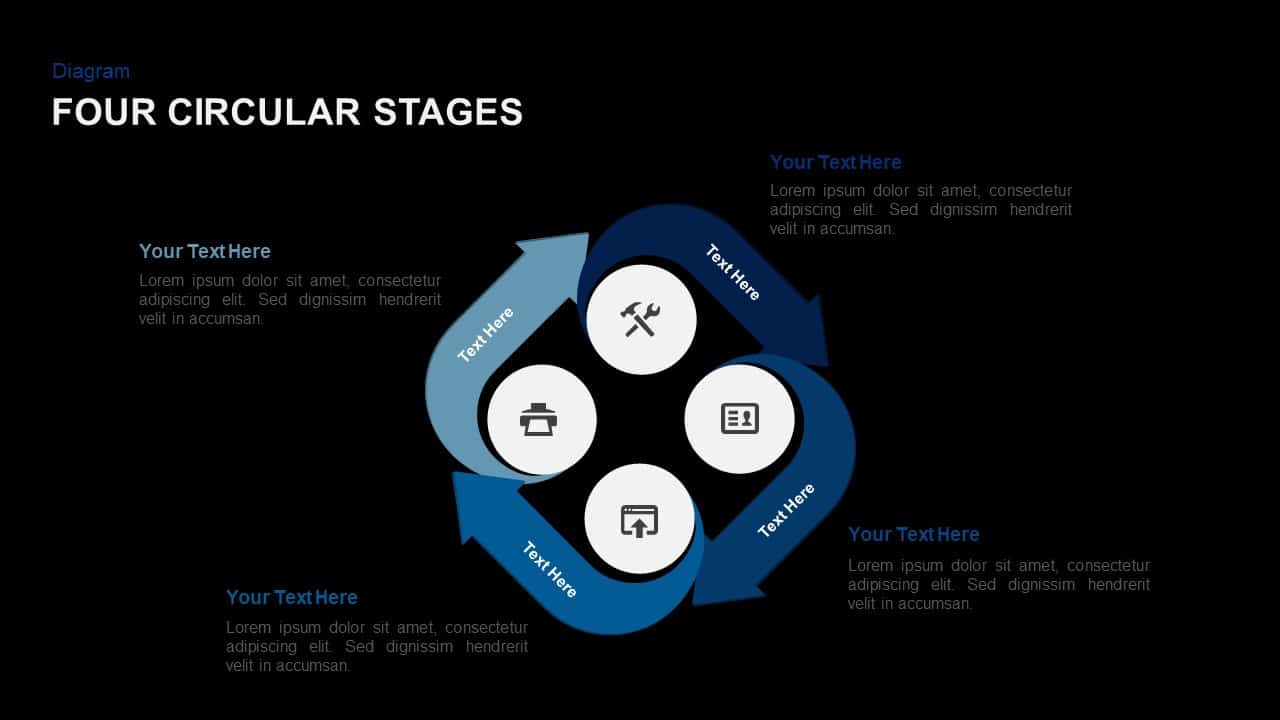
Four-Point Arrow Cycle Diagram Template for PowerPoint & Google Slides
Arrow
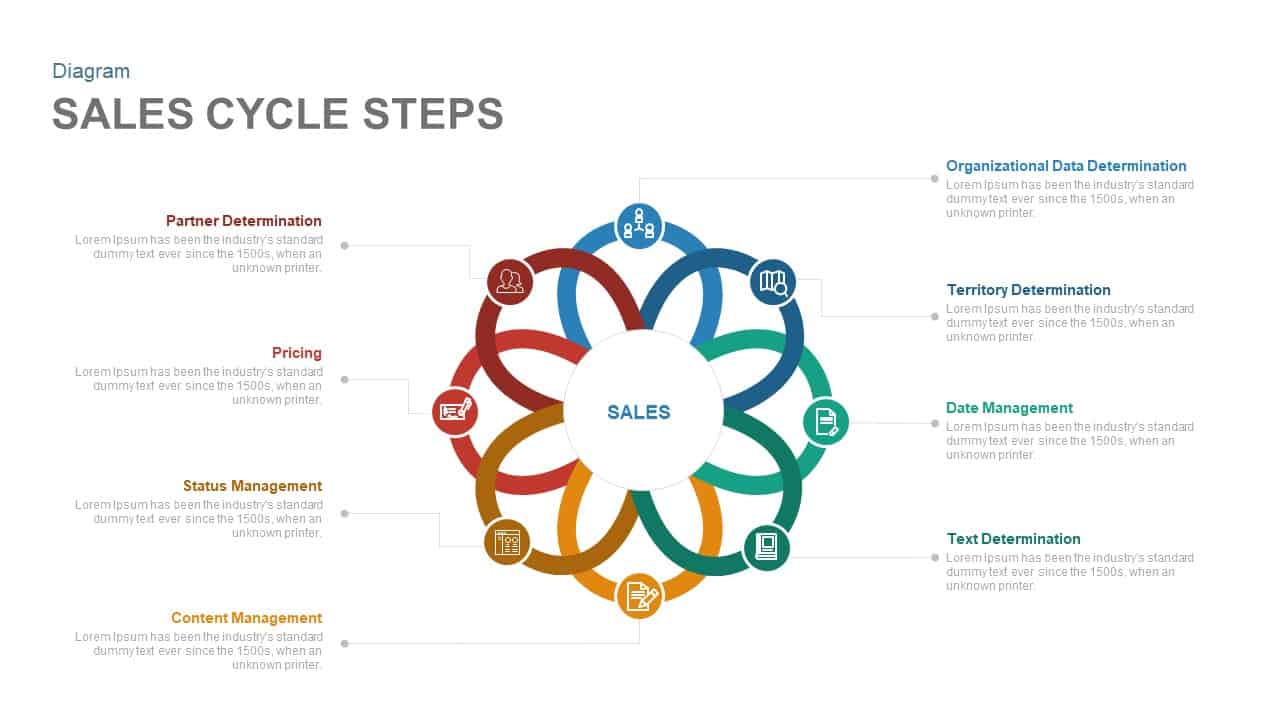
Eight-Step Sales Cycle Diagram Template for PowerPoint & Google Slides
Process
3, 4 & 5 Circular Stages Cycle Diagram Deck Template for PowerPoint & Google Slides
Circular
Four-Stage Cycle Process Diagram Template for PowerPoint & Google Slides
Process
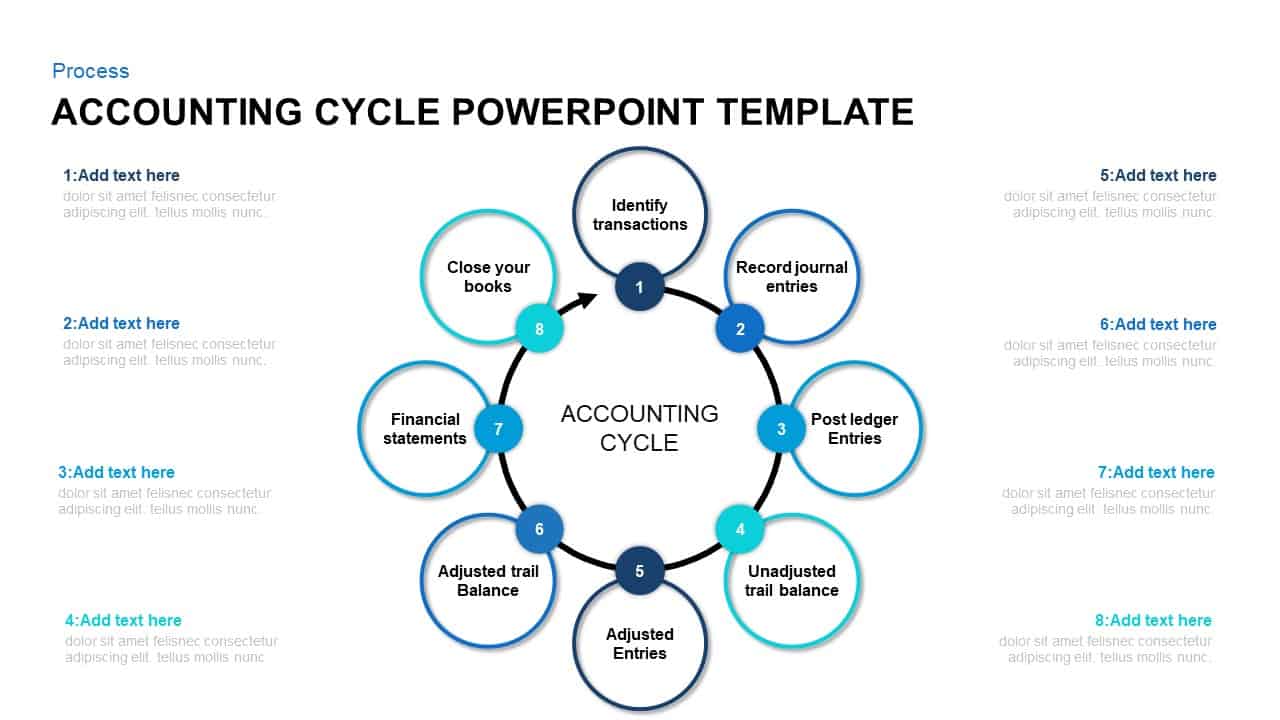
8-Step Circular Accounting Cycle Diagram Template for PowerPoint & Google Slides
Accounting
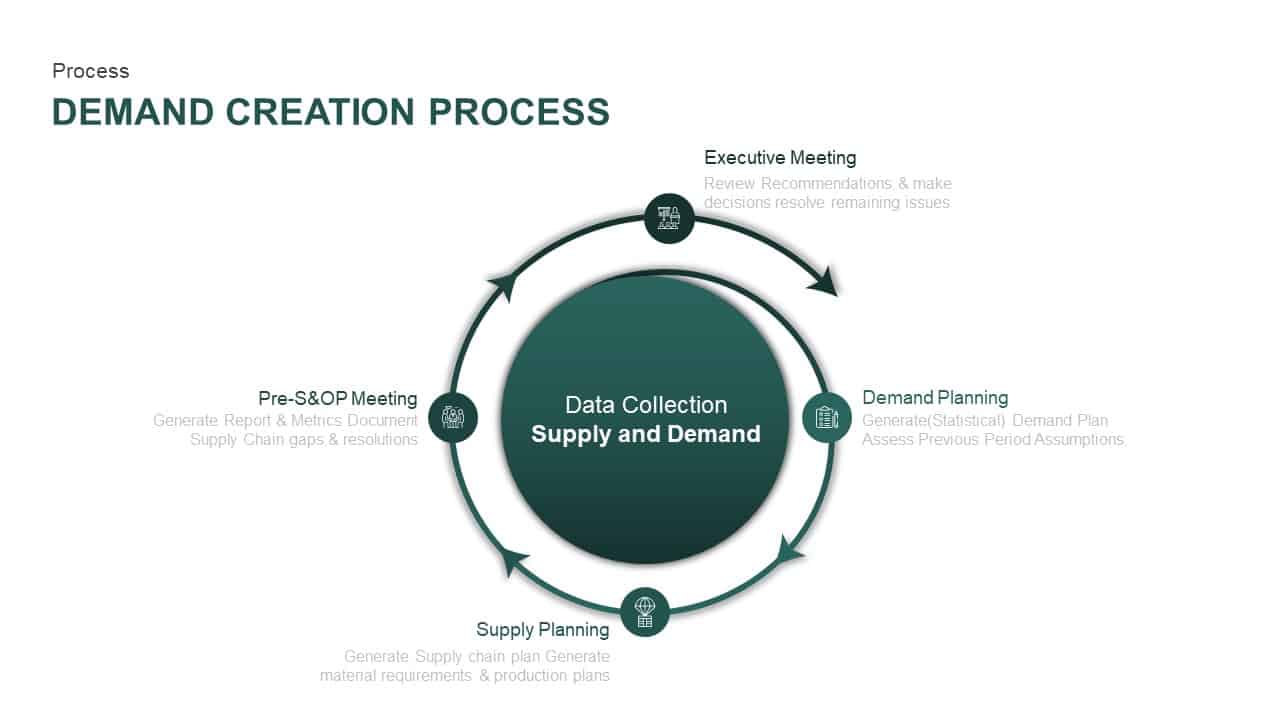
Supply and Demand Creation Cycle Diagram Template for PowerPoint & Google Slides
Process

Modern 6-Step Cycle Diagram Slide Deck Template for PowerPoint & Google Slides
Process
Enterprise Risk Management Cycle Diagram Template for PowerPoint & Google Slides
Process
4MAT Learning Cycle Circular Diagram Template for PowerPoint & Google Slides
Circular
4-Step Circular PDCA Cycle Diagram Template for PowerPoint & Google Slides
Process
Continuous Improvement Cycle Diagram Template for PowerPoint & Google Slides
Process
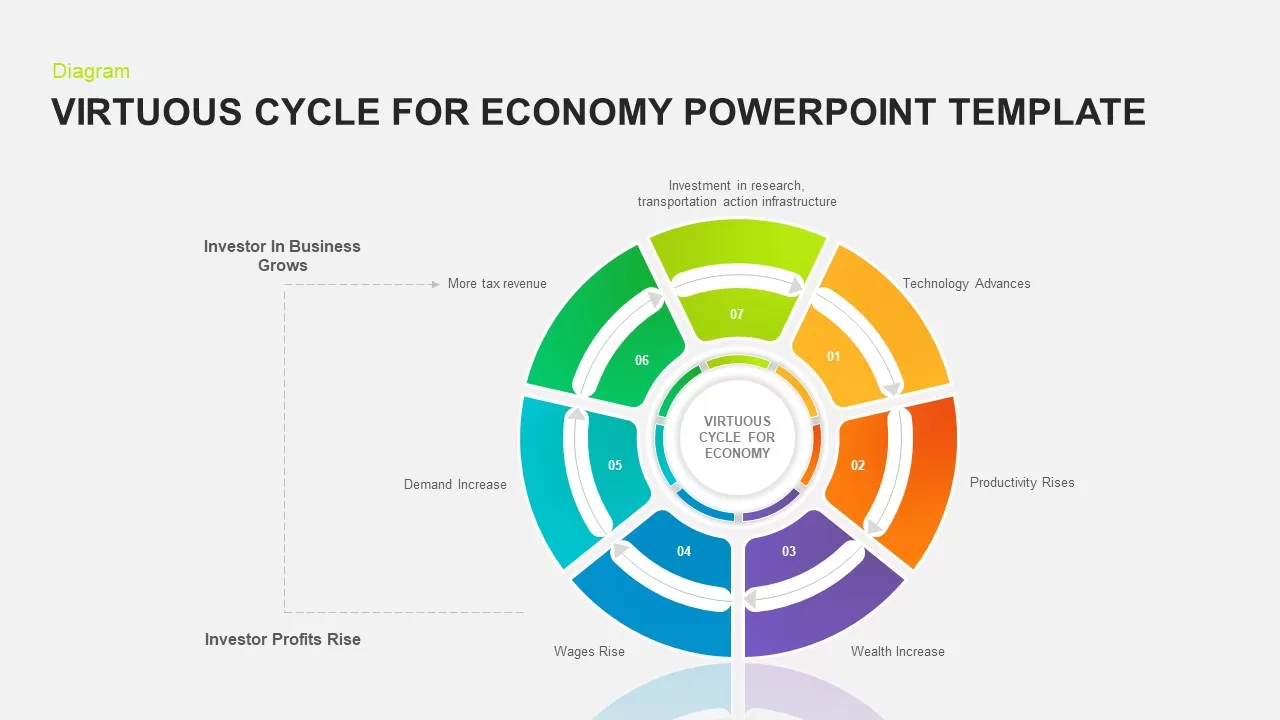
7-Step Virtuous Economy Cycle Diagram Template for PowerPoint & Google Slides
Process
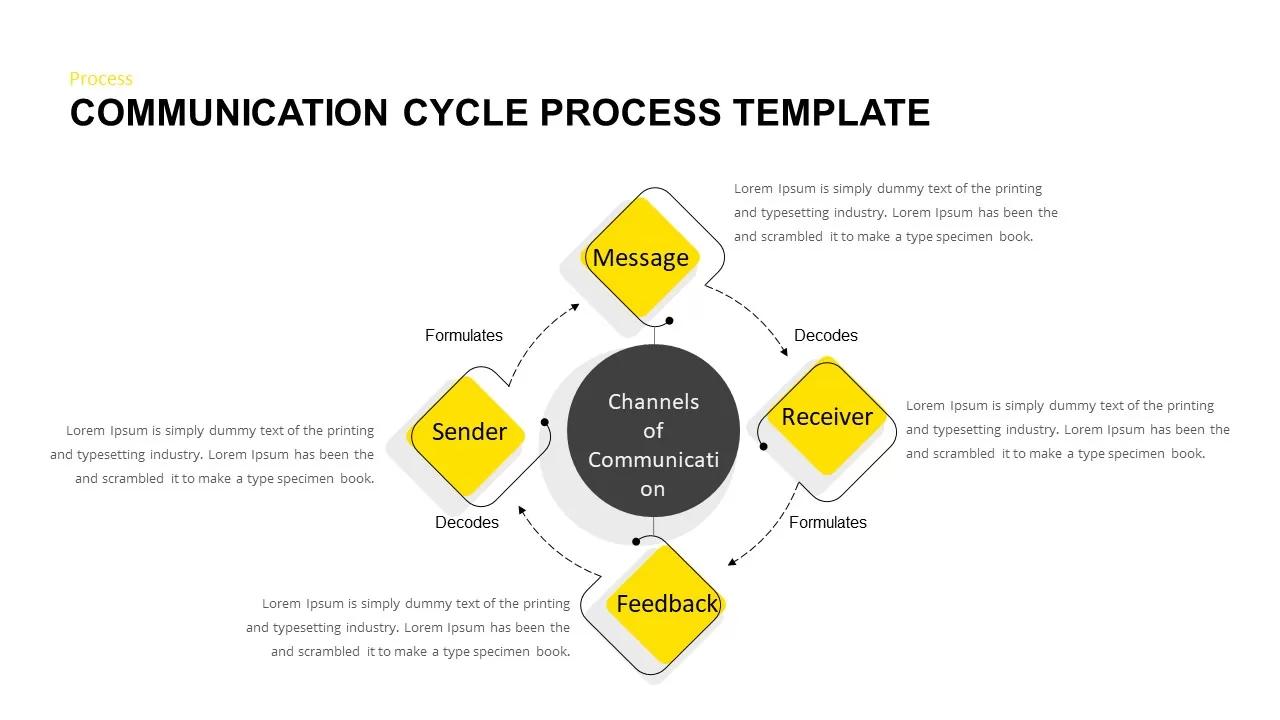
Communication Cycle Process Diagram template for PowerPoint & Google Slides
Business
Concentric Circular Arrow Cycle Diagram Template for PowerPoint & Google Slides
Process
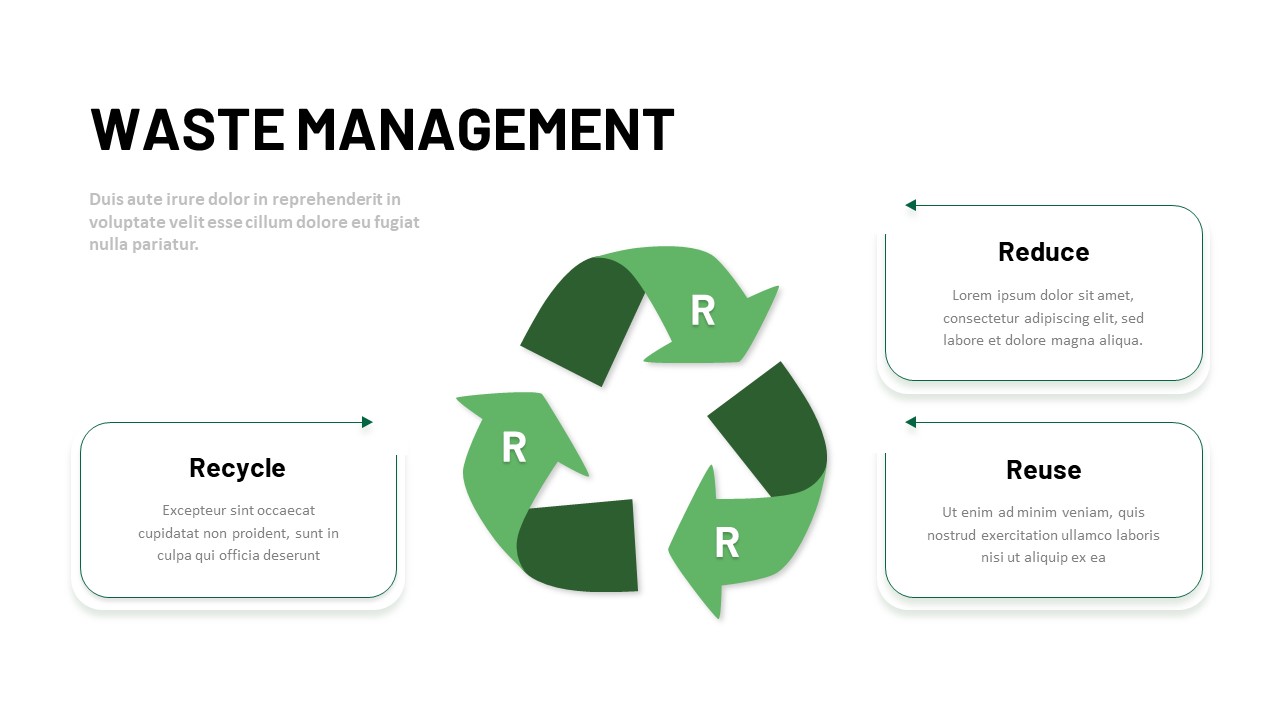
3R Waste Management Cycle Diagram Template for PowerPoint & Google Slides
Circular
Release Management Cycle Circular Diagram Template for PowerPoint & Google Slides
Software Development
Business Process Analysis Cycle Diagram Template for PowerPoint & Google Slides
Business Strategy
Free Time Management Clock Cycle Diagram Template for PowerPoint & Google Slides
Process
Free
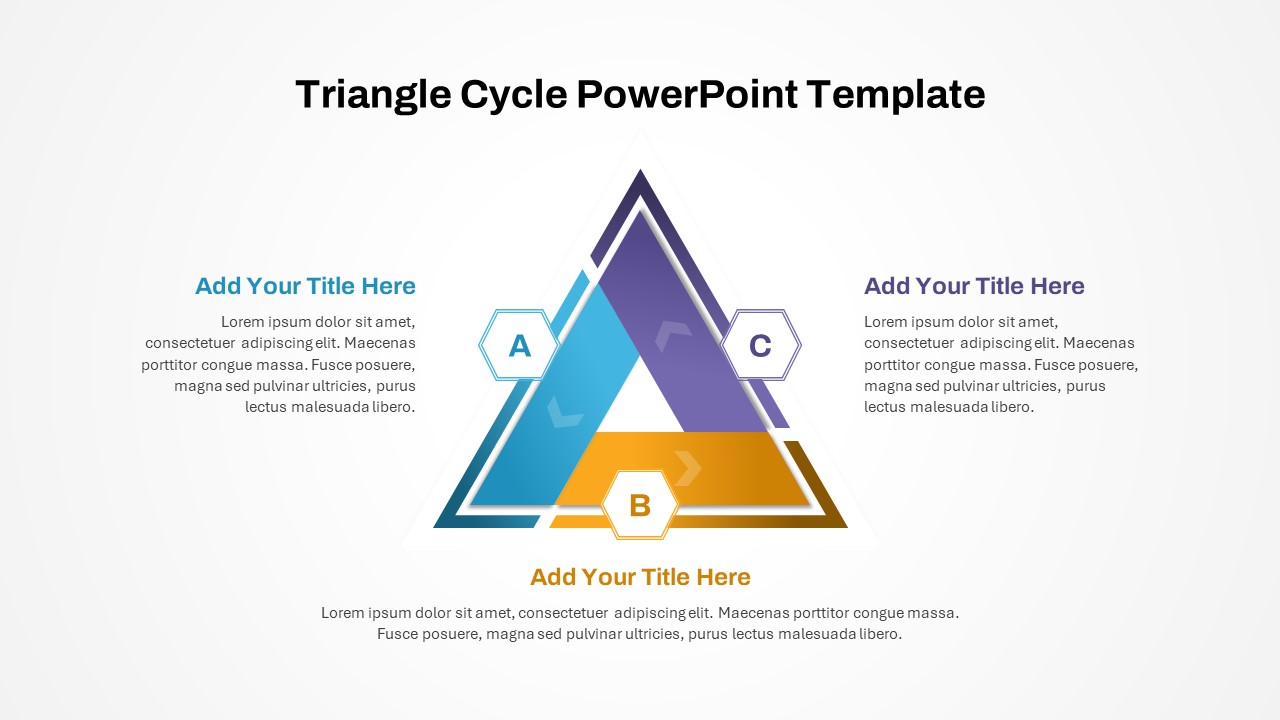
Three-Phase Triangle Cycle Diagram Template for PowerPoint & Google Slides
Infographics
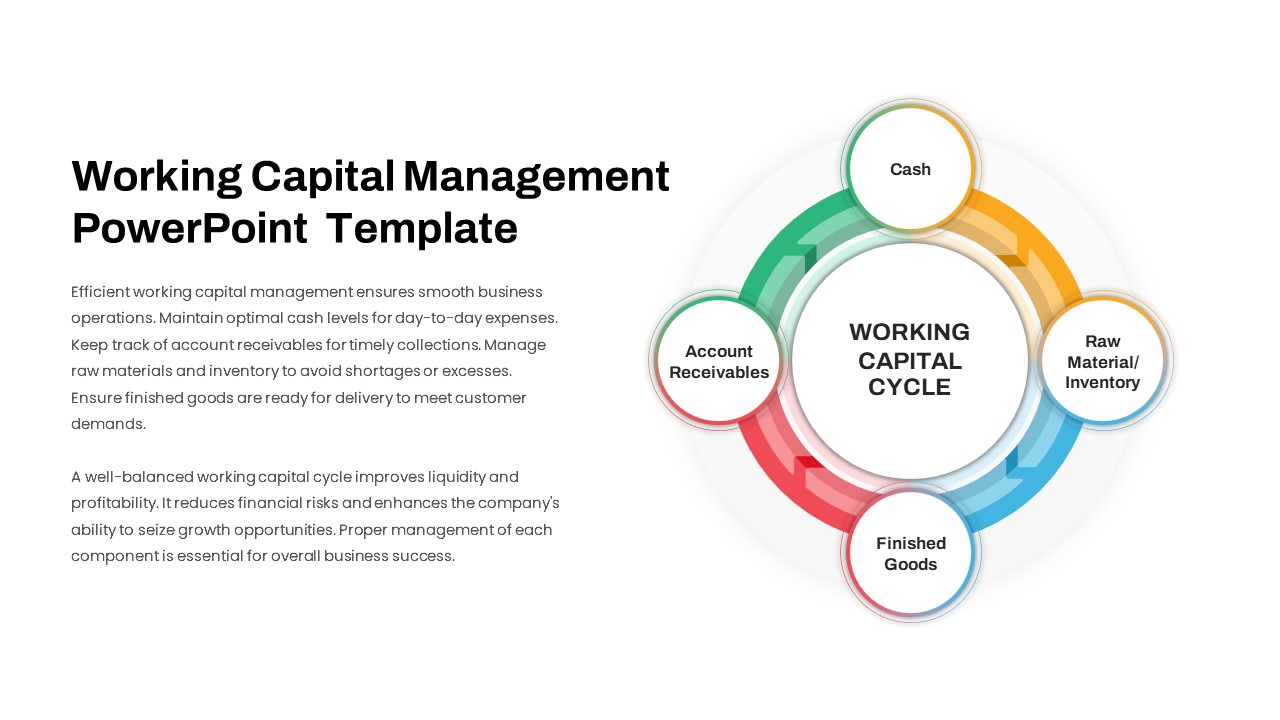
Working Capital Cycle Diagram Template for PowerPoint & Google Slides
Circular
Gartner Hype Cycle Adoption Curve Diagram Template for PowerPoint & Google Slides
Infographics
Colorful Startup Financing Cycle Diagram Template for PowerPoint & Google Slides
Finance
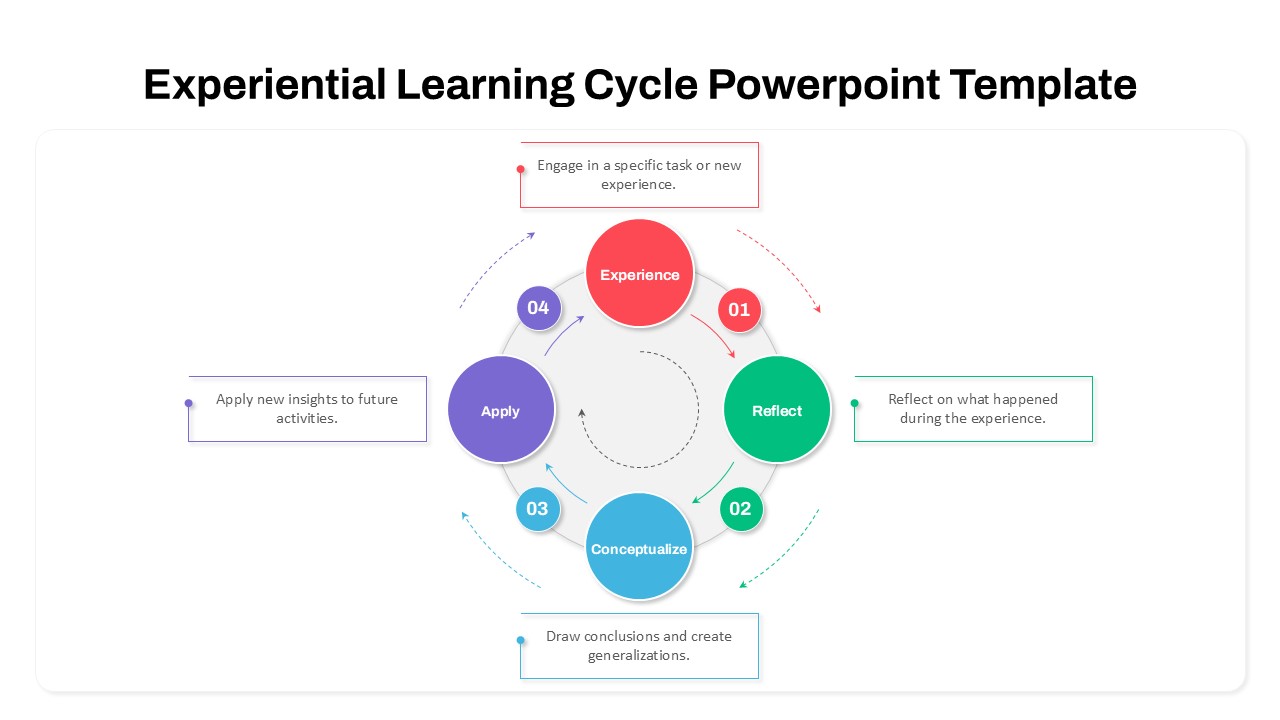
Experiential Learning Cycle Diagram Template for PowerPoint & Google Slides
Circular
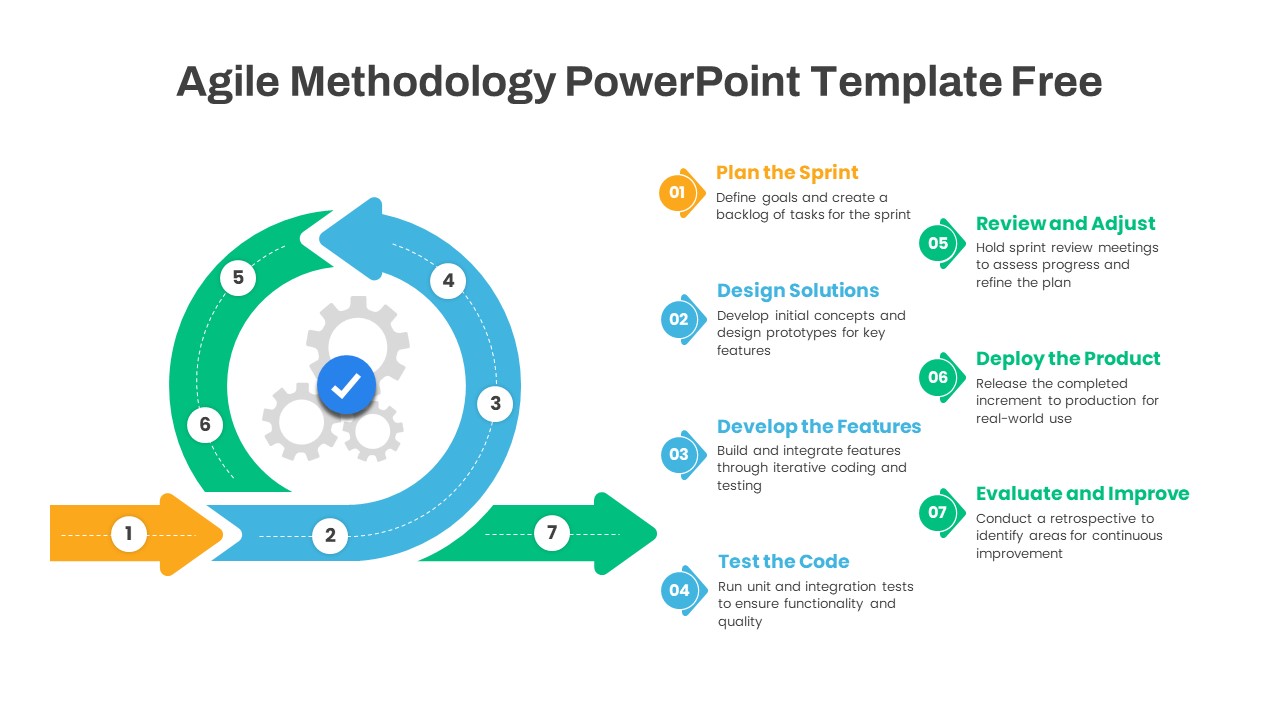
Agile Methodology Cycle Diagram Template for PowerPoint & Google Slides
Project
Free
Change Management Process Cycle Diagram Template for PowerPoint & Google Slides
Process
Flywheel Growth Cycle Diagram Template for PowerPoint & Google Slides
Circular
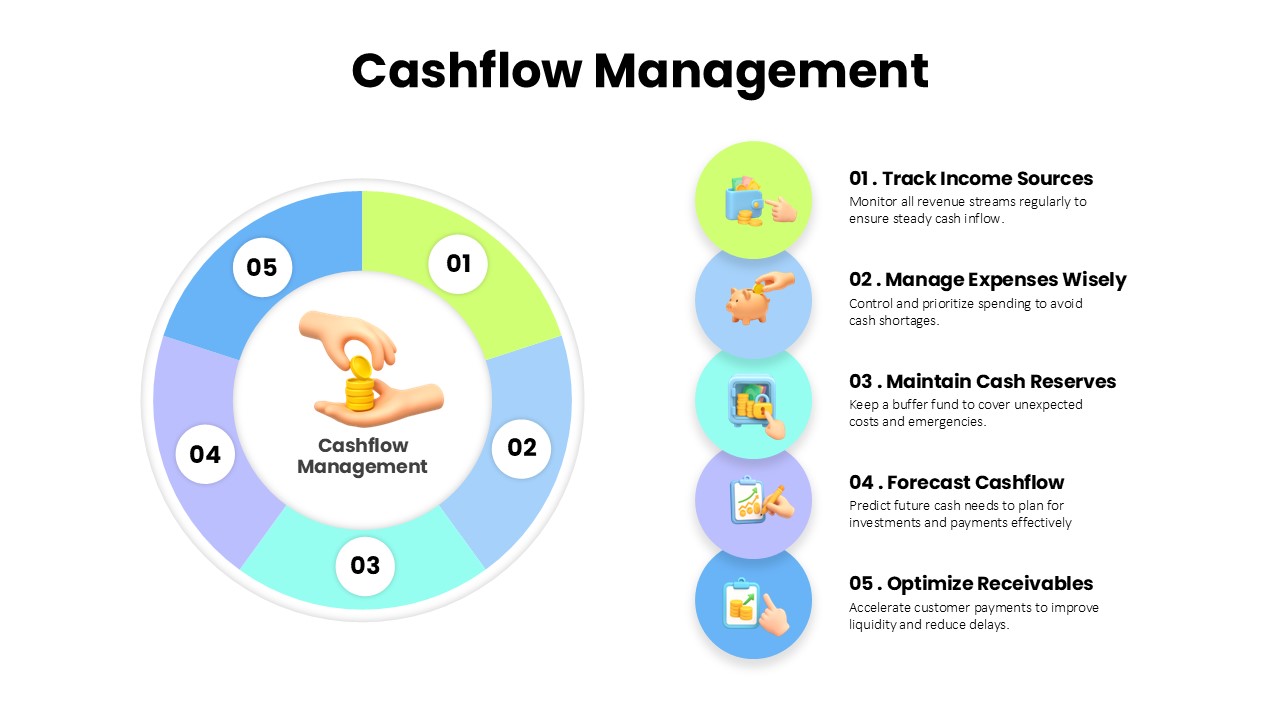
Cashflow Management Cycle Diagram Template for PowerPoint & Google Slides
Finance
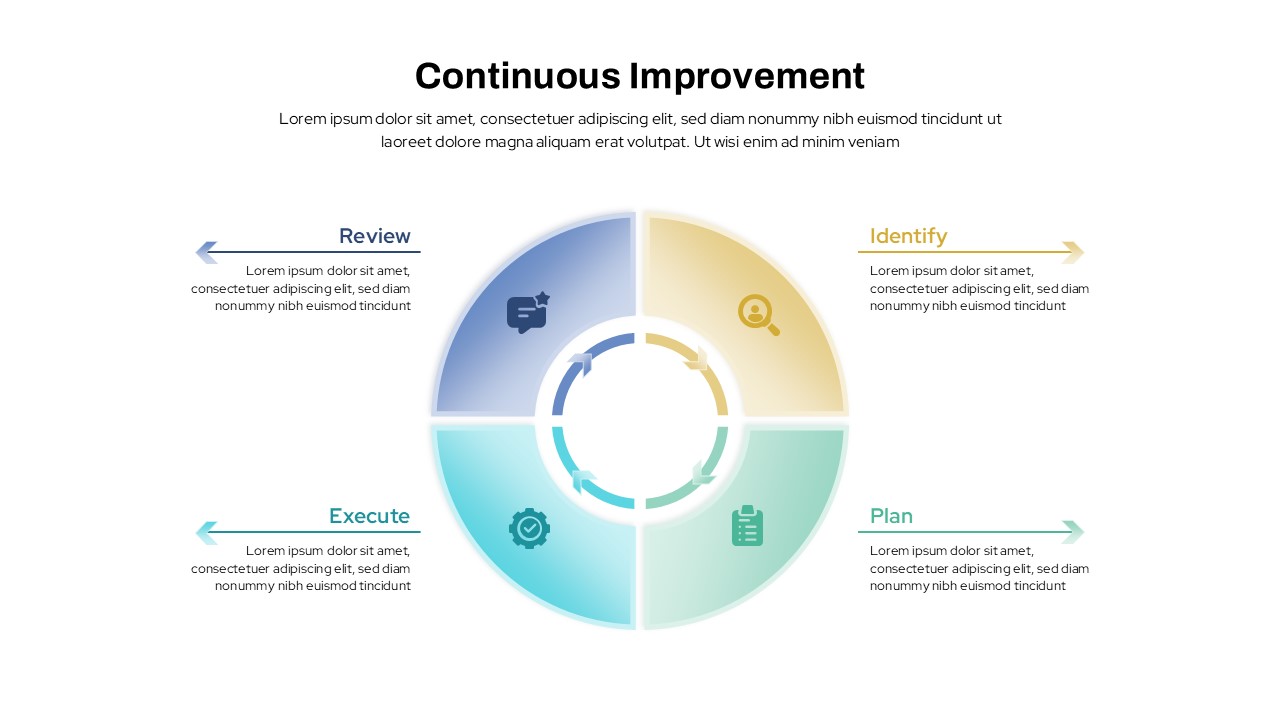
Continuous Improvement Cycle Diagram Template for PowerPoint & Google Slides
Process
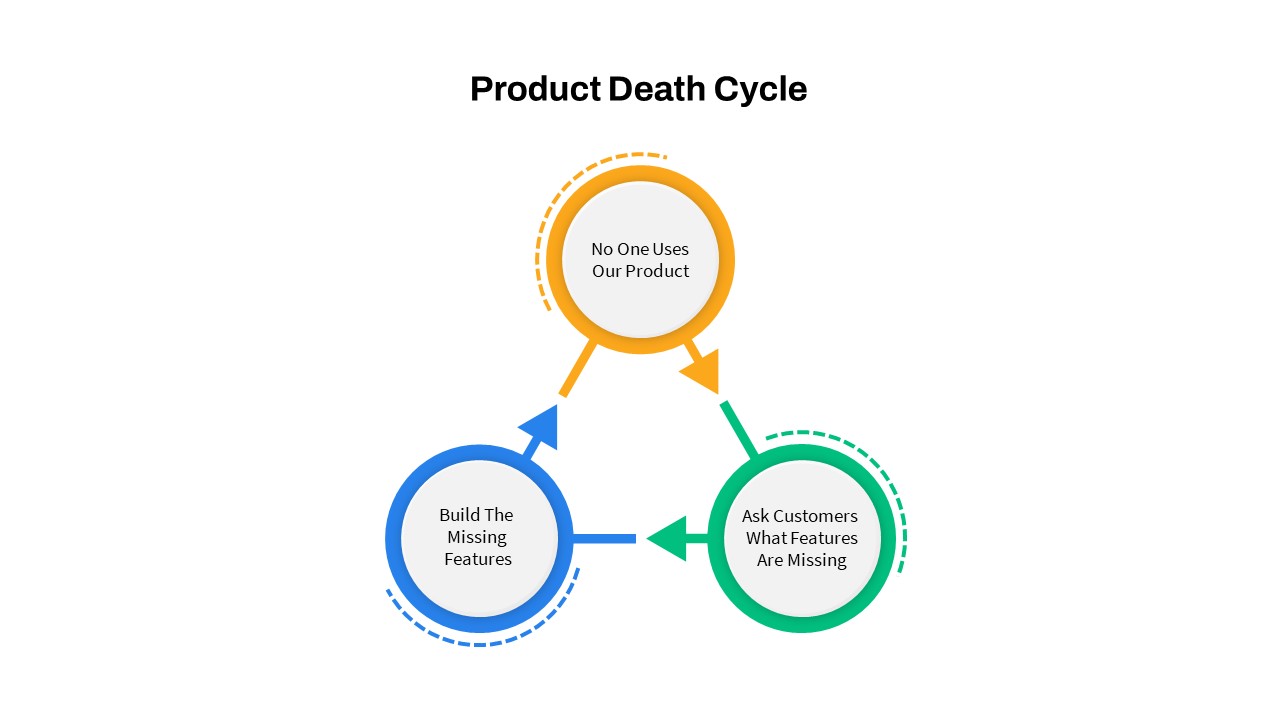
Product Death Cycle Diagram Slide for PowerPoint & Google Slides
Circular
Gear Pie Diagram Data Visualization Template for PowerPoint & Google Slides
Pie/Donut
Data Management and Analytics Diagram Template for PowerPoint & Google Slides
Circular
Advanced Data Flow Diagram Pack Template for PowerPoint & Google Slides
Flow Charts
Data Lake Hub-and-Spoke Diagram Template for PowerPoint & Google Slides
Cloud Computing
ETL Data Pipeline Workflow Diagram Template for PowerPoint & Google Slides
Process
Customer Data Platform Workflow Diagram Template for PowerPoint & Google Slides
Information Technology
Data-Driven Marketing Lifecycle Diagram Template for PowerPoint & Google Slides
Process
Data Governance Roles Pyramid Diagram Template for PowerPoint & Google Slides
Pyramid
4 Business Data Infographics Diagram for PowerPoint & Google Slides
Process
Three-Segment Circular Arrow Cycle Template for PowerPoint & Google Slides
Circular
Four-Segment Circular Arrow Cycle Template for PowerPoint & Google Slides
Circular
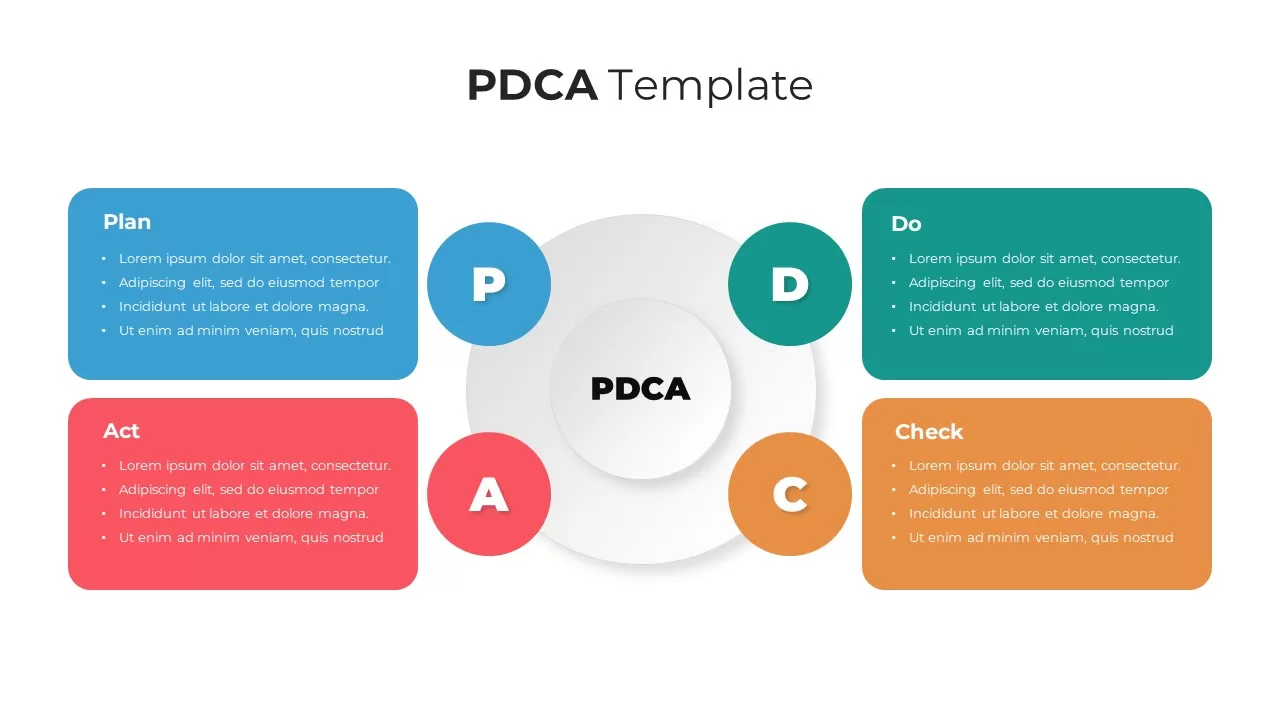
PDCA Four-Stage Cycle Infographic Template for PowerPoint & Google Slides
Process
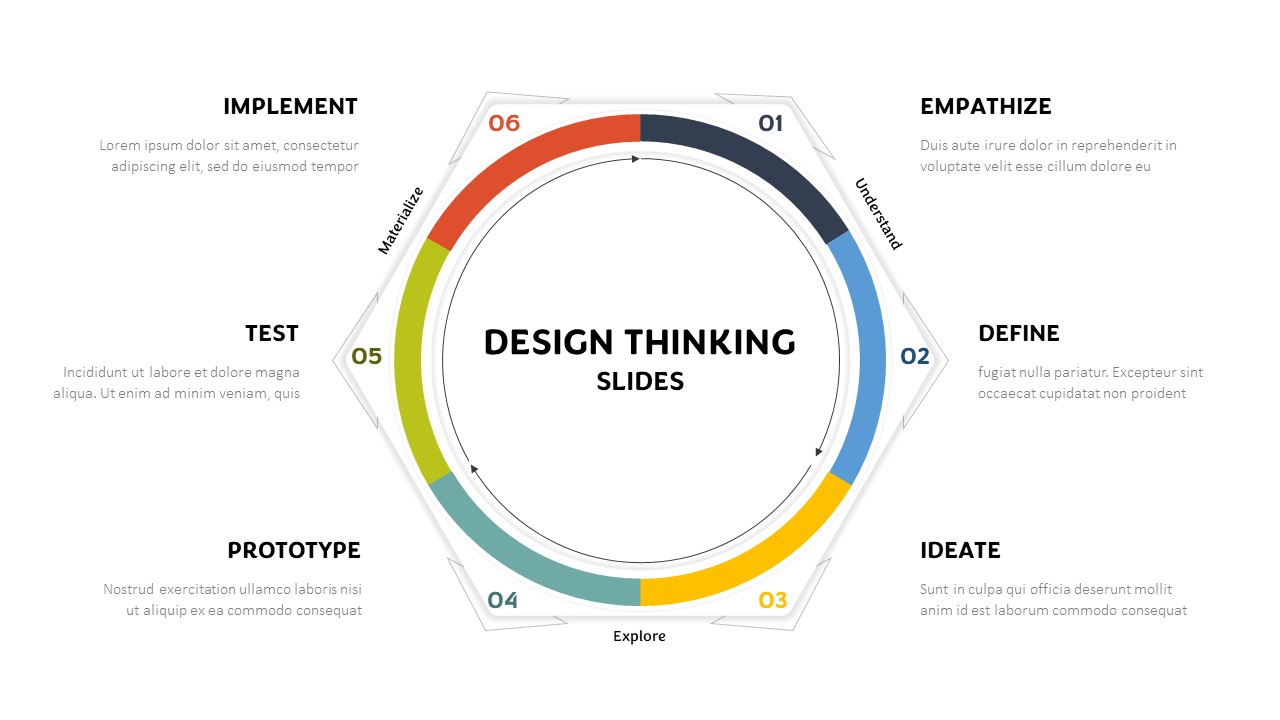
Hexagonal Design Thinking Cycle Template for PowerPoint & Google Slides
Process
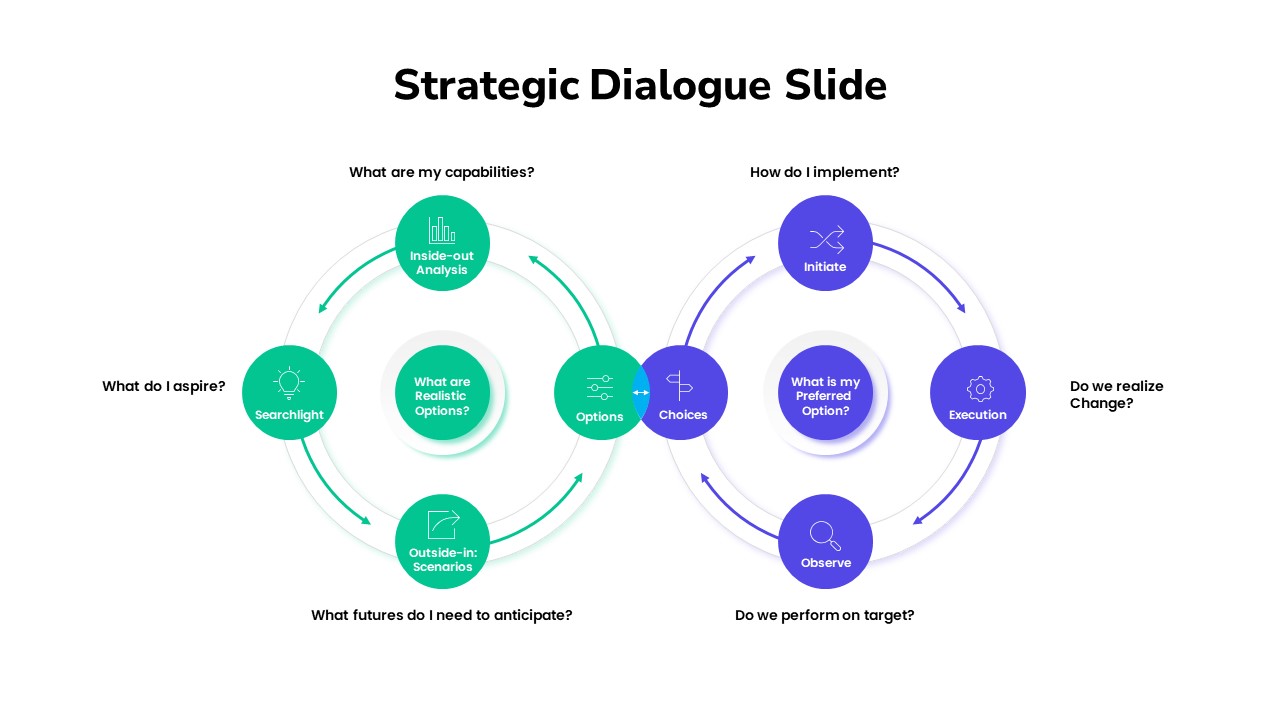
Strategic Dialogue Model Cycle Template for PowerPoint & Google Slides
Circular
Seeds Growth Cycle Business Model Template for PowerPoint & Google Slides
Process
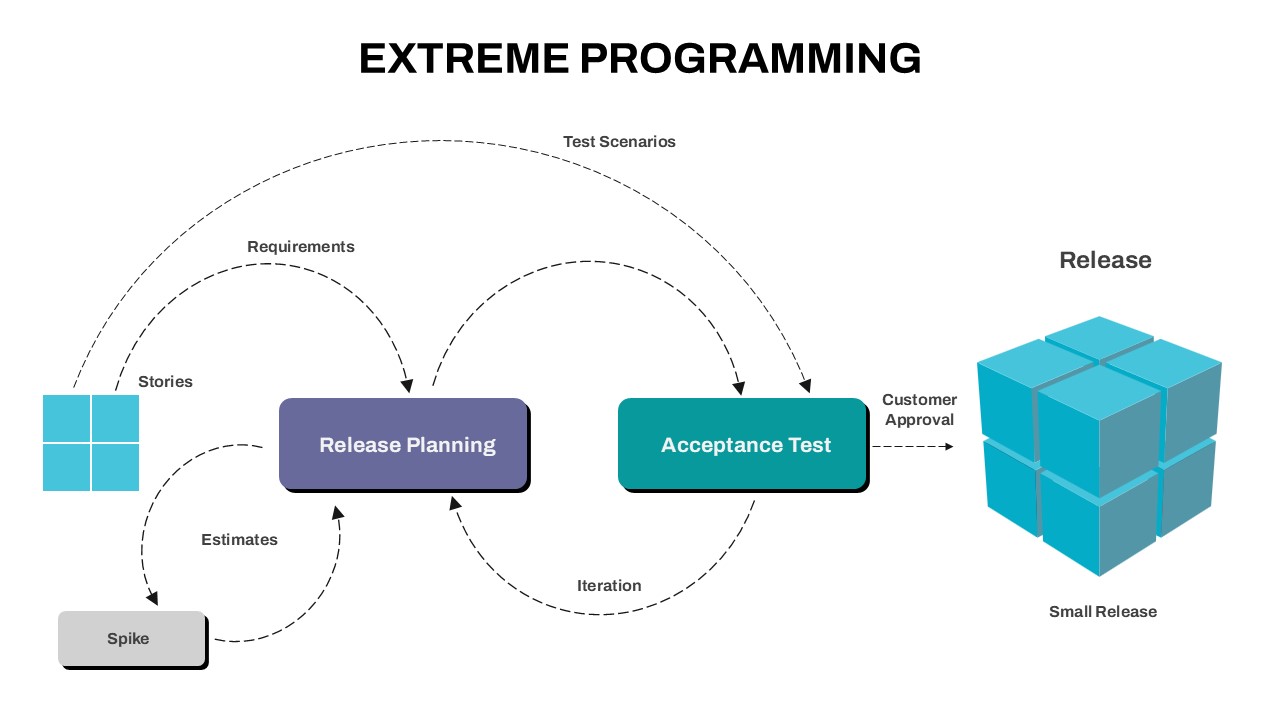
Extreme Programming Process Cycle Template for PowerPoint & Google Slides
Software Development