China Map Infographic Regional Stats Template for PowerPoint & Google Slides

Description
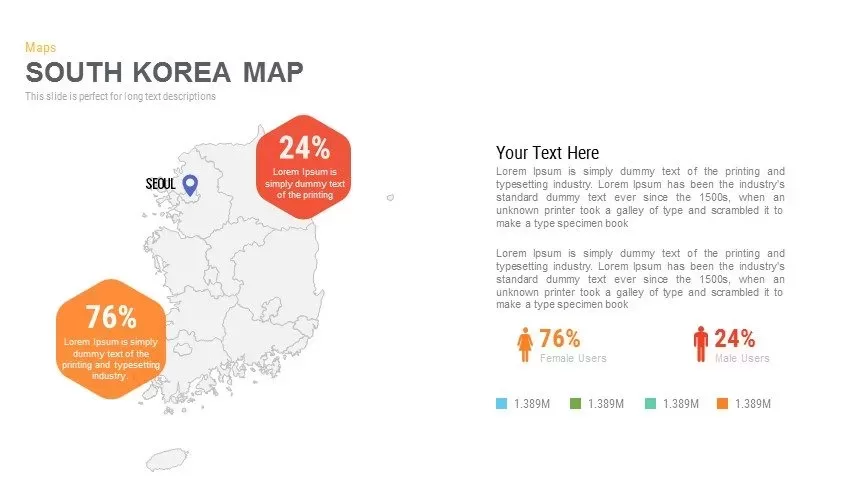
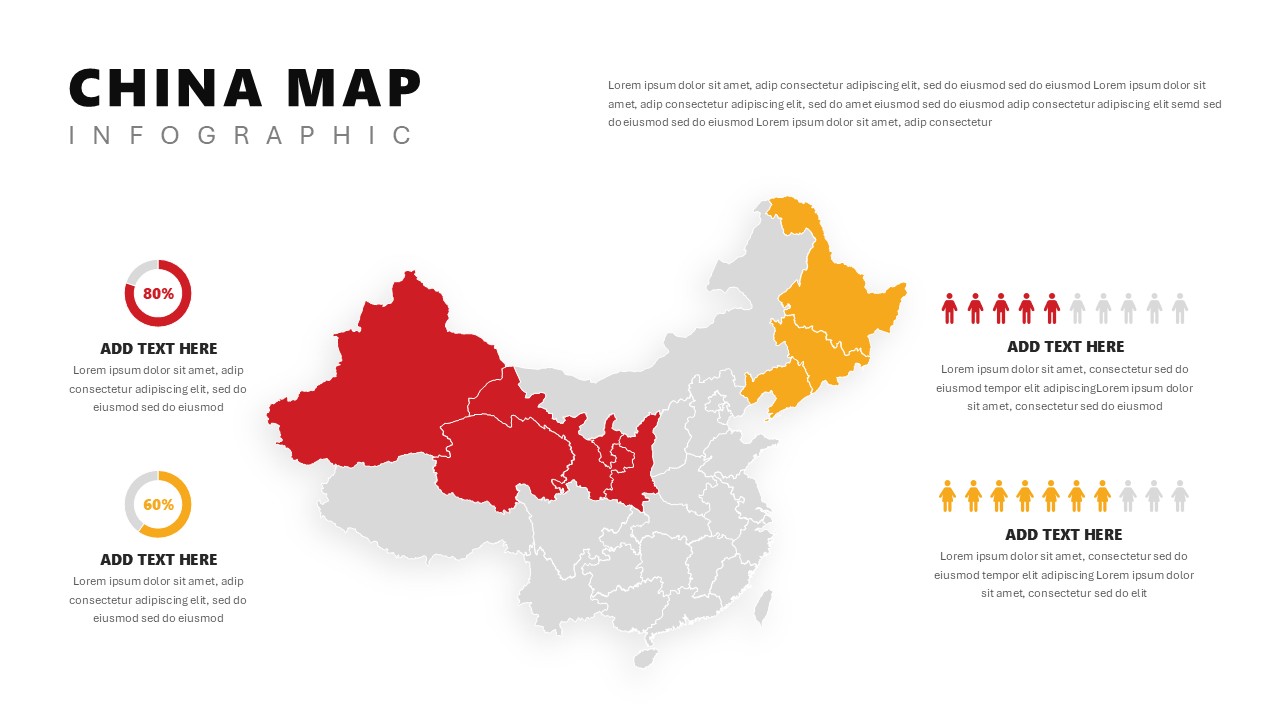
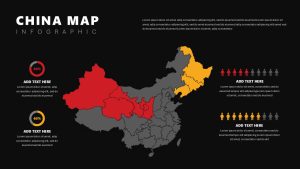
This China Map Infographic slide delivers a dynamic visual for presenting regional metrics across multiple provinces. At the center, a detailed vector map of China is rendered in neutral grey, with select regions highlighted in bold red and vibrant orange to differentiate two distinct data series. On the left, two semi-circular progress charts display percentage values of 80% and 60%, each paired with a headline placeholder and descriptive text block for context. On the right, horizontal arrays of human icons illustrate demographic or survey results, with colored and muted silhouettes indicating participation or completion rates. The layout employs clean sans-serif typography, subtle drop shadows, and crisp iconography to maintain a professional yet approachable aesthetic. Built on editable master slides, every shape, color, and text placeholder can be customized to align with your brand’s visual identity.
This template is optimized for widescreen presentations in both PowerPoint and Google Slides. All graphical elements are vector-based, ensuring flawless scaling and print-quality exports. Placeholder text areas and icons can be swapped or recolored in seconds, while master-level design controls guarantee consistency across multiple slides. Use this slide to highlight market penetration by province, compare regional sales performance, or visualize demographic distributions. The balanced left-right composition and strategic use of color coding help audiences quickly understand complex data, making your message clear and memorable.
Additional callout sections feature editable text placeholders for titles and captions, enabling you to add narrative context or KPI highlights alongside visual data. The slide supports easy color scheme adjustments, allowing you to switch between corporate palette or thematic tones with a few clicks. Its vector-based design ensures compatibility across screen sizes and seamless integration into larger decks. By leveraging this China map layout, presenters can deliver compelling regional analyses for sales meetings, investor briefings, or strategy workshops.
Who is it for
Regional sales managers, market strategists, business analysts, and executive teams will find this slide invaluable when presenting geographic performance reports. Data scientists and research consultants can use it to illustrate demographic distributions and survey results effectively.
Other Uses
Beyond sales and demographic reporting, this template can serve for supply chain mapping, risk assessment by province, resource allocation planning, and educational or training materials. The flexible layout suits investor updates, policy briefings, and academic presentations requiring geographic context.
Login to download this file

Item ID
SB04866
Related Templates

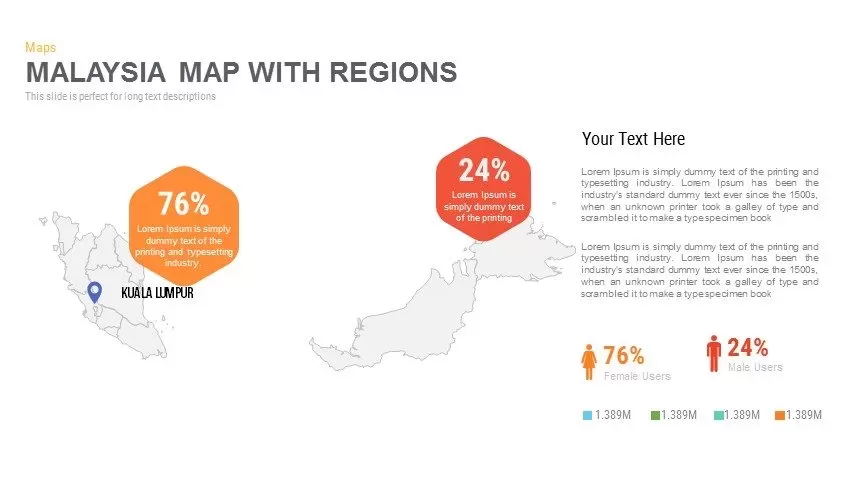
Malaysia Regional Map Infographic Template for PowerPoint & Google Slides
Maps

Syria Regional Data Map Infographic Template for PowerPoint & Google Slides
World Maps
Egypt Regional Map Slide Pack Template for PowerPoint & Google Slides
World Maps
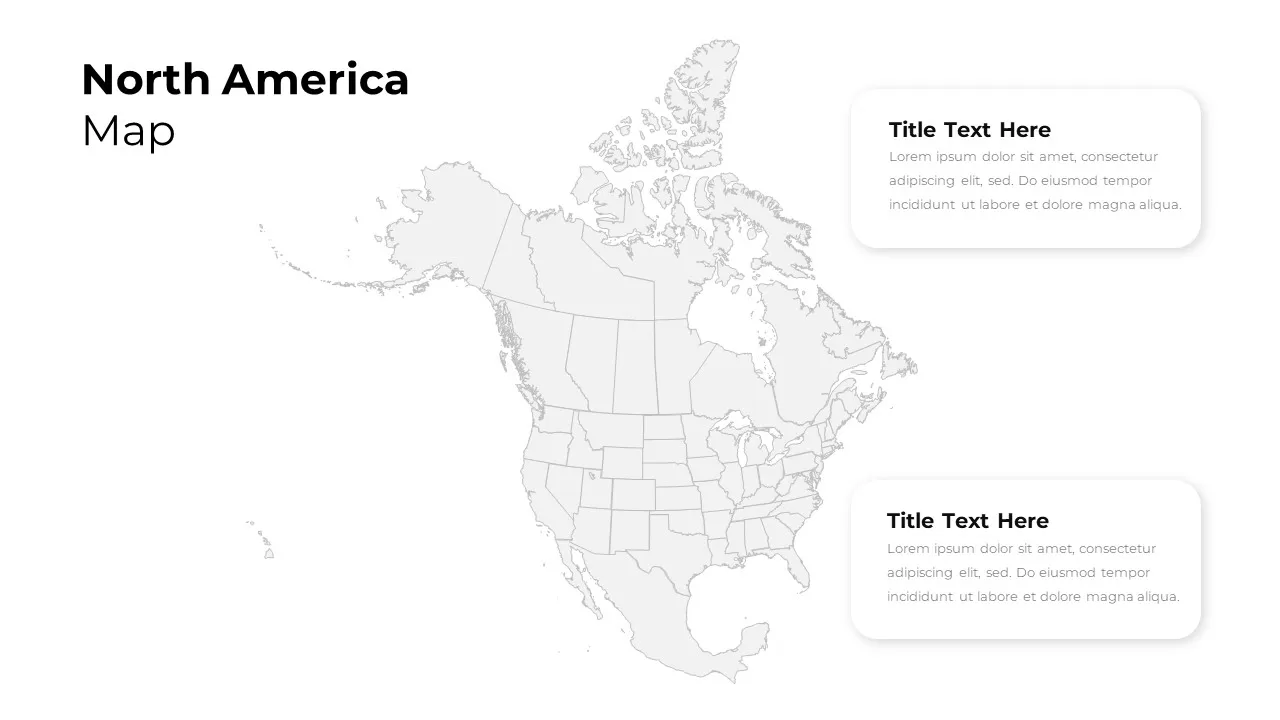
North America Regional Map Overview Template for PowerPoint & Google Slides
World Maps
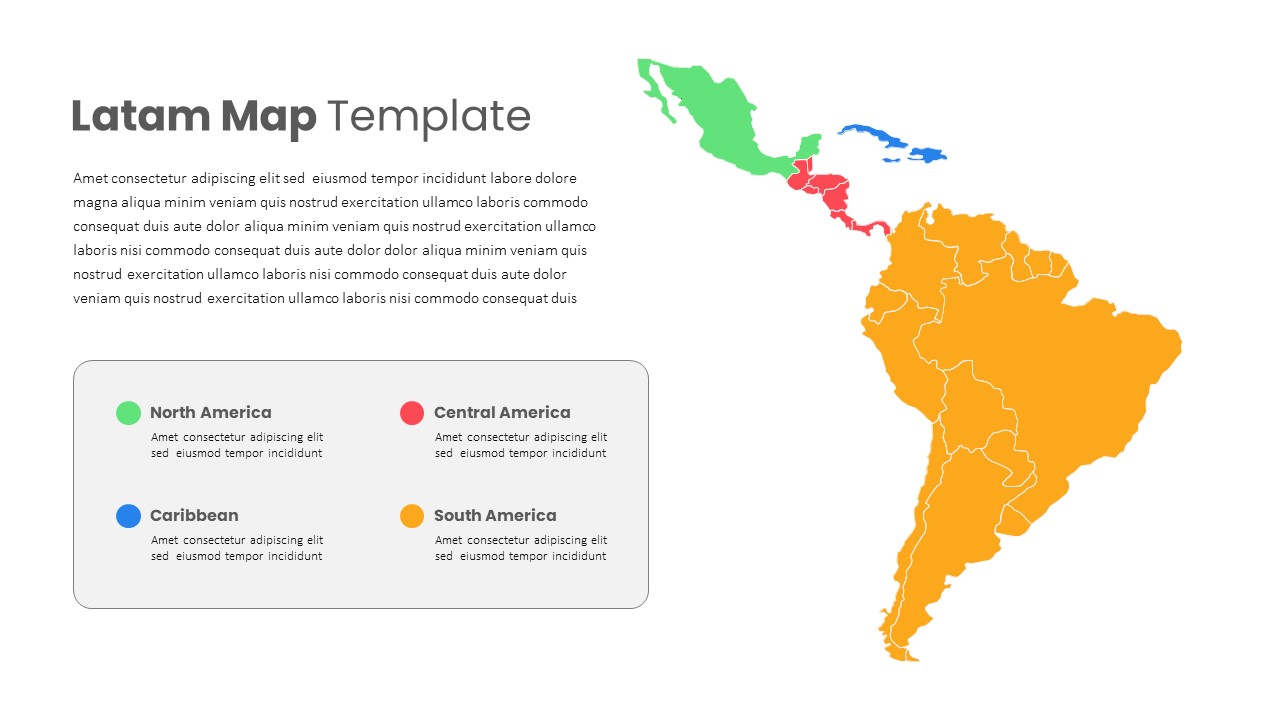
Latin America Regional Map Breakdown Template for PowerPoint & Google Slides
World Maps
Free Editable U.S. Map with Regional Metrics Template for PowerPoint & Google Slides
World Maps
Free
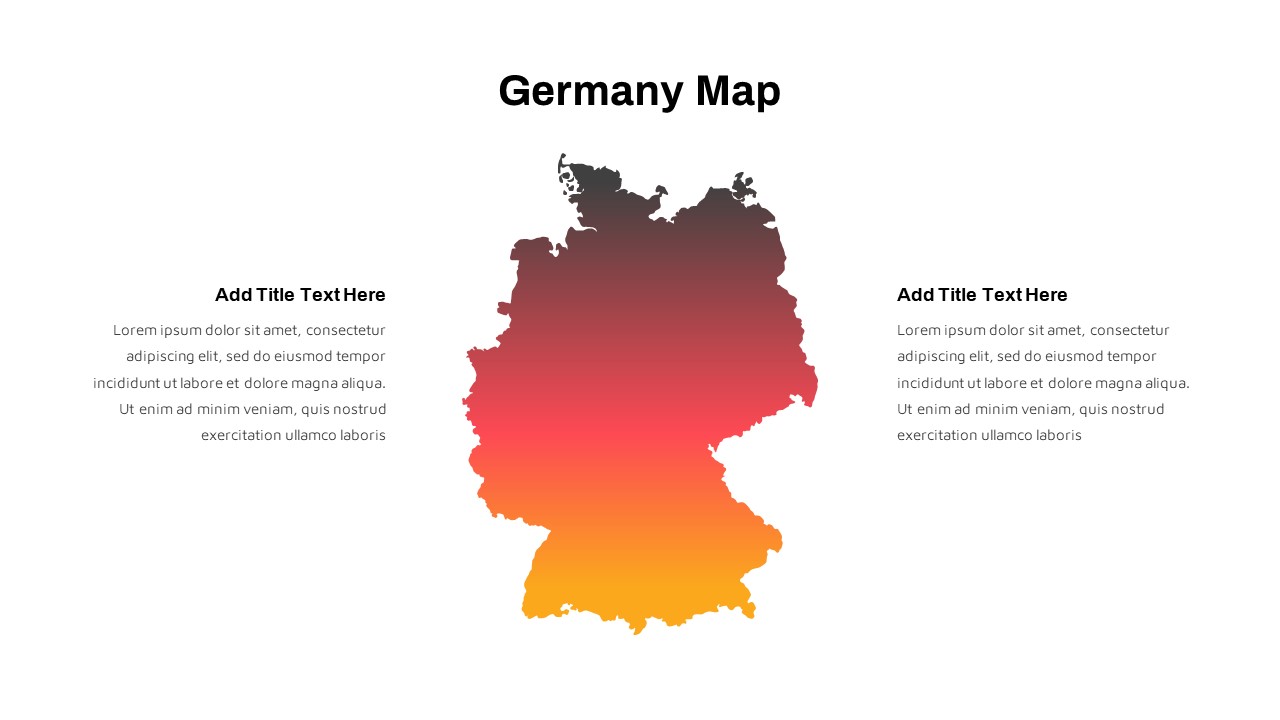
Germany Map with Regional Callouts Template for PowerPoint & Google Slides
World Maps
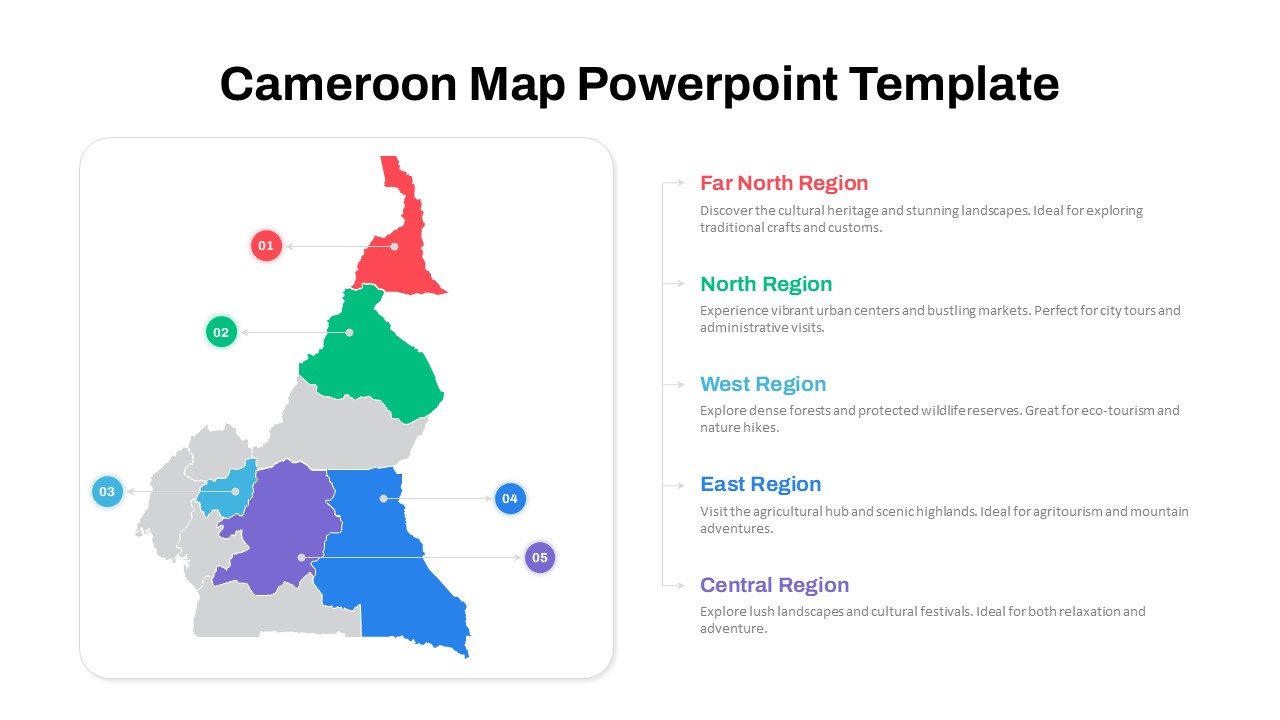
Numbered Cameroon Regional Map Slide Template for PowerPoint & Google Slides
World Maps
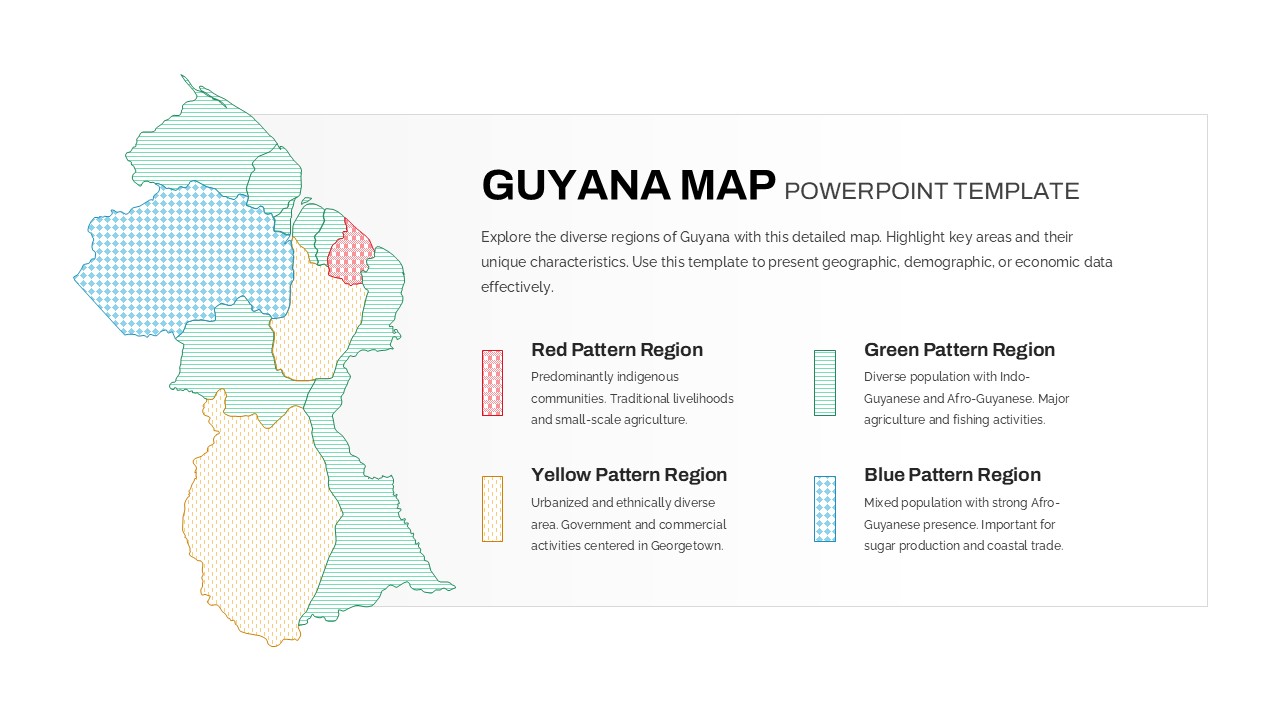
Patterned Guyana Regional Map Template for PowerPoint & Google Slides
World Maps
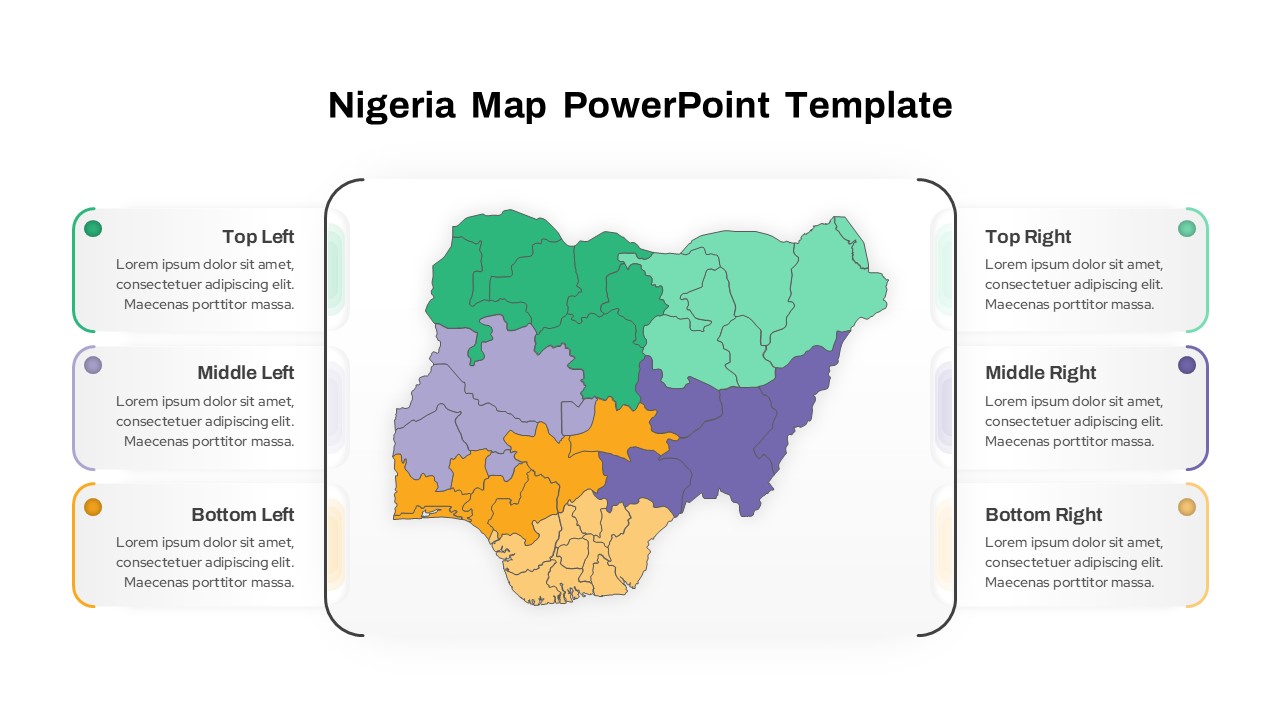
Nigeria Regional Callout Map Diagram Template for PowerPoint & Google Slides
Maps
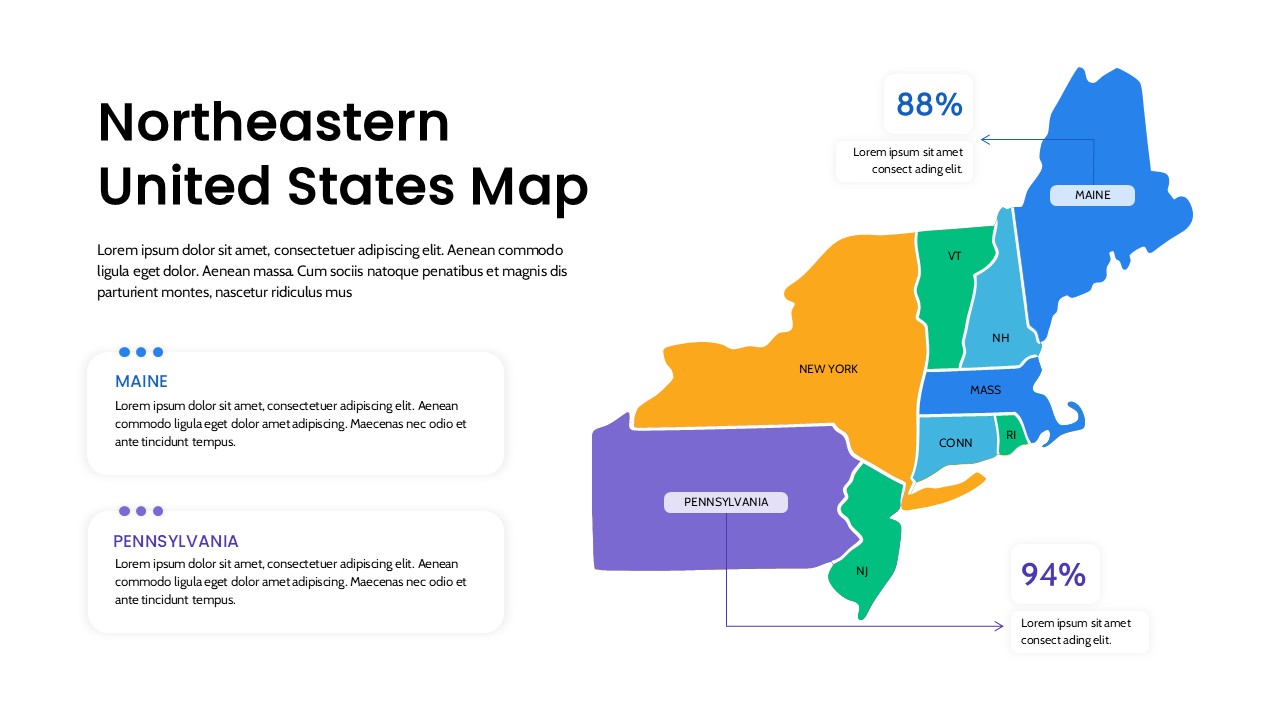
Northeastern United States Regional Map for PowerPoint & Google Slides
World Maps
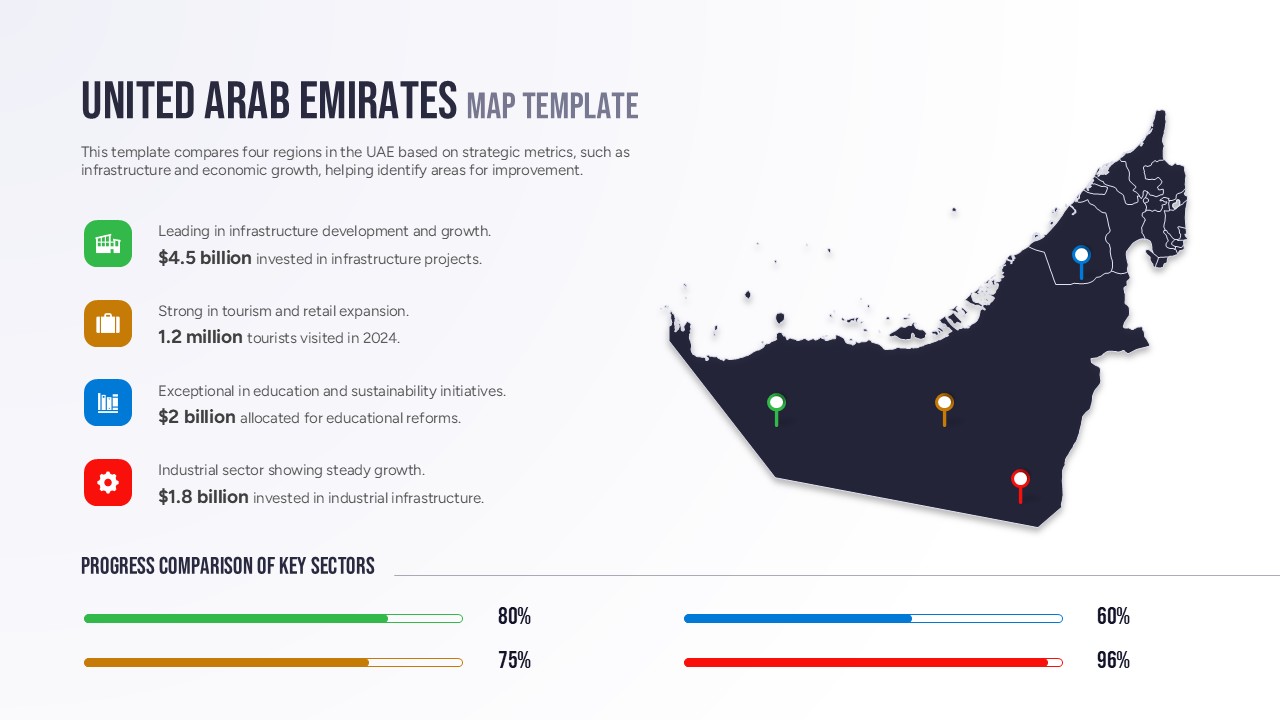
Free United Arab Emirates Regional Map for PowerPoint & Google Slides
World Maps
Free
Soccer Match Stats Dashboard Slide Template for PowerPoint & Google Slides
Graphics
Regional Revenue Comparison Overview Template for PowerPoint & Google Slides
Comparison
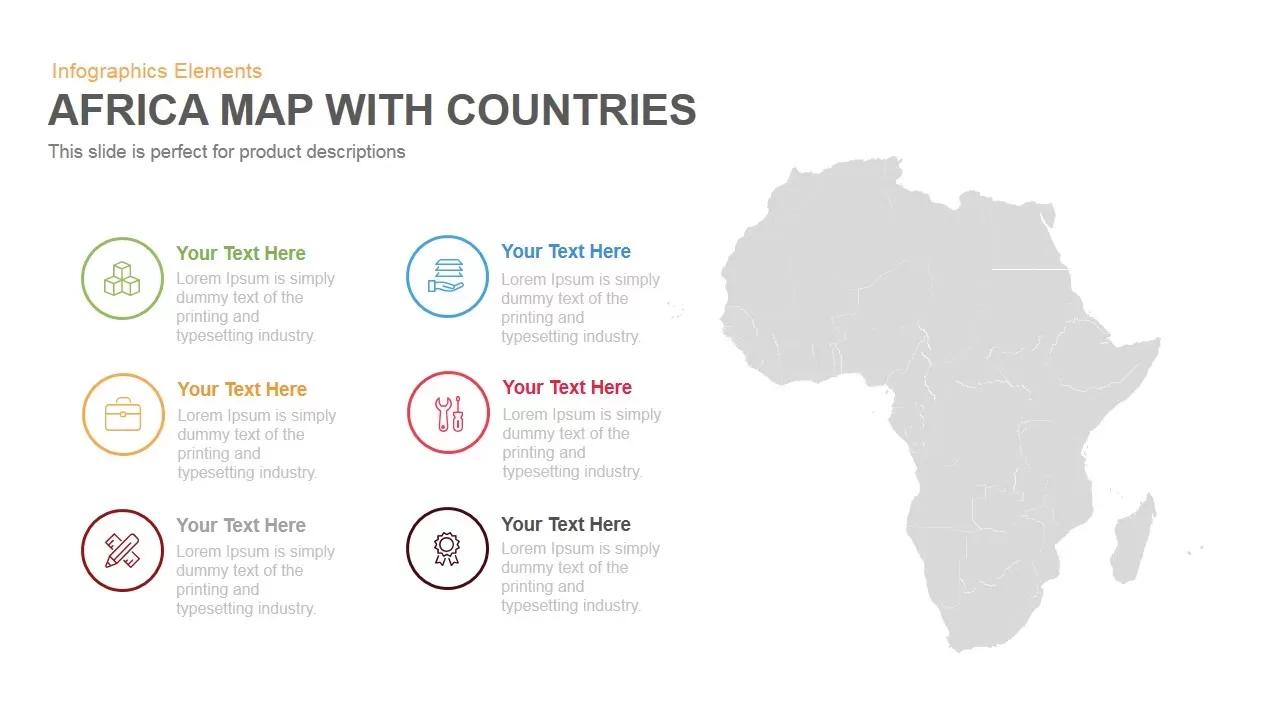
Africa Country Map Infographic Template for PowerPoint & Google Slides
World Maps
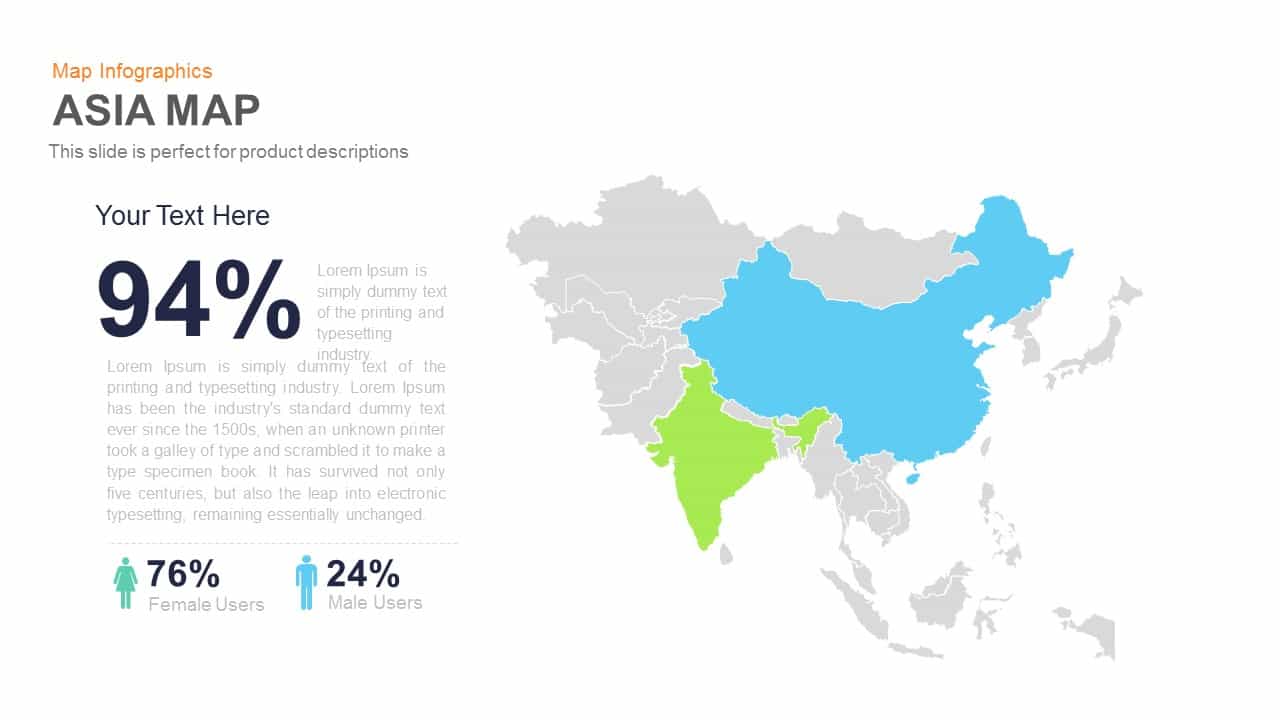
Asia Map Infographic with Demographics template for PowerPoint & Google Slides
World Maps
Curved Road Map Timeline Infographic Template for PowerPoint & Google Slides
Roadmap
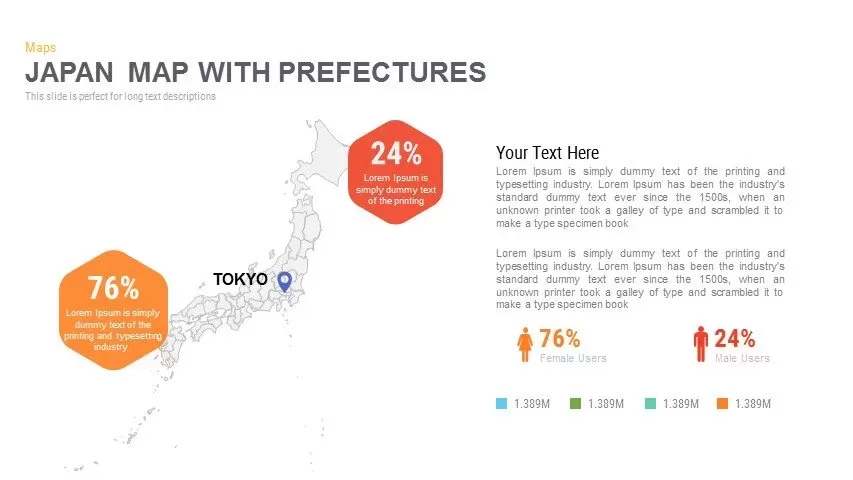
Japan Province Map Infographic Template for PowerPoint & Google Slides
Maps
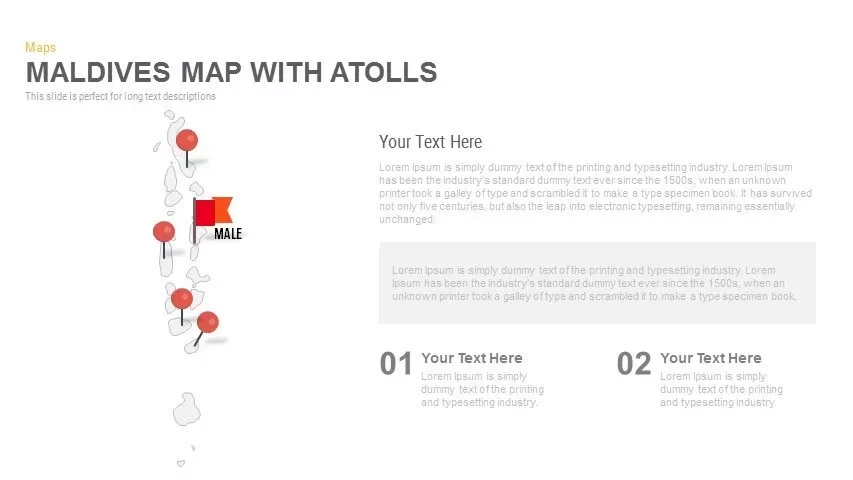
Maldives Map Infographic Template for PowerPoint & Google Slides
Maps
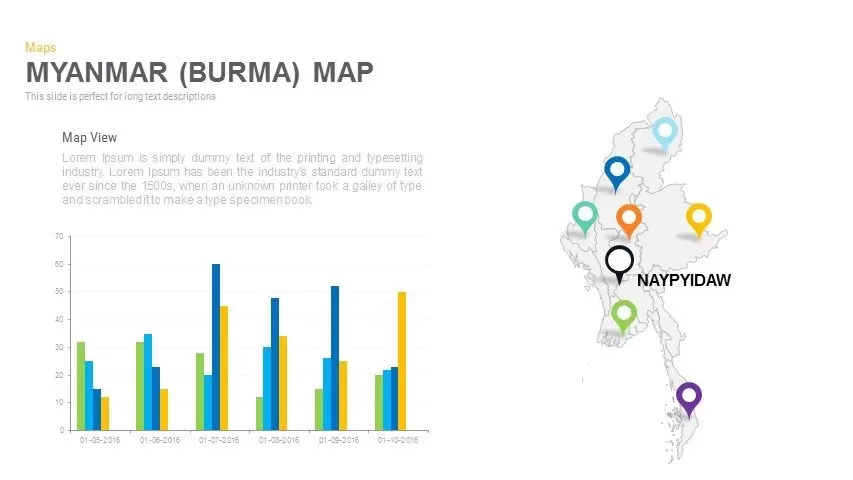
Myanmar (Burma) Provincial Map Infographic Template for PowerPoint & Google Slides
Maps
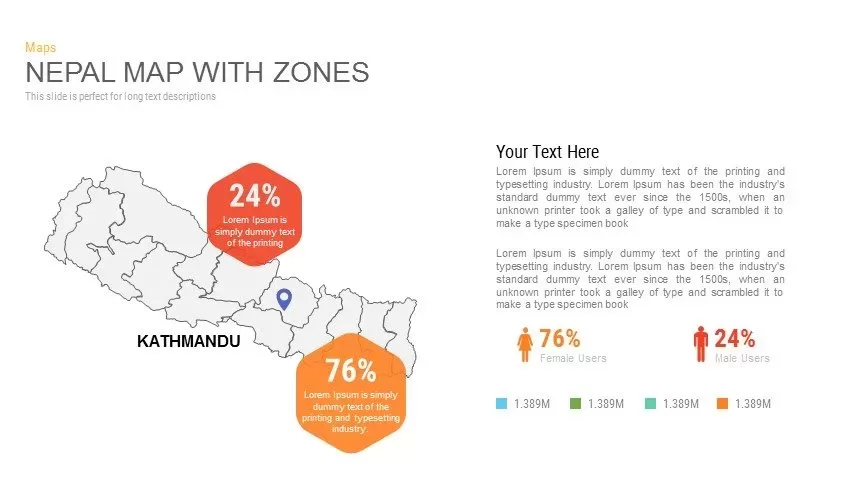
Nepal Map with Zones Infographic Template for PowerPoint & Google Slides
Maps
North Korea Map with Provinces Infographic Pack Template for PowerPoint & Google Slides
Maps
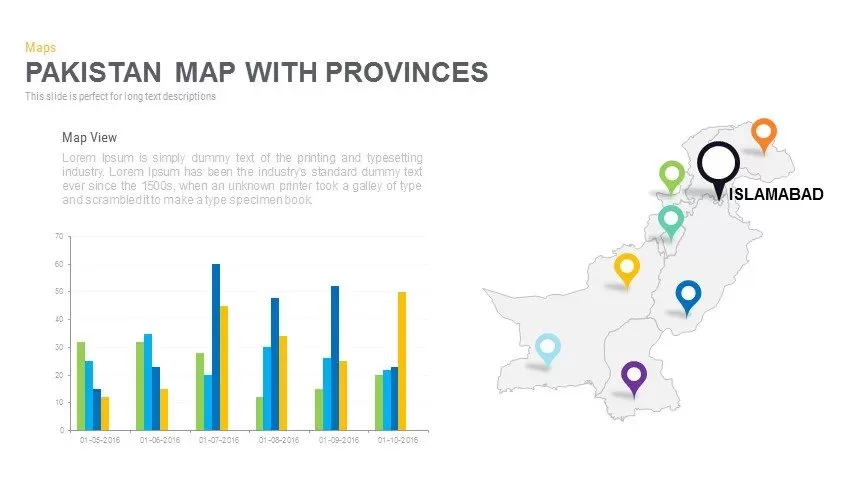
Pakistan Provinces Map Infographic Pack Template for PowerPoint & Google Slides
Maps
Infographic South Korea Map Template for PowerPoint & Google Slides
Maps
Sri Lanka Map Infographic Pack Template for PowerPoint & Google Slides
Maps
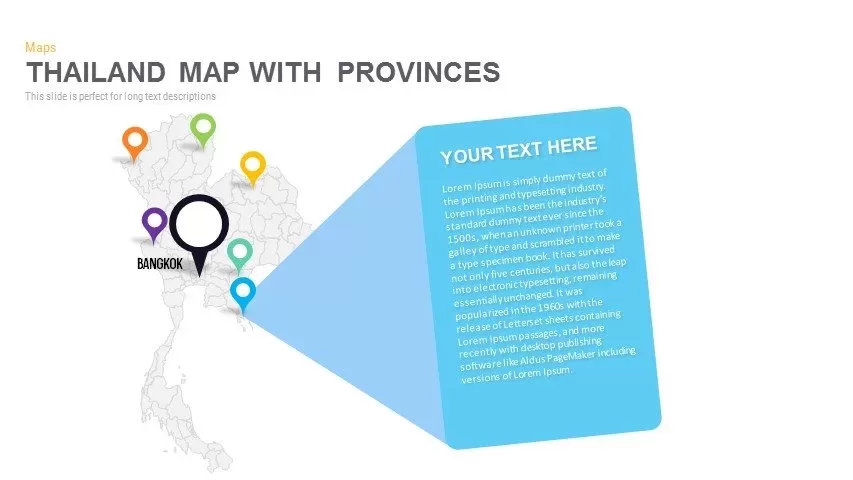
Thailand Provinces Map Infographic Pack Template for PowerPoint & Google Slides
Maps
Vietnam Provinces Map Infographic Pack Template for PowerPoint & Google Slides
Maps
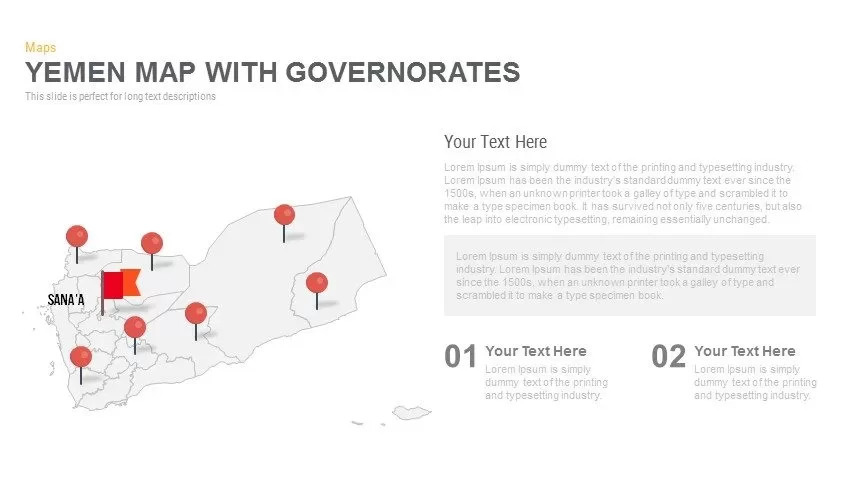
Yemen Governorates Infographic Map Template for PowerPoint & Google Slides
Maps

Multi-Cluster Mind Map Infographic Template for PowerPoint & Google Slides
Mind Maps
Colorful Mind Map Infographic Template with Icons for PowerPoint & Google Slides
Mind Maps
Colorful Mind Map Infographic Template for PowerPoint & Google Slides
Mind Maps
Mind Map Infographic Slide Template for PowerPoint & Google Slides
Mind Maps

Modern World Map Callout Infographic Template for PowerPoint & Google Slides
World Maps
Eight-Node Mind Map Infographic Diagram Template for PowerPoint & Google Slides
Mind Maps
Six-Stage Road Map Infographic Timeline Template for PowerPoint & Google Slides
Roadmap
Versatile Mind Map Infographic Template for PowerPoint & Google Slides
Mind Maps
Structured Mind Map Infographic Diagram Template for PowerPoint & Google Slides
Mind Maps
Dual Topic Mind Map Infographic Template for PowerPoint & Google Slides
Mind Maps
Tri-Cluster Mind Map Infographic Template for PowerPoint & Google Slides
Mind Maps
Fully Editable World Map Infographic Template for PowerPoint & Google Slides
World Maps
Editable World Map Callout Infographic Template for PowerPoint & Google Slides
World Maps
Editable World Map Callout Infographic Template for PowerPoint & Google Slides
World Maps
North America Percentage Map Infographic Template for PowerPoint & Google Slides
World Maps
North America Map Infographic Slide Template for PowerPoint & Google Slides
World Maps
Editable Africa Map Infographic Data Template for PowerPoint & Google Slides
World Maps
Editable Ireland Map Infographic Slide Template for PowerPoint & Google Slides
World Maps
Free
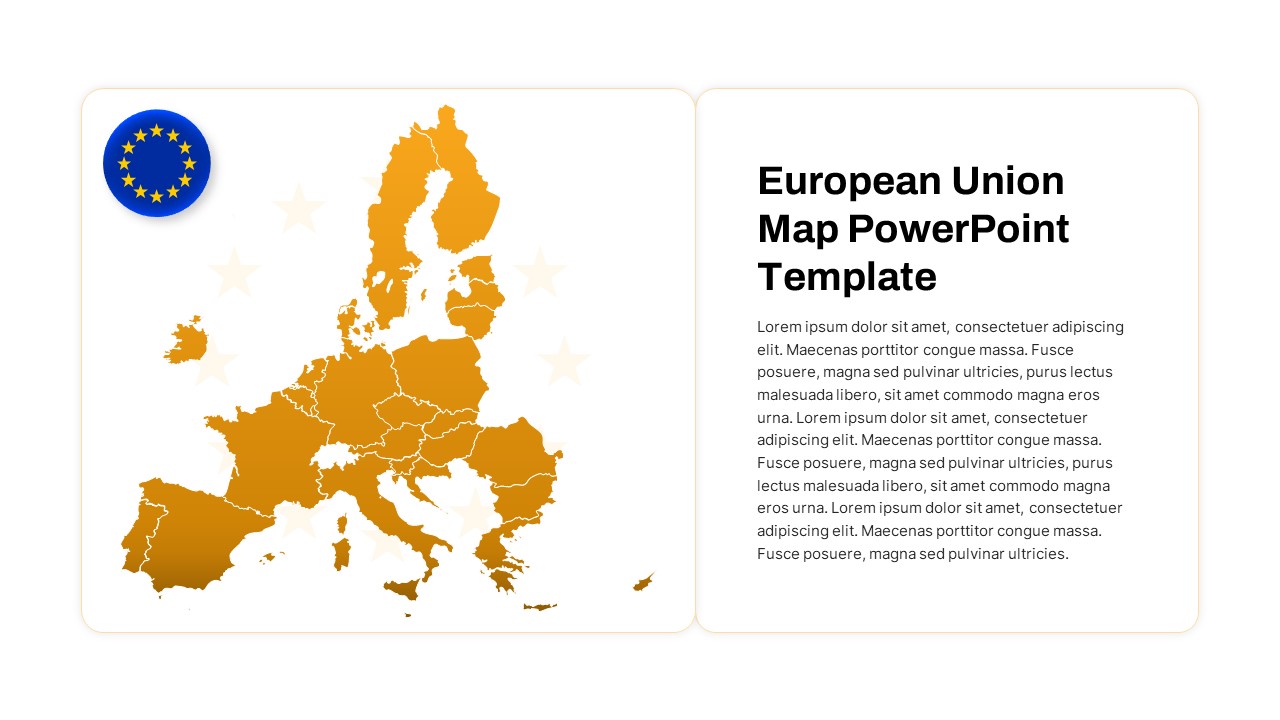
European Union Map Infographic Template for PowerPoint & Google Slides
World Maps
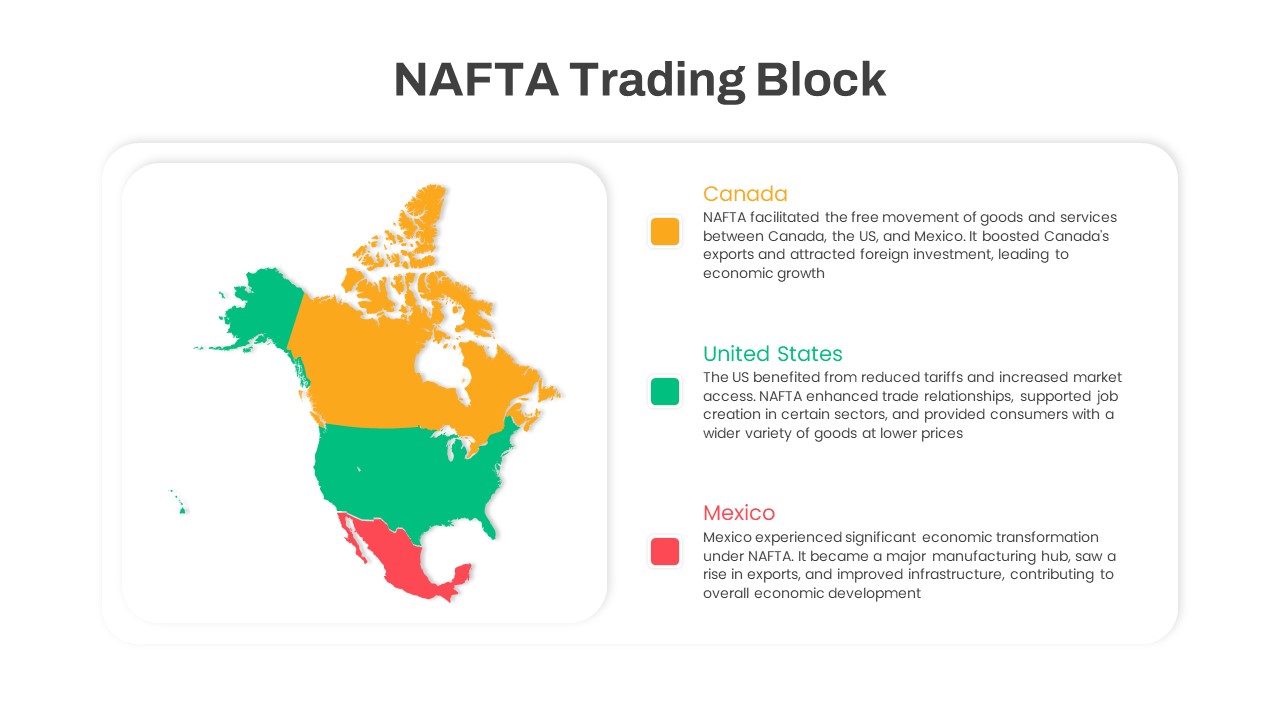
NAFTA Trading Block Map Infographic Template for PowerPoint & Google Slides
World Maps
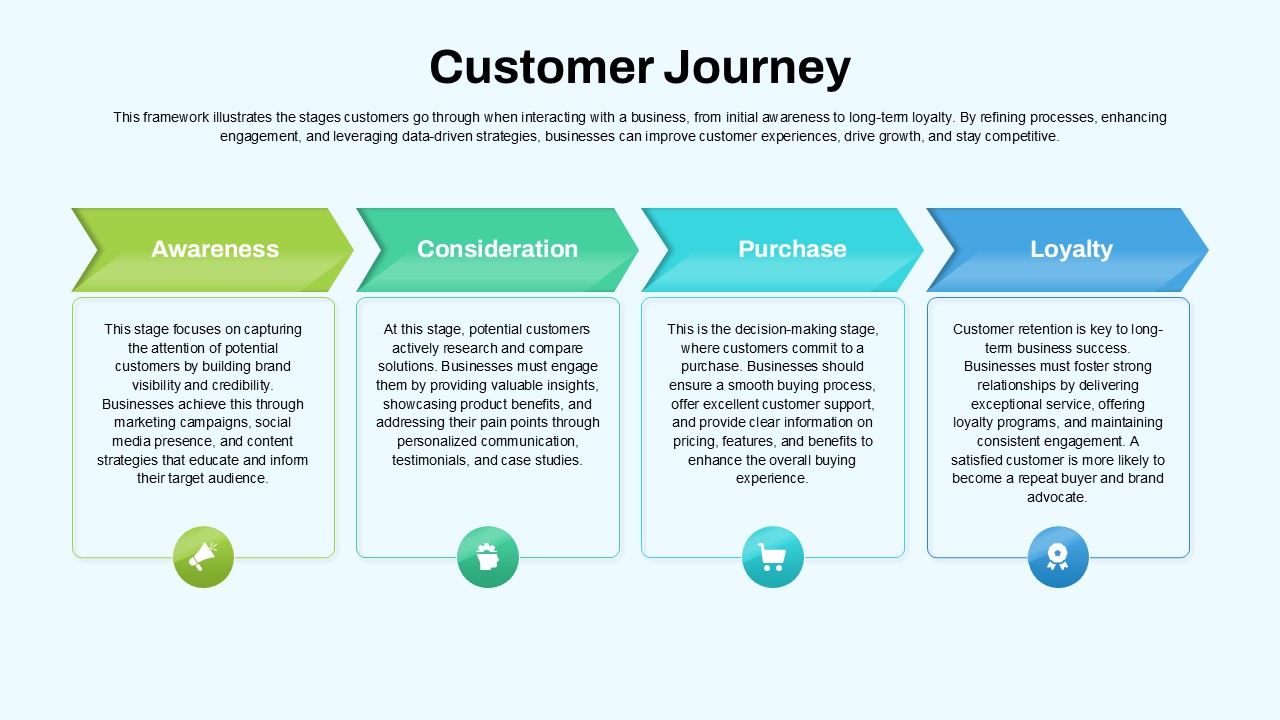
Customer Journey Process Map Infographic Template for PowerPoint & Google Slides
Customer Journey
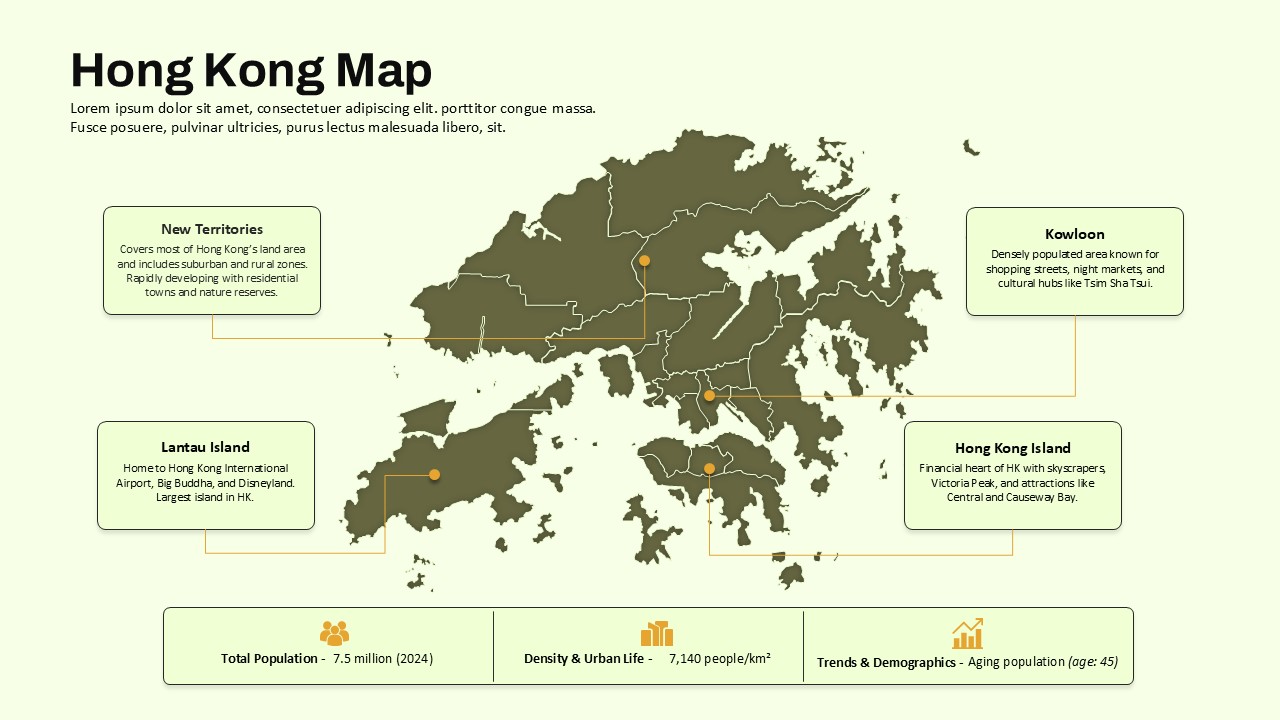
Hong Kong Geographic Map Infographic Template for PowerPoint & Google Slides
World Maps
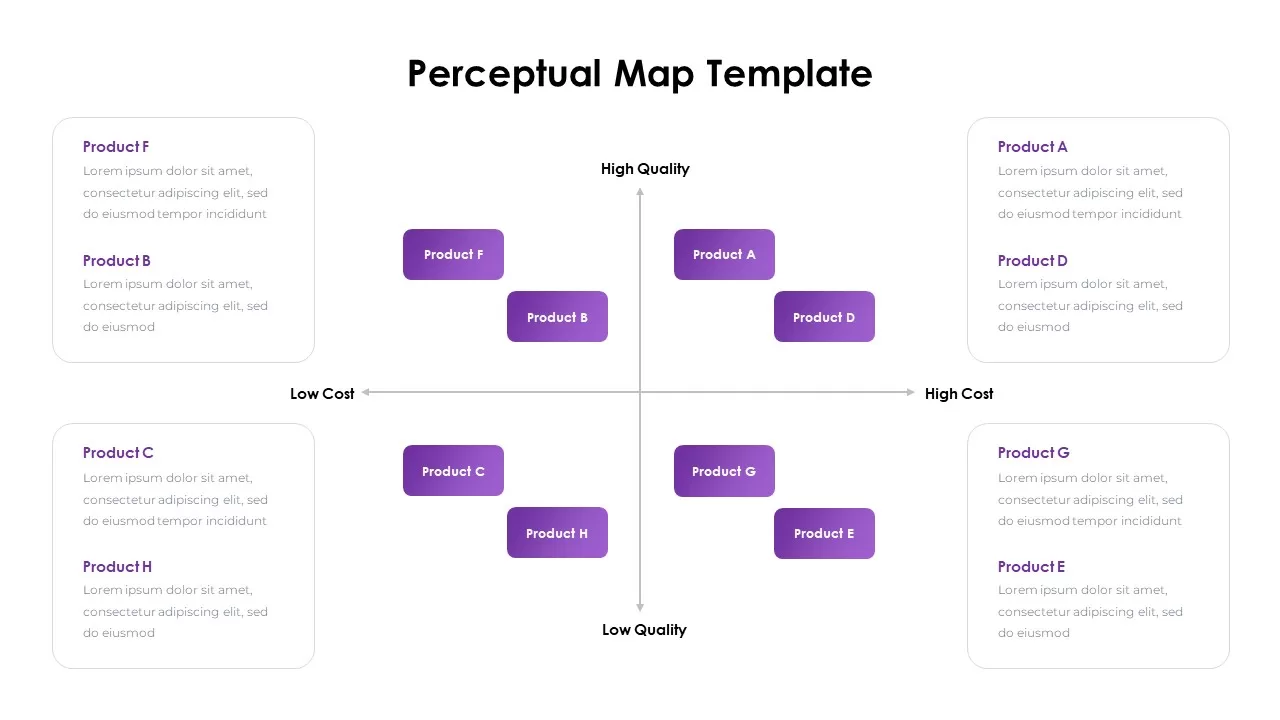
Perceptual Map infographic for PowerPoint & Google Slides
Competitor Analysis
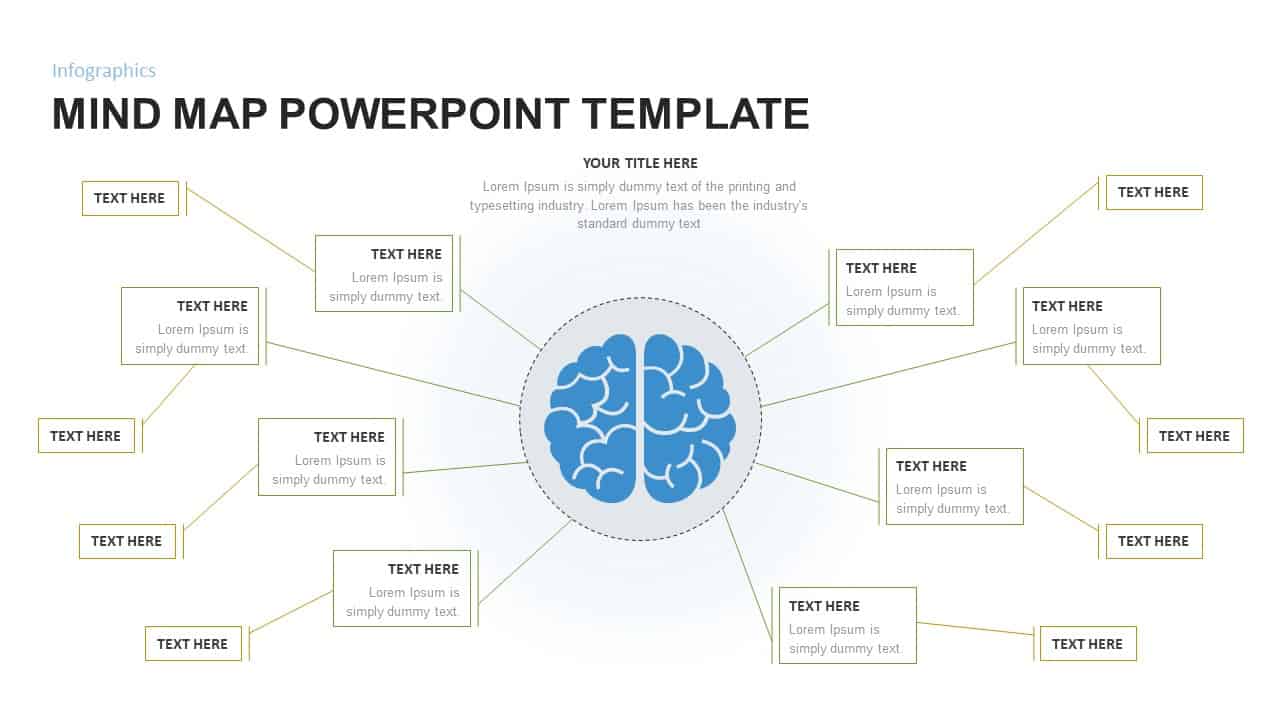
Mind Map PowerPoint template for PowerPoint & Google Slides
Mind Maps
Editable Colombia Map PowerPoint Template for PowerPoint & Google Slides
Business Models
World Map Data template for PowerPoint & Google Slides
World Maps
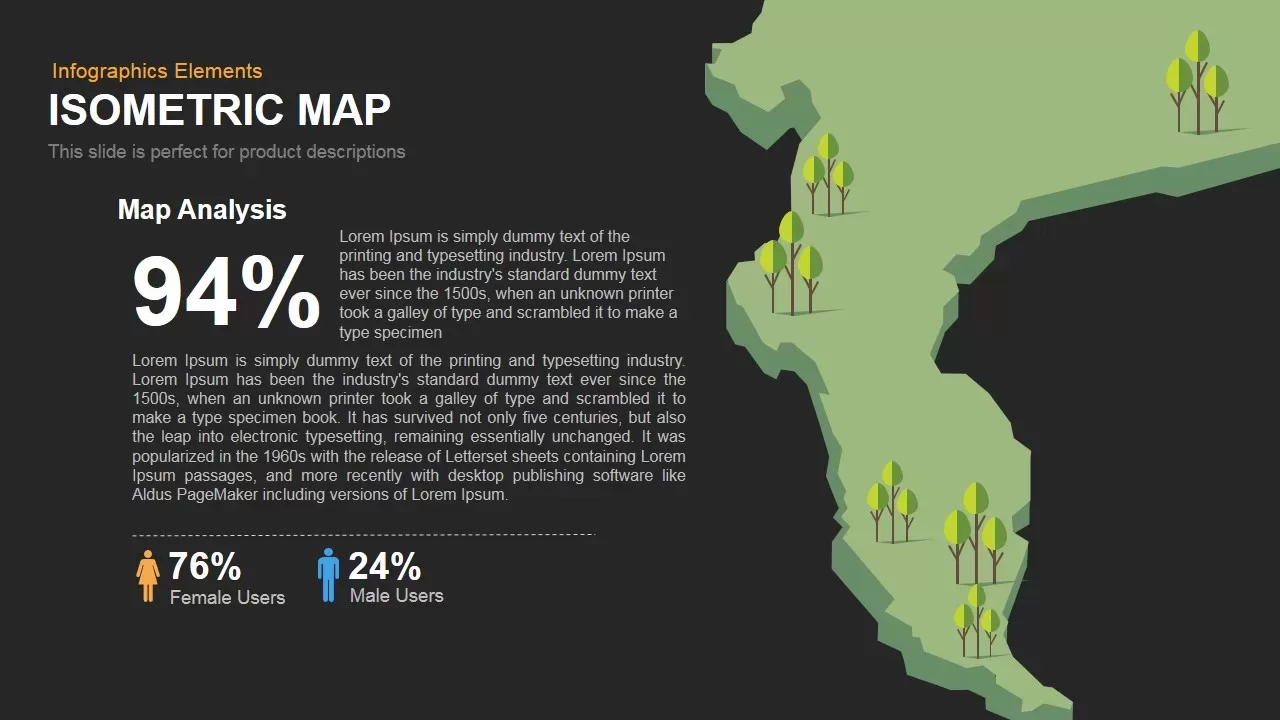
Isometric Map Analysis Slide Template for PowerPoint & Google Slides
World Maps
Asia Map with KPI Metrics and Legend Template for PowerPoint & Google Slides
World Maps
Diamond Mind Map Diagram Four Branches Template for PowerPoint & Google Slides
Mind Maps
Simple Multi-Branch Mind Map Template for PowerPoint & Google Slides
Mind Maps
Customizable USA Map With State Markers Template for PowerPoint & Google Slides
World Maps
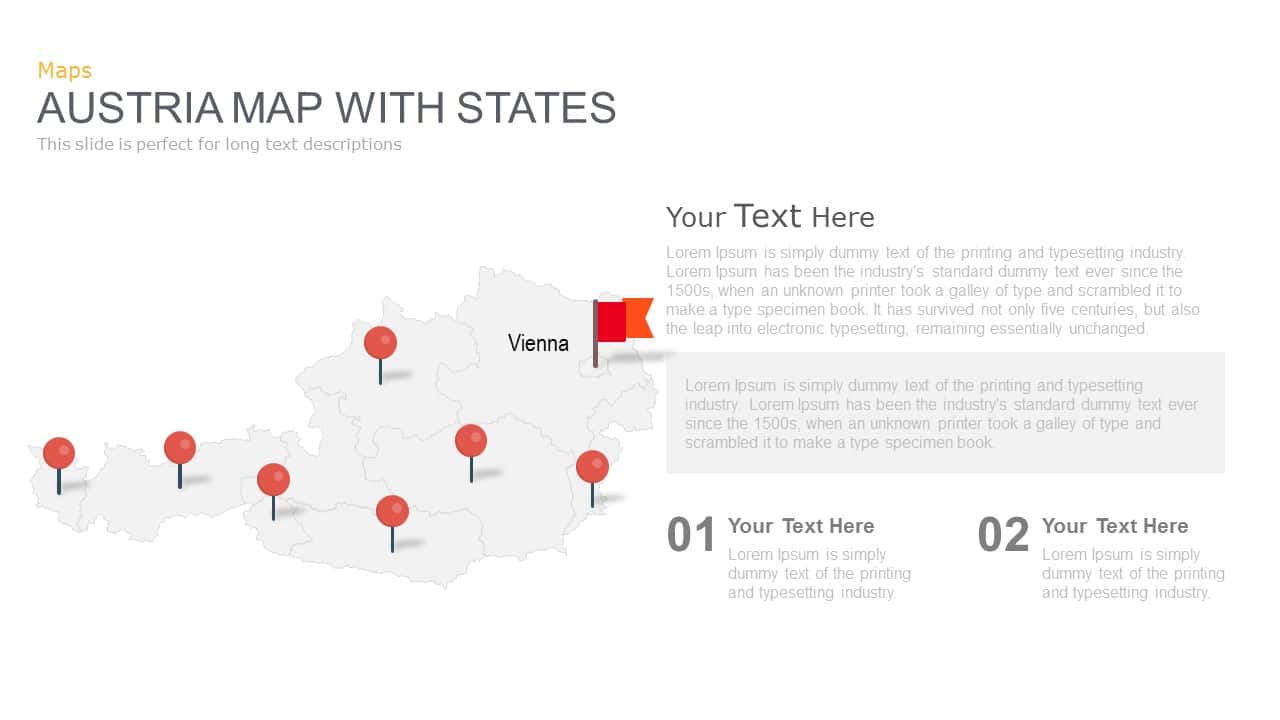
Austria Map With State Markers Template for PowerPoint & Google Slides
World Maps
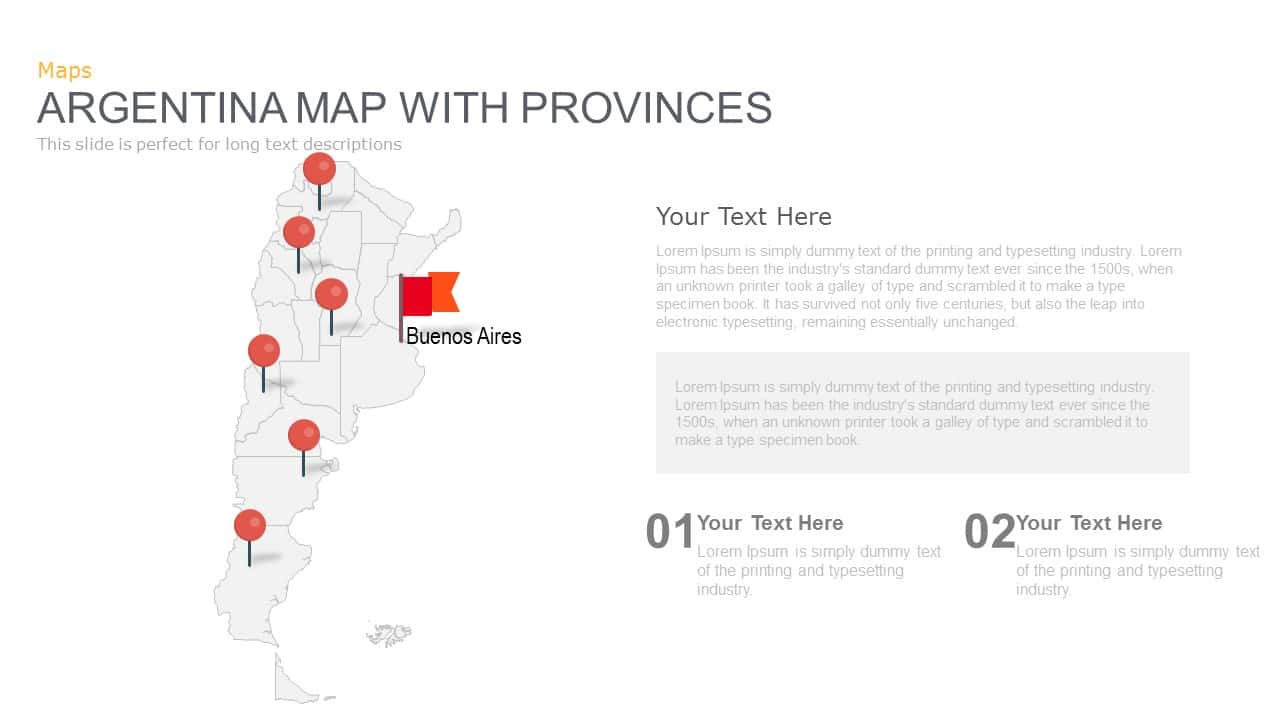
Argentina Province Map Markers Template for PowerPoint & Google Slides
World Maps
Azerbaijan Map with Provinces & Callouts Template for PowerPoint & Google Slides
World Maps
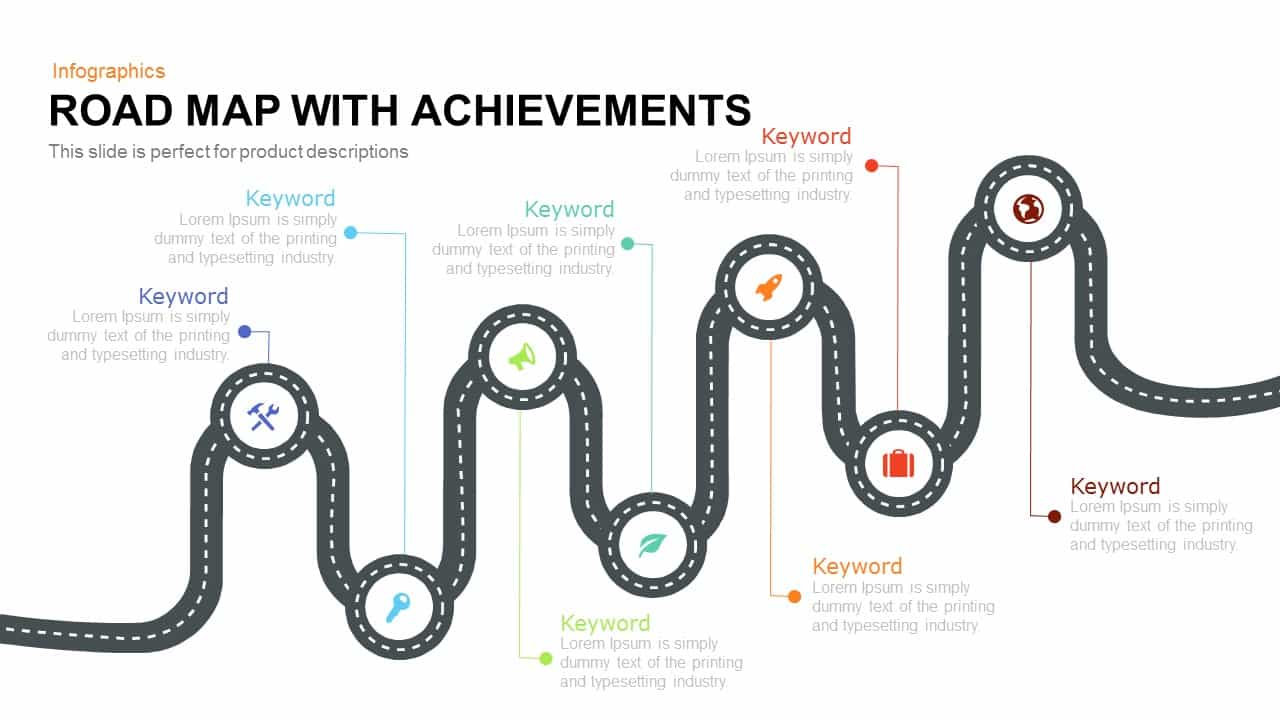
Road Map with Achievements Milestones Template for PowerPoint & Google Slides
Roadmap
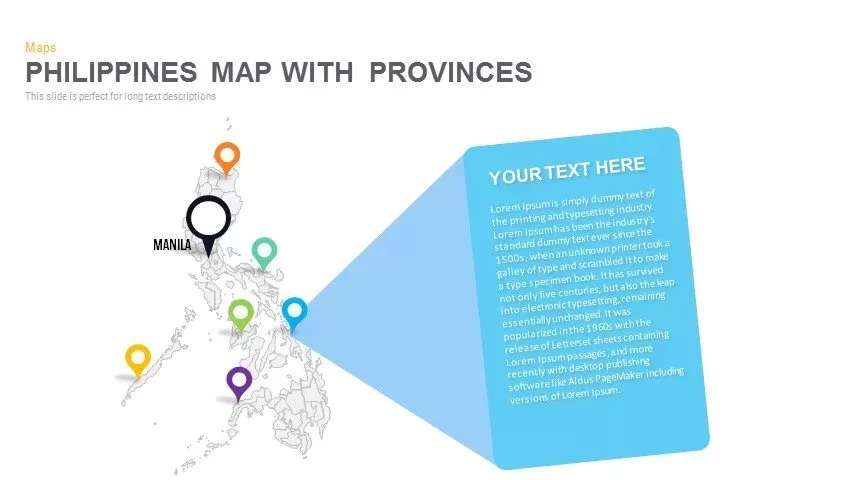
Philippines Map with Provinces Pack Template for PowerPoint & Google Slides
Maps
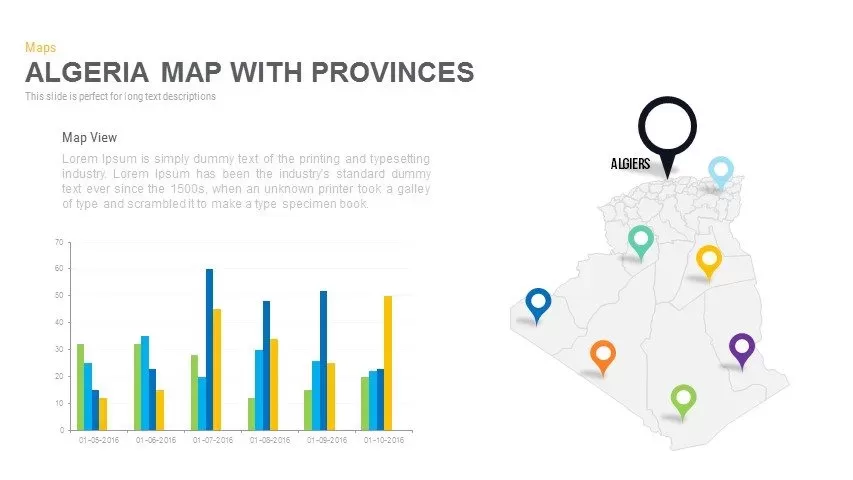
Algeria Map with Provinces Pack Template for PowerPoint & Google Slides
Maps
Angola Provinces Map Slide Pack Template for PowerPoint & Google Slides
World Maps
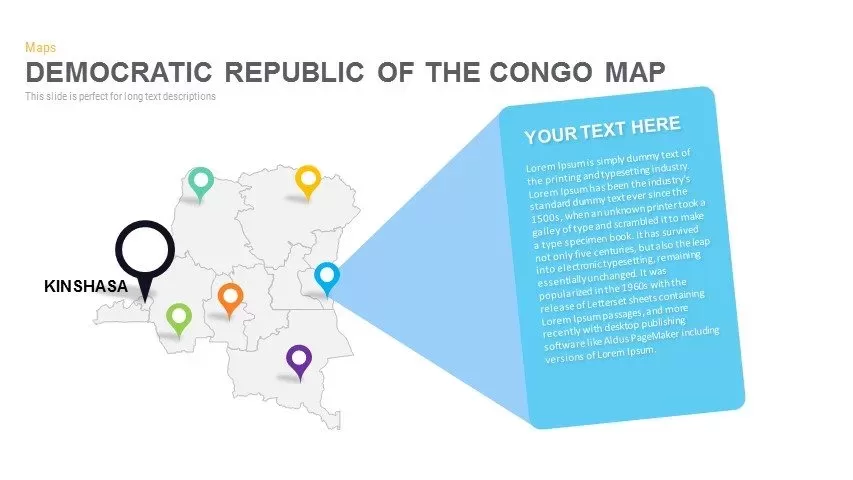
DR Congo Prefecture Map Slide Pack Template for PowerPoint & Google Slides
World Maps
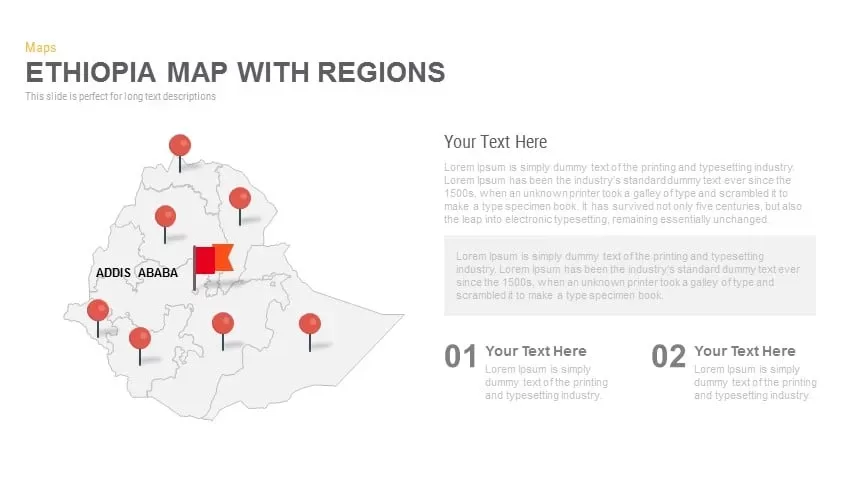
Ethiopia Map with Regions Slide Pack Template for PowerPoint & Google Slides
World Maps
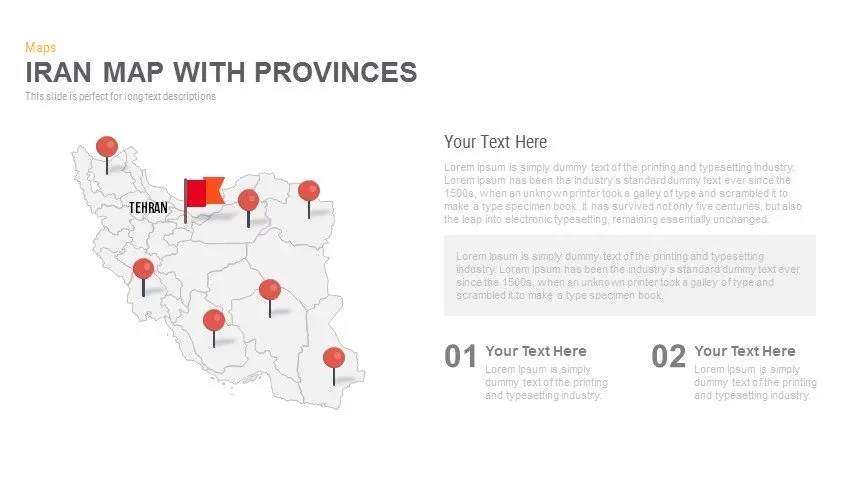
Iran Map with Provinces Slide Pack Template for PowerPoint & Google Slides
World Maps

Road Map Timeline Presentation template for PowerPoint & Google Slides
Roadmap

Global Map with Location Markers Template for PowerPoint & Google Slides
World Maps
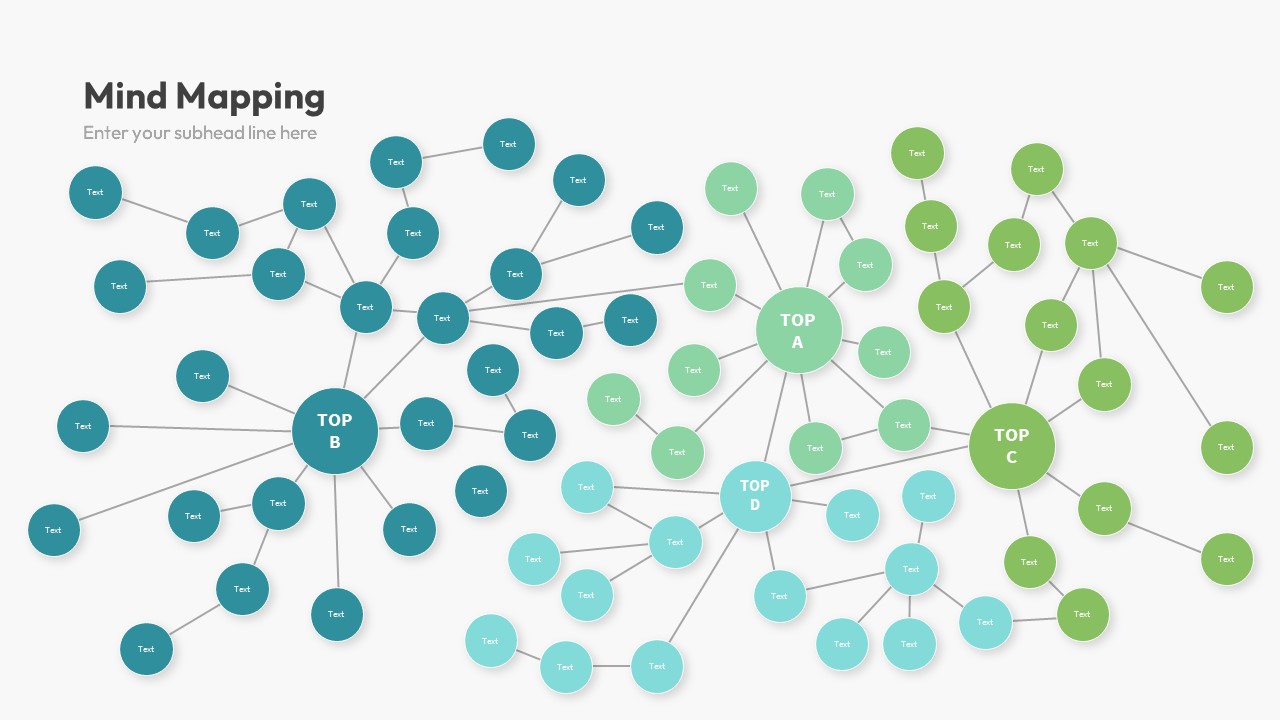
Mind Map Infographics template for PowerPoint & Google Slides
Mind Maps
Concept Map Presentation Template for PowerPoint & Google Slides
Mind Maps
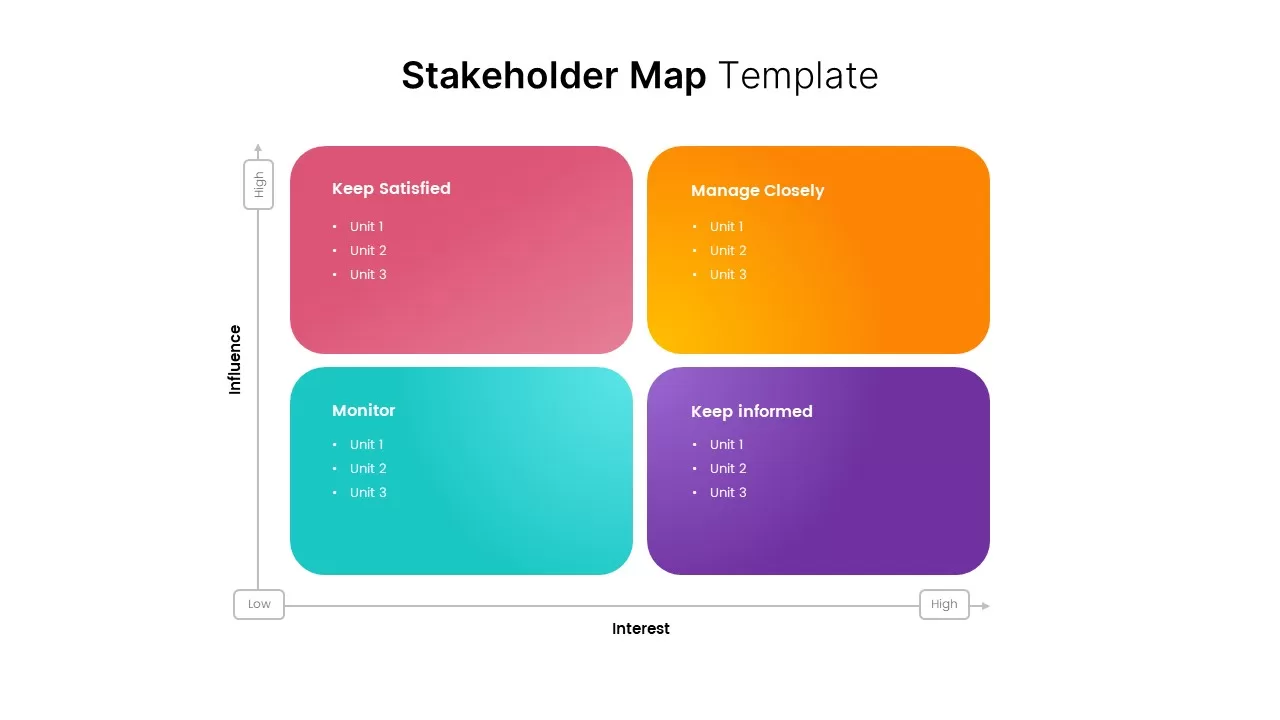
Stakeholder Map Template for PowerPoint & Google Slides
Business
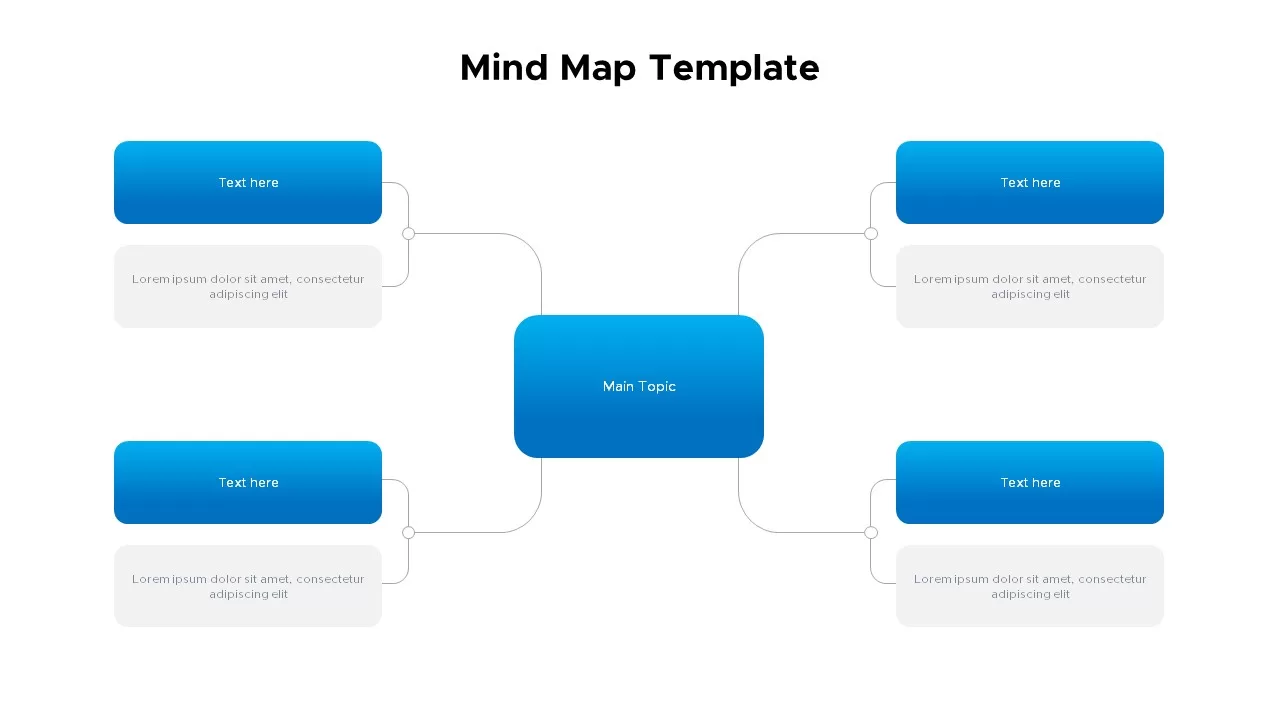
Mind Map Template for PowerPoint & Google Slides
Mind Maps
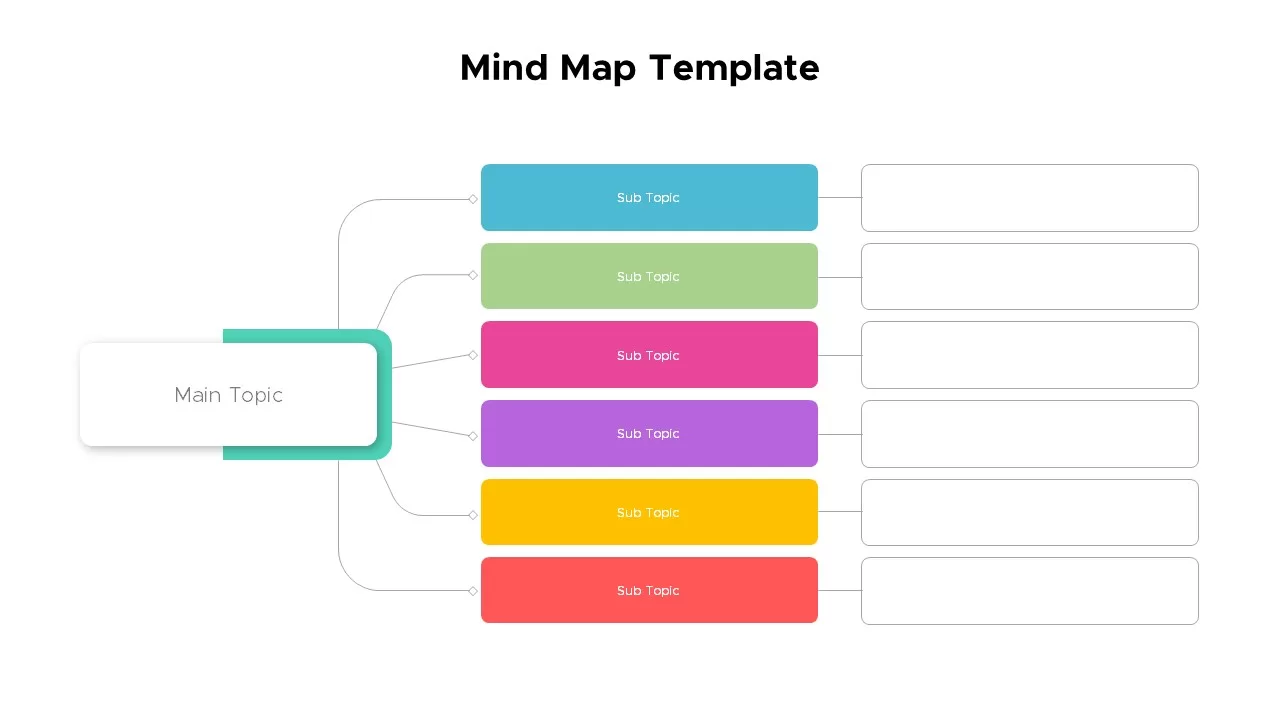
Colorful Mind Map Template for PowerPoint & Google Slides
Mind Maps
Colorful Mind Map Template for PowerPoint & Google Slides
Mind Maps
Customizable Canada Map Outline Template for PowerPoint & Google Slides
World Maps
Heat Map Risk Assessment Presentation Template for PowerPoint & Google Slides
Risk Management
Professional Risk Heat Map Visualization Template for PowerPoint & Google Slides
Risk Management
Professional Interactive Heat Map Matrix Template for PowerPoint & Google Slides
Comparison Chart
Heat Map Risk Matrix Dashboard Template for PowerPoint & Google Slides
Comparison Chart
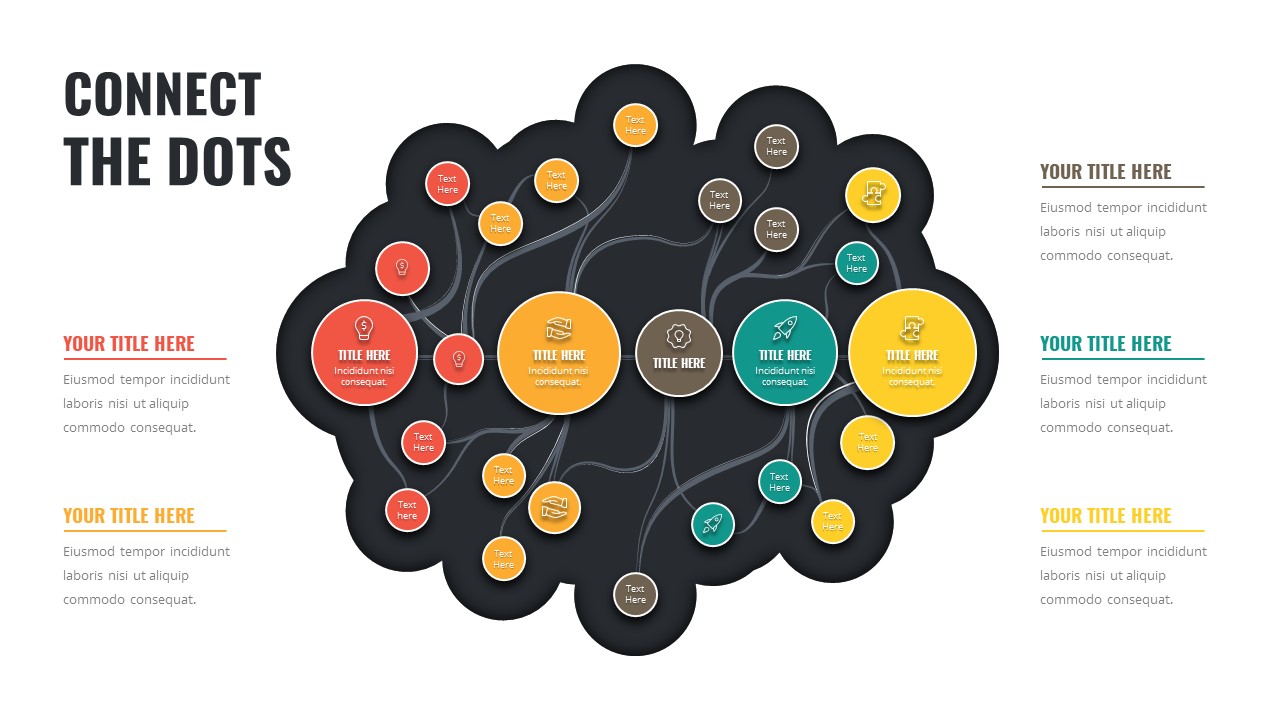
Connect the Dots Mind Map Diagram Template for PowerPoint & Google Slides
Mind Maps
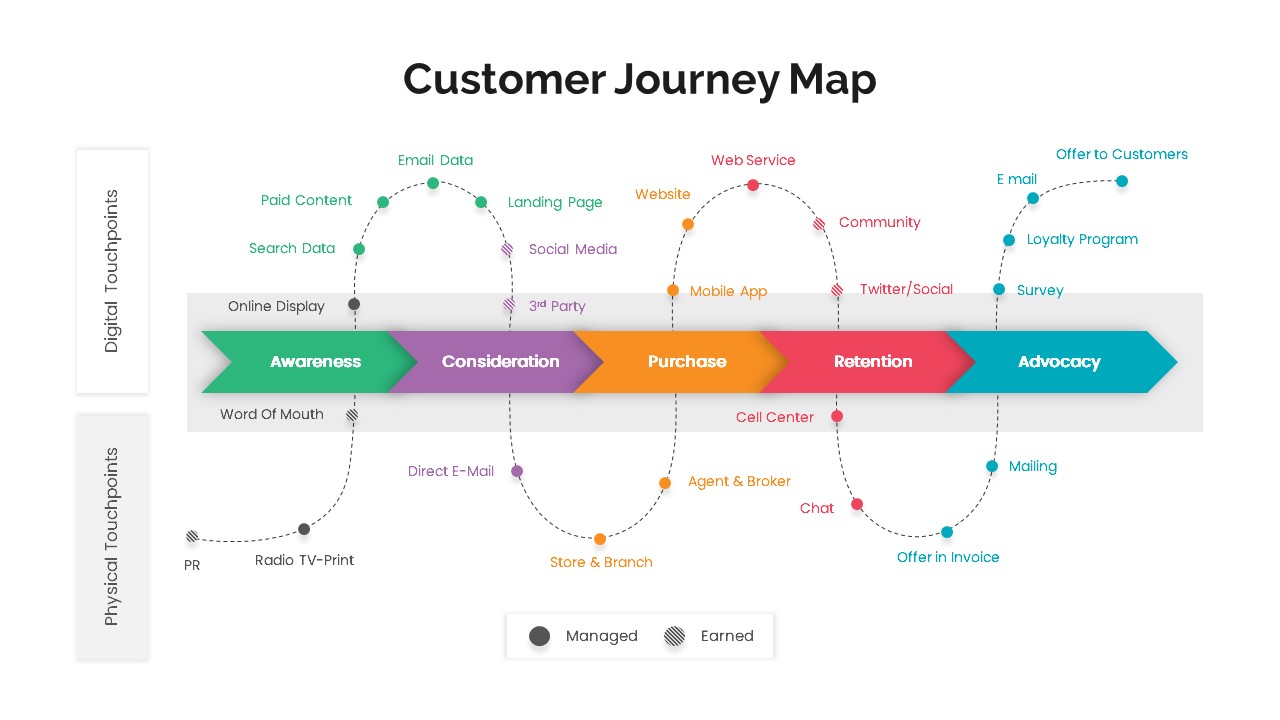
Versatile Customer Journey Map Template for PowerPoint & Google Slides
Customer Journey
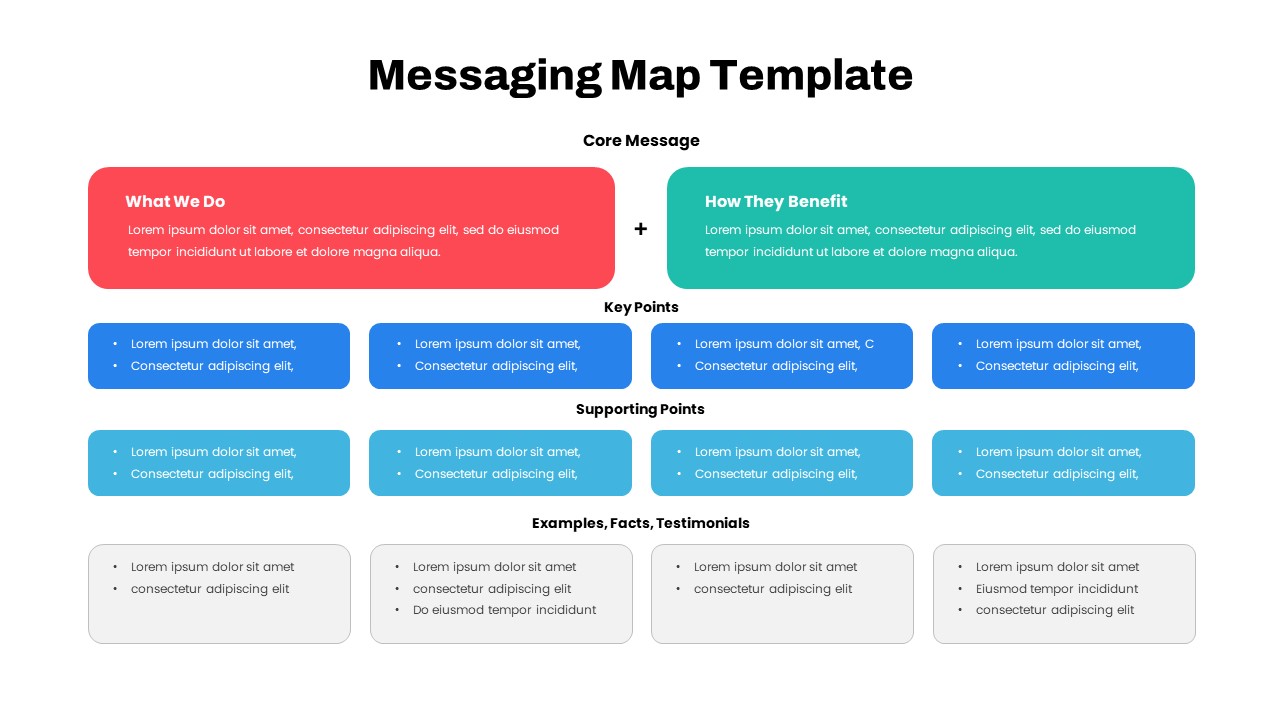
Comprehensive Messaging Map Framework Template for PowerPoint & Google Slides
Process
Free Global Market Distribution Map Template for PowerPoint & Google Slides
World Maps
Free
UK Counties Map Data Visualization Template for PowerPoint & Google Slides
World Maps
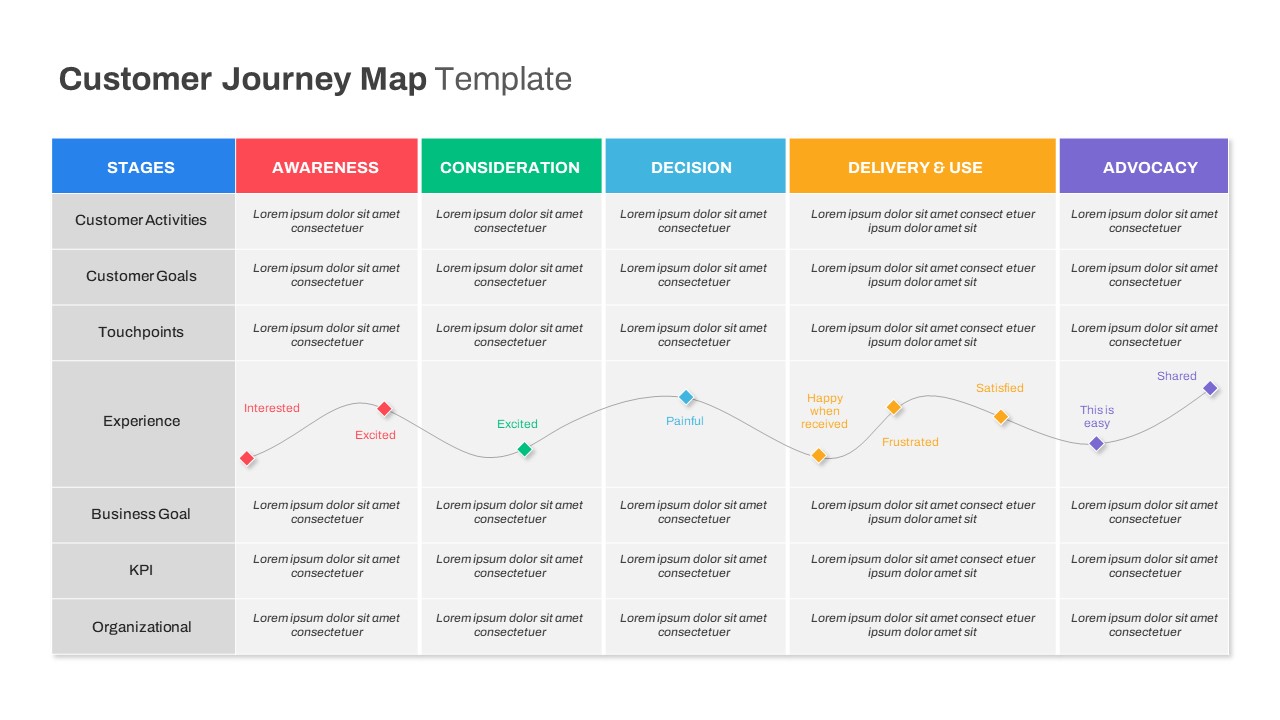
Comprehensive Customer Journey Map Template for PowerPoint & Google Slides
Customer Journey
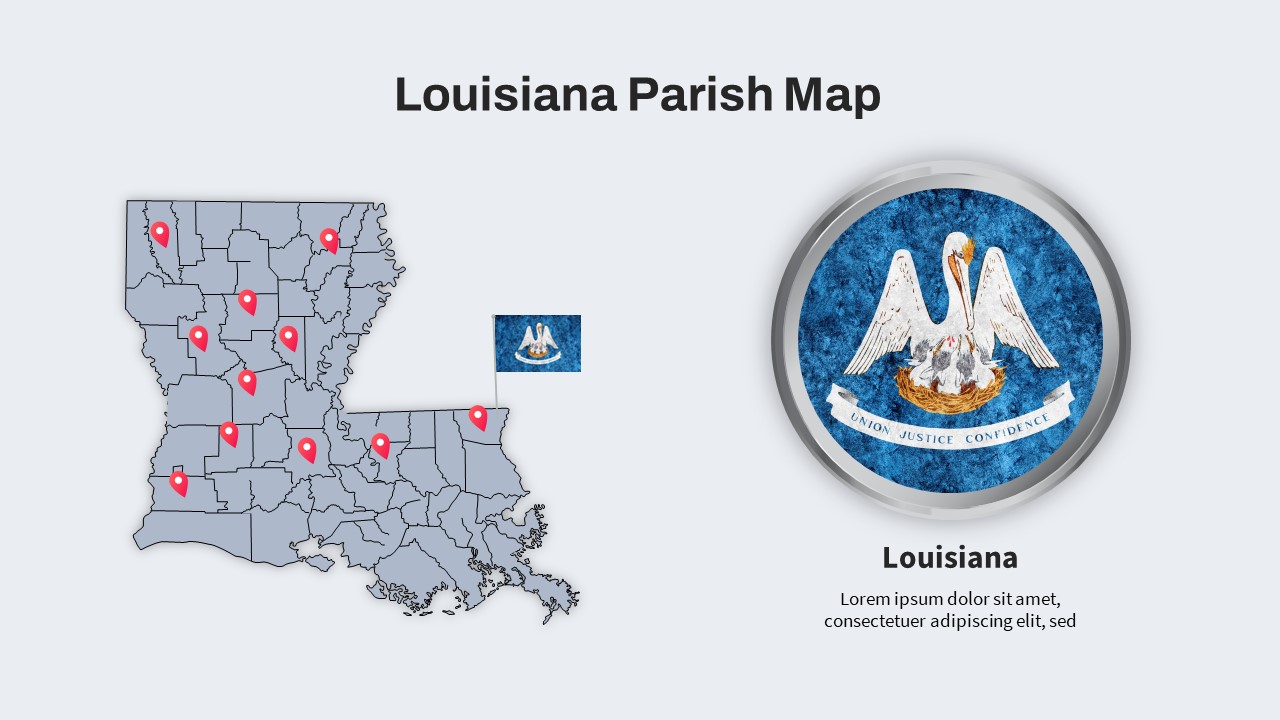
Louisiana Parish Map with Markers Template for PowerPoint & Google Slides
Maps
Colorful Multi-Branch Mind Map Slide Template for PowerPoint & Google Slides
Mind Maps
Michigan County Map with KPI Dashboard Template for PowerPoint & Google Slides
World Maps
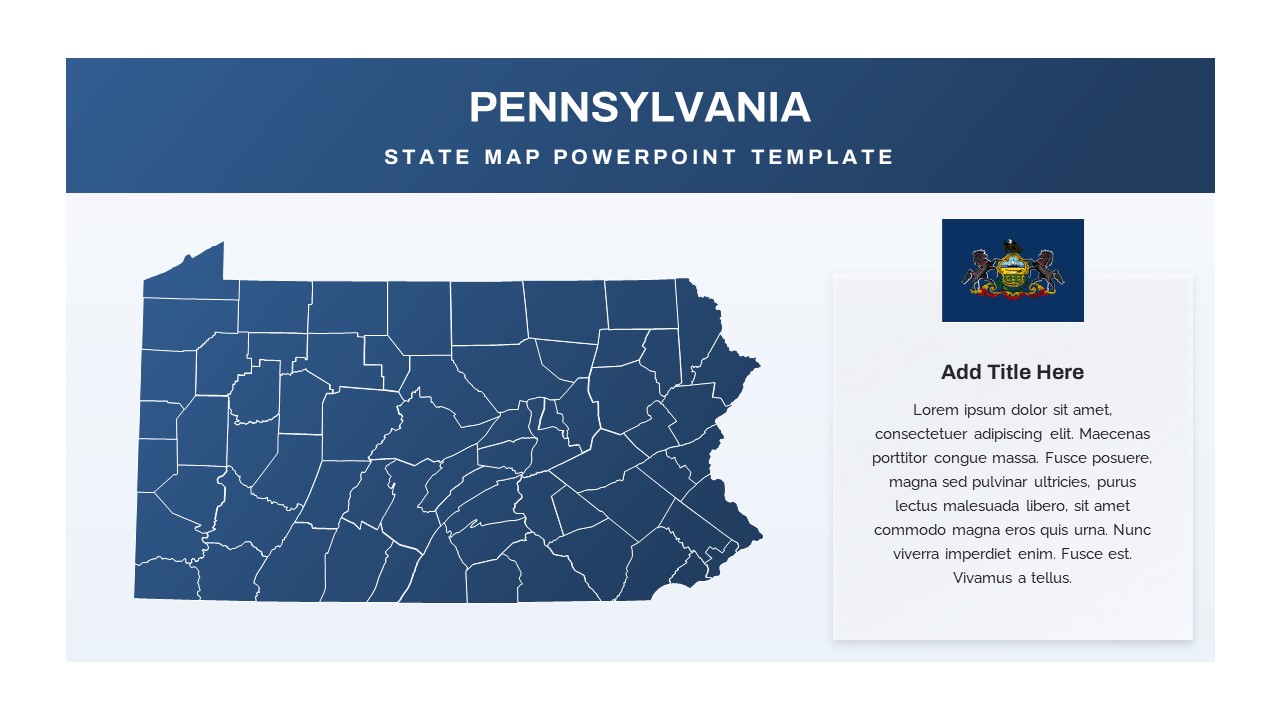
Pennsylvania State Map Diagram Template for PowerPoint & Google Slides
World Maps
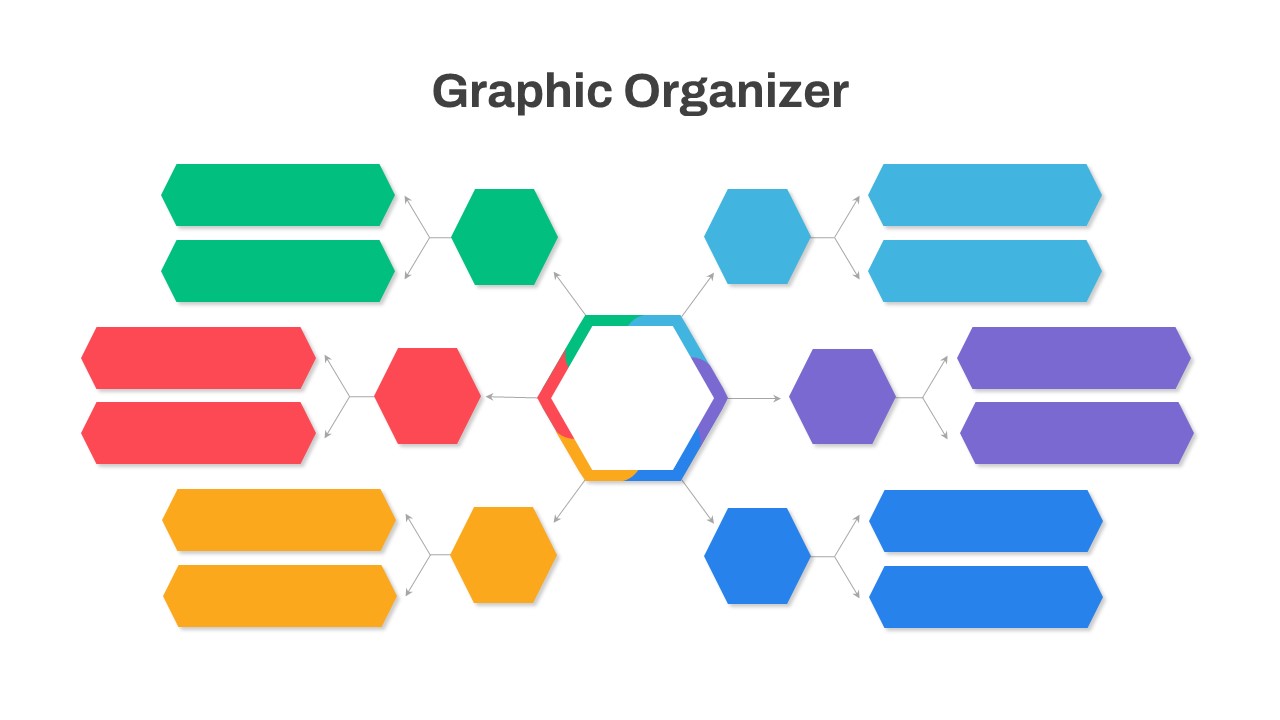
Graphic Organizer & Double Bubble Map Template for PowerPoint & Google Slides
Maps
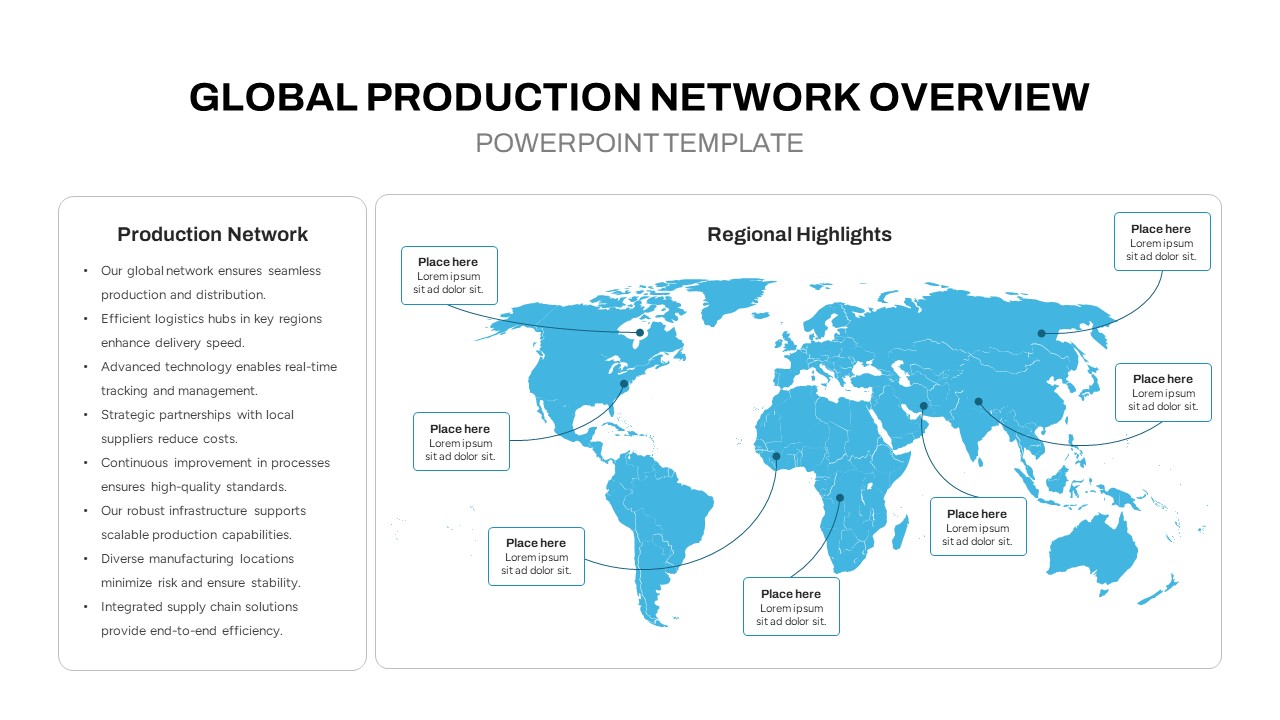
Global Production Network Overview Map Template for PowerPoint & Google Slides
World Maps
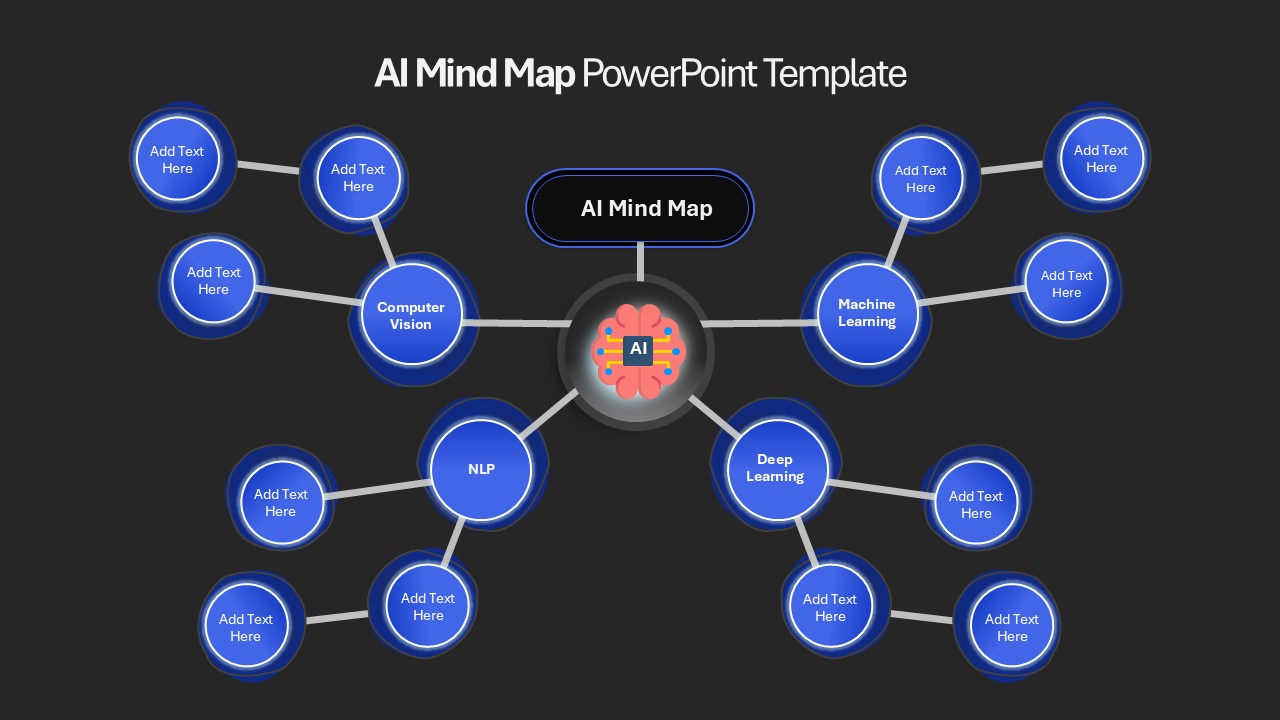
AI Mind Map & Hub-and-Spoke Diagram Template for PowerPoint & Google Slides
Mind Maps
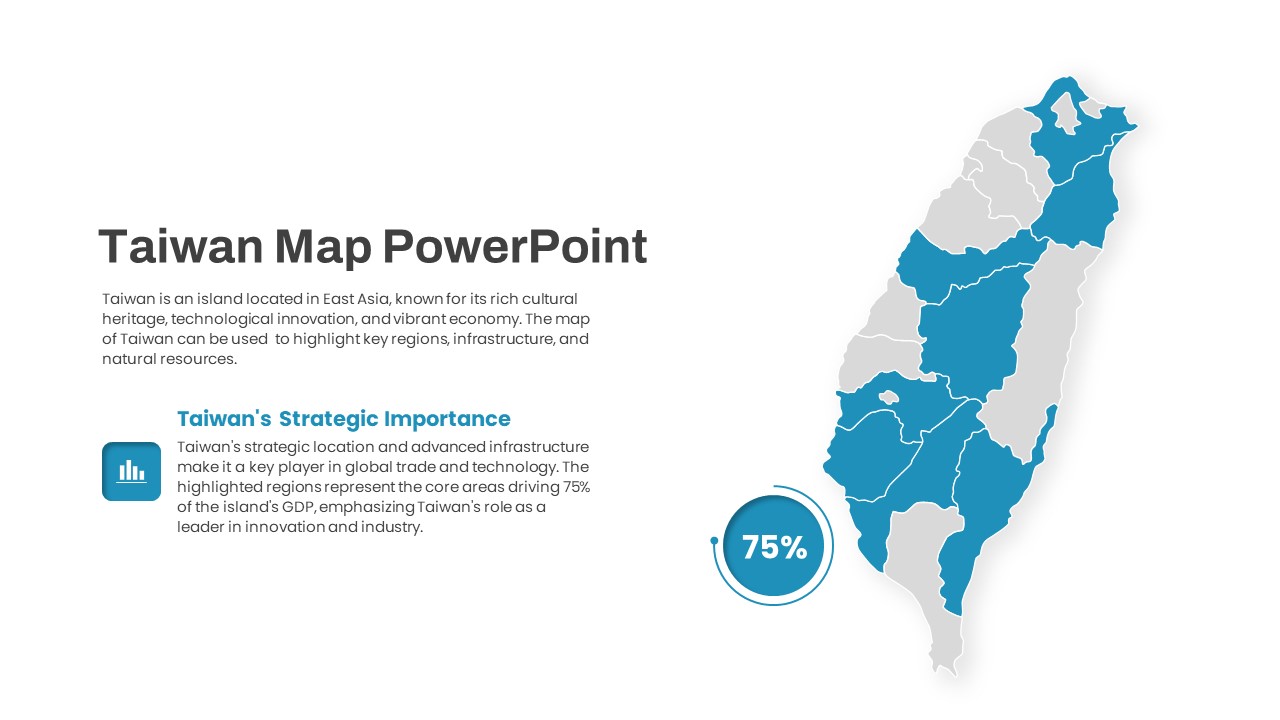
Interactive Taiwan Map Highlight Template for PowerPoint & Google Slides
World Maps
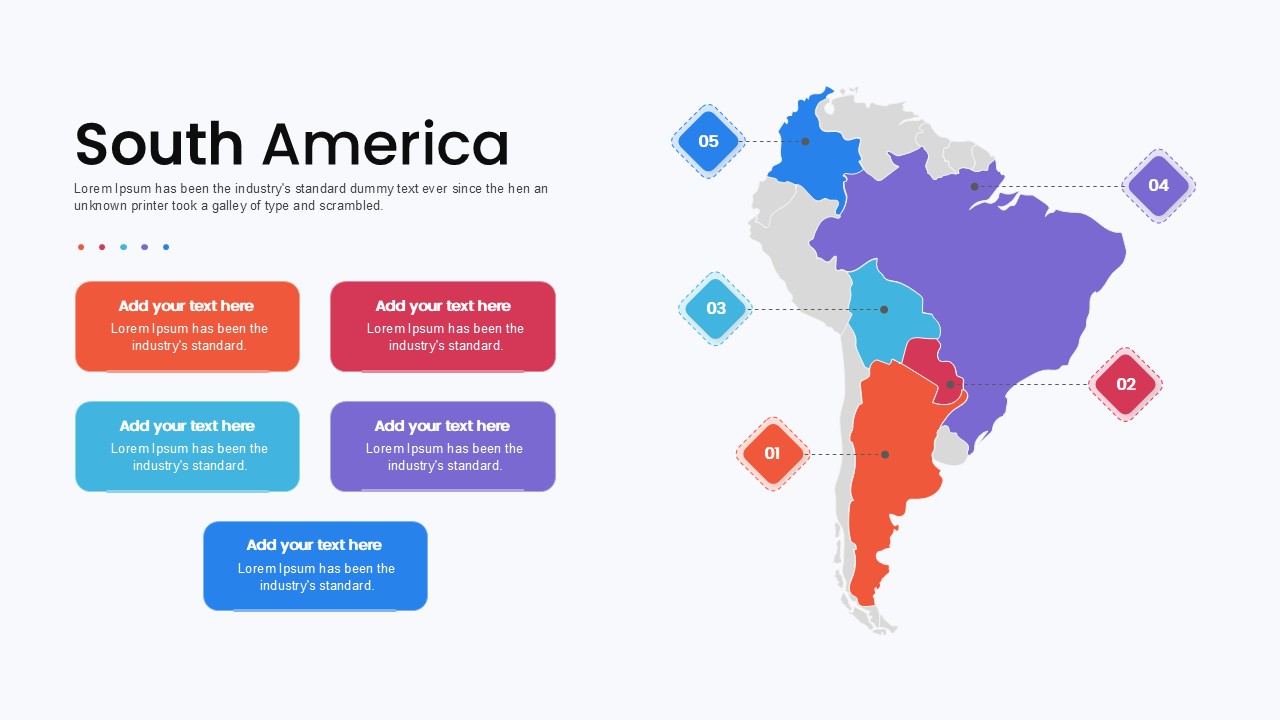
South America Map template for PowerPoint & Google Slides
Maps
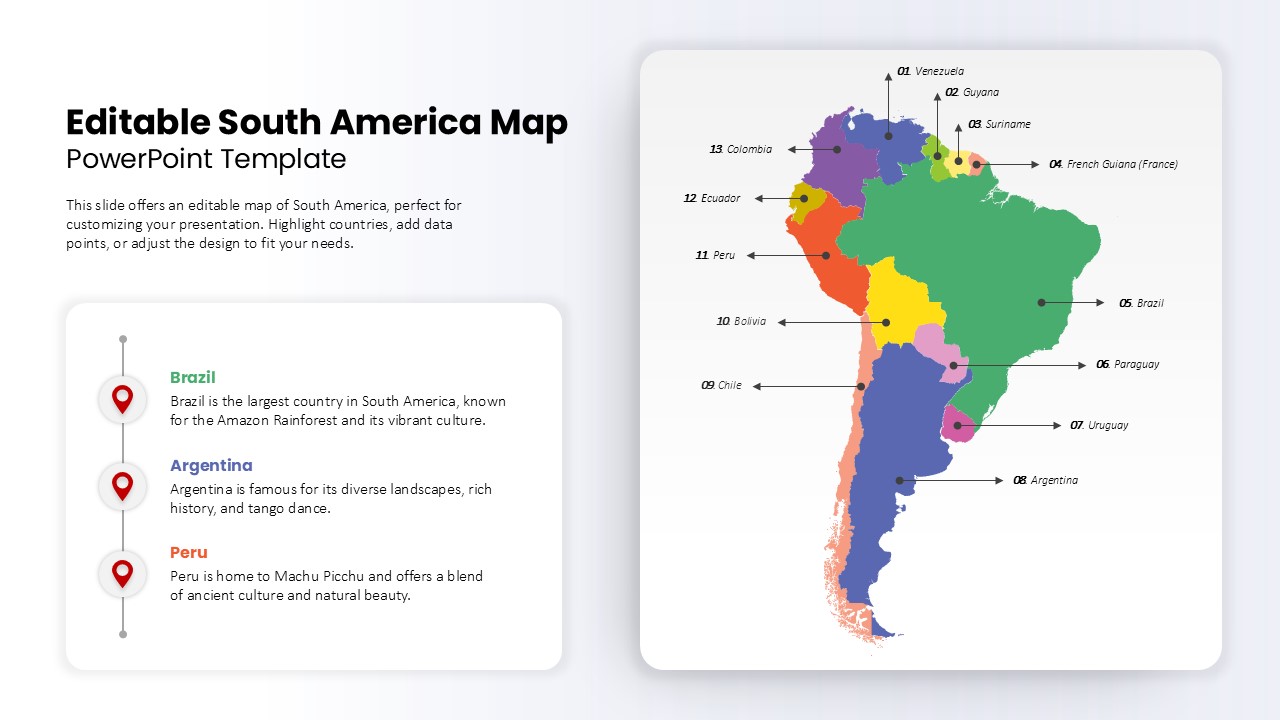
Editable South America Map Diagram Template for PowerPoint & Google Slides
Maps
Employee Journey Map with Stages template for PowerPoint & Google Slides
Recruitment
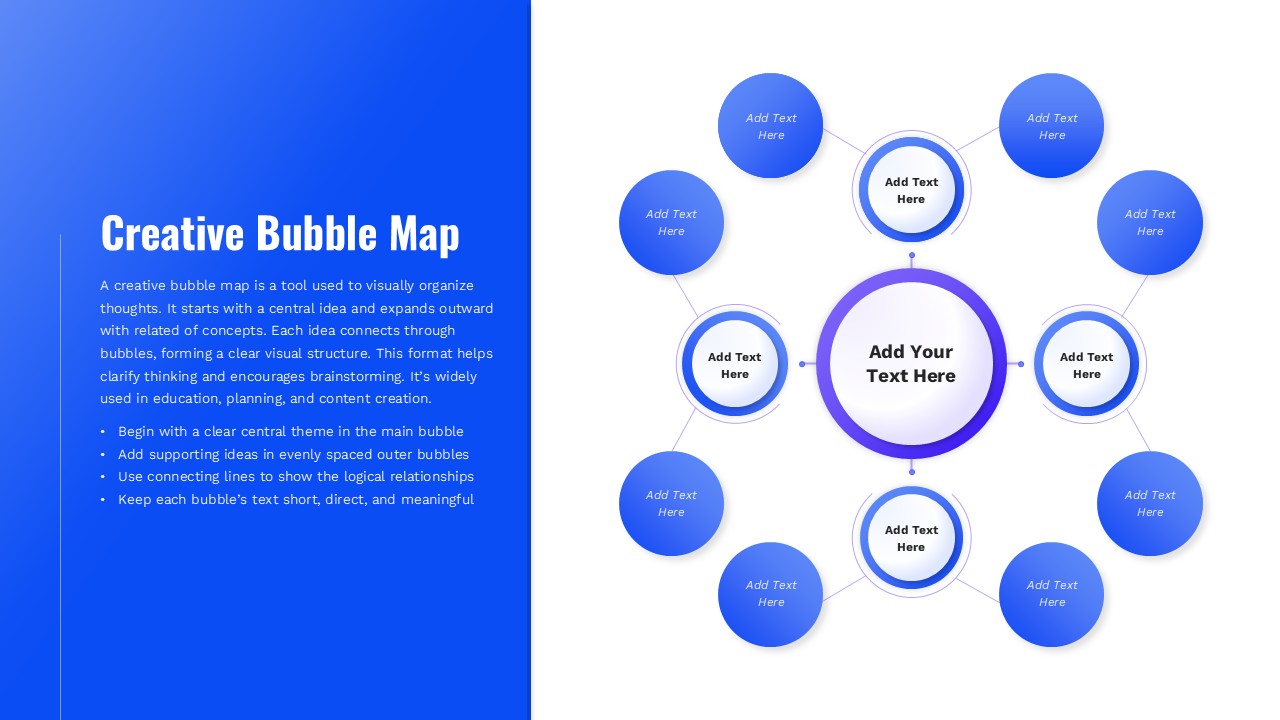
Creative Bubble Mind Map Template for PowerPoint & Google Slides
Mind Maps