Layered Bulb Infographic Four Segments Template for PowerPoint & Google Slides

Description
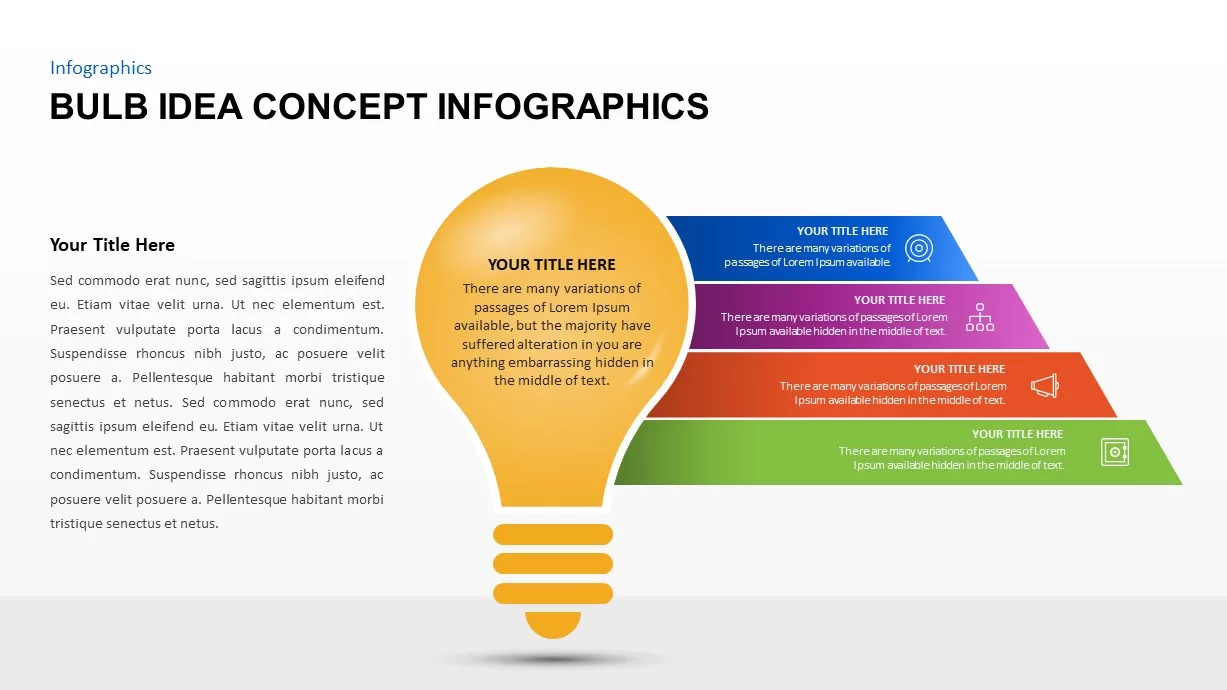
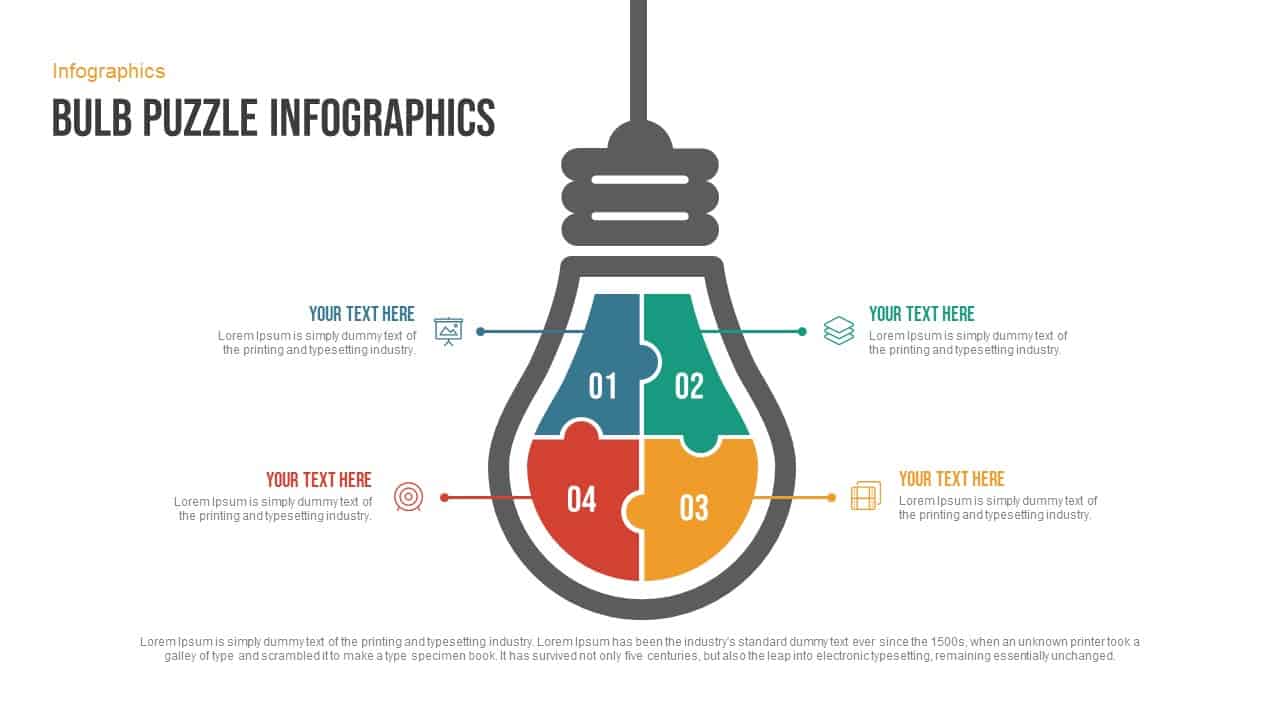
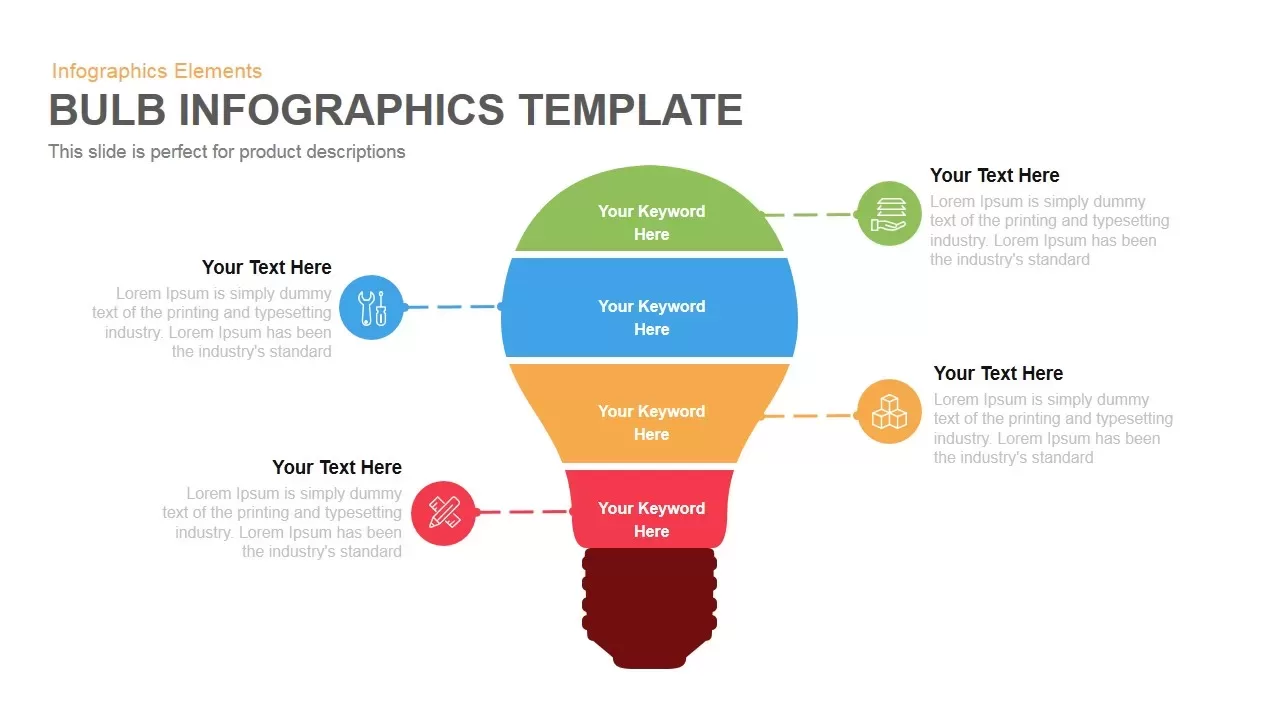
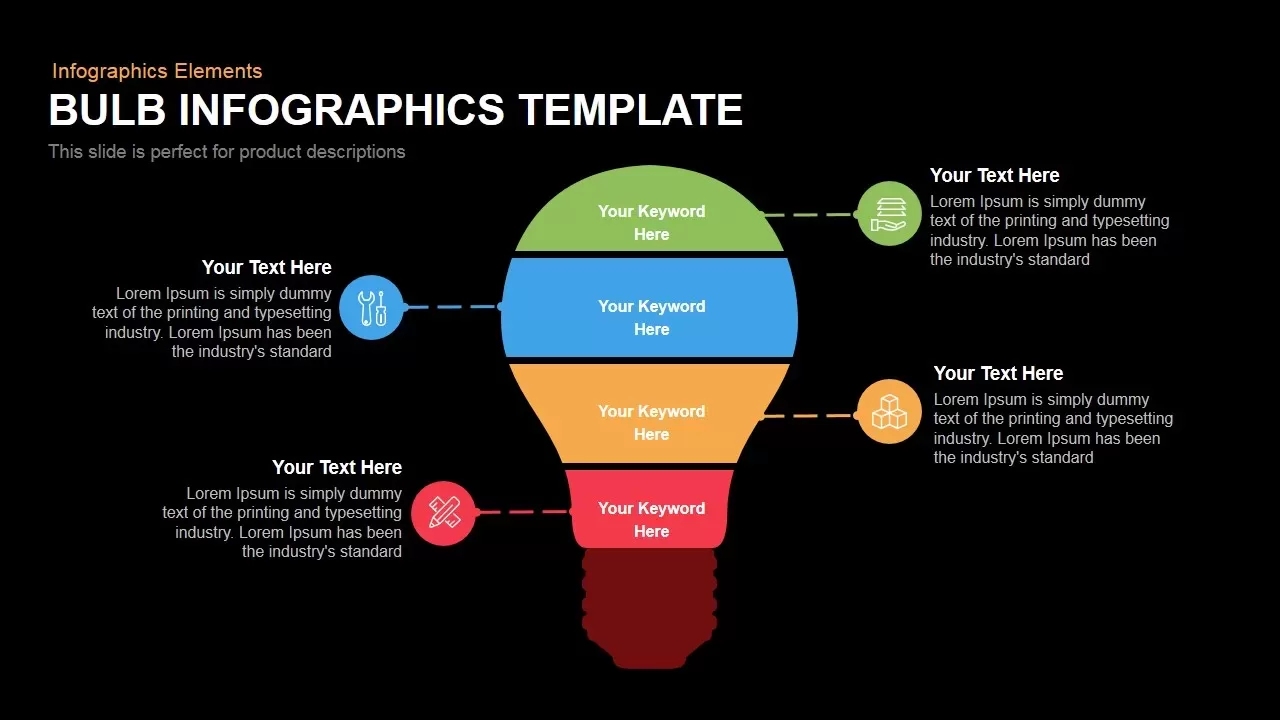
Harness the power of visual metaphors with this layered bulb infographic slide, designed to present four interconnected data points or strategic objectives in a clean, engaging format. A stylized lightbulb vector is divided into four horizontal segments—green, blue, orange, and red—each representing a distinct category or phase. Dashed connector lines extend from each layer to circular icon callouts positioned on either side, offering space for concise headings and descriptive text. The bulb’s base in dark red anchors the design and reinforces hierarchy, while semi-transparent gradient arrows on the slide margins suggest a guided, step-by-step narrative flow.
Built on fully editable master slides, every element is vector-based for seamless scaling across PowerPoint and Google Slides without loss of quality. Swap icons, recolor segments, adjust connector paths, or update text placeholders in seconds to match your brand guidelines or presentation theme. A neutral white background and minimalist typography ensure readability, while balanced white space keeps focus on key insights. Beneath the main graphic, include optional notes or captions to provide additional context without cluttering the central visual.
Ideal for showcasing product roadmaps, process stages, budget allocations, or quarterly goals, this template leverages the lightbulb motif to symbolize innovation, ideation, and strategic planning. Duplicate the slide to illustrate sequential progressions or comparative analyses, or remove layers to simplify your story. With its professional aesthetic and intuitive structure, this slide accelerates your slide-creation workflow, enforces design consistency, and eliminates formatting headaches, so you can concentrate on delivering compelling, data-driven presentations.
Who is it for
• Product managers and innovation teams outlining development roadmaps
• Marketing strategists visualizing campaign phases and budget splits
• Project leads presenting milestone progress and resource allocation
• Executive teams communicating high-level objectives and KPIs
Other Uses
• Break down customer journey stages or user personas
• Map risk-assessment layers or compliance checklists
• Visualize resource distribution across departments or functions
• Illustrate sequential workshop modules or training agendas
Login to download this file

Item ID
SB00129
Related Templates

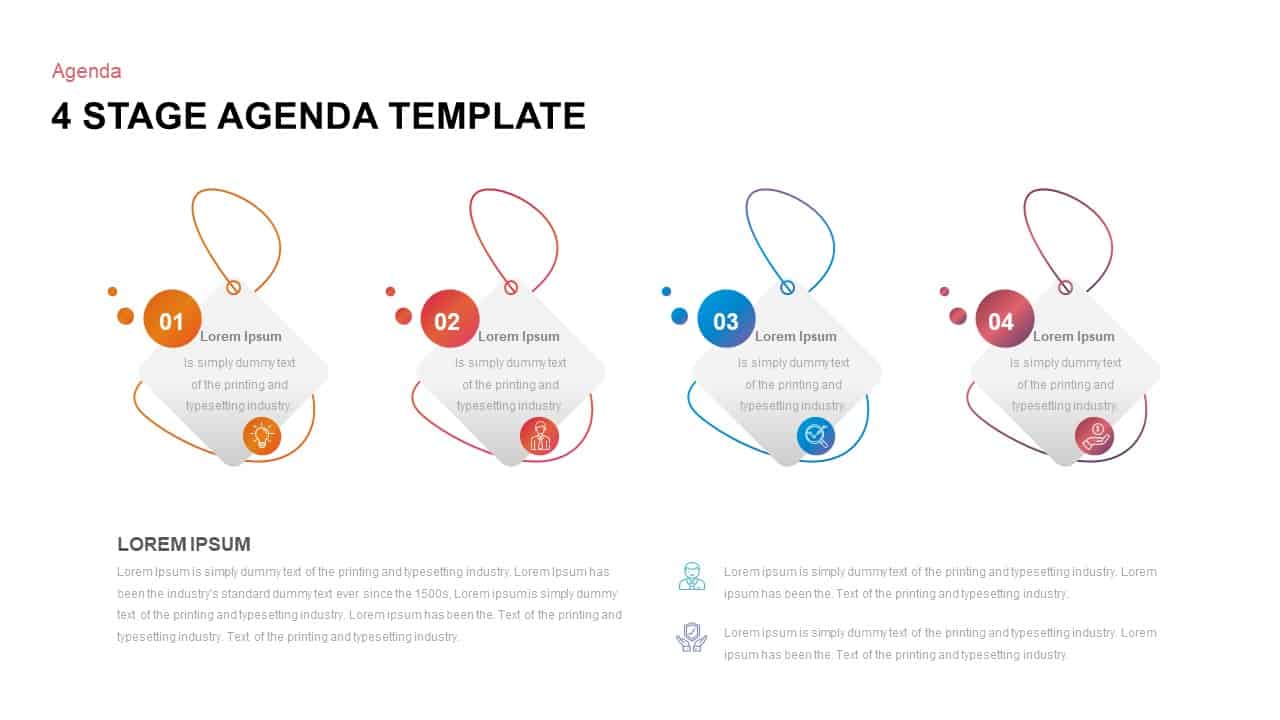
Layered Circular Four-Step Agenda Slide Layout Template for PowerPoint & Google Slides
Agenda
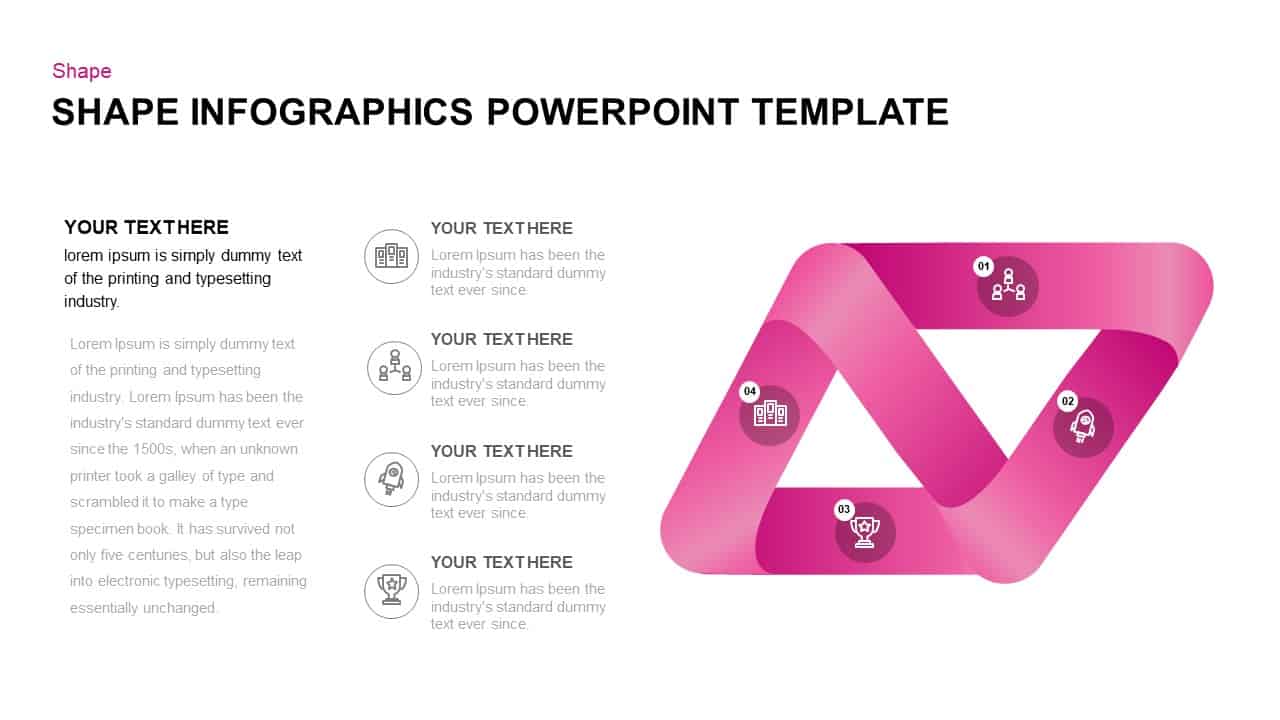
Creative Layered Oval Infographic Diagram Template for PowerPoint & Google Slides
Process
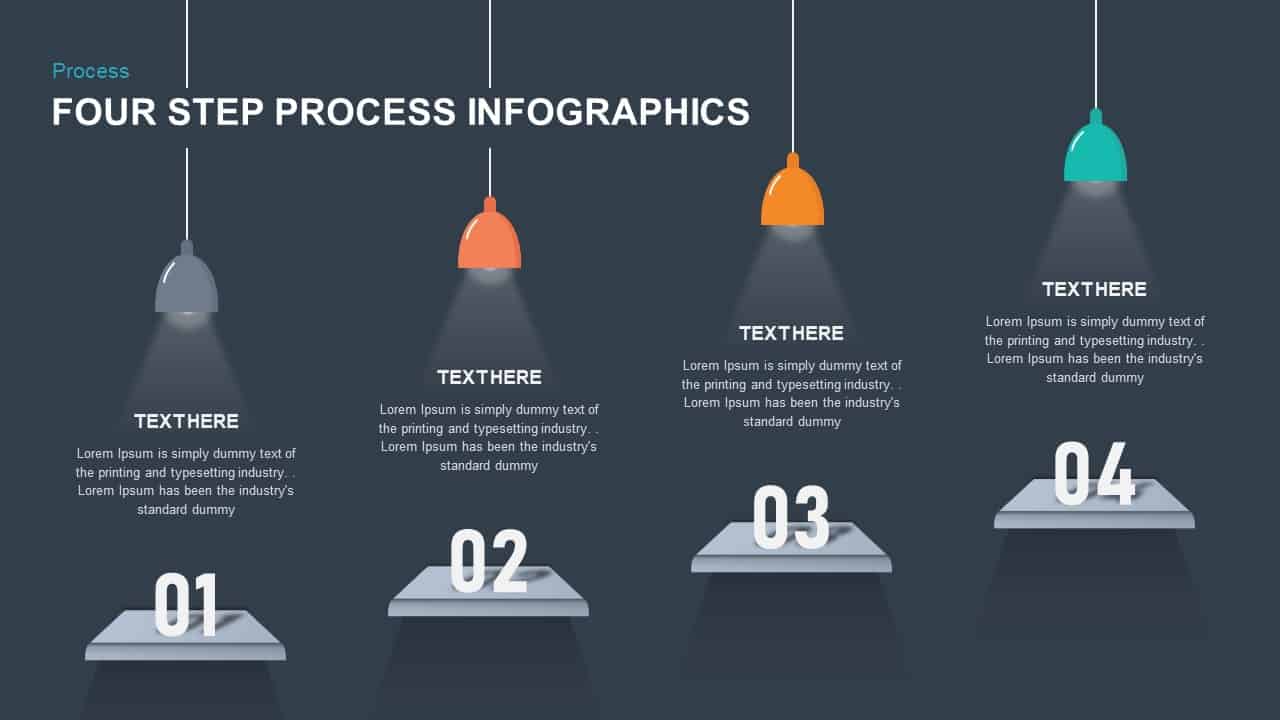
3D Layered Infographic Diagram Template for PowerPoint & Google Slides
Infographics
Brand Portfolio Matrix: Segments & Tiers Template for PowerPoint & Google Slides
Business Report

Bulb Idea Concept Infographic Slide Template for PowerPoint & Google Slides
Process
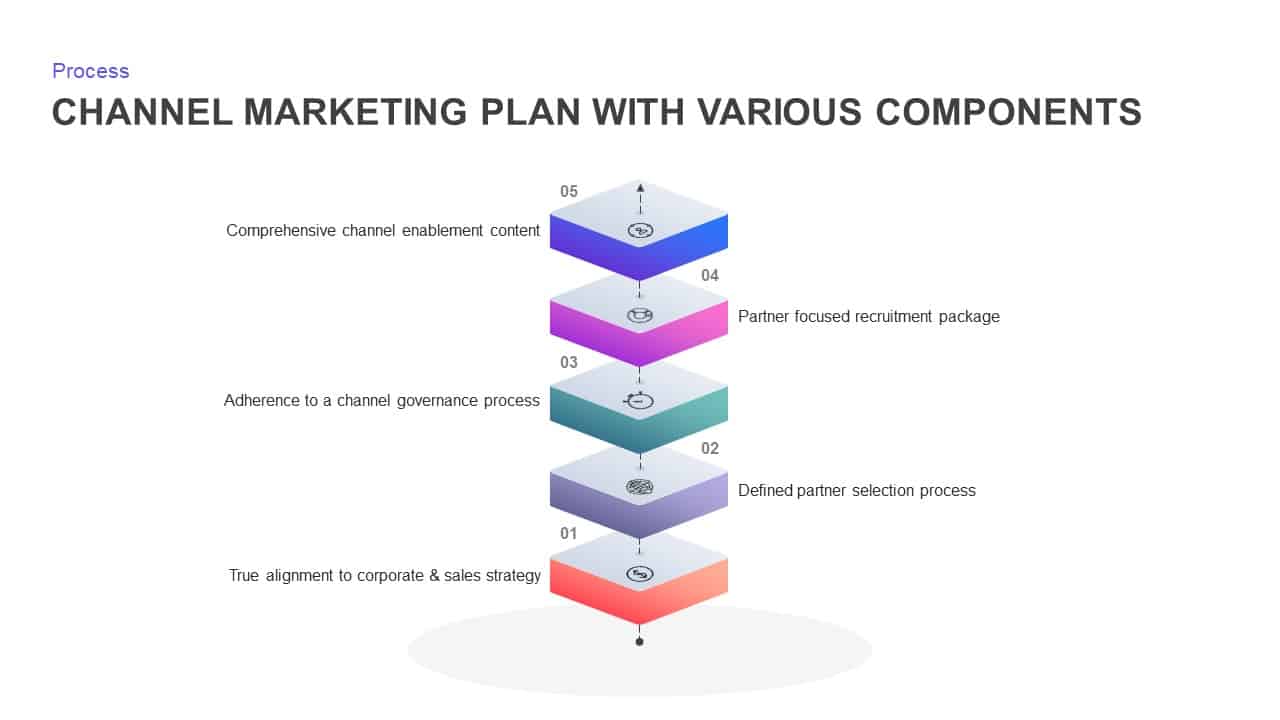
Channel Marketing Plan Layered Diagram Template for PowerPoint & Google Slides
Process
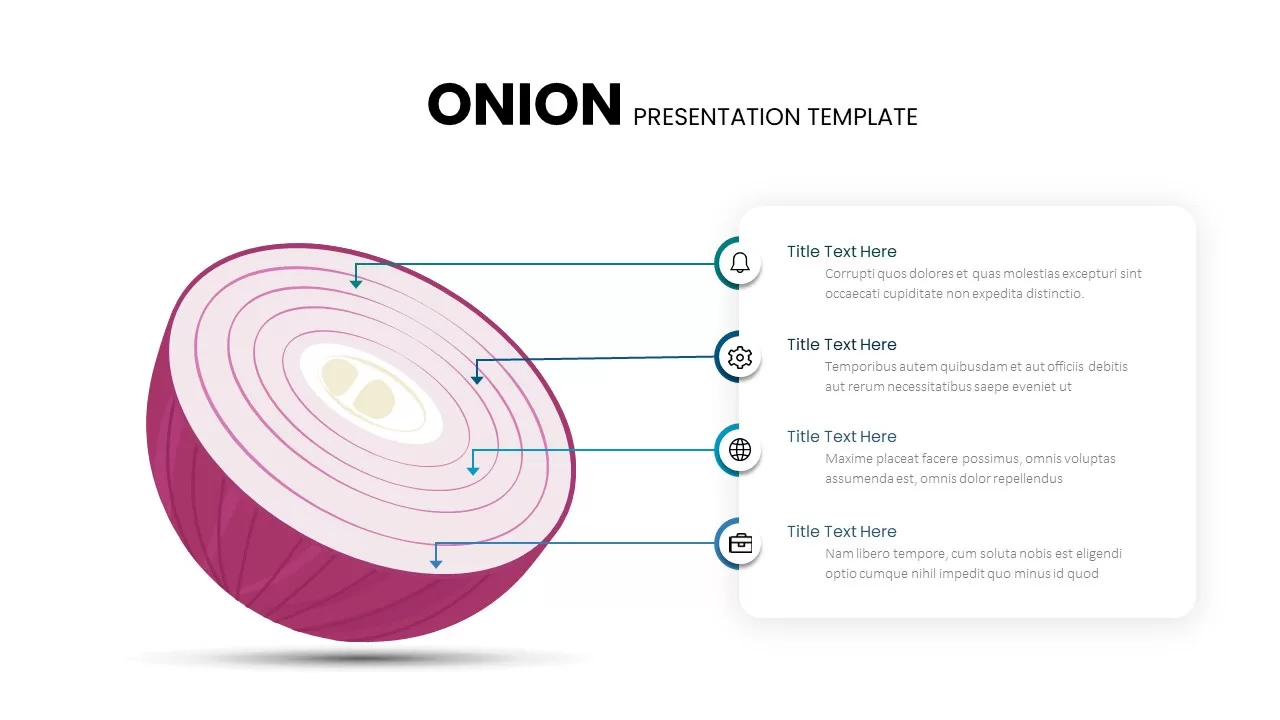
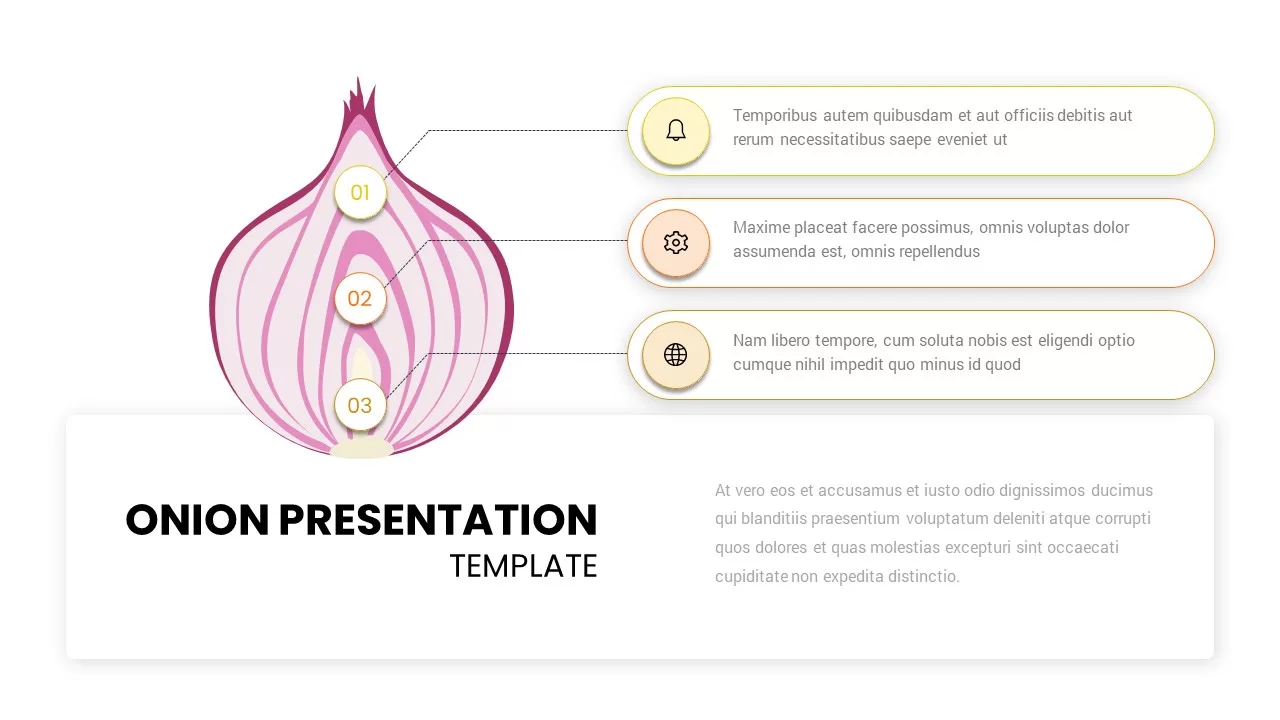
Layered Onion Diagram Template for PowerPoint & Google Slides
Process
Layered Data Governance Maturity Model Template for PowerPoint & Google Slides
Process
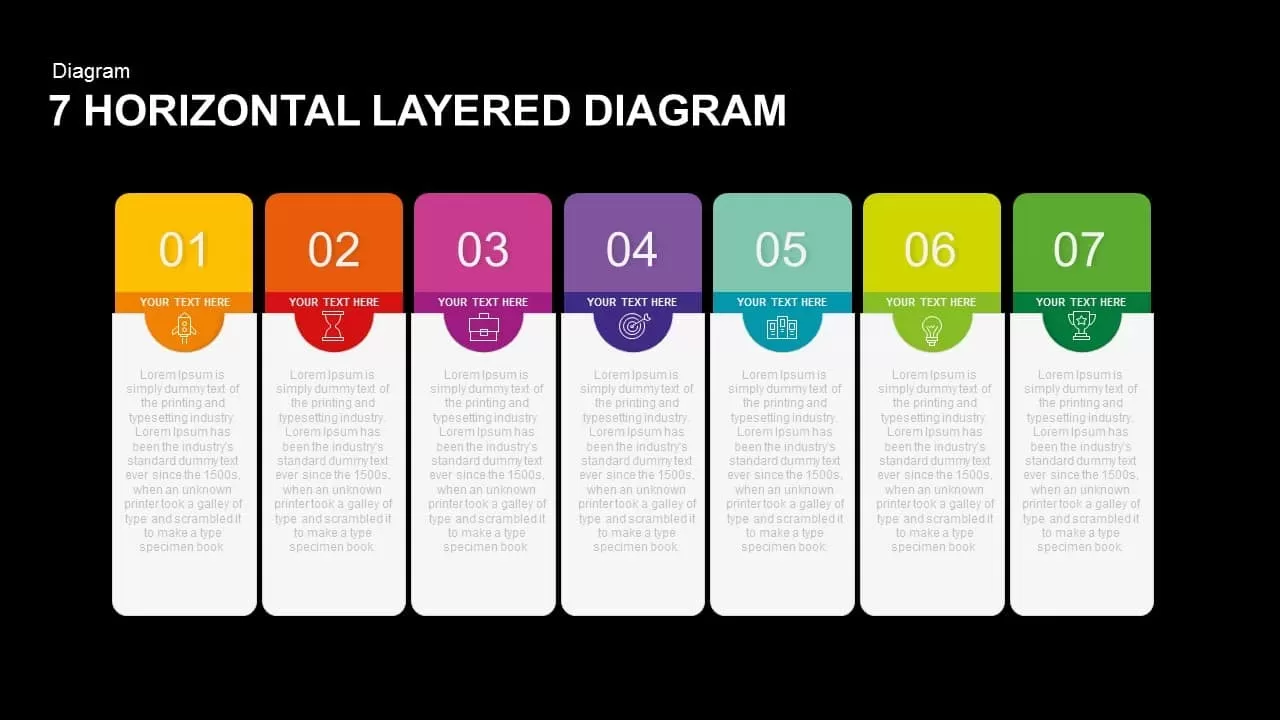
7 Horizontal Layered Diagram for PowerPoint & Google Slides
Process
Layered Onion Diagram Slide for Process Breakdown in PowerPoint & Google Slides
Process
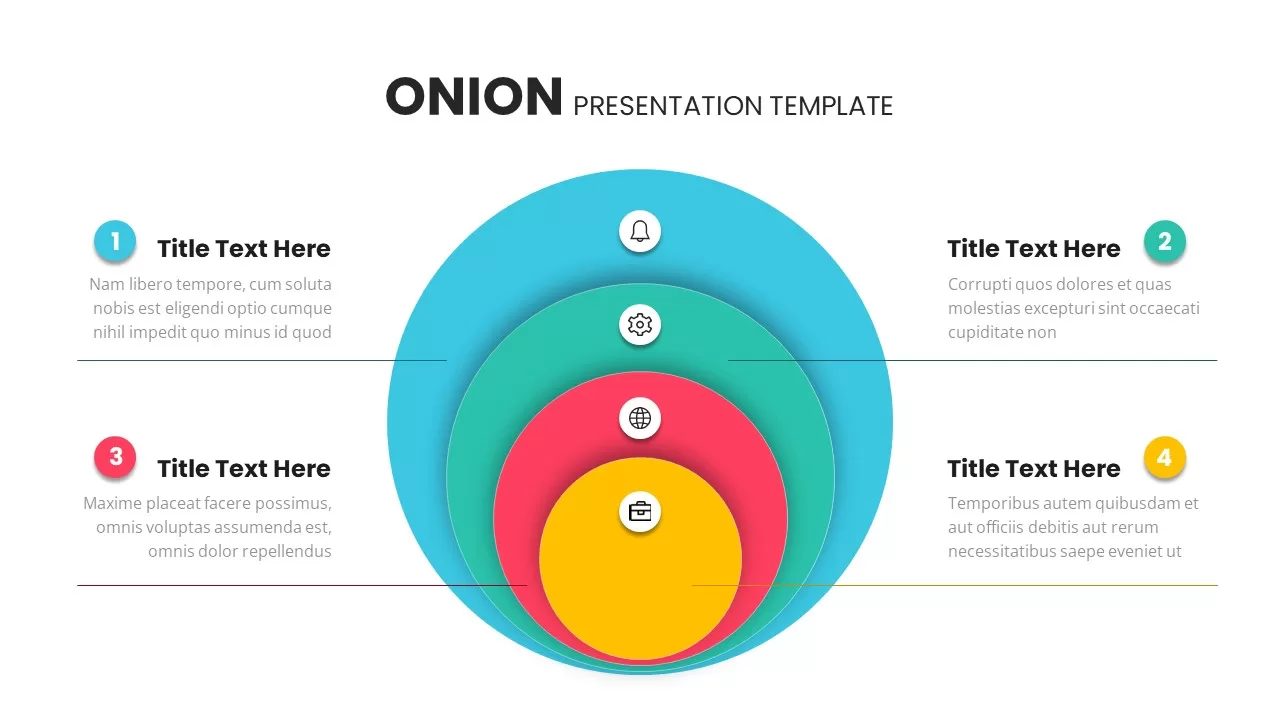
Colorful Layered Onion Diagram Slide for PowerPoint & Google Slides
Process
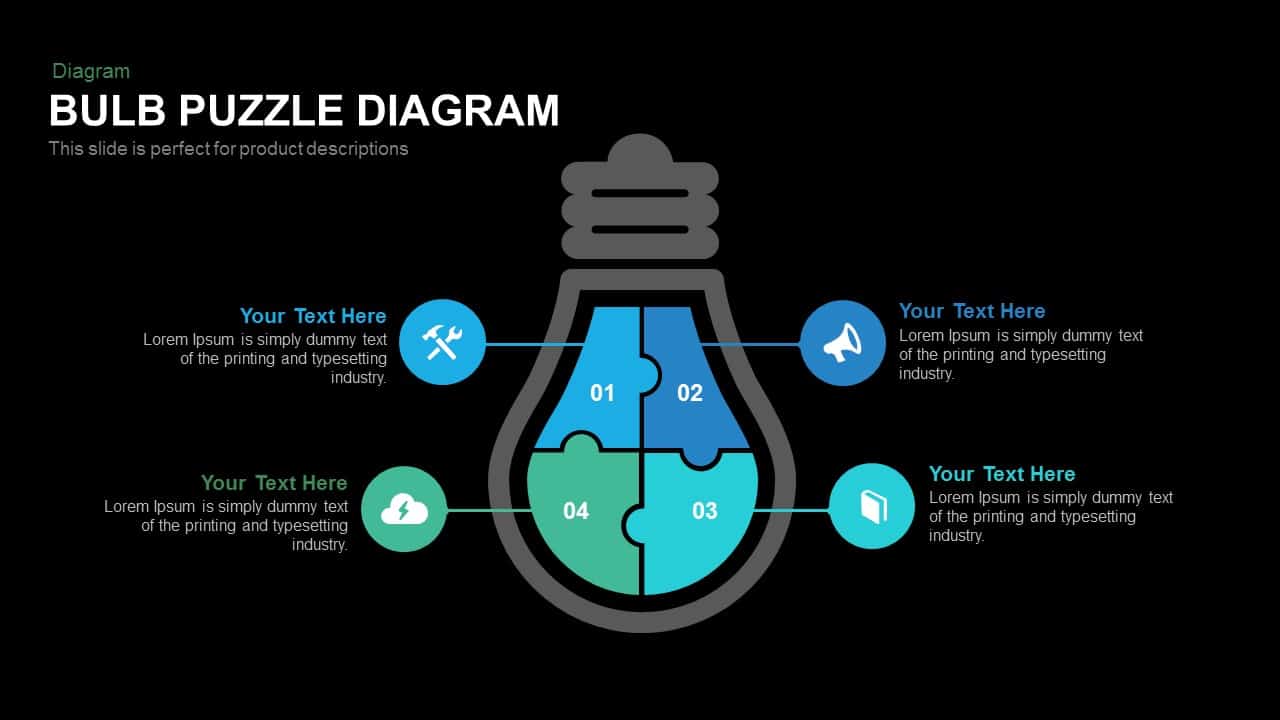
Bulb Puzzle Diagram template for PowerPoint & Google Slides
Process

Metaphor Light Bulb Idea Concept Template for PowerPoint & Google Slides
Infographics
Light Bulb Idea Circular Diagram Template for PowerPoint & Google Slides
Infographics
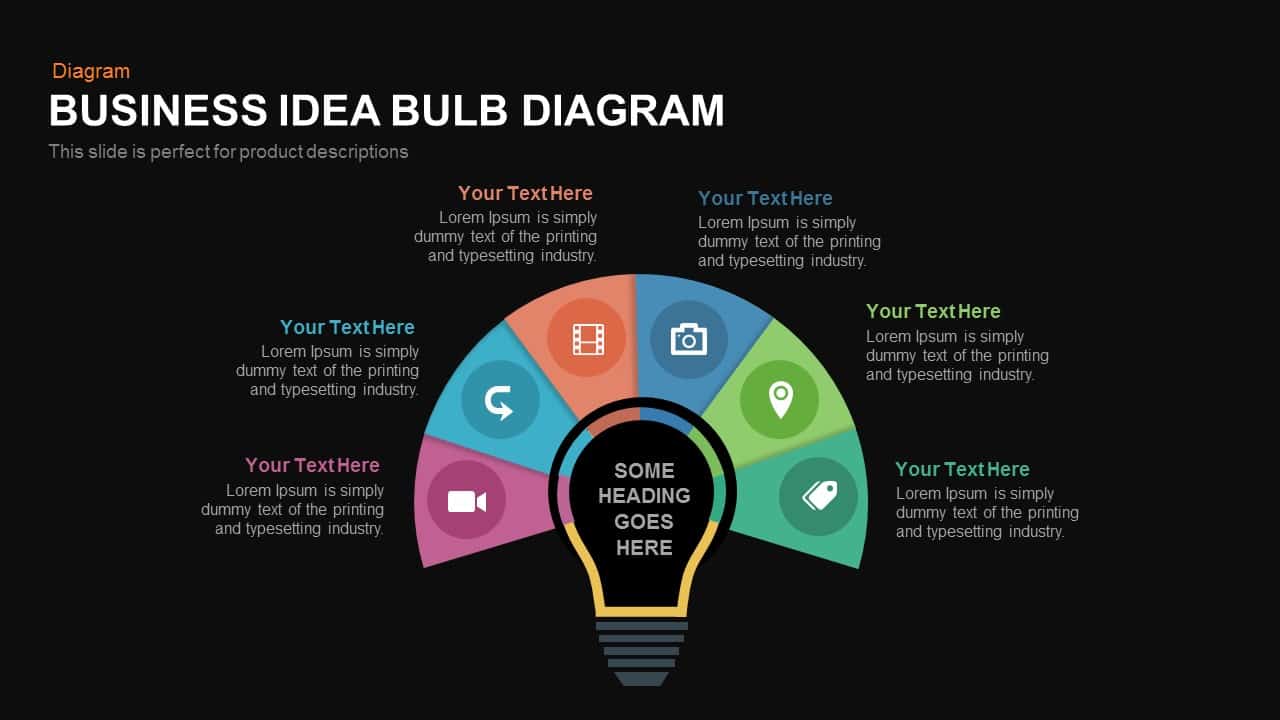
Six-Part Business Idea Bulb Diagram Template for PowerPoint & Google Slides
Circular
Free Bulb Puzzle Infographics Diagram Template for PowerPoint & Google Slides
Process
Free
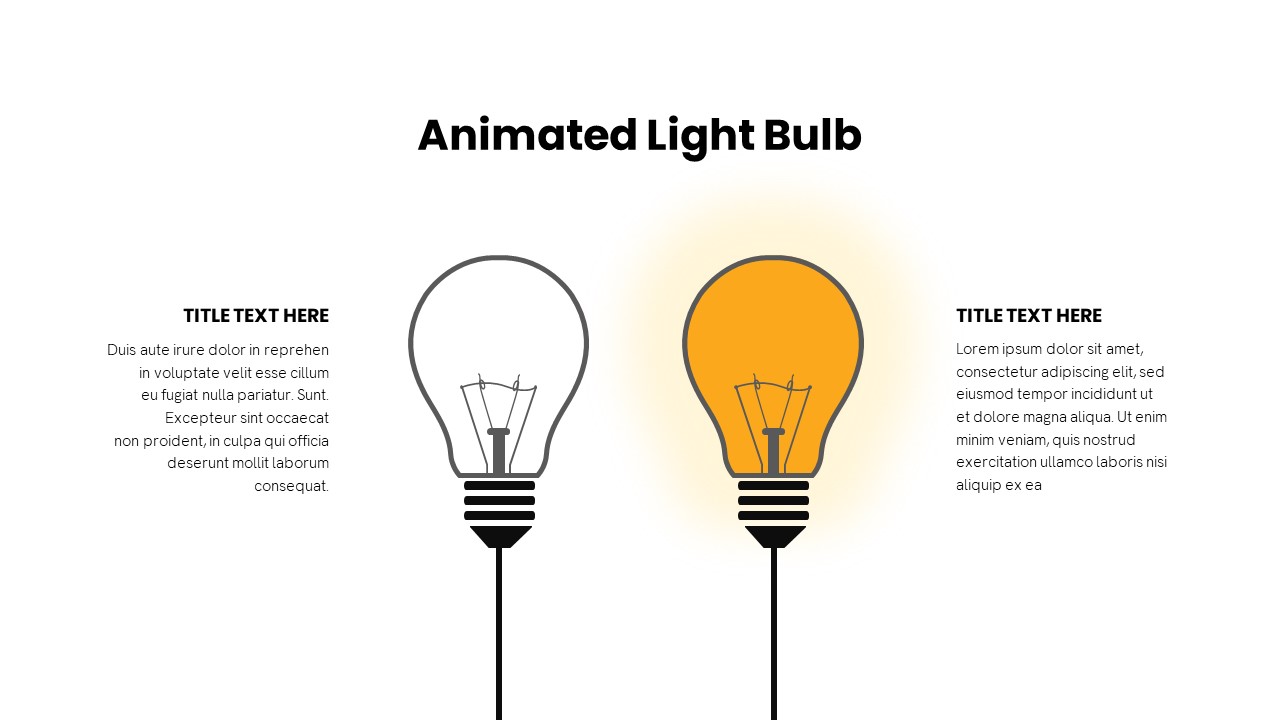
Animated Light Bulb Visualization Template for PowerPoint & Google Slides
Process
Four Options Infographic Slides Template for PowerPoint & Google Slides
Comparison
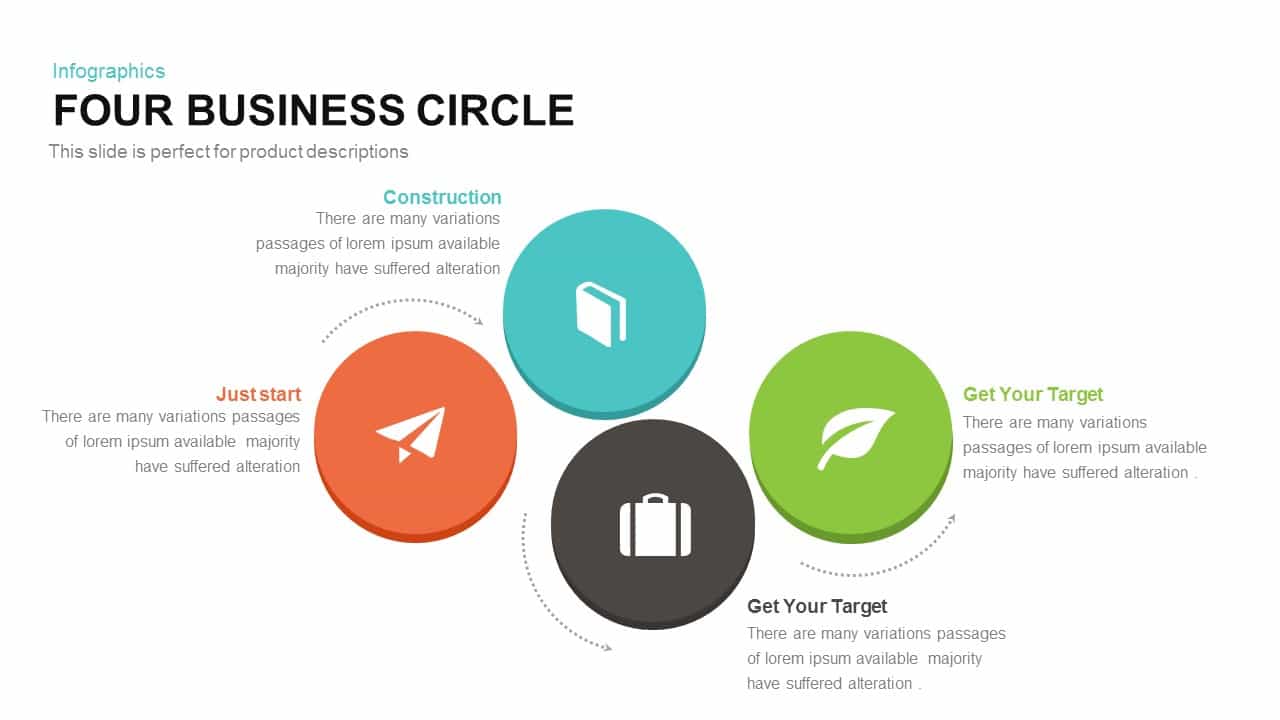
Four-Circle Business Process Infographic Template for PowerPoint & Google Slides
Circular
Three Four Five Stage Timeline Infographic Template for PowerPoint & Google Slides
Timeline
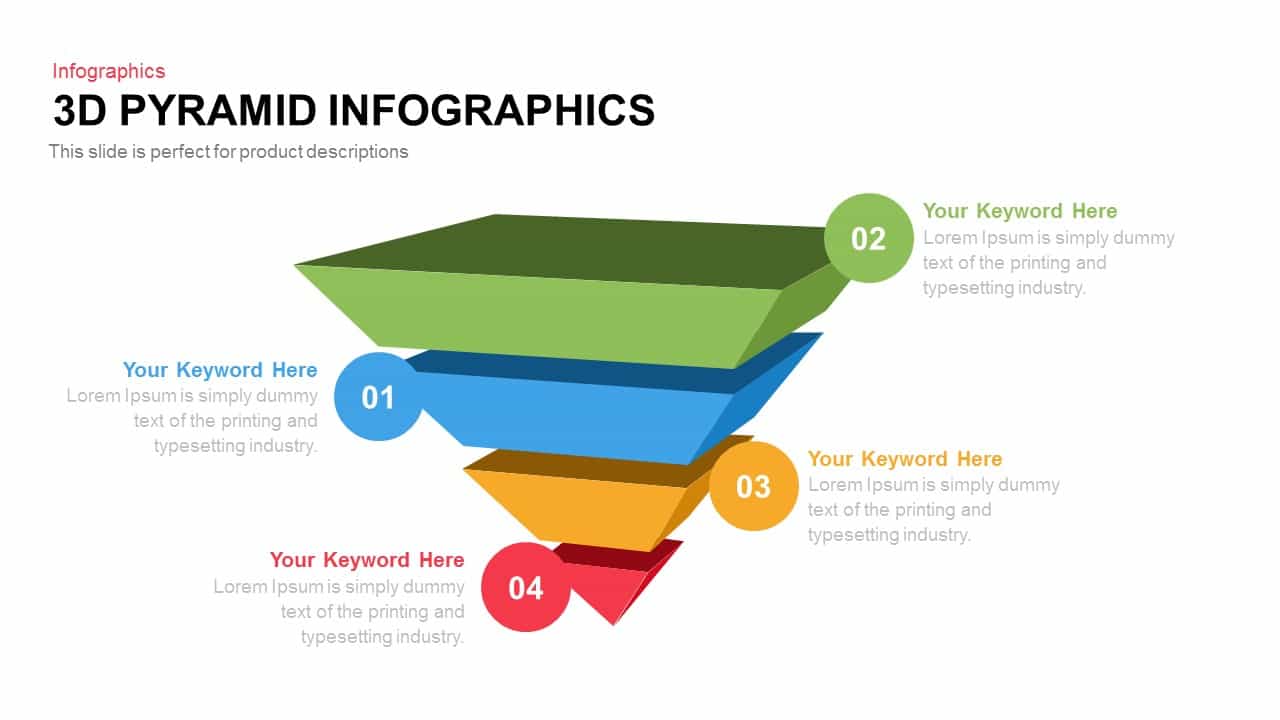
Four-Level 3D Pyramid Infographic Template for PowerPoint & Google Slides
Pyramid
Four-Stage Linear Infographic Diagram Template for PowerPoint & Google Slides
Process
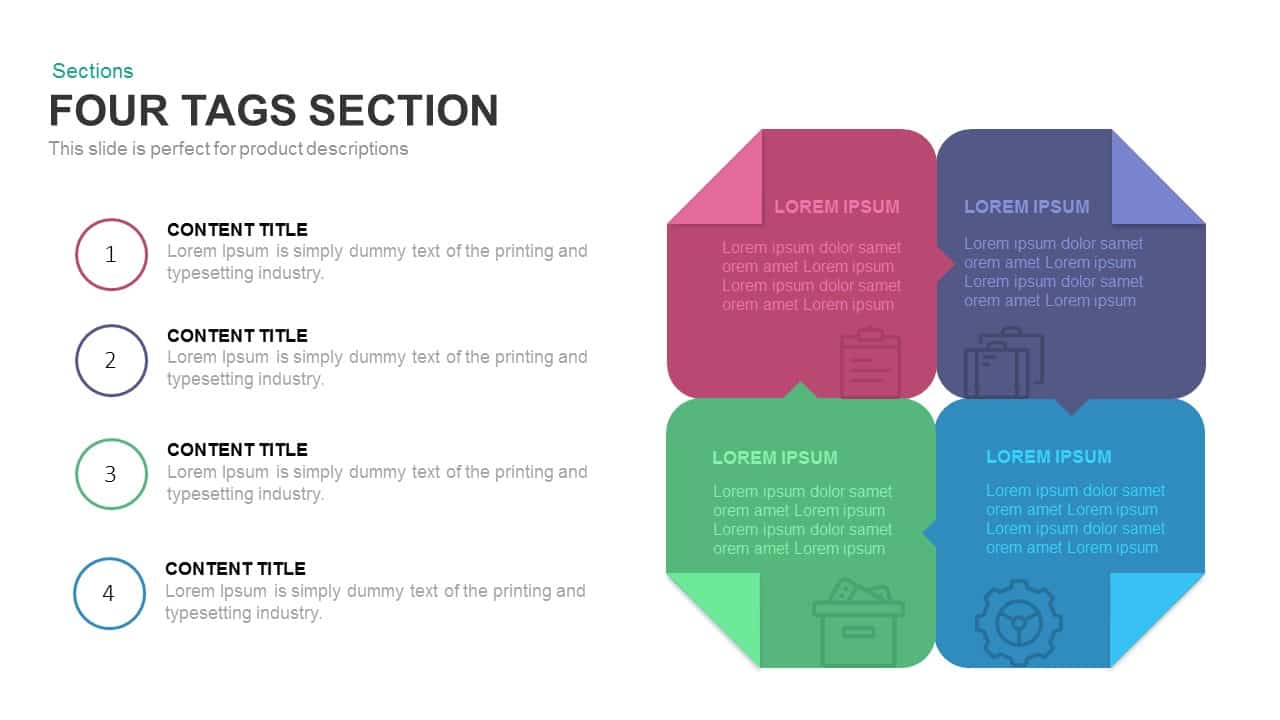
Four-Tag Section Ribbon Infographic Template for PowerPoint & Google Slides
Comparison
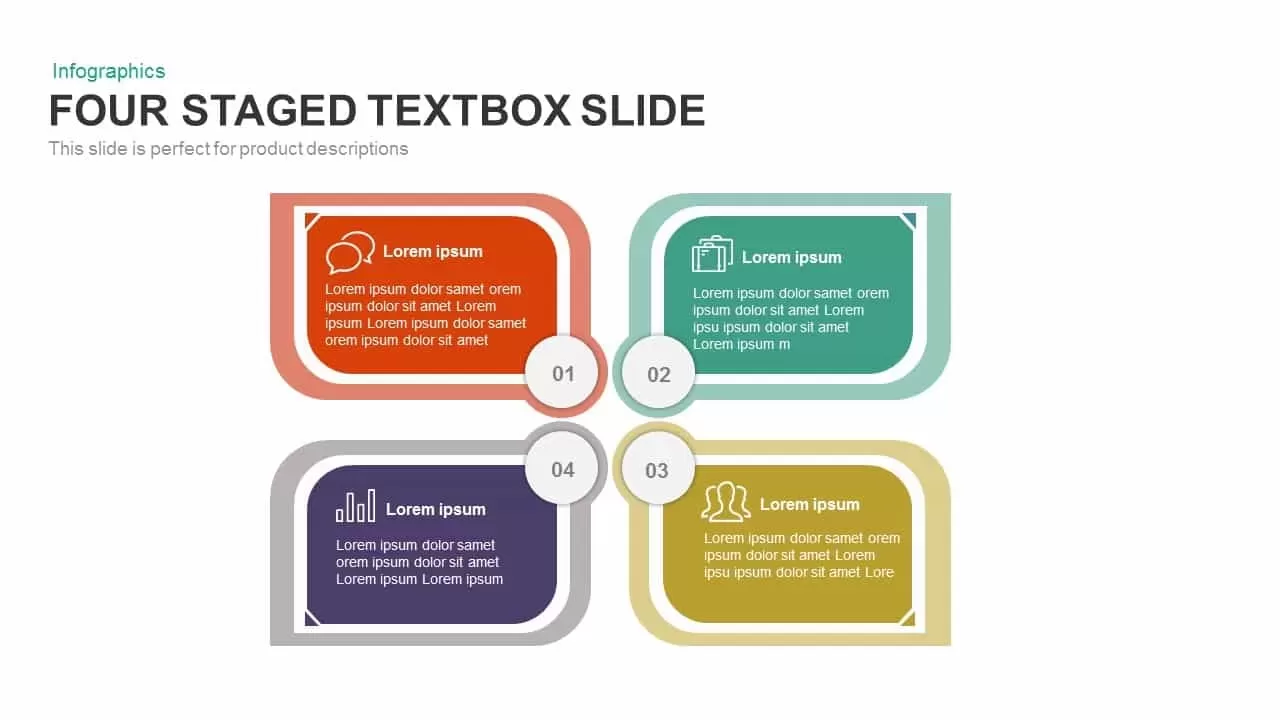
Four-Staged Textbox Infographic Template for PowerPoint & Google Slides
Process
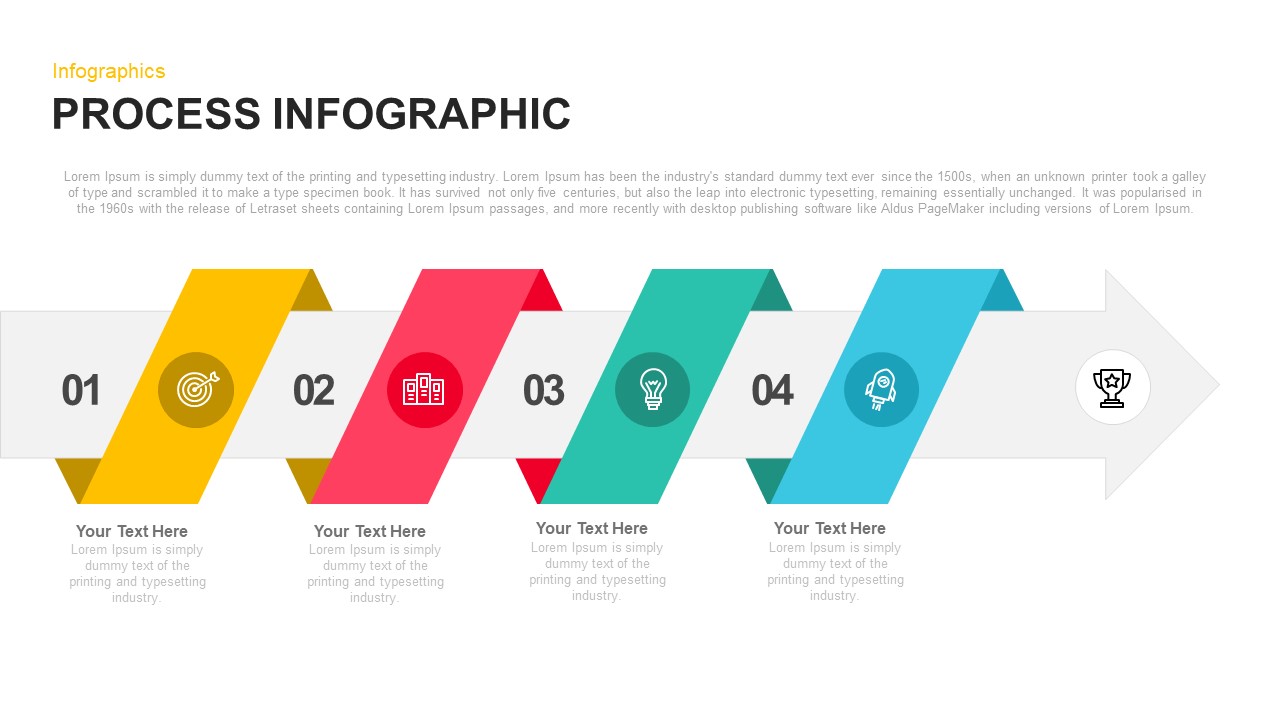
Colorful Four-Stage Infographic Process Template for PowerPoint & Google Slides
Process
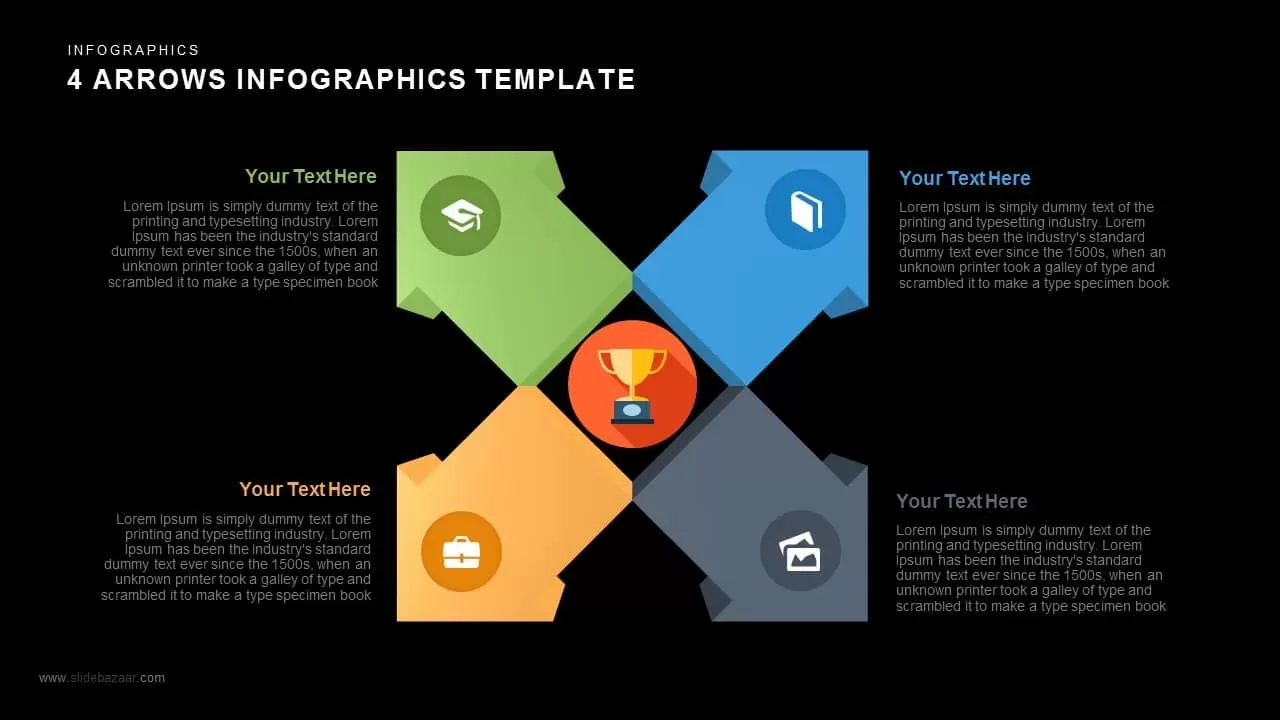
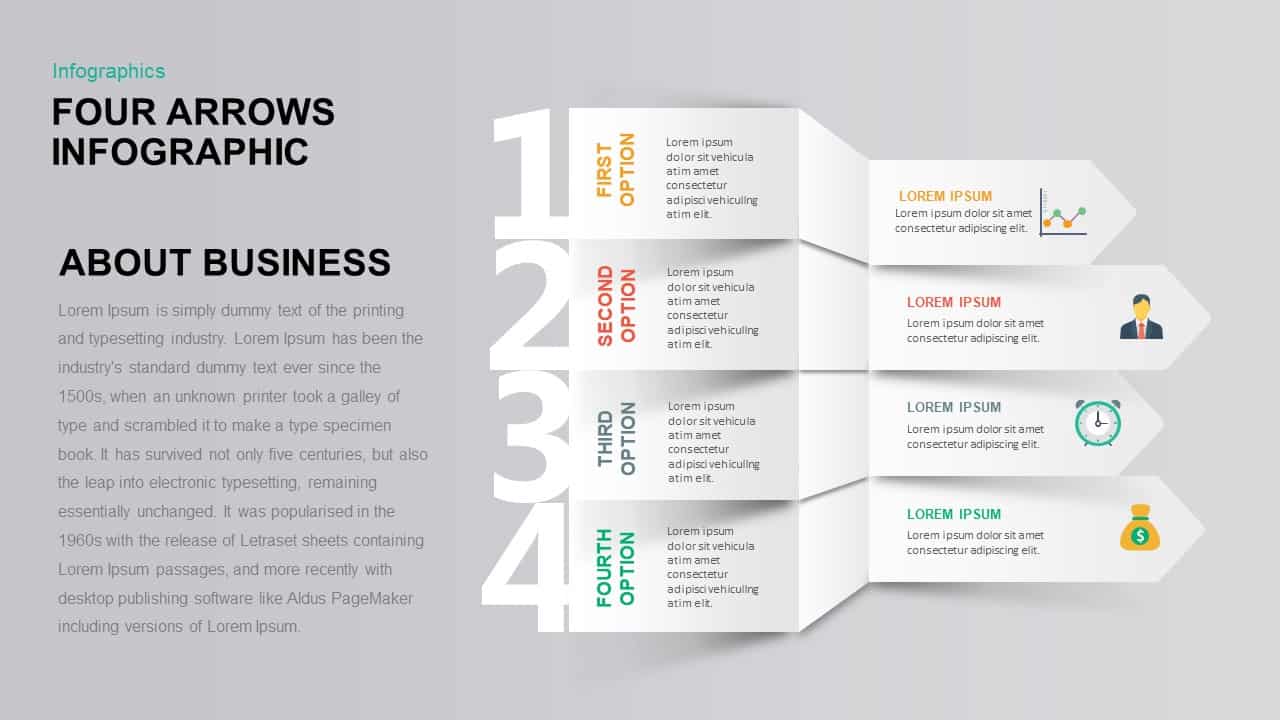
Four Arrows Layout Infographic with Icon Template for PowerPoint & Google Slides
Arrow
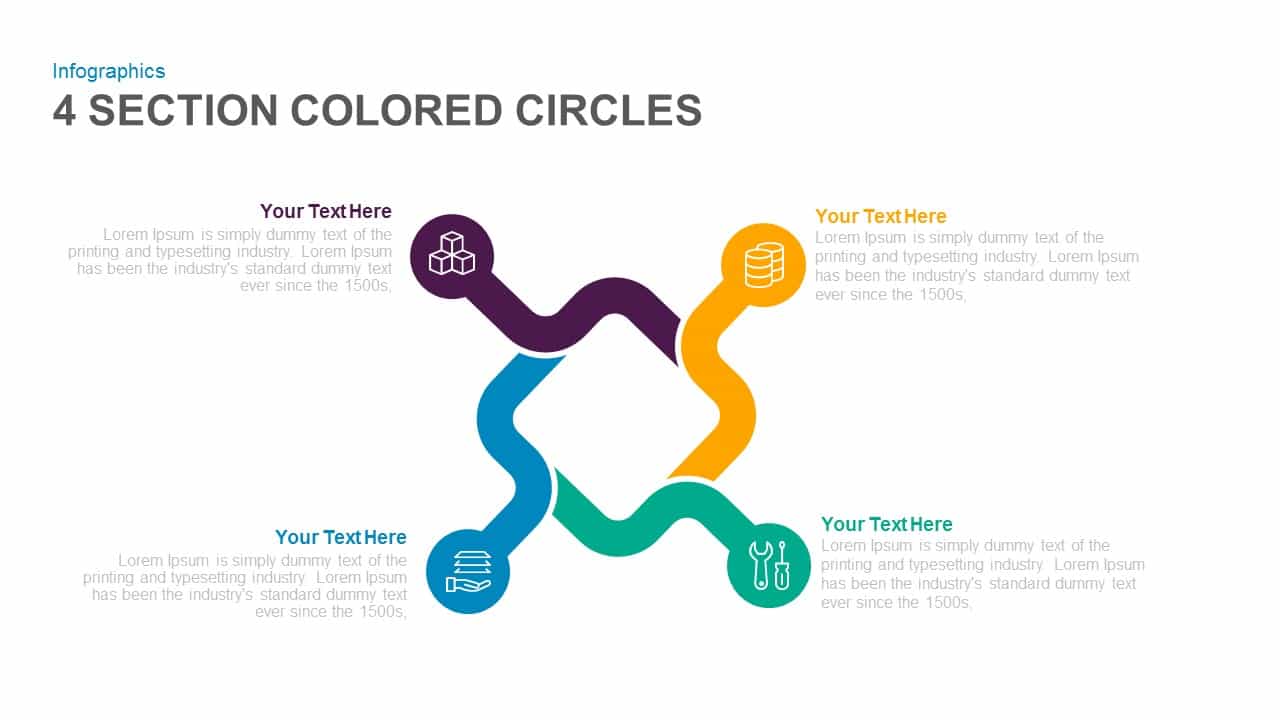
Four-Section Colored Circle Infographic Template for PowerPoint & Google Slides
Circular

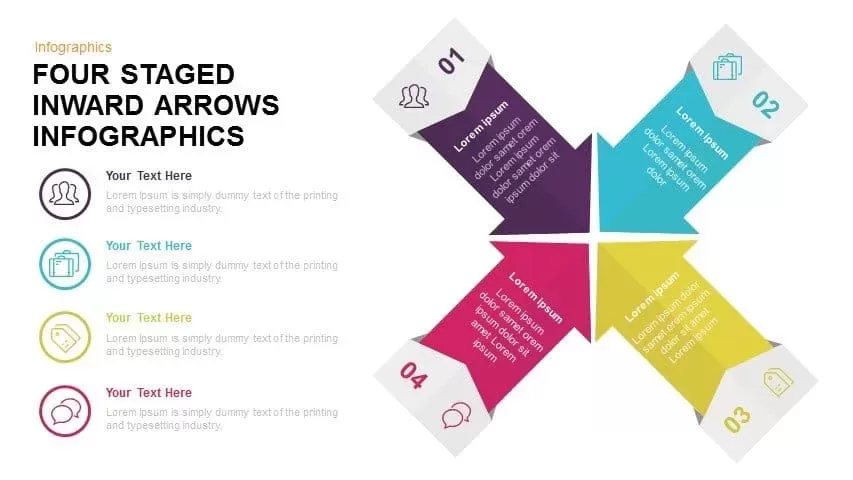
Four Staged Inward Arrows Infographic Template for PowerPoint & Google Slides
Arrow
Four-Section Arrow Infographic Diagram Template for PowerPoint & Google Slides
Arrow
Four-Step Arrow Process Infographic Template for PowerPoint & Google Slides
Arrow
Four-Option 4-Step Arrow Infographic Template for PowerPoint & Google Slides
Arrow
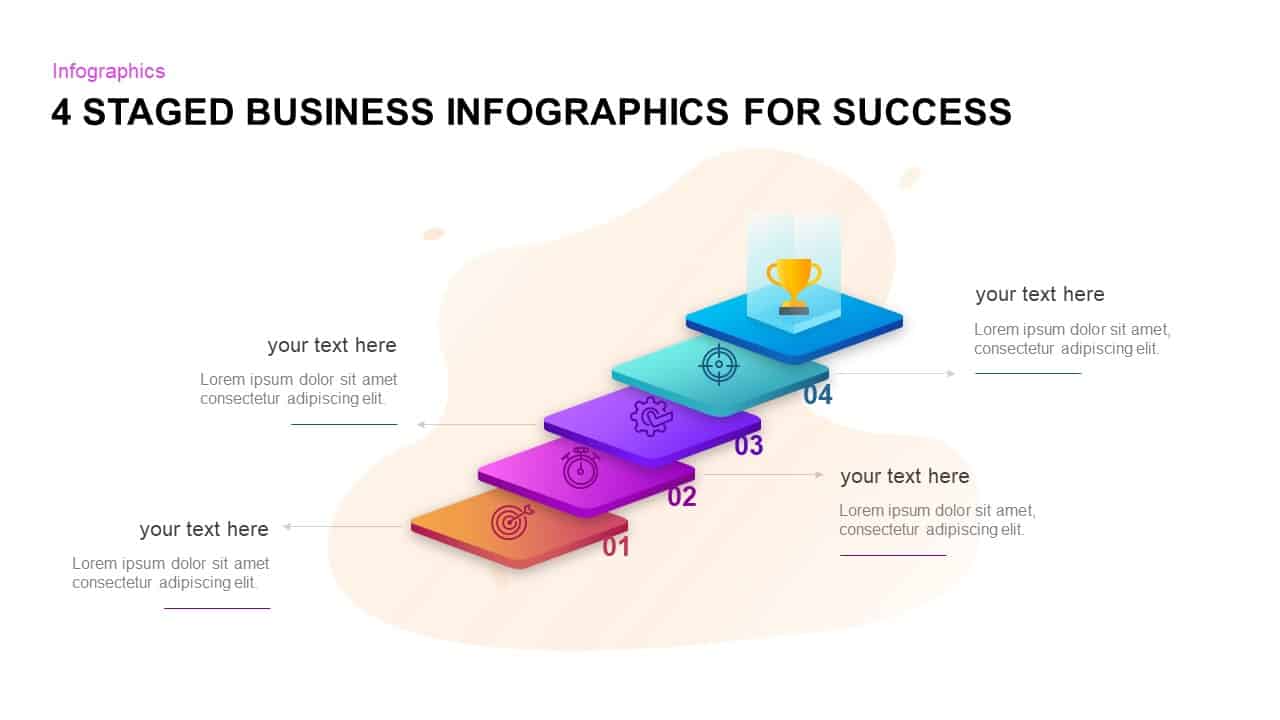
Four-Stage Business Success Infographic Template for PowerPoint & Google Slides
Process
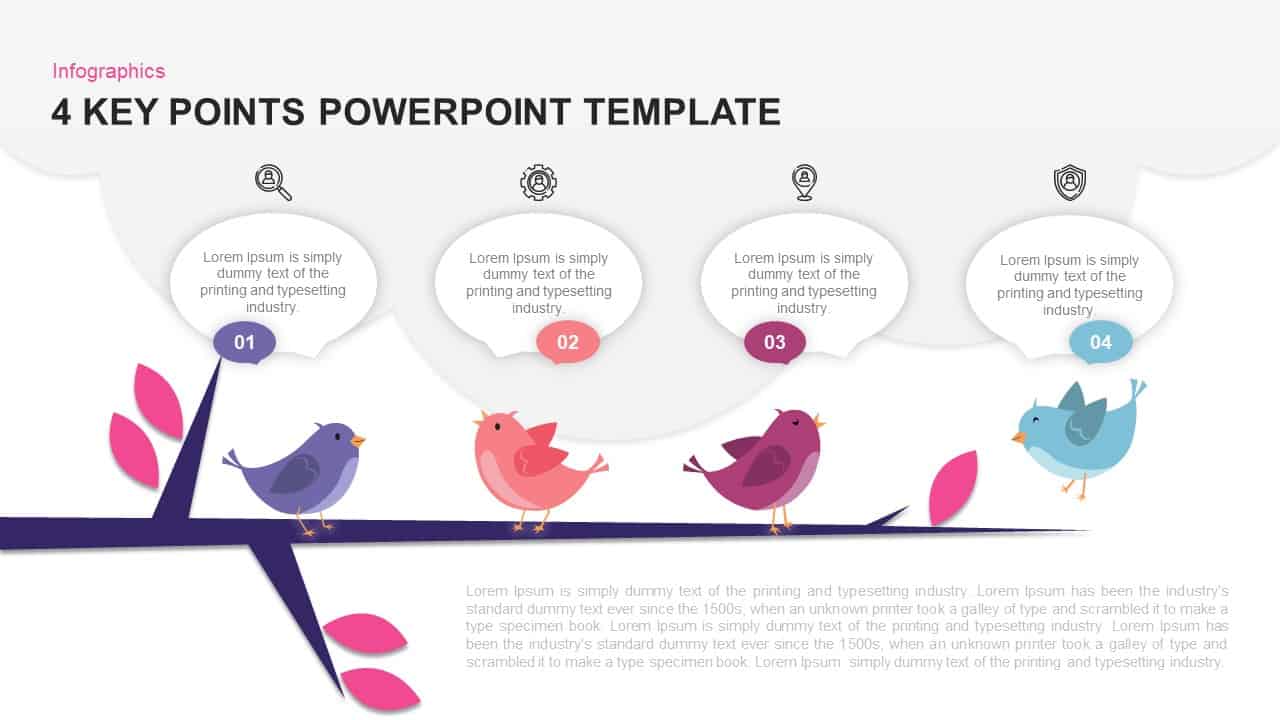
Bird Branch Four Key Points Infographic Template for PowerPoint & Google Slides
Agenda
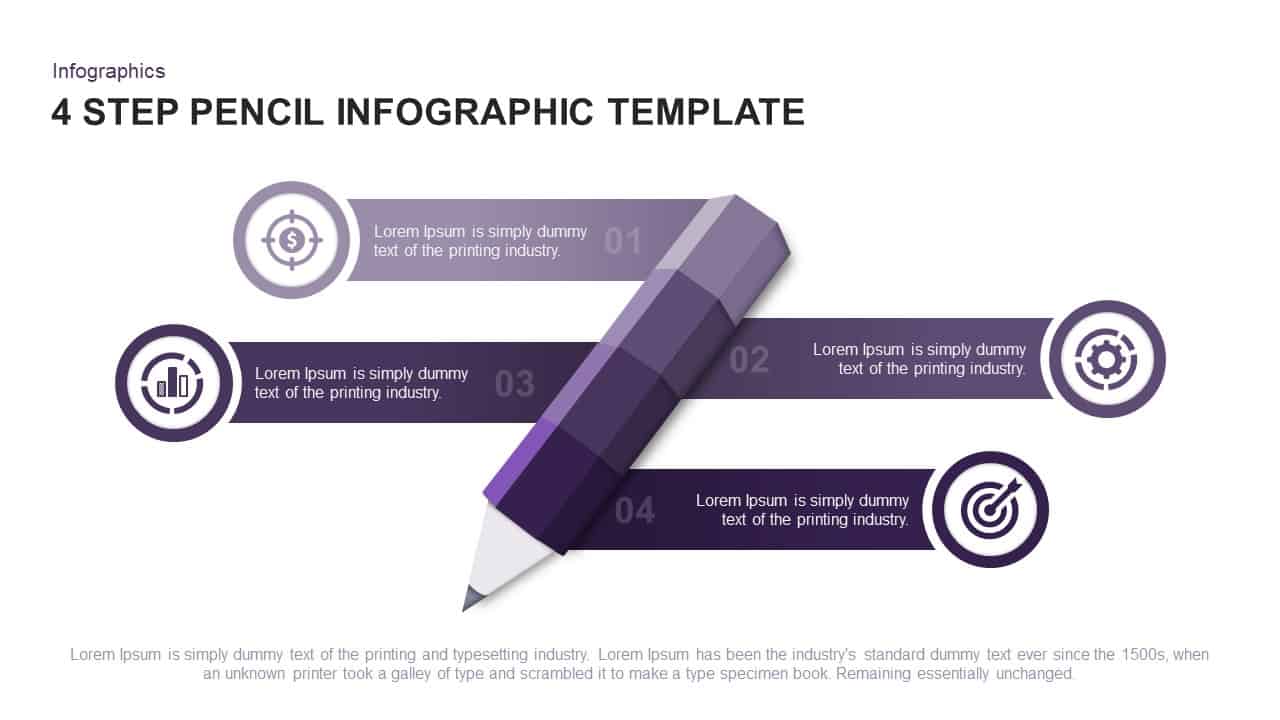
Four-Step Pencil Infographic Process Template for PowerPoint & Google Slides
Process
Four-Stage Circular Diagram Infographic Template for PowerPoint & Google Slides
Circular
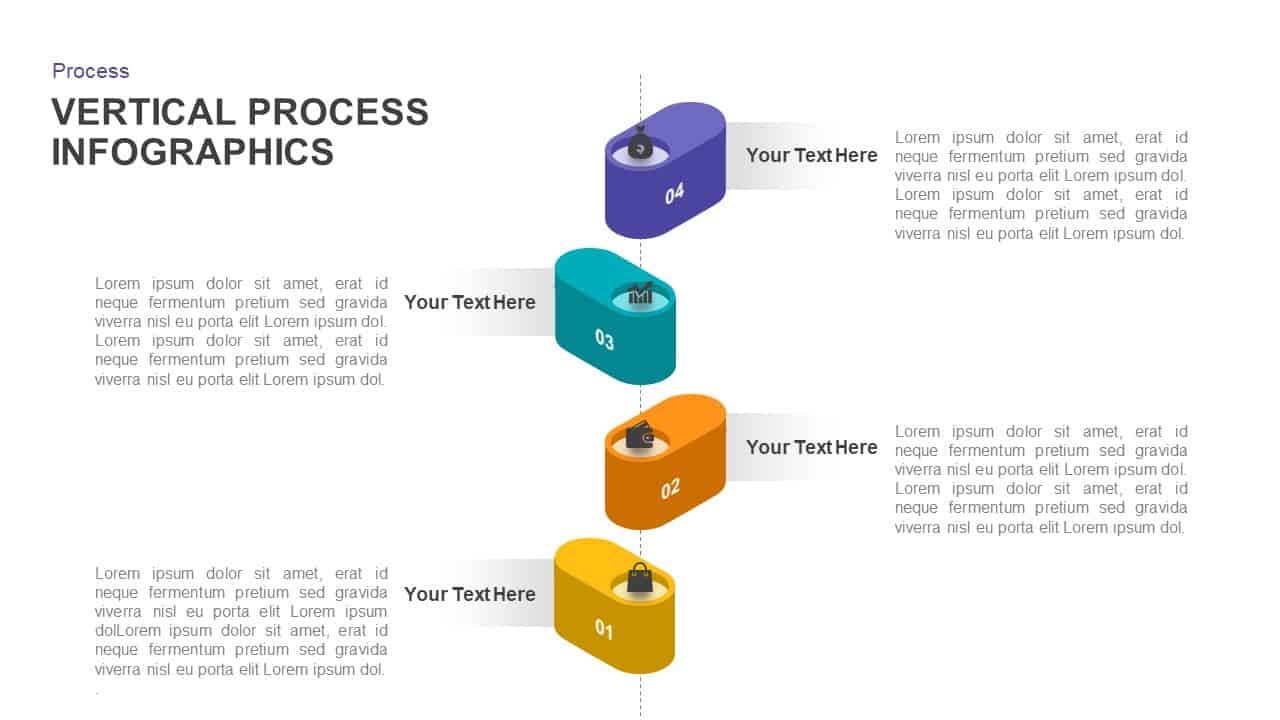
Vertical Four-Step Process Infographic Template for PowerPoint & Google Slides
Process
Four-Stage Funnel Diagram Infographic Template for PowerPoint & Google Slides
Funnel
Shape Loop Four-Step Infographic Slide Template for PowerPoint & Google Slides
Process
Four-Stage Agenda Infographic Slide Template for PowerPoint & Google Slides
Agenda
Four Step Process Infographic Slide Template for PowerPoint & Google Slides
Process
Four-Step Hexagon Process Infographic Template for PowerPoint & Google Slides
Process
Four-Step Funnel Infographic Pack Template for PowerPoint & Google Slides
Funnel
Four-Step Puzzle Diagram Infographic Template for PowerPoint & Google Slides
Process
Four-Stage Funnel Diagram Infographic Template for PowerPoint & Google Slides
Funnel
Four-Step Meeting Agenda Infographic Template for PowerPoint & Google Slides
Agenda
Four Section Infographic Diagram Template for PowerPoint & Google Slides
Circular
Four-Step Isometric Process Infographic Template for PowerPoint & Google Slides
Process
Four-Option Cross Infographic Diagram Template for PowerPoint & Google Slides
Comparison
Four-Part Puzzle Piece Infographic Template for PowerPoint & Google Slides
Infographics
Free Modern Four-Step Agenda Infographic Template for PowerPoint & Google Slides
Agenda
Free
Four-Part Table of Contents Infographic Template for PowerPoint & Google Slides
Agenda
Four-Stage Circle Arrow Infographic Template for PowerPoint & Google Slides
Circular
PDCA Cycle Infographic with Four Stages Template for PowerPoint & Google Slides
Process
Four-Stage Circle Arrow Infographic Template for PowerPoint & Google Slides
Circular
PDCA Four-Stage Cycle Infographic Template for PowerPoint & Google Slides
Process
Four-Segment Flywheel Infographic Model Template for PowerPoint & Google Slides
Process
Apple Four-Step Process Infographic Template for PowerPoint & Google Slides
Process
Shield Four-Segment Infographic Template for PowerPoint & Google Slides
Process
Four-Step Content Audit Infographic Template for PowerPoint & Google Slides
Process
Four-Level Food Pyramid Infographic Template for PowerPoint & Google Slides
Pyramid
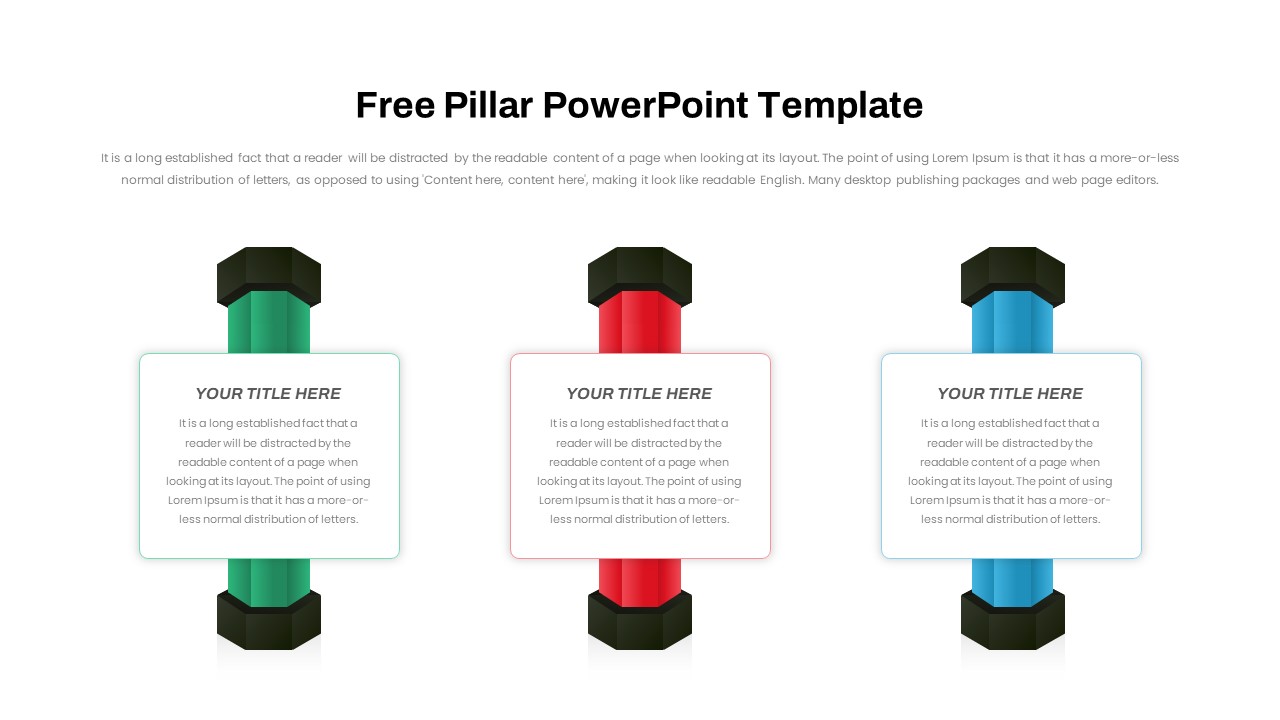
Free Three and Four Pillar Infographic Pack Template for PowerPoint & Google Slides
Process
Free
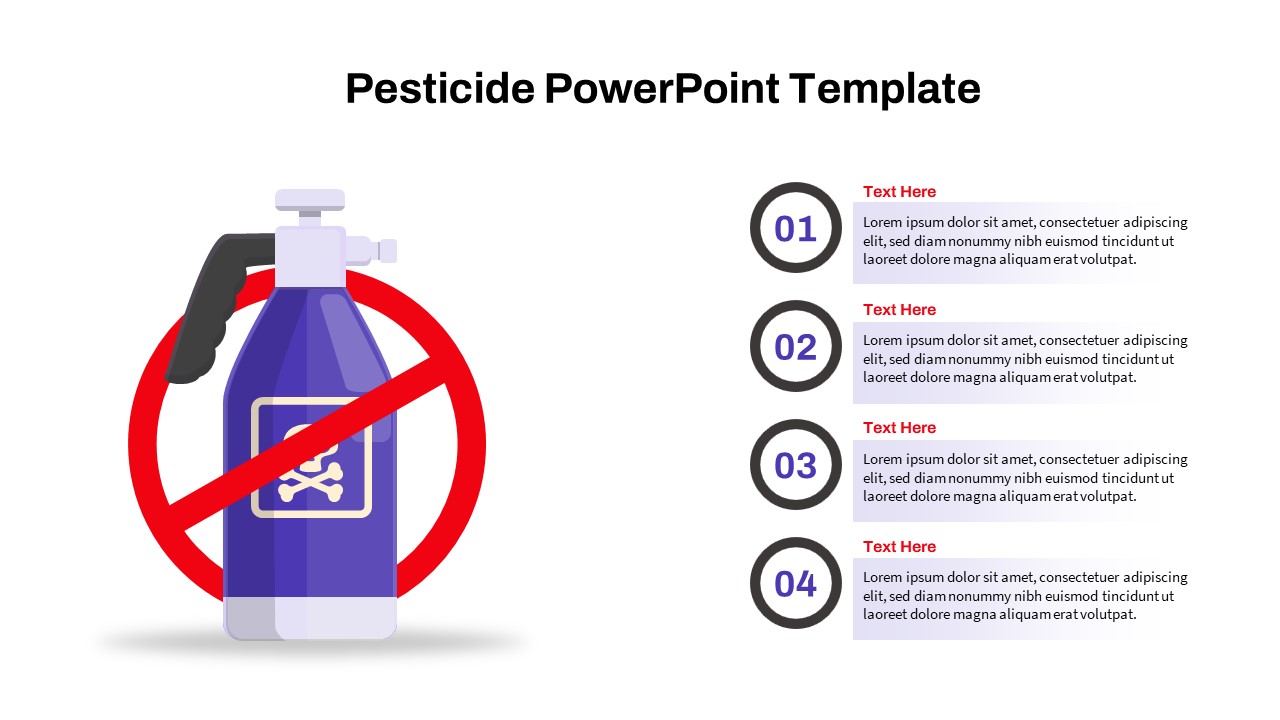
Pesticide Four-Step Process Infographic Template for PowerPoint & Google Slides
Process
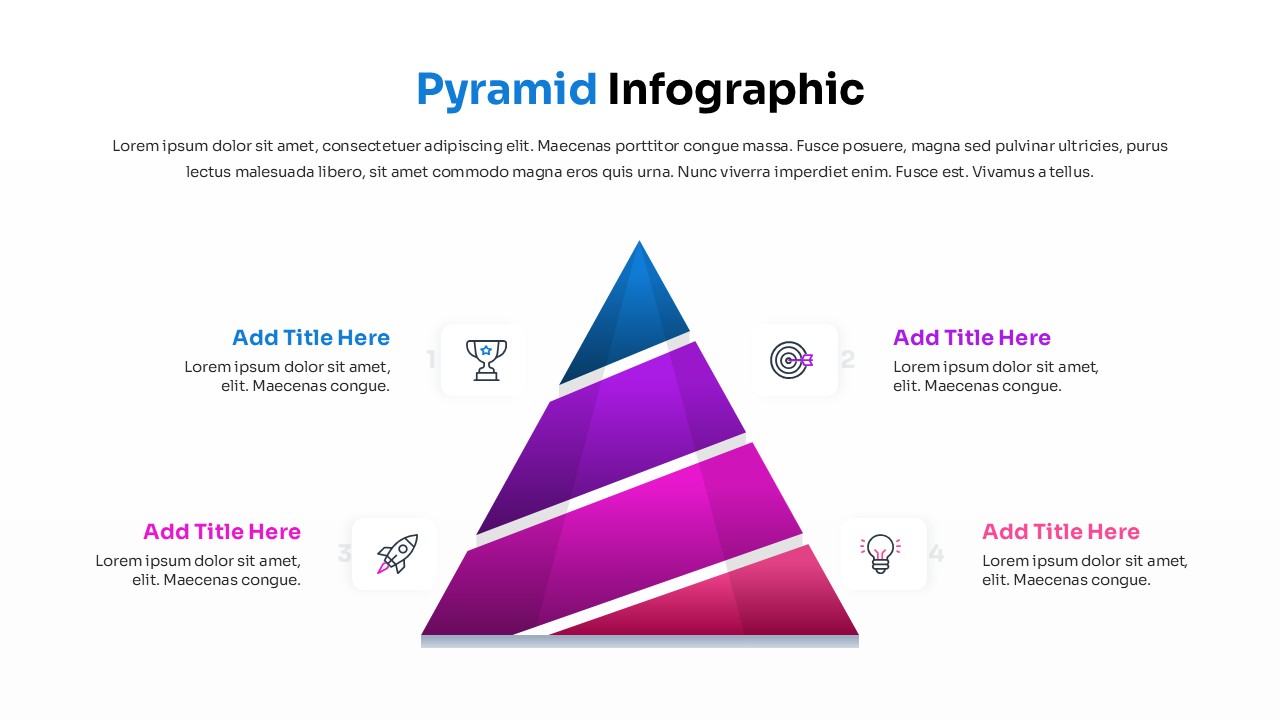
Four Level Pyramid Infographic Template for PowerPoint & Google Slides
Pyramid
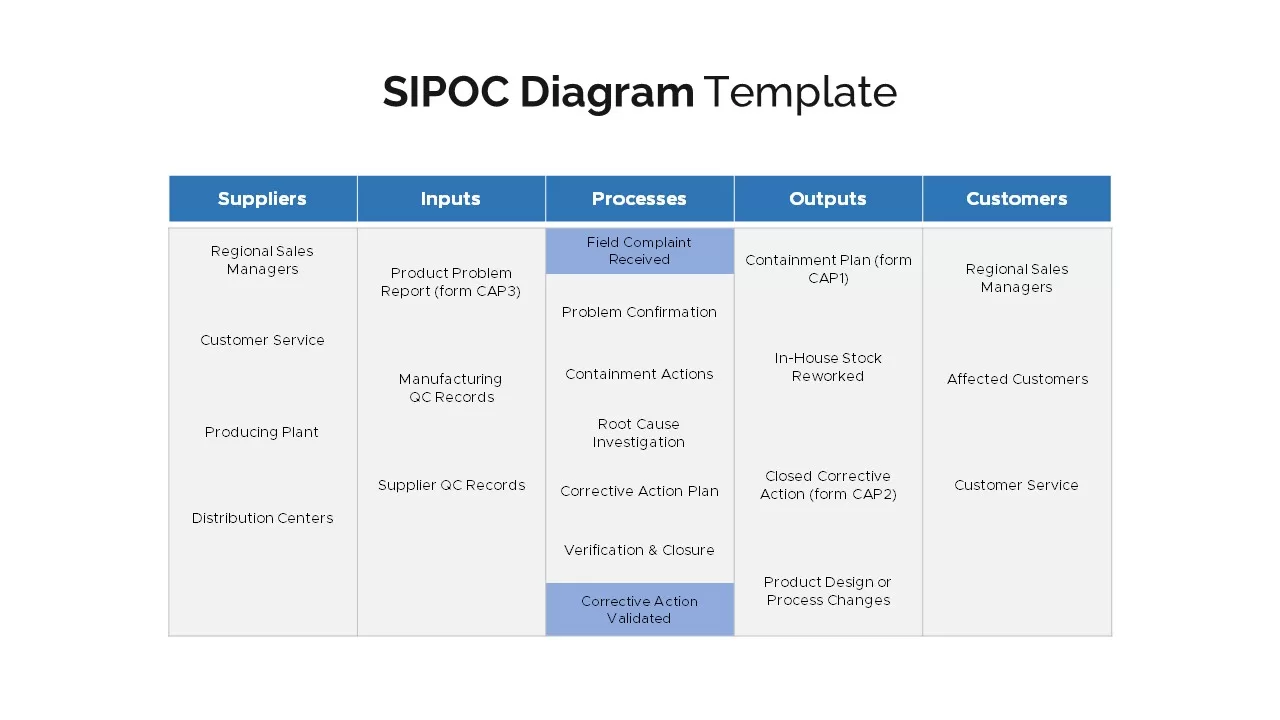
Four SIPOC Diagram Infographic Templates for PowerPoint & Google Slides
Business Plan
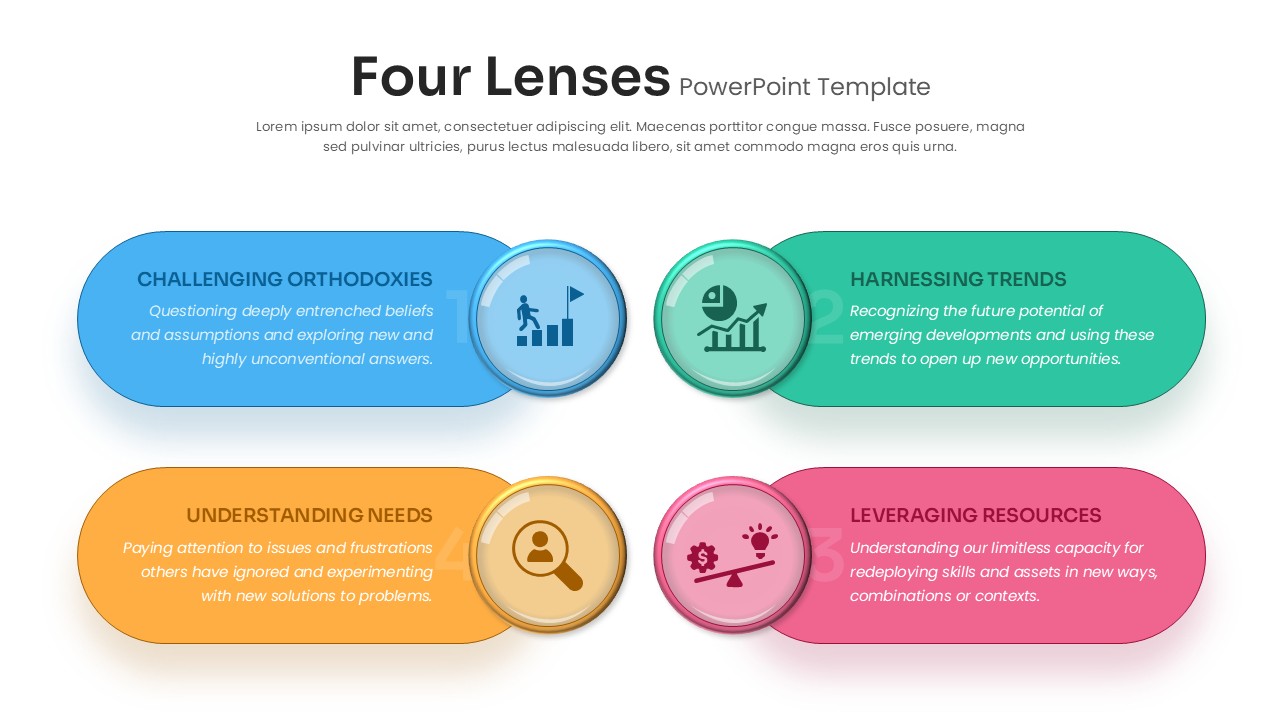
Four Lenses PowerPoint Template for PowerPoint & Google Slides
Competitor Analysis
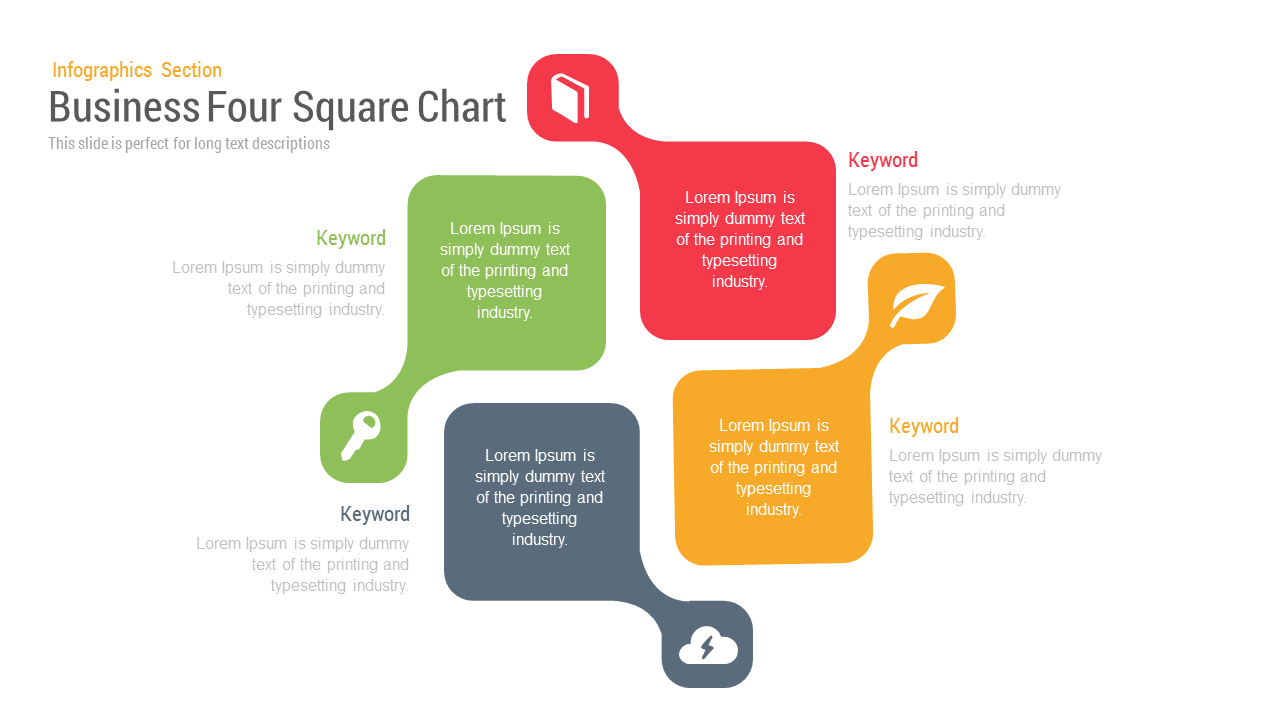
Business Four Square Chart template for PowerPoint & Google Slides
Business

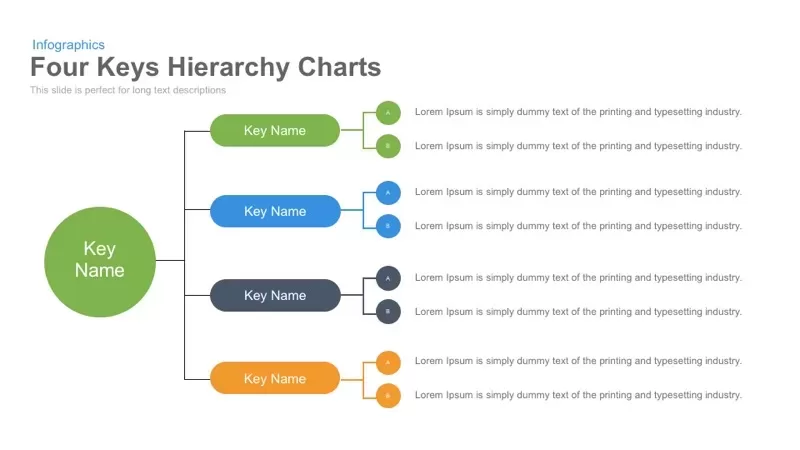
Four Keys Hierarchy Chart template for PowerPoint & Google Slides
Process
Diamond Mind Map Diagram Four Branches Template for PowerPoint & Google Slides
Mind Maps
3D Four-Directional Arrow Infographics Template for PowerPoint & Google Slides
Arrow
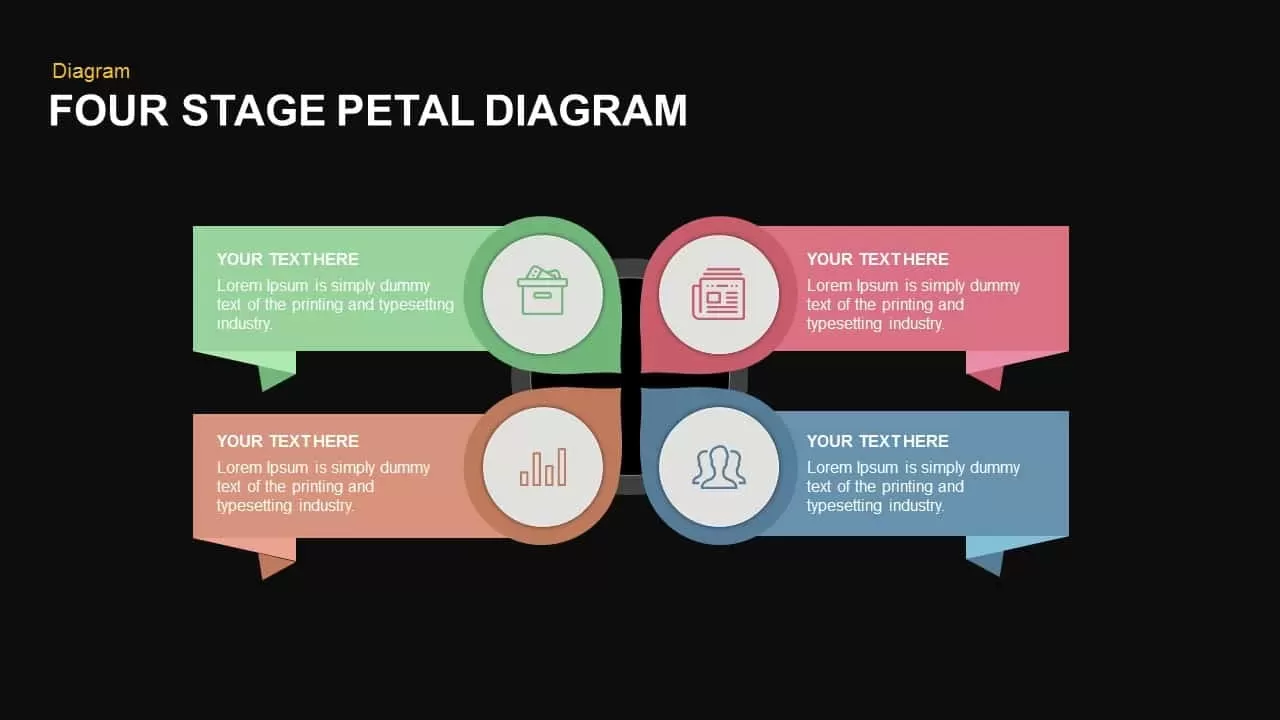
Modern Four-Stage Petal Diagram Template for PowerPoint & Google Slides
Circular
Clean Four-Section Review Diagram Template for PowerPoint & Google Slides
Agenda
Four-Section Ribbon Infographics Template for PowerPoint & Google Slides
Process
Editable Four-Section 3D Shape Diagram Template for PowerPoint & Google Slides
Comparison
Four Section Medical Process template for PowerPoint & Google Slides
Process

Professional Four Puzzle Meeting Agenda Template for PowerPoint & Google Slides
Agenda

Four-Plus Process Flow Diagram Template for PowerPoint & Google Slides
Process
Four-Stage Circular Process Flow Template for PowerPoint & Google Slides
Process
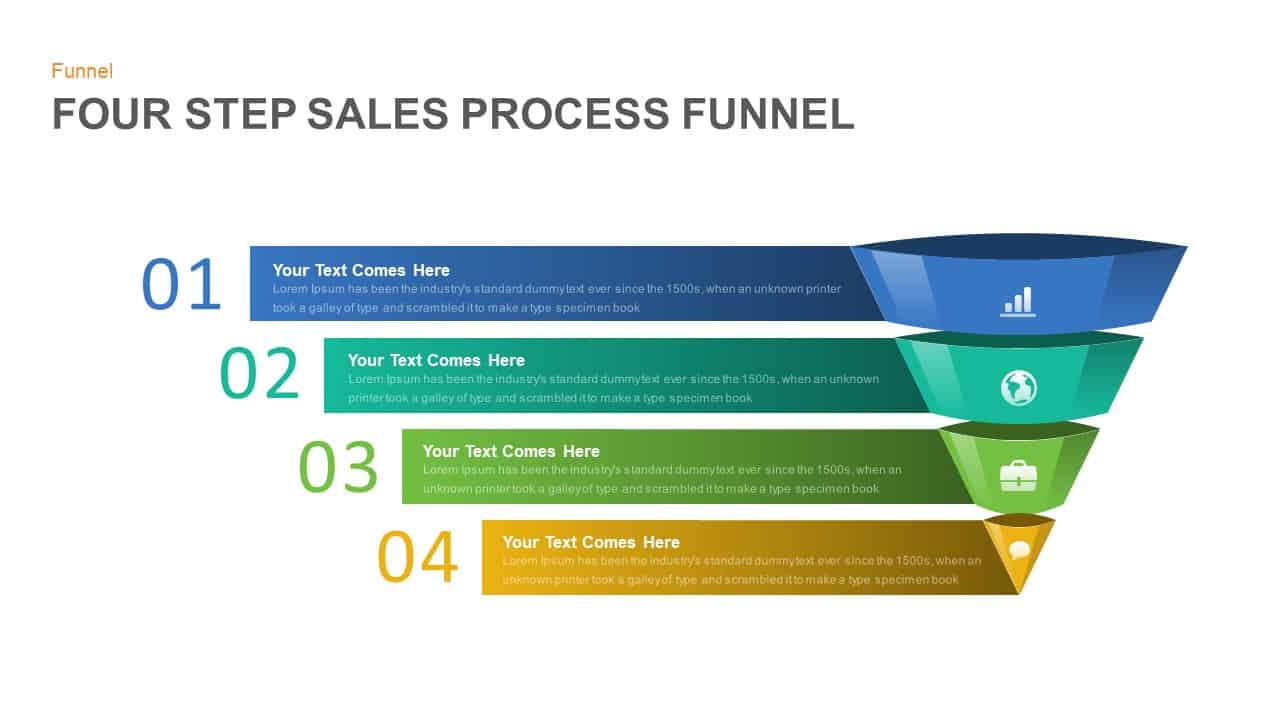
Four Step Sales Process Funnel Template for PowerPoint & Google Slides
Funnel
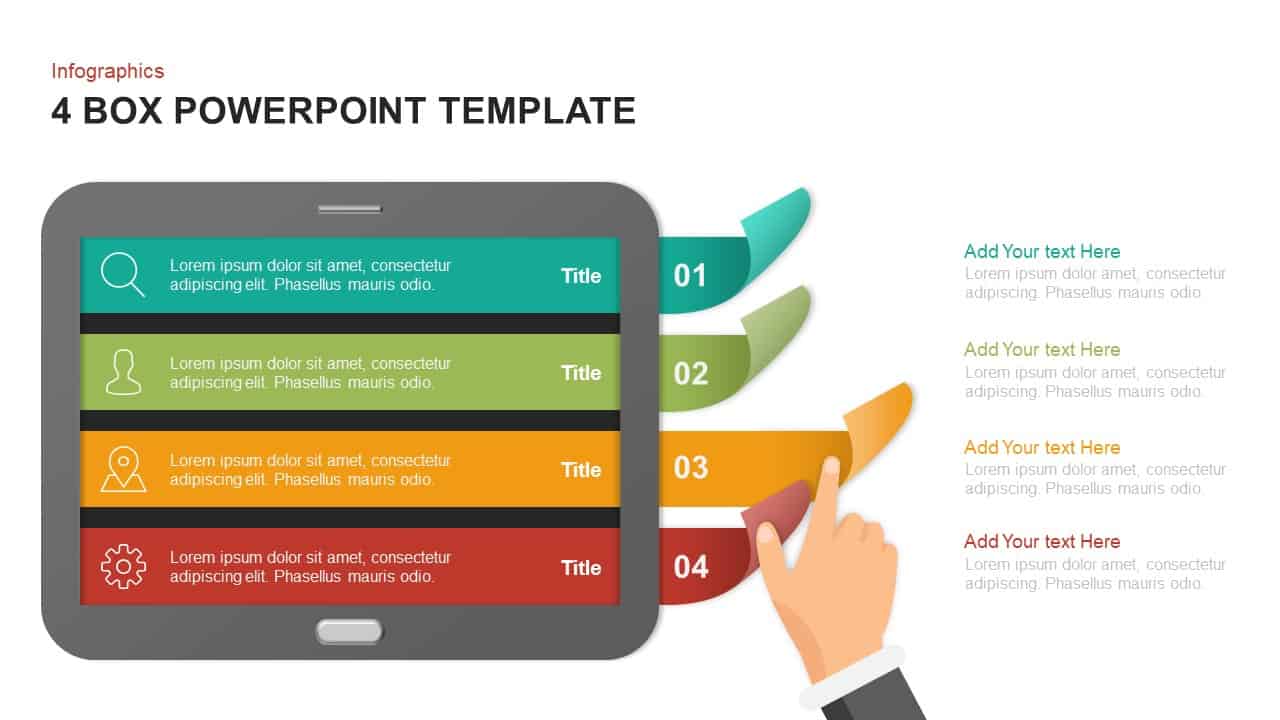
Tablet Four-Section Menu Interface Template for PowerPoint & Google Slides
Agenda
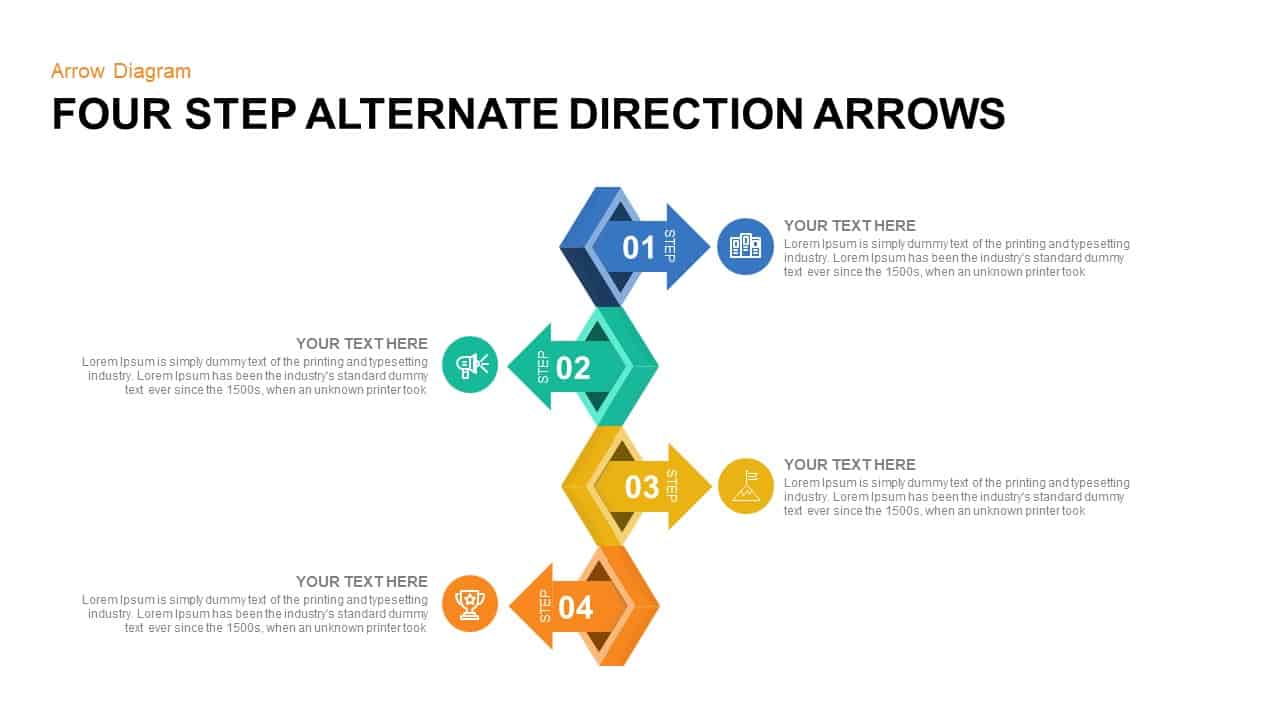
Four Step Alternate Direction Arrows Template for PowerPoint & Google Slides
Arrow
Four-Stage Gear Process Diagram Template for PowerPoint & Google Slides
Process
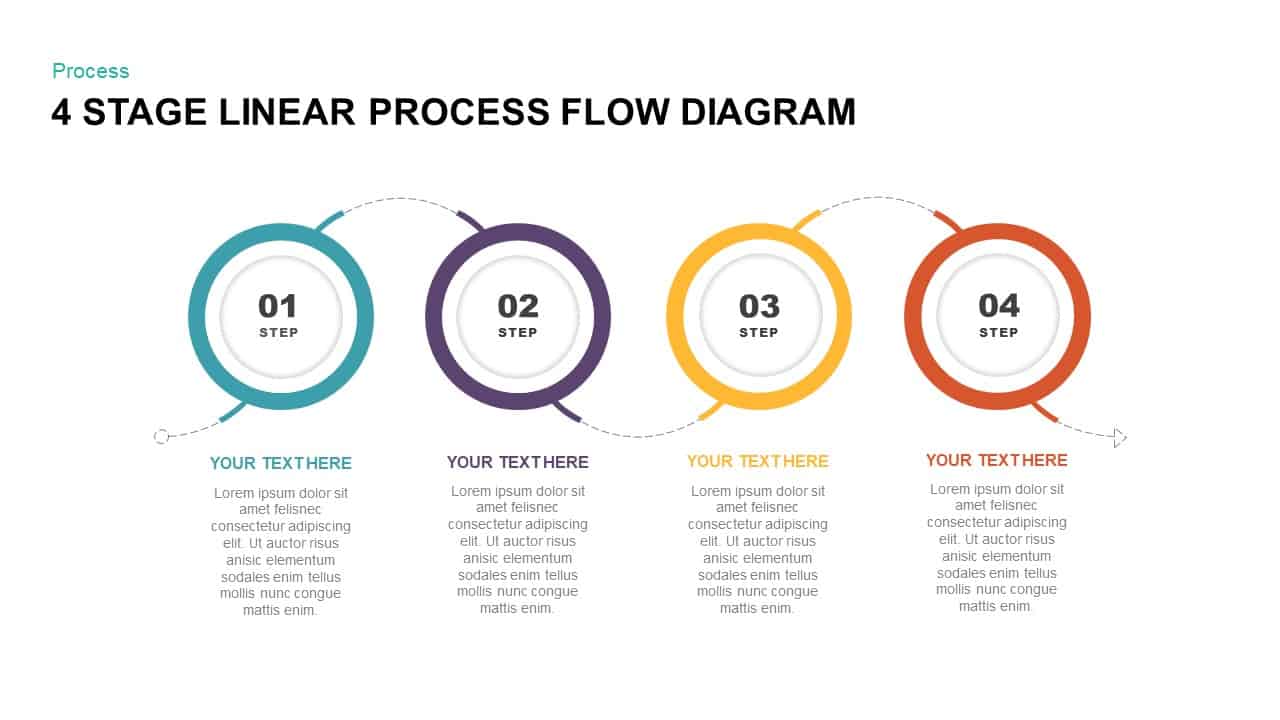
Four-Stage Linear Process Flow Diagram Template for PowerPoint & Google Slides
Process
Four Section Diagram Infographics template for PowerPoint & Google Slides
Process
Modern Four-Step Agenda Slide Layout Template for PowerPoint & Google Slides
Agenda
Gradient Four-Step Roadmap Diagram Template for PowerPoint & Google Slides
Roadmap
Four-Stage Development Pipeline Template for PowerPoint & Google Slides
Process
Modern Four-Step Table of Contents Template for PowerPoint & Google Slides
Agenda
Elegant PDCA Four-Step Process Diagram Template for PowerPoint & Google Slides
Process
Chess Board Four-Point Template for PowerPoint & Google Slides
Opportunities Challenges
Four-Step Arrow Reference Diagram Slide Template for PowerPoint & Google Slides
Arrow
Four-Level Colorful Pyramid Diagram Template for PowerPoint & Google Slides
Pyramid
Colorful Four-Segment Wheel Chart Template for PowerPoint & Google Slides
Circular
Four Quadrant Scatter Chart Analysis Template for PowerPoint & Google Slides
Comparison Chart
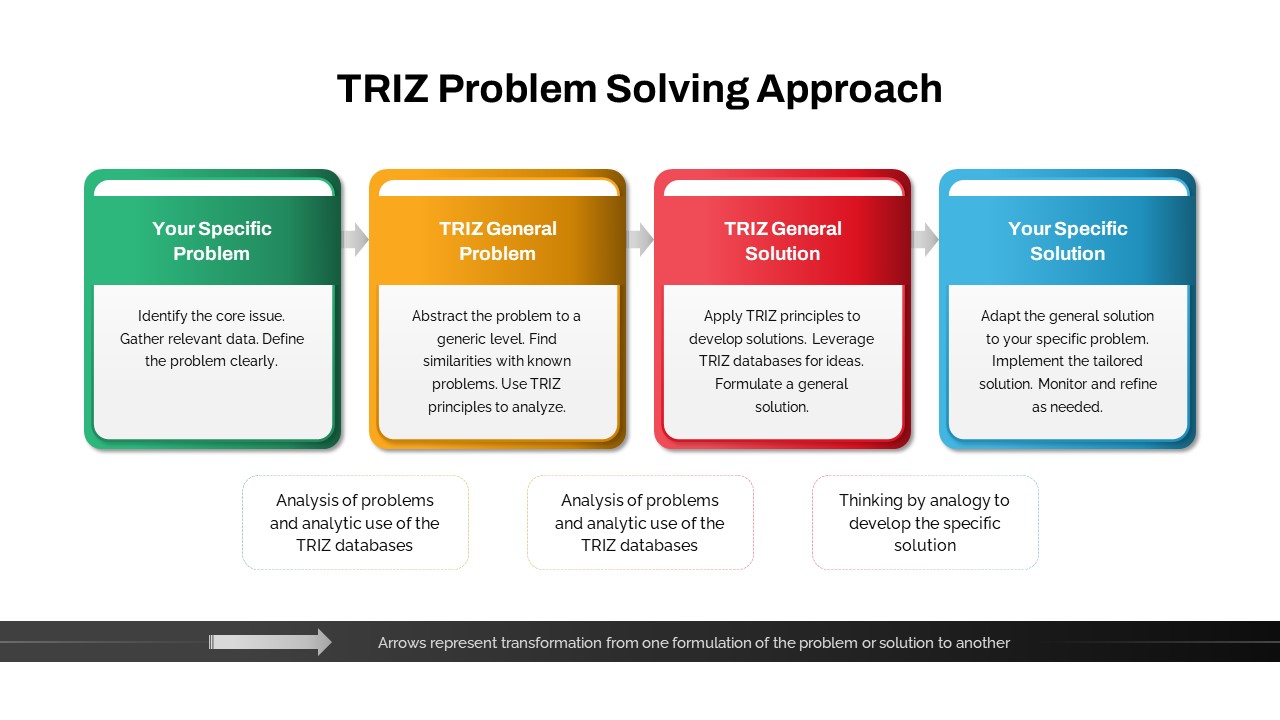
TRIZ Four-Stage Problem Solving Approach Template for PowerPoint & Google Slides
Process
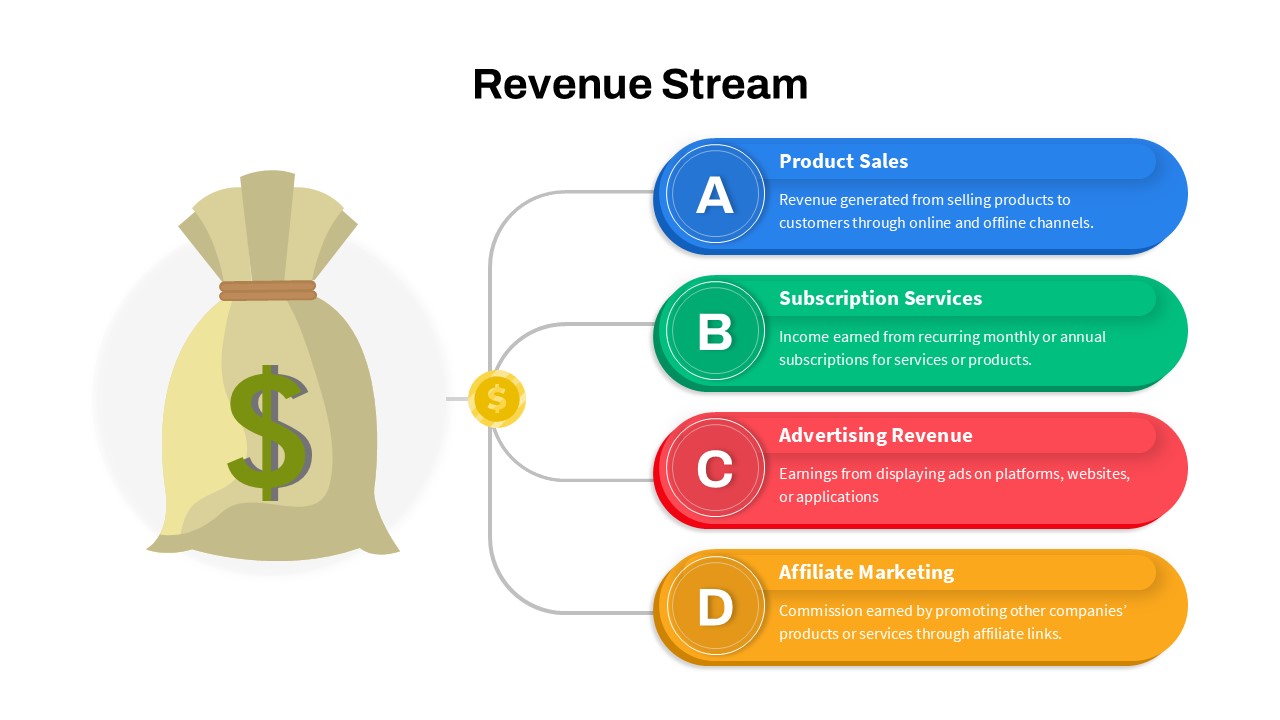
Revenue Streams: Four Channels Diagram Template for PowerPoint & Google Slides
Business Models
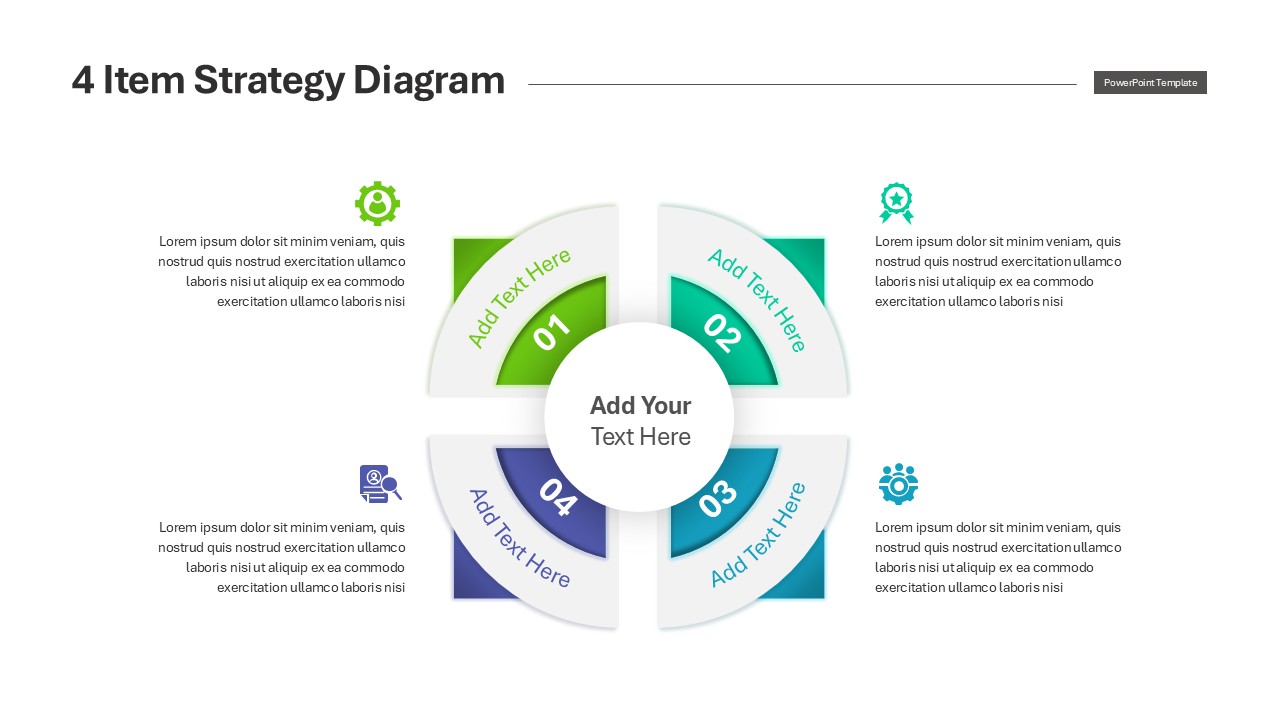
Engaging Four-Option Strategy Diagram Template for PowerPoint & Google Slides
Business Strategy
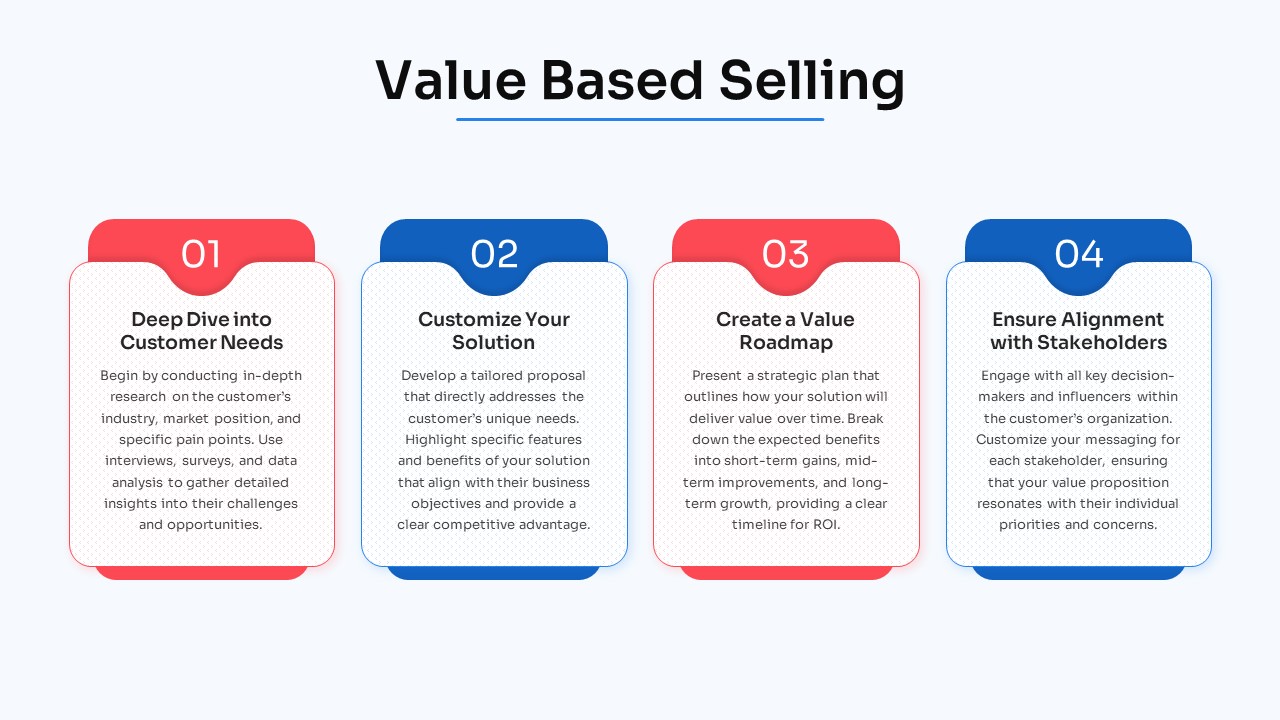
Free Four-Step Value-Based Selling Process Template for PowerPoint & Google Slides
Process
Free
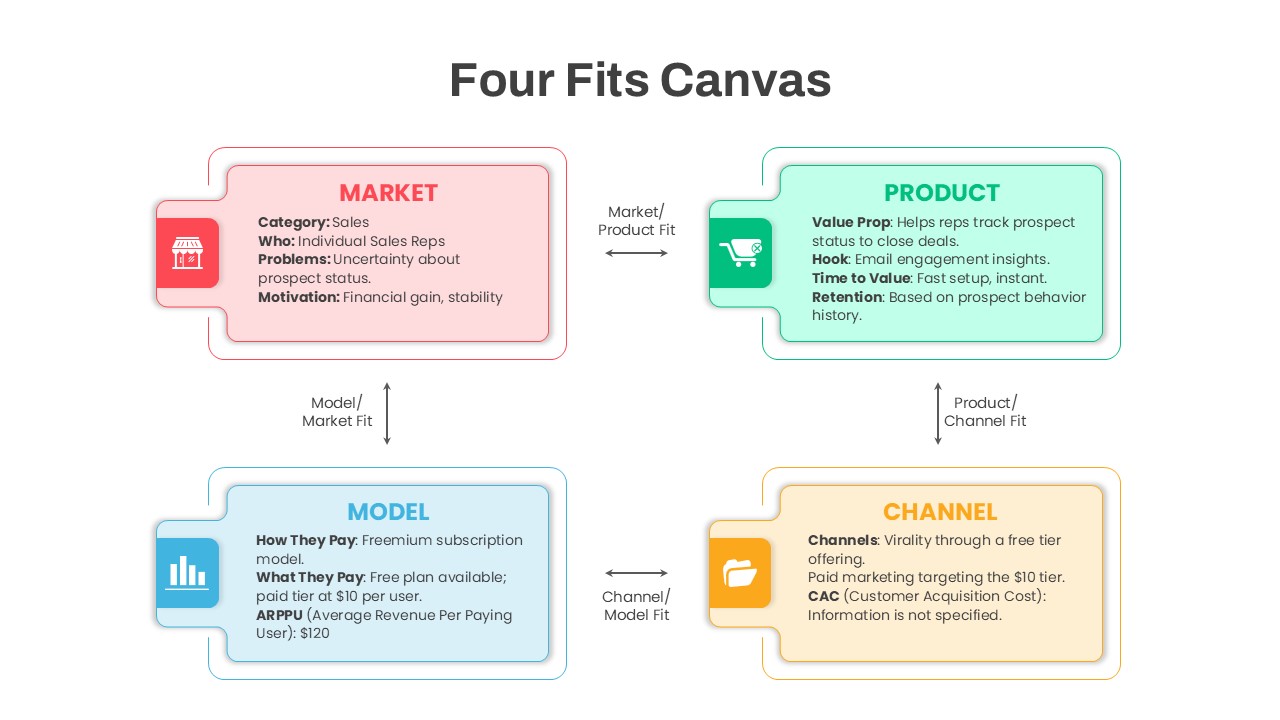
Four Fits Canvas template for PowerPoint & Google Slides
Business Strategy
Modern Four-Step Horizontal List Template for PowerPoint & Google Slides
Process
Machine Learning Four-Step Process Template for PowerPoint & Google Slides
Machine Learning