Business Process Reengineering Cycle Template for PowerPoint & Google Slides


Description
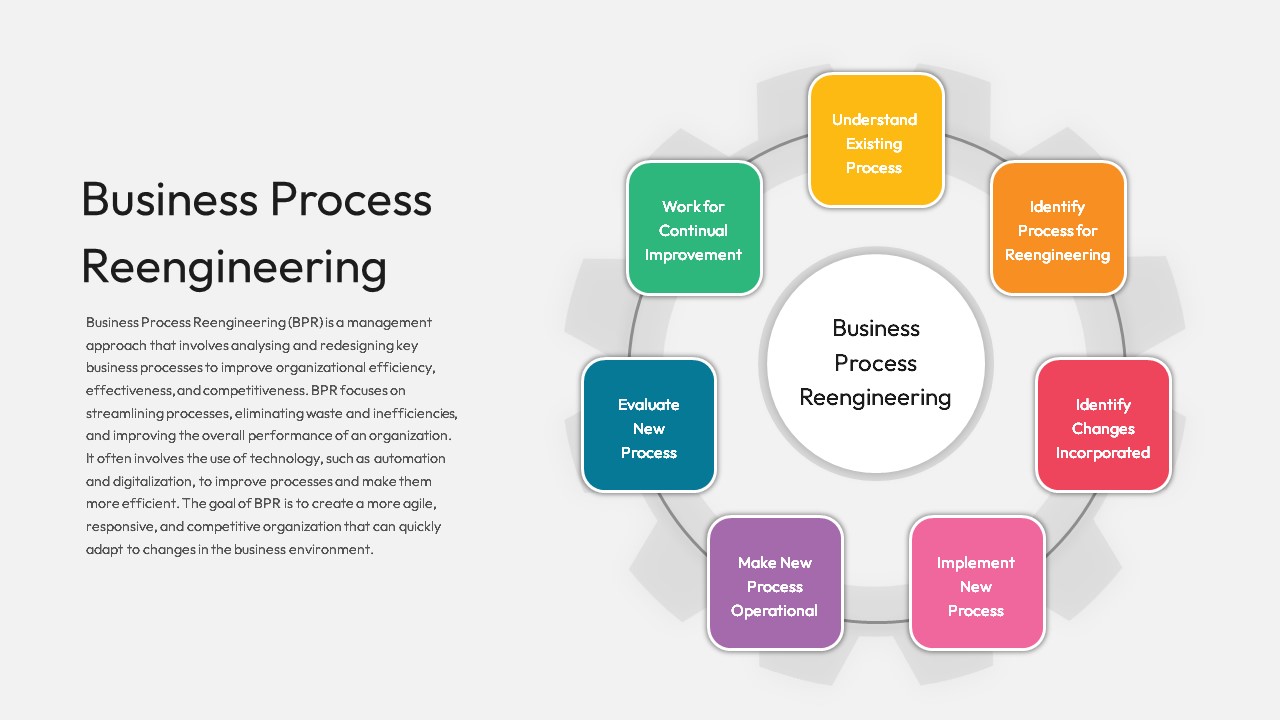
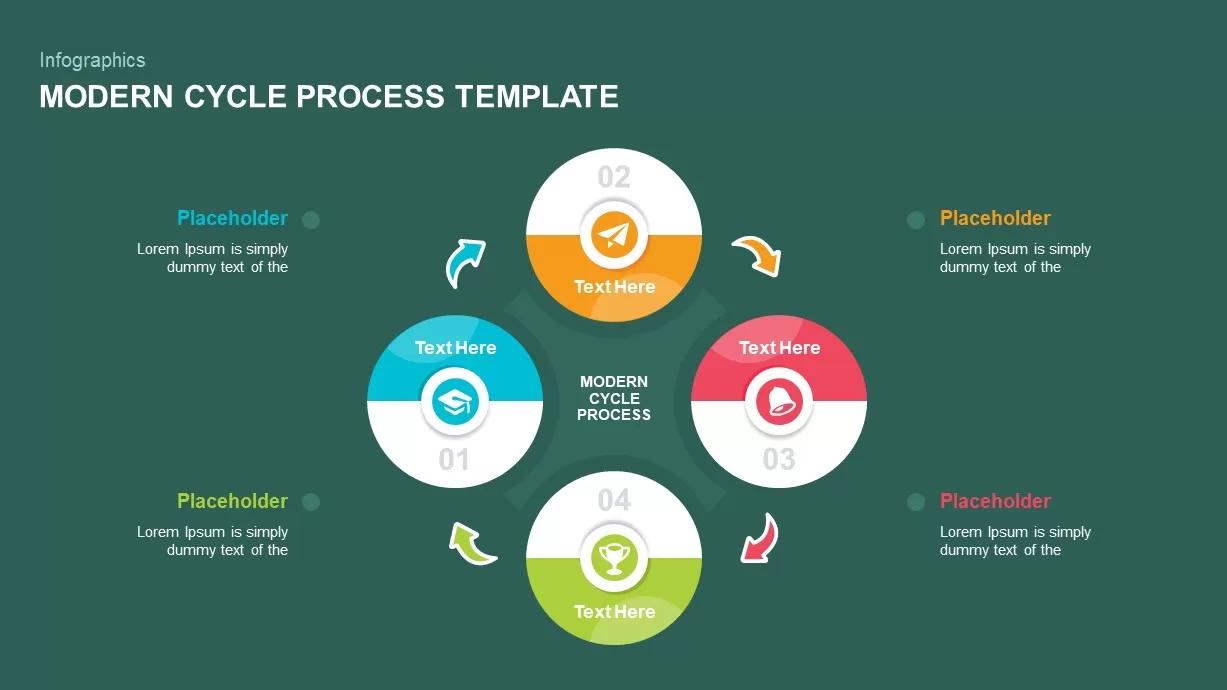
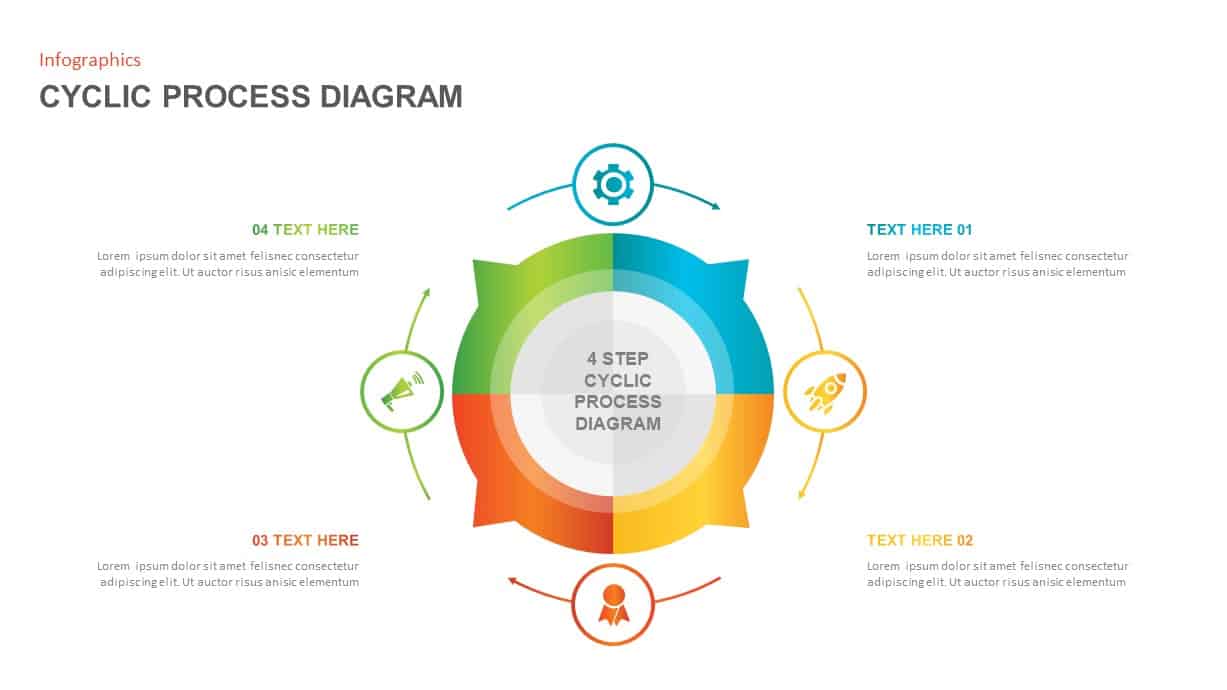
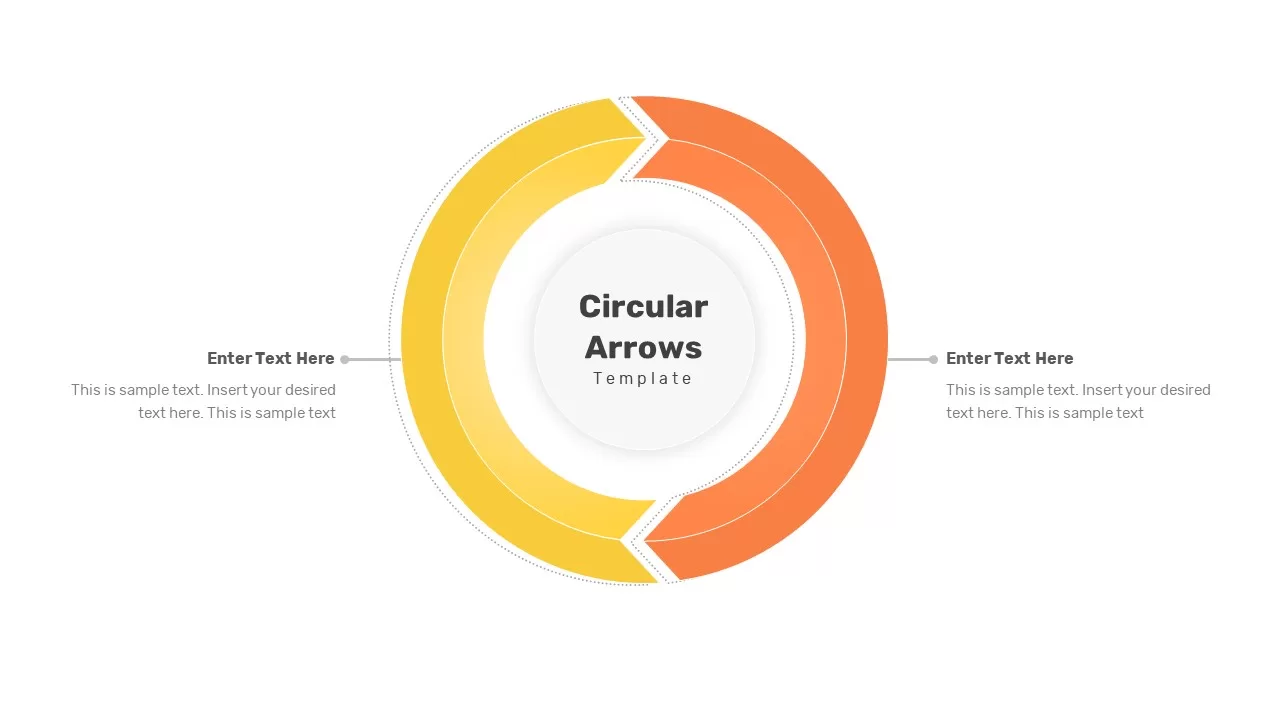
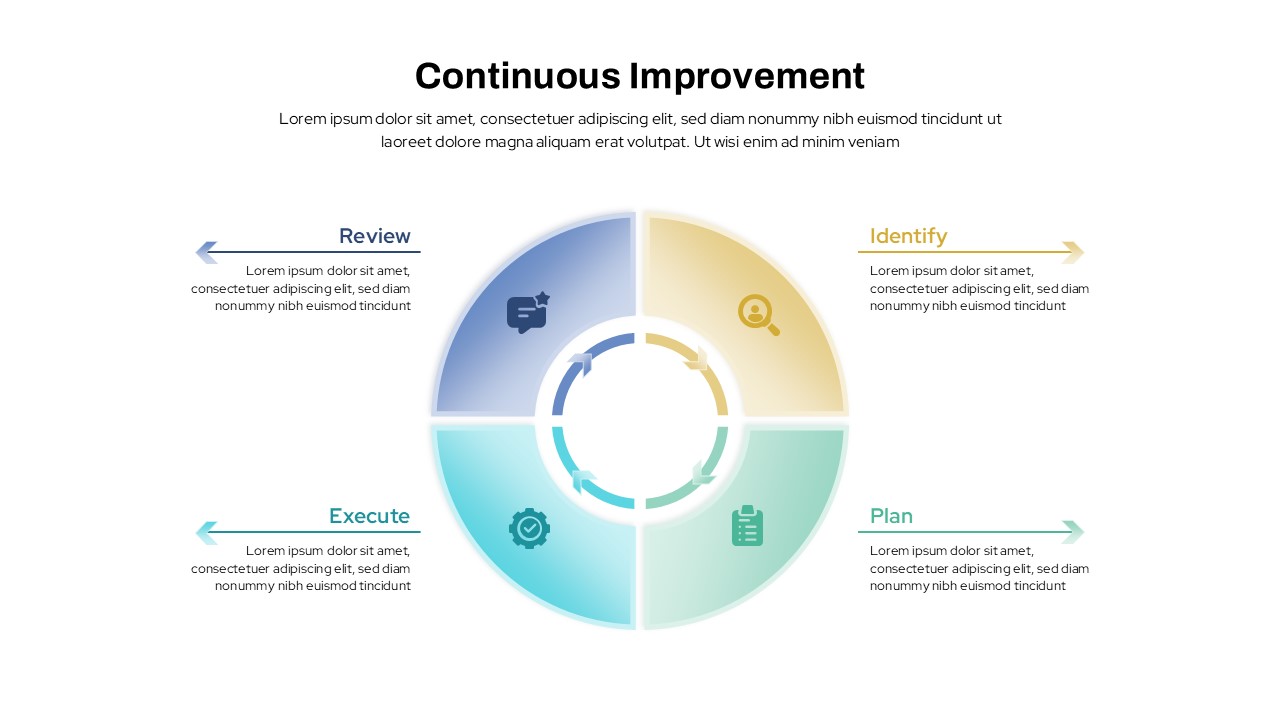
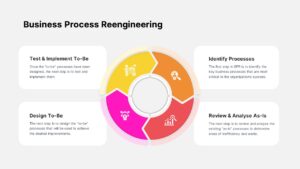
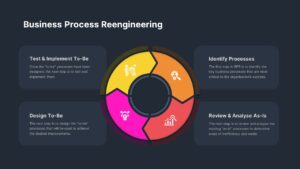
Visualize your process optimization strategy with this Business Process Reengineering cycle diagram, featuring four color-coded segments—Identify Processes, Review & Analyse As-Is, Design To-Be, and Test & Implement To-Be—arranged around a central hub. Each segment is highlighted in vibrant orange, red, magenta, and yellow squares with coordinating pastel strokes, creating a gear-like circular flow that emphasizes iteration and continuous improvement. The clean vector icons and organized content panels on either side allow for concise descriptions of each step, while subtle drop shadows and a neutral background maintain a professional aesthetic and clear focus.
Fully editable in PowerPoint and Google Slides, this master slide offers intuitive placeholders, structured layers, and scalable vector shapes. Easily update the segment titles, adjust color palettes to match your brand guidelines, or replace icons with custom visuals. The circular layout supports data-driven storytelling by allowing users to adjust segment widths or annotate with performance metrics, making it ideal for mapping process efficiency, waste reduction initiatives, or automation roadmaps. Rapid customization empowers teams to iterate on workflows and share updated versions without disrupting slide consistency.
Optimized for high-resolution displays and remote collaboration, this diagram simplifies version control and accelerates slide production. Use it to communicate BPR stages in stakeholder workshops, executive briefings, or training sessions. Its versatility extends beyond reengineering: repurpose the circular framework for quality improvement cycles, risk assessments, agile retrospectives, or project lifecycle overviews. Simply rename the segments and update descriptions to fit any iterative process narrative, ensuring clear, impactful presentations that drive alignment and informed decision-making.
Who is it for
Operations managers, process improvement teams, business analysts, and quality consultants will find this slide invaluable for mapping reengineering initiatives, presenting to stakeholders, or training teams on efficiency-driven transformations.
Other Uses
Repurpose this cyclic layout for risk management processes, quality improvement frameworks, agile retrospectives, or product lifecycle overviews by updating the segment titles and descriptions.
Login to download this file

Item ID
SB03376
Related Templates

Business Process Reengineering Diagram Template for PowerPoint & Google Slides
Circular
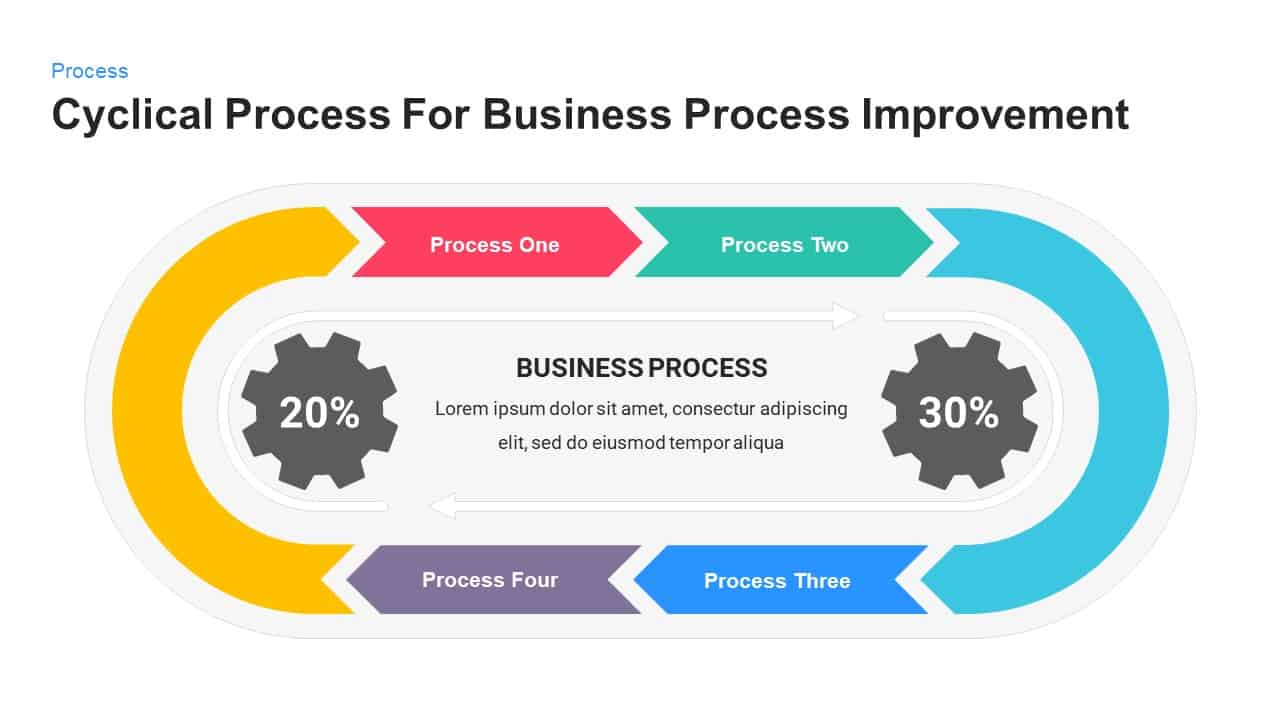
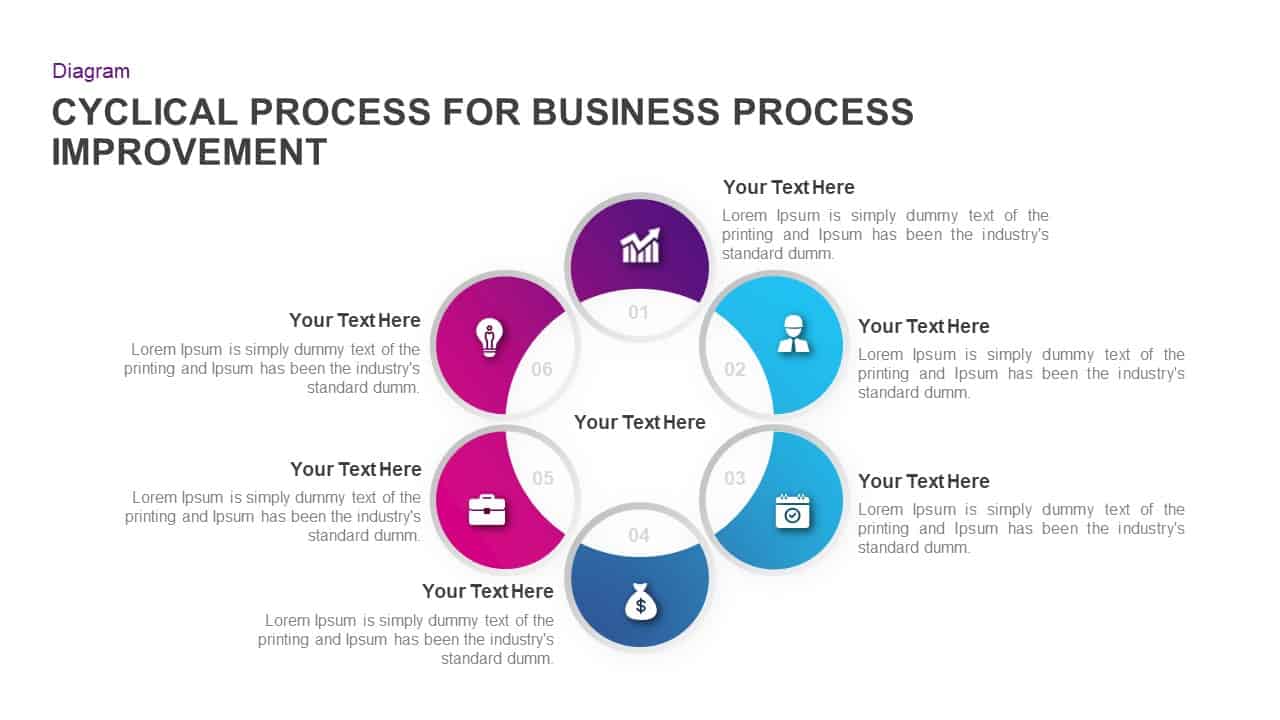
Business Process Improvement Cycle Template for PowerPoint & Google Slides
Process
Business Process Improvement Cycle Template for PowerPoint & Google Slides
Circular
Business Process Analysis Cycle Diagram Template for PowerPoint & Google Slides
Business Strategy
Modern Five-Stage Cycle Process Diagram Template for PowerPoint & Google Slides
Process
Performance Review Process Management Cycle template for PowerPoint & Google Slides
Employee Performance
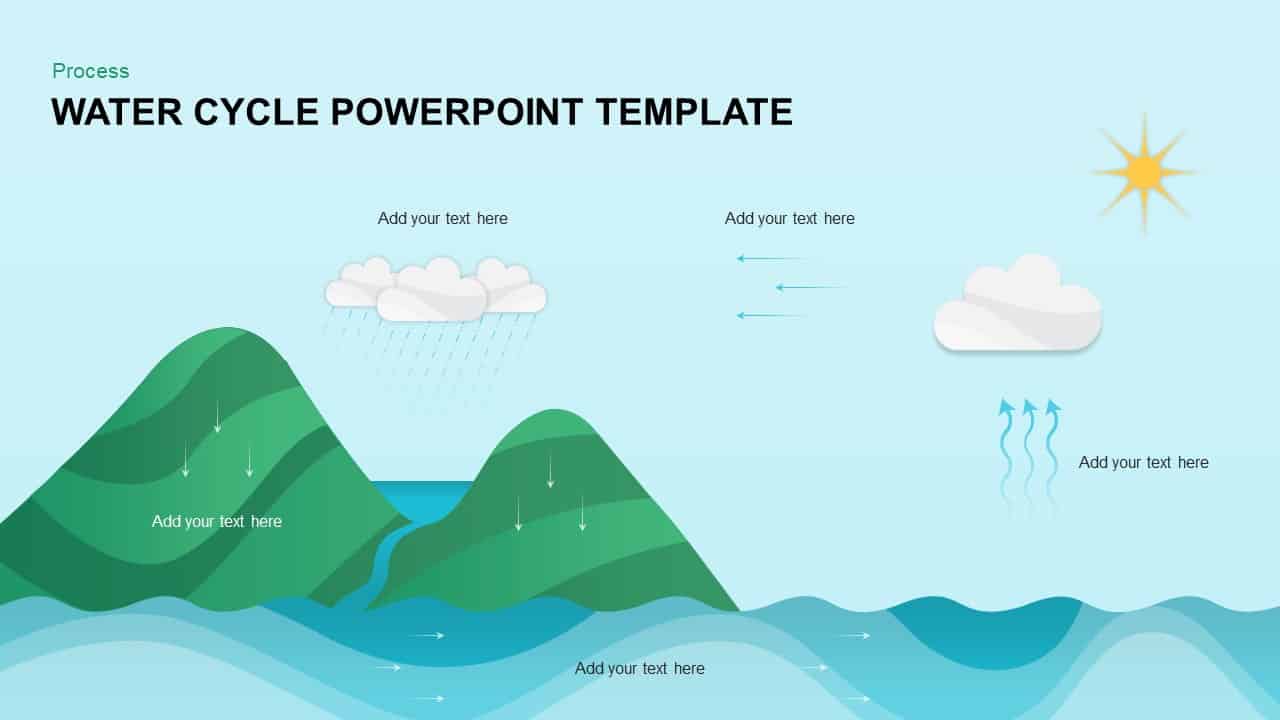
Water Cycle Process Infographic Template for PowerPoint & Google Slides
Process
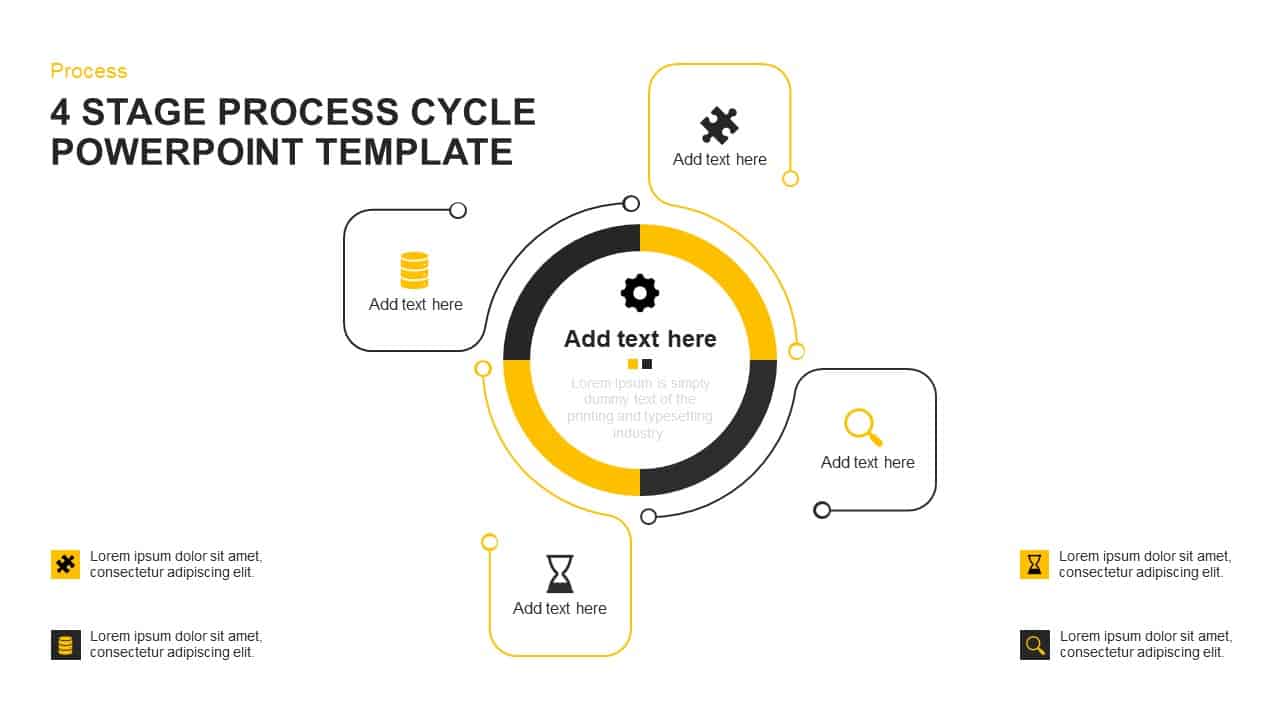
Four-Stage Cycle Process Diagram Template for PowerPoint & Google Slides
Process
Four-Stage Process Cycle Variations Pack Template for PowerPoint & Google Slides
Process
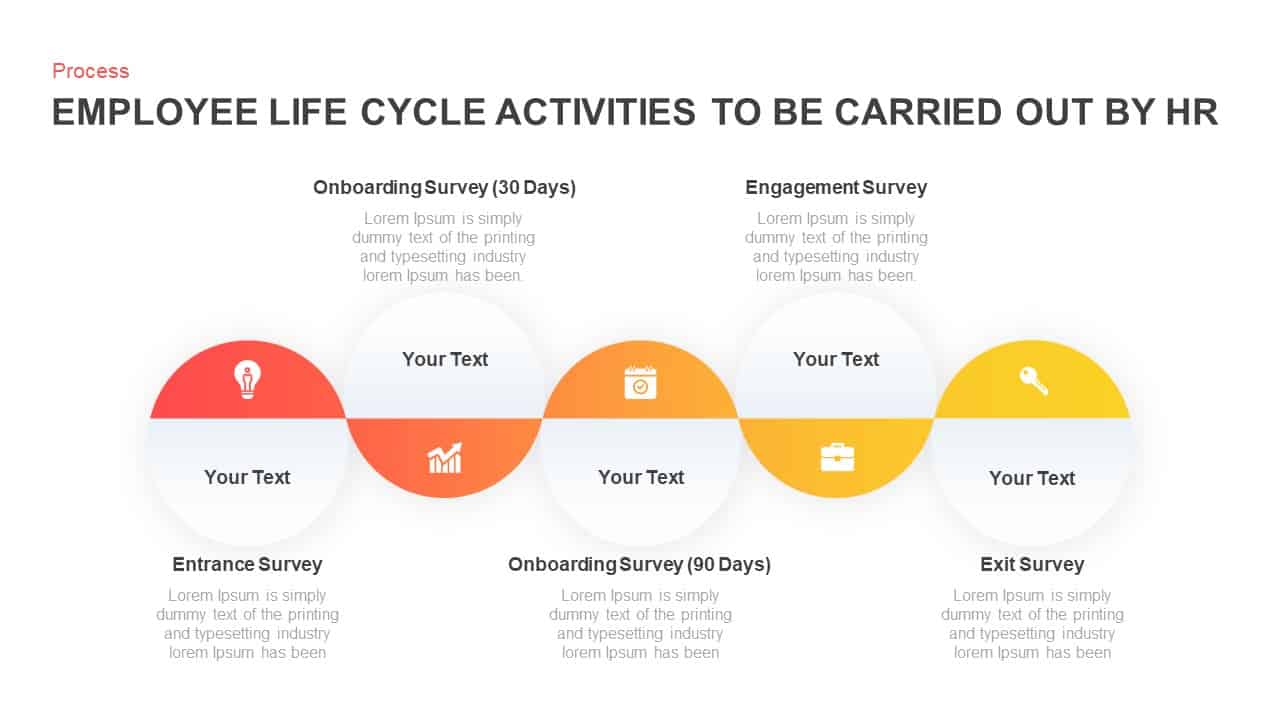
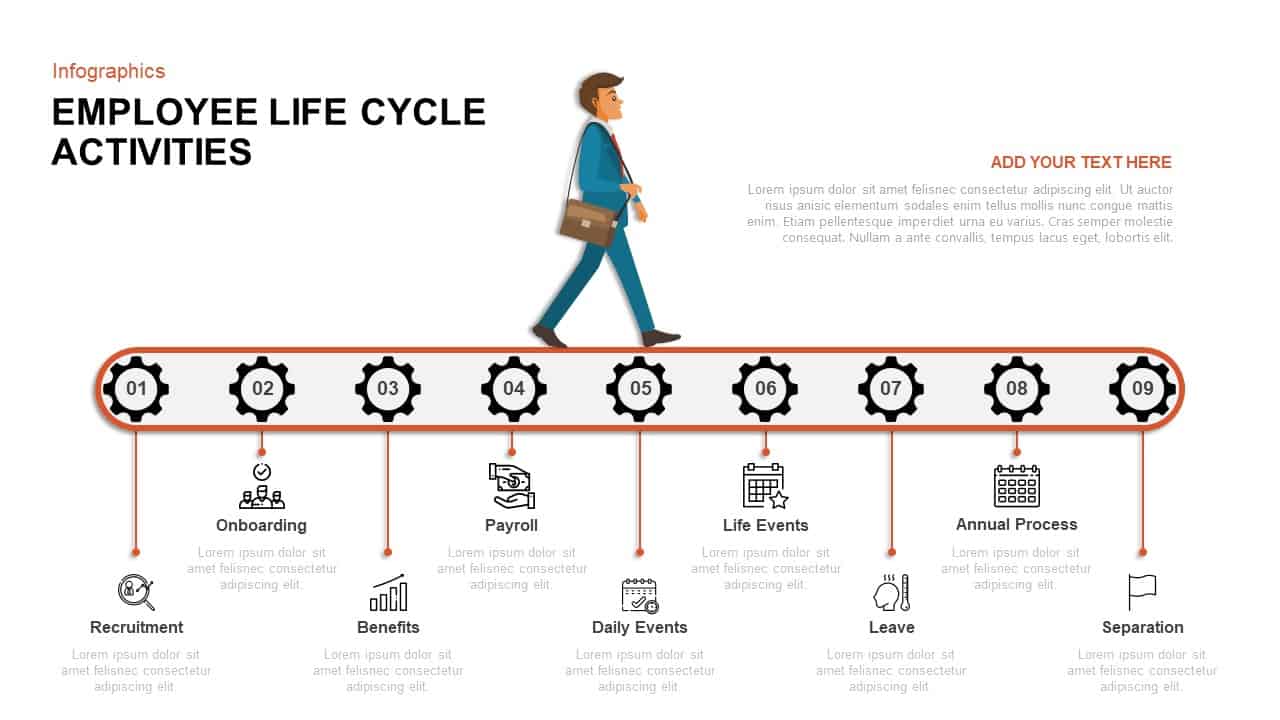
Employee Life Cycle Activities Process Template for PowerPoint & Google Slides
Employee Performance

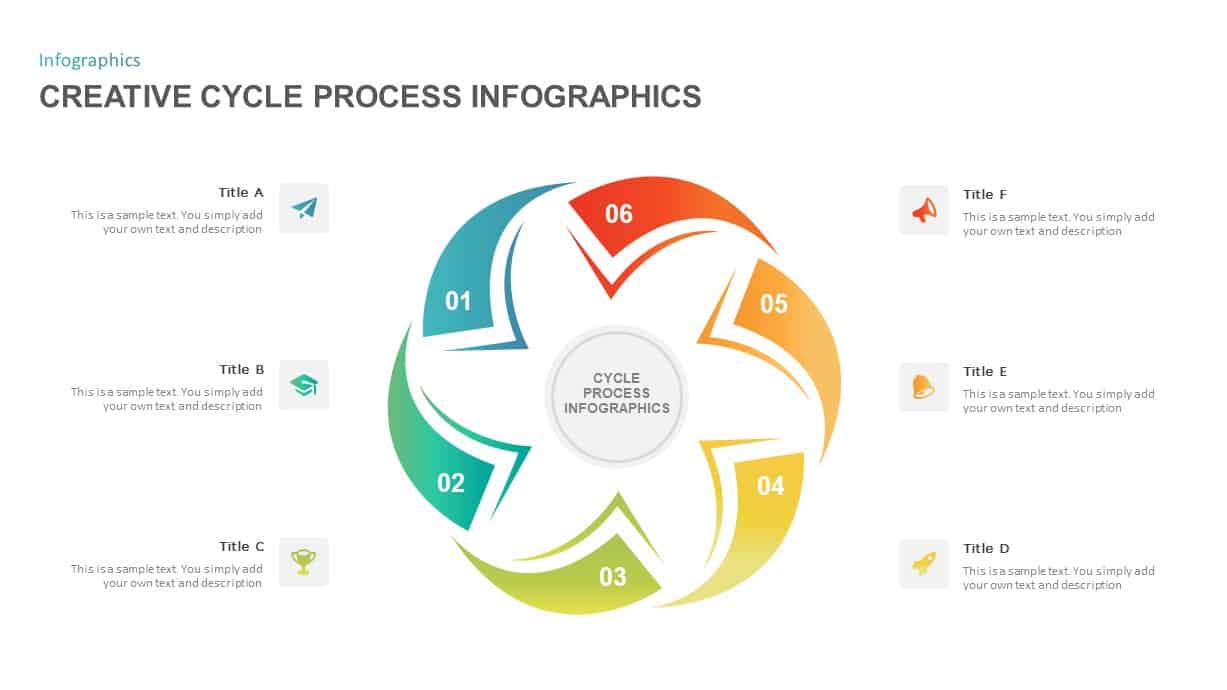
Creative Cycle Process Infographics Template for PowerPoint & Google Slides
Process
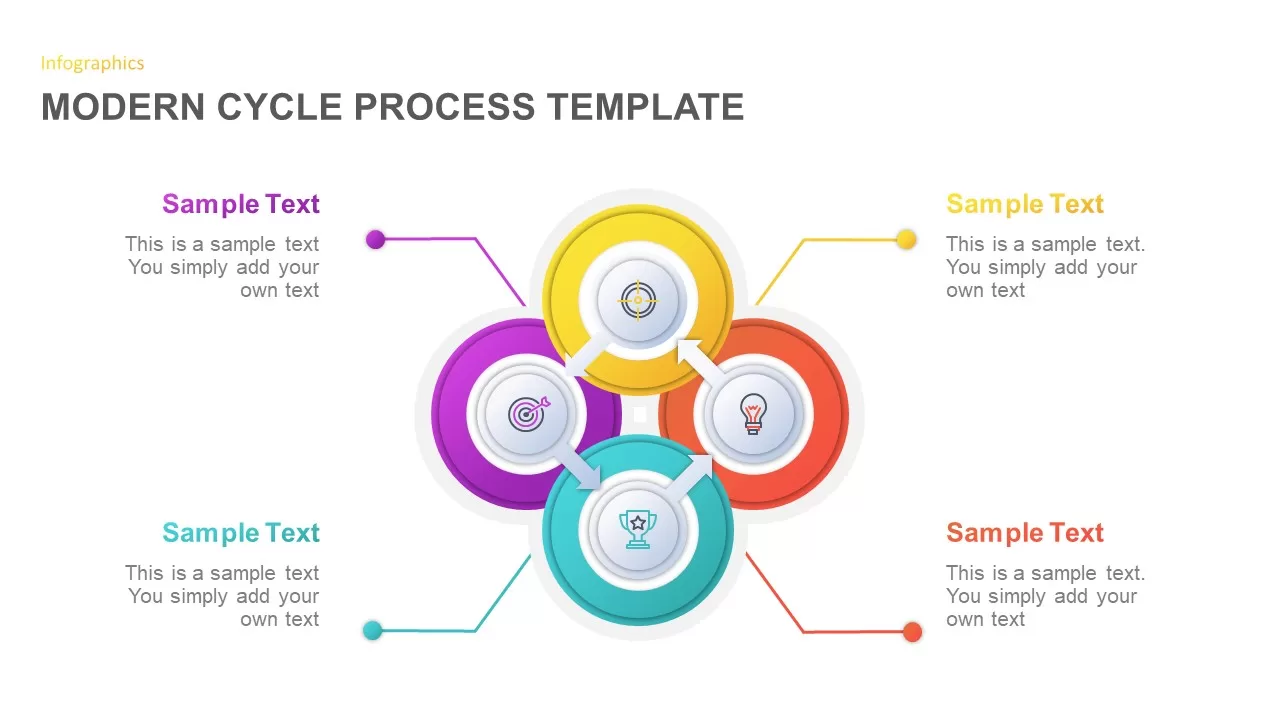
Modern Cycle Process Template for PowerPoint & Google Slides
Business Proposal
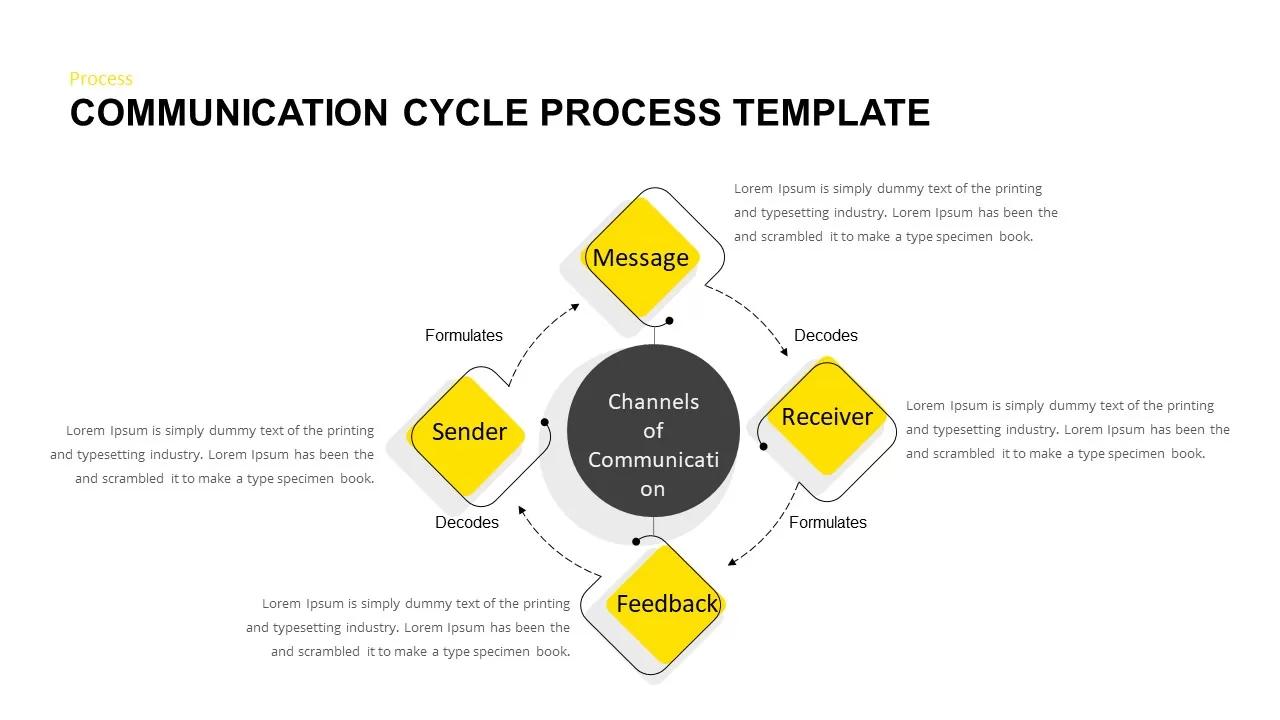
Communication Cycle Process Diagram template for PowerPoint & Google Slides
Business
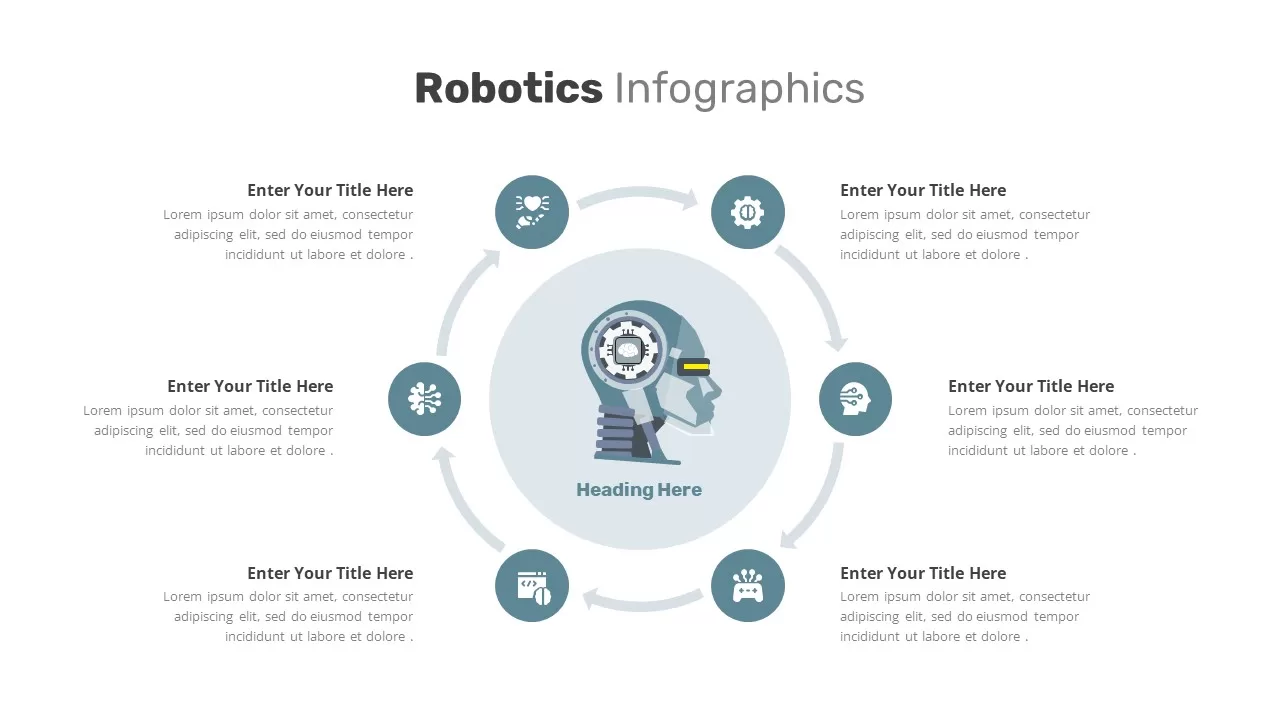
Robotics Process Cycle Infographic Template for PowerPoint & Google Slides
Process
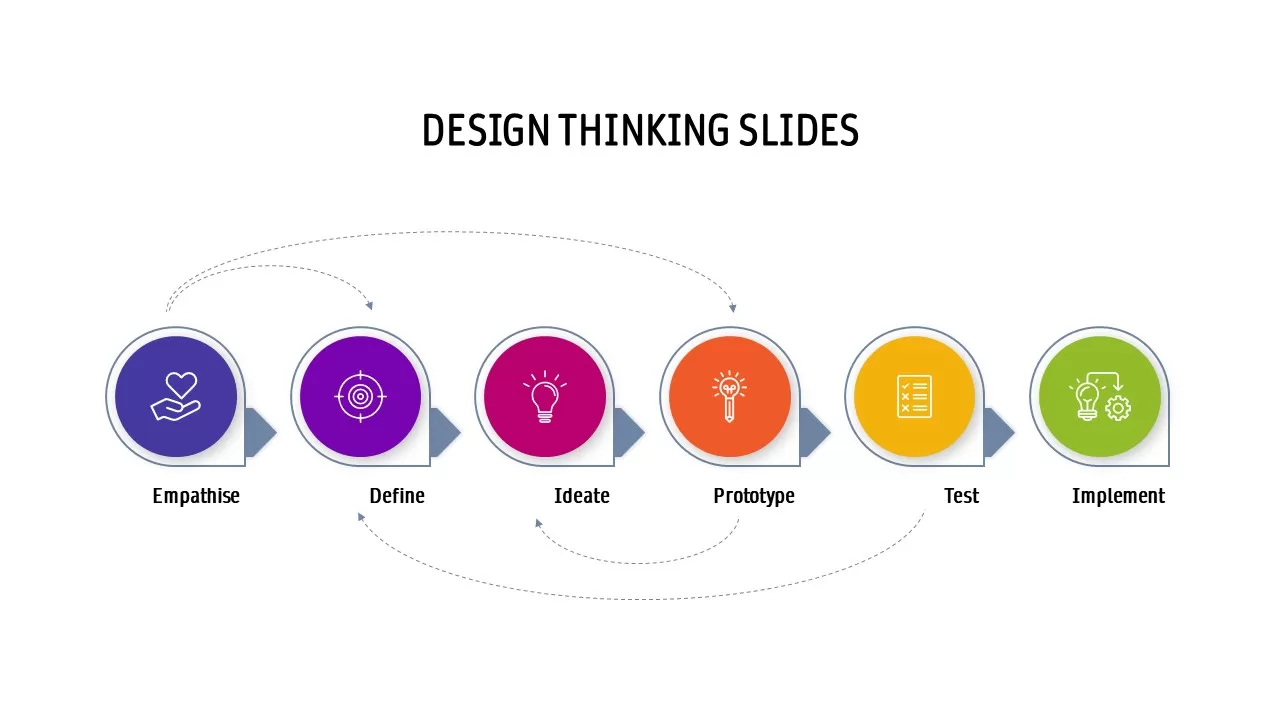
Design Thinking Process Cycle Slide Template for PowerPoint & Google Slides
Process
Change Management Process Cycle Diagram Template for PowerPoint & Google Slides
Process
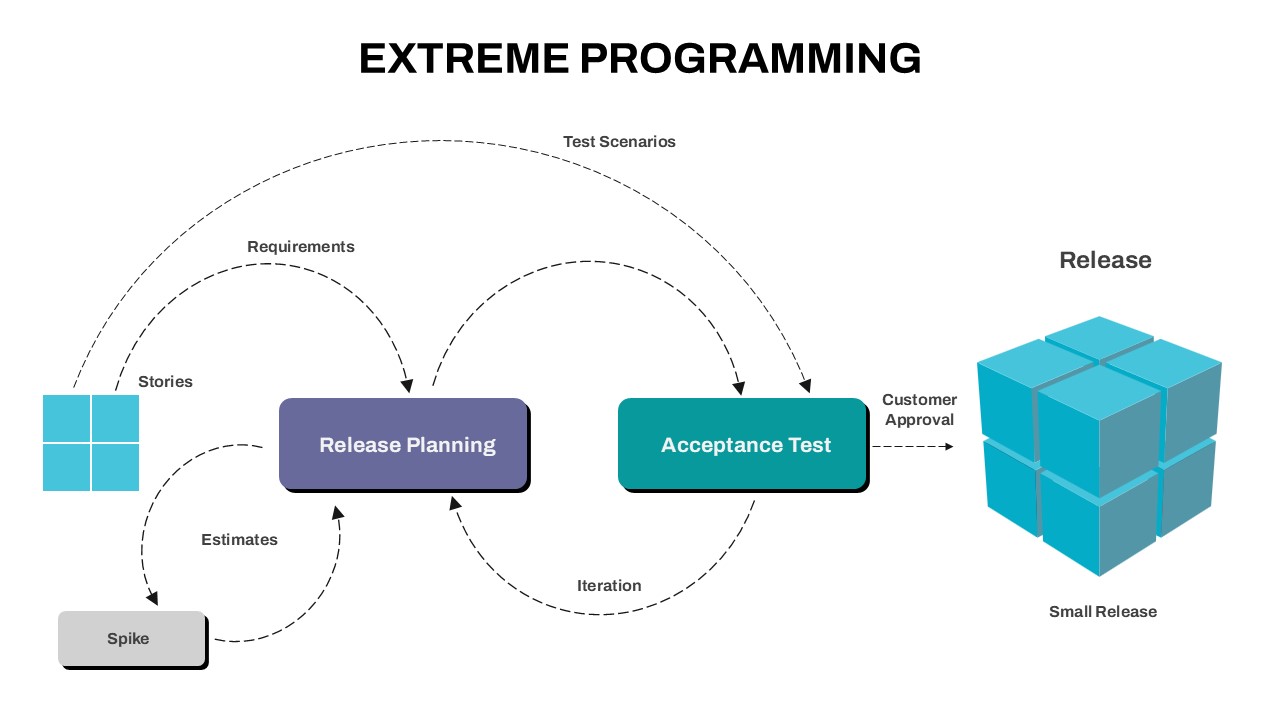
Extreme Programming Process Cycle Template for PowerPoint & Google Slides
Software Development
Modern Cycle Process for PowerPoint & Google Slides
Infographics
Seeds Growth Cycle Business Model Template for PowerPoint & Google Slides
Process
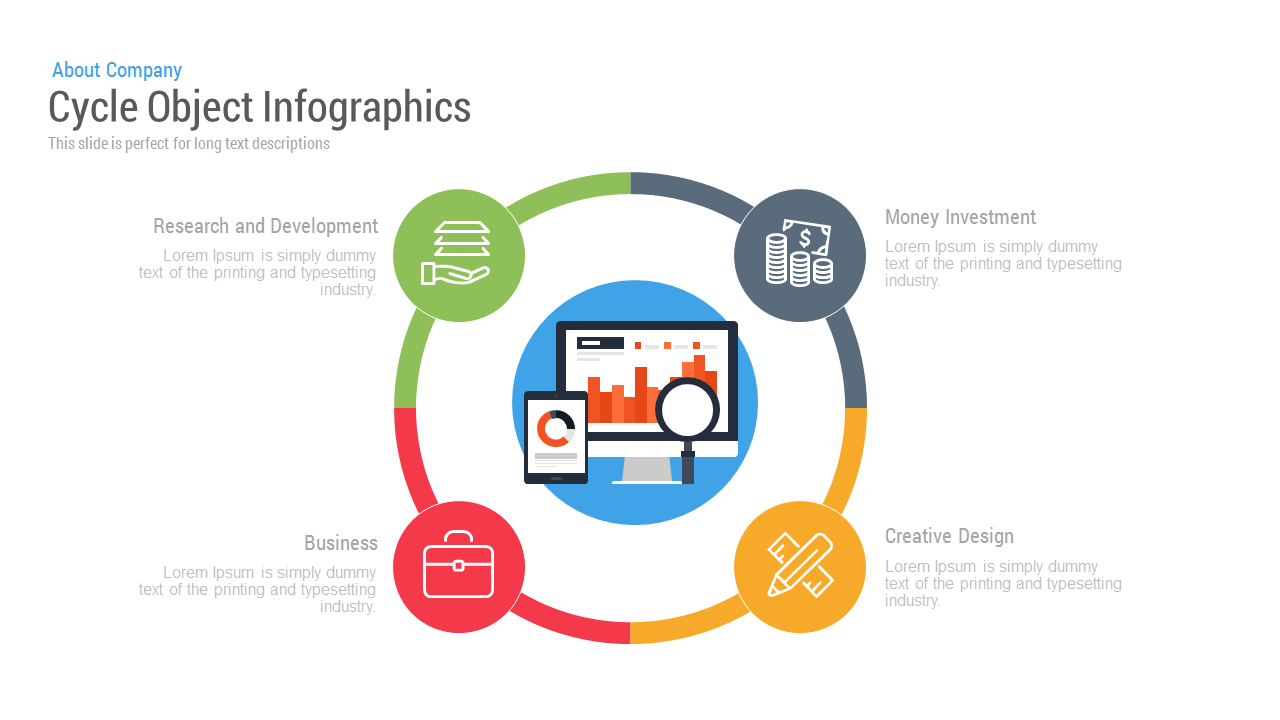
Free Cycle Object Infographics template for PowerPoint & Google Slides
Process
Free
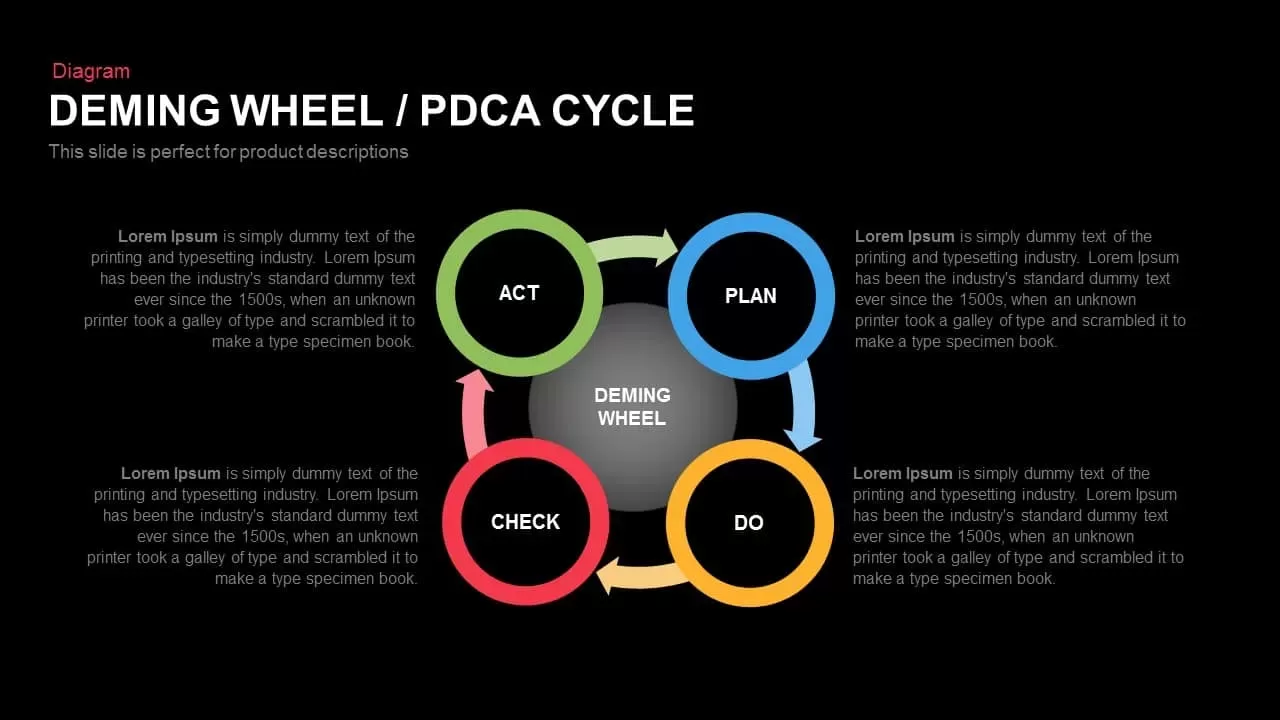
Deming Wheel PDCA Cycle Diagram Template for PowerPoint & Google Slides
Business Plan
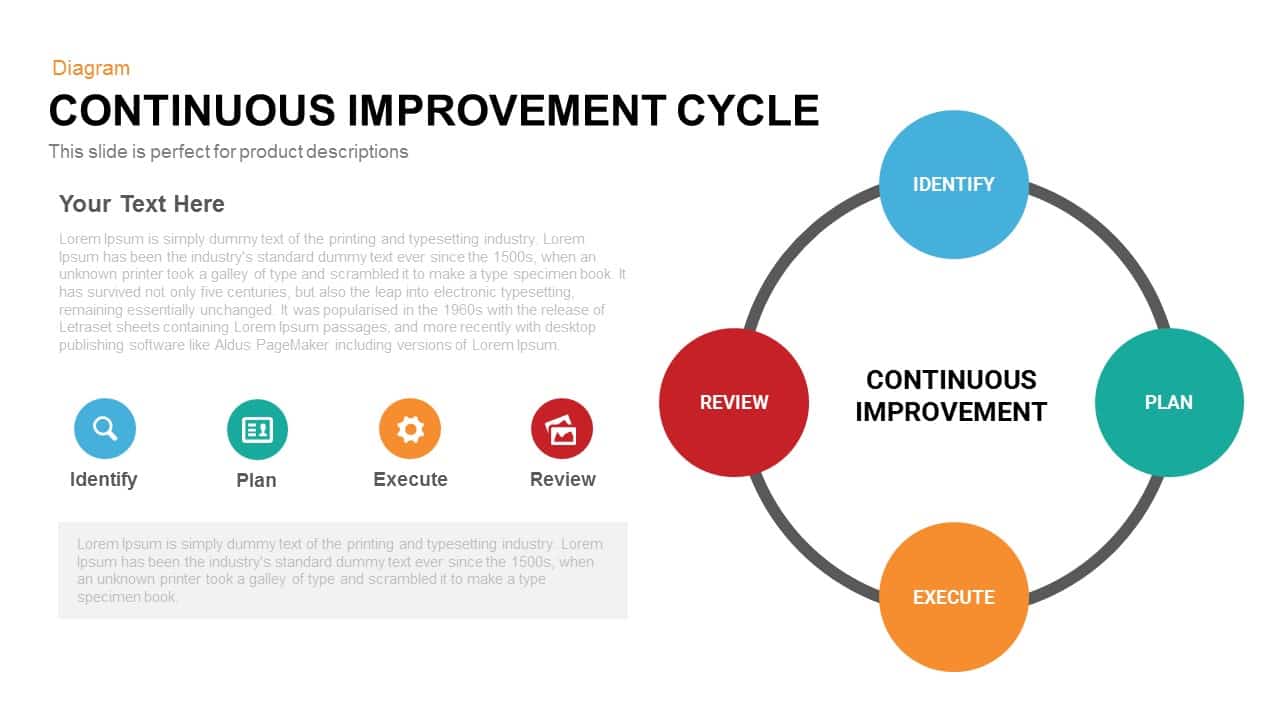
Continuous Improvement Cycle Diagram Template for PowerPoint & Google Slides
Circular
Six-Stage Circular Cycle Diagram Template for PowerPoint & Google Slides
Process
Four-Point Arrow Cycle Diagram Template for PowerPoint & Google Slides
Arrow

Data-Driven Marketing Cycle Diagram Template for PowerPoint & Google Slides
Customer Journey
Eight-Step Sales Cycle Diagram Template for PowerPoint & Google Slides
Process
Software Development Life Cycle Diagram Template for PowerPoint & Google Slides
Circular
3, 4 & 5 Circular Stages Cycle Diagram Deck Template for PowerPoint & Google Slides
Circular
Product Life Cycle Infographics template for PowerPoint & Google Slides
Business
Data Migration Life Cycle Curved Diagram Template for PowerPoint & Google Slides
Process
Employee Life Cycle Activities Template for PowerPoint & Google Slides
Timeline
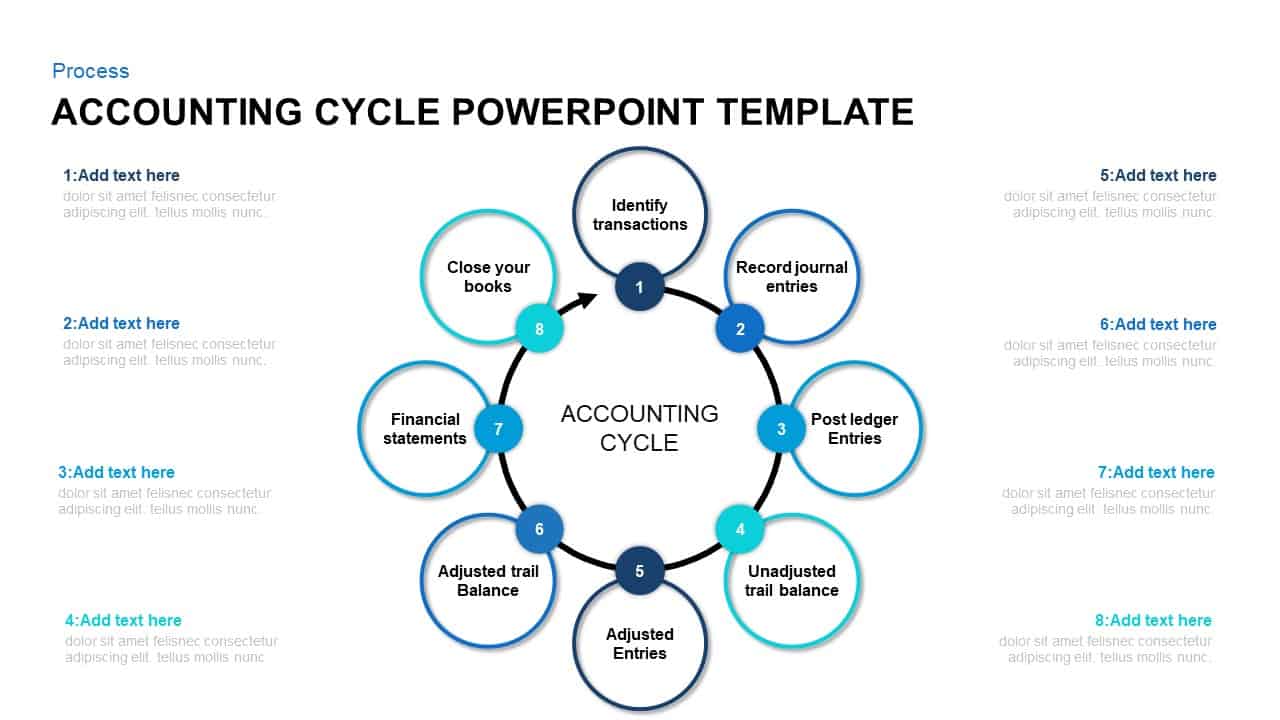
8-Step Circular Accounting Cycle Diagram Template for PowerPoint & Google Slides
Accounting
Multi-Style Project Life Cycle Diagram Template for PowerPoint & Google Slides
Process
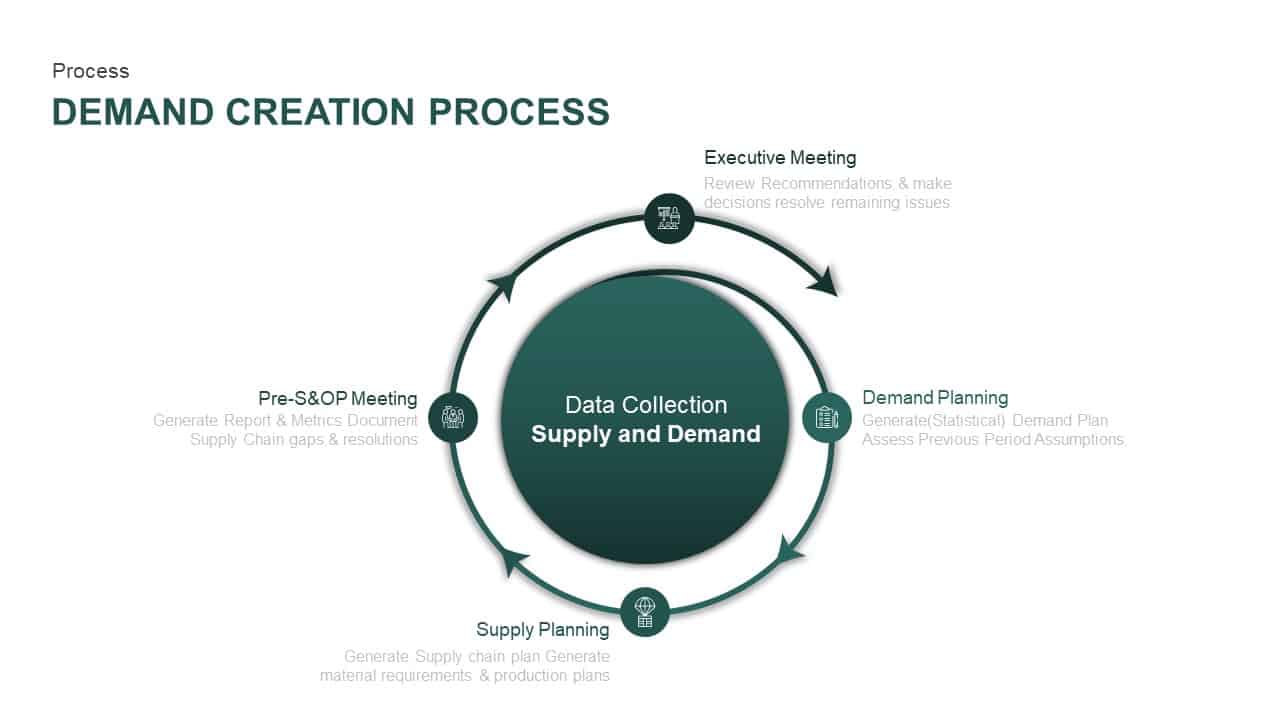
Supply and Demand Creation Cycle Diagram Template for PowerPoint & Google Slides
Process
Strategic ADL Matrix by Industry Life Cycle & Position Template for PowerPoint & Google Slides
Business Strategy
Modern 6-Step Cycle Diagram Slide Deck Template for PowerPoint & Google Slides
Process
Corporate Product Life Cycle Diagram Template for PowerPoint & Google Slides
Process
Plan Do Check Act PDCA Cycle Infographic Template for PowerPoint & Google Slides
Process
Enterprise Risk Management Cycle Diagram Template for PowerPoint & Google Slides
Process
4MAT Learning Cycle Circular Diagram Template for PowerPoint & Google Slides
Circular
4-Step Circular PDCA Cycle Diagram Template for PowerPoint & Google Slides
Process
Continuous Improvement Cycle Diagram Template for PowerPoint & Google Slides
Process
7-Step Virtuous Economy Cycle Diagram Template for PowerPoint & Google Slides
Process
Gibbs Reflective Cycle Overview Template for PowerPoint & Google Slides
Process
Concentric Circular Arrow Cycle Diagram Template for PowerPoint & Google Slides
Process
Dual-Stage Circular Arrow Cycle Template for PowerPoint & Google Slides
Process
Three-Segment Circular Arrow Cycle Template for PowerPoint & Google Slides
Circular
Four-Segment Circular Arrow Cycle Template for PowerPoint & Google Slides
Circular
Six-Segment Circular Arrow Cycle Template for PowerPoint & Google Slides
Circular
PDCA Cycle Infographic with Four Stages Template for PowerPoint & Google Slides
Process
PDCA Plan Do Check Act Cycle Infographic Template for PowerPoint & Google Slides
Process
PDCA Four-Stage Cycle Infographic Template for PowerPoint & Google Slides
Process
Hexagonal Design Thinking Cycle Template for PowerPoint & Google Slides
Process
3R Waste Management Cycle Diagram Template for PowerPoint & Google Slides
Circular
Strategic Dialogue Model Cycle Template for PowerPoint & Google Slides
Circular
3R Waste Management Cycle Overview template for PowerPoint & Google Slides
Process
Release Management Cycle Circular Diagram Template for PowerPoint & Google Slides
Software Development
Iterative Strategic Planning Cycle Template for PowerPoint & Google Slides
Business Strategy
Cycle Chart Template for PowerPoint & Google Slides
Circular
Free Time Management Clock Cycle Diagram Template for PowerPoint & Google Slides
Process
Free
Three-Phase Triangle Cycle Diagram Template for PowerPoint & Google Slides
Infographics
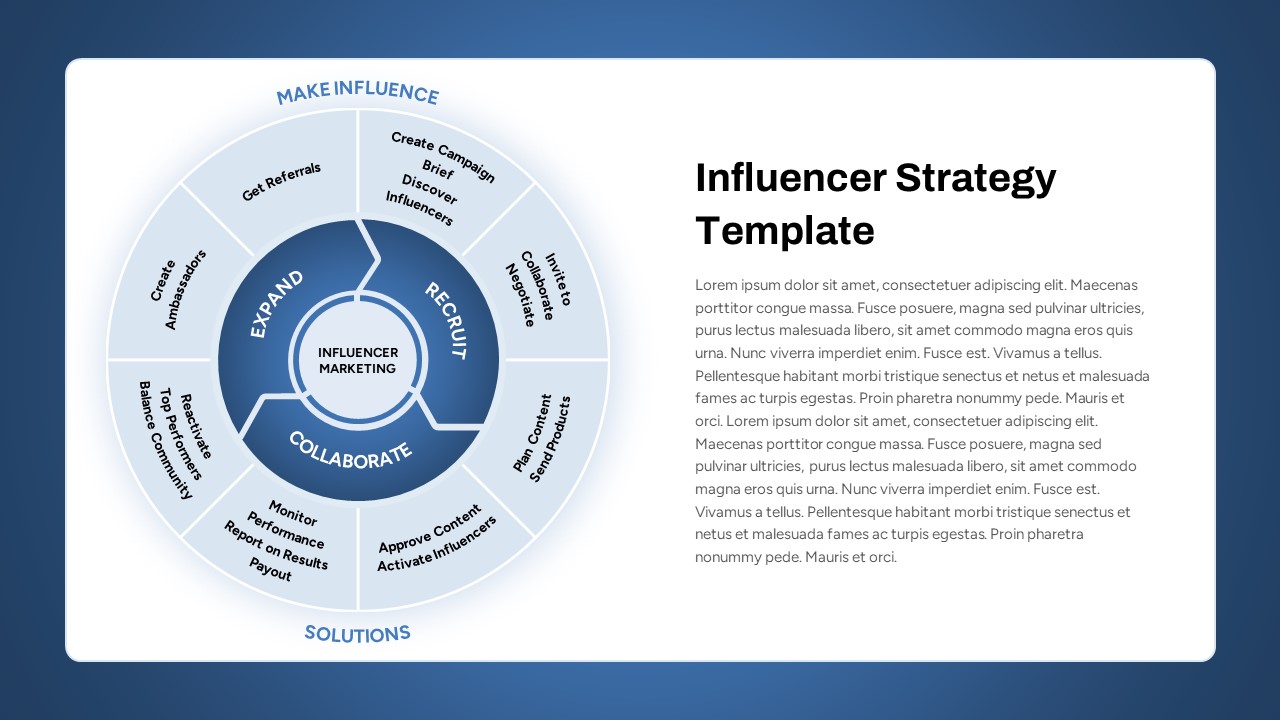
Influencer Marketing Cycle Strategy Template for PowerPoint & Google Slides
Circular
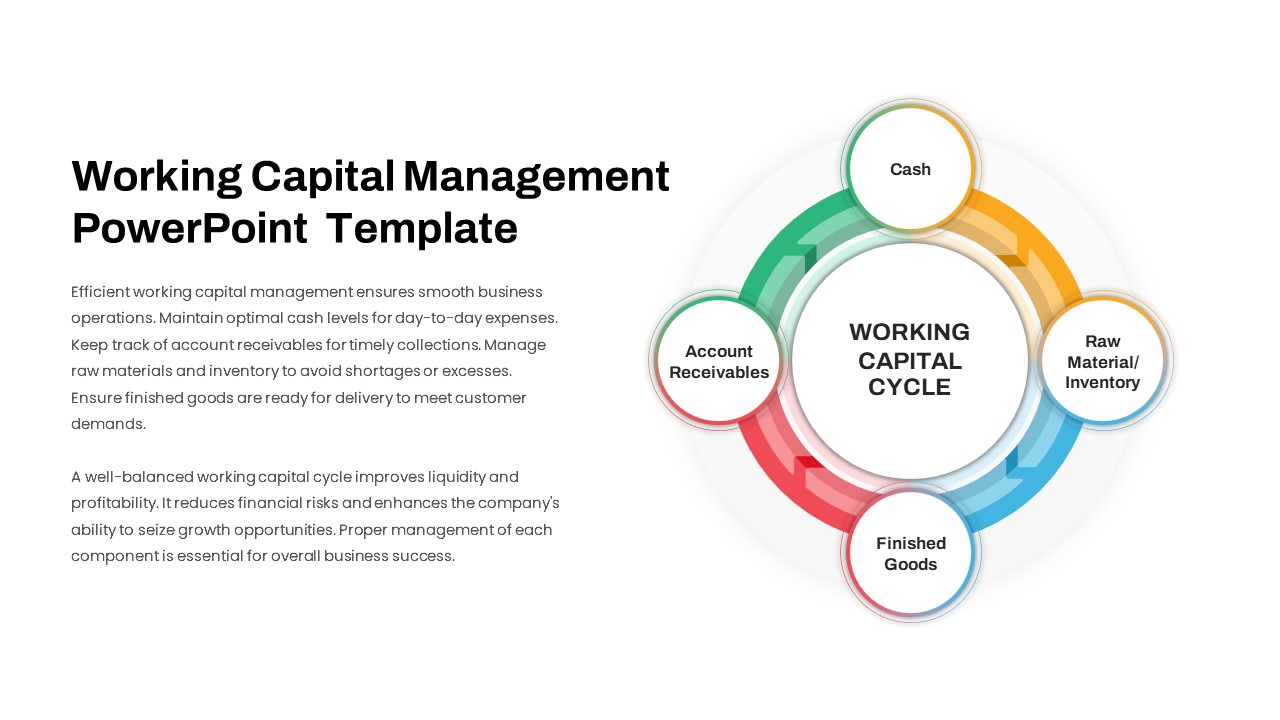
Working Capital Cycle Diagram Template for PowerPoint & Google Slides
Circular
Gartner Hype Cycle Adoption Curve Diagram Template for PowerPoint & Google Slides
Infographics
Colorful Startup Financing Cycle Diagram Template for PowerPoint & Google Slides
Finance
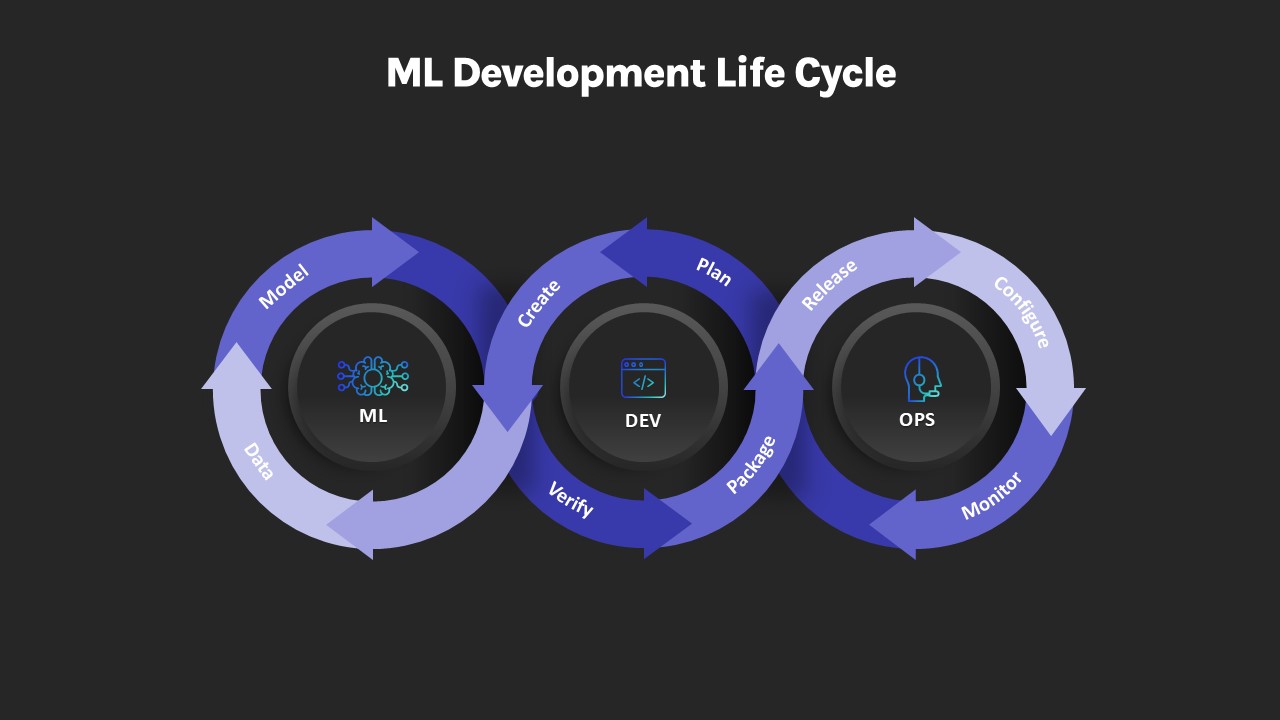
ML Development Life Cycle Diagram Template for PowerPoint & Google Slides
Machine Learning
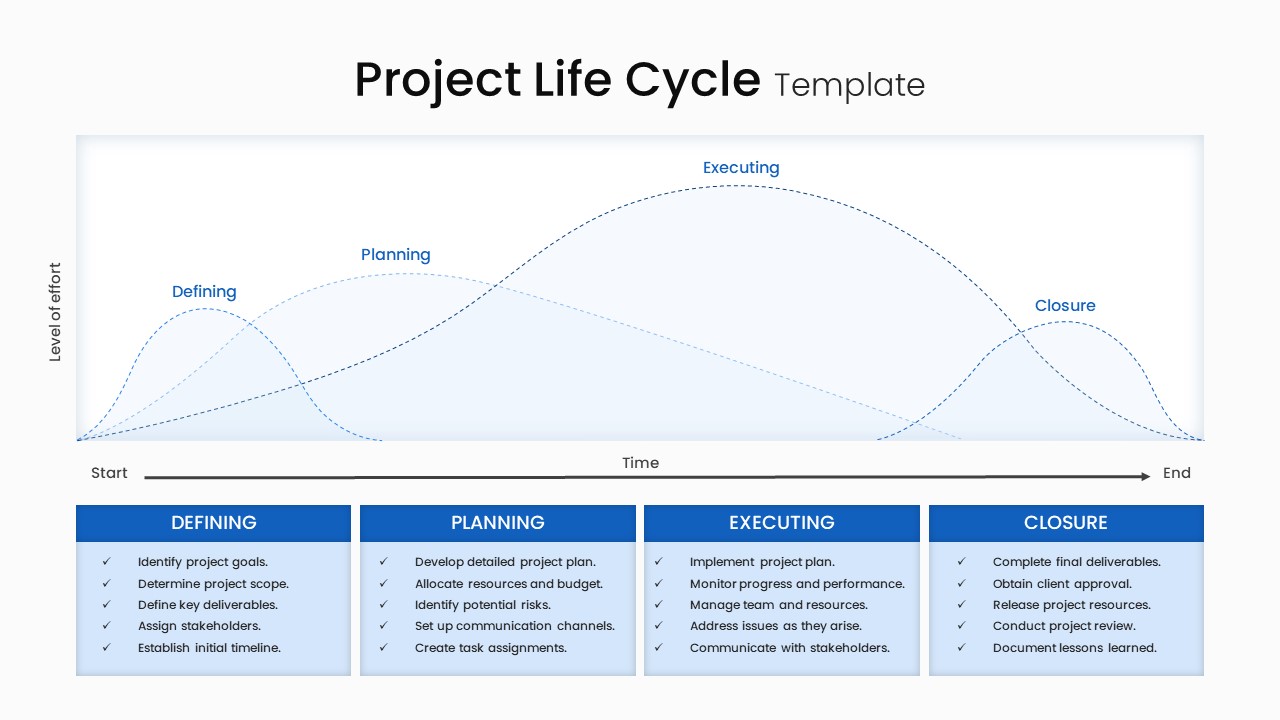
Project Life Cycle Workflow Diagram Template for PowerPoint & Google Slides
Process
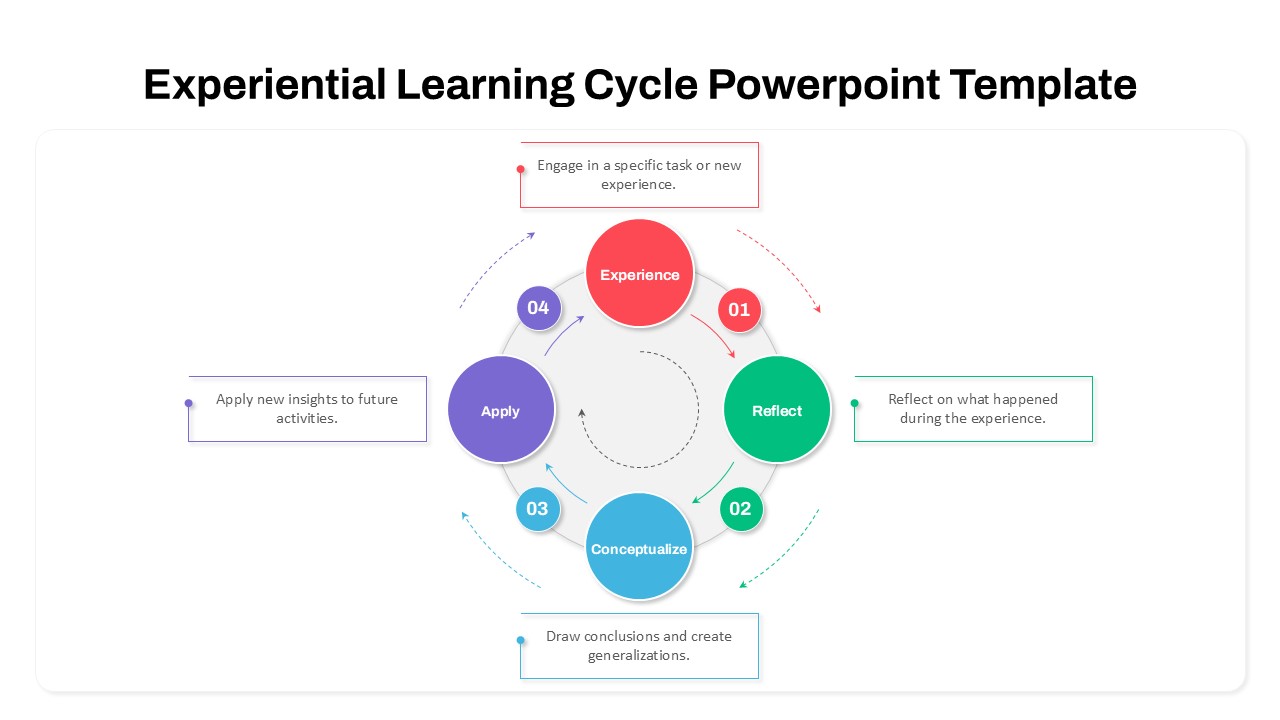
Experiential Learning Cycle Diagram Template for PowerPoint & Google Slides
Circular
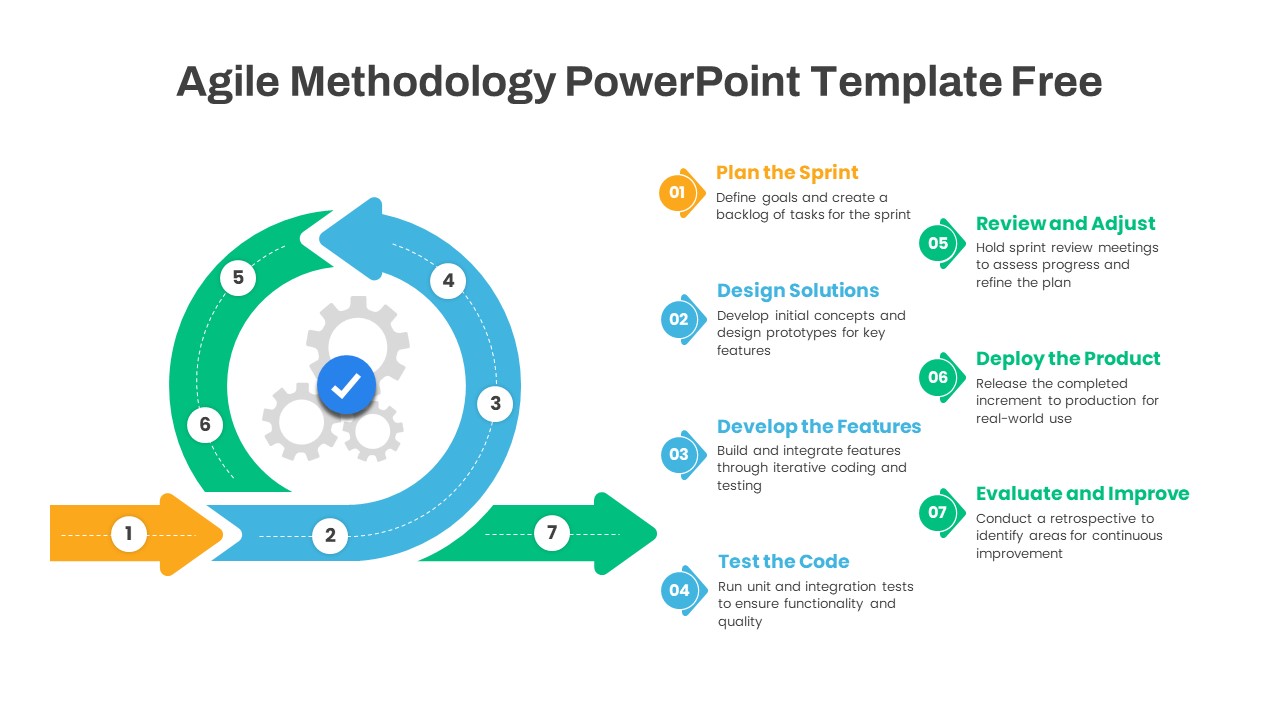
Agile Methodology Cycle Diagram Template for PowerPoint & Google Slides
Project
Free
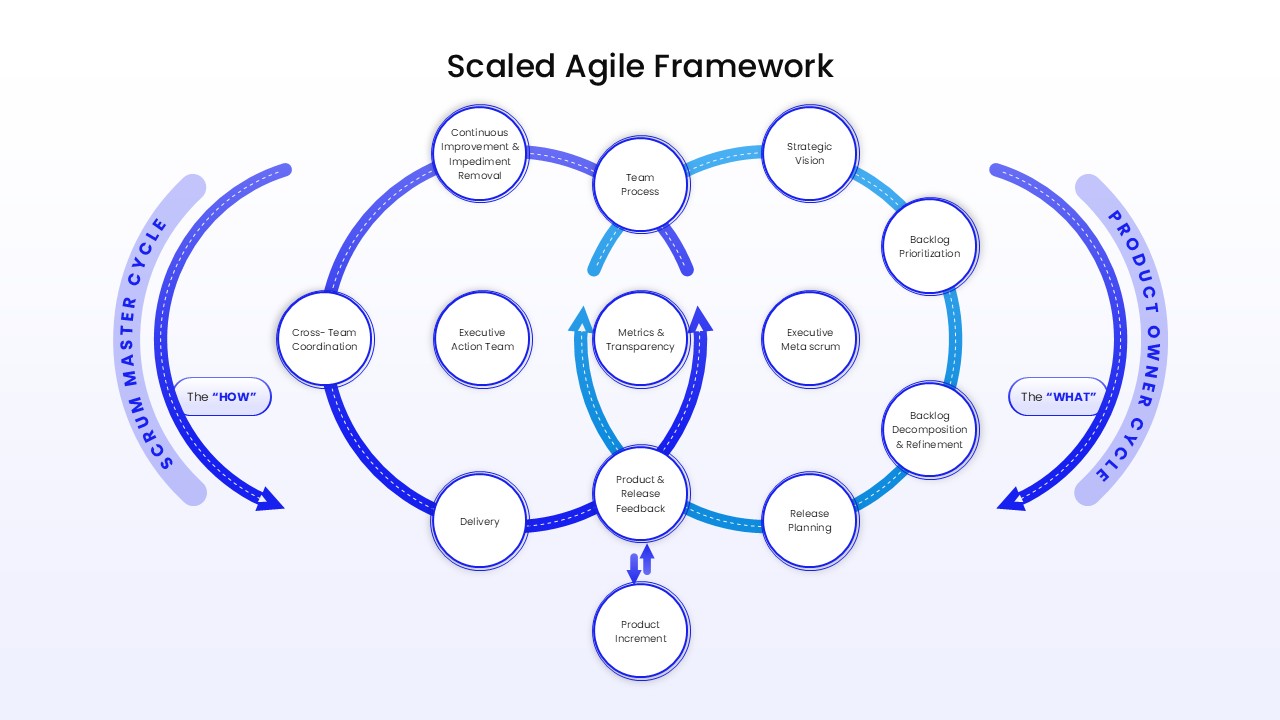
Two-Cycle Scaled Agile Framework Template for PowerPoint & Google Slides
Scrum
Flywheel Growth Cycle Diagram Template for PowerPoint & Google Slides
Circular
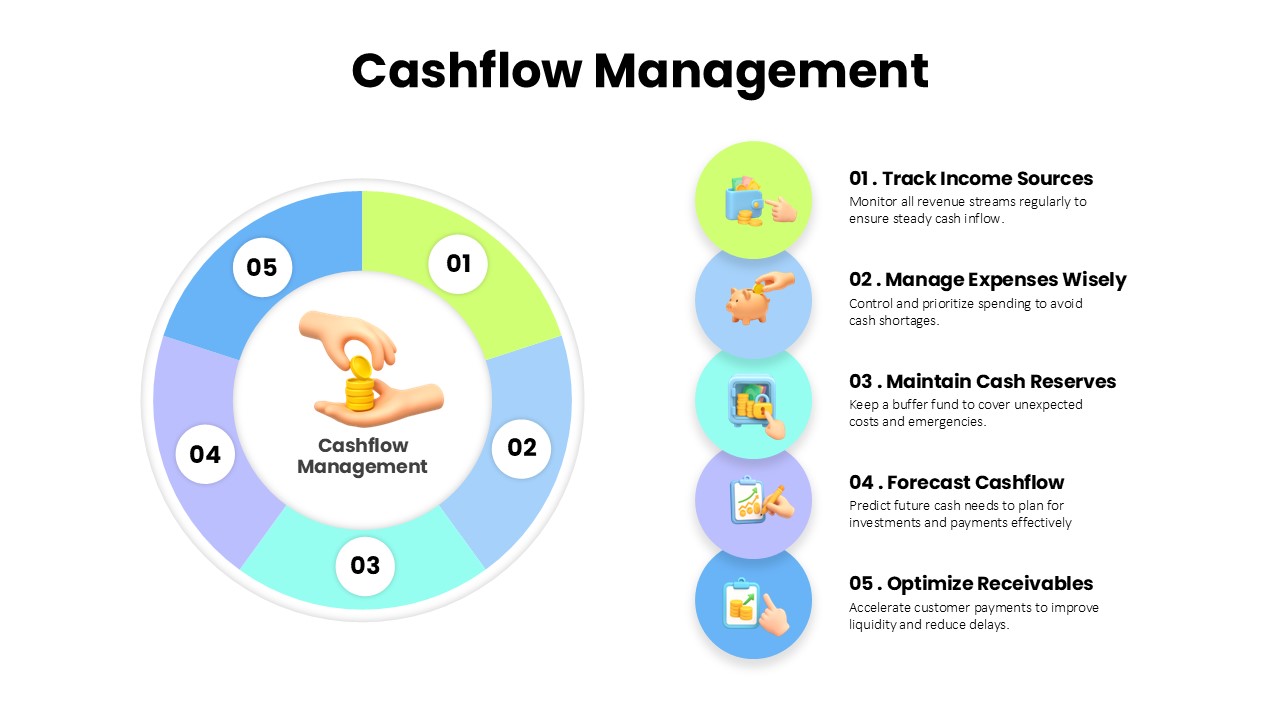
Cashflow Management Cycle Diagram Template for PowerPoint & Google Slides
Finance
Continuous Improvement Cycle Diagram Template for PowerPoint & Google Slides
Process
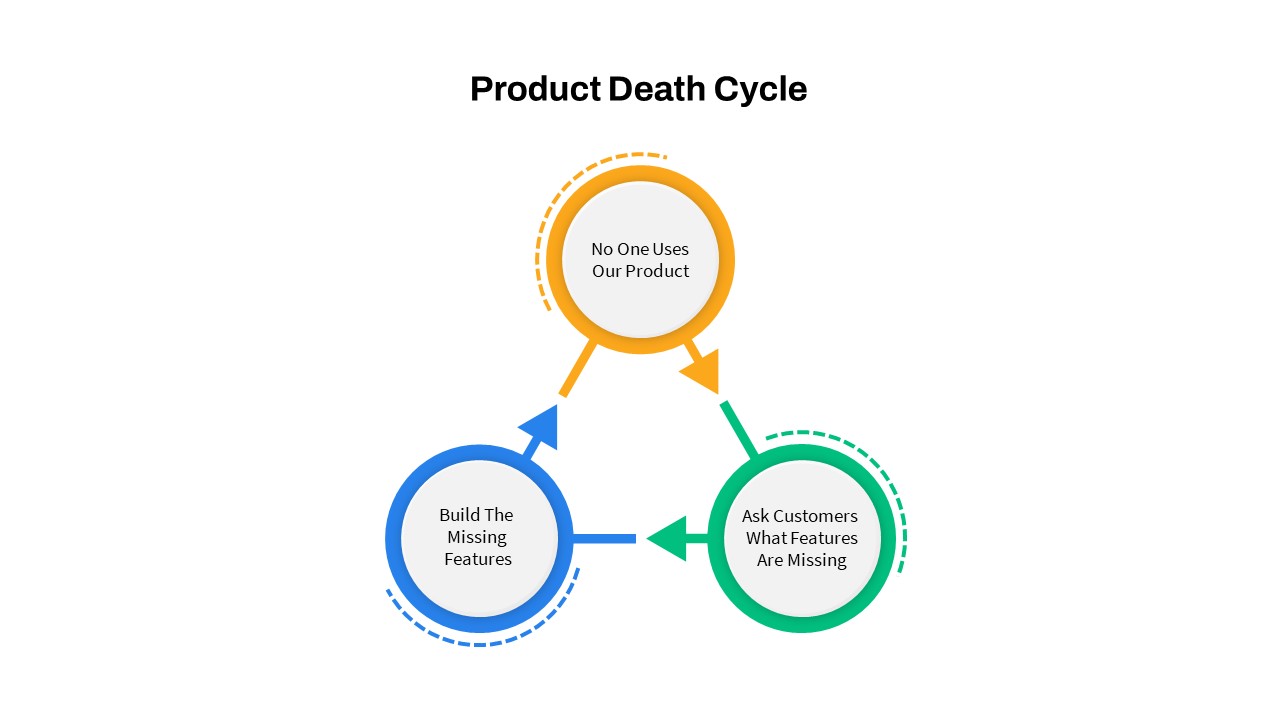
Product Death Cycle Diagram Slide for PowerPoint & Google Slides
Circular
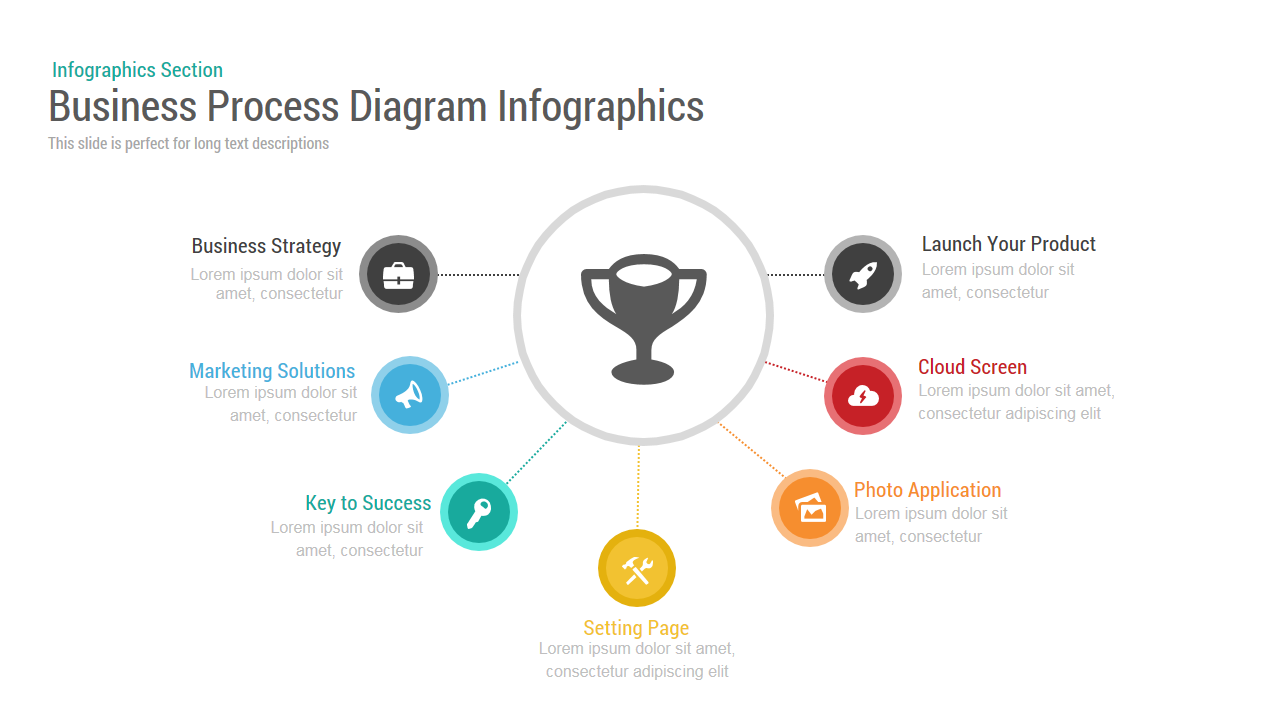
Business Process Diagram template for PowerPoint & Google Slides
Process
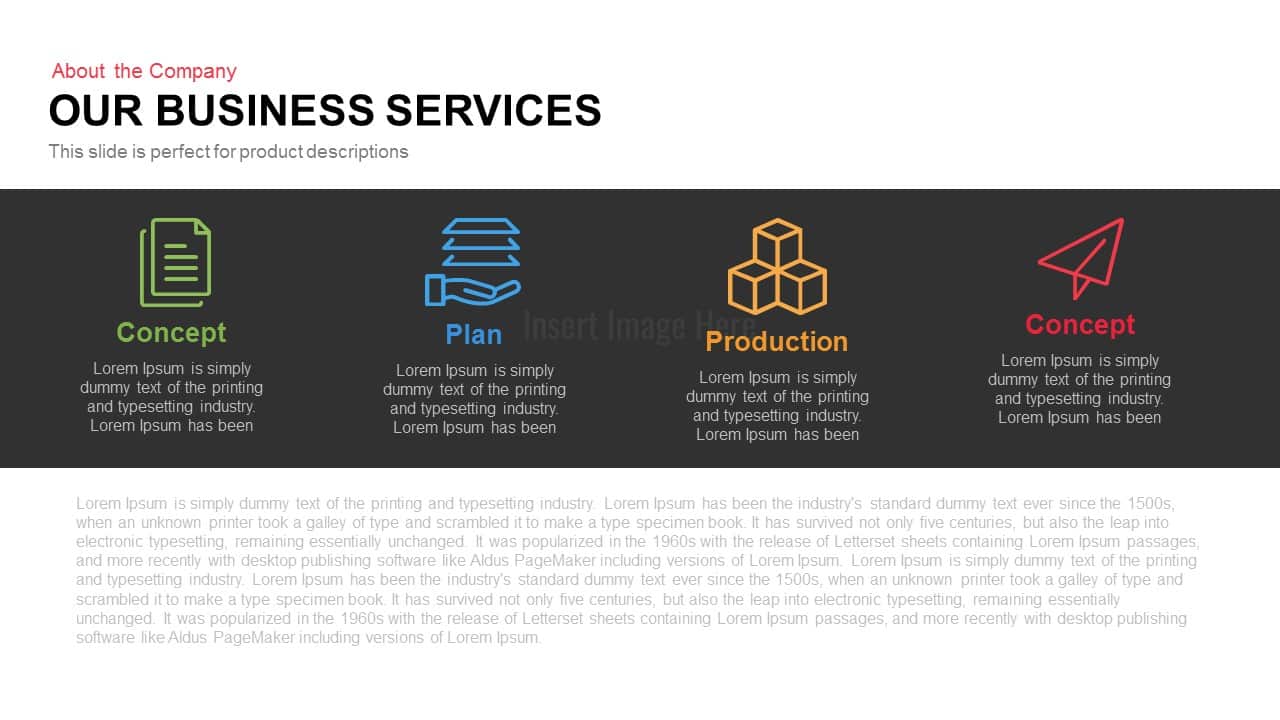
Business Services 4-Step Process Template for PowerPoint & Google Slides
Process
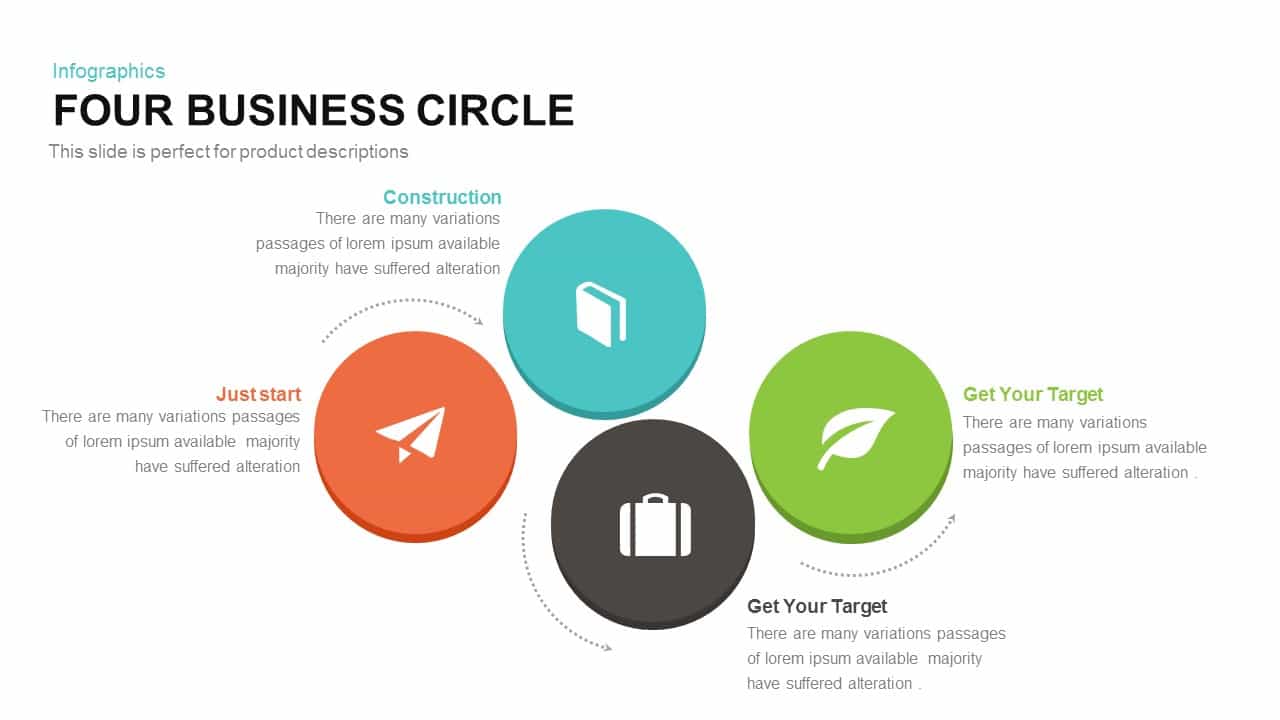
Four-Circle Business Process Infographic Template for PowerPoint & Google Slides
Circular
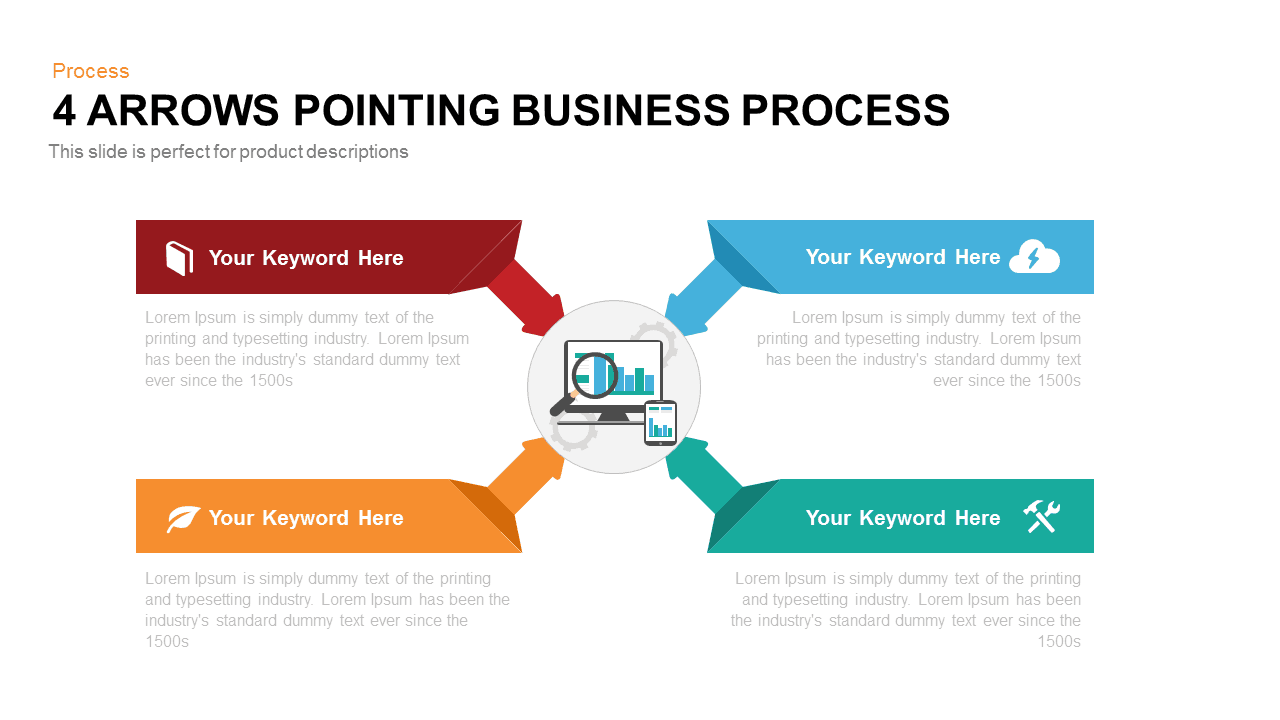
Four Arrows Business Process Diagram template for PowerPoint & Google Slides
Process
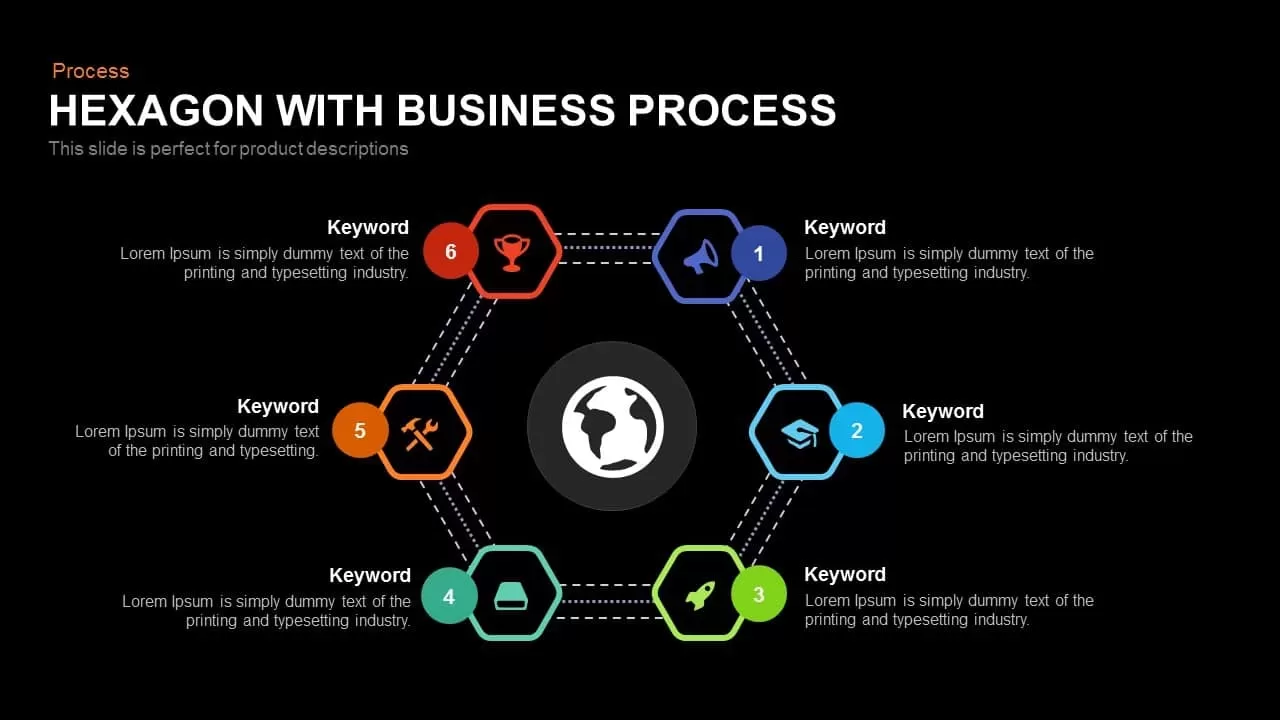
Global Hexagon Six-Step Business Process Template for PowerPoint & Google Slides
Process
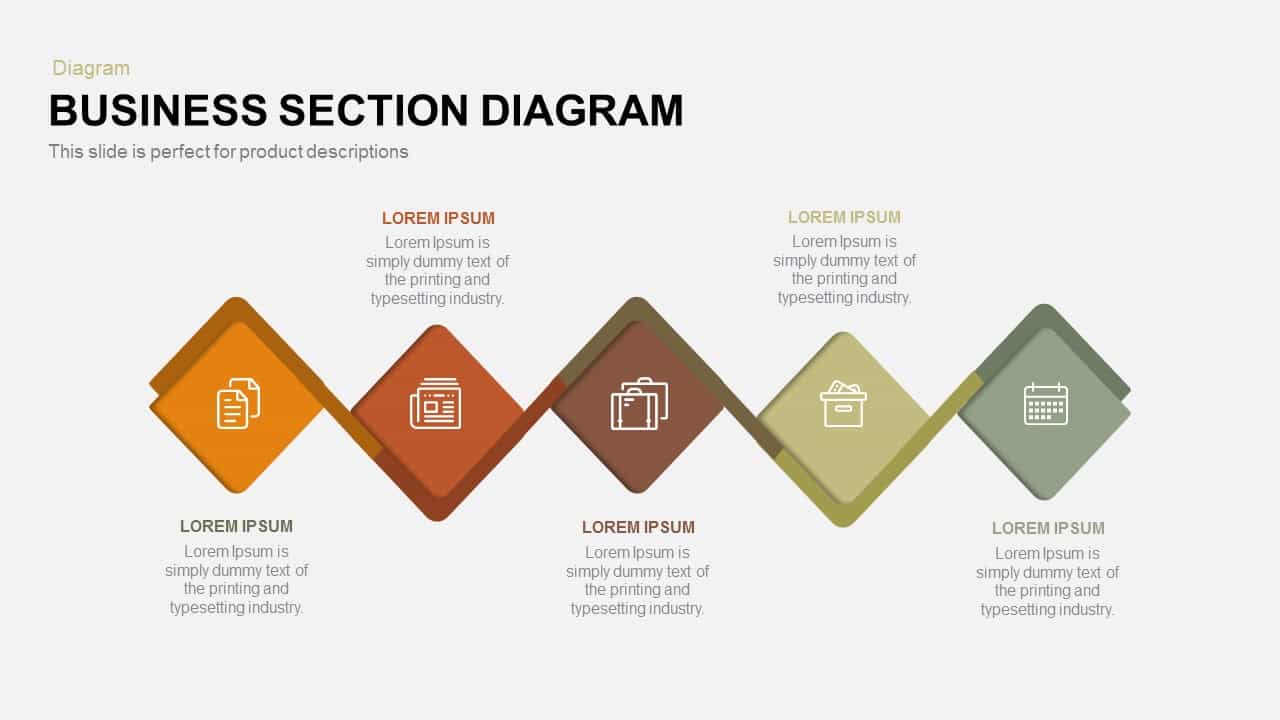
Business Section Diamond Process Diagram Template for PowerPoint & Google Slides
Process
Vertical Business Process Flow Diagram Template for PowerPoint & Google Slides
Process

Linear Business Process Diagram template for PowerPoint & Google Slides
Process
Four Step Business Process template for PowerPoint & Google Slides
Process
Ten-Stage Business Process Diagram Template for PowerPoint & Google Slides
Process
4 Staged Circular Business Process Diagram template for PowerPoint & Google Slides
Process

Business Process Improvements template for PowerPoint & Google Slides
Process
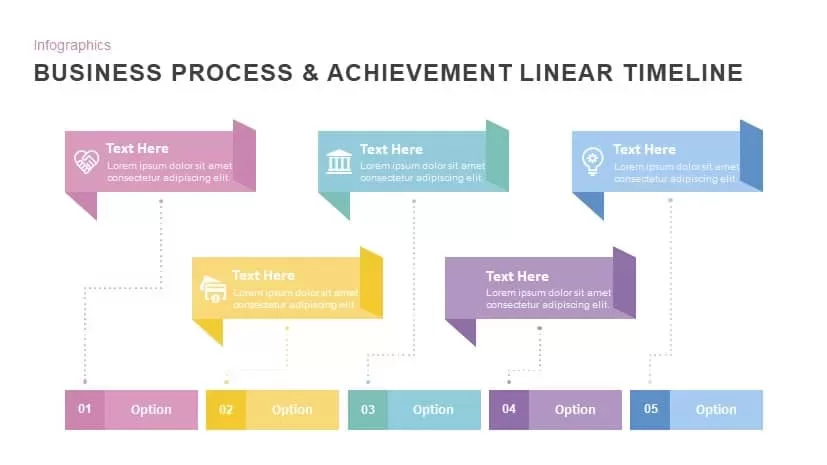
Business Process & Achievement Linear Timeline template for PowerPoint & Google Slides
Timeline
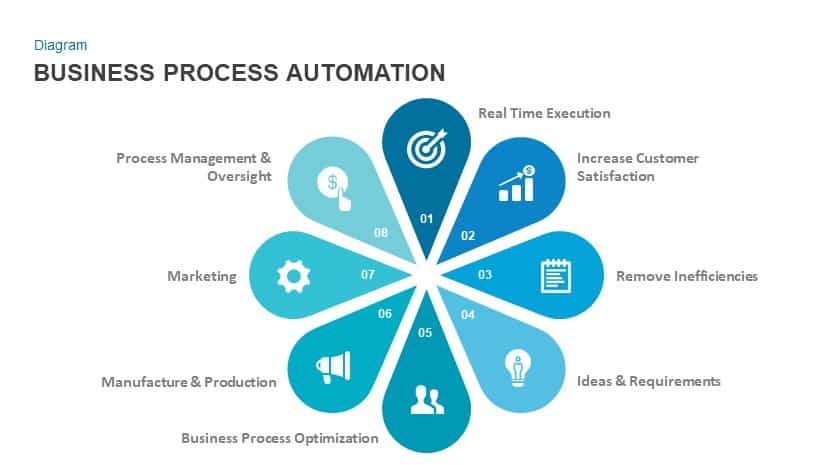
Business Process Automation Diagram Template for PowerPoint & Google Slides
Process
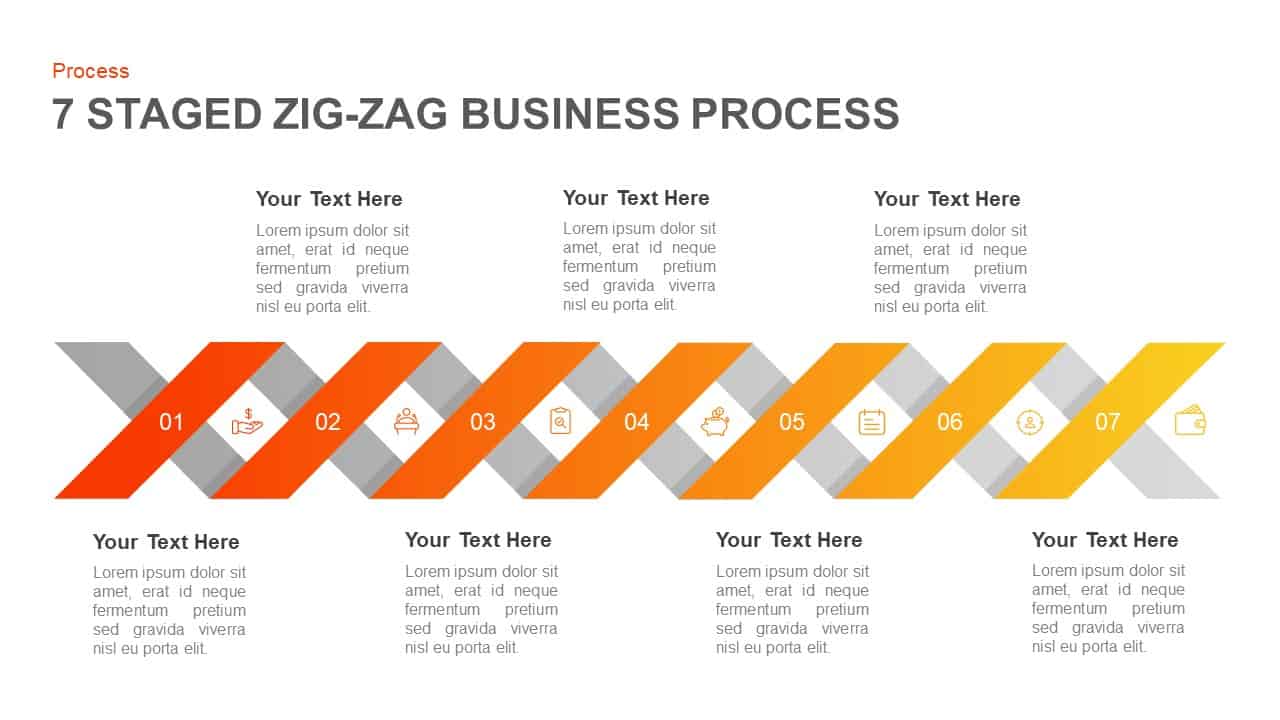
7-Stage Zig-Zag Business Process Template for PowerPoint & Google Slides
Process
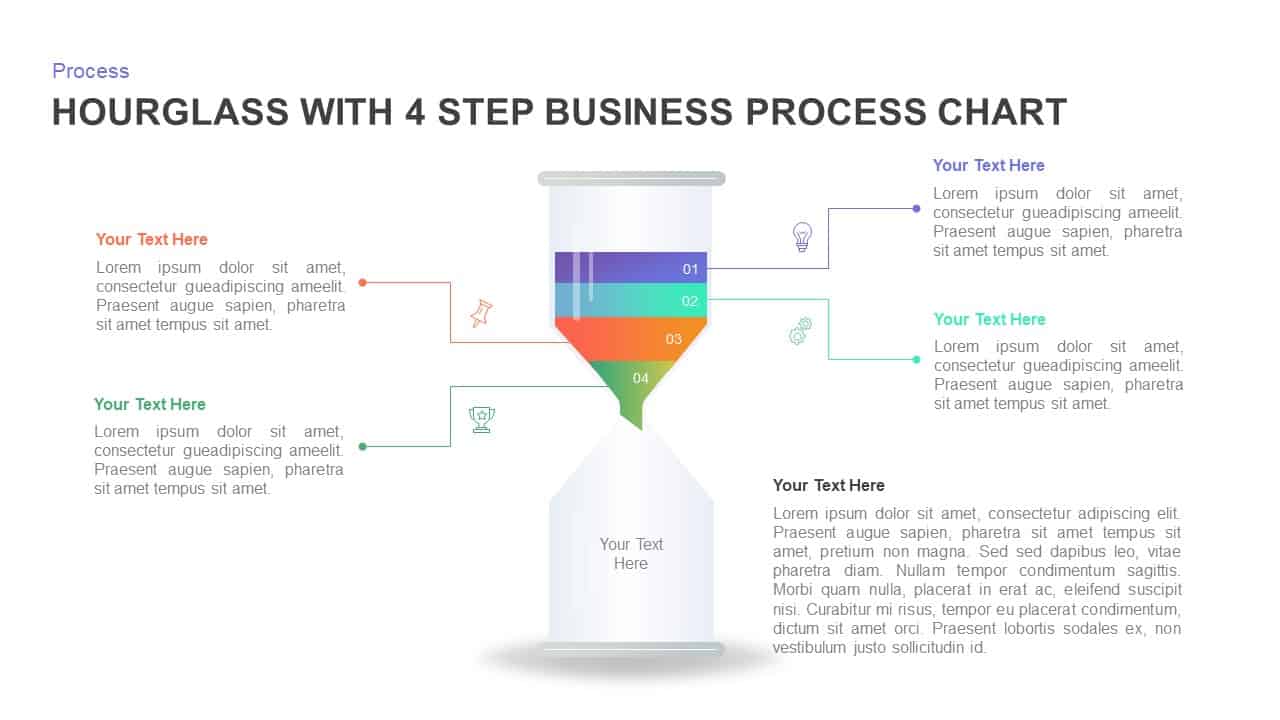
Four-Step Hourglass Business Process Template for PowerPoint & Google Slides
Process
Business System Five-Step Process Template for PowerPoint & Google Slides
Process
6-Step Business Process Flow Diagram Template for PowerPoint & Google Slides
Process
Business Process Achievement Timeline Template for PowerPoint & Google Slides
Timeline
SEO Business Process Puzzle Diagram Template for PowerPoint & Google Slides
Process
Business Plan Presentation Process template for PowerPoint & Google Slides
Business Plan
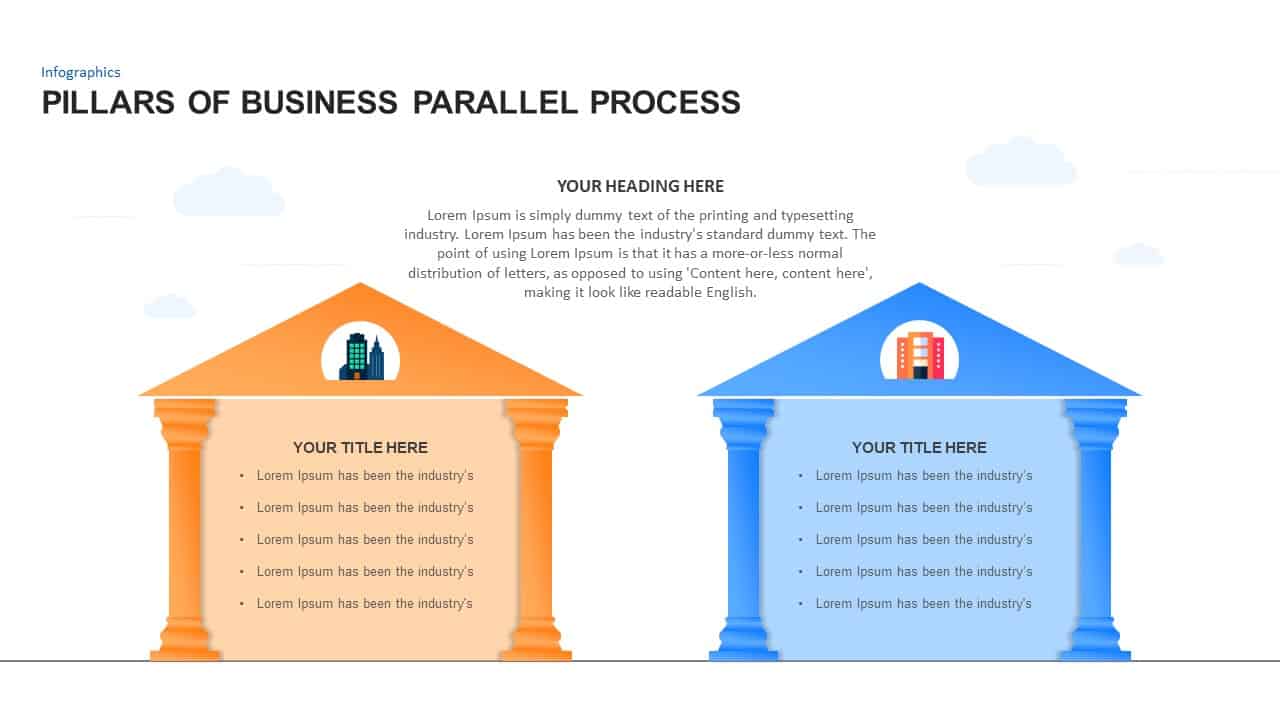
Pillars of Business Parallel Process template for PowerPoint & Google Slides
Process
Business Process Management Flow Diagram Template for PowerPoint & Google Slides
Process
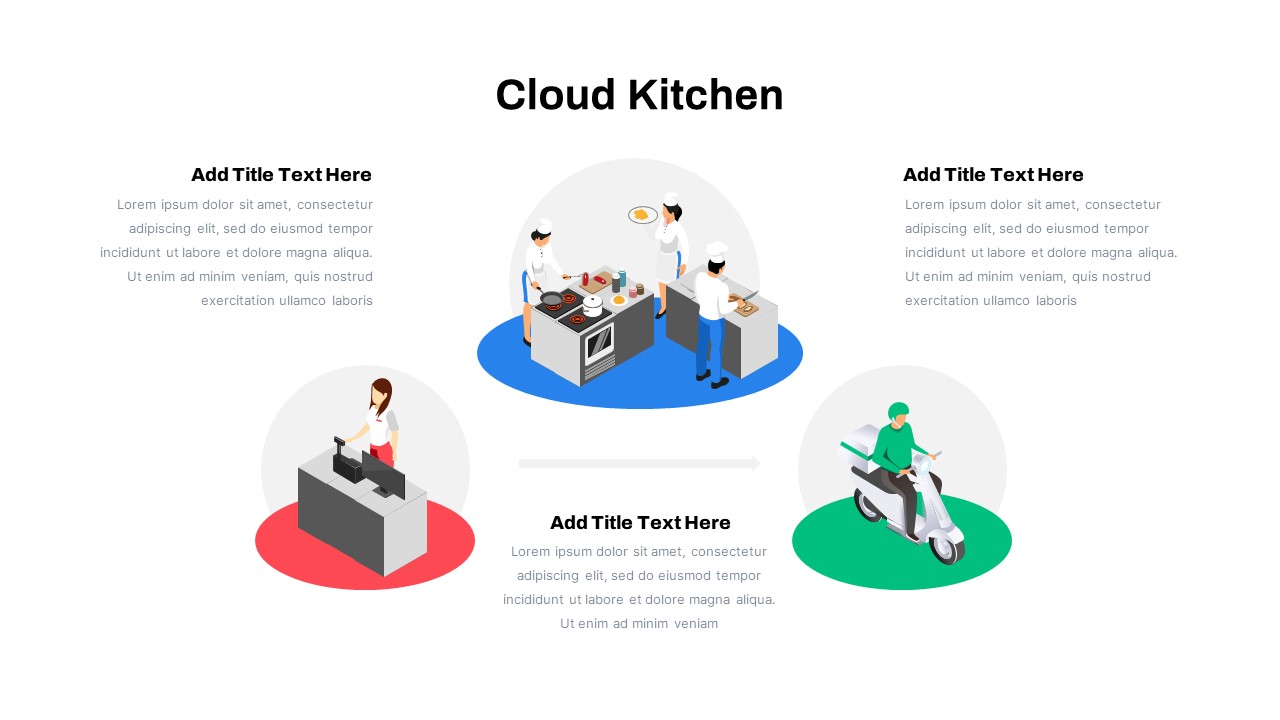
Cloud Kitchen Business Process Diagram Template for PowerPoint & Google Slides
Process
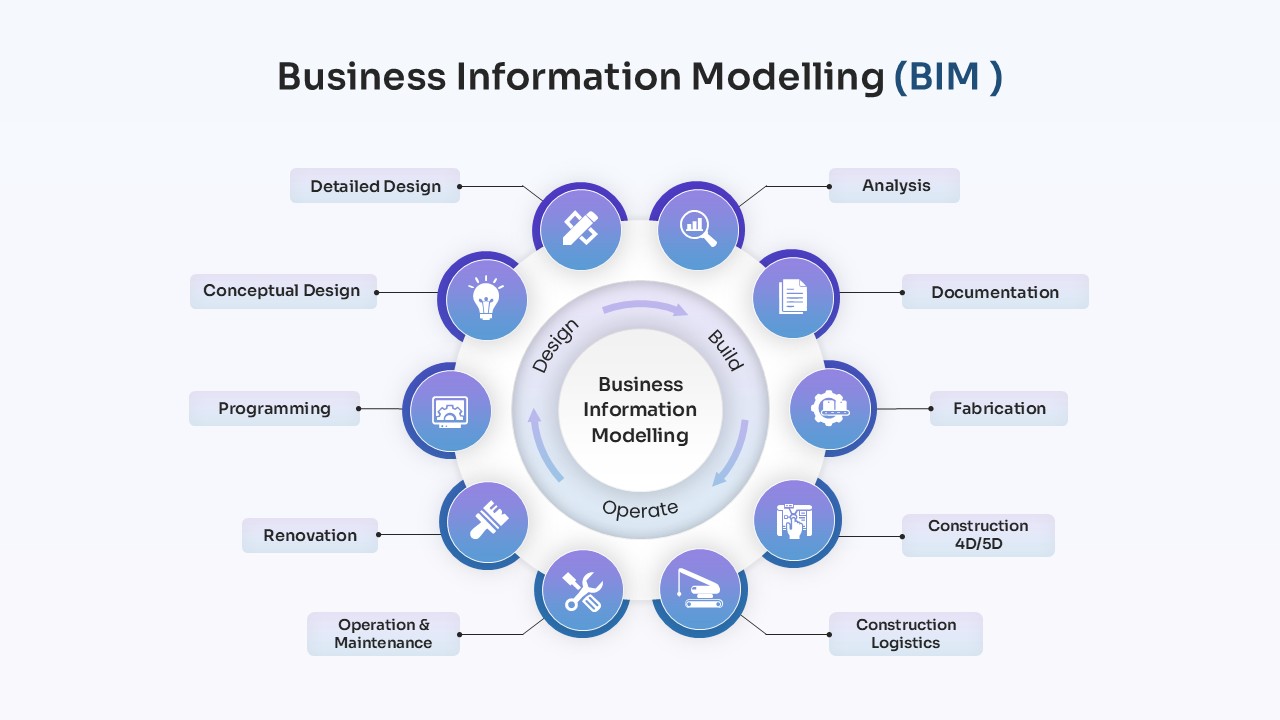
Business Information Modelling Process Template for PowerPoint & Google Slides
Process
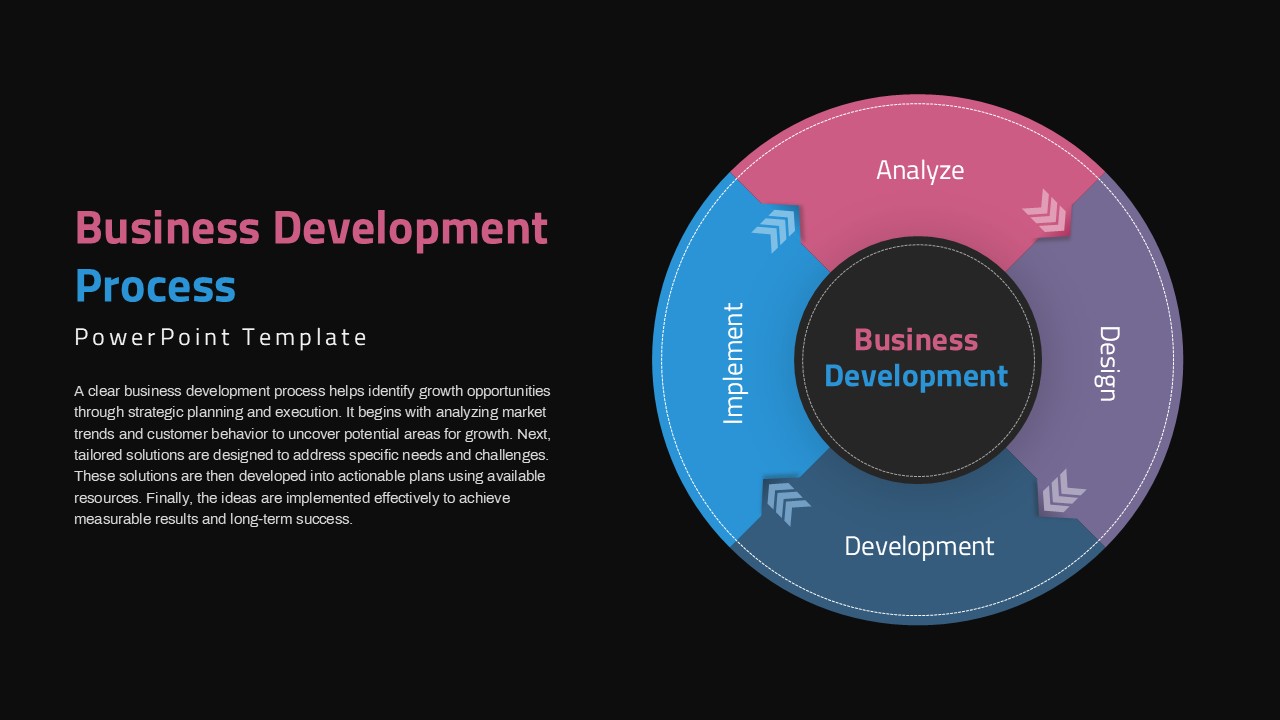
Circular Business Development Process Template for PowerPoint & Google Slides
Process