Colorful Block Infographic Metrics Slide Template for PowerPoint & Google Slides

Description
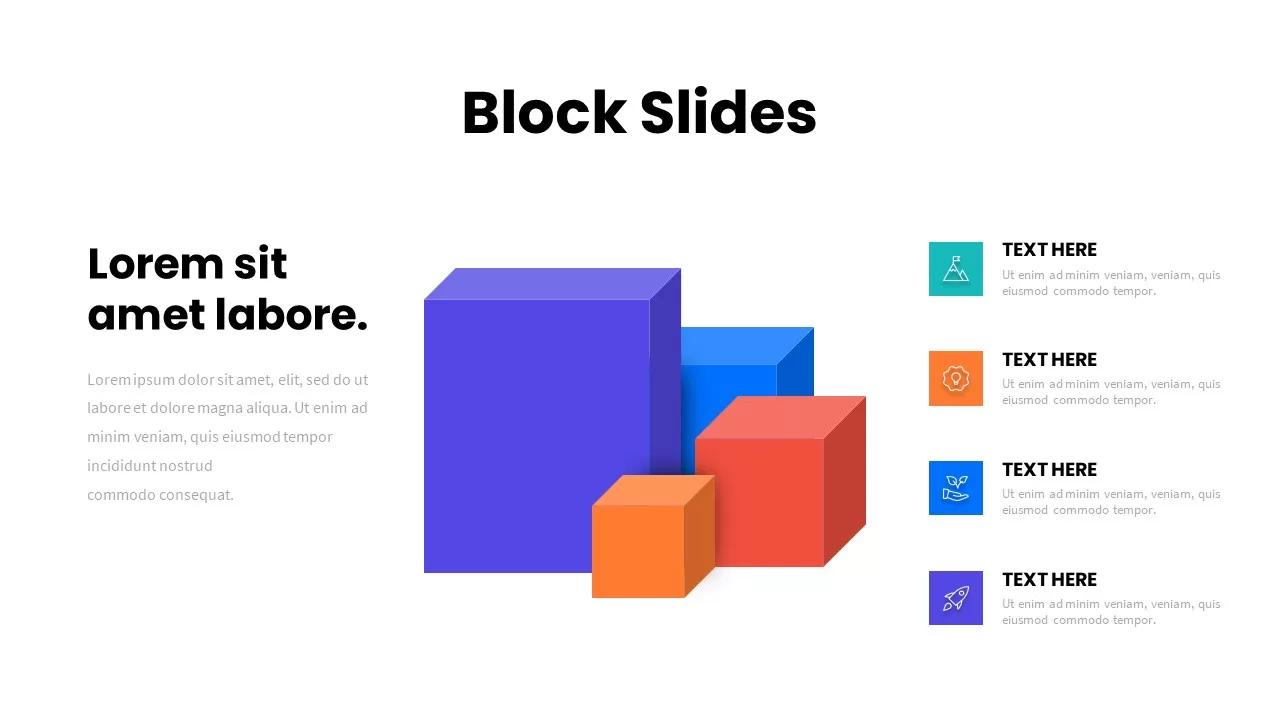
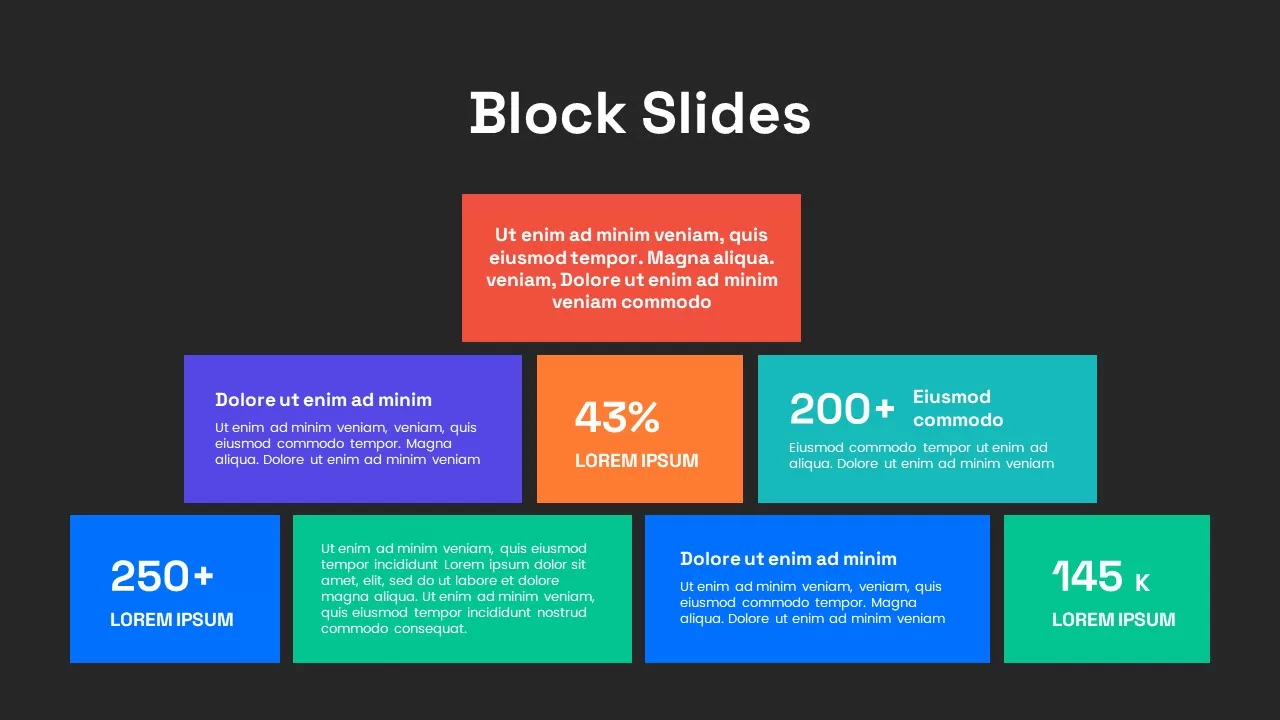
Use this vibrant block infographic to present key metrics and accomplishments with maximum clarity in PowerPoint & Google Slides. A tiered layout of colored rectangles—red, purple, orange, teal, blue, and green—organizes headline numbers (e.g., 43%, 200+, 250+, 145 K) alongside supporting text blocks. The topmost red card sets context with a descriptive summary, followed by three middle cards for feature highlights or KPIs, and four bottom cards for detailed stats or narrative points. Editable masters and vector shapes let you swap colors, adjust card sizes, replace icons, and relabel text in seconds. Subtle drop shadows and generous white space ensure a polished, modern look that keeps your audience focused on the data that matters.
Whether you’re reporting quarterly results, showcasing project milestones, or summarizing dashboard insights, this slide equips you to tell a data-driven story. Built for both desktop and web editors, it guarantees pixel-perfect clarity across devices and supports seamless branding updates via theme controls.
Who is it for
Marketing analysts, sales leaders, project managers, and executives will benefit from this infographic when presenting performance summaries, KPI dashboards, or quarterly business reviews. Data teams and consultants can also leverage it to highlight insights in client deliverables.
Other Uses
Repurpose these block cards for product feature overviews, service comparisons, e-commerce highlights, customer segment breakdowns, or training module summaries. Duplicate or remove cards to fit any number of data points, making this template a versatile asset for diverse presentation needs.
Login to download this file

Item ID
SB02826
Related Templates

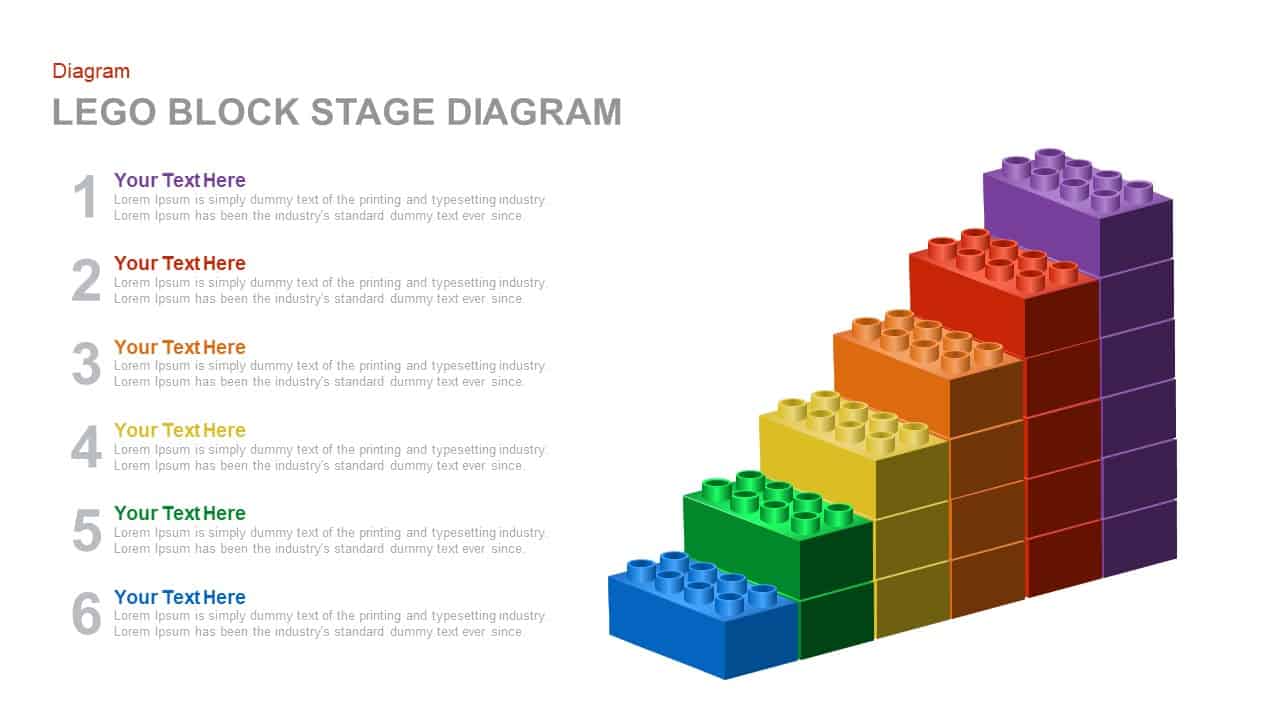
Colorful LEGO Block Stage Diagram Template for PowerPoint & Google Slides
Process
LinkedIn Metrics Infographic Slide Template for PowerPoint & Google Slides
Digital Marketing
Instagram Infographic Metrics Slide Template for PowerPoint & Google Slides
Marketing
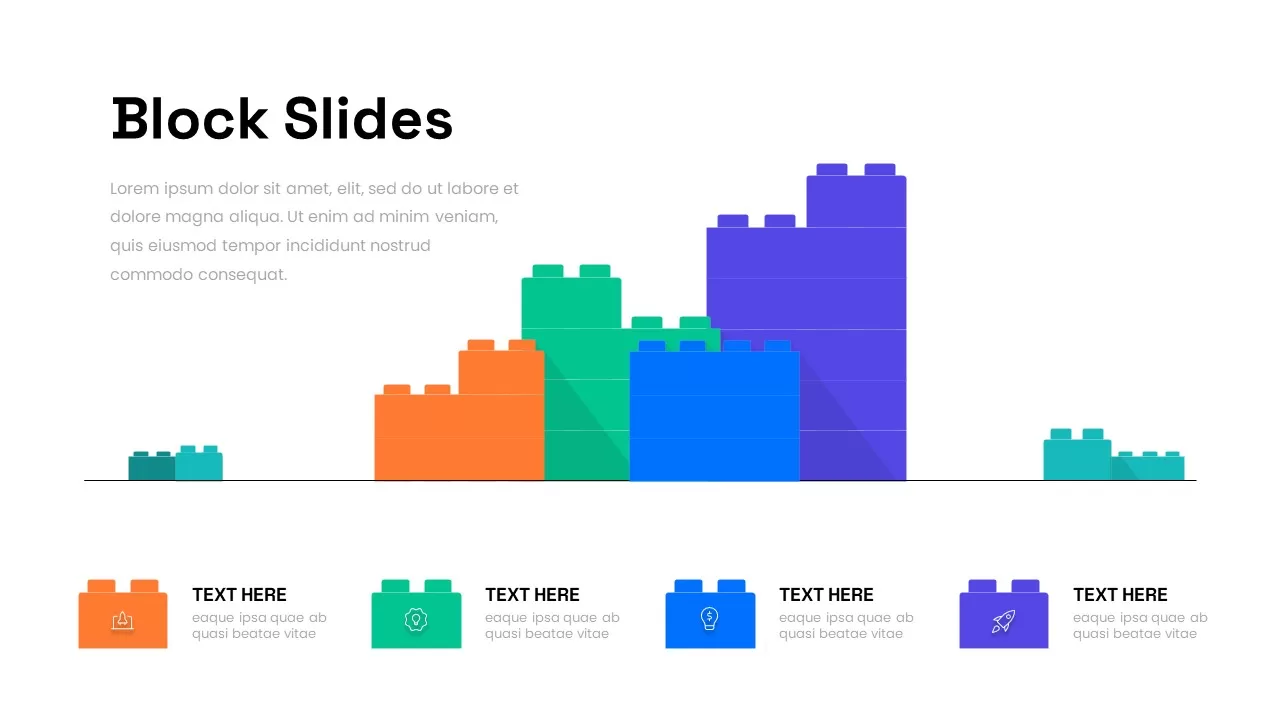
Modular Block Infographic Slide Template for PowerPoint & Google Slides
Infographics
Bubble Head Metrics Infographic Template for PowerPoint & Google Slides
Circular
Circle Segment Sales Metrics Infographic Template for PowerPoint & Google Slides
Circular
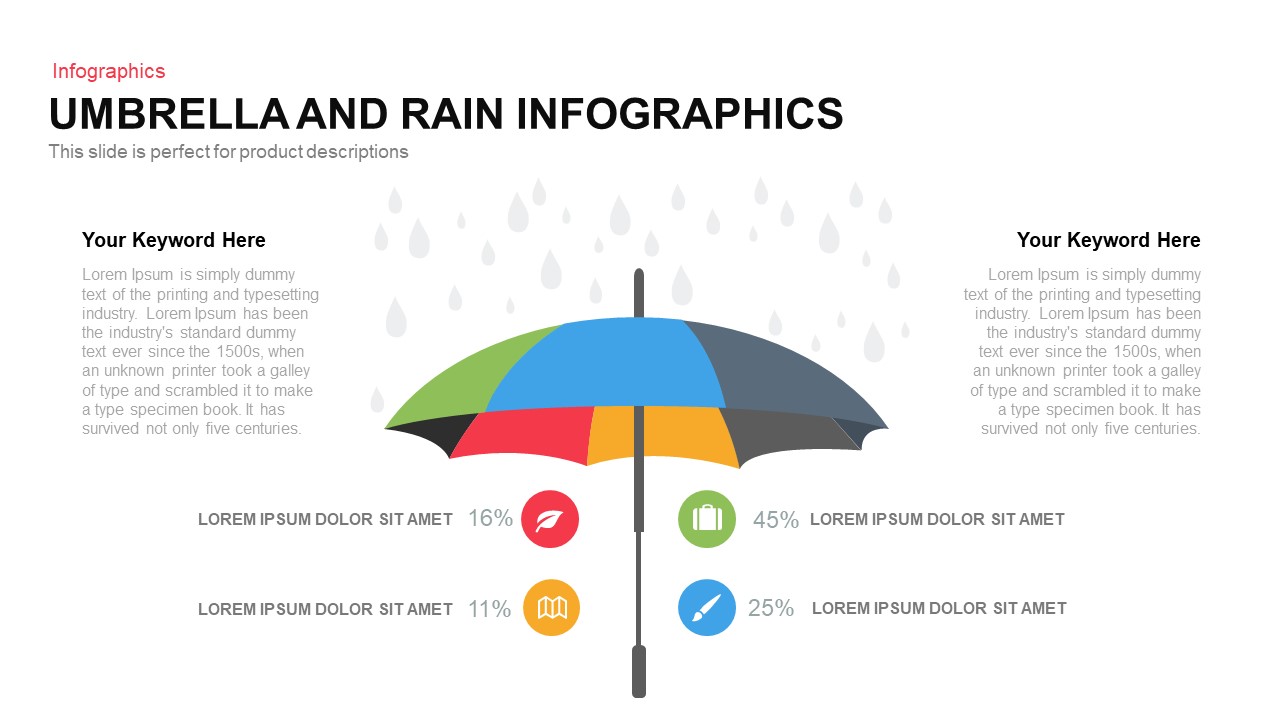
Umbrella and Rain Infographic Metrics Template for PowerPoint & Google Slides
Comparison
Statistics & Global Metrics Infographic Template for PowerPoint & Google Slides
Bar/Column
Facebook Social Metrics Infographic Template for PowerPoint & Google Slides
Graphics
Mastodon Metrics Infographic Dashboard Template for PowerPoint & Google Slides
Business Report
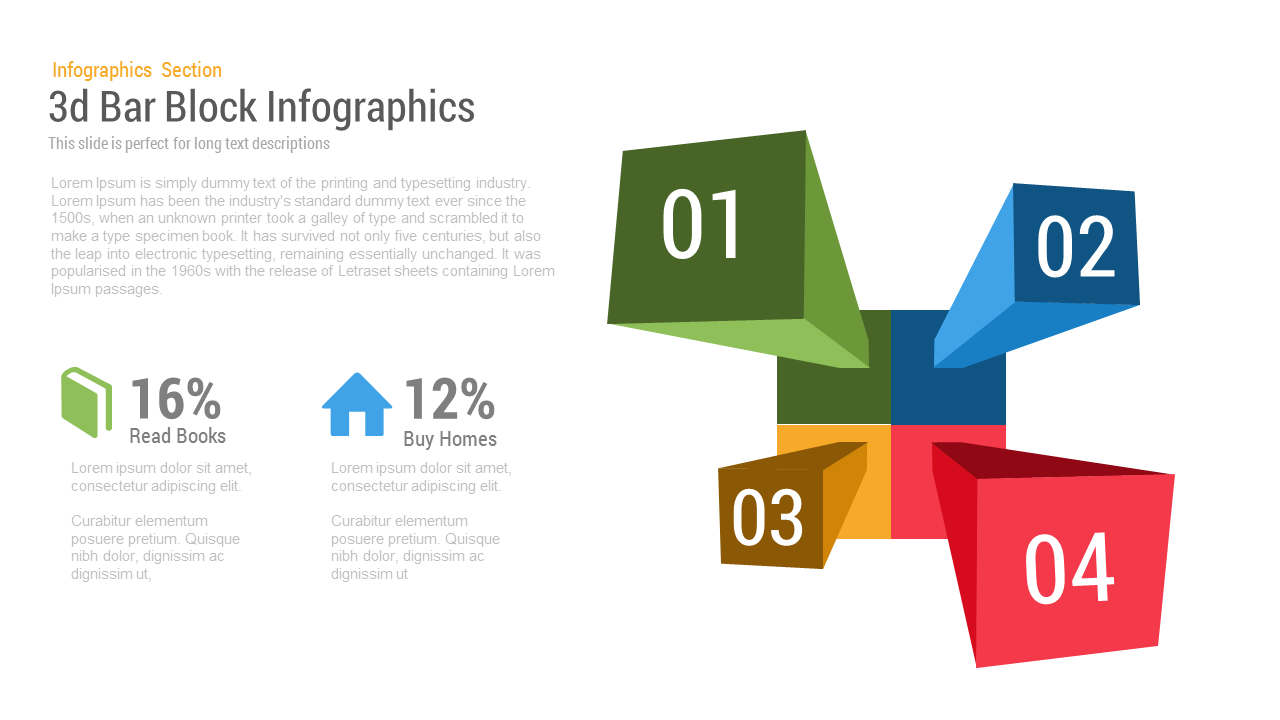
3D Block Infographic template for PowerPoint & Google Slides
Infographics
3D Block Arrow Infographic Diagram Template for PowerPoint & Google Slides
Arrow
Six-Layer 3D Block Stack Infographic Template for PowerPoint & Google Slides
Process
Isometric Block Infographic Steps Template for PowerPoint & Google Slides
Process
Isometric Block Steps Infographic Template for PowerPoint & Google Slides
Process
Creative Block List Infographic Template for PowerPoint & Google Slides
Agenda
NAFTA Trading Block Map Infographic Template for PowerPoint & Google Slides
World Maps
Benchmarking Metrics Comparison Slide Template for PowerPoint & Google Slides
Pie/Donut
Agriculture Infographics Slide with Progress Rings & Metrics Template for PowerPoint & Google Slides
Pie/Donut
Social Media Analysis Metrics Slide Deck Template for PowerPoint & Google Slides
Digital Marketing
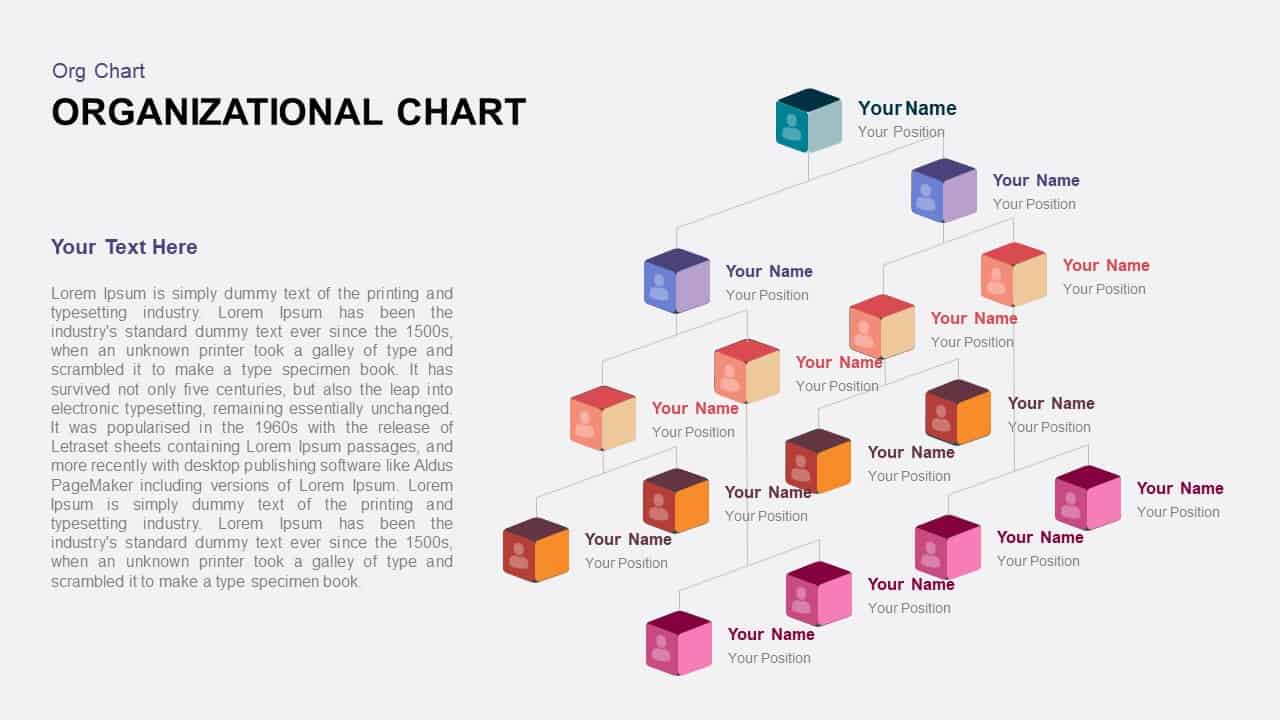
3D Color Block Organizational Chart Slide for PowerPoint & Google Slides
Org Chart
iPad App Mockup with Progress Metrics Template for PowerPoint & Google Slides
Bar/Column
Asia Map with KPI Metrics and Legend Template for PowerPoint & Google Slides
World Maps
Social Media Metrics template for PowerPoint & Google Slides
Comparison Chart
Mobile Usage Metrics template for PowerPoint & Google Slides
Comparison Chart

Scale Metaphor Metrics Comparison Template for PowerPoint & Google Slides
Charts
Comprehensive Recruitment Metrics Report Template for PowerPoint & Google Slides
Recruitment
Project Status Dashboard with Metrics Template for PowerPoint & Google Slides
Project Status
Circular Image Gallery & KPI Metrics Template for PowerPoint & Google Slides
Pie/Donut
Annual Recurring Revenue Metrics Template for PowerPoint & Google Slides
Bar/Column
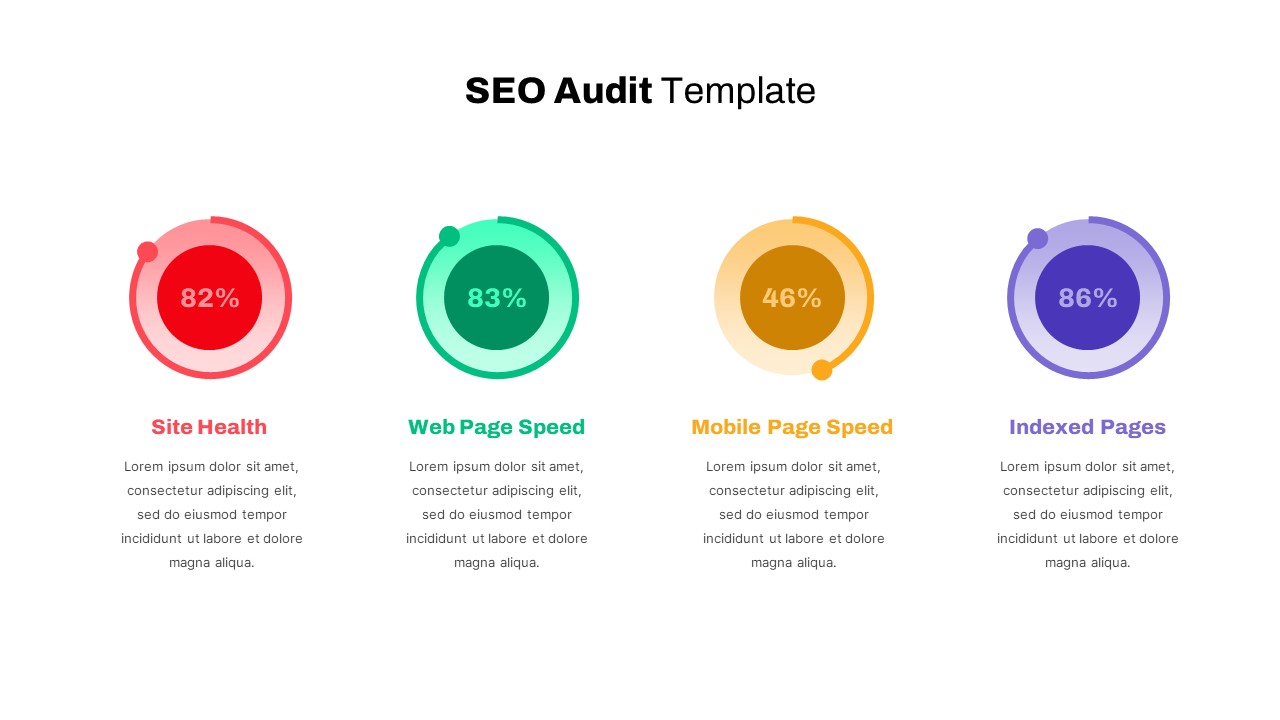
Detailed SEO Audit Metrics Overview Template for PowerPoint & Google Slides
Circular
Free Editable U.S. Map with Regional Metrics Template for PowerPoint & Google Slides
World Maps
Free
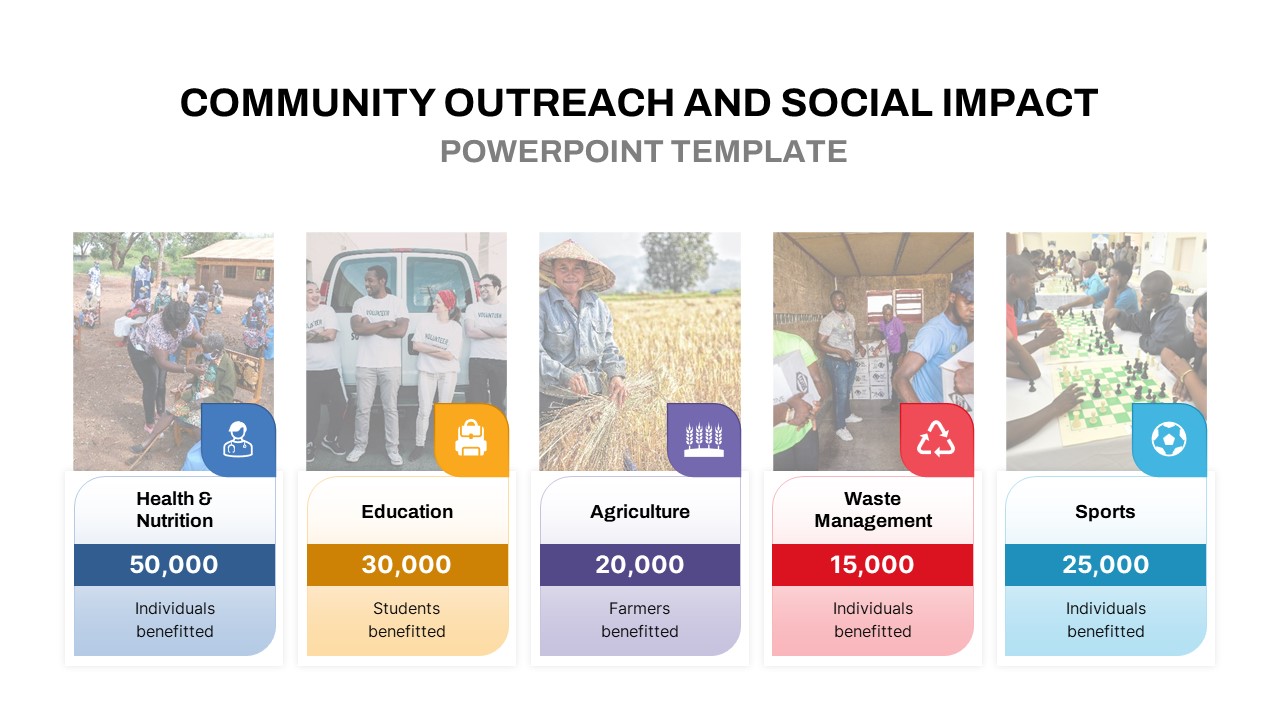
Community Outreach Impact Metrics Template for PowerPoint & Google Slides
Accomplishment
DevOps KPI Dashboard Performance Metrics Template for PowerPoint & Google Slides
Software Development
Purchasing KPI Metrics Dashboard Template for PowerPoint & Google Slides
Business Report
Financial Snapshot & Metrics Overview Template for PowerPoint & Google Slides
Finance
Procurement KPI Dashboard & Metrics Template for PowerPoint & Google Slides
Business Report
Market Validation Metrics Overview Template for PowerPoint & Google Slides
Business
Employee Performance Metrics Dashboard Template for PowerPoint & Google Slides
Employee Performance
Pirate Metrics AARRR Funnel Framework Template for PowerPoint & Google Slides
Funnel
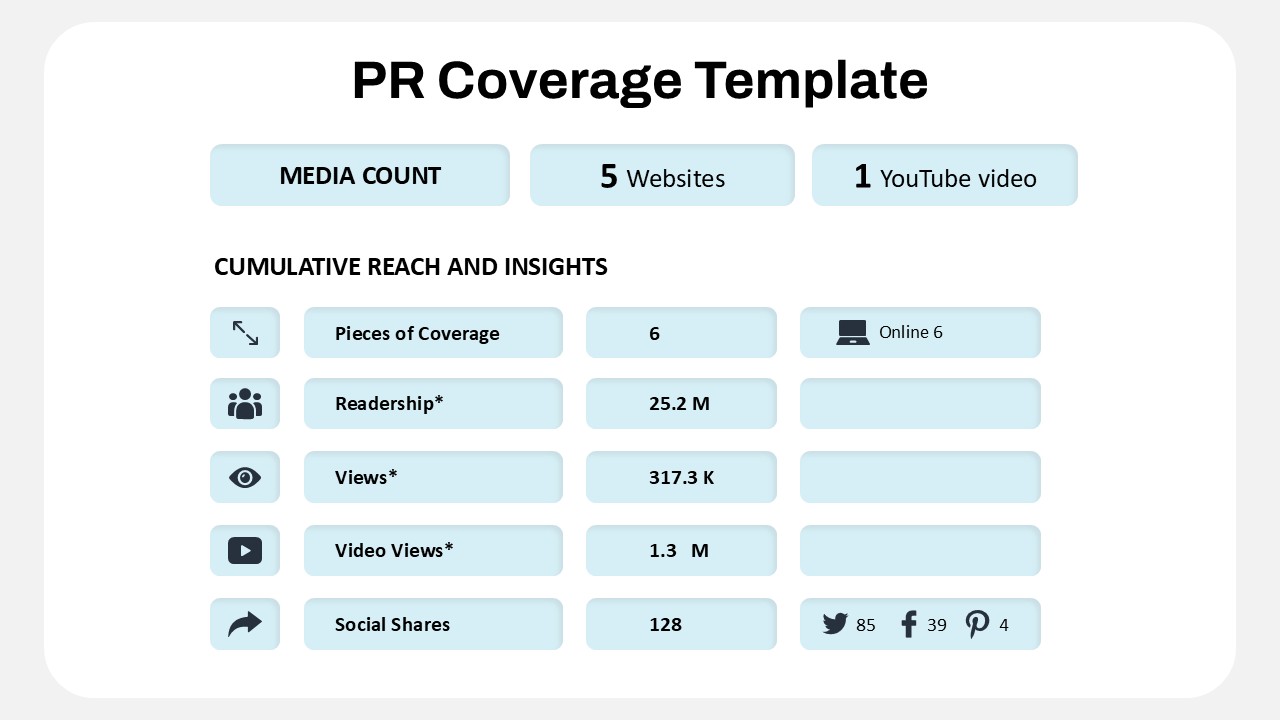
Public Relations Coverage Metrics Template for PowerPoint & Google Slides
Business Report
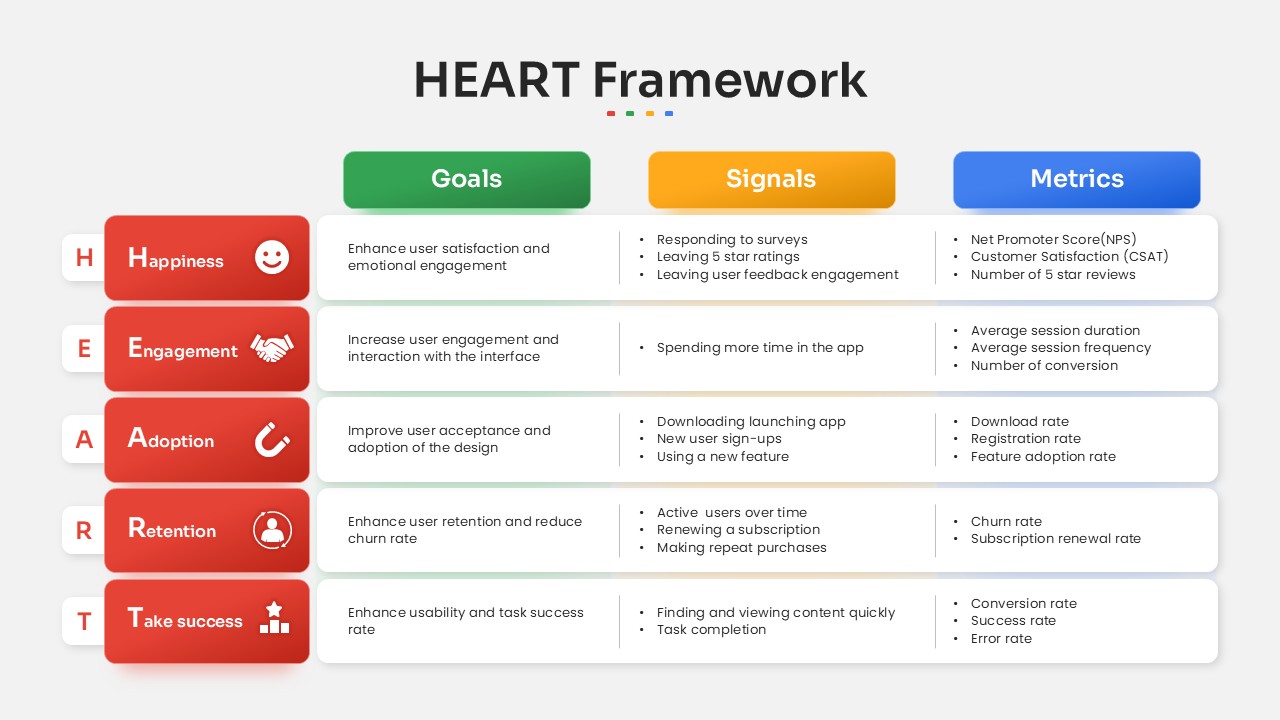
HEART Framework Goals, Signals & Metrics Template for PowerPoint & Google Slides
Process

Free Colorful Infographic Slide Pack Template for PowerPoint & Google Slides
Roadmap
Free
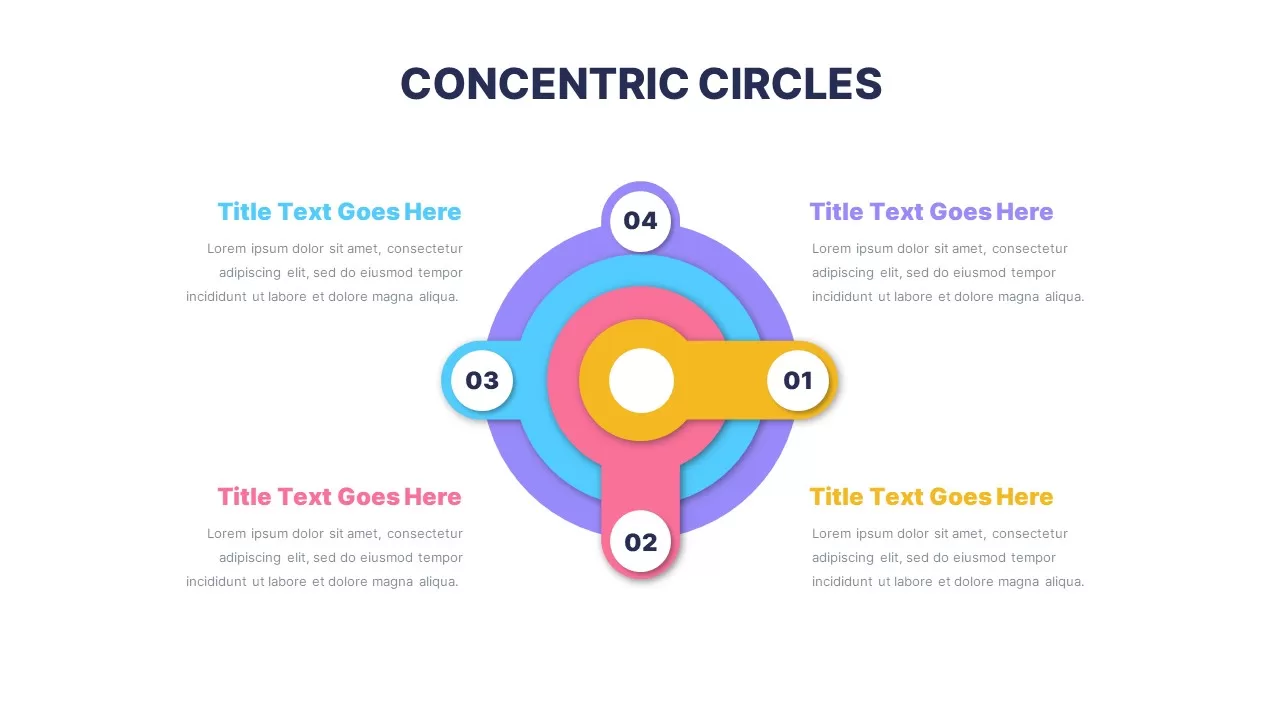
Colorful Concentric Circles Infographic Slide for PowerPoint & Google Slides
Process
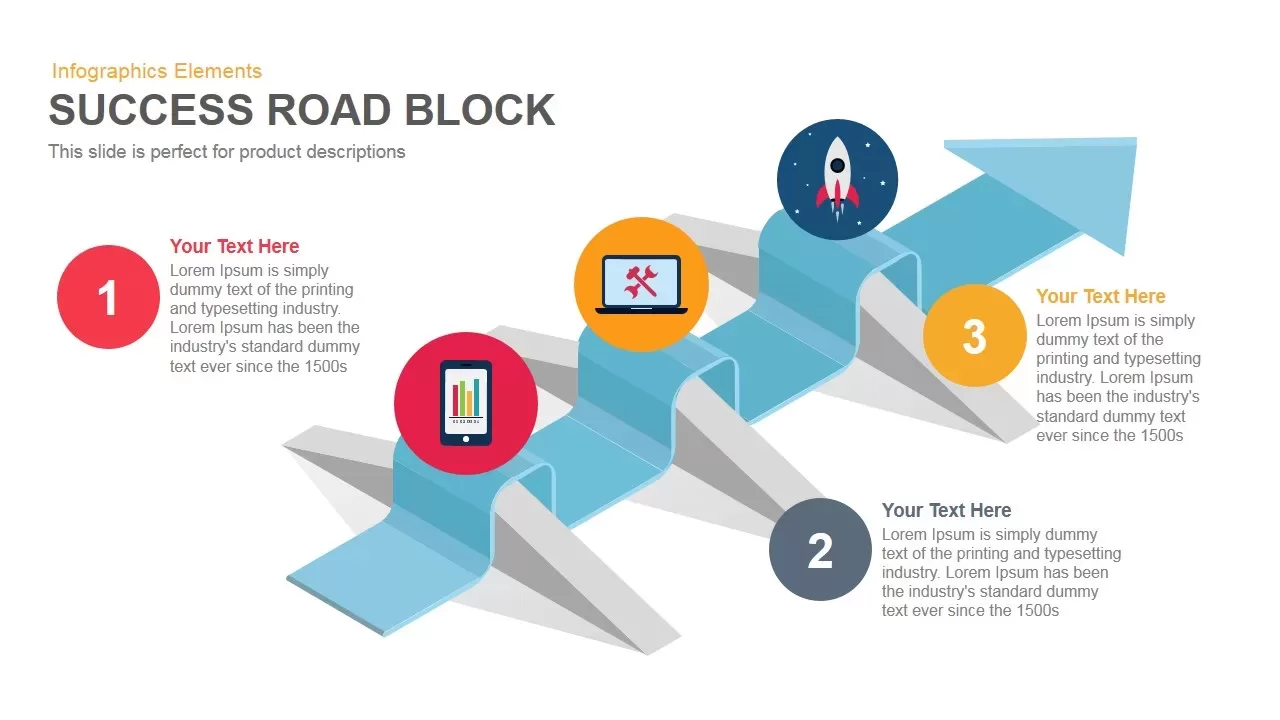
Success Road Block template for PowerPoint & Google Slides
Process

Modern Ten-Block Section Title Chart template for PowerPoint & Google Slides
Comparison
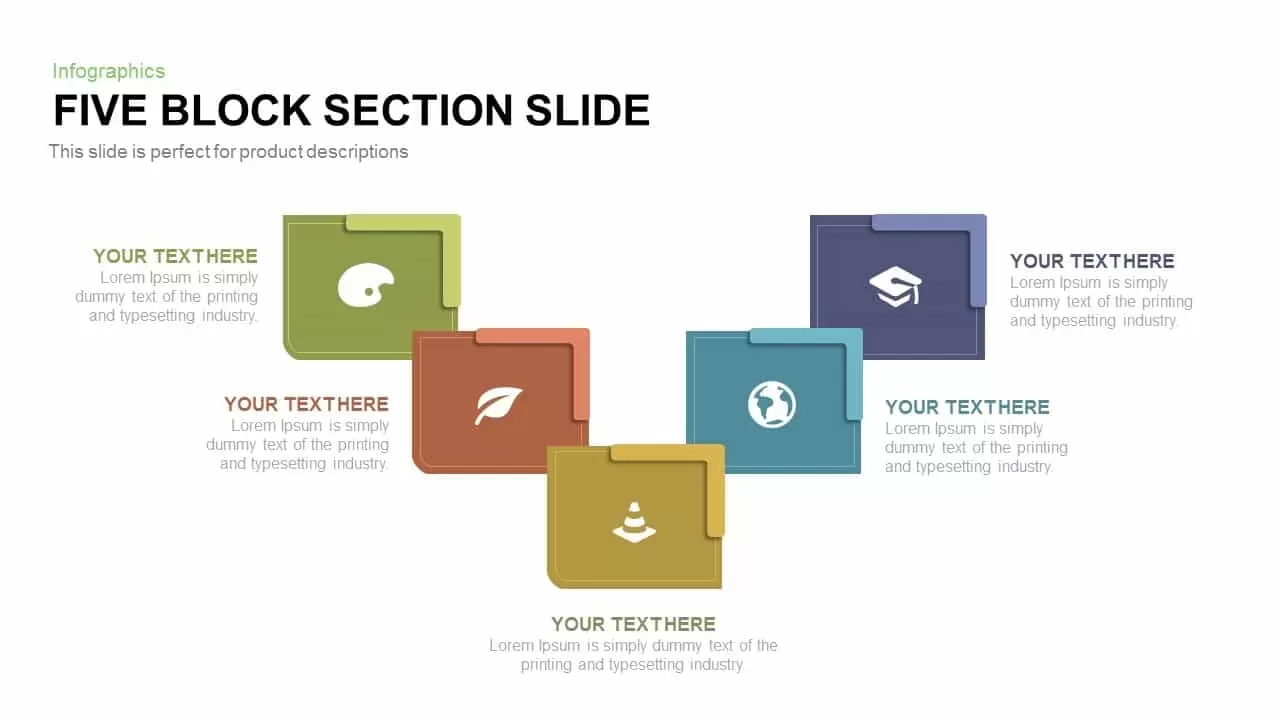
Five-Block Section Feature Highlights Template for PowerPoint & Google Slides
Comparison

Isometric 3D Block Comparison Diagram Template for PowerPoint & Google Slides
Comparison
Six-Block Capability Statement Template for PowerPoint & Google Slides
Business Report
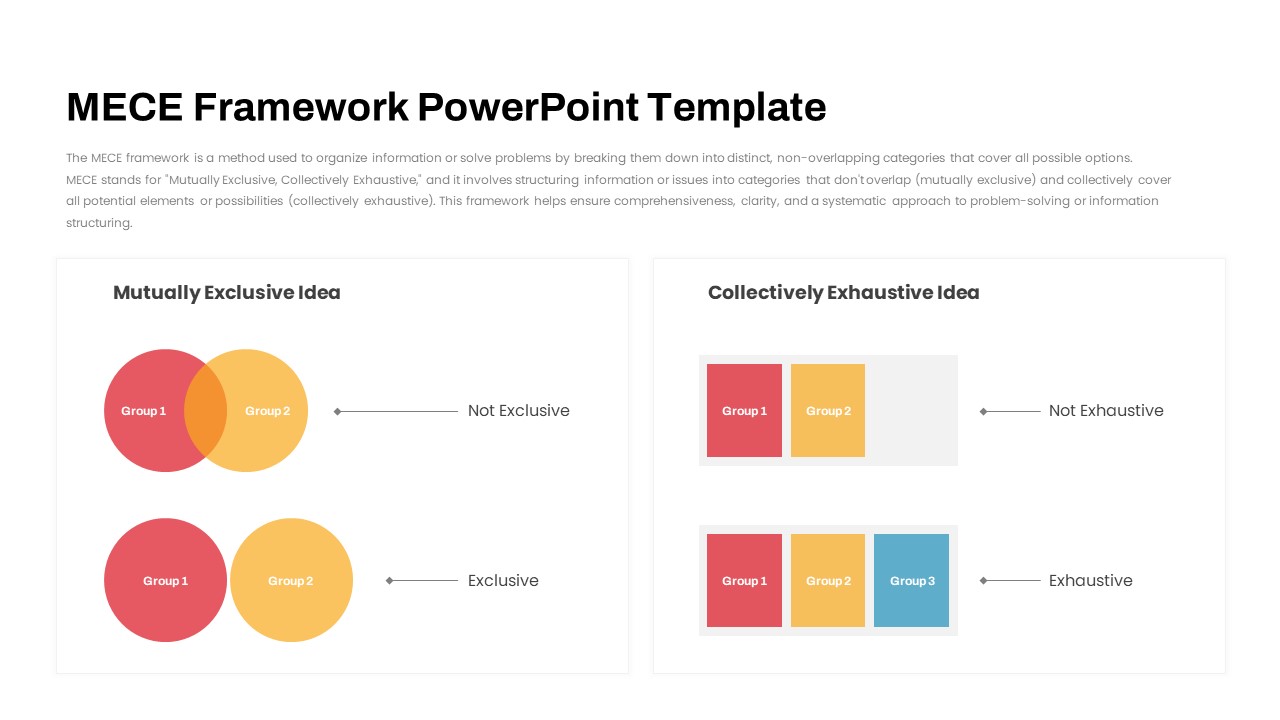
MECE Framework Venn & Block Diagram Template for PowerPoint & Google Slides
Comparison
7-Stage Colorful Timeline Infographic Template for PowerPoint & Google Slides
Timeline
Colorful Photo Capture Infographic Template for PowerPoint & Google Slides
Advertising
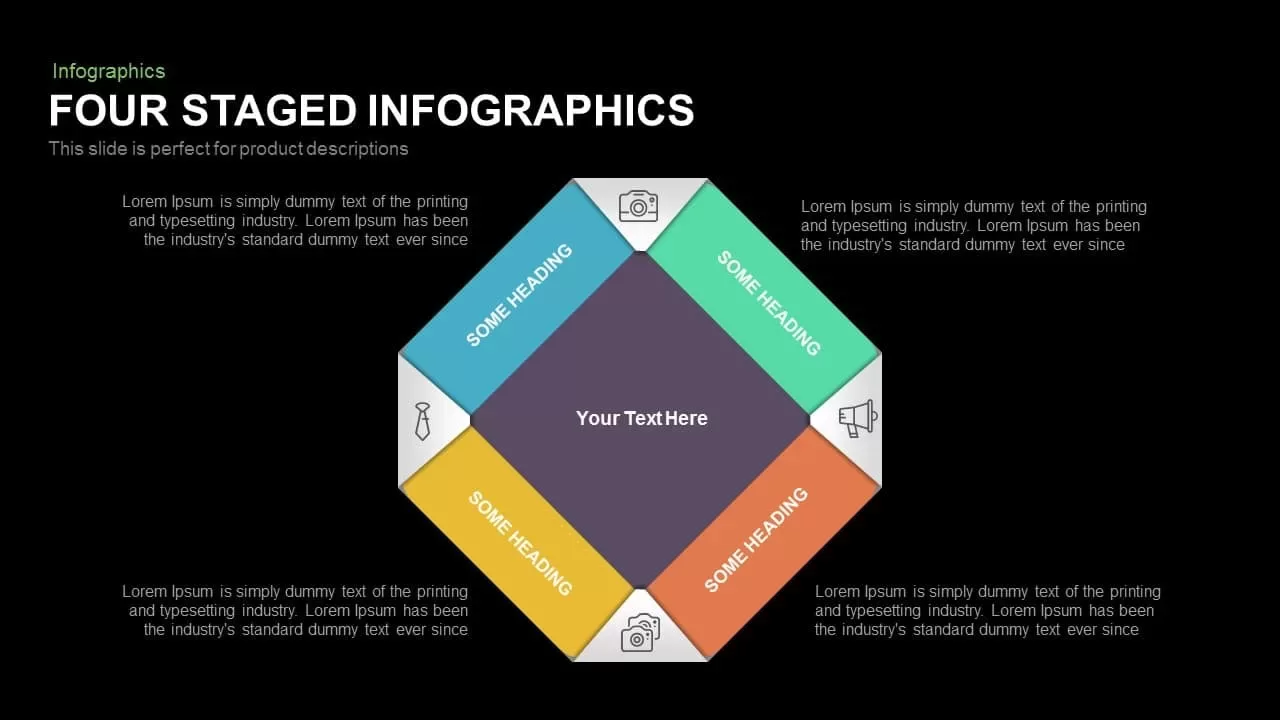
Colorful Four-Stage Infographic Process Template for PowerPoint & Google Slides
Process
Colorful Mind Map Infographic Template with Icons for PowerPoint & Google Slides
Mind Maps
Colorful Mind Map Infographic Template for PowerPoint & Google Slides
Mind Maps
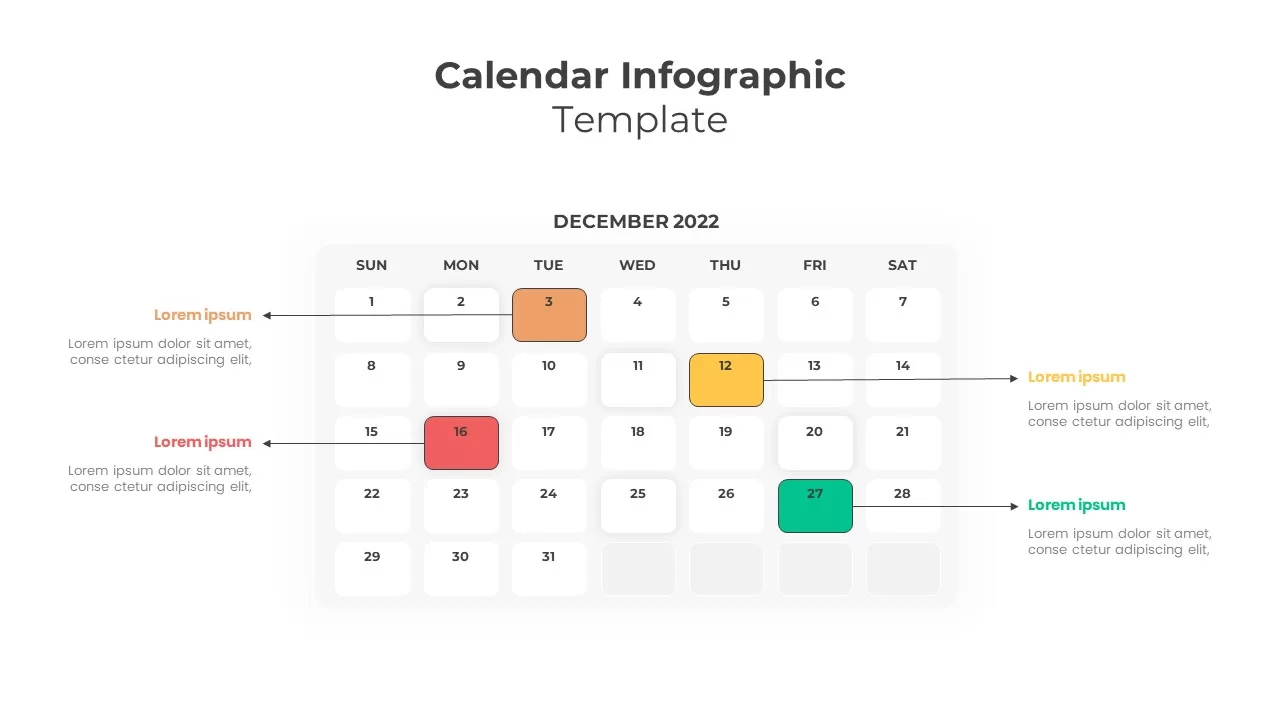
Colorful Callout Calendar Infographic Template for PowerPoint & Google Slides
Infographics
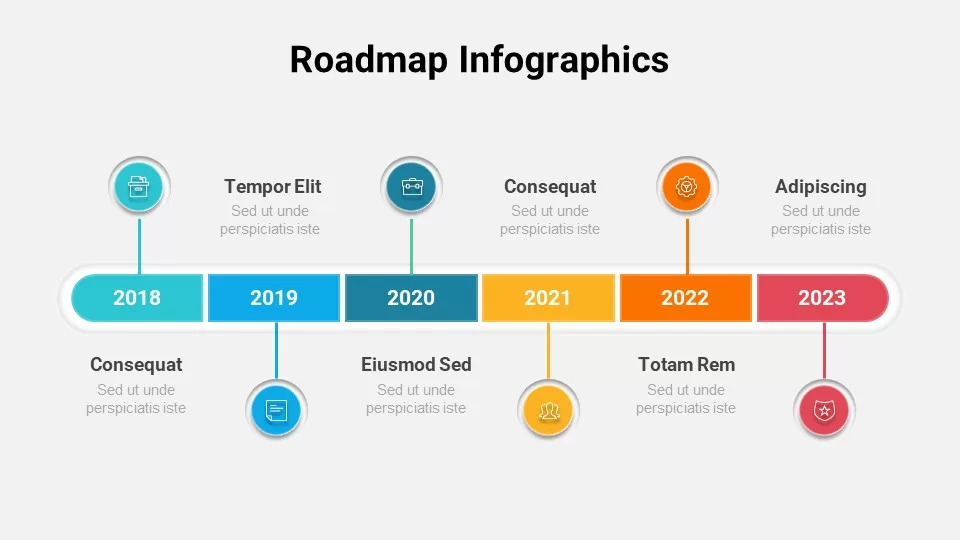
Free Colorful Roadmap Timeline Infographic Template for PowerPoint & Google Slides
Roadmap
Free
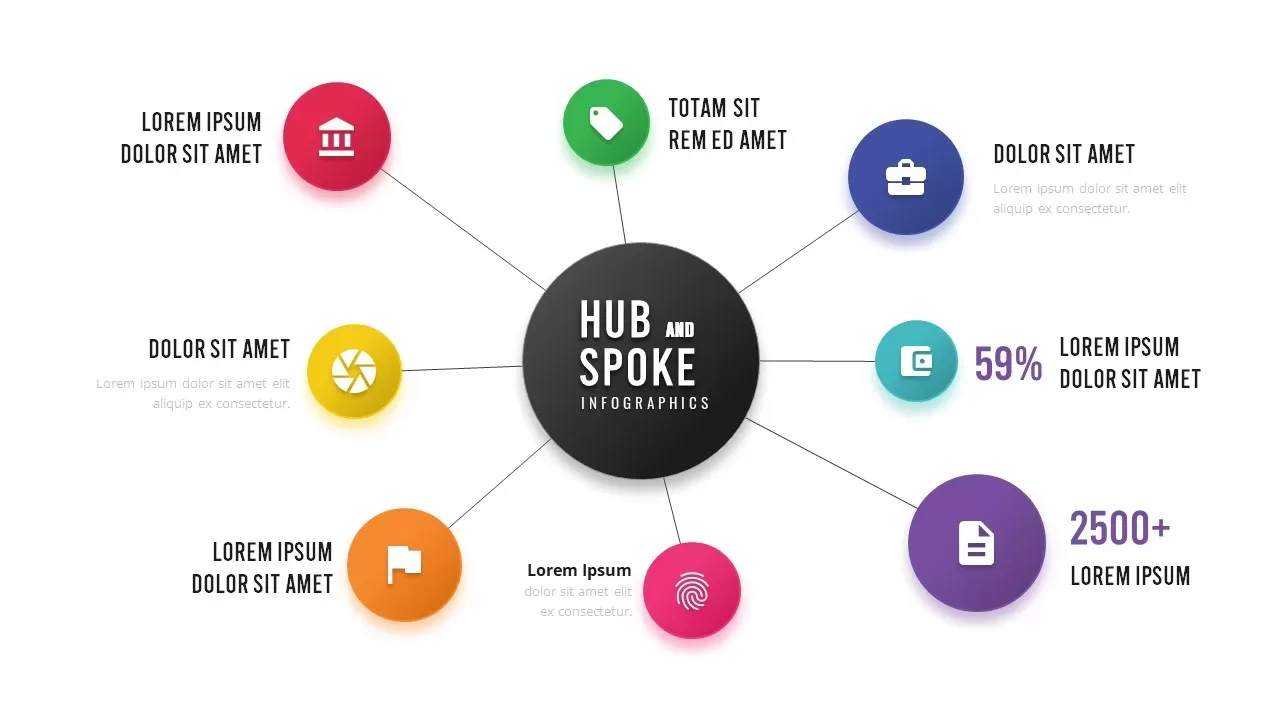
Colorful Hub-and-Spoke Infographic Template for PowerPoint & Google Slides
Circular
Colorful Hub-and-Spoke Infographic Template for PowerPoint & Google Slides
Circular
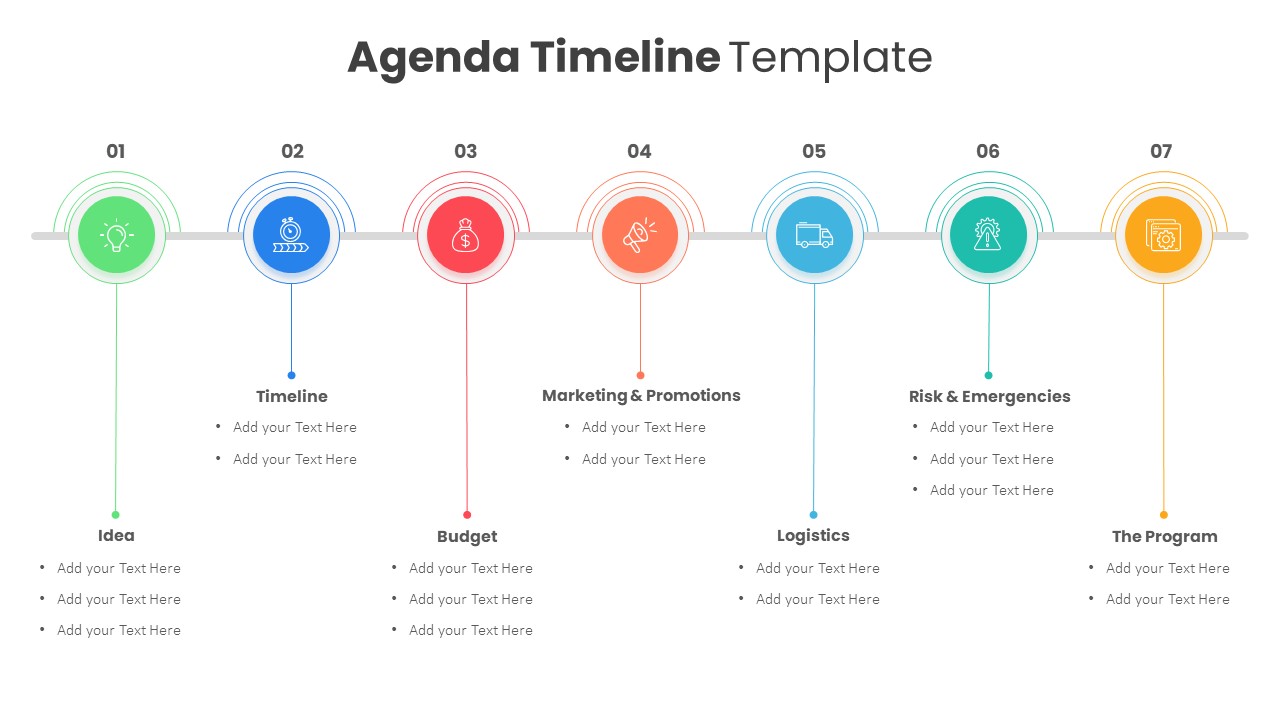
Colorful Agenda Timeline Infographic Template for PowerPoint & Google Slides
Agenda
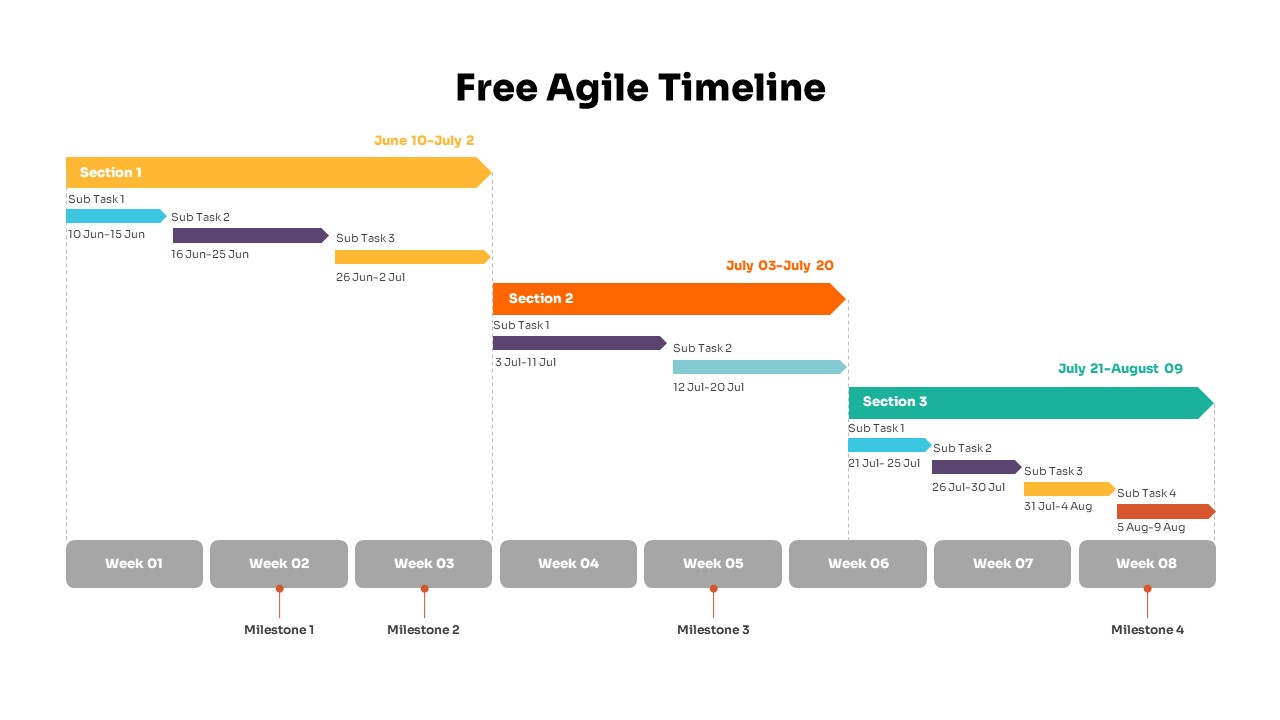
Colorful Agile Timeline Infographic Template for PowerPoint & Google Slides
Timeline
Free
Six Colorful Gear Shapes Infographic Template for PowerPoint & Google Slides
Process
Free
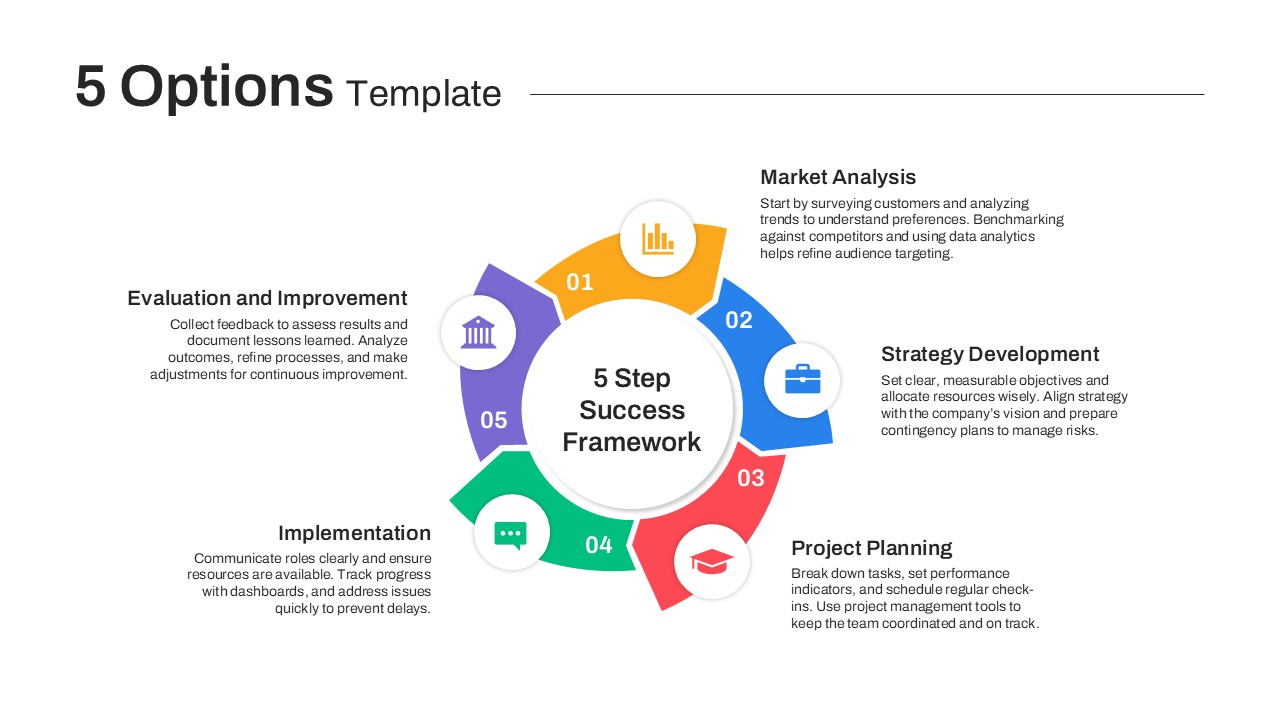
Colorful Five-Option Ribbon Infographic Template for PowerPoint & Google Slides
Process
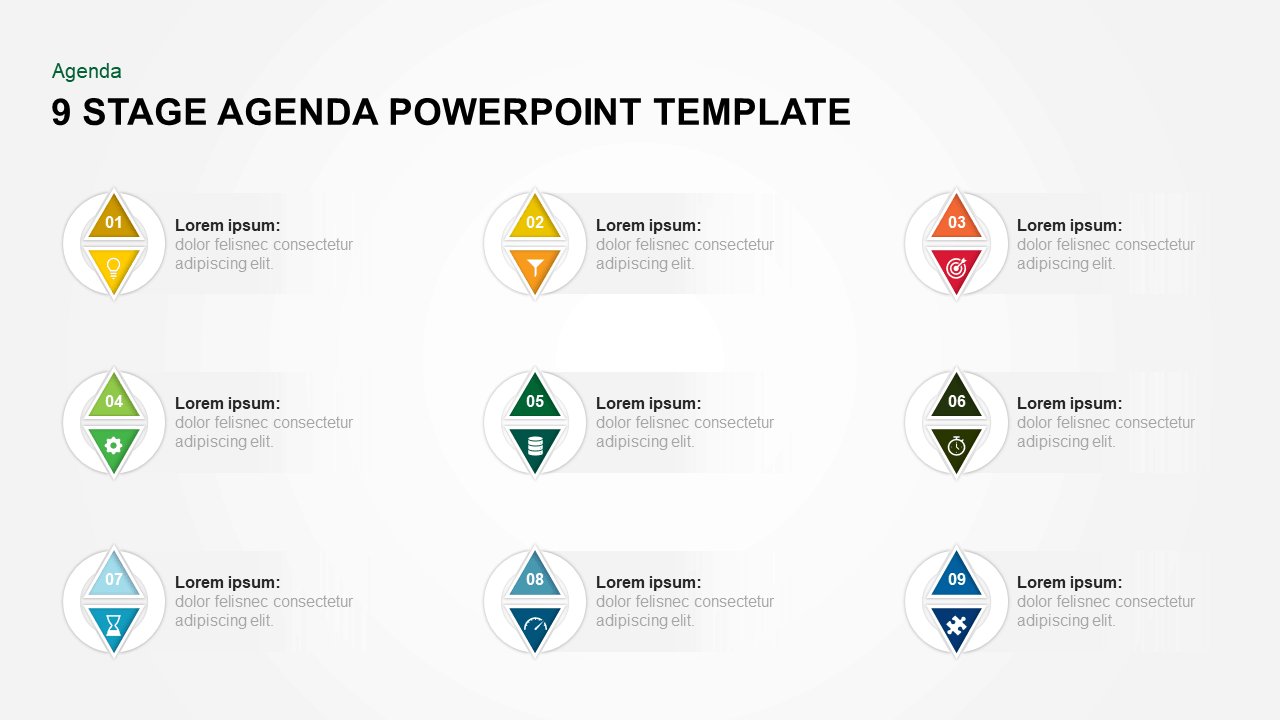
Colorful Nine-Stage Agenda Slide Template for PowerPoint & Google Slides
Agenda
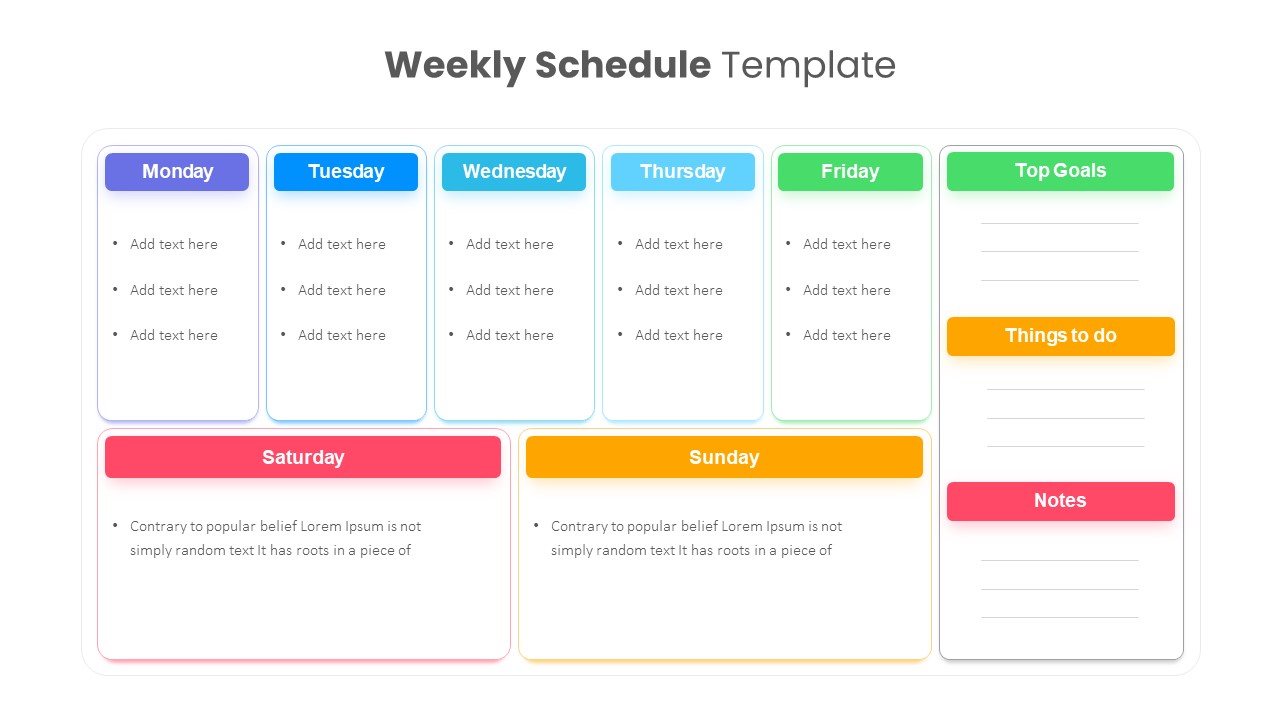
Colorful Weekly Schedule Slide Deck Template for PowerPoint & Google Slides
Agenda
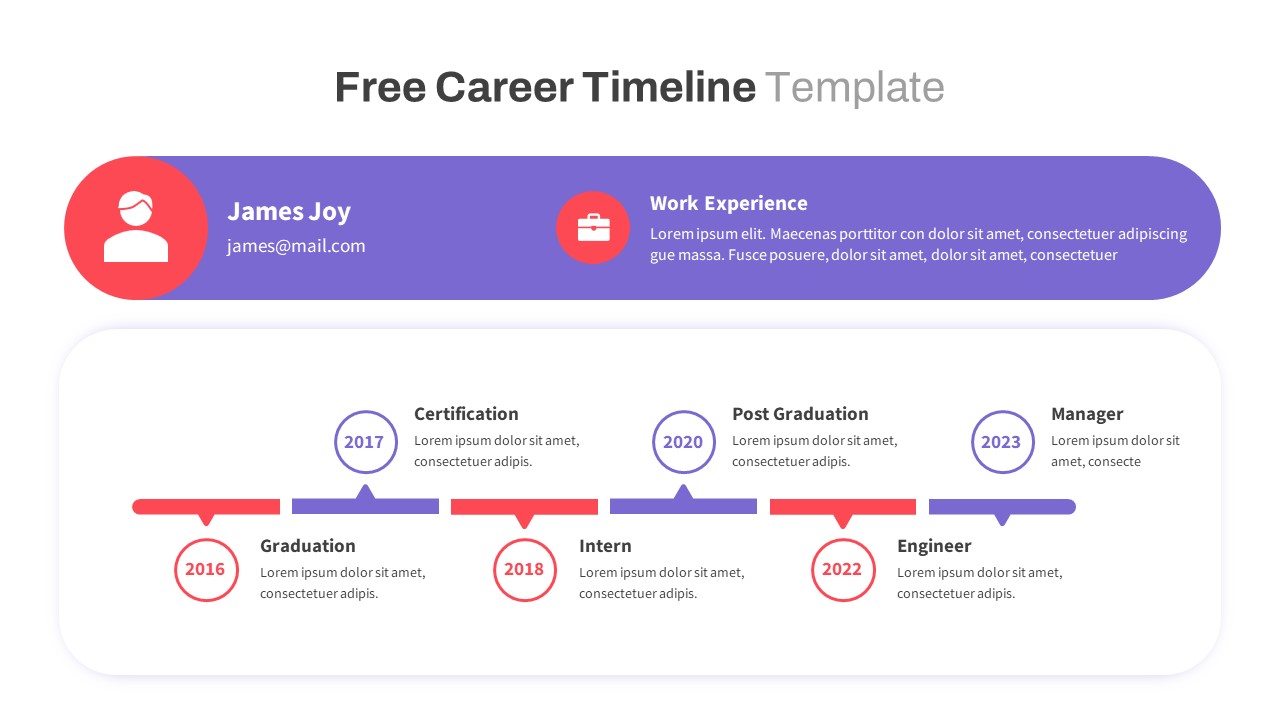
Free Colorful Career Timeline Resume Slide Template for PowerPoint & Google Slides
Timeline
Free
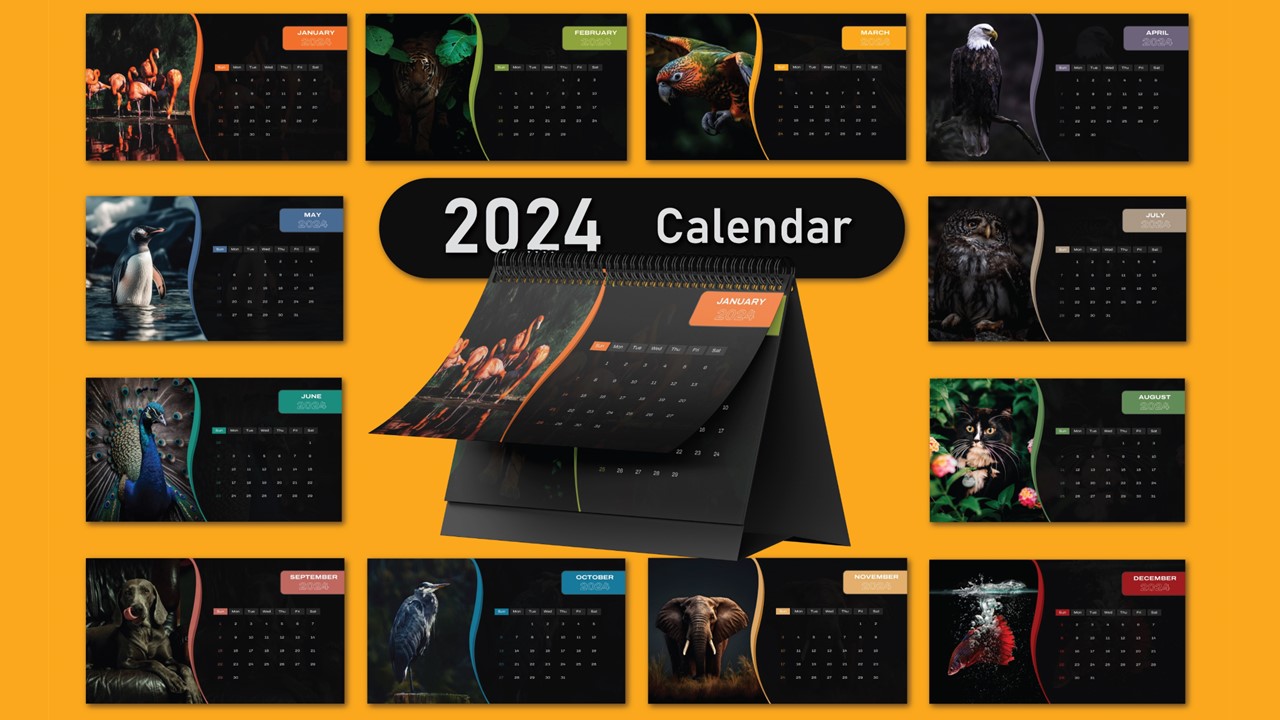
Free Colorful Animal 2024 Calendar Slide Pack Template for PowerPoint & Google Slides
Infographics
Free
Colorful Multi-Branch Mind Map Slide Template for PowerPoint & Google Slides
Mind Maps
Colorful Seven-Item Agenda Slide Template for PowerPoint & Google Slides
Agenda
Colorful Layered Onion Diagram Slide for PowerPoint & Google Slides
Process
Colorful Rainbow Slides Template for PowerPoint & Google Slides
Graphics
Editable Colorful Daily Agenda Slides Template for PowerPoint & Google Slides
Agenda
Free Colorful Morning Meeting Agenda Slides Template for PowerPoint & Google Slides
Agenda
Free
Colorful Birthday Celebration Slides for PowerPoint & Google Slides
Graphics
Colorful Decision Tree Diagram template for PowerPoint & Google Slides
Decision Tree

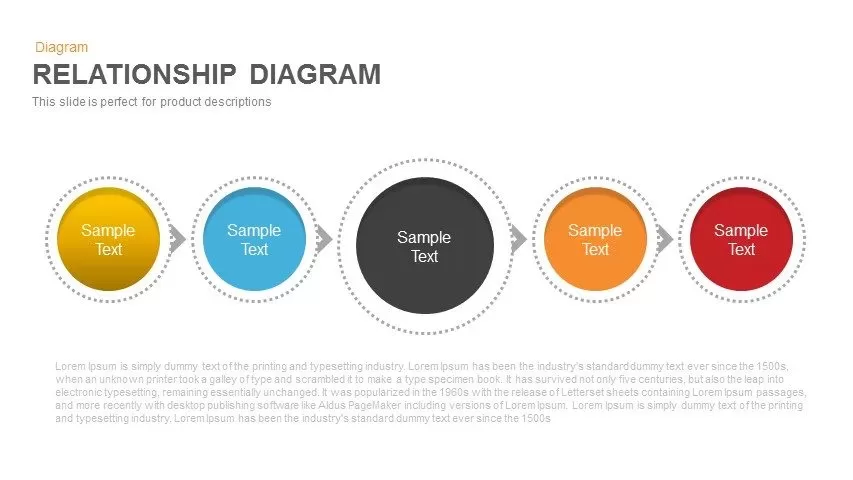
Colorful Five-Stage Relationship Diagram Template for PowerPoint & Google Slides
Process
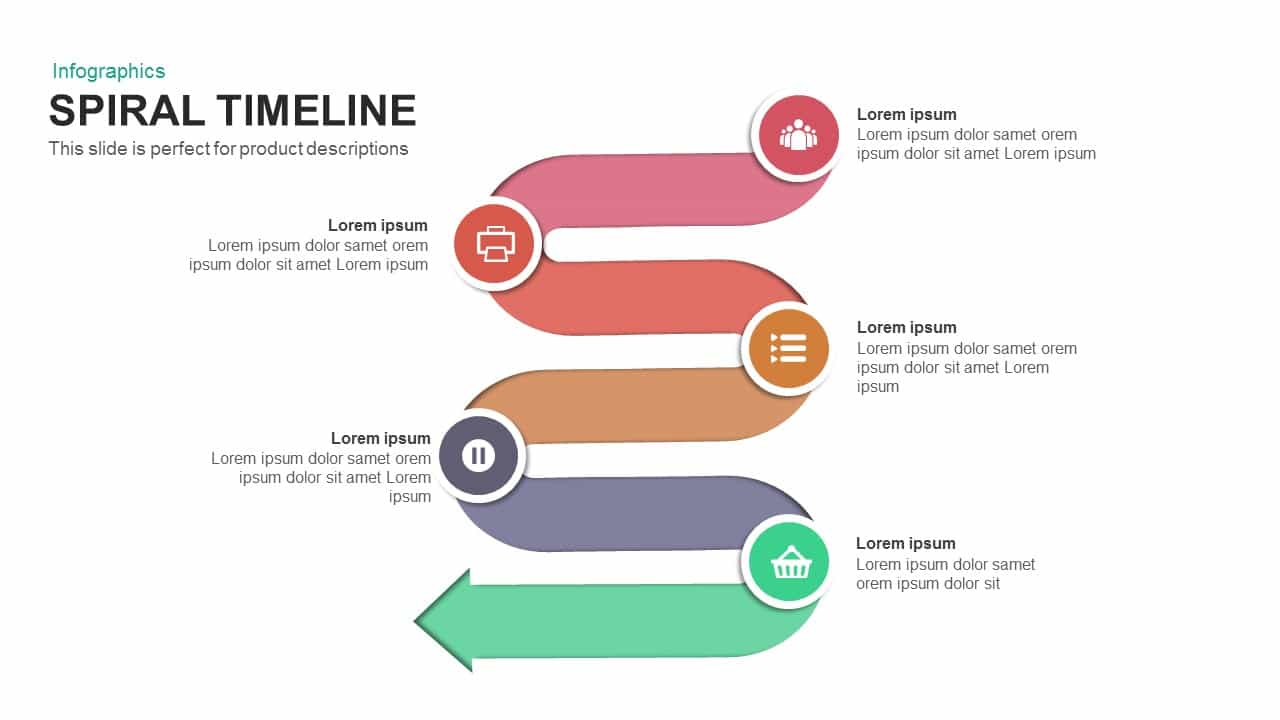
Six-Stage Colorful Spiral Timeline Template for PowerPoint & Google Slides
Timeline
Colorful Venn Diagram Infographics Template for PowerPoint & Google Slides
Circular
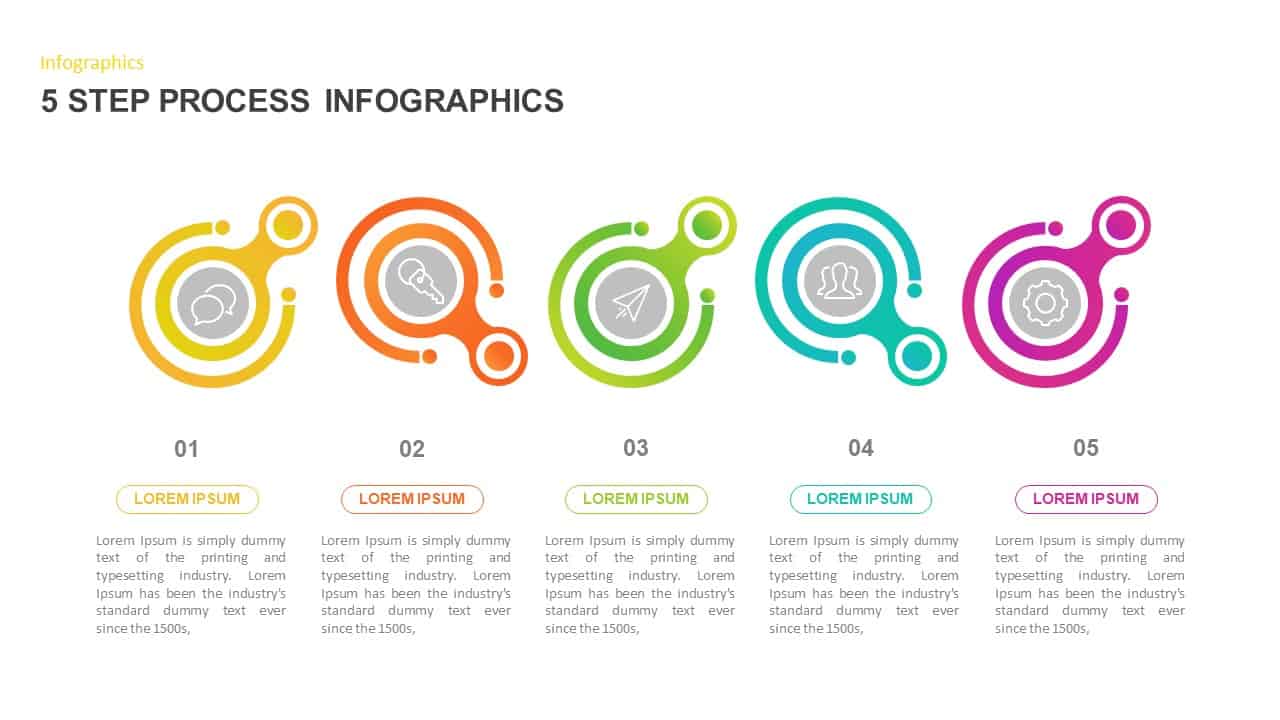
Colorful 5-Step Circular Process Template for PowerPoint & Google Slides
Process
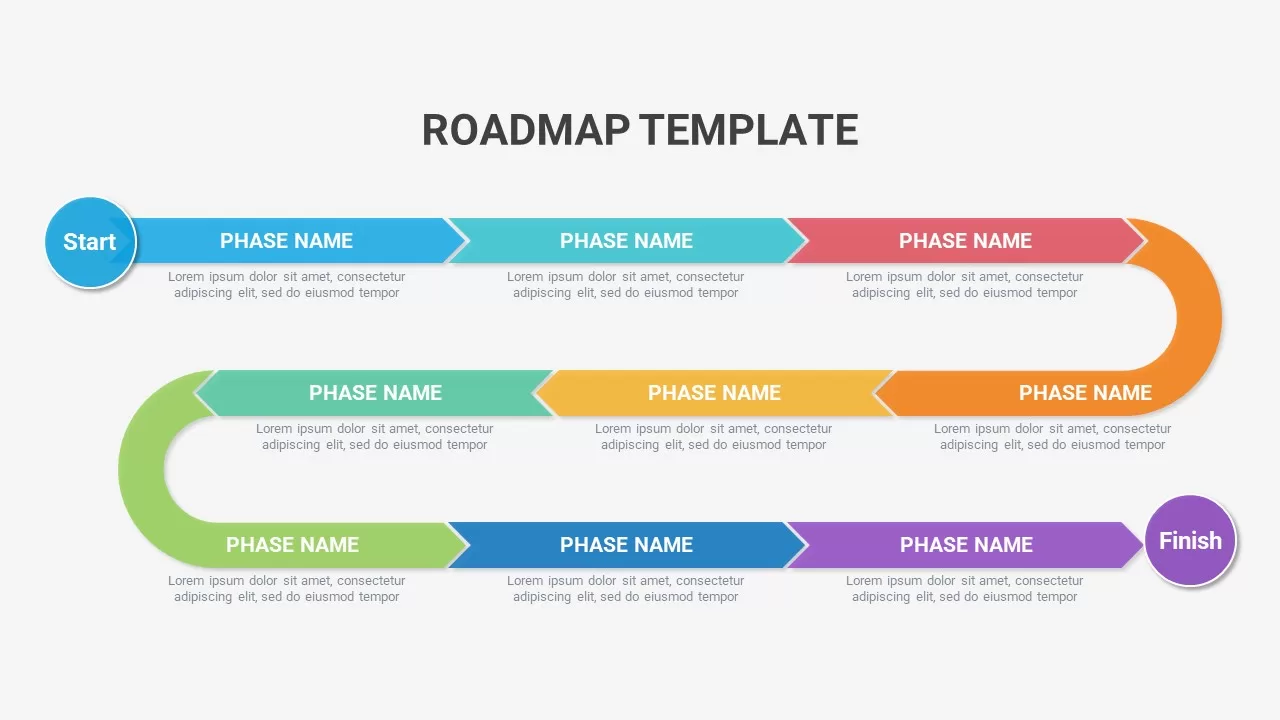
Colorful Curved Roadmap Phases Template for PowerPoint & Google Slides
Roadmap
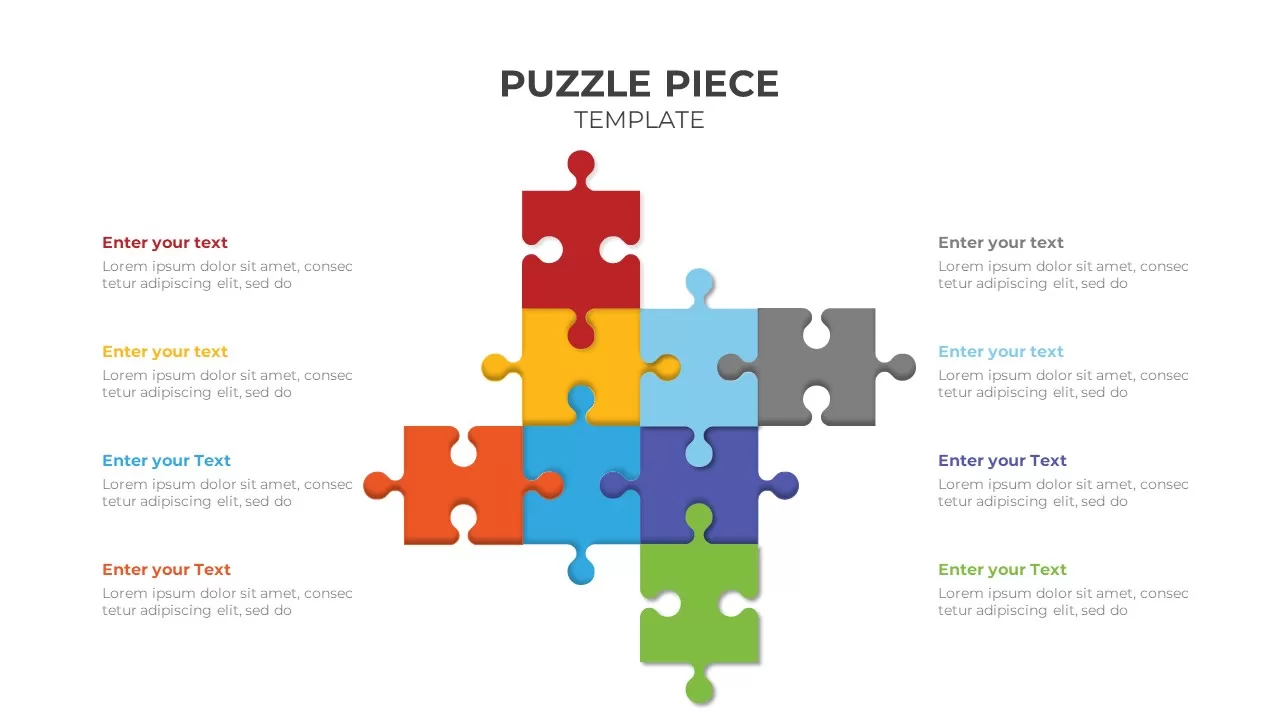
Colorful Eight-Piece Puzzle Diagram Template for PowerPoint & Google Slides
Process
Colorful SWOT Analysis Quadrant Template for PowerPoint & Google Slides
SWOT
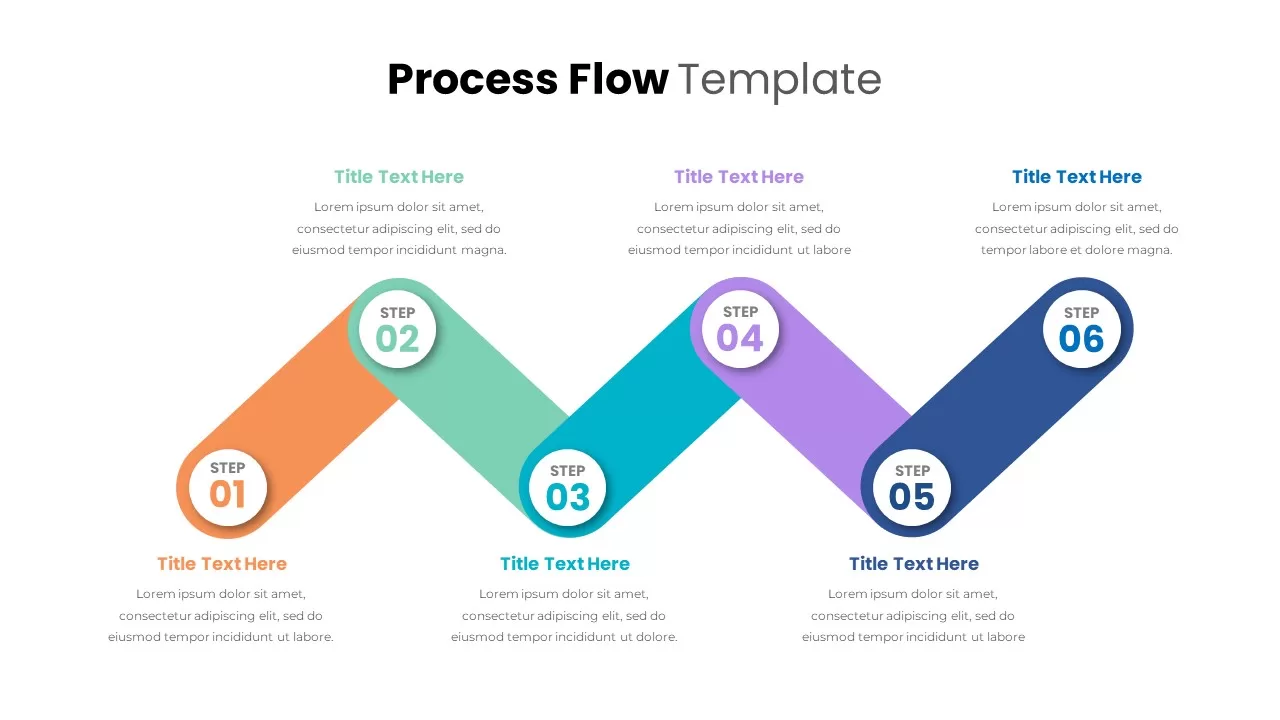
Colorful Process Flow Template for PowerPoint & Google Slides
Process
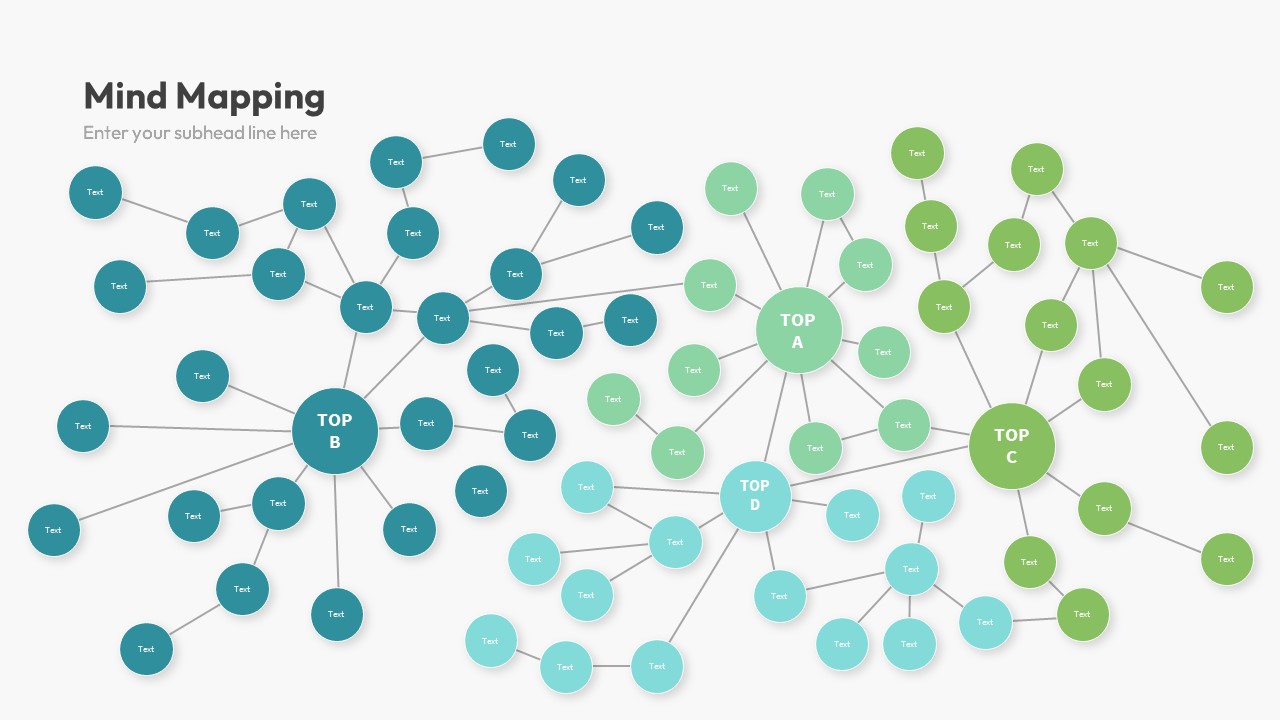
Colorful Mind Map Template for PowerPoint & Google Slides
Mind Maps
Colorful Process Flow Infographics Template for PowerPoint & Google Slides
Process
Colorful Project Status Dashboard Template for PowerPoint & Google Slides
Project Status
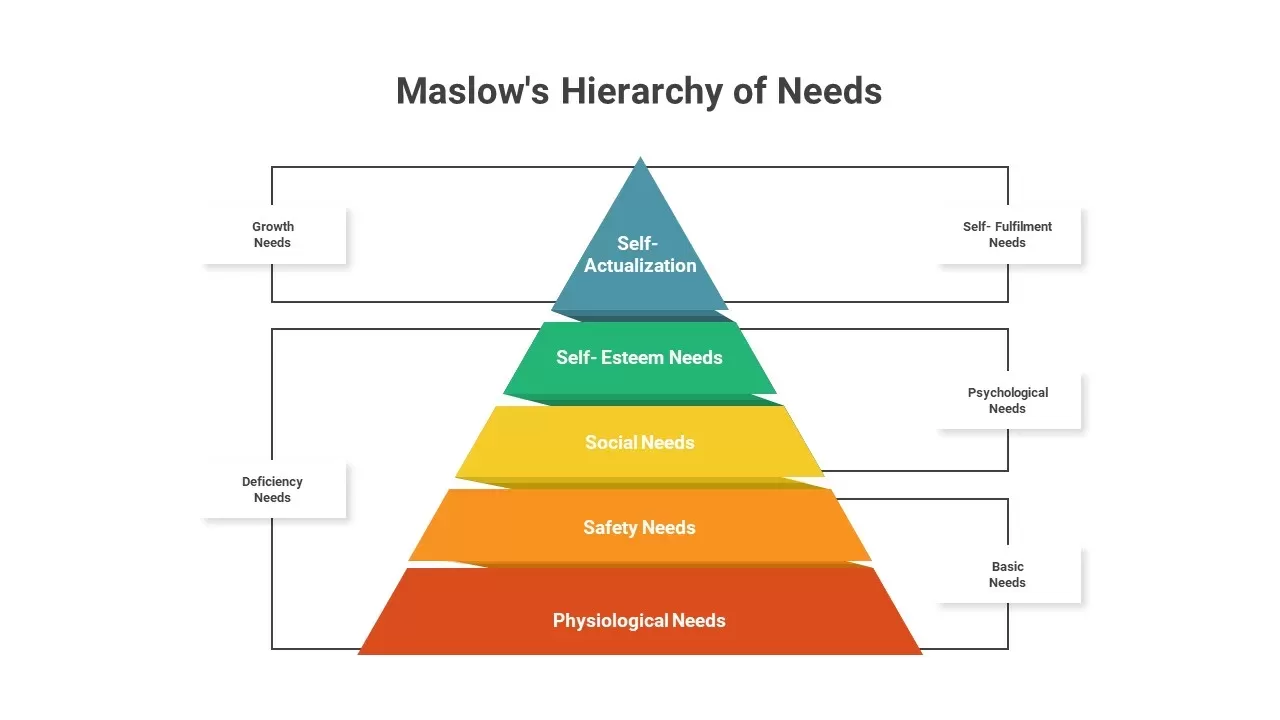
Maslow’s Colorful Pyramid of Needs Template for PowerPoint & Google Slides
Pyramid
Colorful Arrow Methodology Steps Template for PowerPoint & Google Slides
Process
Six-Step Colorful Flywheel Diagram Template for PowerPoint & Google Slides
Circular
Colorful Feature List Presentation Template for PowerPoint & Google Slides
Decks
Colorful Snake Process Diagram Template for PowerPoint & Google Slides
Process

Groovy Retro Colorful Presentation Template for PowerPoint & Google Slides
Company Profile
Free Graffiti Style Colorful Presentation Template for PowerPoint & Google Slides
Pitch Deck
Free
Colorful Education Roadmap Workshop Timeline Template for PowerPoint & Google Slides
Roadmap
Free Modern Colorful Business Plan Deck Template for PowerPoint & Google Slides
Business Plan
Free
Colorful Creative Presentation Deck Template for PowerPoint & Google Slides
Company Profile
Colorful Conflict Handling Matrix Template for PowerPoint & Google Slides
Comparison
Colorful Annual Gantt Chart Project Planner Template for PowerPoint & Google Slides
Gantt Chart
SWOT Template with Colorful Circles for PowerPoint & Google Slides
SWOT
Four-Level Colorful Pyramid Diagram Template for PowerPoint & Google Slides
Pyramid