Asymmetric Betting Payoff Risk Diagram Template for PowerPoint & Google Slides

Description
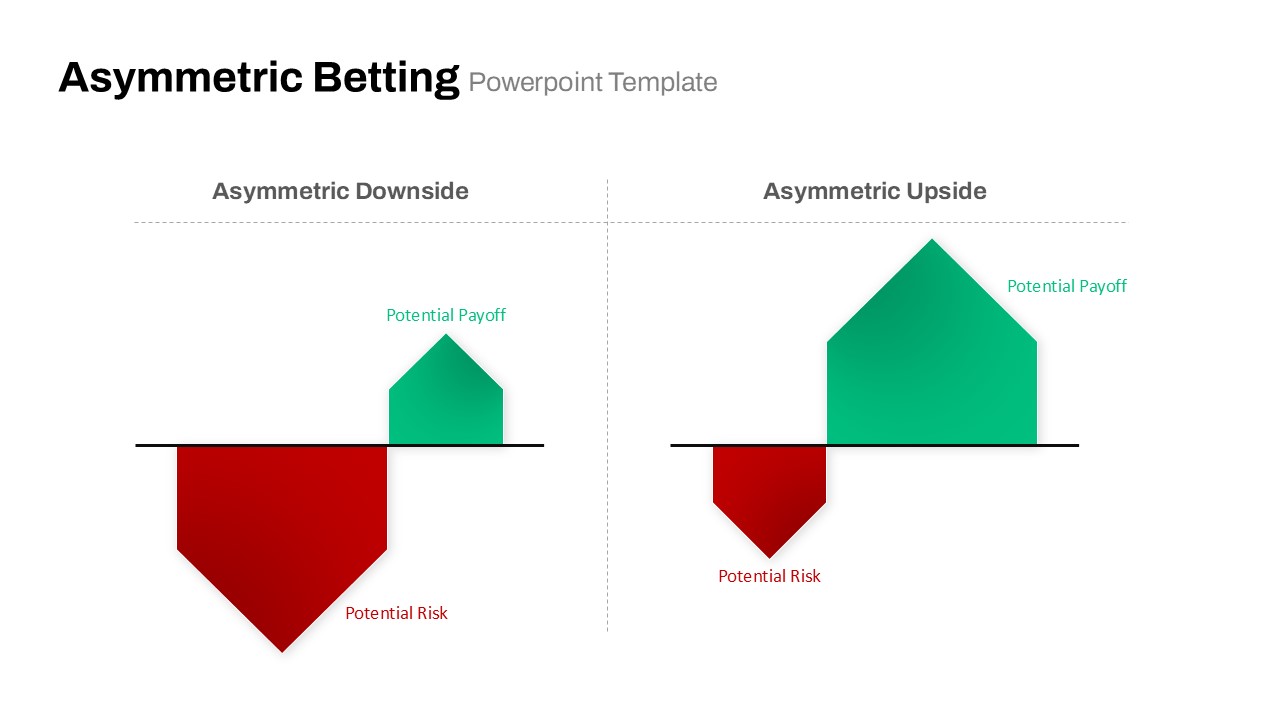
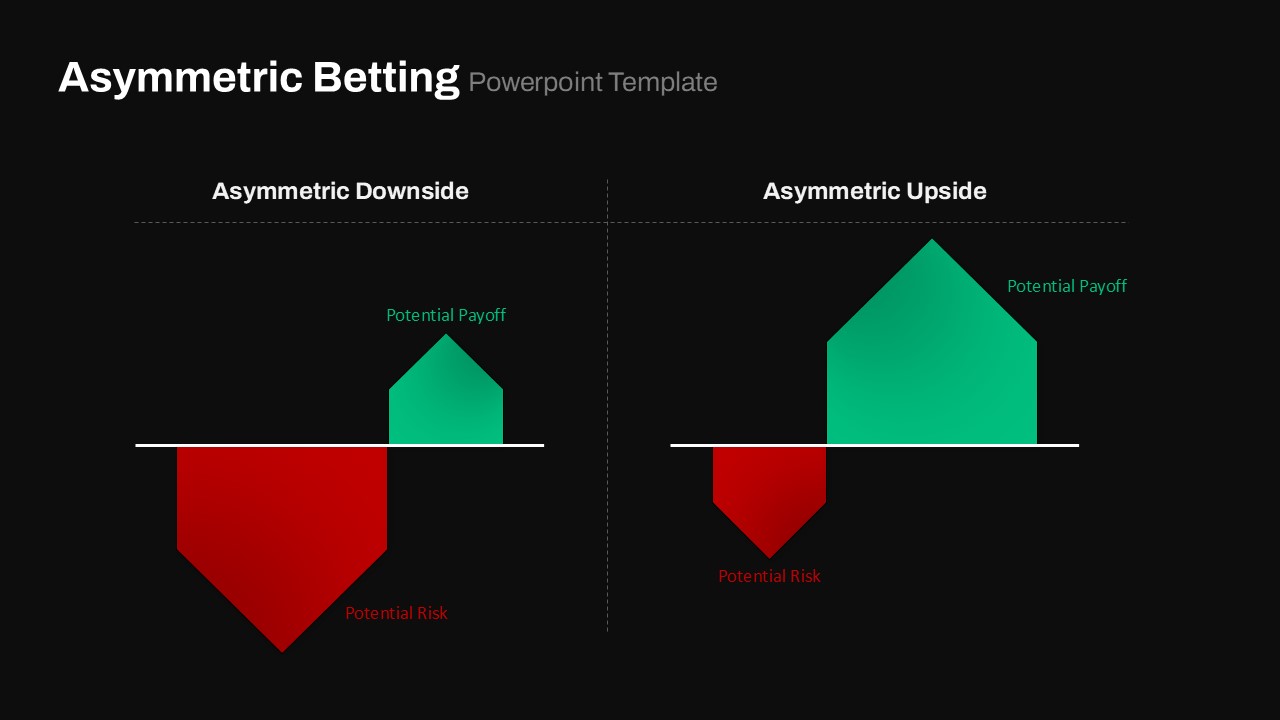
Highlight skewed risk-reward relationships with this asymmetric betting payoff risk diagram template, designed for PowerPoint & Google Slides. The slide presents two side-by-side infographics under “Asymmetric Downside” and “Asymmetric Upside” headings, each rendered on a clean baseline. Bold, gradient-filled shapes—a deep red inverted trapezoid to represent potential risk and a vibrant green pentagon to illustrate potential payoff—dramatically emphasize imbalance. Dashed division lines and concise labels guide audience interpretation and reinforce comparative context.
Built on fully editable master slides, you can customize text placeholders, adjust gradient swatches, and swap icons or shapes to align with your corporate branding or project requirements. The minimalist white background maximizes focus on the colored diagrams, while preset animations enable sequential reveals that drive home the contrast between limited downside versus amplified upside scenarios. Seamless compatibility with both desktop and cloud-based environments ensures consistent formatting in PowerPoint and Google Slides, eliminating version-control headaches during collaborative projects.
Ideal for investor pitches, product-launch assessments, or risk-management workshops, this template clarifies how asymmetric payoff structures can optimize strategic decision-making. It also serves as a powerful visual aid for hedge-fund strategies, venture-capital analyses, and executive presentations on portfolio diversification. Duplicate the slide to compare multiple case studies, reorganize shape sizes to highlight different scales of risk versus reward, or integrate supporting charts for deeper analysis.
Beyond financial applications, leverage this diagram to illustrate asymmetric outcomes in marketing experiments, operational-efficiency initiatives, or technology investments. Use the design to compare best-case vs worst-case scenarios, product-feature trade-offs, or resource allocation decisions. With uniform typography and intuitive legends, maintain consistency across multiple slides and streamline narrative flow, so your insights into strategic imbalances are communicated with clarity and impact.
Who is it for
Financial analysts, portfolio managers, and risk officers will benefit from this slide when presenting skewed payoff structures. Consultants, startup founders, and marketing strategists can also leverage the contrasting infographics to illustrate asymmetric outcomes in experiments and investments.
Other Uses
Repurpose this diagram for product-feature trade-off analyses, operational efficiency comparisons, or scenario-planning workshops. Use it to contrast best-case vs worst-case outcomes, resource allocation strategies, or technology-investment payoffs.
Login to download this file

Item ID
SB04661
Related Templates

Risk Management Mind Map Radial Diagram template for PowerPoint & Google Slides
Mind Maps
Marketing Risk Management Gear Diagram Template for PowerPoint & Google Slides
Risk Management
Risk Management Heat Map Diagram Template for PowerPoint & Google Slides
Comparison Chart

Enterprise Risk Management Cycle Diagram Template for PowerPoint & Google Slides
Process
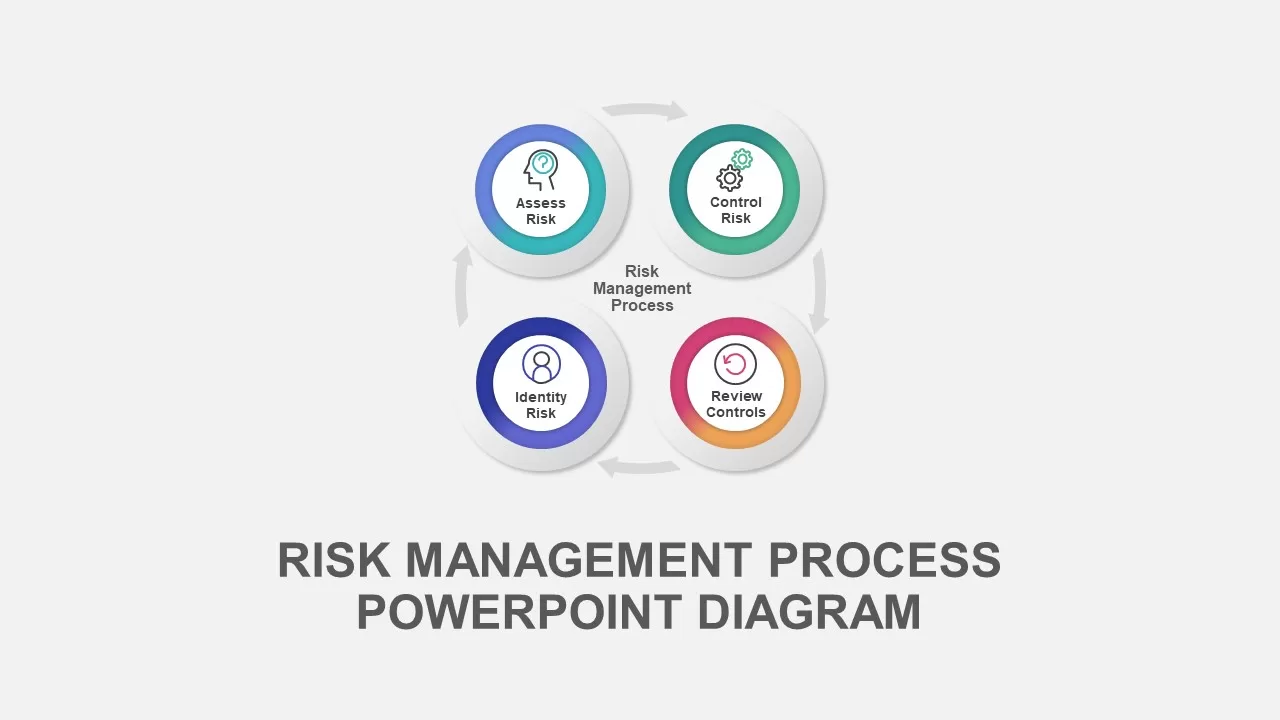
Risk Management Process Diagram Template for PowerPoint & Google Slides
Risk Management
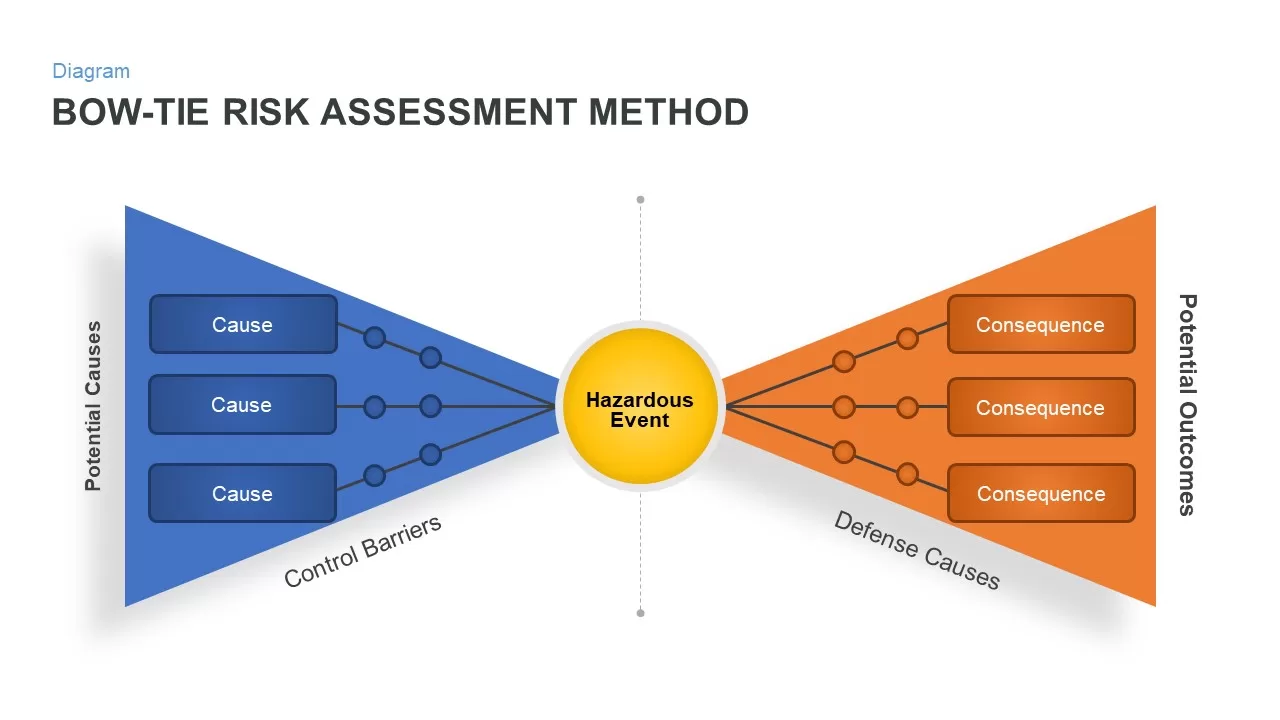
Bow-Tie Risk Assessment Diagram Template for PowerPoint & Google Slides
Risk Management
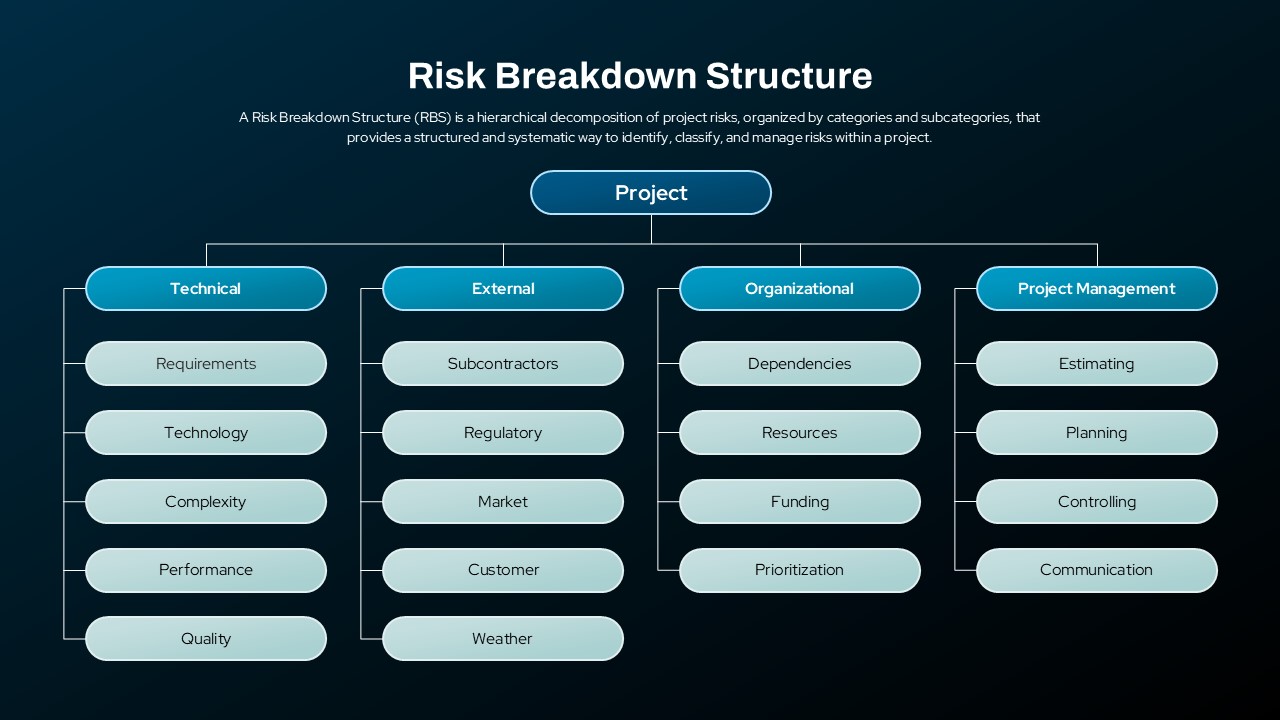
Risk Breakdown Structure Diagram Template for PowerPoint & Google Slides
Org Chart

Bold Diamond Risk Alert Visualization Template for PowerPoint & Google Slides
Risk Management
Risk Management Presentation Template for PowerPoint and Google Slides
Decks
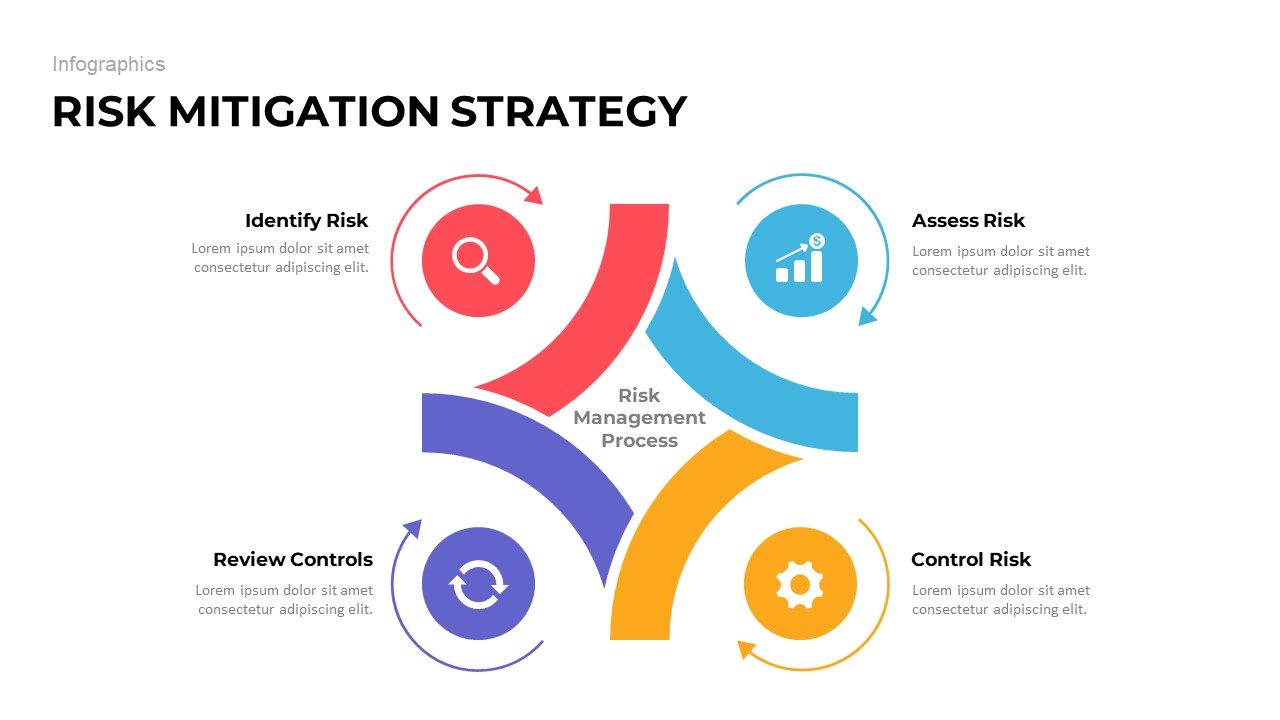
Risk Mitigation Strategy template for PowerPoint & Google Slides
Risk Management
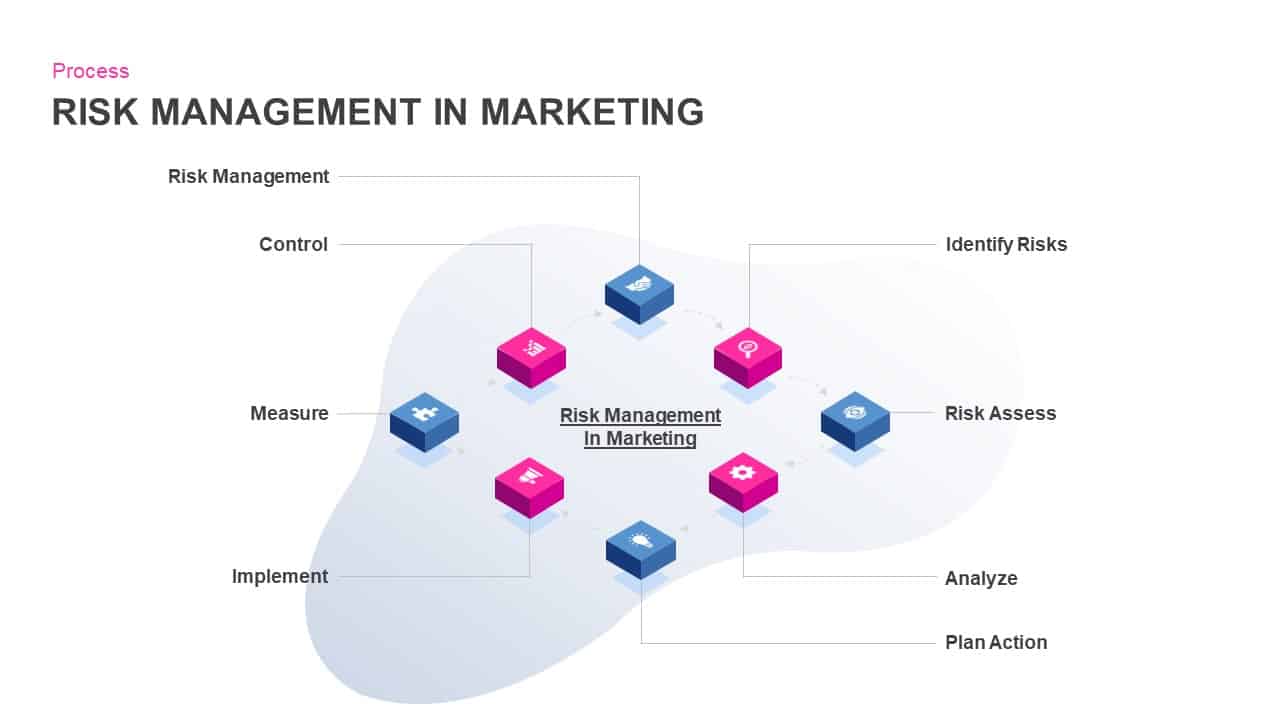
Risk Management in Marketing Process Template for PowerPoint & Google Slides
Risk Management
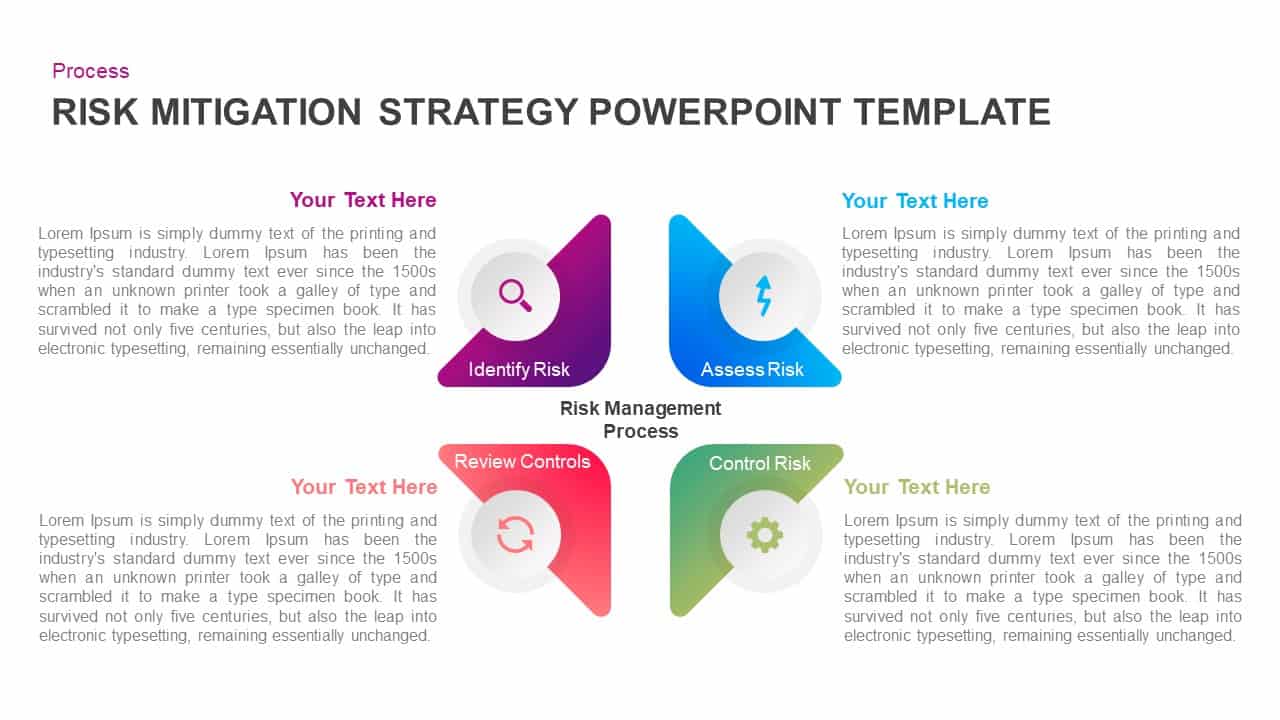
Four-Step Risk Mitigation Strategy Template for PowerPoint & Google Slides
Process
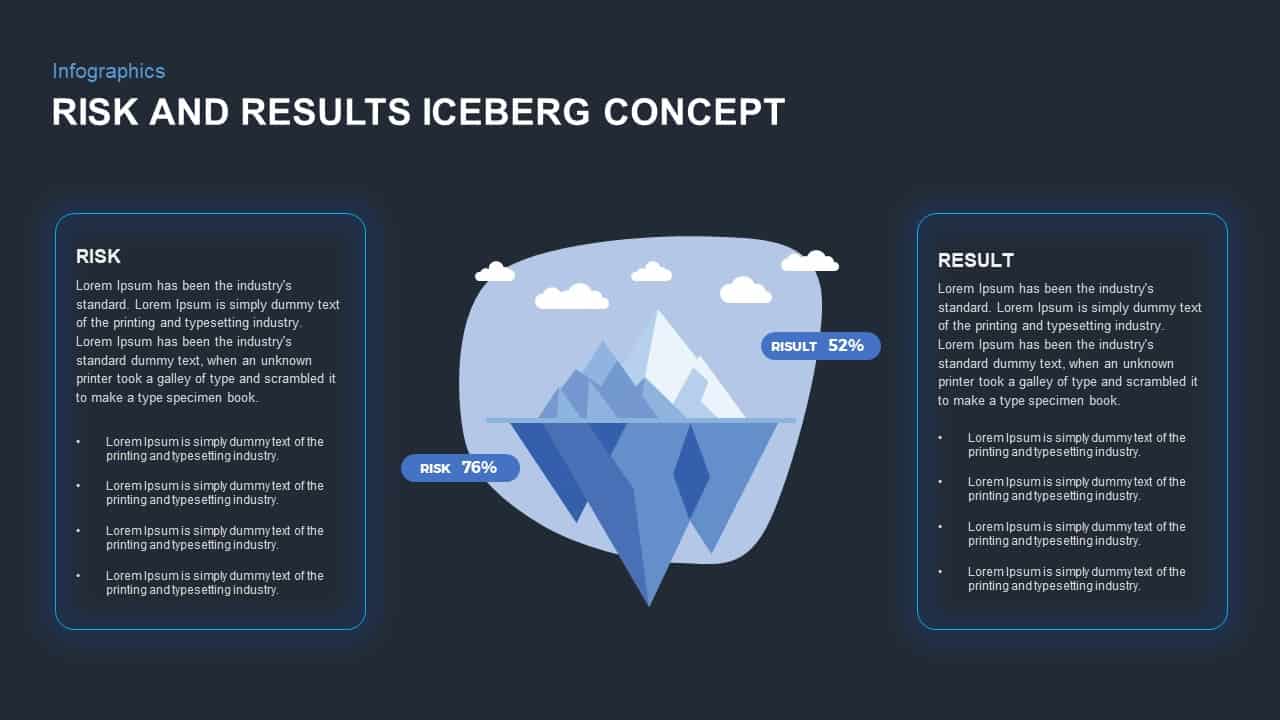
Risk and Results Iceberg Infographic Template for PowerPoint & Google Slides
Comparison
Comprehensive Risk Impact Analysis Template for PowerPoint & Google Slides
Risk Management
Heat Map Risk Assessment Presentation Template for PowerPoint & Google Slides
Risk Management
Professional Risk Heat Map Visualization Template for PowerPoint & Google Slides
Risk Management
Heat Map Risk Matrix Dashboard Template for PowerPoint & Google Slides
Comparison Chart
Risk Assessment Heatmap Matrix Slide Template for PowerPoint & Google Slides
Comparison Chart
Risk Heatmap Comparison Template for PowerPoint & Google Slides
Maps
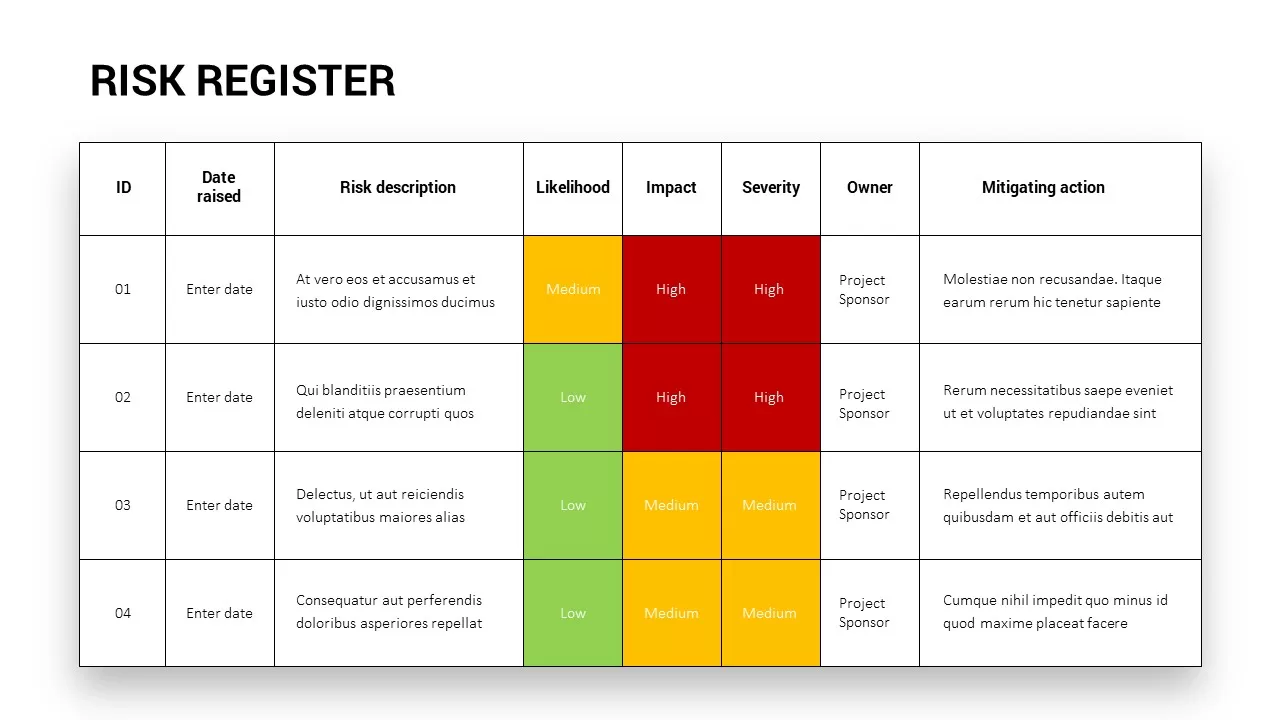
Comprehensive Risk Register Table Template for PowerPoint & Google Slides
Risk Management
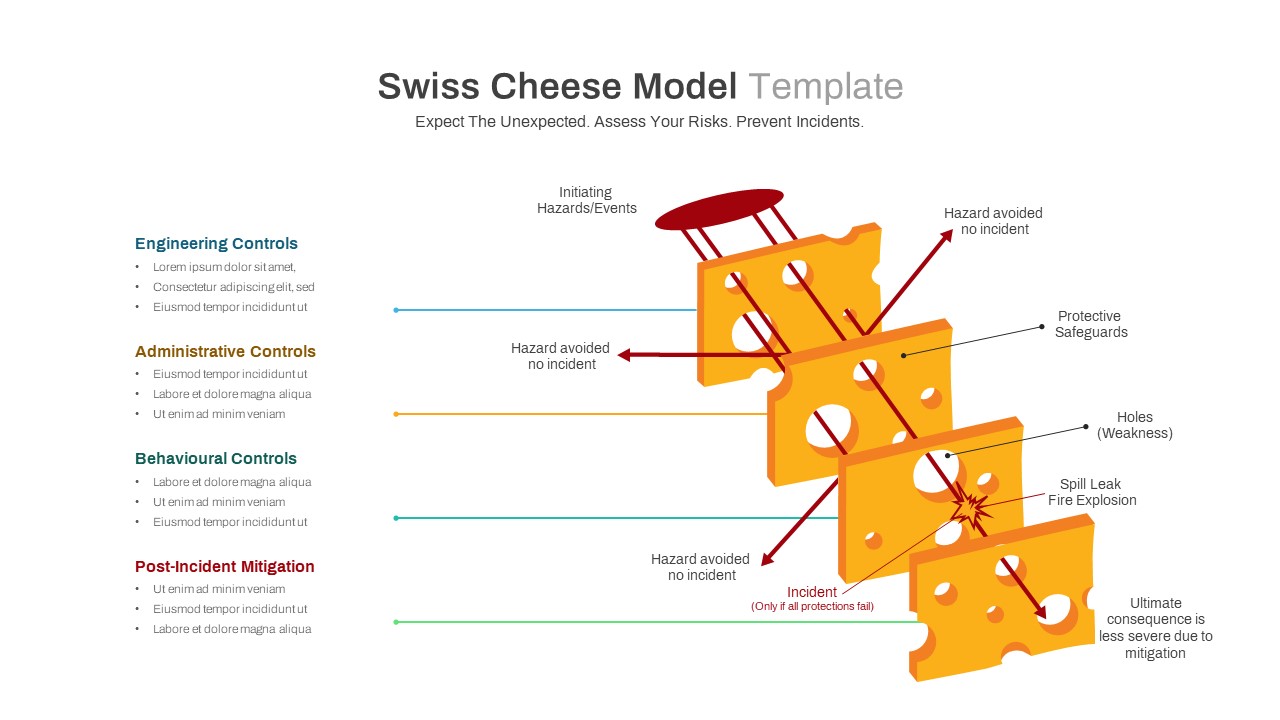
Swiss Cheese Risk Management Model Template for PowerPoint & Google Slides
Risk Management
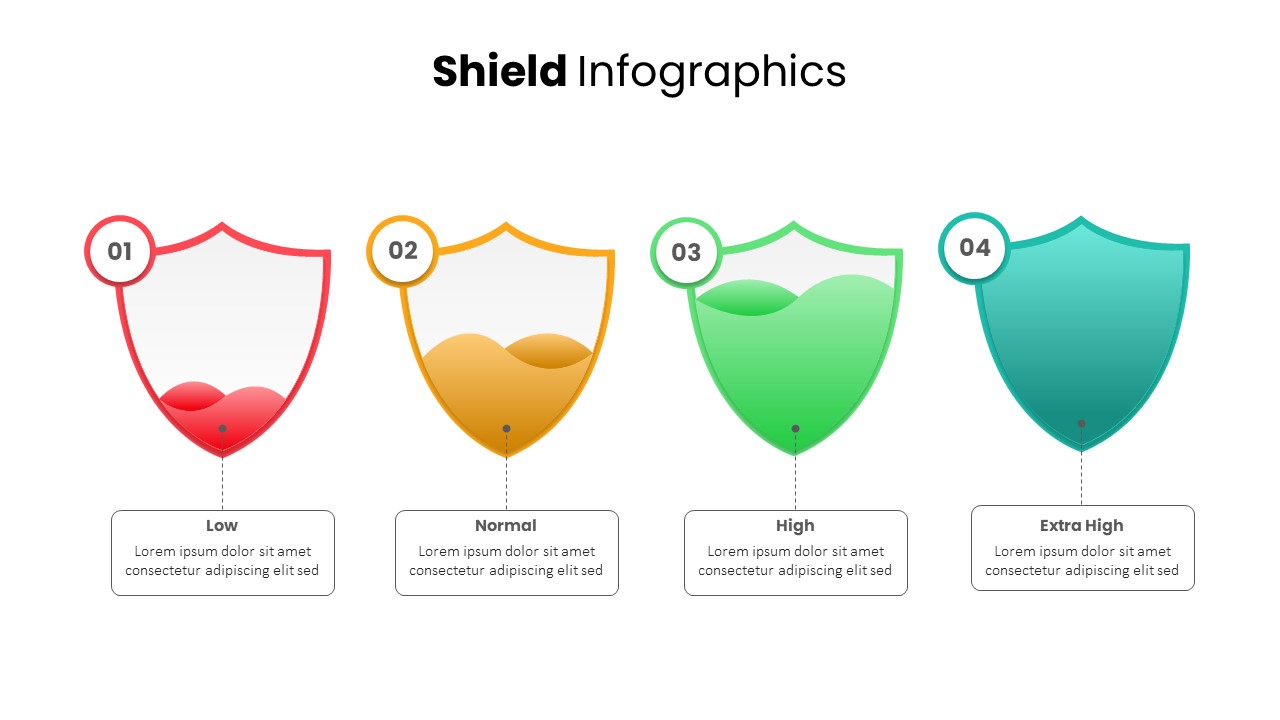
Shield Infographics Risk Indicators Template for PowerPoint & Google Slides
Infographics
Risk Pyramid Hierarchy Analysis Template for PowerPoint & Google Slides
Pyramid
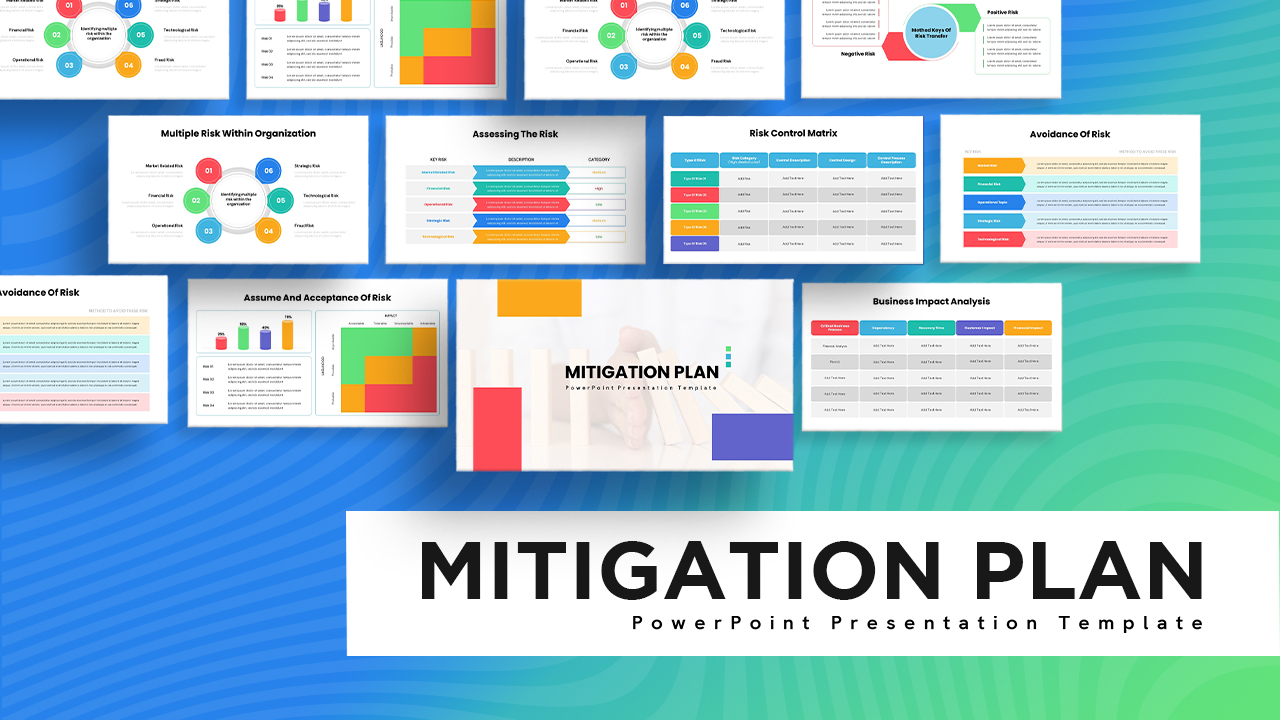
Risk Mitigation Plan Deck Template for PowerPoint & Google Slides
Risk Management
Work Safety Training & Risk Management Template for PowerPoint & Google Slides
Risk Management
Risk Management Consulting Deck Template for PowerPoint & Google Slides
Risk Management
Risk Level Gauge Comparison Dashboard Template for PowerPoint & Google Slides
Comparison
Operational Risk Template for PowerPoint & Google Slides
Risk Management
Risk Tolerance Assessment Sliders Template for PowerPoint & Google Slides
Finance
Risk Scoring & Ranking Heatmap Matrix Template for PowerPoint & Google Slides
Risk Management
Risk Management Framework Pyramid Template for PowerPoint & Google Slides
Risk Management
Risk Probability and Impact Matrix Template for PowerPoint & Google Slides
Risk Management
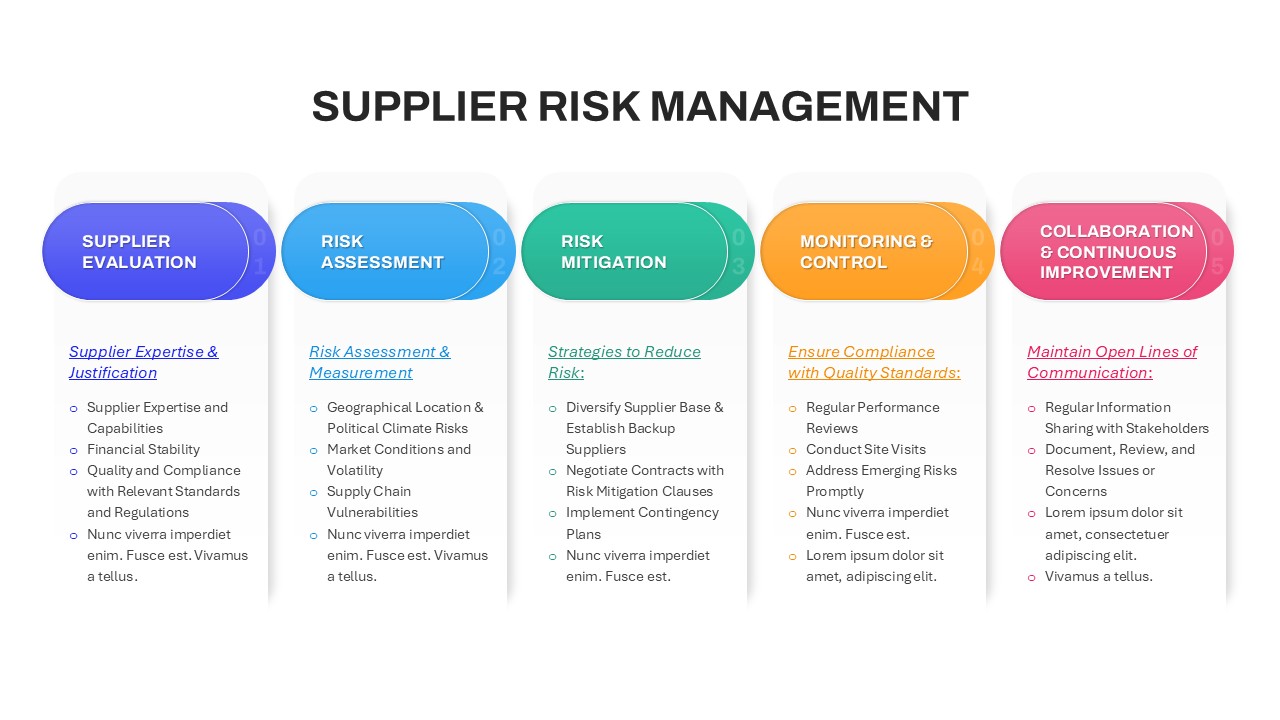
Supplier Risk Management template for PowerPoint & Google Slides
Opportunities Challenges
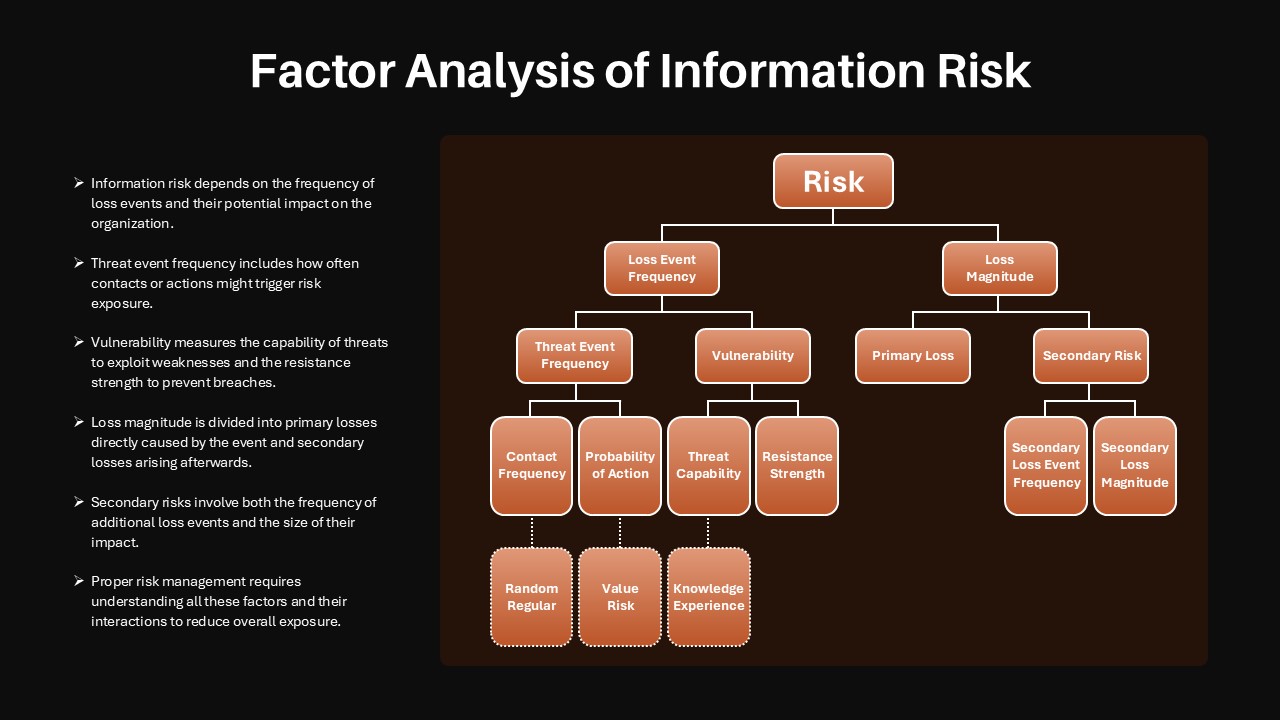
Factor Analysis of Information Risk Template for PowerPoint & Google Slides
Risk Management
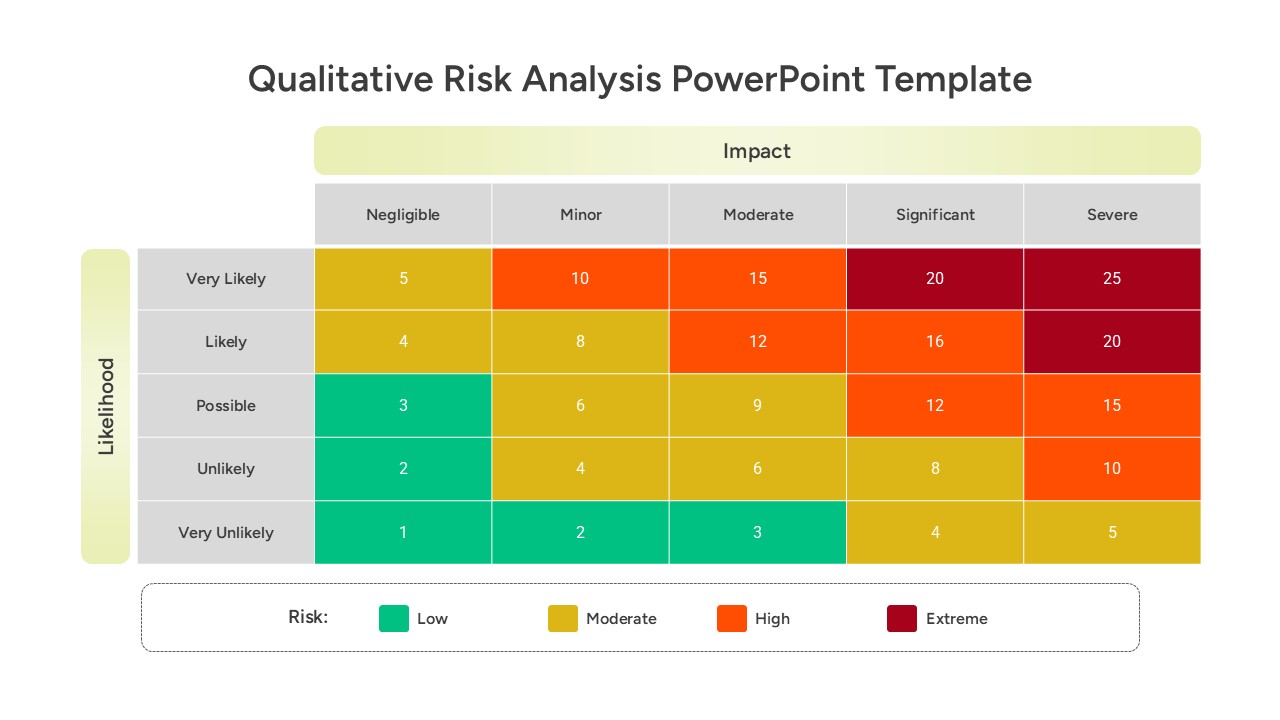
Qualitative Risk Analysis template for PowerPoint & Google Slides
Business
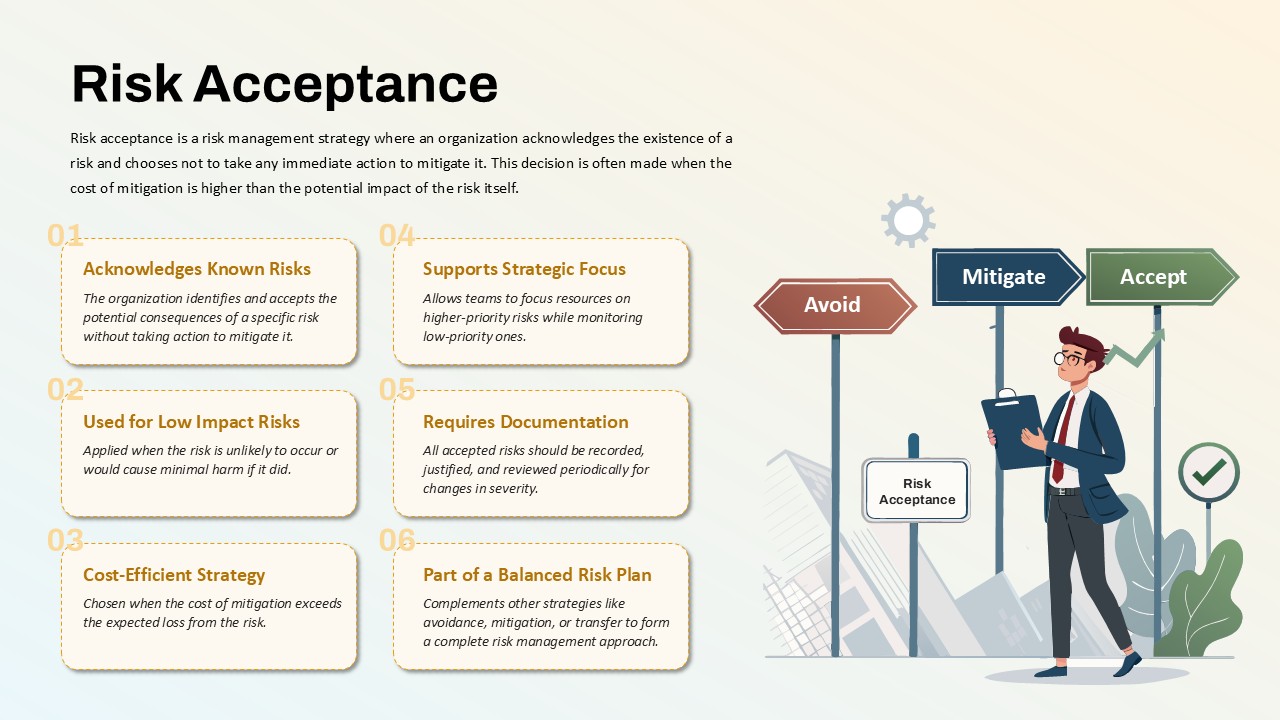
Risk Acceptance Workflow Template for PowerPoint & Google Slides
Risk Management
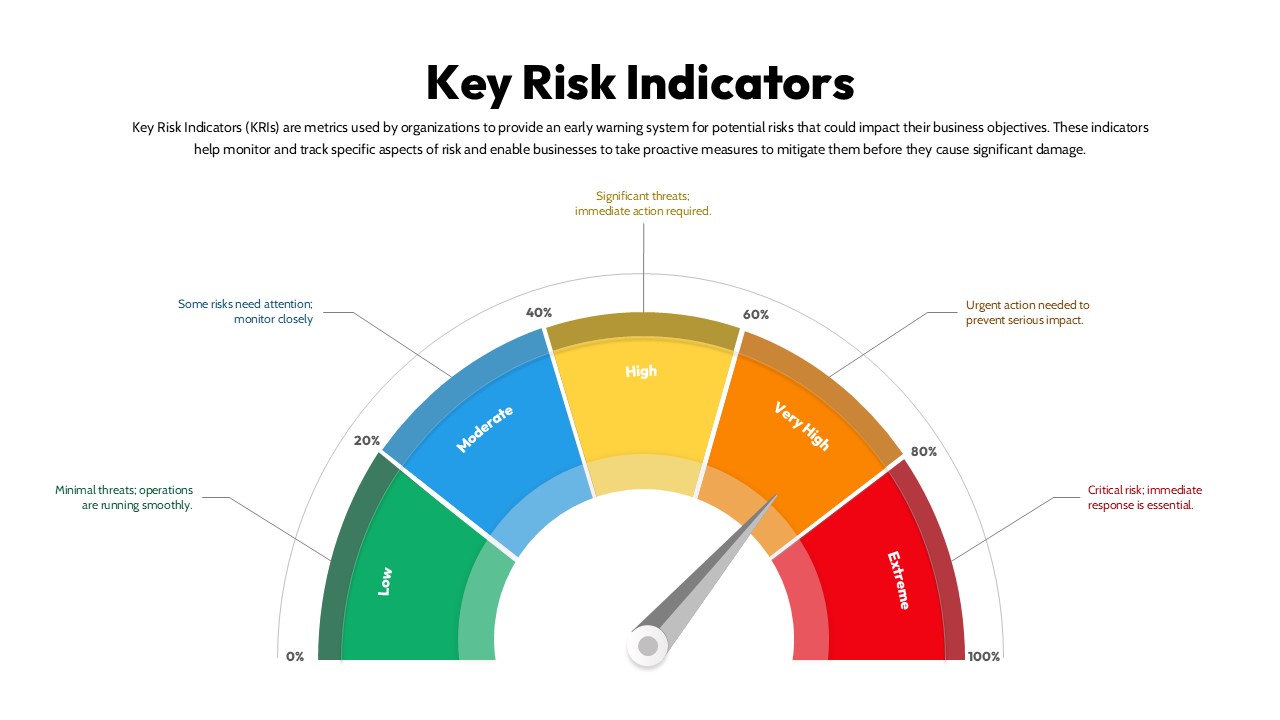
Key Risk Indicators (KRI) Gauge Template for PowerPoint & Google Slides
Risk Management
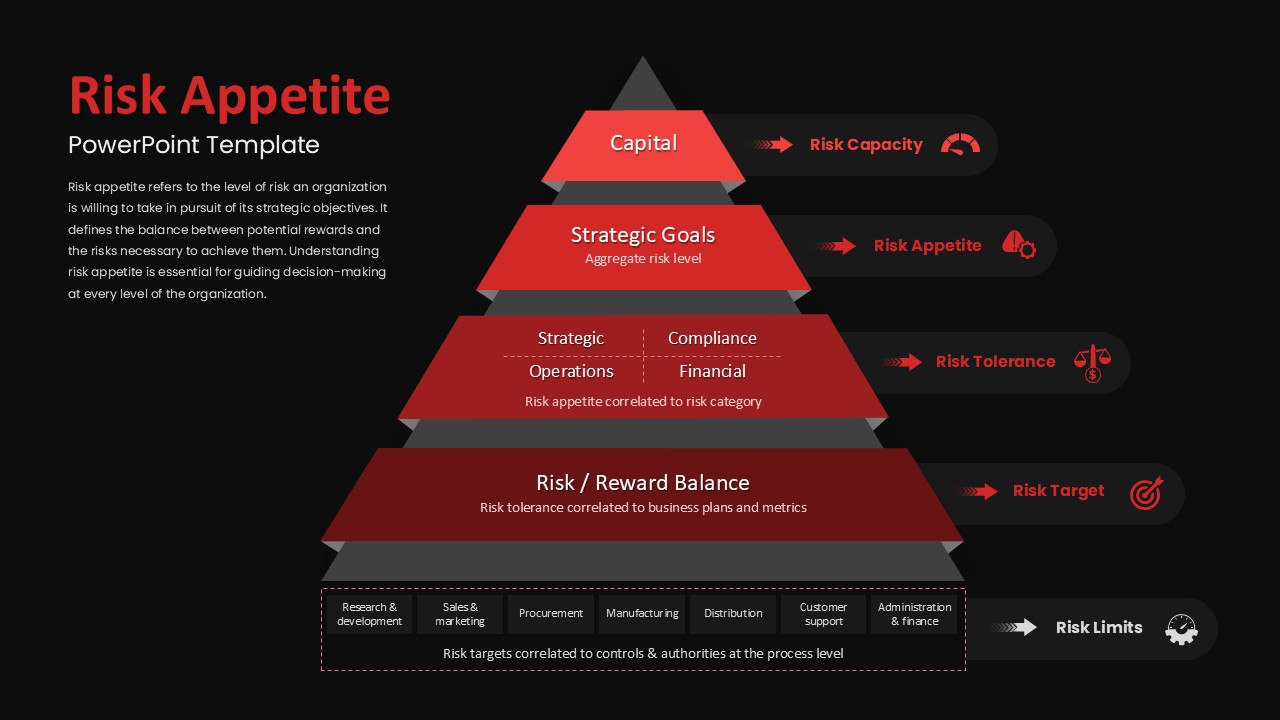
Risk Appetite Pyramid Framework Template for PowerPoint & Google Slides
Pyramid
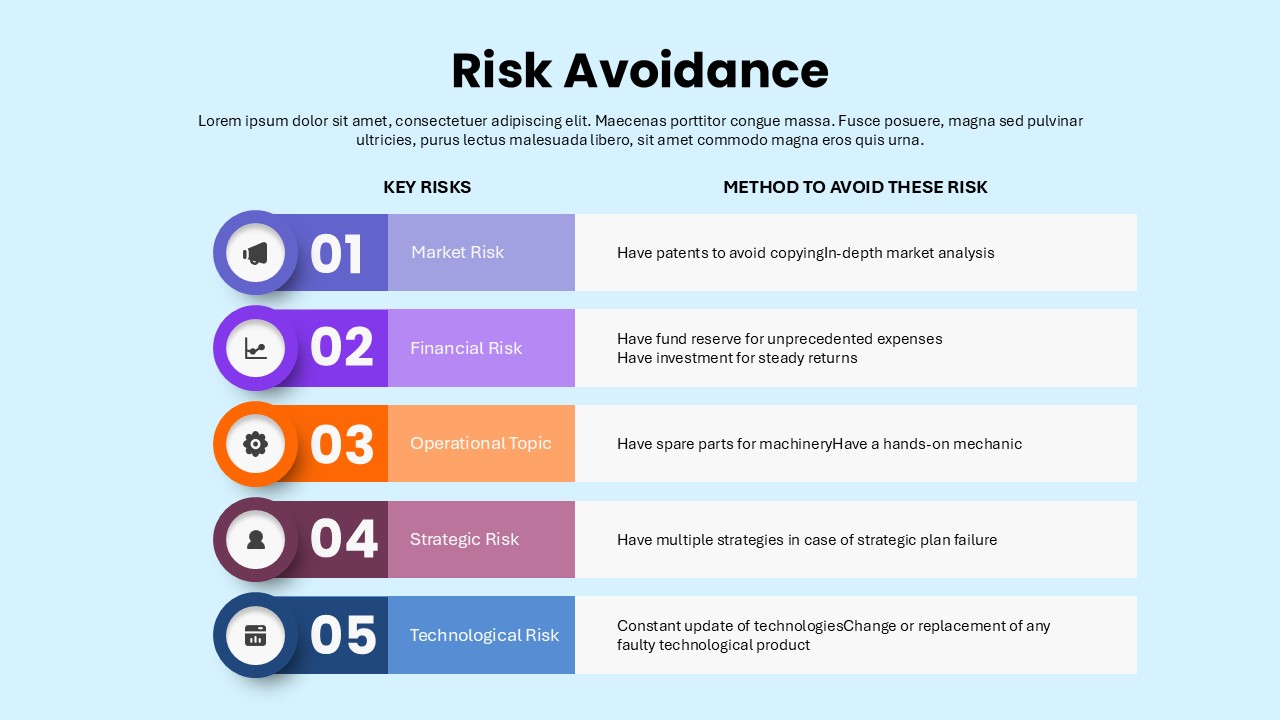
Risk Avoidance: Five Risks & Mitigation Template for PowerPoint & Google Slides
Risk Management
Quantitative Risk Analysis Matrix template for PowerPoint & Google Slides
Risk Management
Risk vs Reward Comparison Template for PowerPoint & Google Slides
Opportunities Challenges
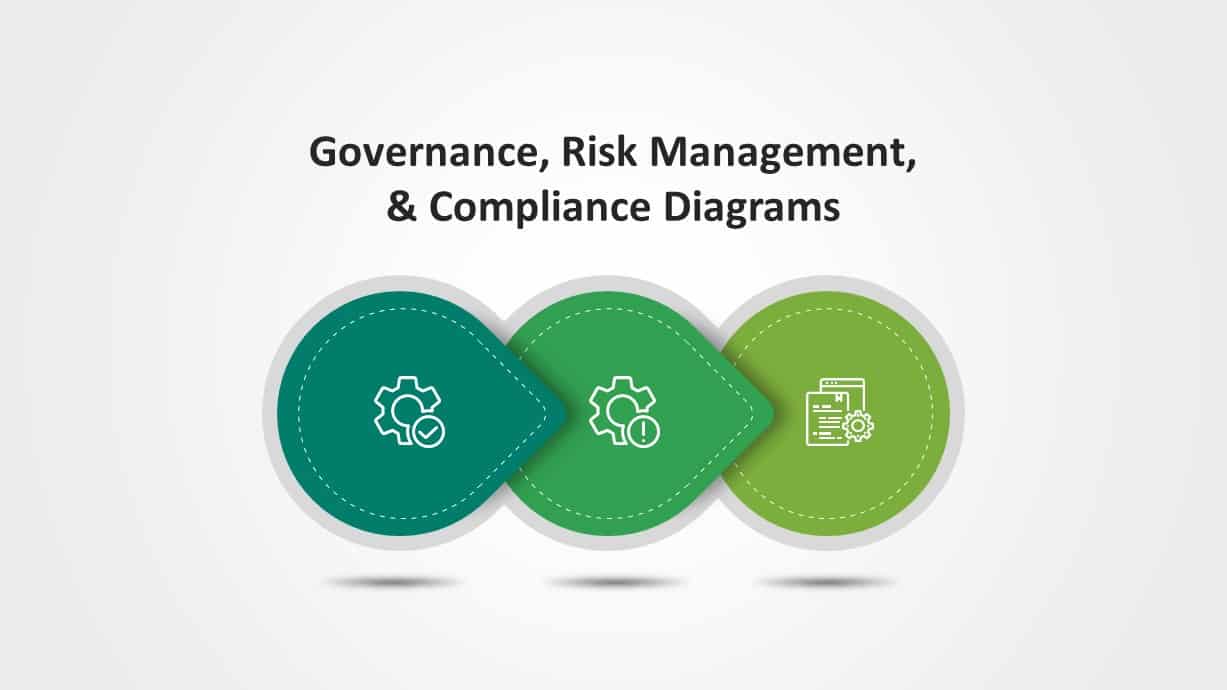
Governance, Risk & Compliance Overview Diagrams for PowerPoint & Google Slides
Risk Management
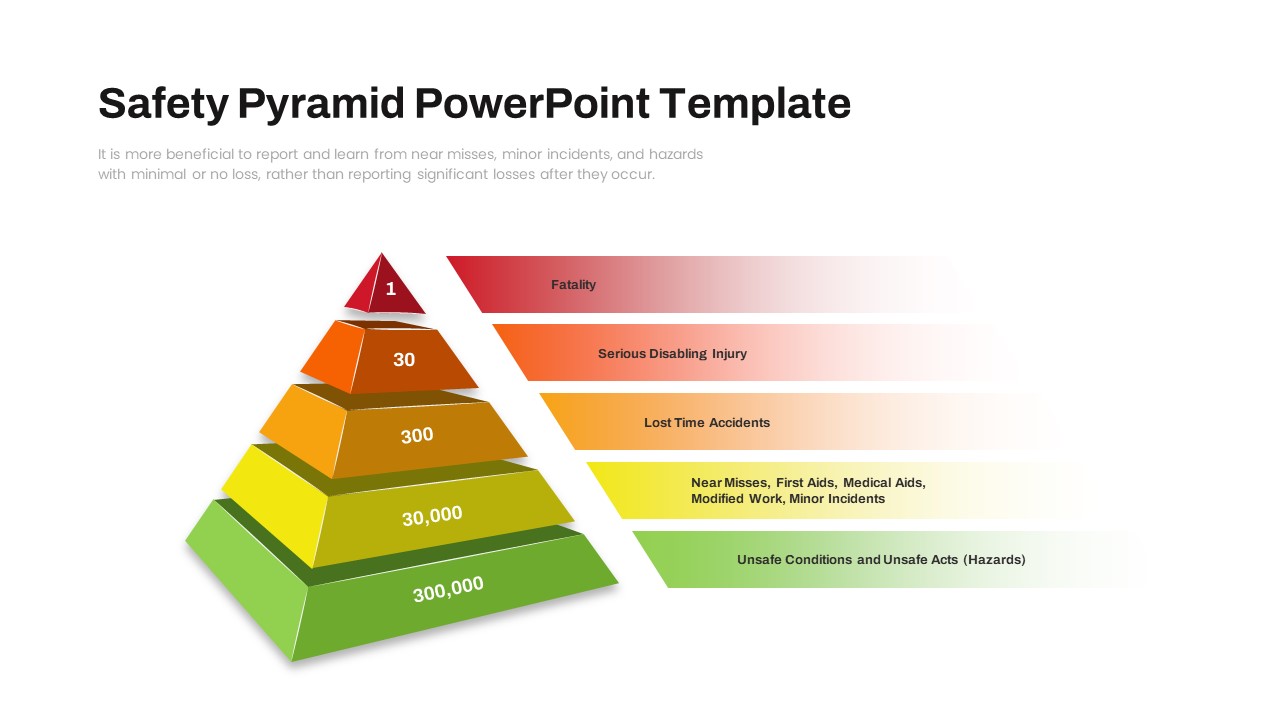
Safety Incident Pyramid Risk Hierarchy Slide for PowerPoint & Google Slides
Risk Management
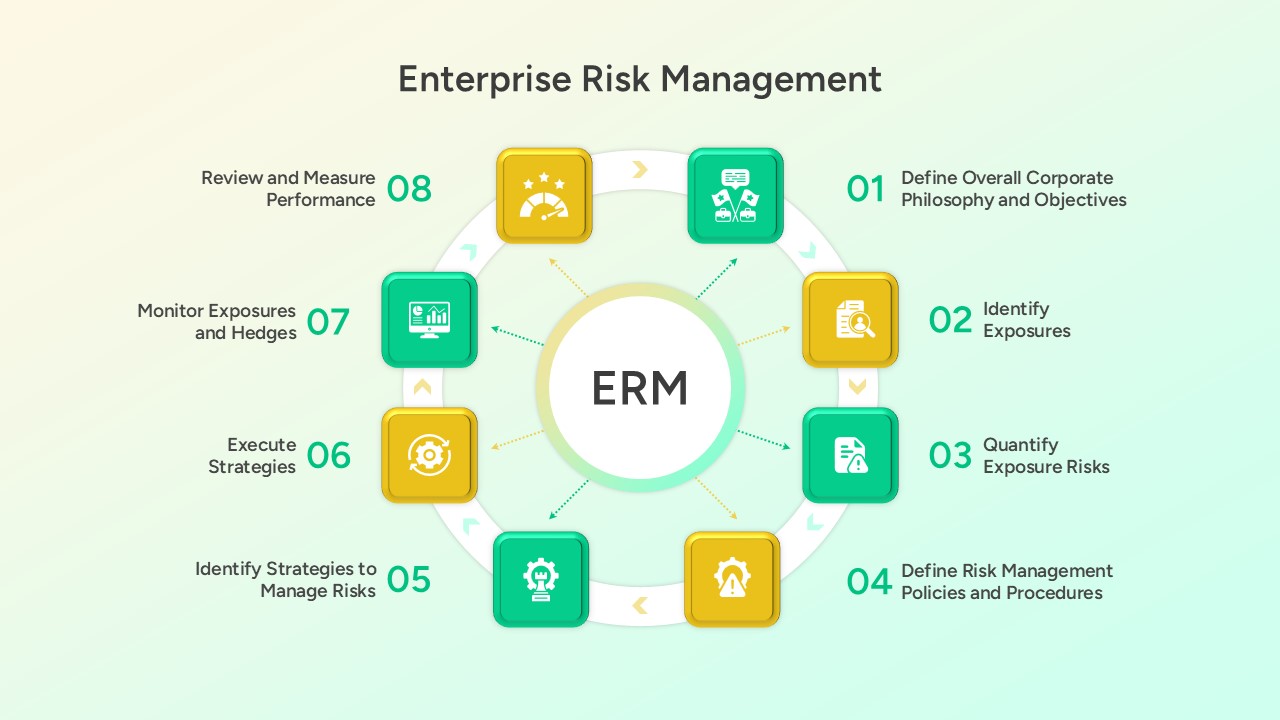
Enterprise Risk Management (ERM) Framework for PowerPoint & Google Slides
Business Plan
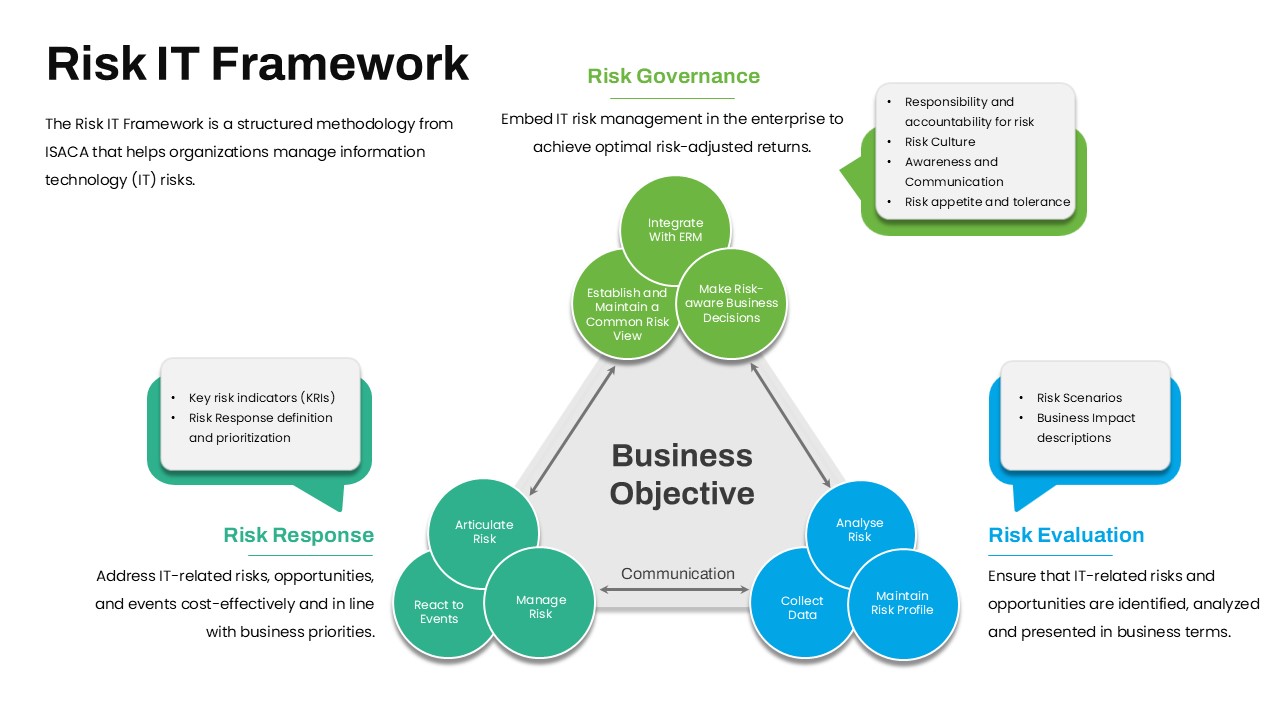
Risk IT Framework Overview for PowerPoint & Google Slides
Business Strategy
Snake Diagram Pack of 8 Slides template for PowerPoint & Google Slides
Process
Gear Process Diagram PowerPoint Template for PowerPoint & Google Slides
Process
Sales Process Workflow Funnel Diagram PowerPoint Template for PowerPoint & Google Slides
Funnel
Puzzle Diagram PowerPoint Template for PowerPoint & Google Slides
Process
Transportation Logistics PowerPoint Diagram template for PowerPoint & Google Slides
Process
Emoji Scale PowerPoint Diagram for PowerPoint & Google Slides
Infographics
4 Step Problem Solving PowerPoint Diagram for PowerPoint & Google Slides
Process
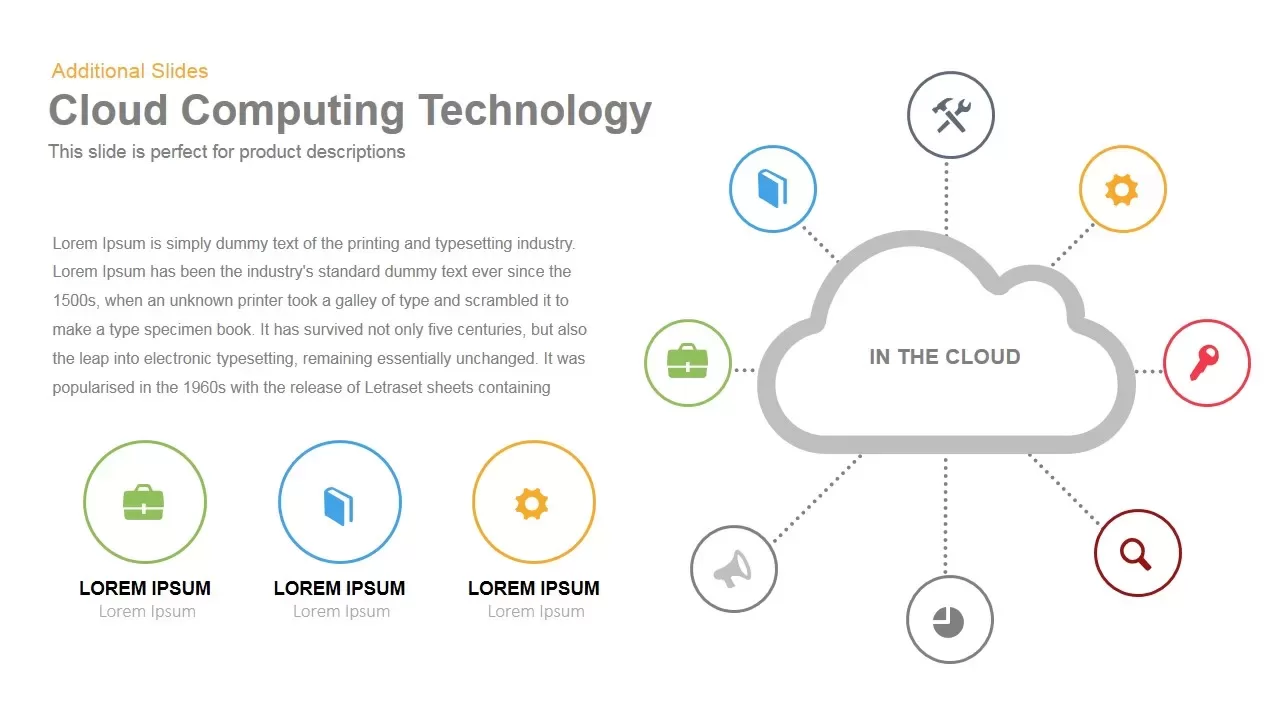
Cloud Computing Diagram template for PowerPoint & Google Slides
Technology
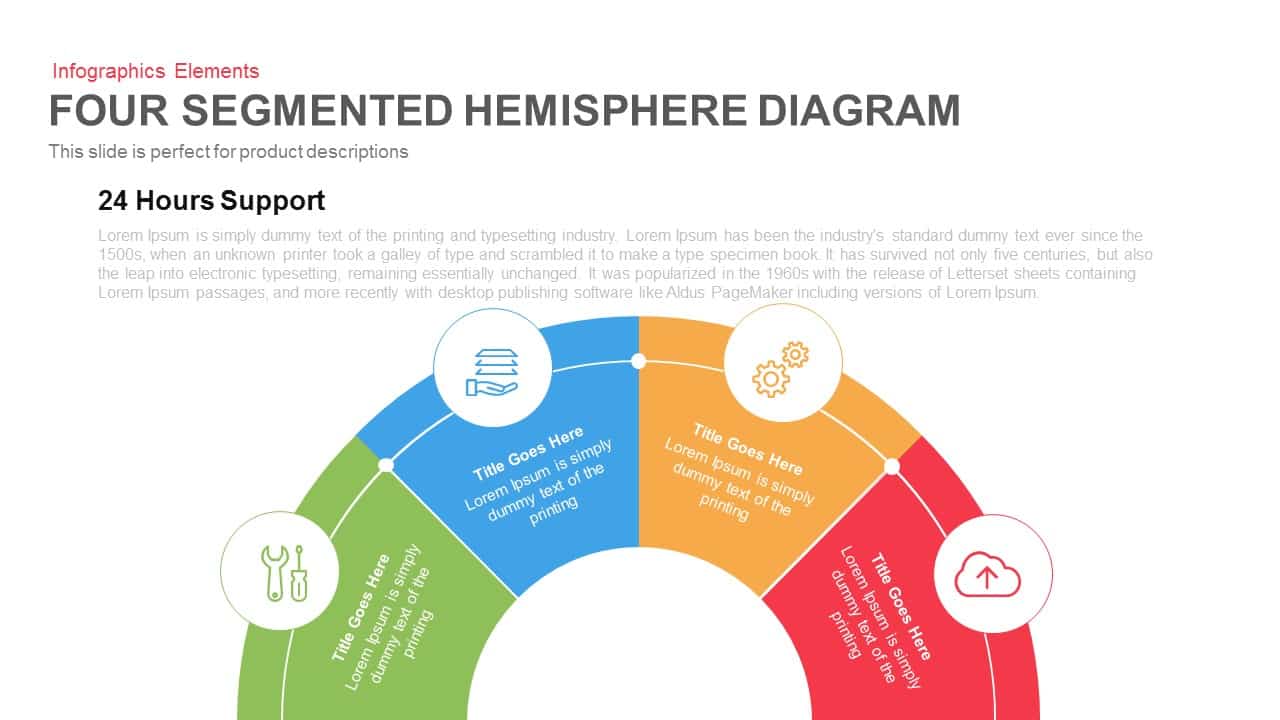
Four Segmented Hemisphere Diagram Template for PowerPoint & Google Slides
Process
Six Step Creative Circular Diagram Template for PowerPoint & Google Slides
Circular
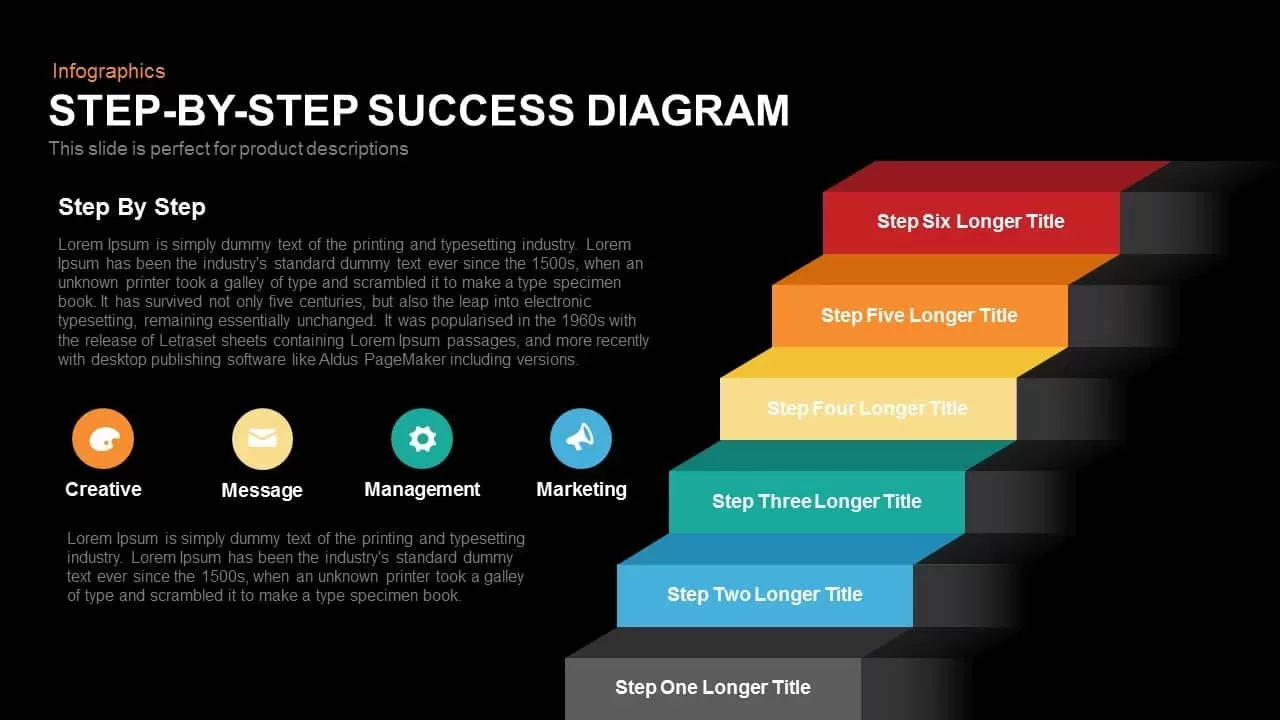
Step-by-Step Success Staircase Diagram template for PowerPoint & Google Slides
Process
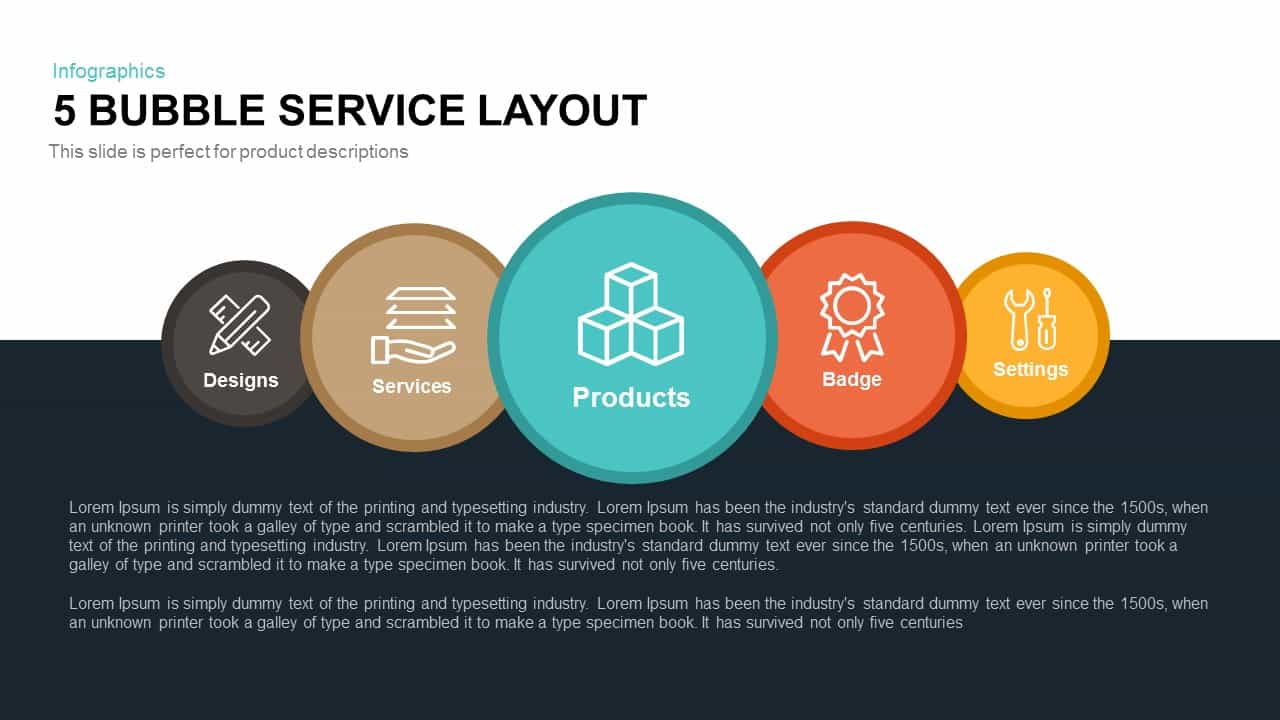
5 Bubble Service Layout Diagram Template for PowerPoint & Google Slides
Process
Three Circle Arrow Process Diagram template for PowerPoint & Google Slides
Circular
Arrow Stage Process Diagram template for PowerPoint & Google Slides
Arrow

Dynamic 4 Gear Process Diagram Template for PowerPoint & Google Slides
Process
Five-Section Circular Arrow Diagram Template for PowerPoint & Google Slides
Circular
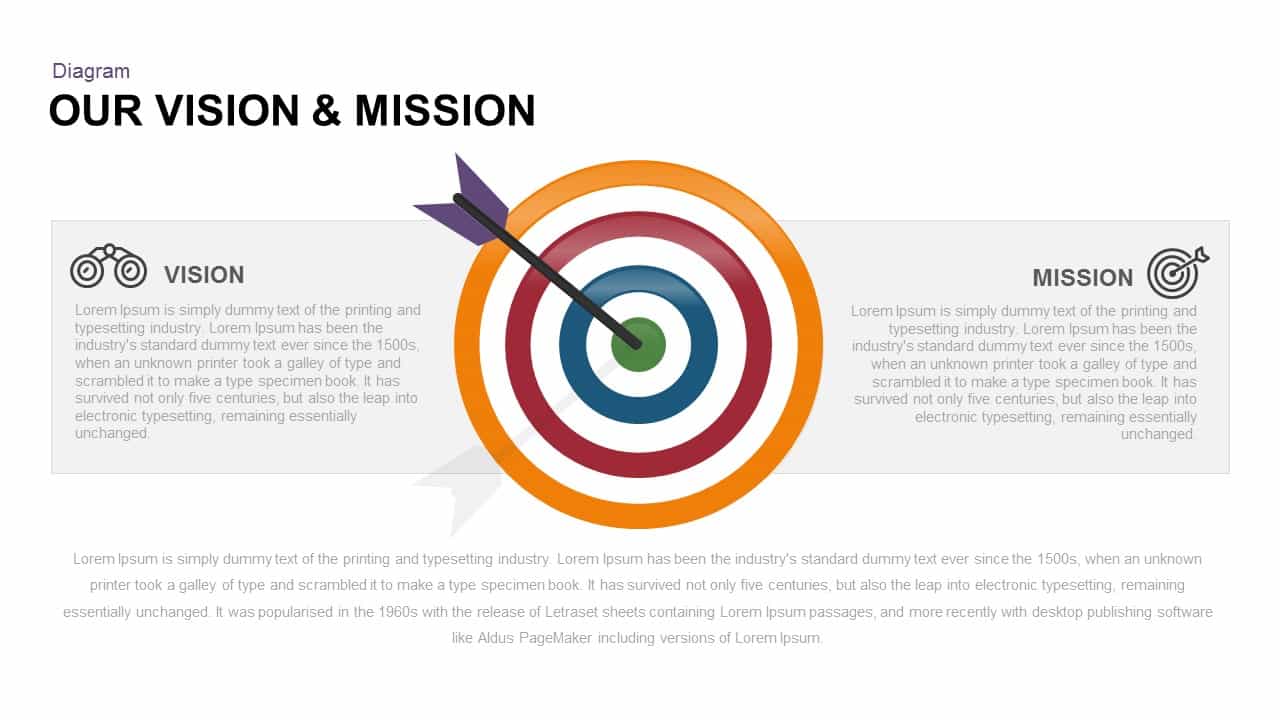
Vision and Mission Diagram template for PowerPoint & Google Slides
Goals
Four-Point Arrow Cycle Diagram Template for PowerPoint & Google Slides
Arrow
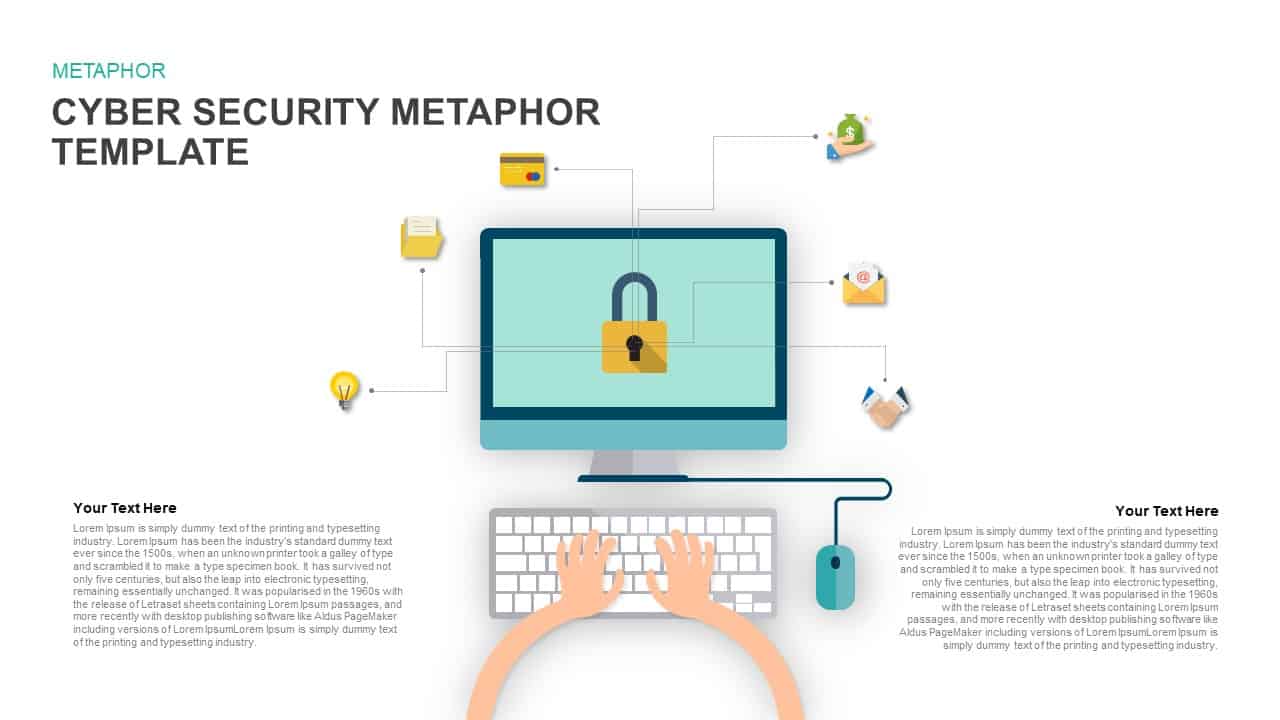
Cyber Security Metaphor Diagram Template for PowerPoint & Google Slides
Risk Management
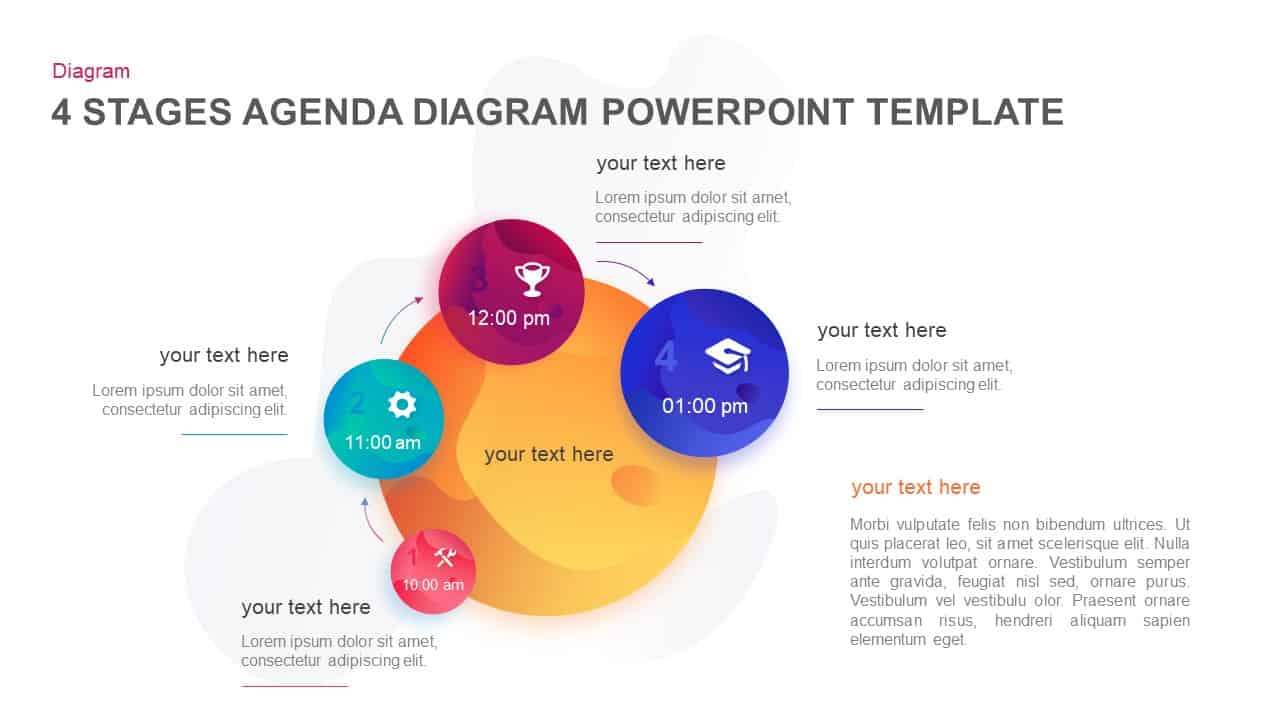
Four-Stage Agenda Circle Diagram Slide Template for PowerPoint & Google Slides
Agenda
Five-Step Circular Process Diagram Template for PowerPoint & Google Slides
Circular
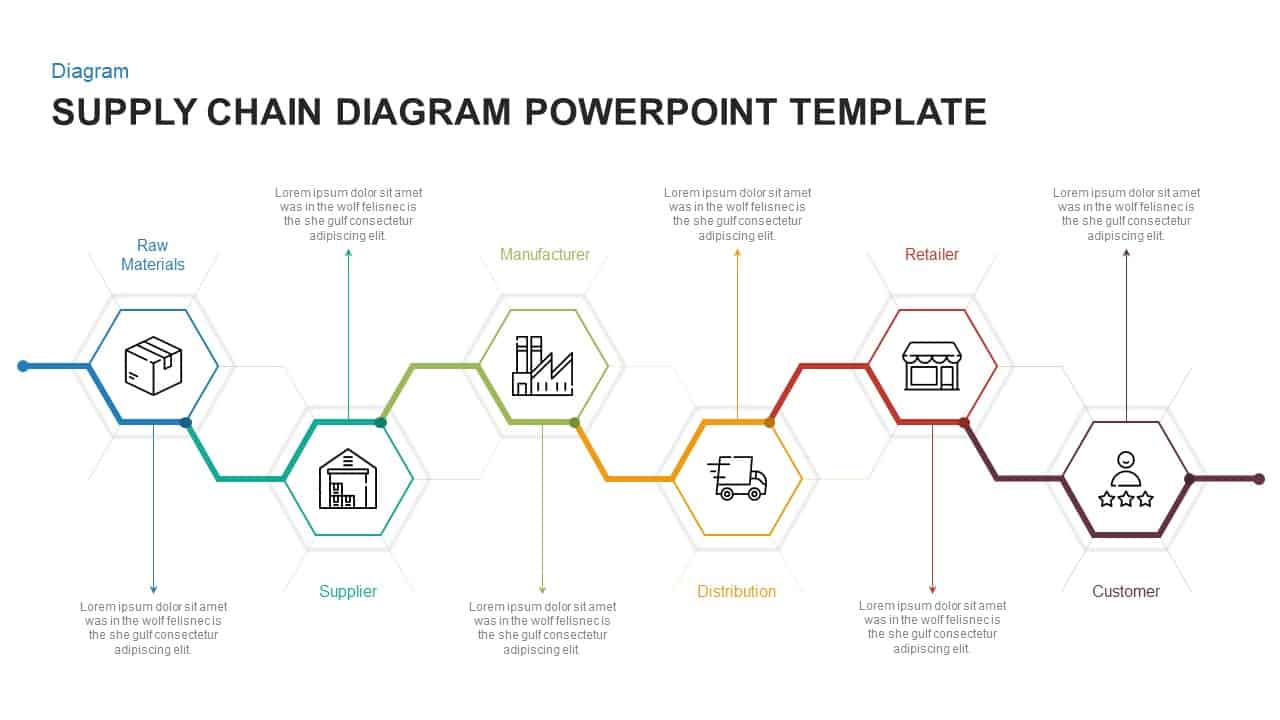
Hexagonal Supply Chain Diagram Template for PowerPoint & Google Slides
Process
4 Stage Linear Process Flow Diagram Template for PowerPoint & Google Slides
Process
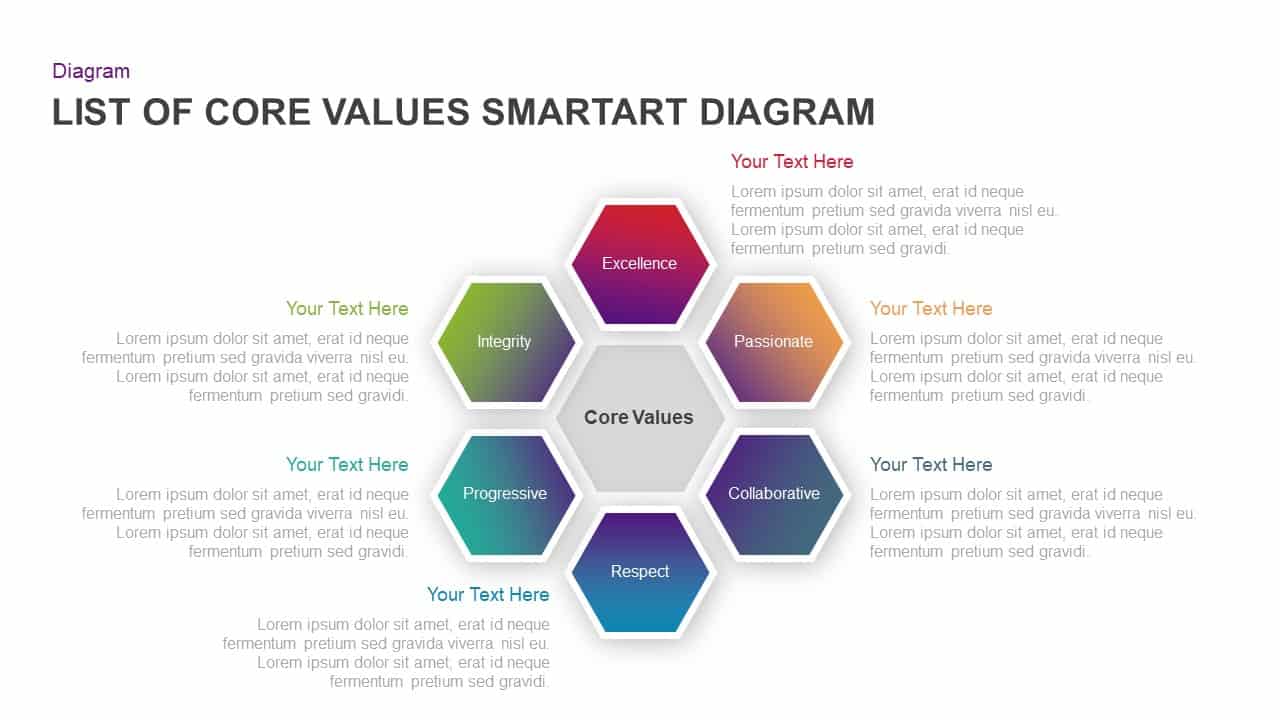
Core Values SmartArt Hexagon Diagram Template for PowerPoint & Google Slides
Circular
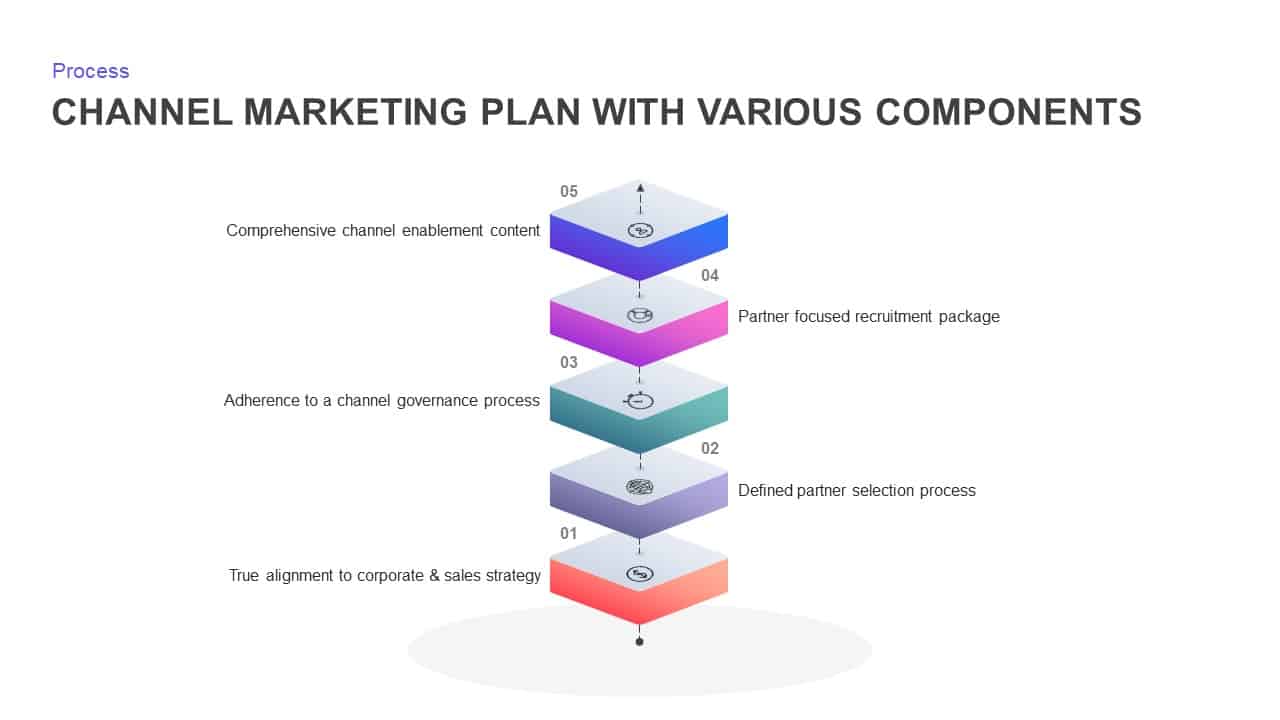
Channel Marketing Plan Layered Diagram Template for PowerPoint & Google Slides
Process
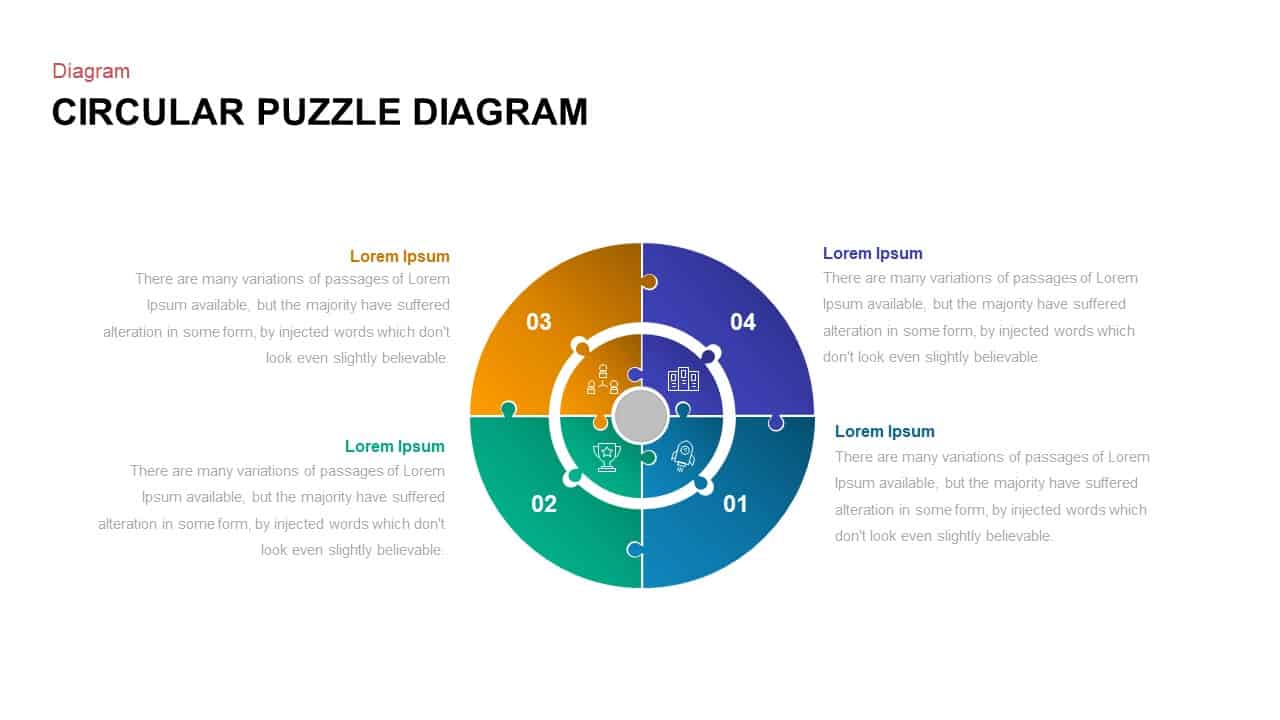
Colorful Circular Puzzle Diagram Template for PowerPoint & Google Slides
Circular
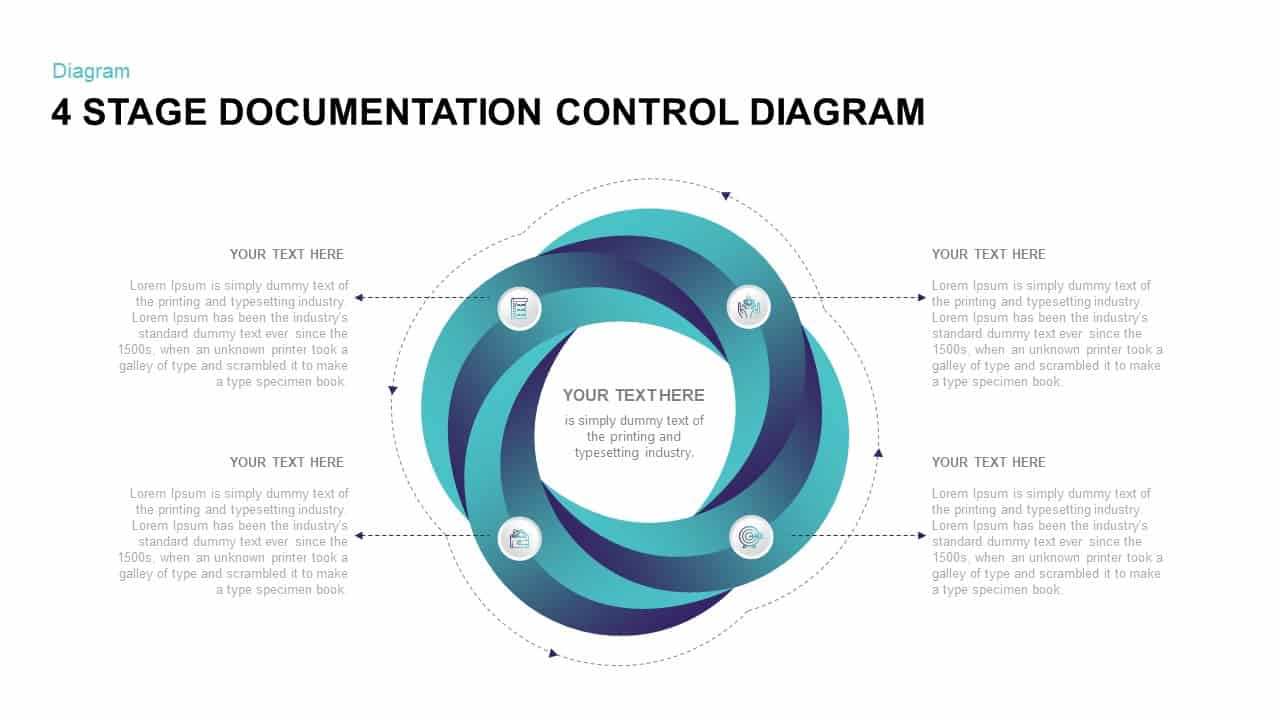
4-Stage Documentation Control Diagram Template for PowerPoint & Google Slides
Process
Vertical Split Flow Chart Diagram Template for PowerPoint & Google Slides
Flow Charts
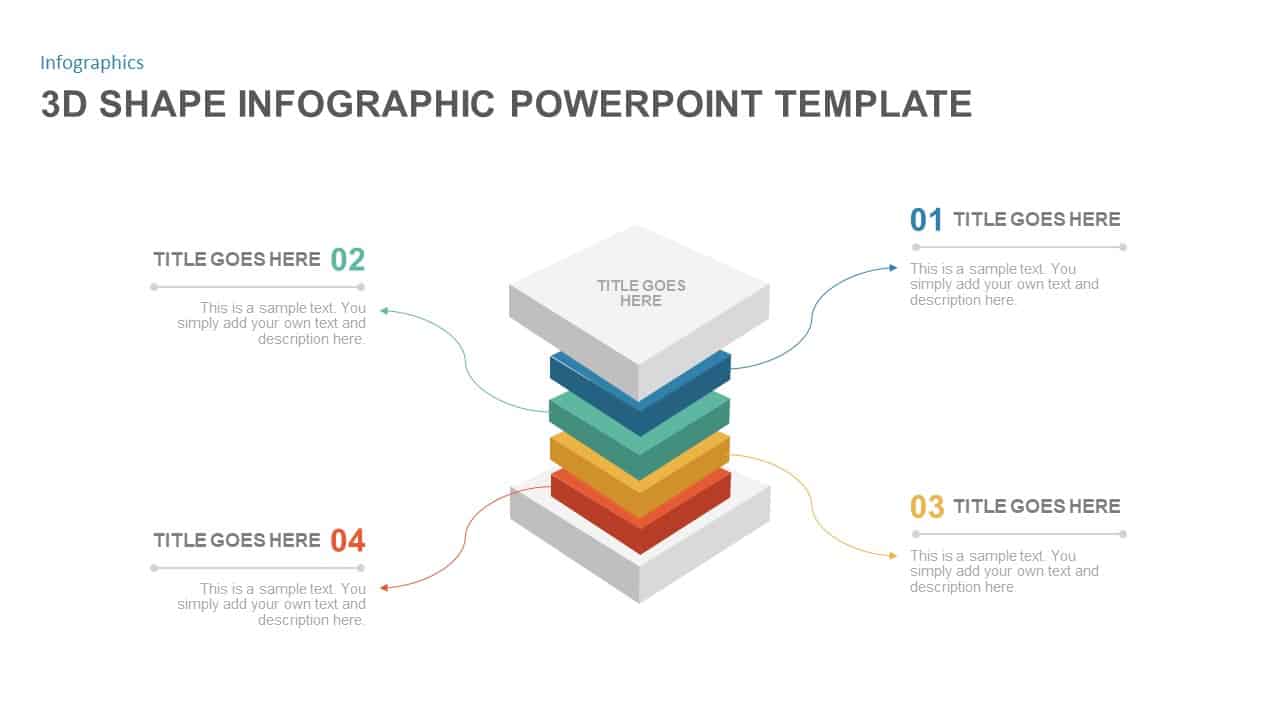
3D Layered Infographic Diagram Template for PowerPoint & Google Slides
Infographics
Flow Chart Diagram Template for PowerPoint & Google Slides
Flow Charts
Stacked Cubes Pyramid Six-Option Diagram Template for PowerPoint & Google Slides
Pyramid
Snowball Effect Process Diagram Template for PowerPoint & Google Slides
Process
Free Simple Venn Diagram Overview template for PowerPoint & Google Slides
Comparison Chart
Free
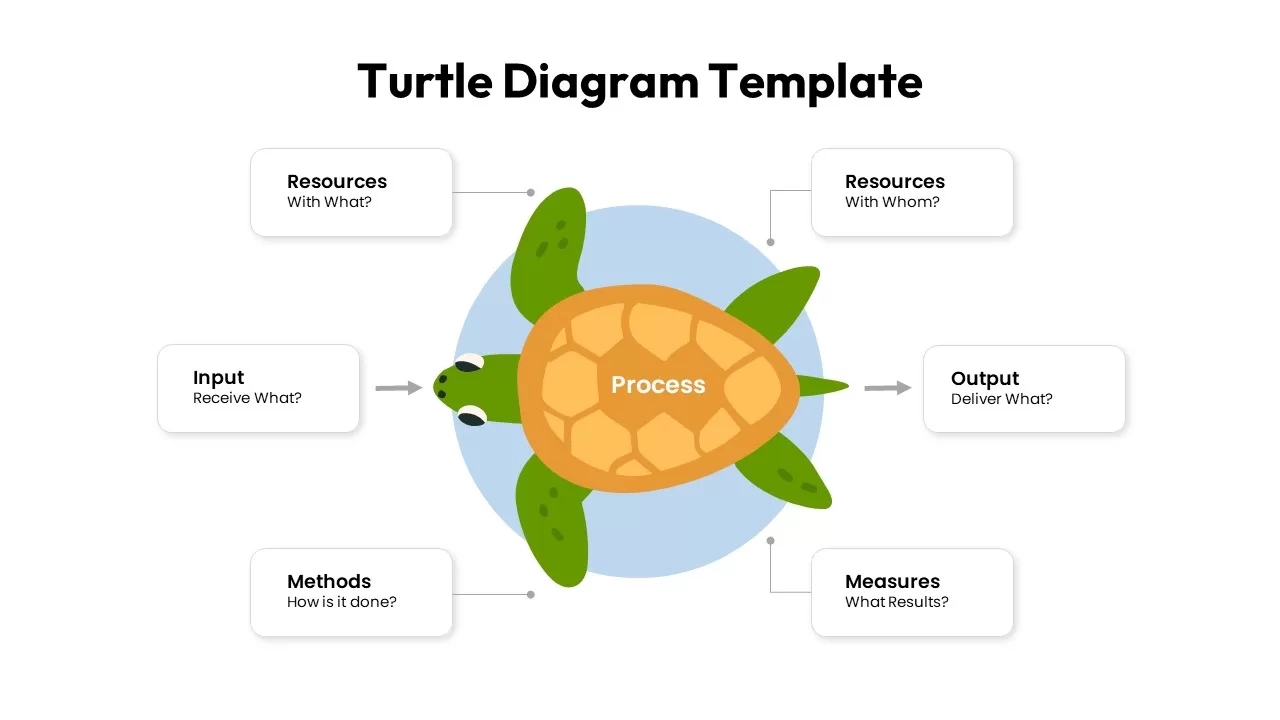
Turtle Diagram Infographics Template for PowerPoint & Google Slides
Process
Free Circular Multi-Step Flow Chart Diagram Template for PowerPoint & Google Slides
Flow Charts
Free
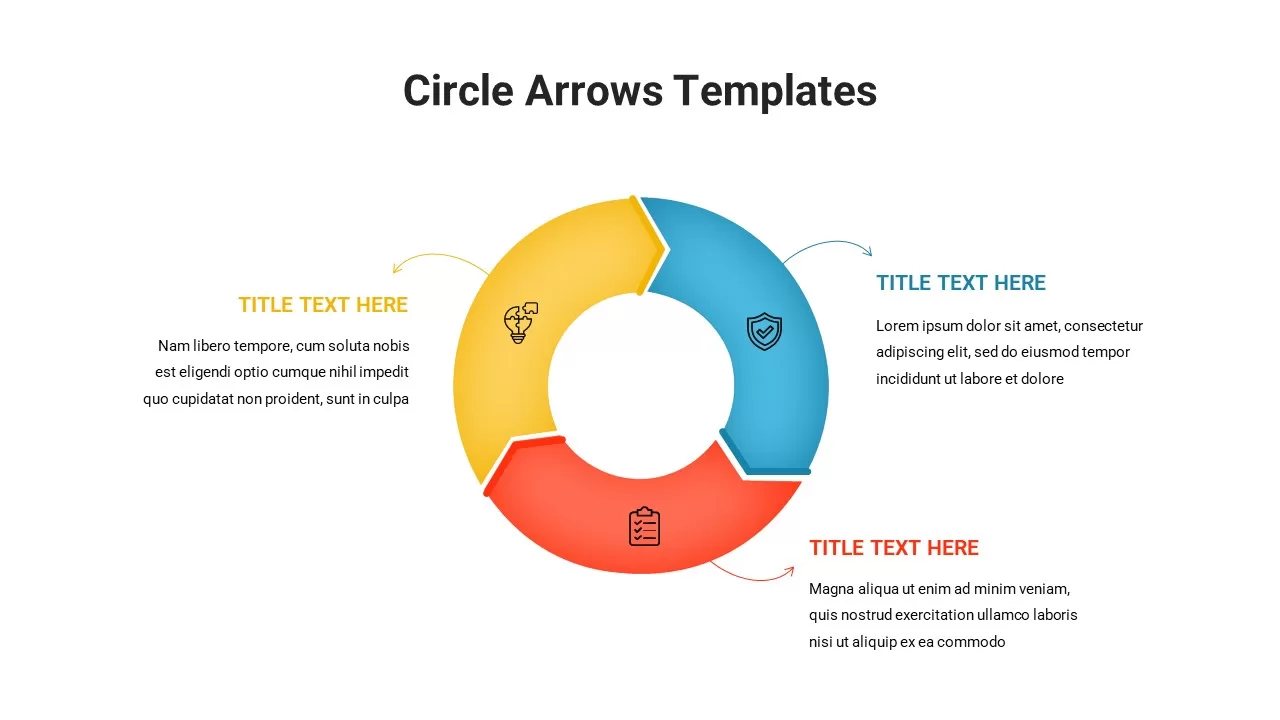
Circle Arrows Diagram template for PowerPoint & Google Slides
Process
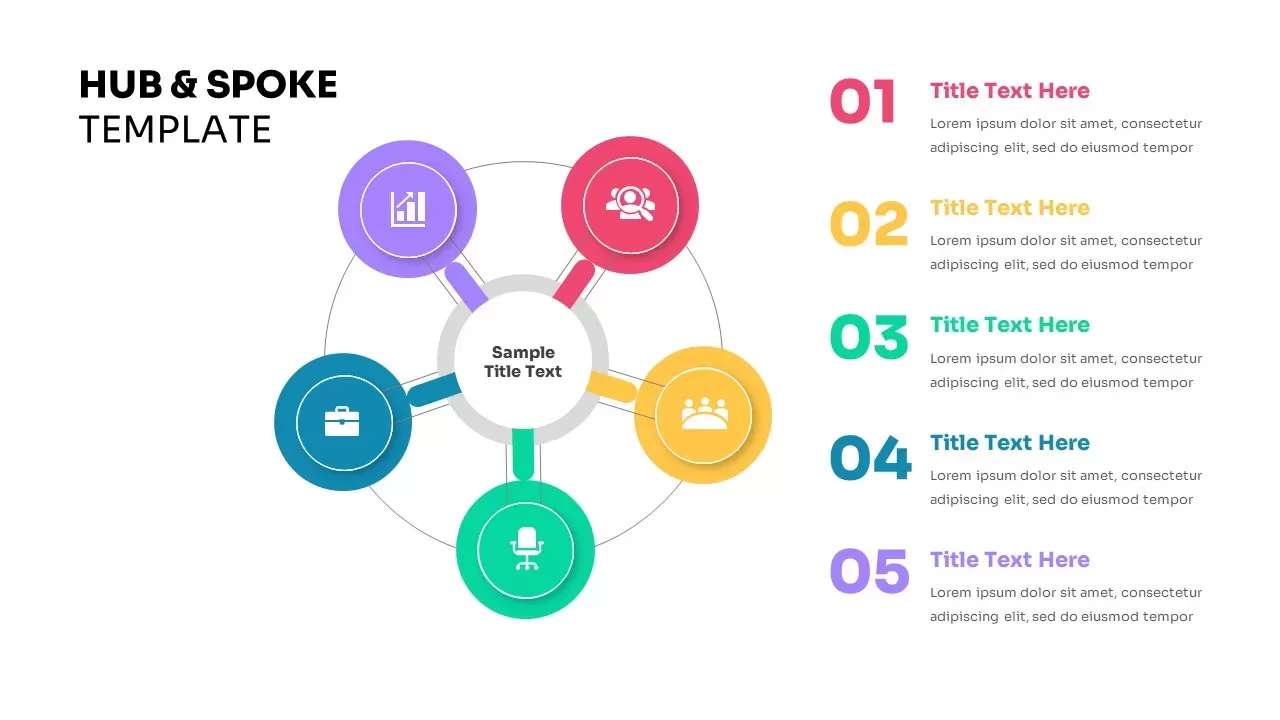
Five-Node Hub & Spoke Diagram Process Template for PowerPoint & Google Slides
Business Models
4-Step Methodology Diagram Template for PowerPoint & Google Slides
Process
3D Conveyor Belt Process Flow Diagram Template for PowerPoint & Google Slides
Process
Layered Onion Diagram Template for PowerPoint & Google Slides
Process
Three-Step Gears Brain Diagram Template for PowerPoint & Google Slides
Process
Five Circle Venn Diagram for Template for PowerPoint & Google Slides
Circular
Five-Step Cascade Diagram & Timeline Template for PowerPoint & Google Slides
Process
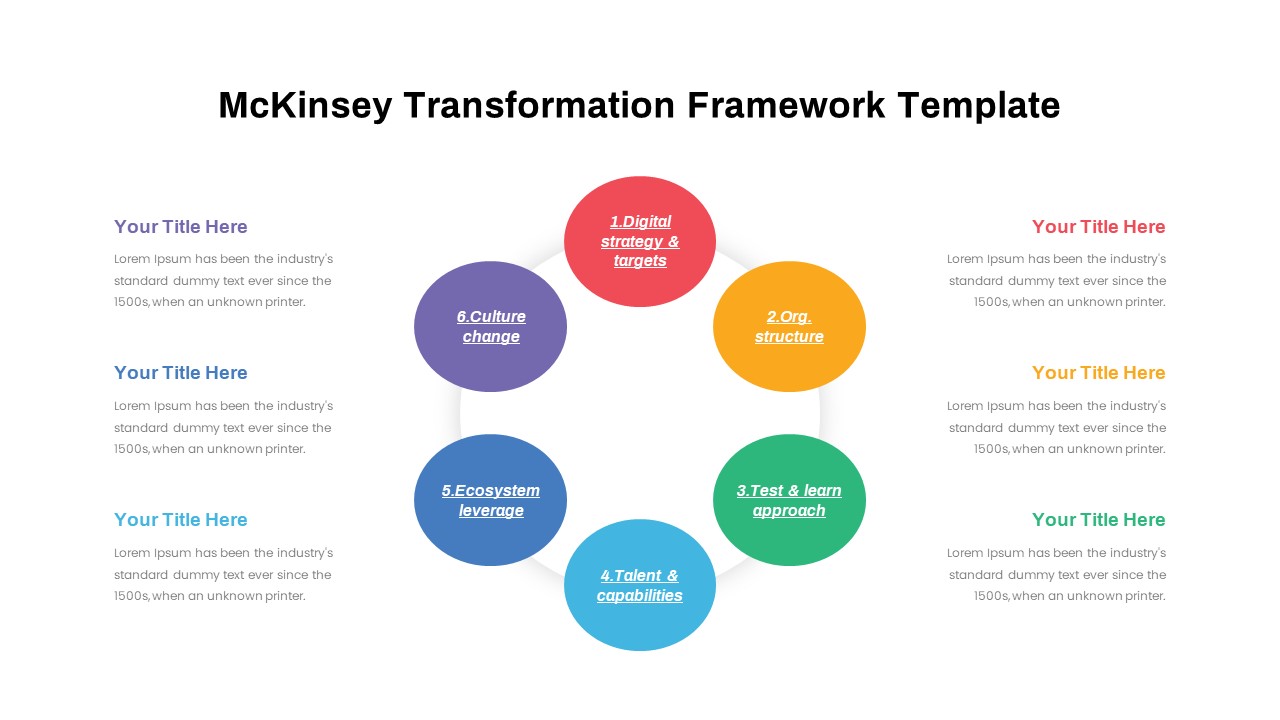
BCG Transformation Framework Diagram Template for PowerPoint & Google Slides
BCG
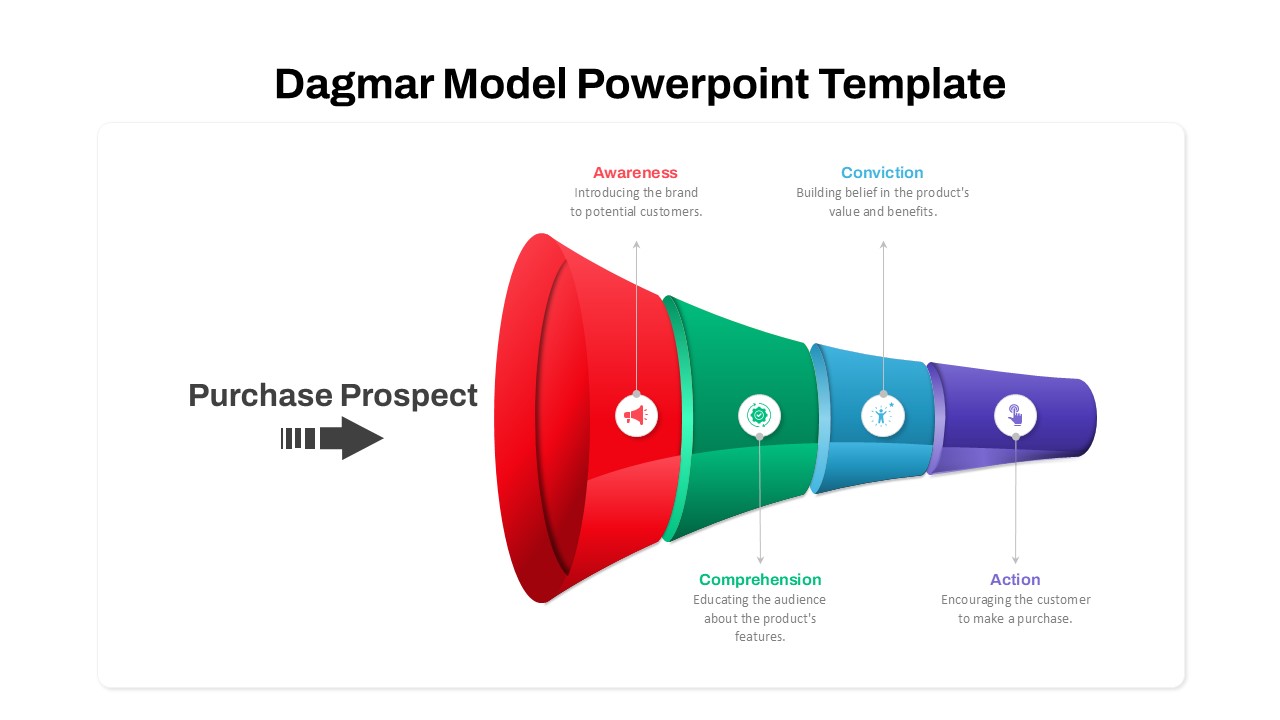
Dagmar Model Marketing Funnel Diagram Template for PowerPoint & Google Slides
Funnel
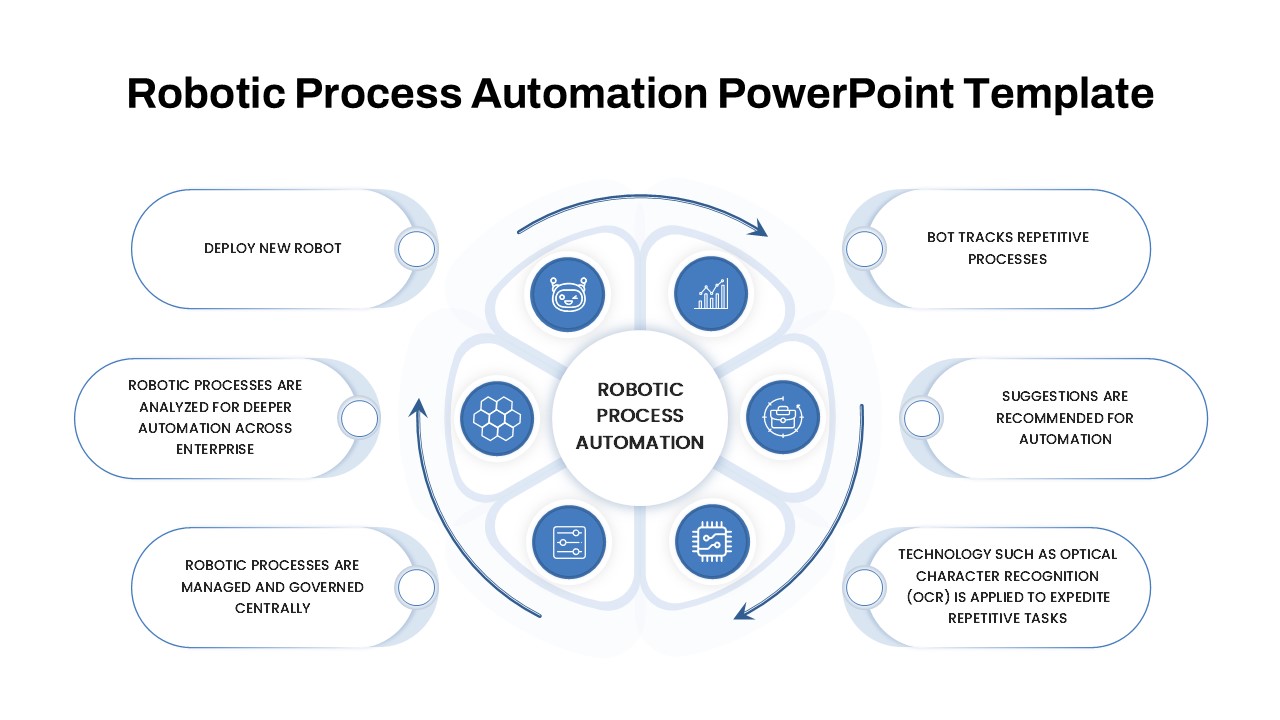
Robotic Process Automation Diagram Template for PowerPoint & Google Slides
Process
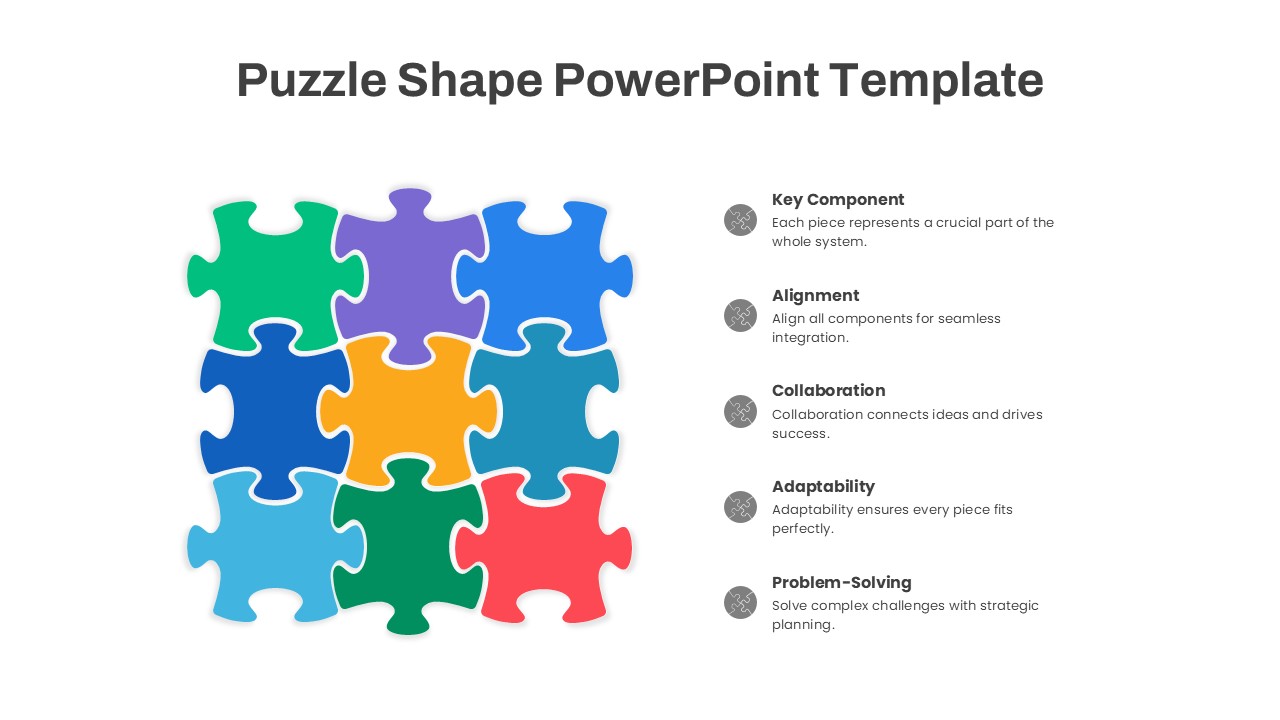
Puzzle Shape Diagram with Five Elements Template for PowerPoint & Google Slides
Circular
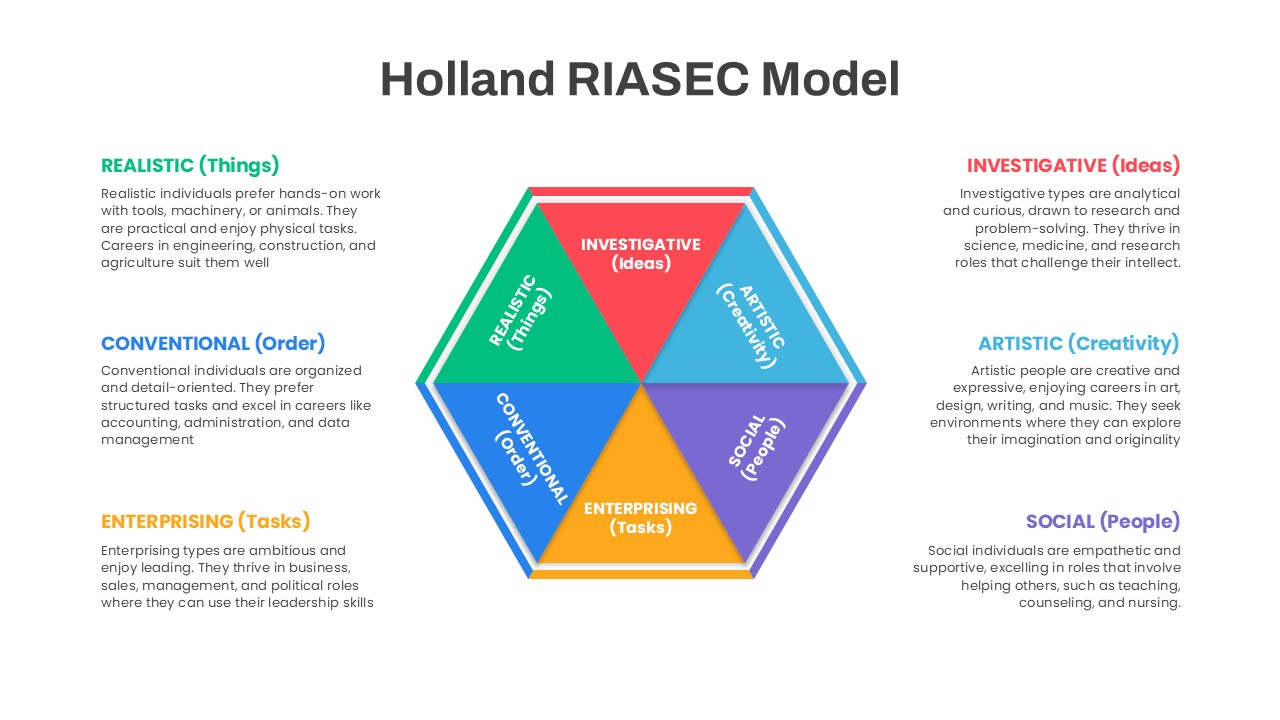
Holland RIASEC Hexagon Diagram Template for PowerPoint & Google Slides
Circular
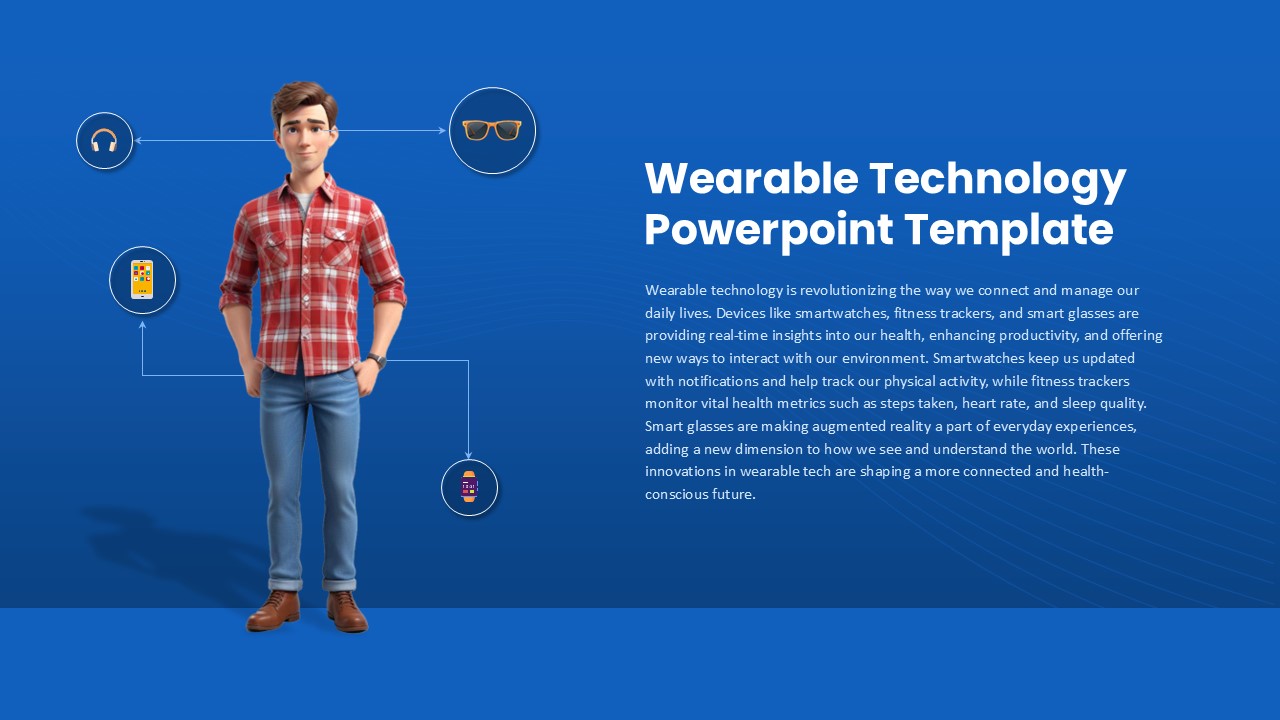
Wearable Technology Connectivity Diagram Template for PowerPoint & Google Slides
Information Technology
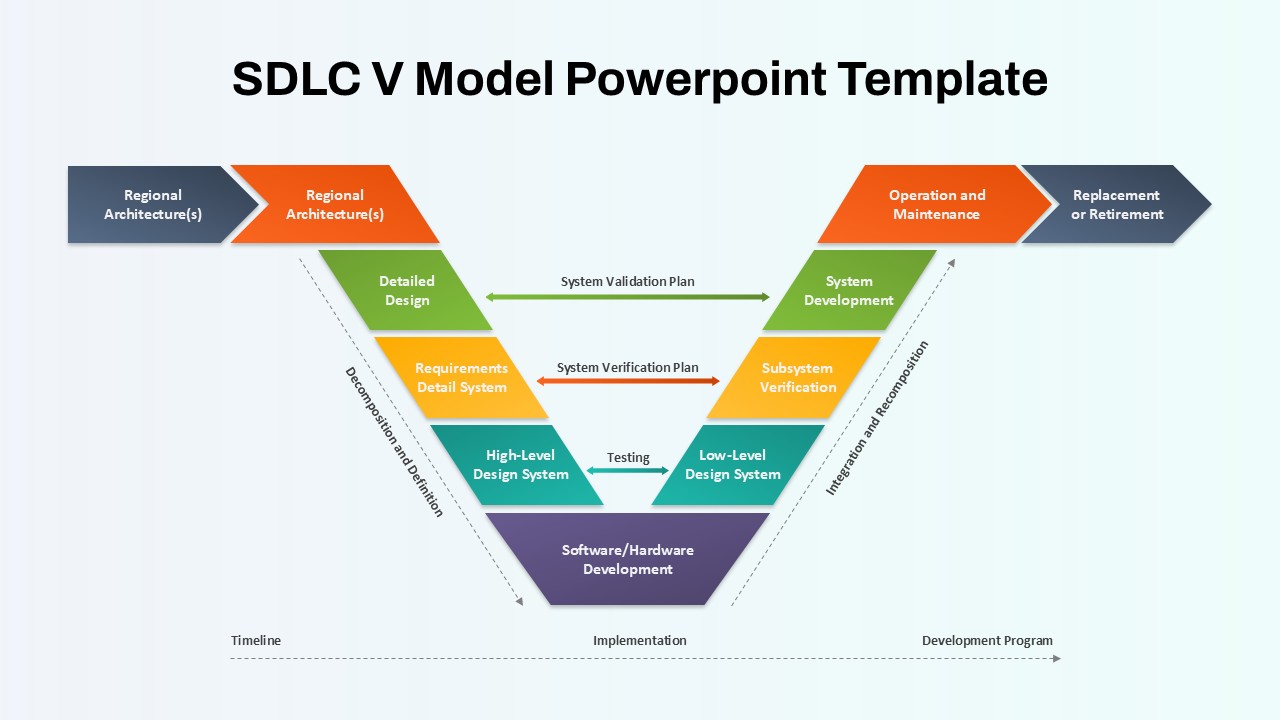
SDLC V Model Lifecycle Diagram Template for PowerPoint & Google Slides
Process
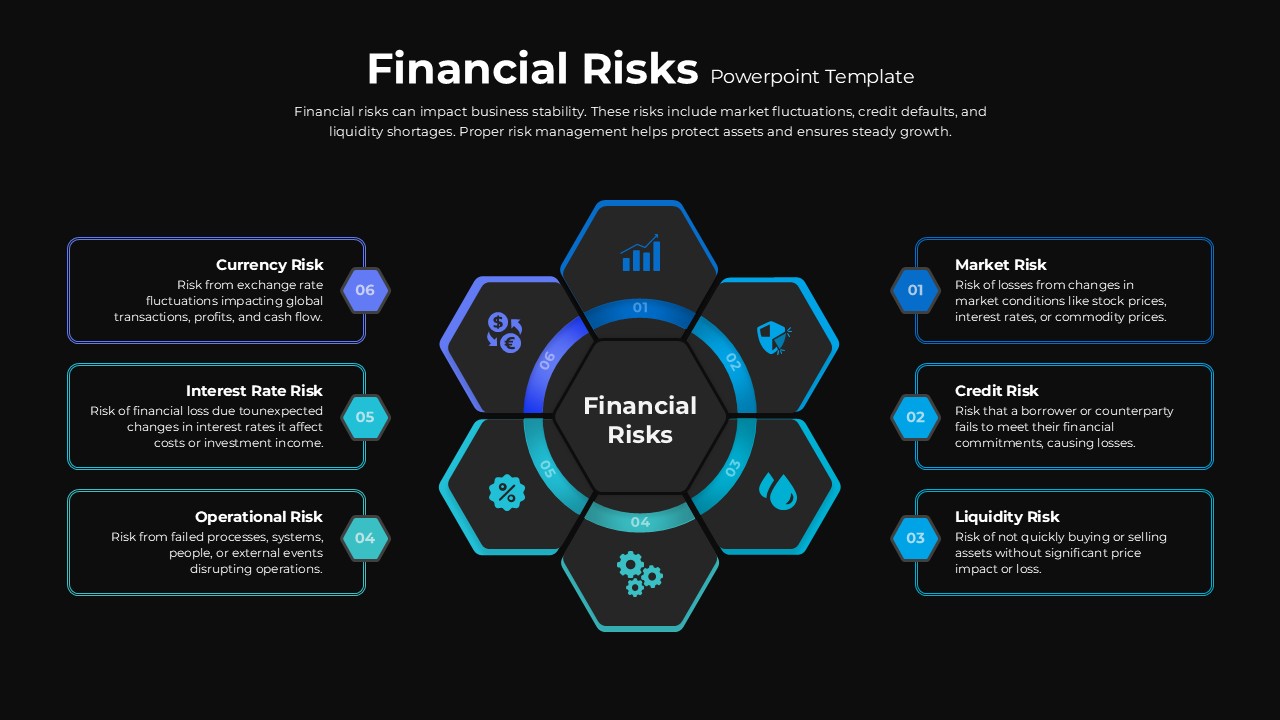
Financial Risks Hexagon Diagram Template for PowerPoint & Google Slides
Risk Management
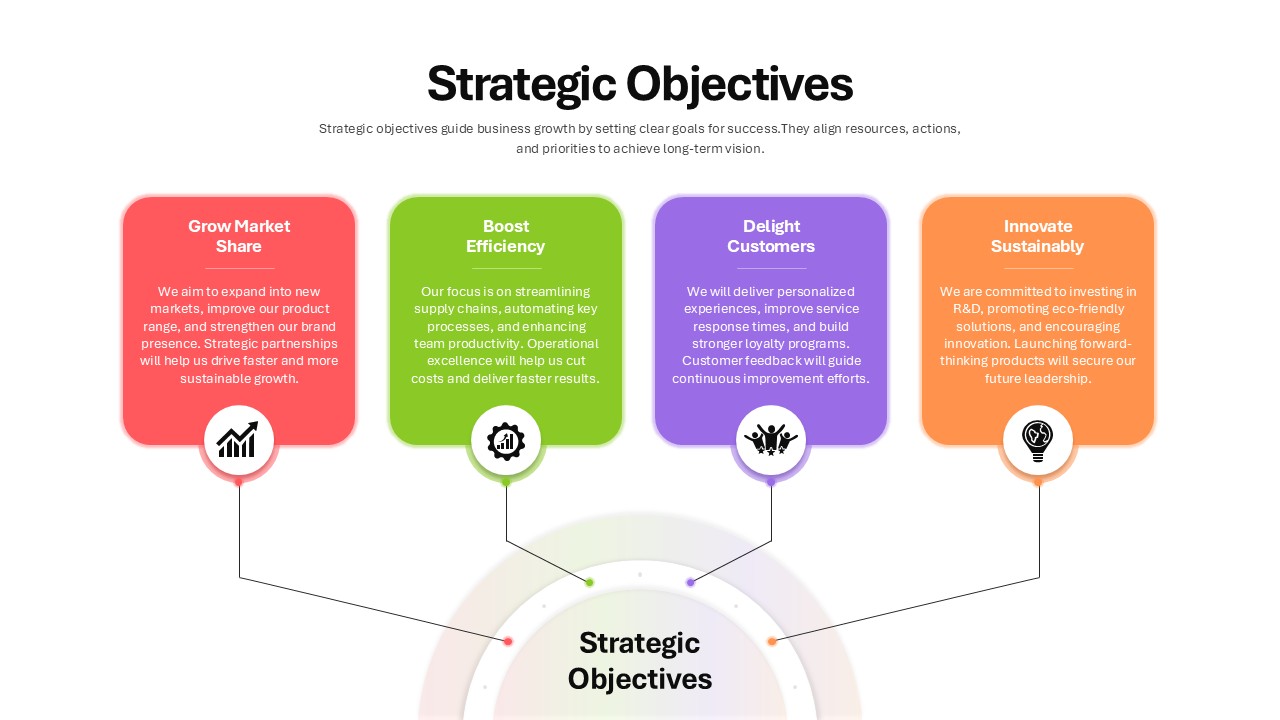
Four Strategic Objectives Radial Diagram Template for PowerPoint & Google Slides
Business Strategy
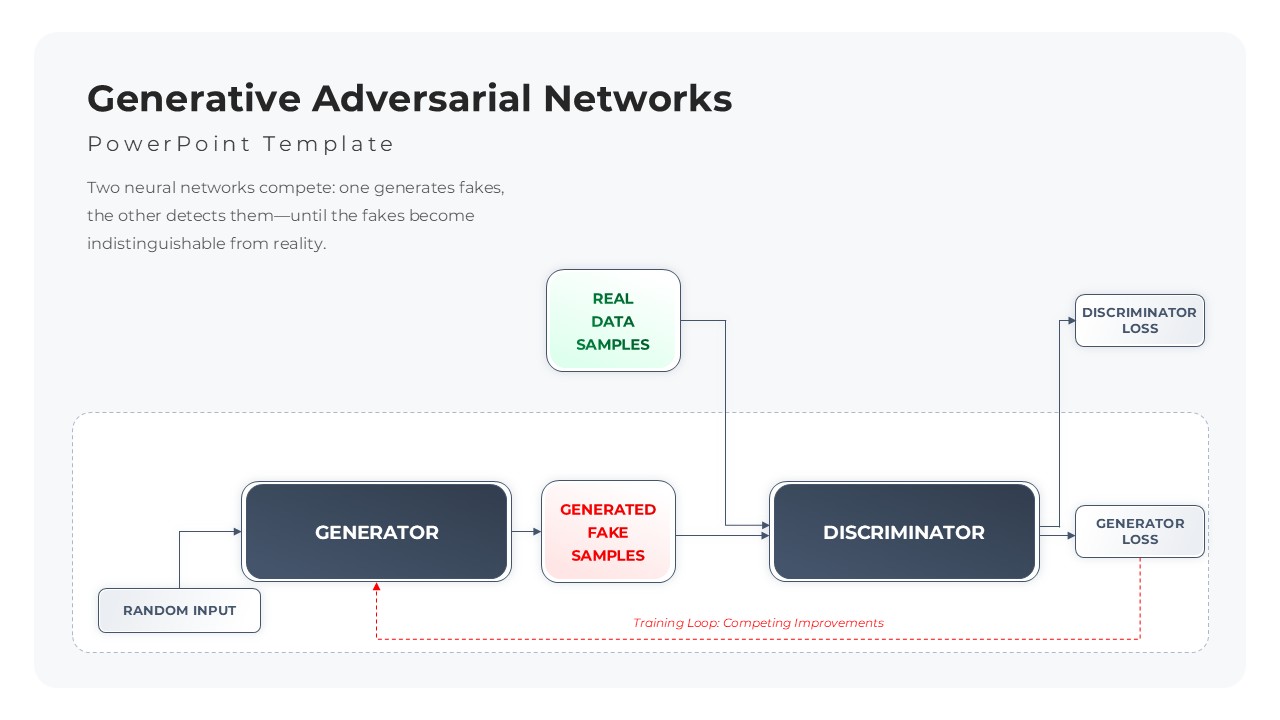
Generative Adversarial Networks Diagram Template for PowerPoint & Google Slides
Process
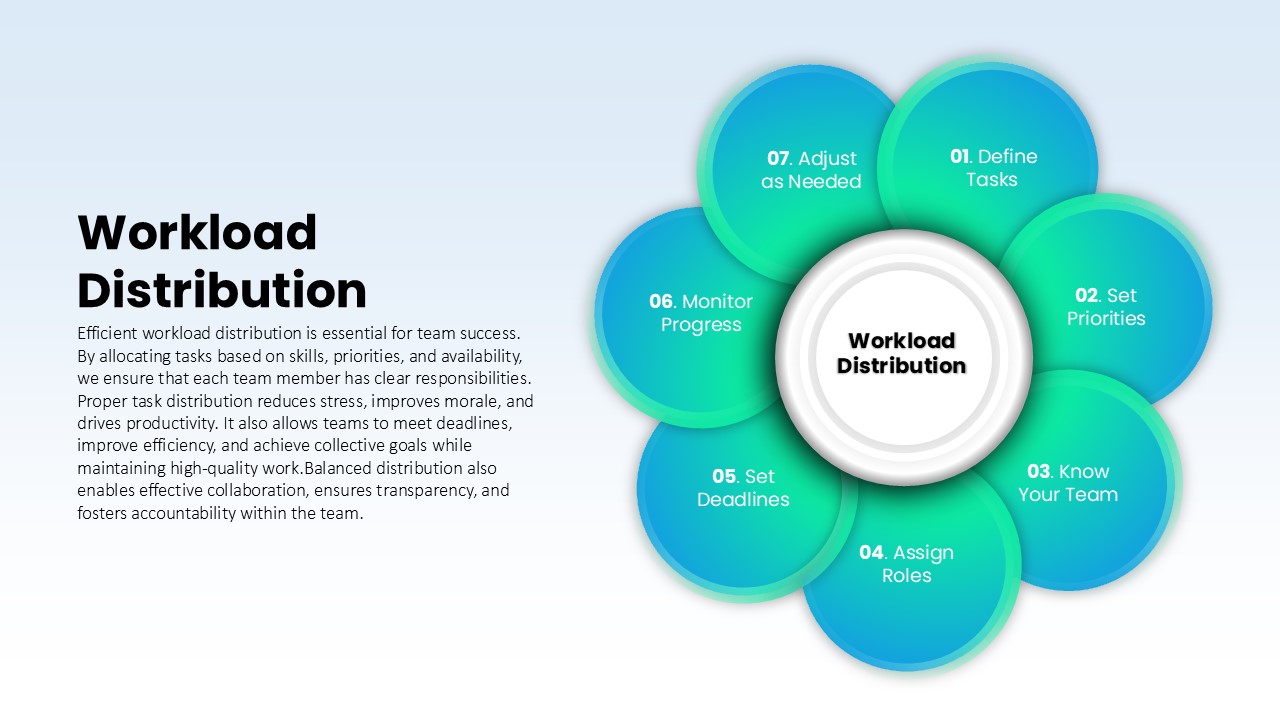
Workload Distribution Circular Diagram Template for PowerPoint & Google Slides
Circular
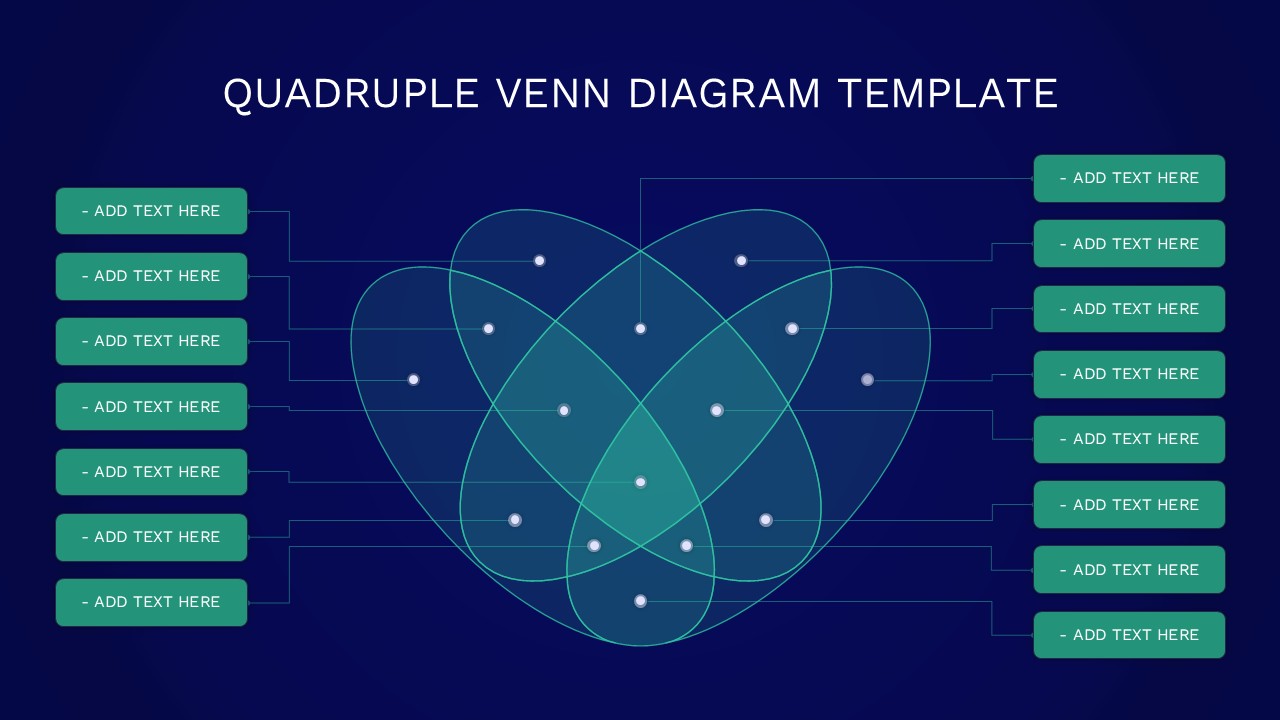
Quadruple Venn Diagram Template for PowerPoint & Google Slides
Circular