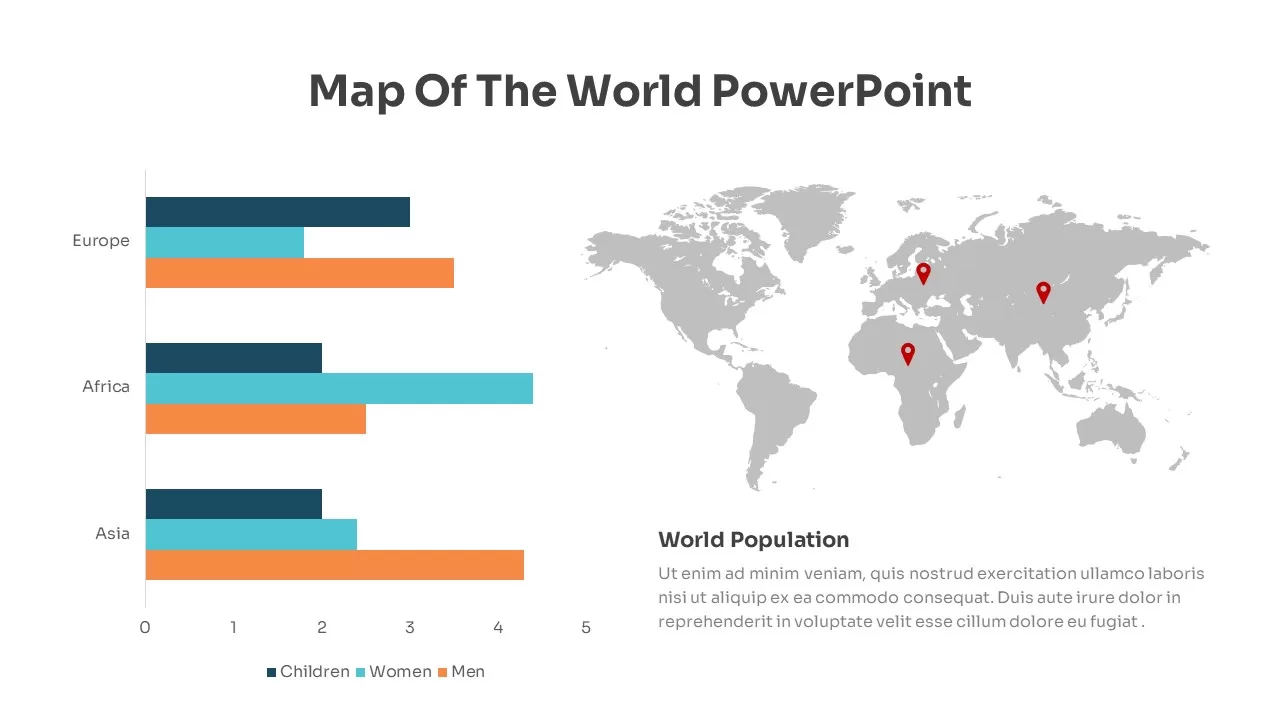
Asia Map Infographic with Demographics template for PowerPoint & Google Slides
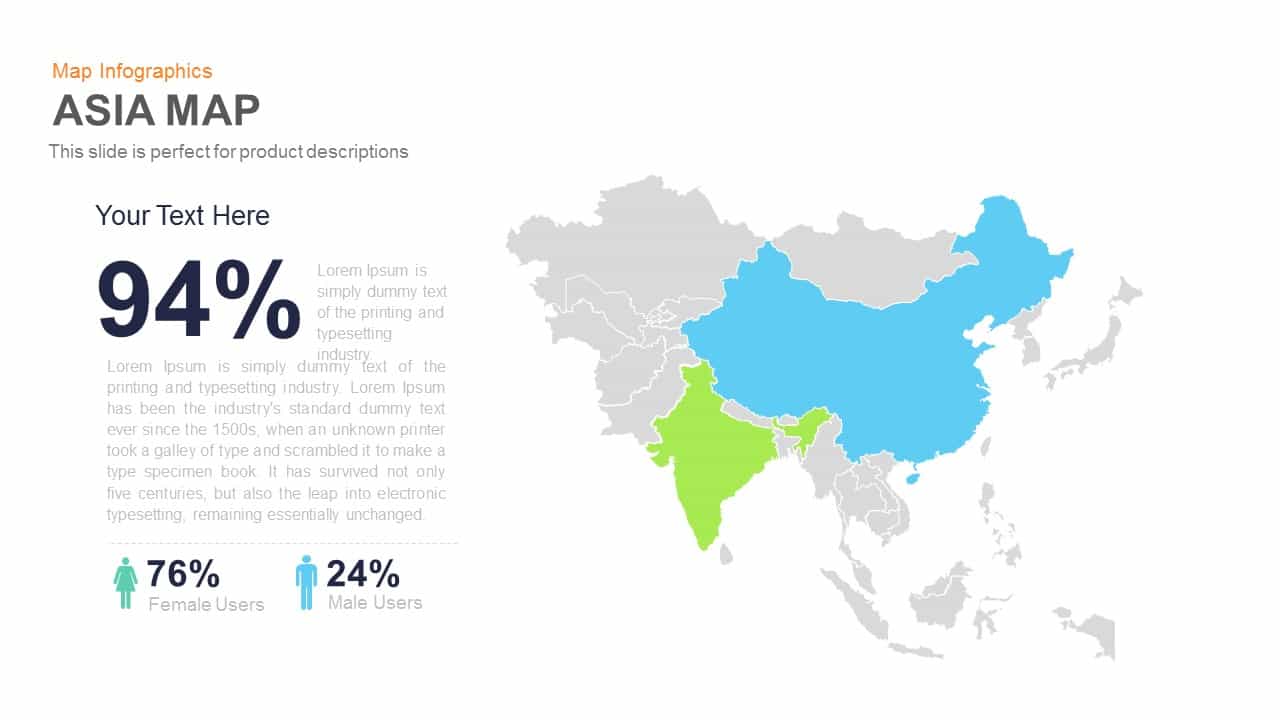
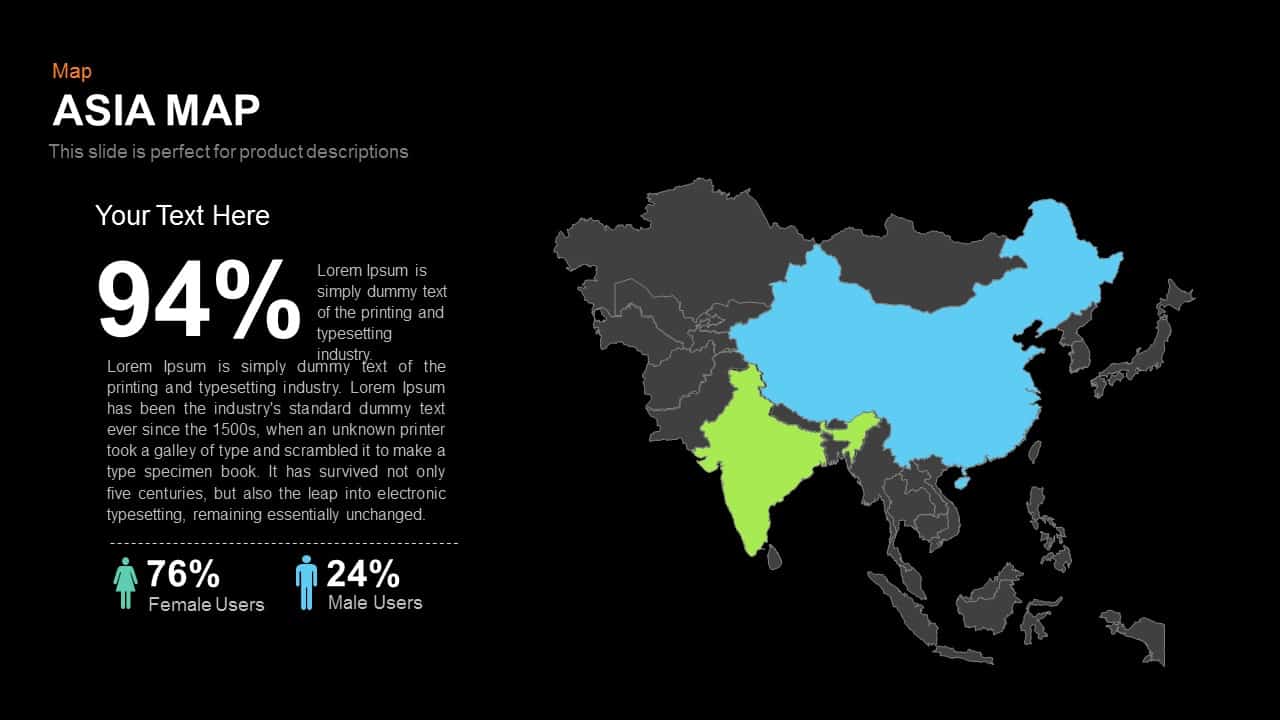

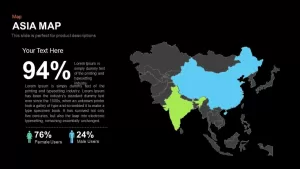
Leverage this compelling Asia map slide to present geographic and demographic data with clarity and visual impact. This fully editable infographic highlights key regions such as India and China through contrasting color fills, while the remaining countries appear in subtle gray. Prominent percentage indicators and gender icons illustrate user demographics or regional metrics, supported by placeholder text for detailed descriptions. The balanced layout positions the map on the right, ensuring audience focus on both visuals and narrative content.
Built on master slides with vector shapes, this asset allows you to customize colors, labels, and icons in seconds. Swap the highlight hues to reflect brand palette or adjust opacity for emphasis. Insert your own percentage values, replace the lorem ipsum block with product insights, market analysis, or campaign performance data, and resize map elements without losing resolution. Navigation arrows indicate progression through a deck, ideal for multi-step presentations.
Optimize stakeholder communications by mapping regional sales figures, market penetration rates, or customer segmentation across Asia. Whether you’re comparing performance in South Asia versus East Asia, showcasing growth hotspots, or reporting demographic trends, this slide ensures complex information remains accessible and engaging. The minimalist design, crisp typography, and clean iconography deliver a professional aesthetic that adapts seamlessly to corporate, academic, or startup environments.
Designed for both Microsoft PowerPoint and Google Slides, this slide maintains full resolution clarity across devices and platforms. Leverage intuitive placeholders and editable elements to streamline edits, maintain brand consistency, and reduce version control issues. Whether you need to embed this asset in a pitch deck, training module, or marketing presentation, the intuitive structure and flexible design empower you to convey regional data with maximum impact and minimal effort.
Who is it for
Product managers, marketing analysts, regional sales teams, and business consultants can leverage this slide to convey geographic insights and demographic metrics across Asia. Educators, researchers, and strategists will also find this map useful for illustrating regional comparisons, market segmentation, or socio-economic trends in presentations.
Other Uses
Beyond demographic reports, repurpose this slide to highlight regional sales distribution, showcase product availability zones, map supply chain networks, track market expansion progress, illustrate target audience segmentation, or visualize cultural and economic trends. Simply modify the color fills and data points to adapt the slide for logistics planning, academic lectures, investor briefings, or training workshops.
Login to download this file

Item ID
SB00303
Related Templates

Global Population Demographics & Map Template for PowerPoint & Google Slides
Bar/Column
Asia Map with KPI Metrics and Legend Template for PowerPoint & Google Slides
World Maps
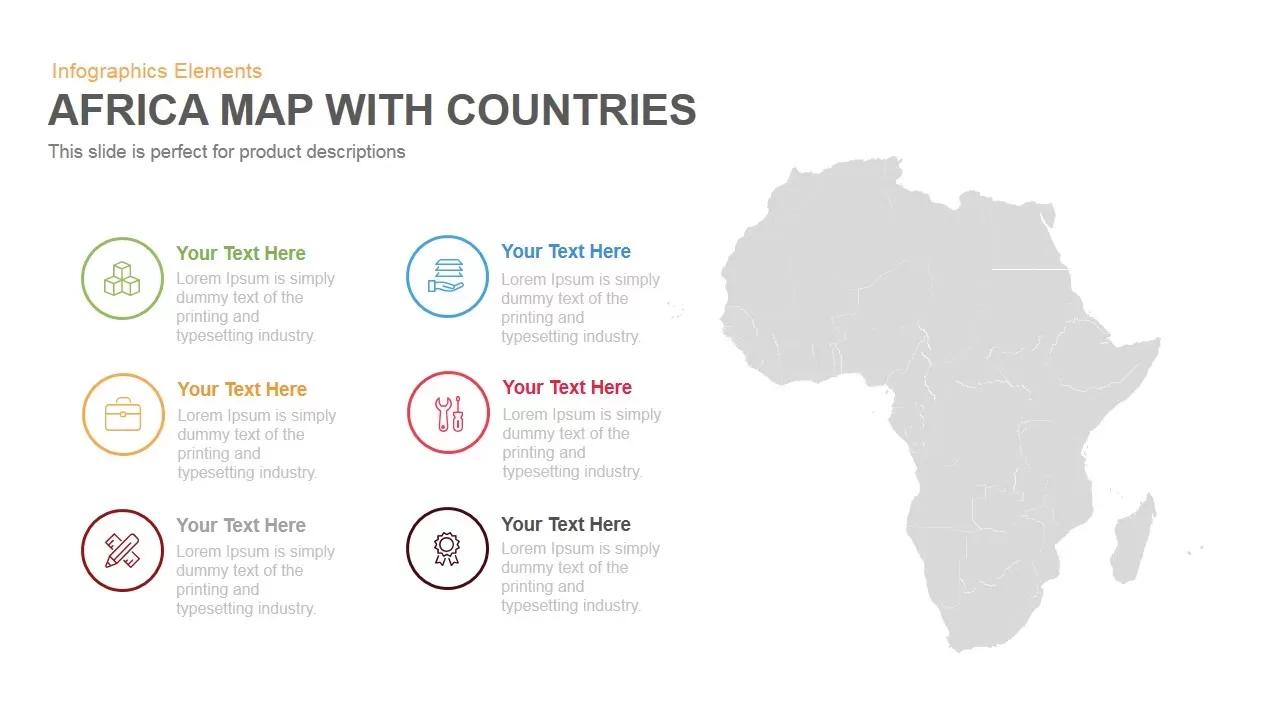
Africa Country Map Infographic Template for PowerPoint & Google Slides
World Maps
Curved Road Map Timeline Infographic Template for PowerPoint & Google Slides
Roadmap

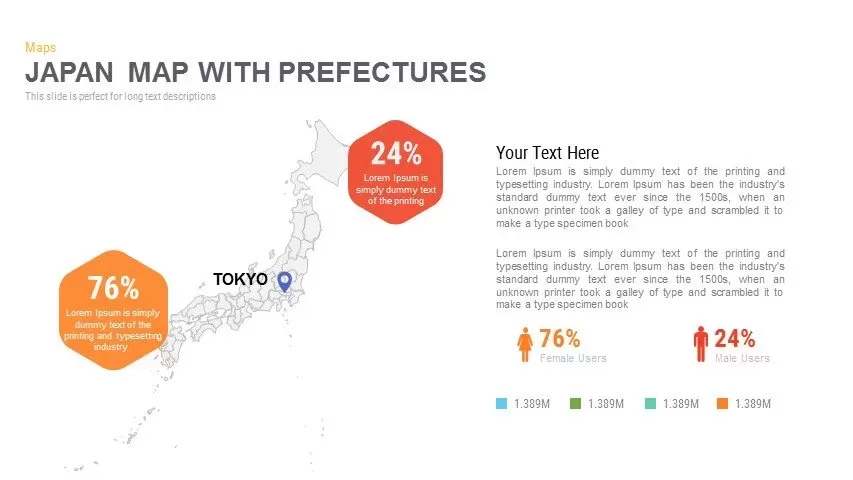
Japan Province Map Infographic Template for PowerPoint & Google Slides
Maps
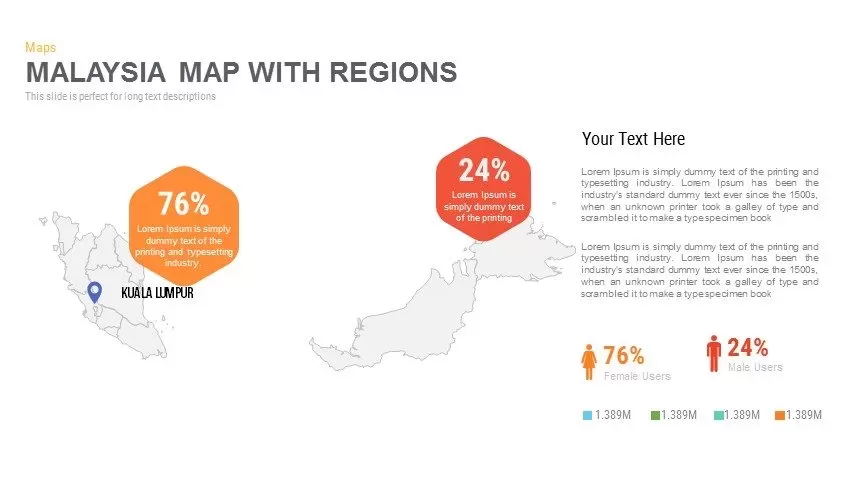
Malaysia Regional Map Infographic Template for PowerPoint & Google Slides
Maps
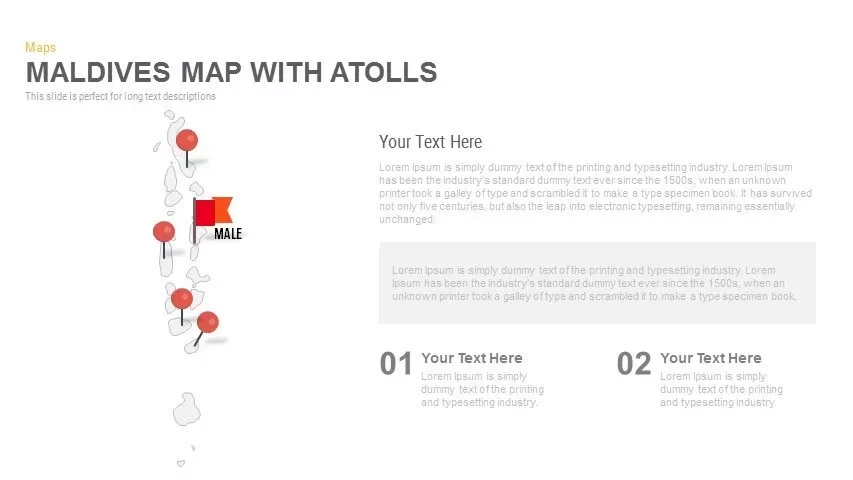
Maldives Map Infographic Template for PowerPoint & Google Slides
Maps
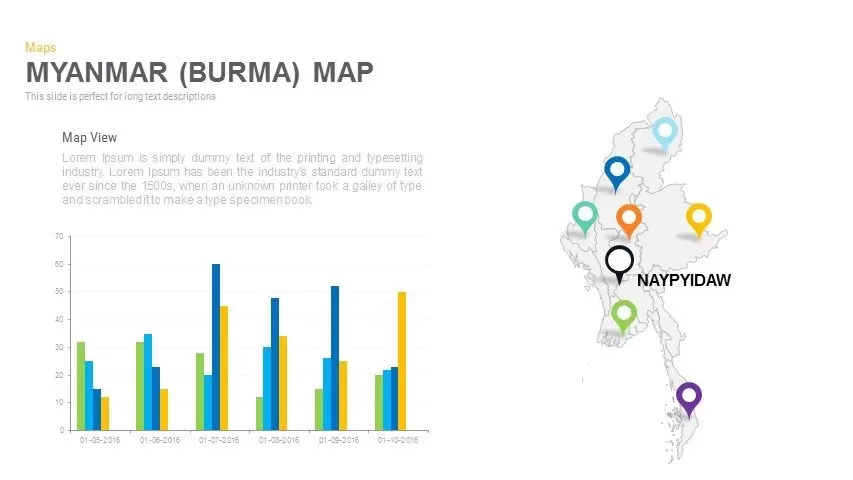
Myanmar (Burma) Provincial Map Infographic Template for PowerPoint & Google Slides
Maps
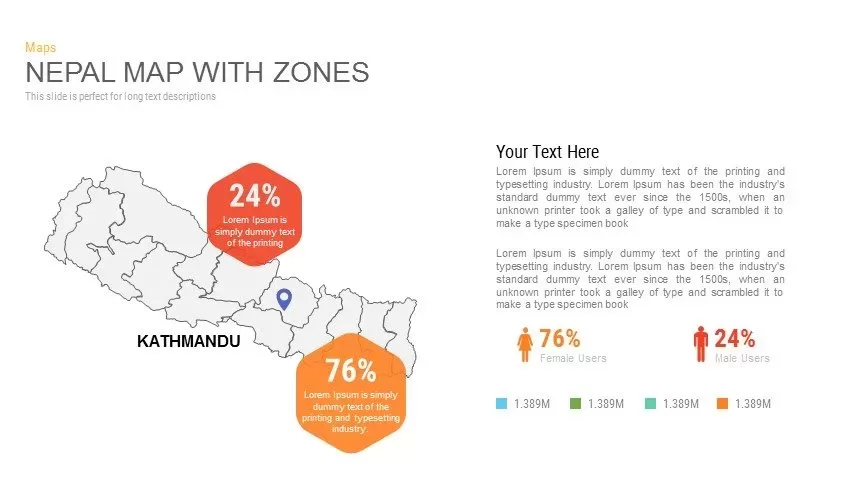
Nepal Map with Zones Infographic Template for PowerPoint & Google Slides
Maps
North Korea Map with Provinces Infographic Pack Template for PowerPoint & Google Slides
Maps
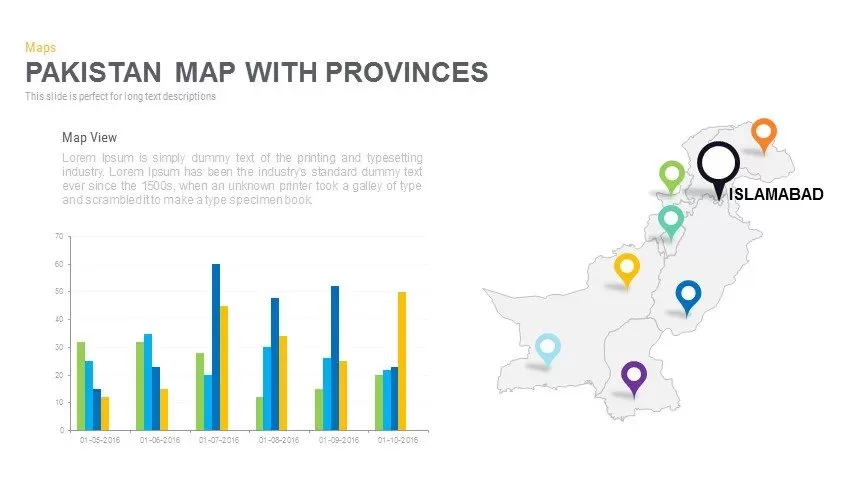
Pakistan Provinces Map Infographic Pack Template for PowerPoint & Google Slides
Maps
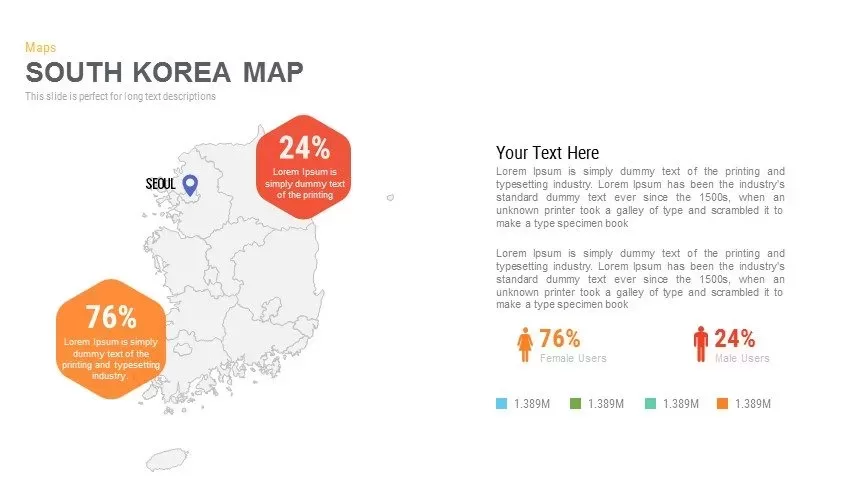
Infographic South Korea Map Template for PowerPoint & Google Slides
Maps
Sri Lanka Map Infographic Pack Template for PowerPoint & Google Slides
Maps
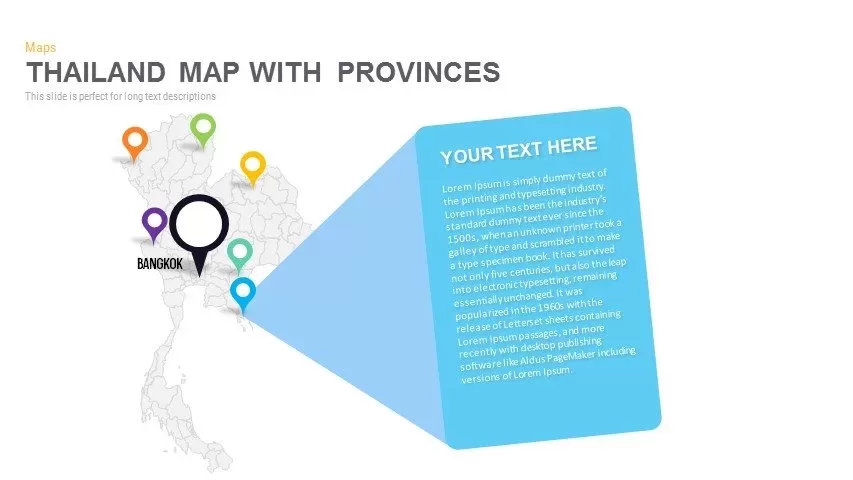
Thailand Provinces Map Infographic Pack Template for PowerPoint & Google Slides
Maps
Vietnam Provinces Map Infographic Pack Template for PowerPoint & Google Slides
Maps
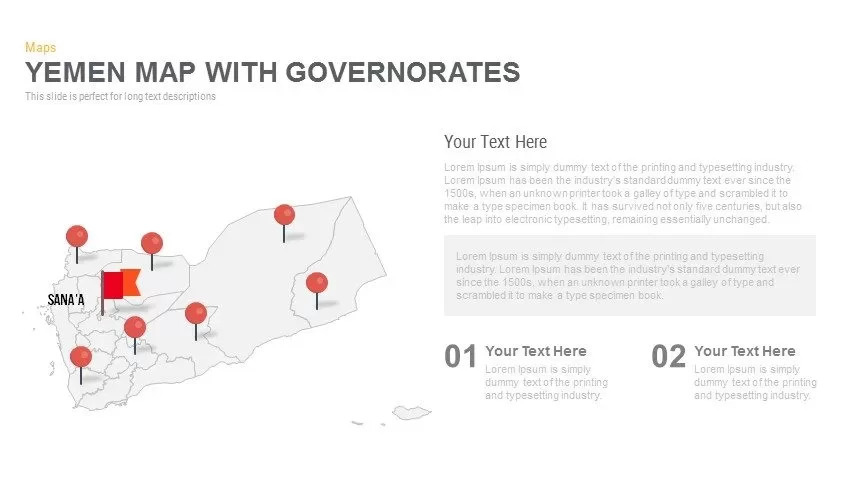
Yemen Governorates Infographic Map Template for PowerPoint & Google Slides
Maps

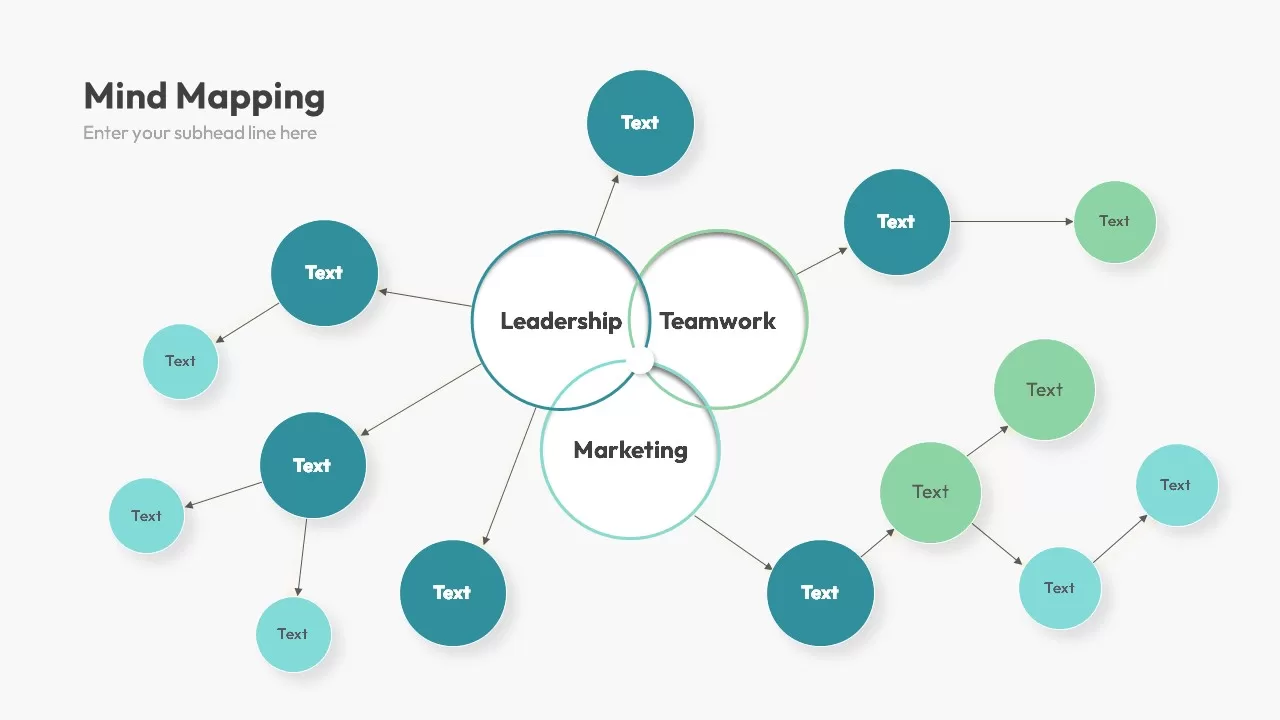
Multi-Cluster Mind Map Infographic Template for PowerPoint & Google Slides
Mind Maps
Colorful Mind Map Infographic Template with Icons for PowerPoint & Google Slides
Mind Maps
Colorful Mind Map Infographic Template for PowerPoint & Google Slides
Mind Maps
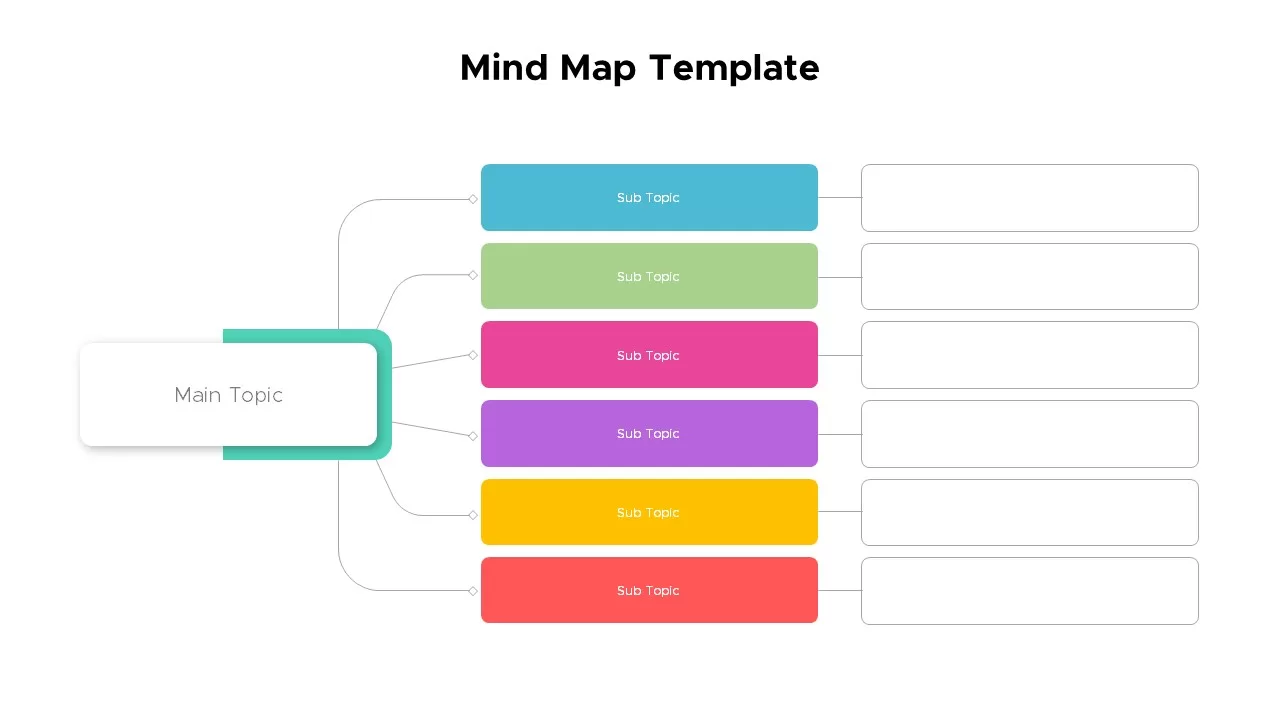
Mind Map Infographic Slide Template for PowerPoint & Google Slides
Mind Maps

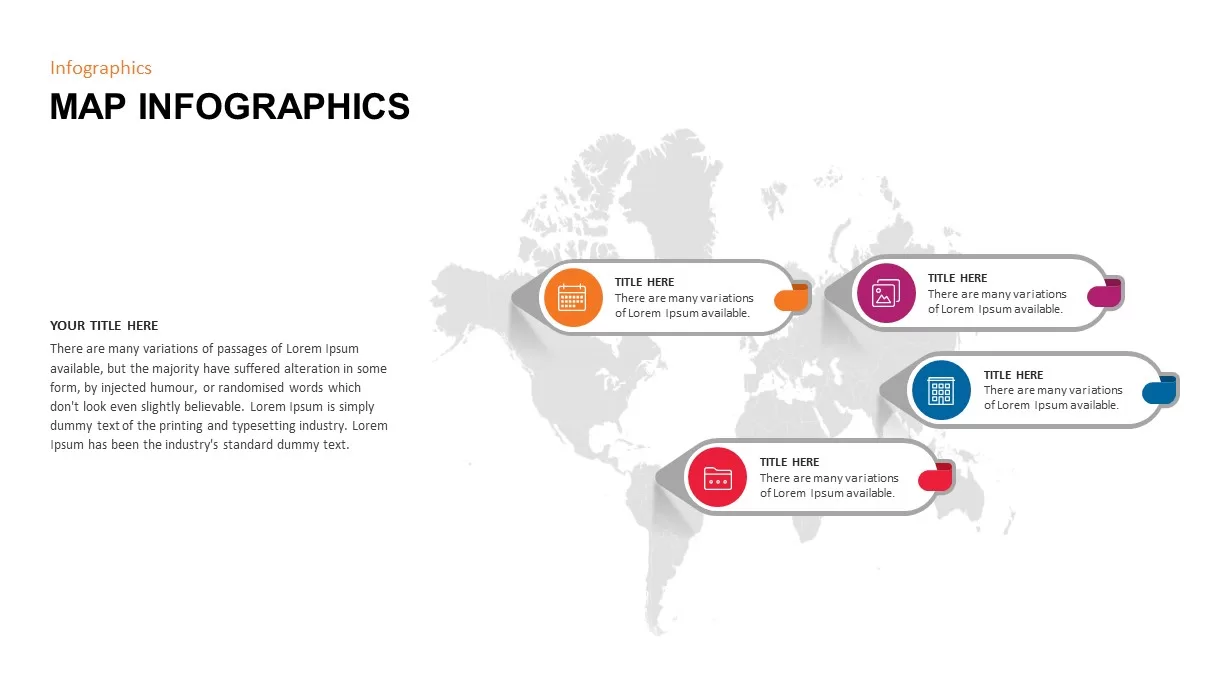
Modern World Map Callout Infographic Template for PowerPoint & Google Slides
World Maps
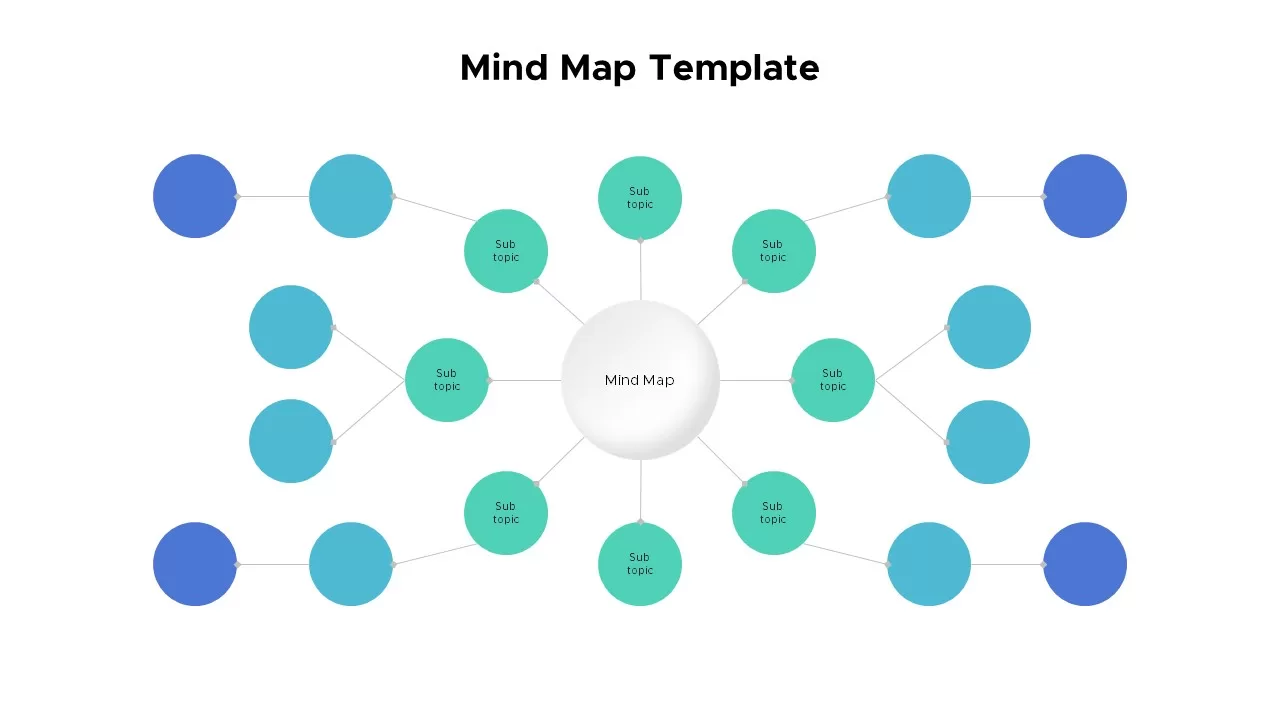
Eight-Node Mind Map Infographic Diagram Template for PowerPoint & Google Slides
Mind Maps
Six-Stage Road Map Infographic Timeline Template for PowerPoint & Google Slides
Roadmap
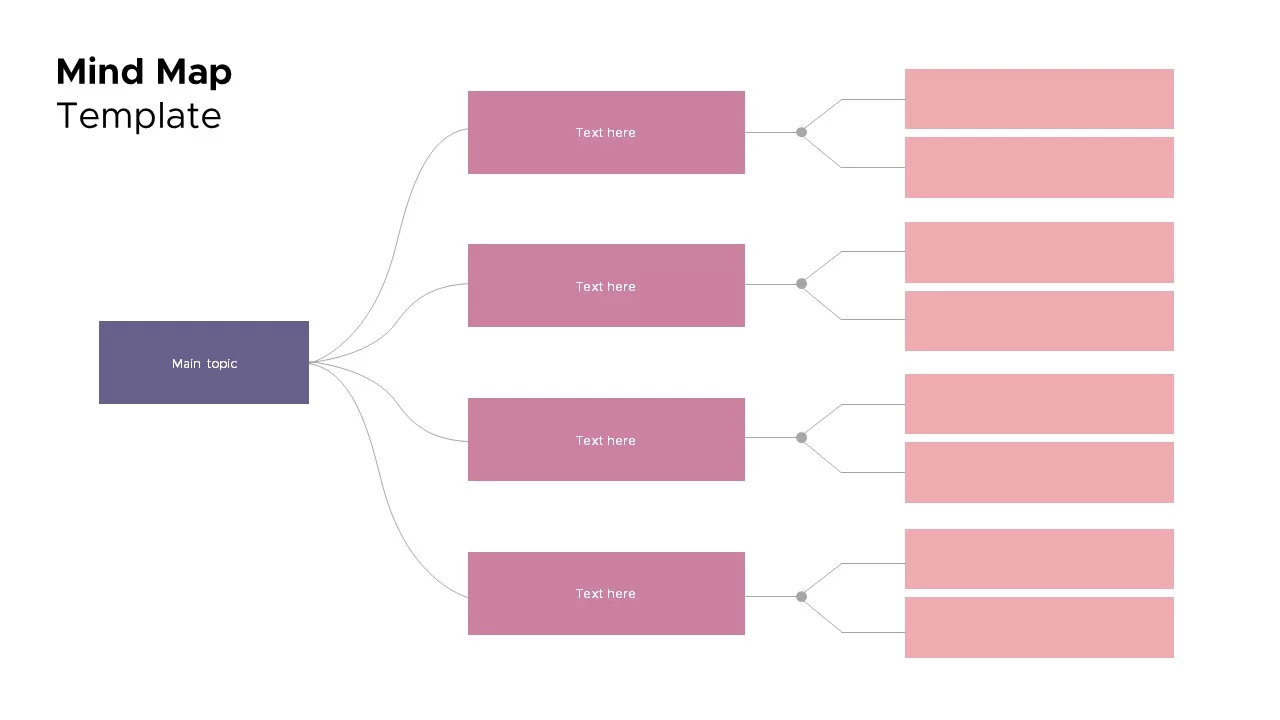
Versatile Mind Map Infographic Template for PowerPoint & Google Slides
Mind Maps
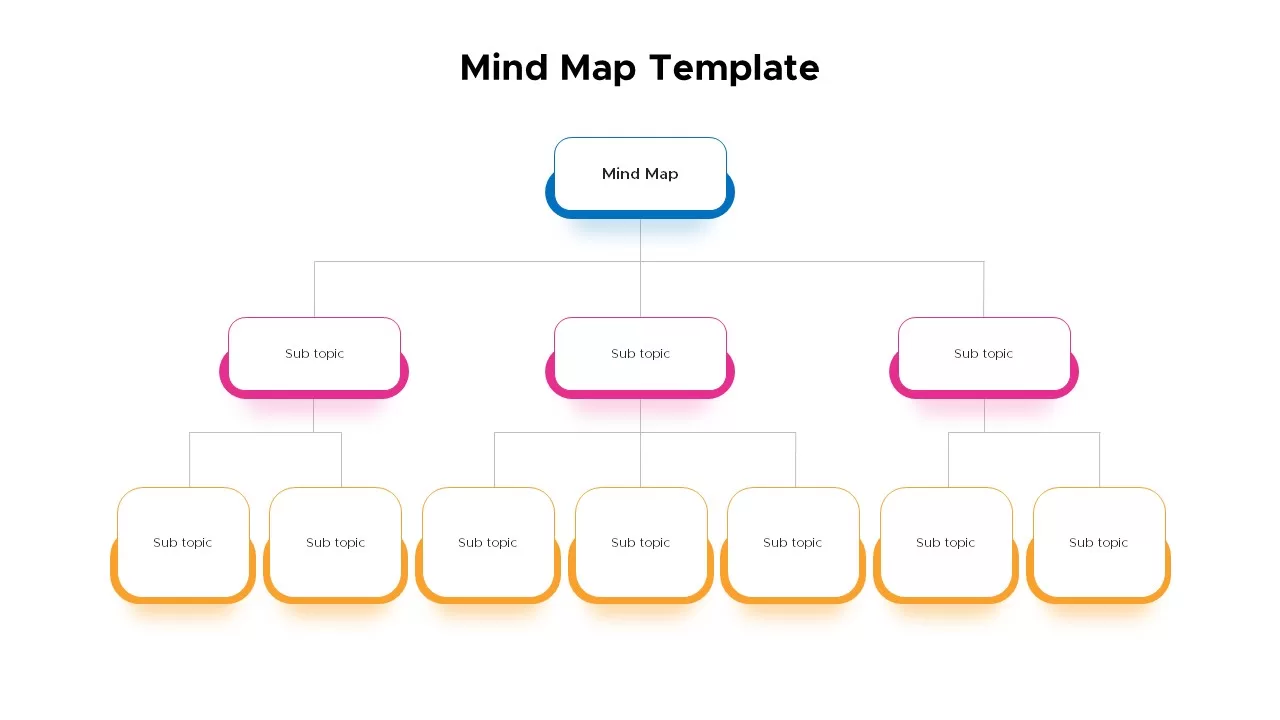
Structured Mind Map Infographic Diagram Template for PowerPoint & Google Slides
Mind Maps
Dual Topic Mind Map Infographic Template for PowerPoint & Google Slides
Mind Maps
Tri-Cluster Mind Map Infographic Template for PowerPoint & Google Slides
Mind Maps
Fully Editable World Map Infographic Template for PowerPoint & Google Slides
World Maps
Editable World Map Callout Infographic Template for PowerPoint & Google Slides
World Maps
Editable World Map Callout Infographic Template for PowerPoint & Google Slides
World Maps
North America Percentage Map Infographic Template for PowerPoint & Google Slides
World Maps
North America Map Infographic Slide Template for PowerPoint & Google Slides
World Maps
Editable Africa Map Infographic Data Template for PowerPoint & Google Slides
World Maps
Editable Ireland Map Infographic Slide Template for PowerPoint & Google Slides
World Maps
Free
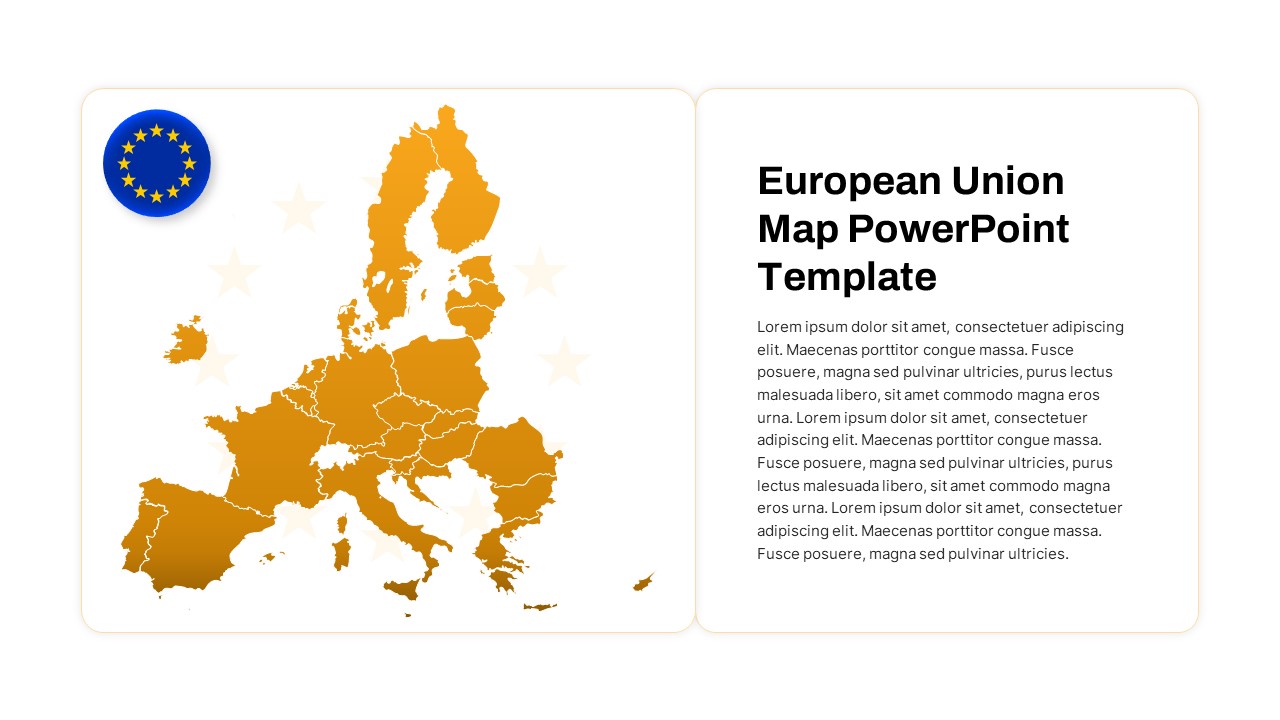
European Union Map Infographic Template for PowerPoint & Google Slides
World Maps
Syria Regional Data Map Infographic Template for PowerPoint & Google Slides
World Maps
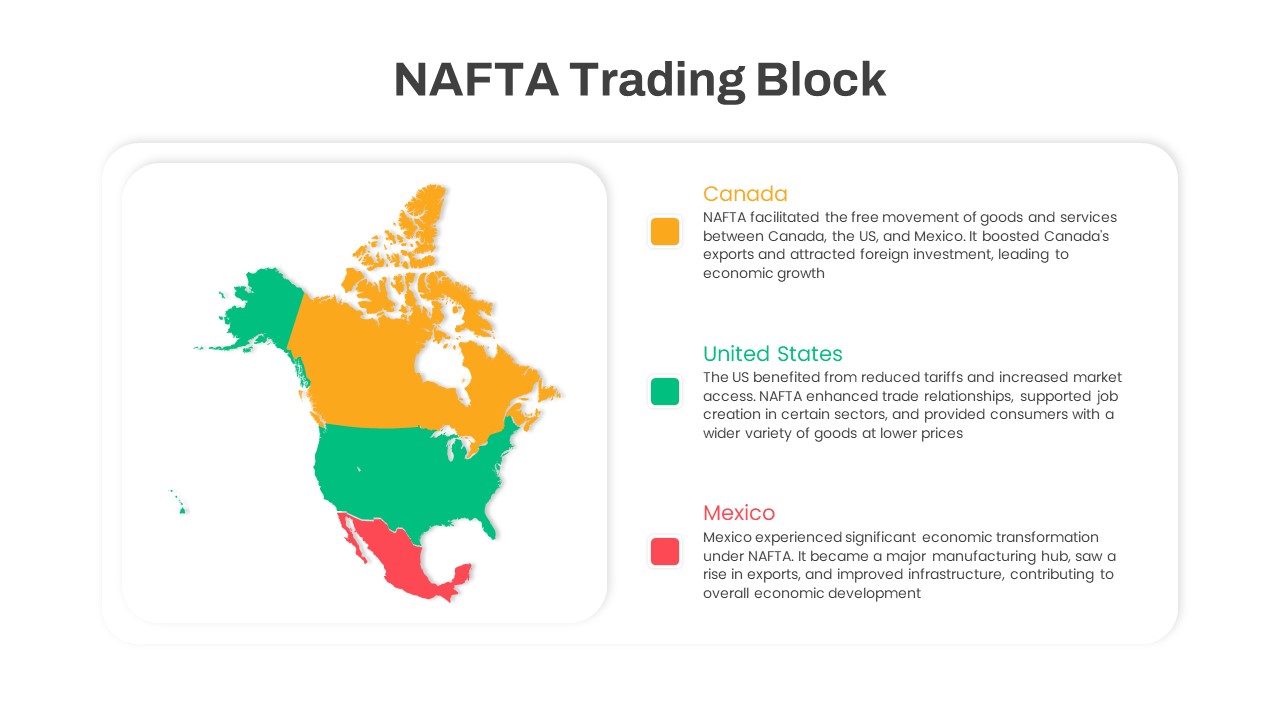
NAFTA Trading Block Map Infographic Template for PowerPoint & Google Slides
World Maps
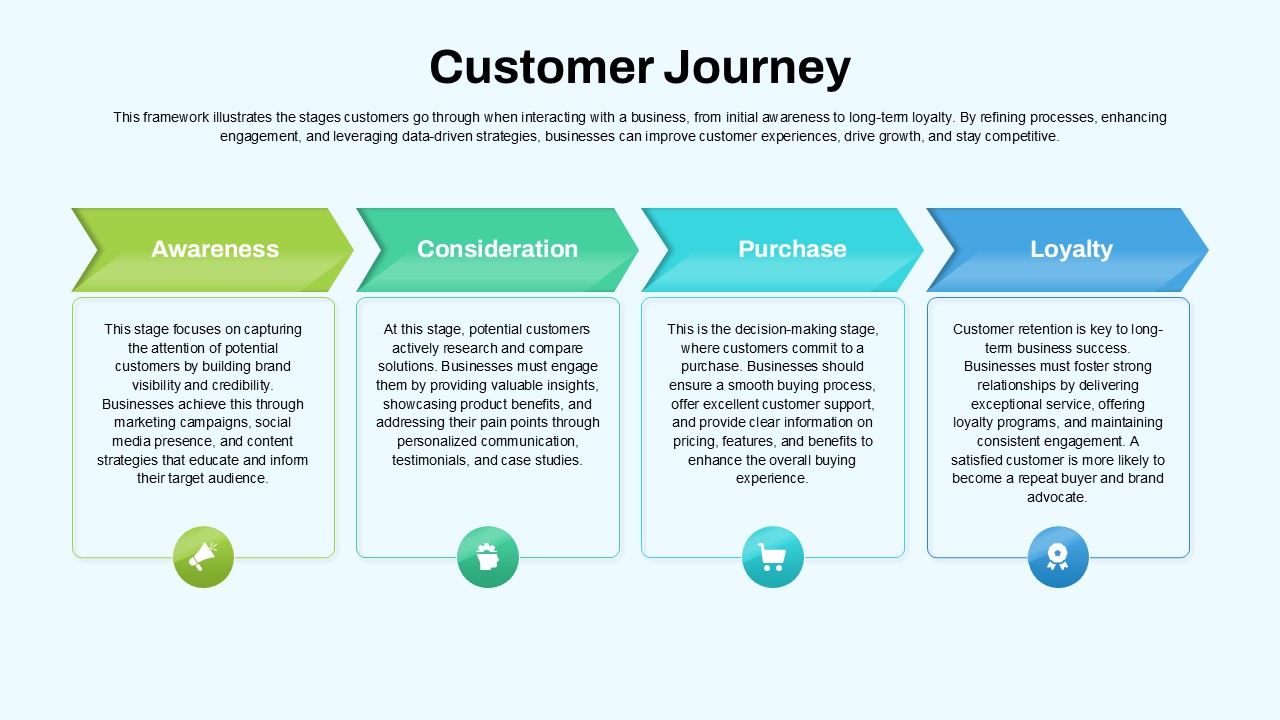
Customer Journey Process Map Infographic Template for PowerPoint & Google Slides
Customer Journey
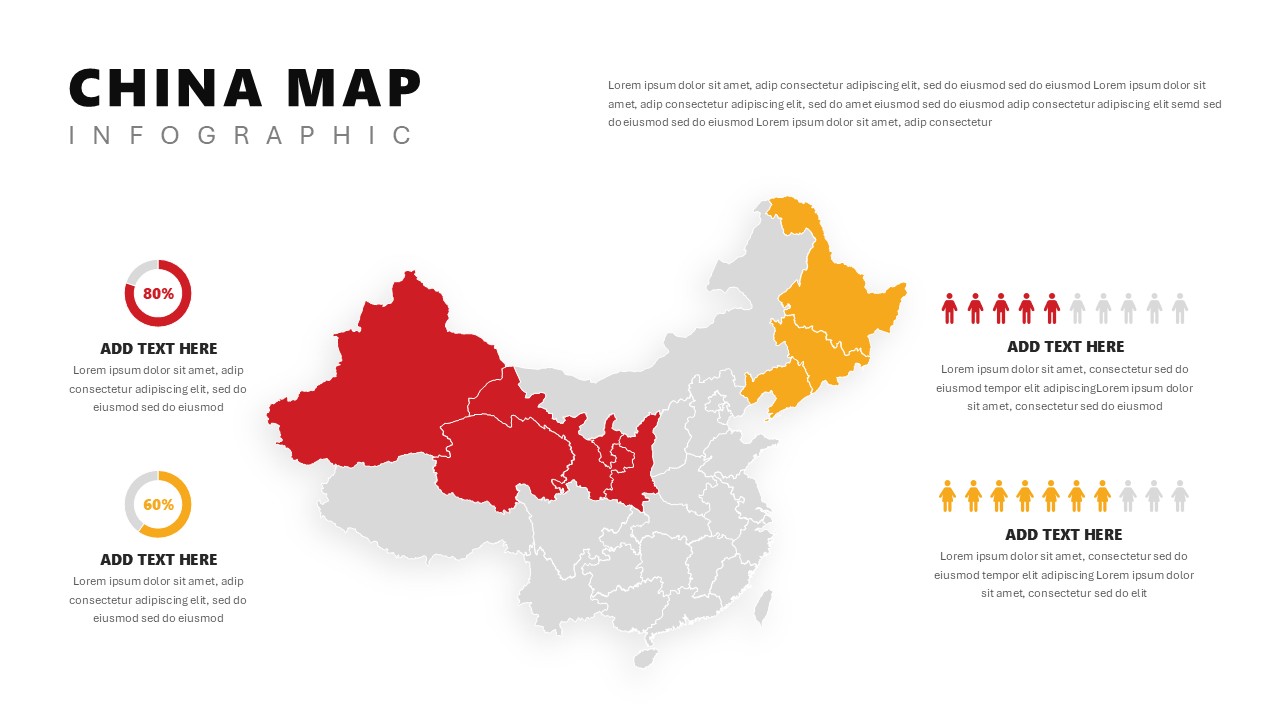
China Map Infographic Regional Stats Template for PowerPoint & Google Slides
World Maps
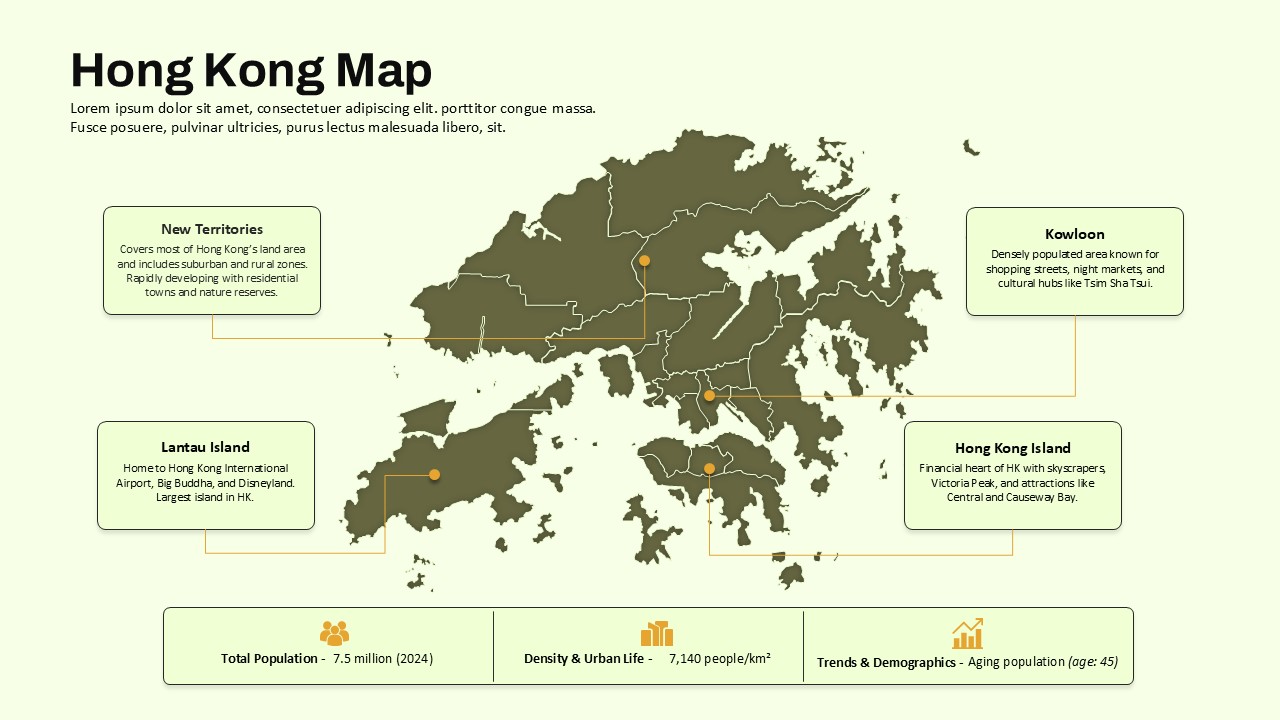
Hong Kong Geographic Map Infographic Template for PowerPoint & Google Slides
World Maps
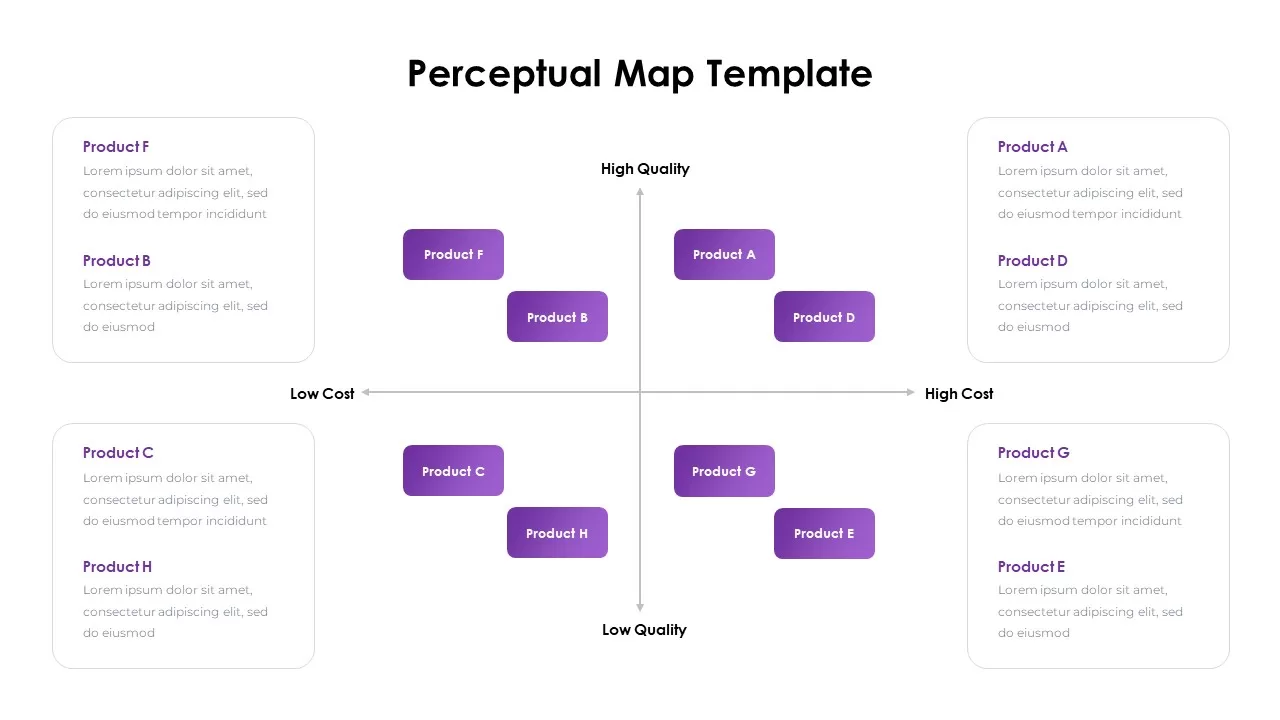
Perceptual Map infographic for PowerPoint & Google Slides
Competitor Analysis
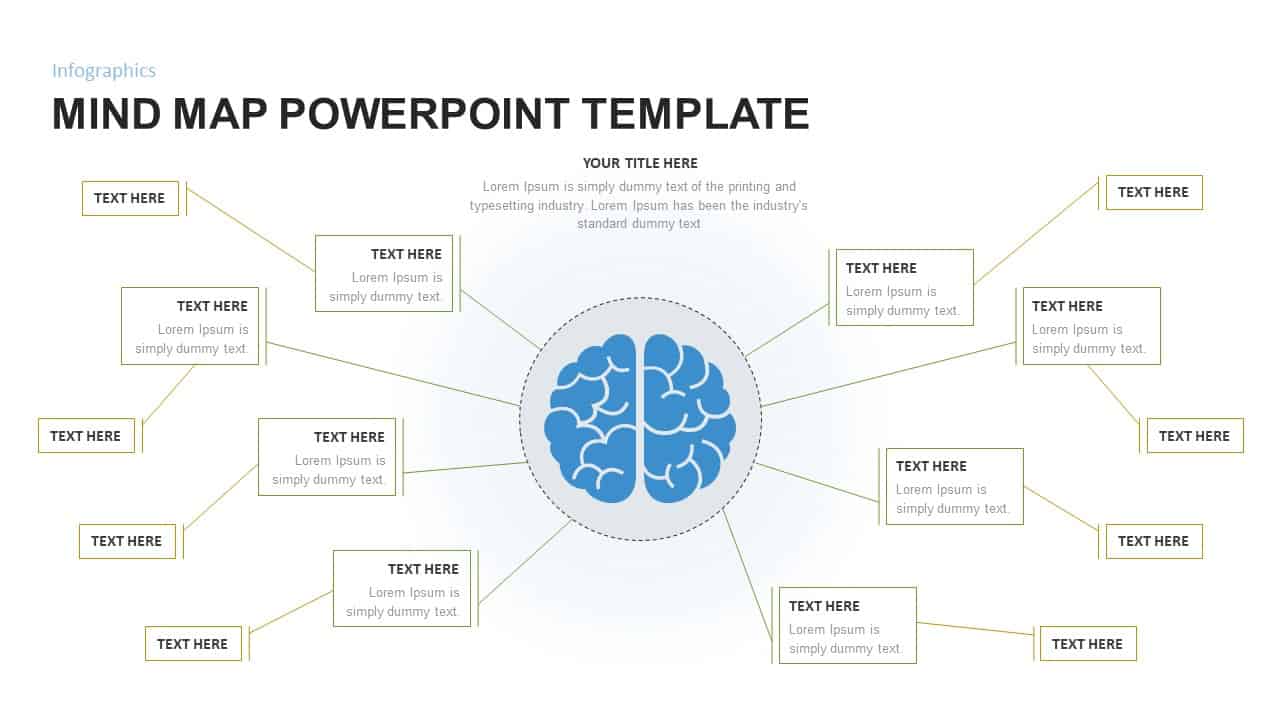
Mind Map PowerPoint template for PowerPoint & Google Slides
Mind Maps
Editable Colombia Map PowerPoint Template for PowerPoint & Google Slides
Business Models
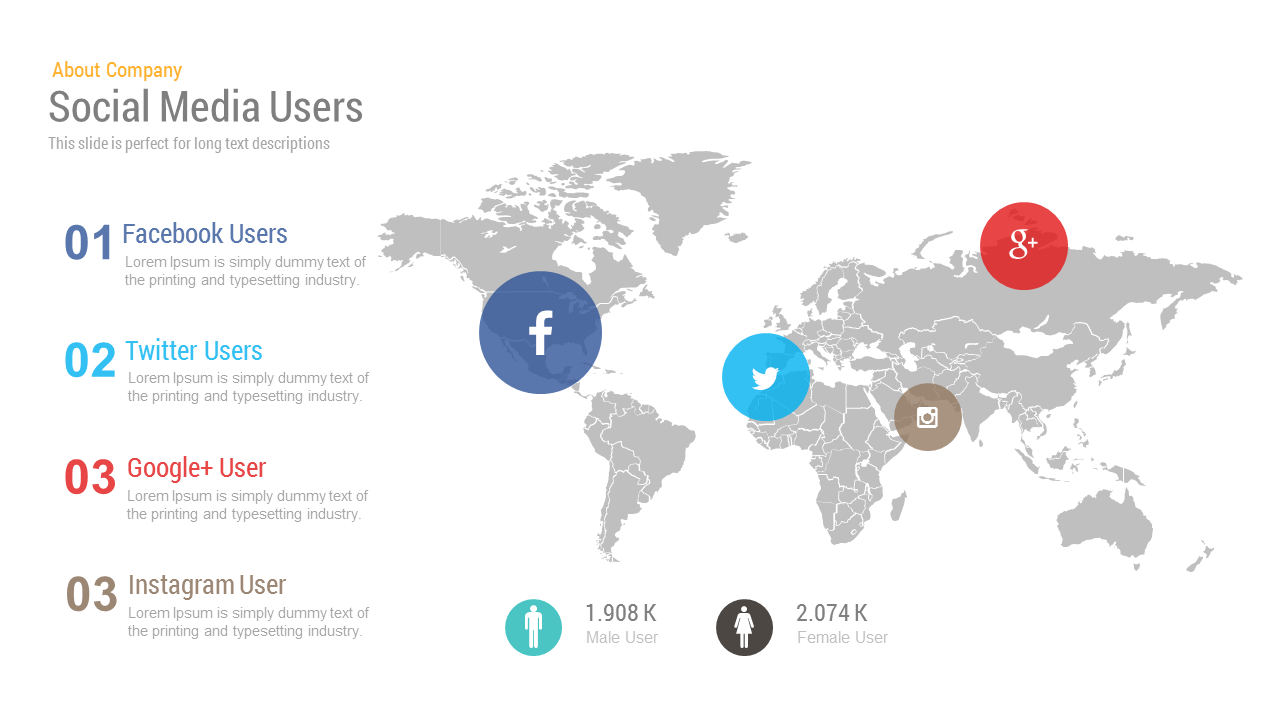
Free Social Media Users Map template for PowerPoint & Google Slides
World Maps
Free
World Map Data template for PowerPoint & Google Slides
World Maps
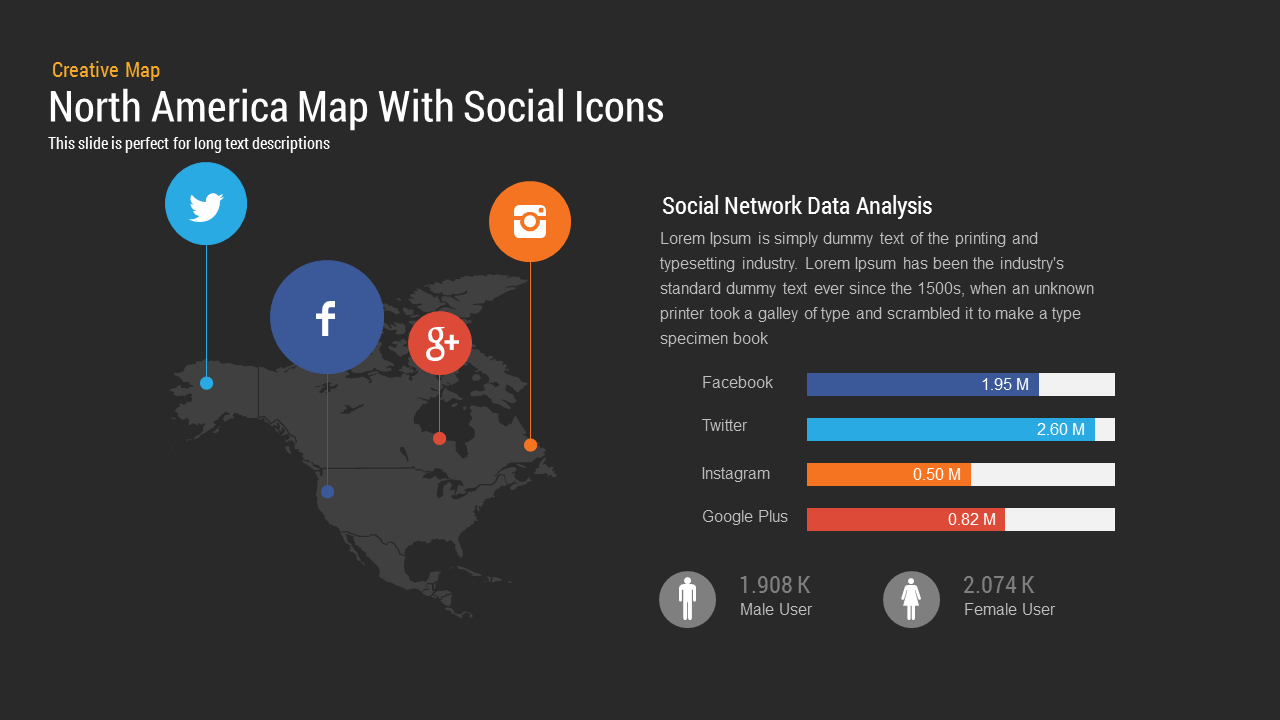
North America Map template for PowerPoint & Google Slides
World Maps
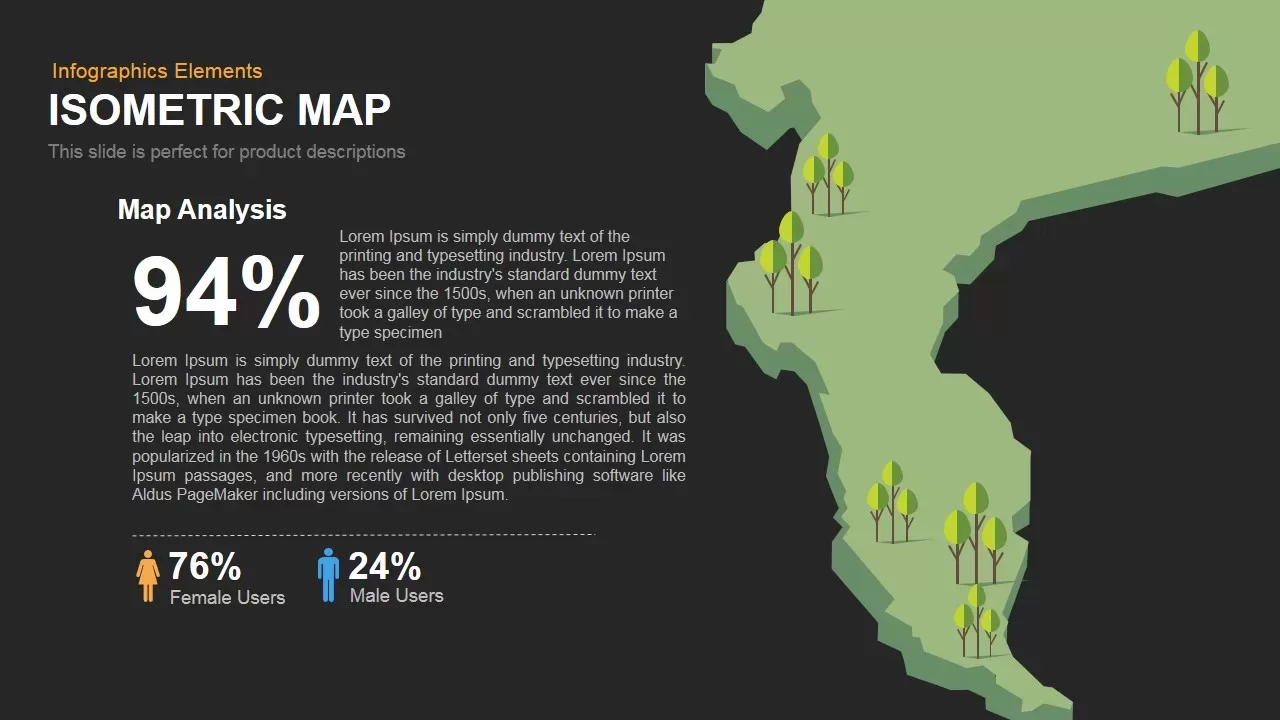
Isometric Map Analysis Slide Template for PowerPoint & Google Slides
World Maps
Risk Management Mind Map Radial Diagram template for PowerPoint & Google Slides
Mind Maps
Colorful Creative Mind Map Diagram template for PowerPoint & Google Slides
Mind Maps
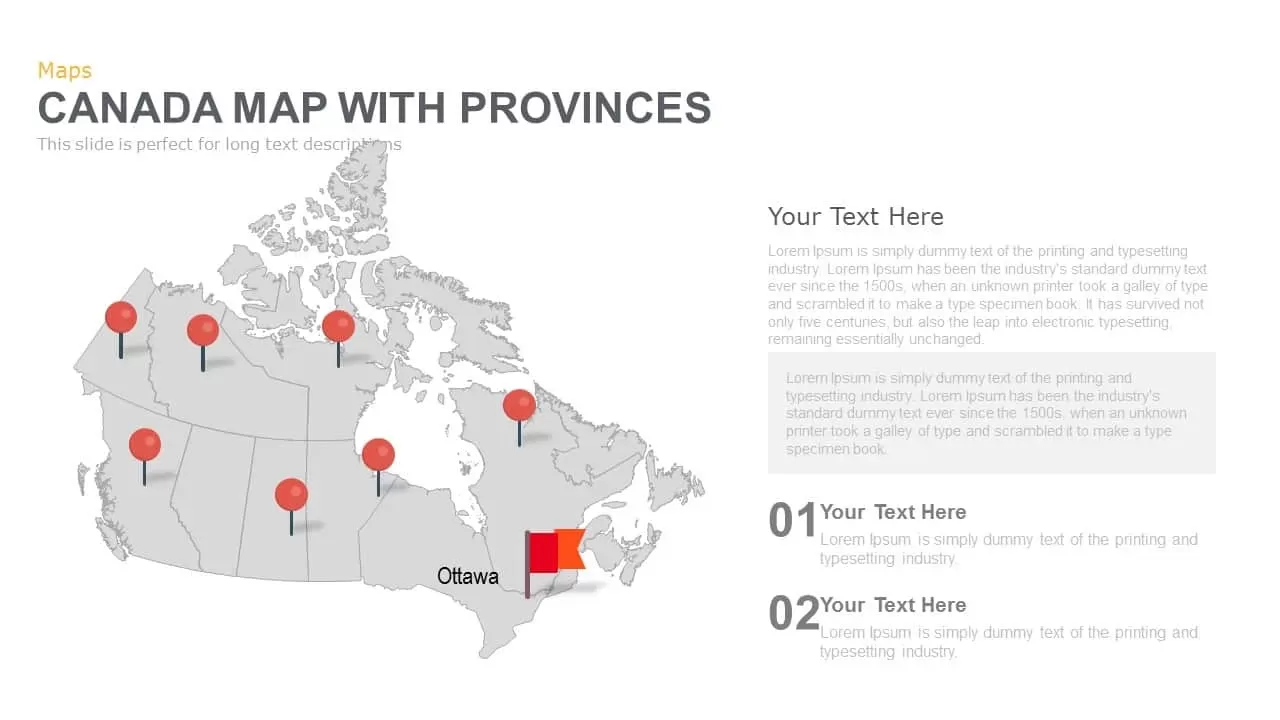
Canada Provinces Map Multi-Layout Template for PowerPoint & Google Slides
World Maps
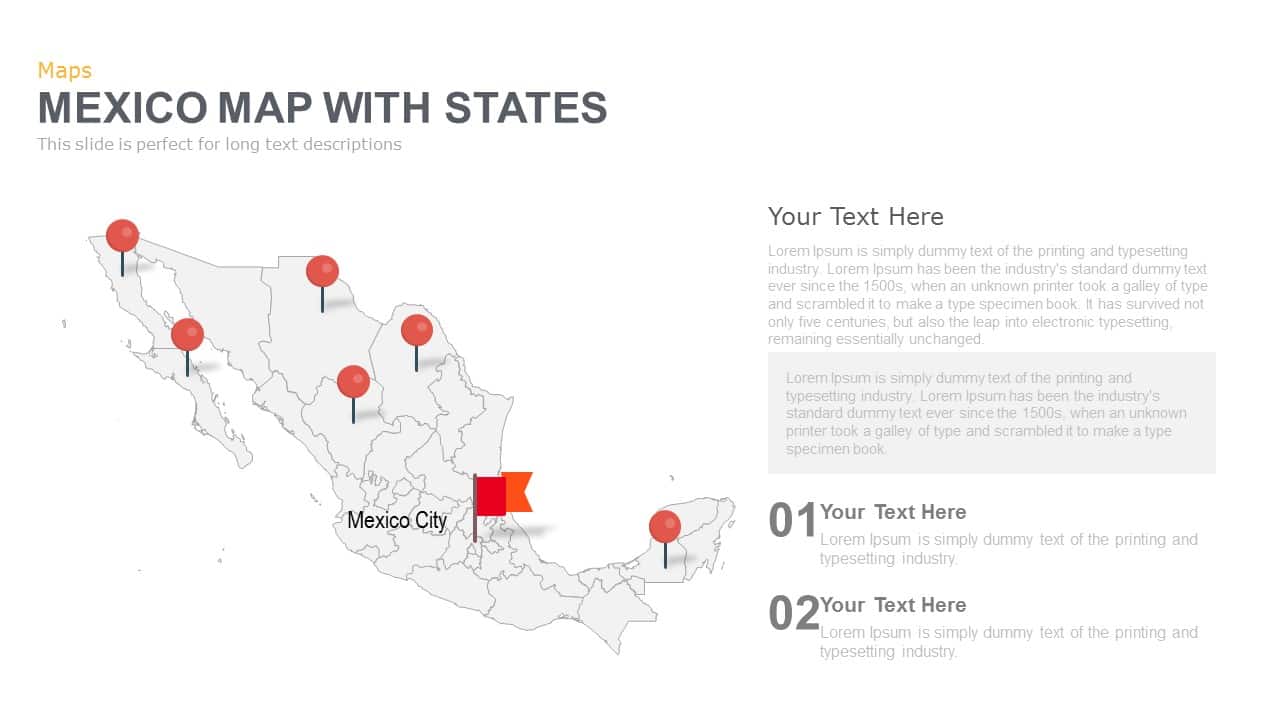
Mexico Map With States Template for PowerPoint & Google Slides
World Maps
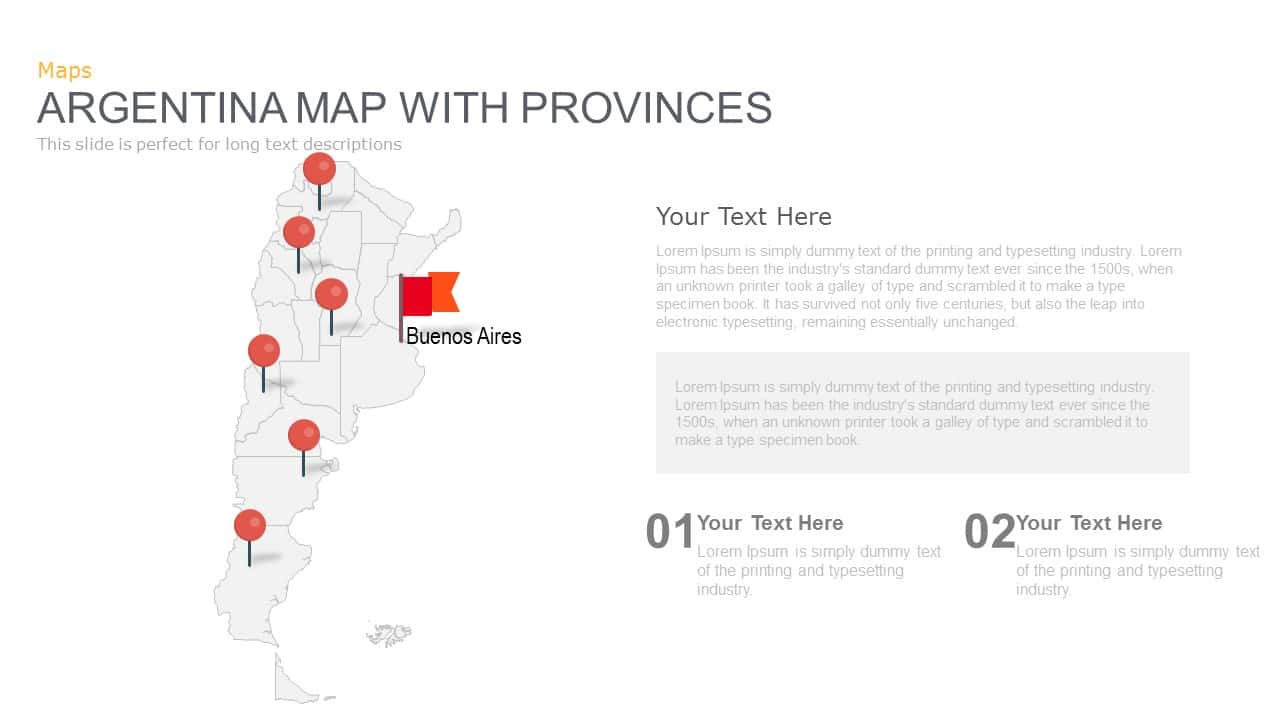
Argentina Province Map Markers Template for PowerPoint & Google Slides
World Maps
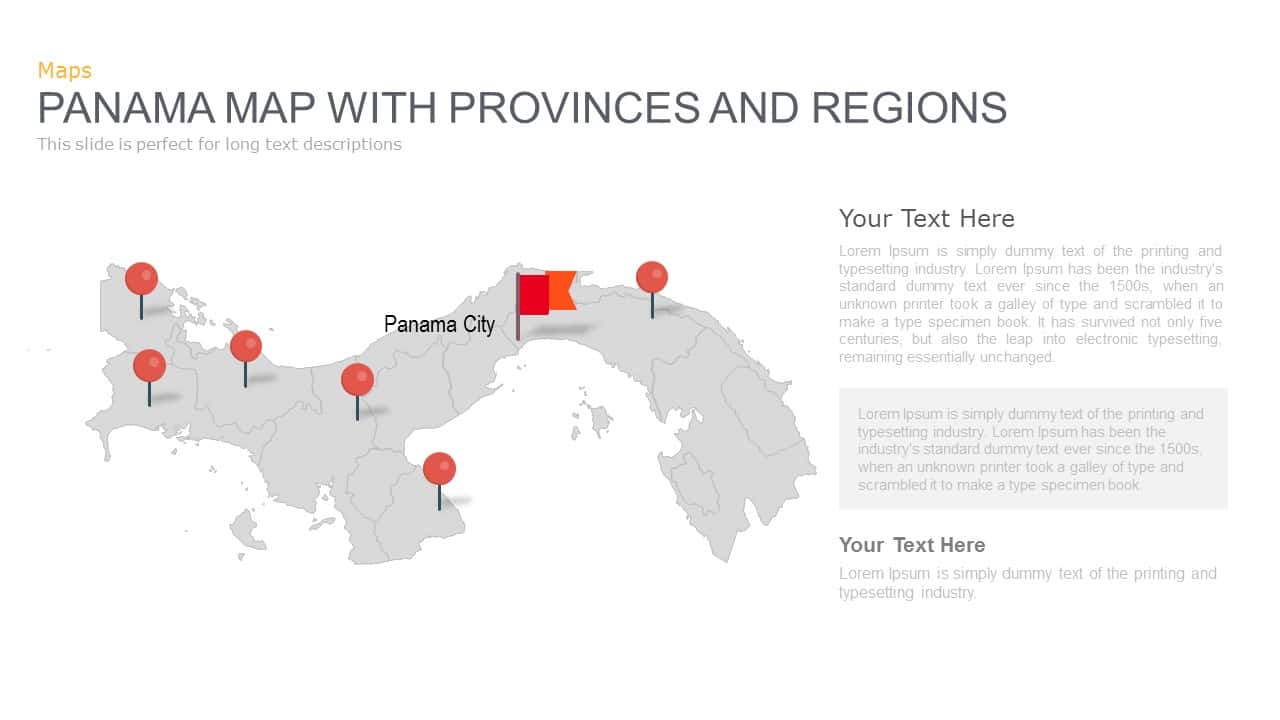
Panama Map with Region Markers Template for PowerPoint & Google Slides
World Maps
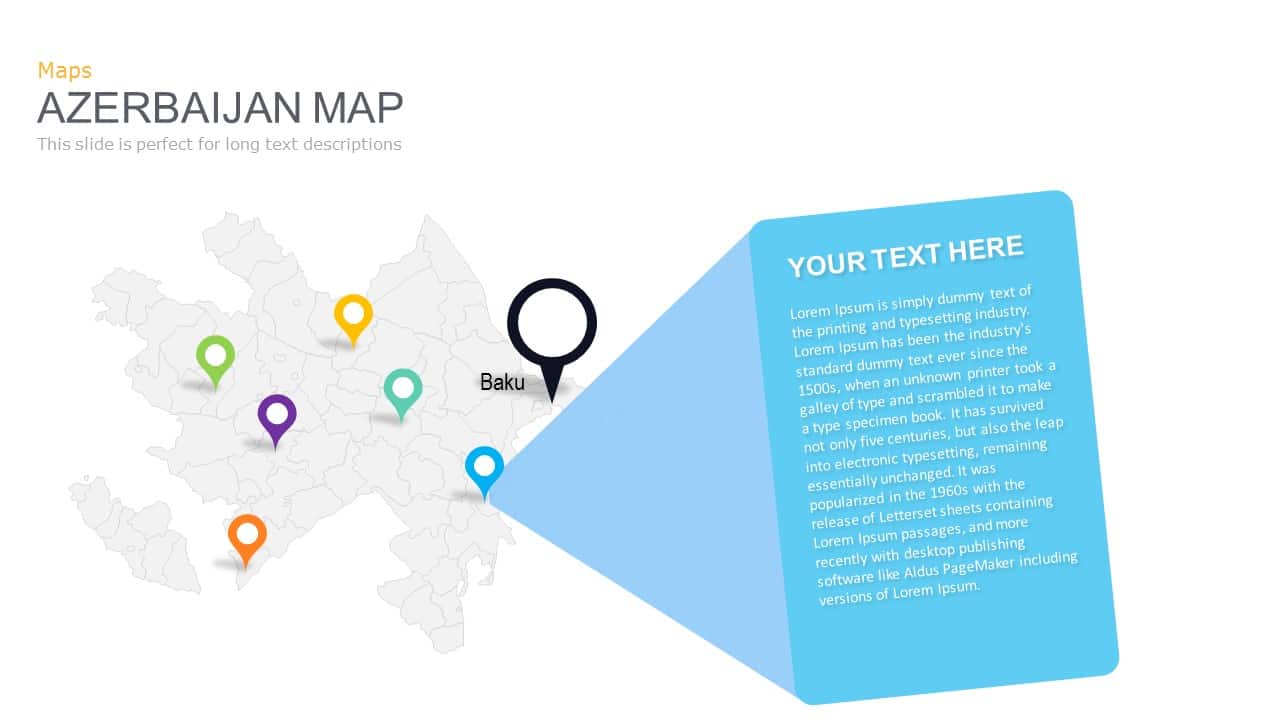
Azerbaijan Map with Provinces & Callouts Template for PowerPoint & Google Slides
World Maps
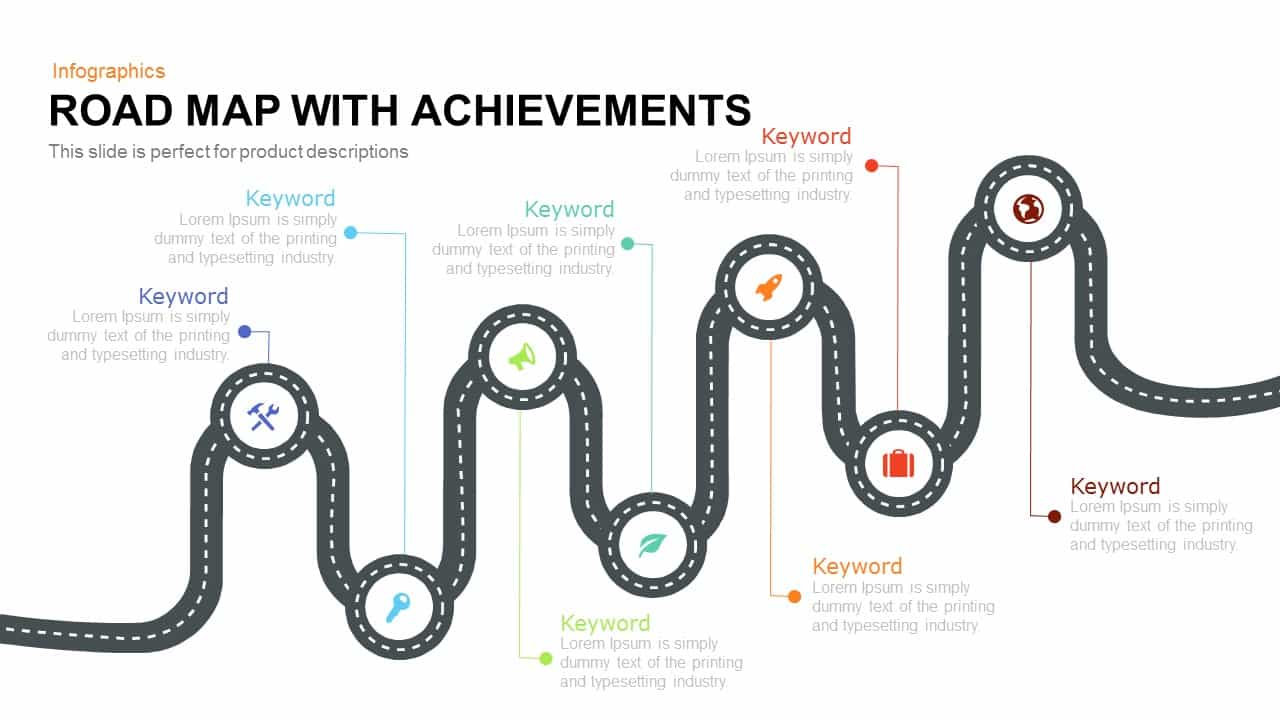
Road Map with Achievements Milestones Template for PowerPoint & Google Slides
Roadmap
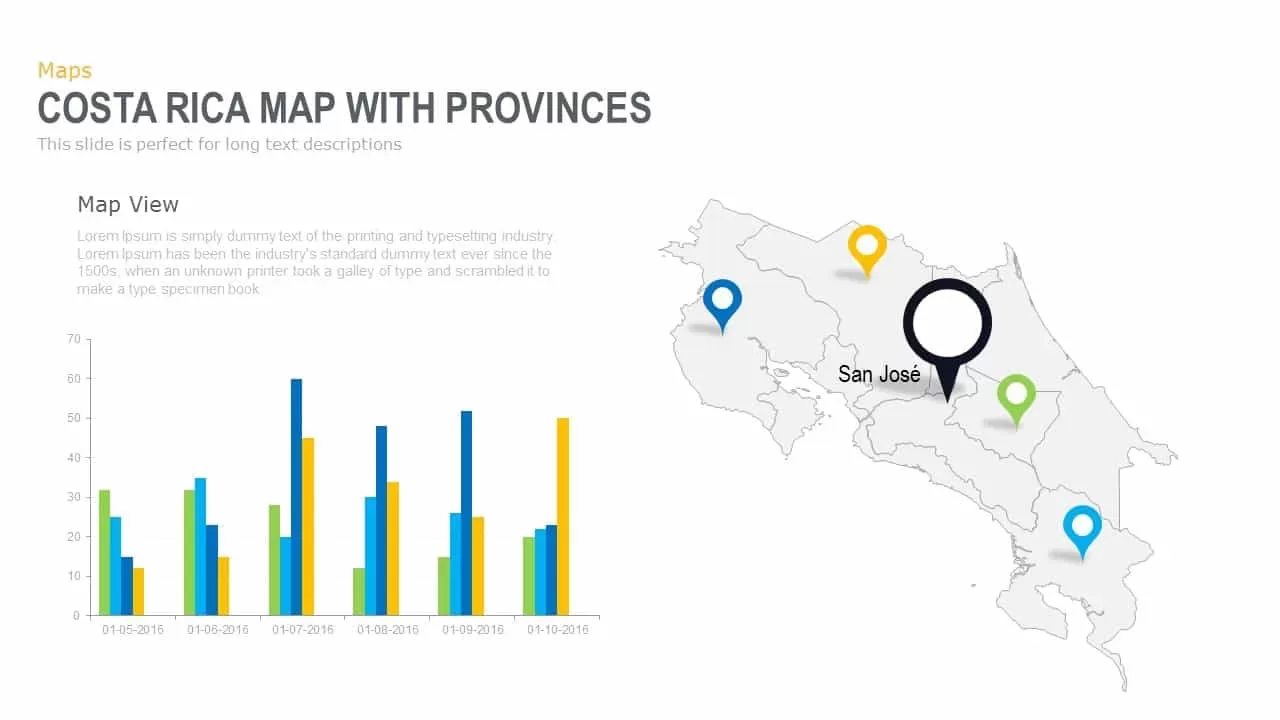
Interactive Costa Rica Province Map Template for PowerPoint & Google Slides
World Maps
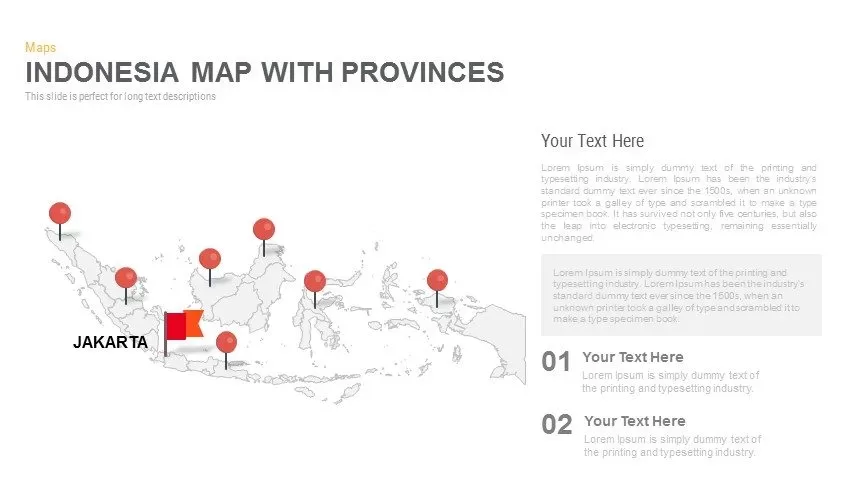
Indonesia Province Map Callout Slide Template for PowerPoint & Google Slides
Maps
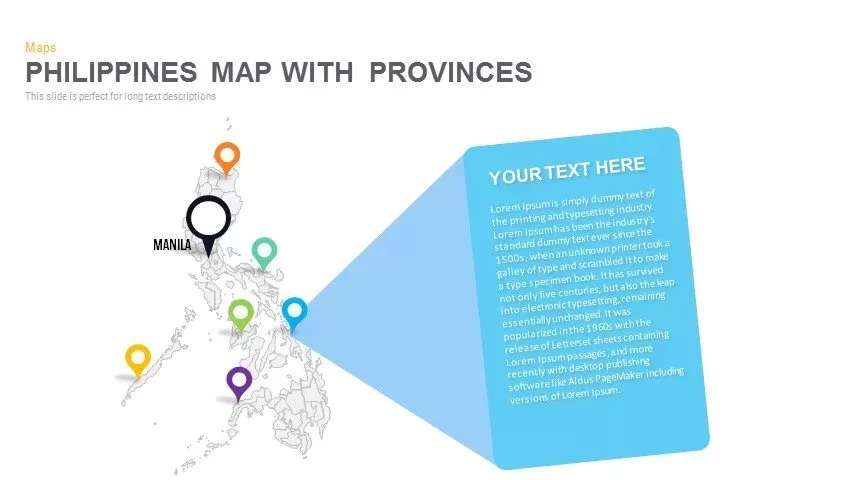
Philippines Map with Provinces Pack Template for PowerPoint & Google Slides
Maps
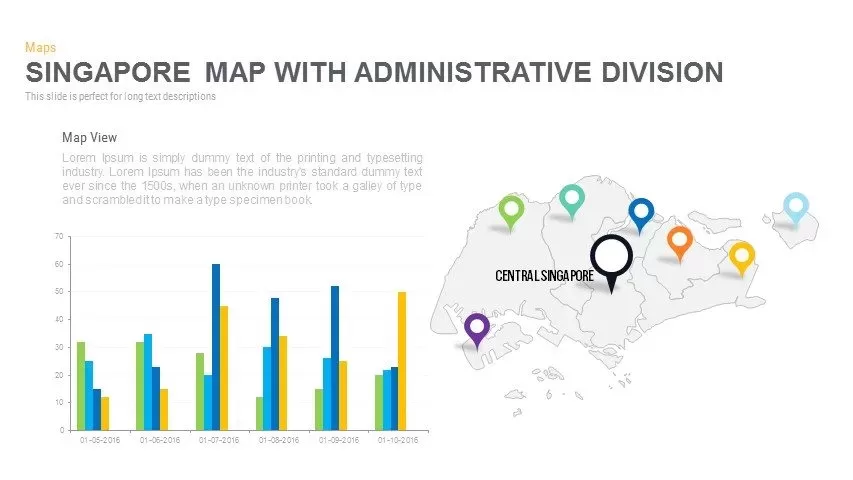
Singapore Map Pack Template for PowerPoint & Google Slides
Maps
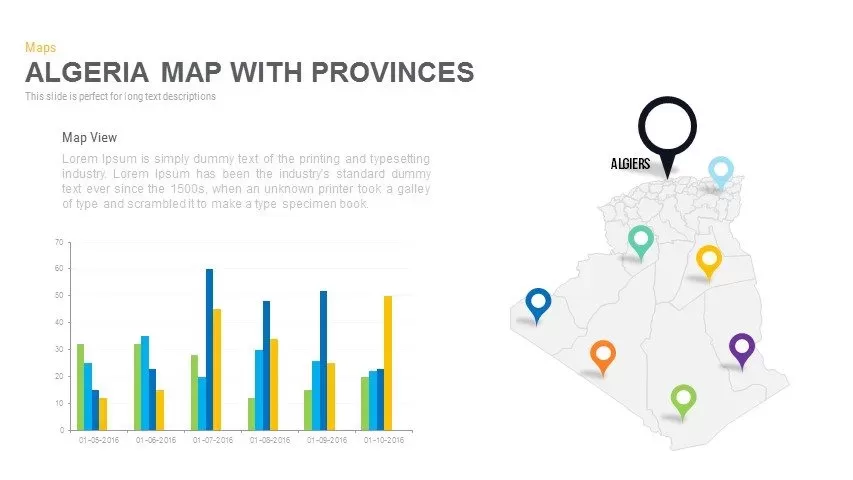
Algeria Map with Provinces Pack Template for PowerPoint & Google Slides
Maps
Angola Provinces Map Slide Pack Template for PowerPoint & Google Slides
World Maps
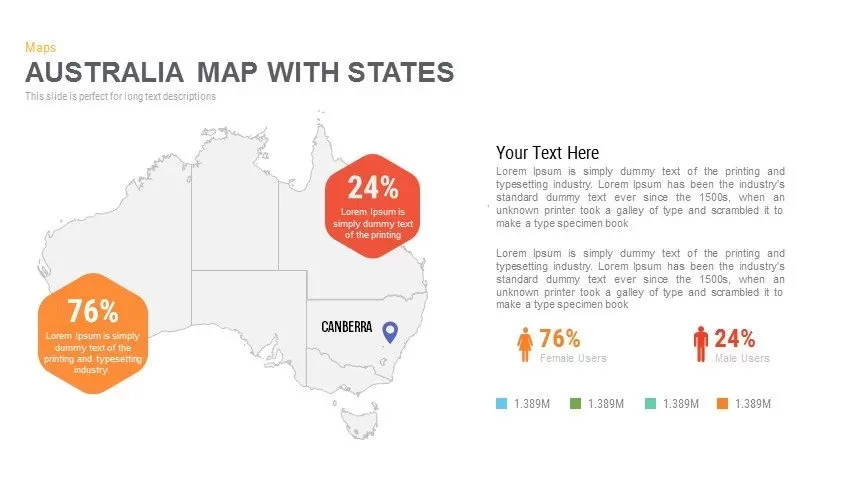
Australia Map with State Markers Template for PowerPoint & Google Slides
Maps
Angola Map with Provinces Slide Pack Template for PowerPoint & Google Slides
World Maps
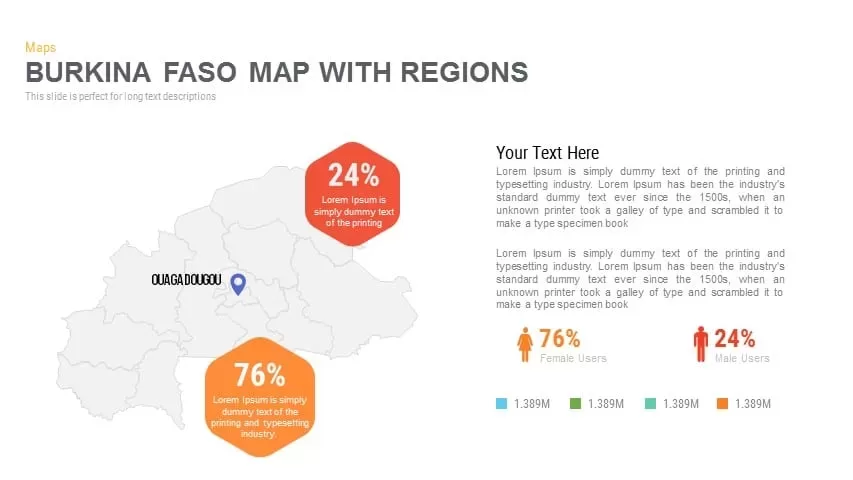
Burkina Faso Map with Regions Slide Pack Template for PowerPoint & Google Slides
World Maps
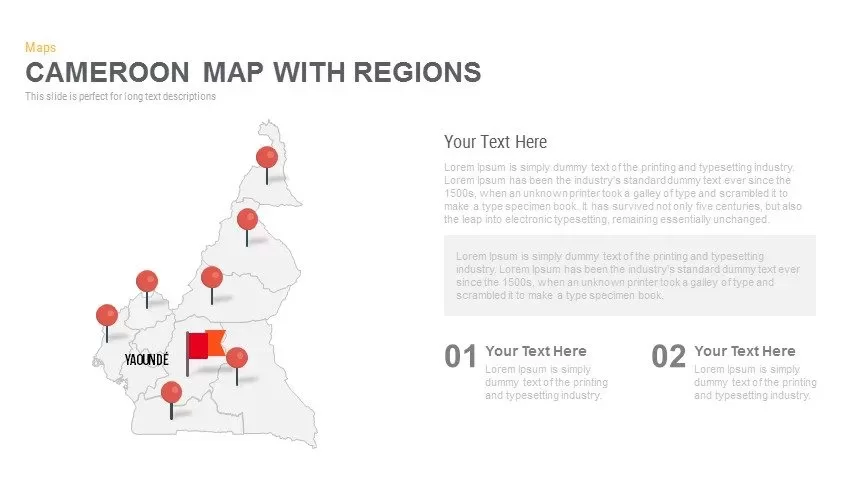
Cameroon Map with Regions Slide Pack Template for PowerPoint & Google Slides
World Maps
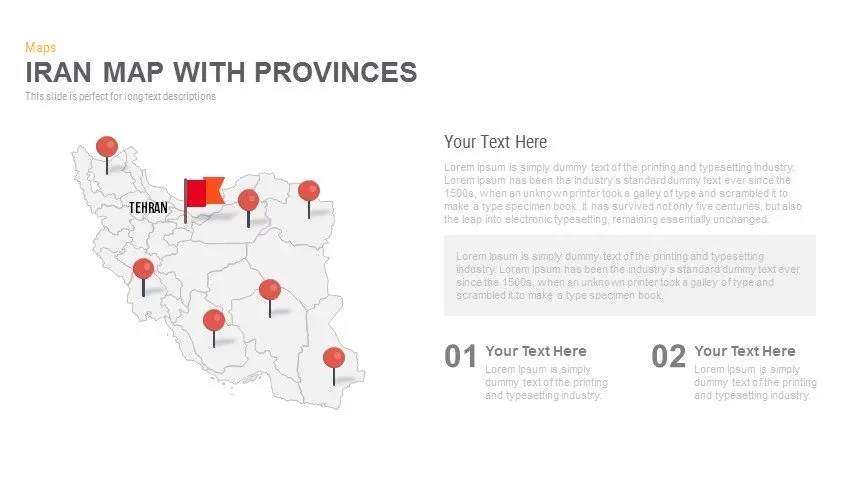
Iran Map with Provinces Slide Pack Template for PowerPoint & Google Slides
World Maps
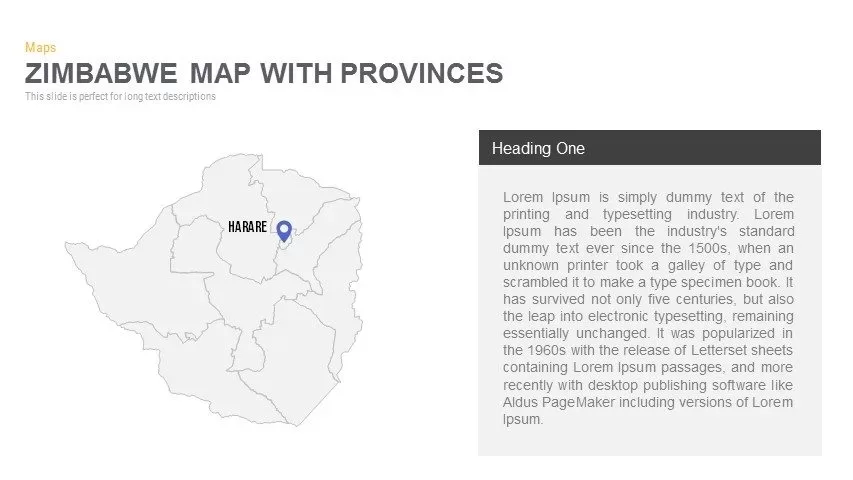
Zimbabwe Map with Provinces Slide Pack Template for PowerPoint & Google Slides
World Maps

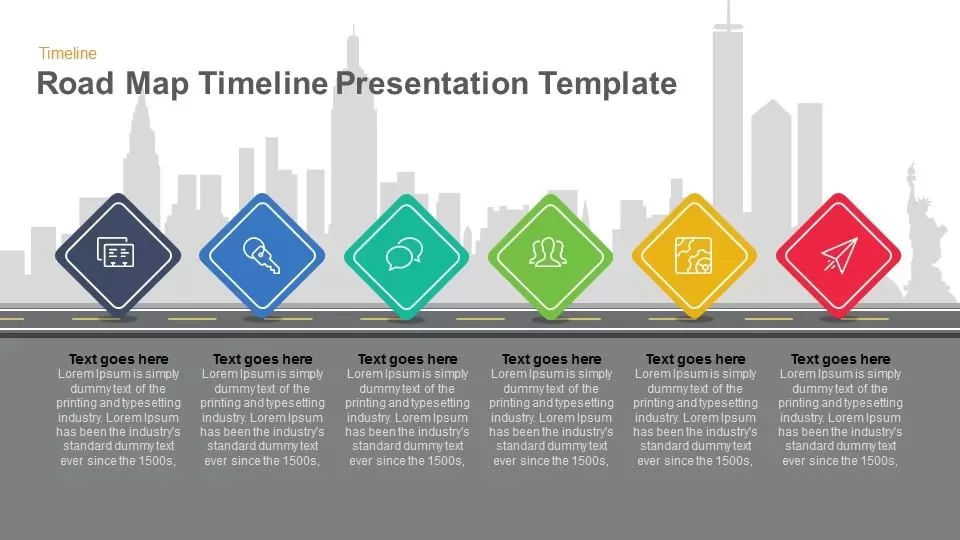
Road Map Timeline Presentation template for PowerPoint & Google Slides
Roadmap

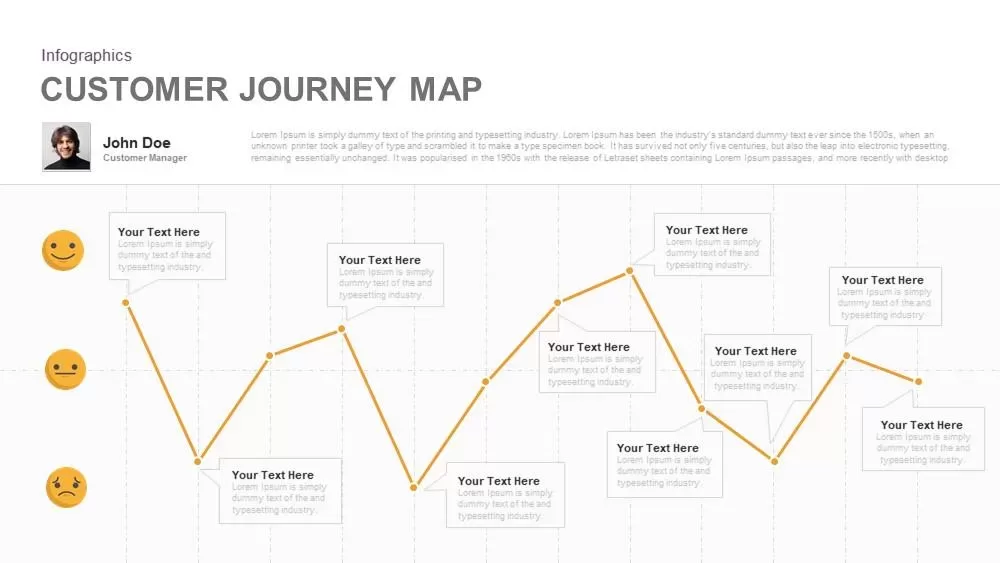
Emotional Customer Journey Map Template for PowerPoint & Google Slides
Customer Journey
Risk Management Heat Map Diagram Template for PowerPoint & Google Slides
Comparison Chart
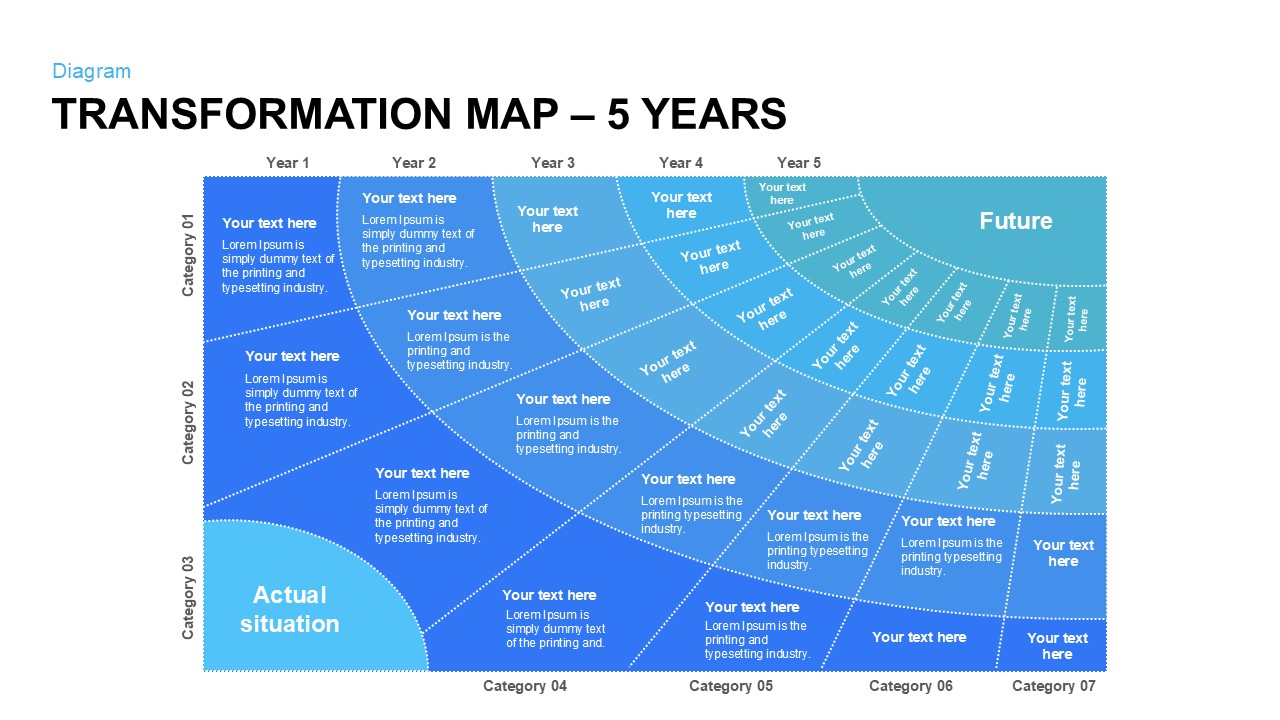
Five-Year Transformation Map Diagram Template for PowerPoint & Google Slides
Process
Interactive Empathy Map Diagram Template for PowerPoint & Google Slides
Process
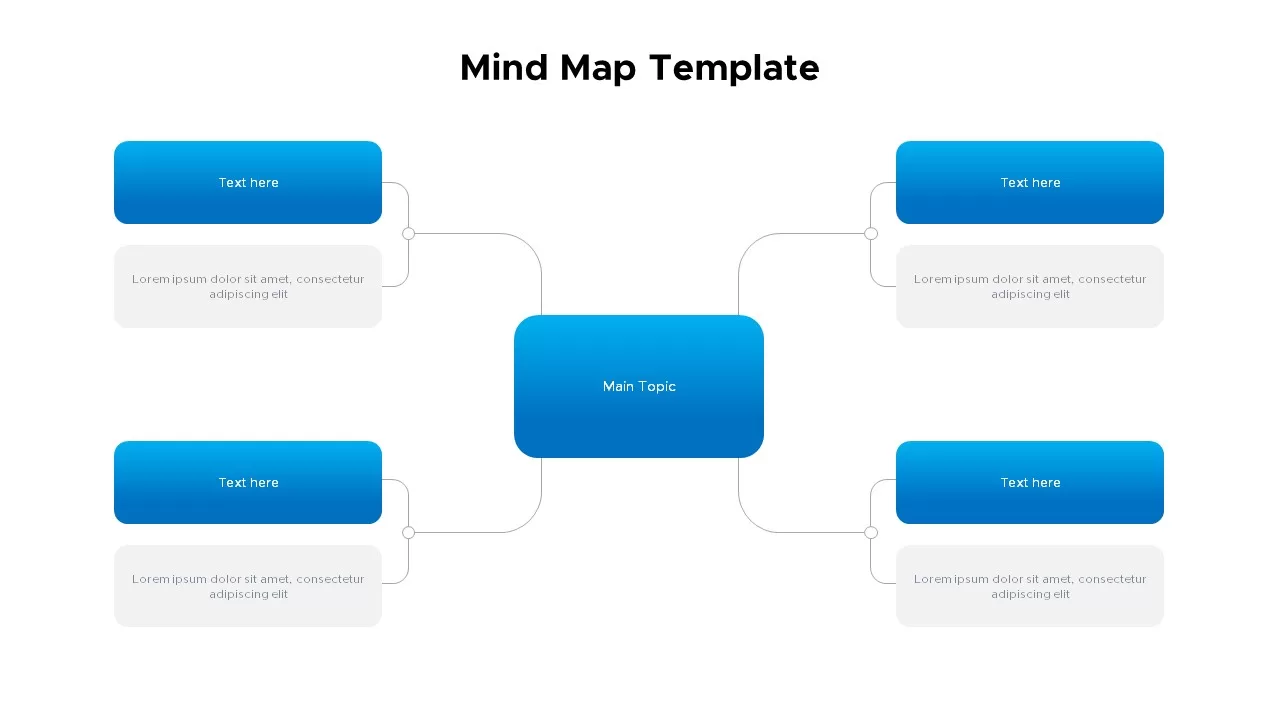
Mind Map Template for PowerPoint & Google Slides
Mind Maps
Colorful Mind Map Template for PowerPoint & Google Slides
Mind Maps
Colorful Mind Map Template for PowerPoint & Google Slides
Mind Maps
Circular Mind Map Template for PowerPoint & Google Slides
Mind Maps
Mind Map Template for PowerPoint & Google Slides
Mind Maps
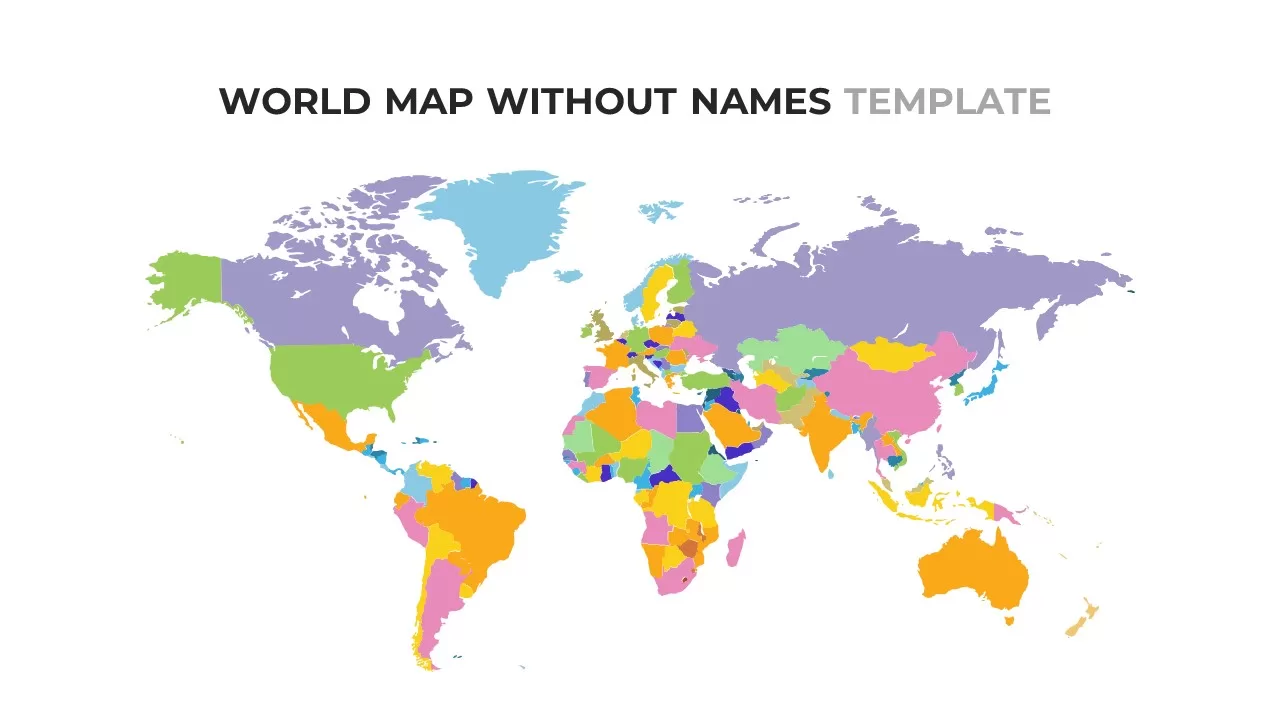
World Map Without Names Template for PowerPoint & Google Slides
World Maps
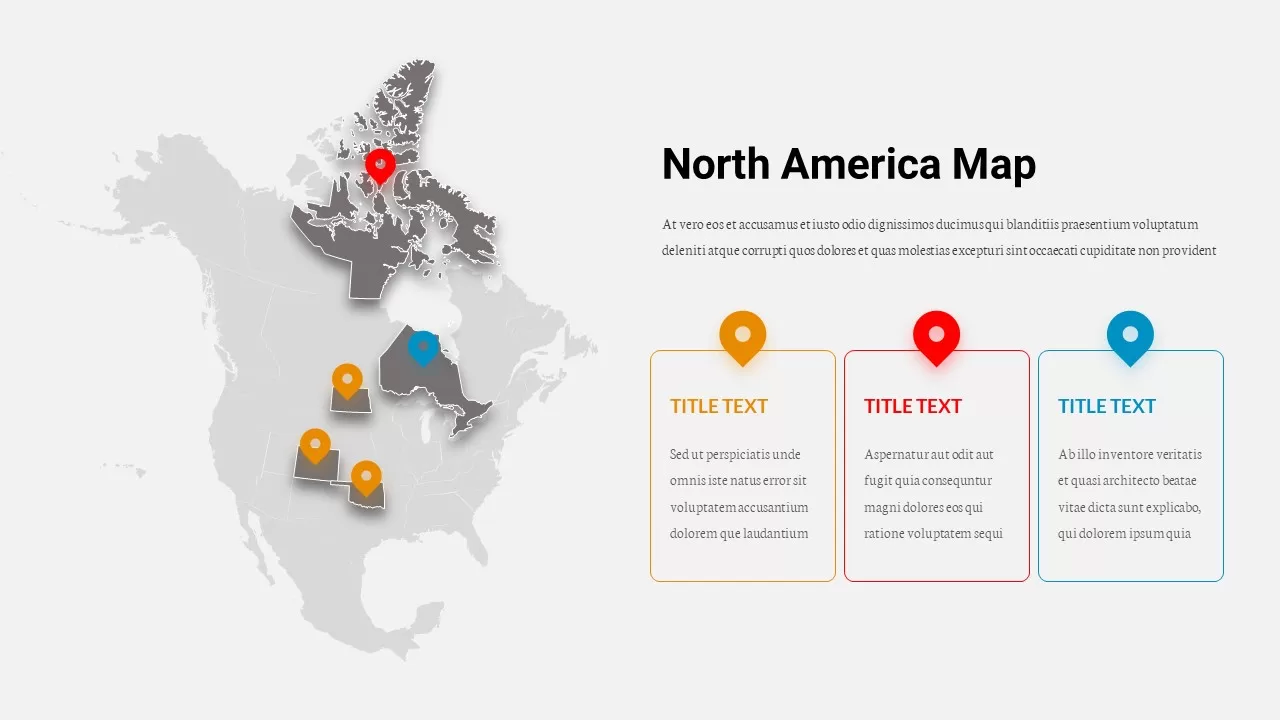
North America Location Pin Map Overview Template for PowerPoint & Google Slides
World Maps
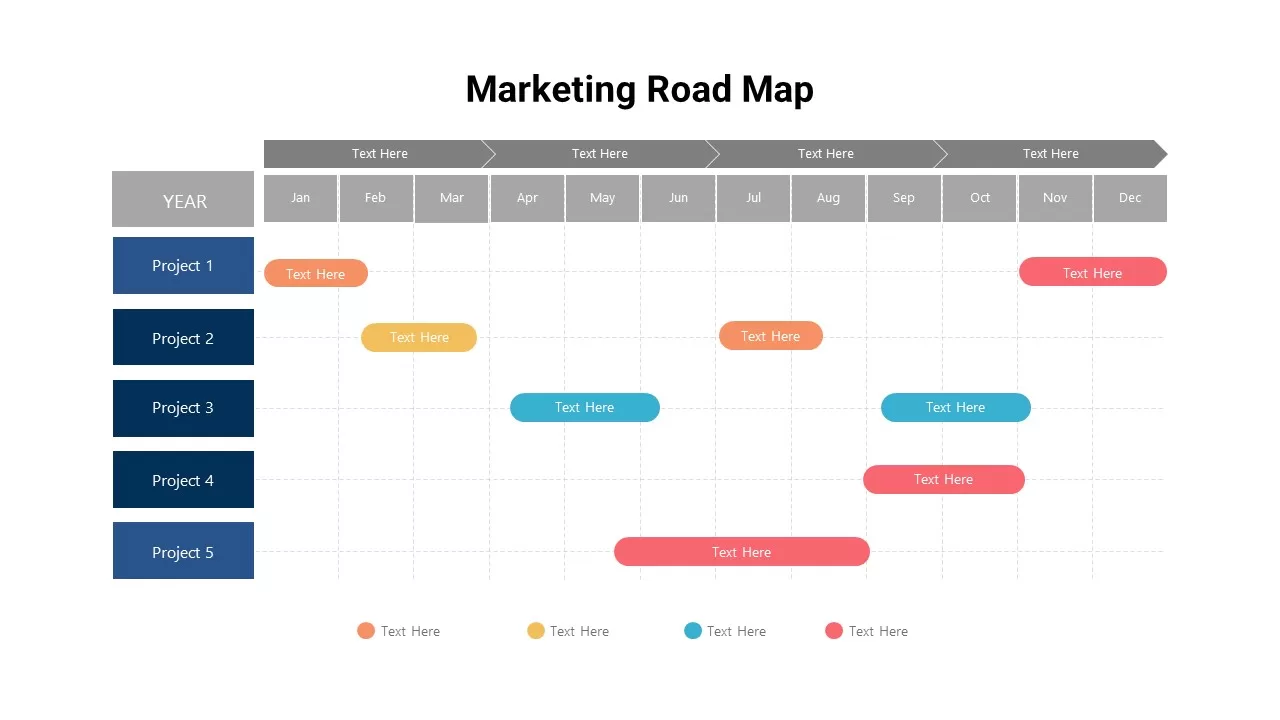
Marketing Projects Road Map Timeline Template for PowerPoint & Google Slides
Roadmap
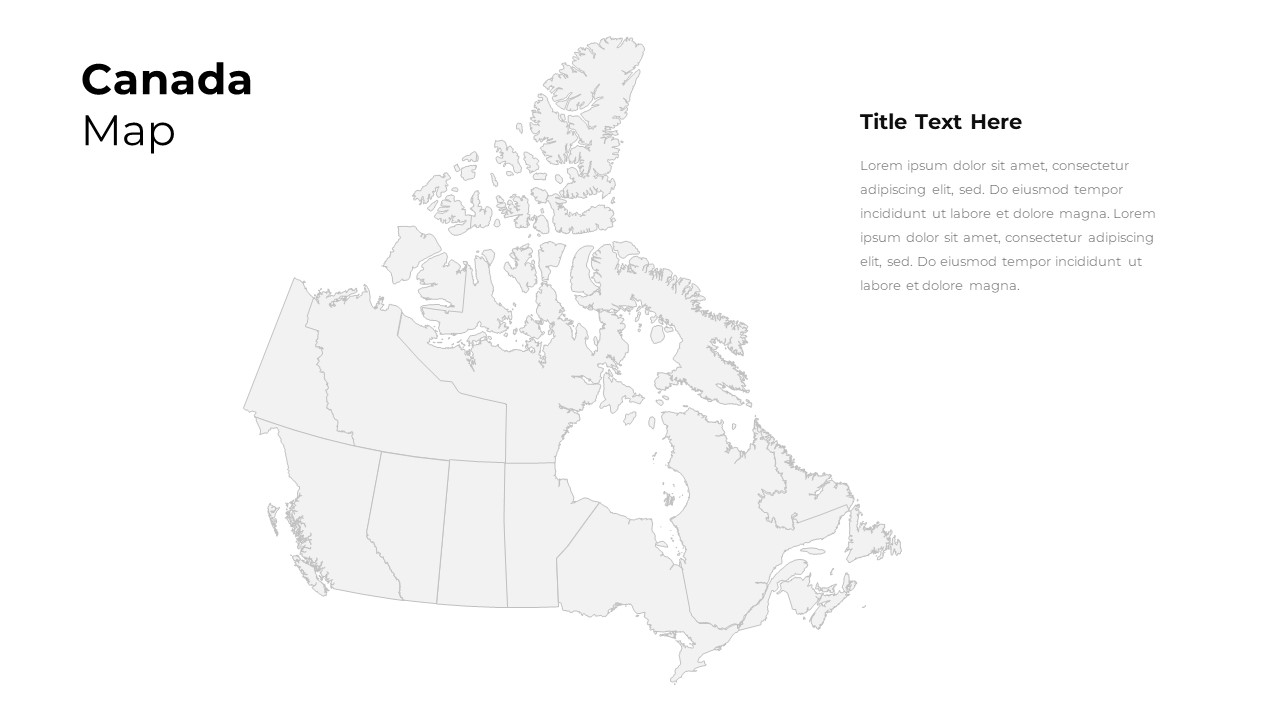
Customizable Canada Map Outline Template for PowerPoint & Google Slides
World Maps
North America Data Map Callouts Template for PowerPoint & Google Slides
World Maps
Heat Map Risk Assessment Presentation Template for PowerPoint & Google Slides
Risk Management
Professional Interactive Heat Map Matrix Template for PowerPoint & Google Slides
Comparison Chart
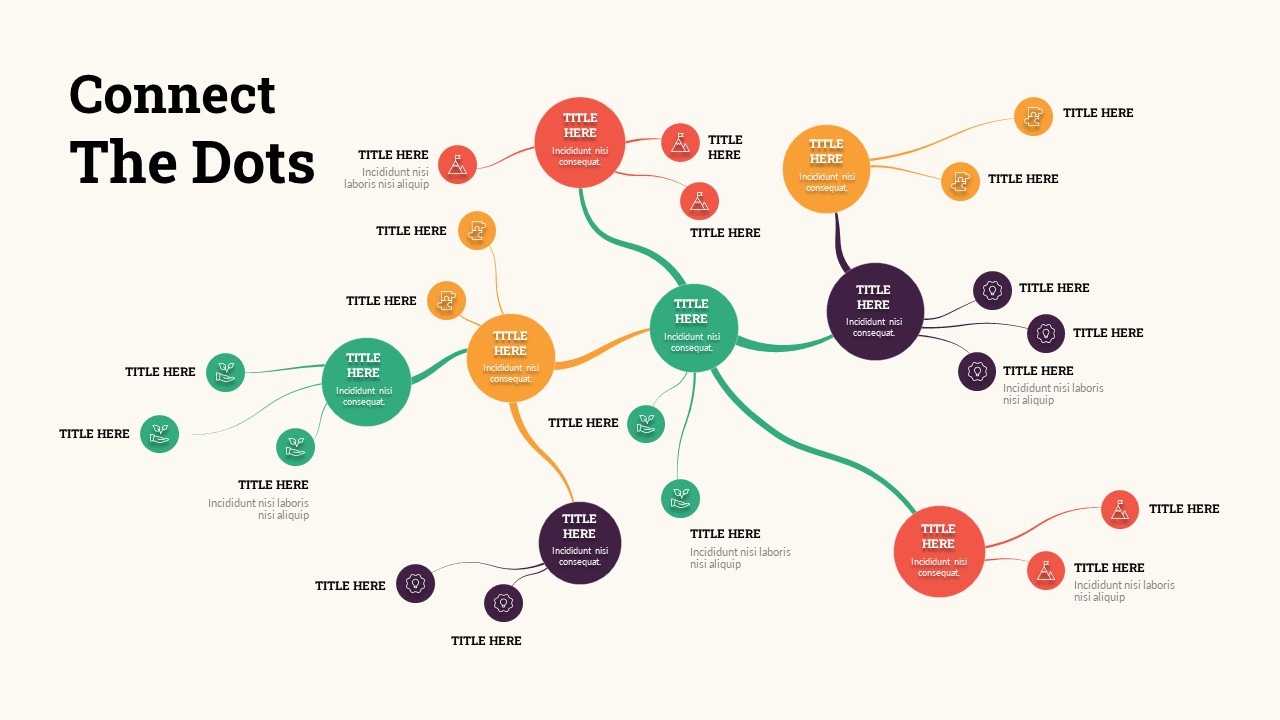
Connect the Dots Mind Map template for PowerPoint & Google Slides
Mind Maps
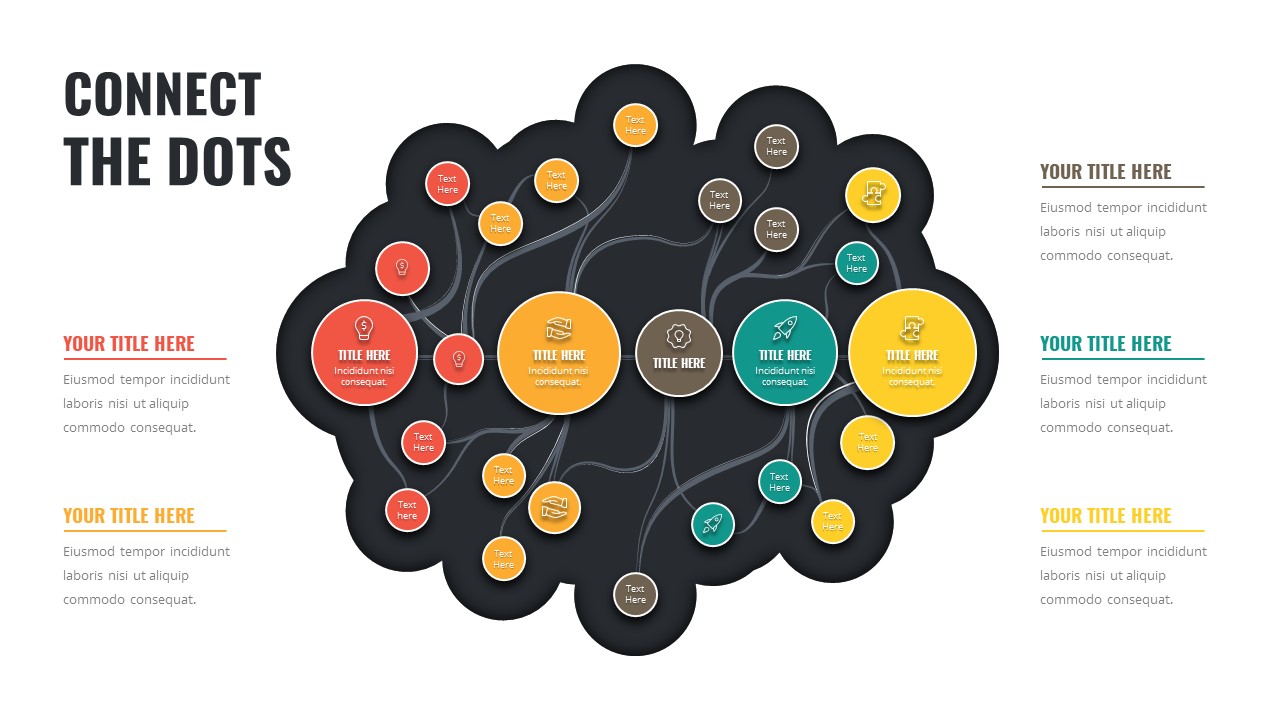
Connect the Dots Mind Map Diagram Template for PowerPoint & Google Slides
Mind Maps
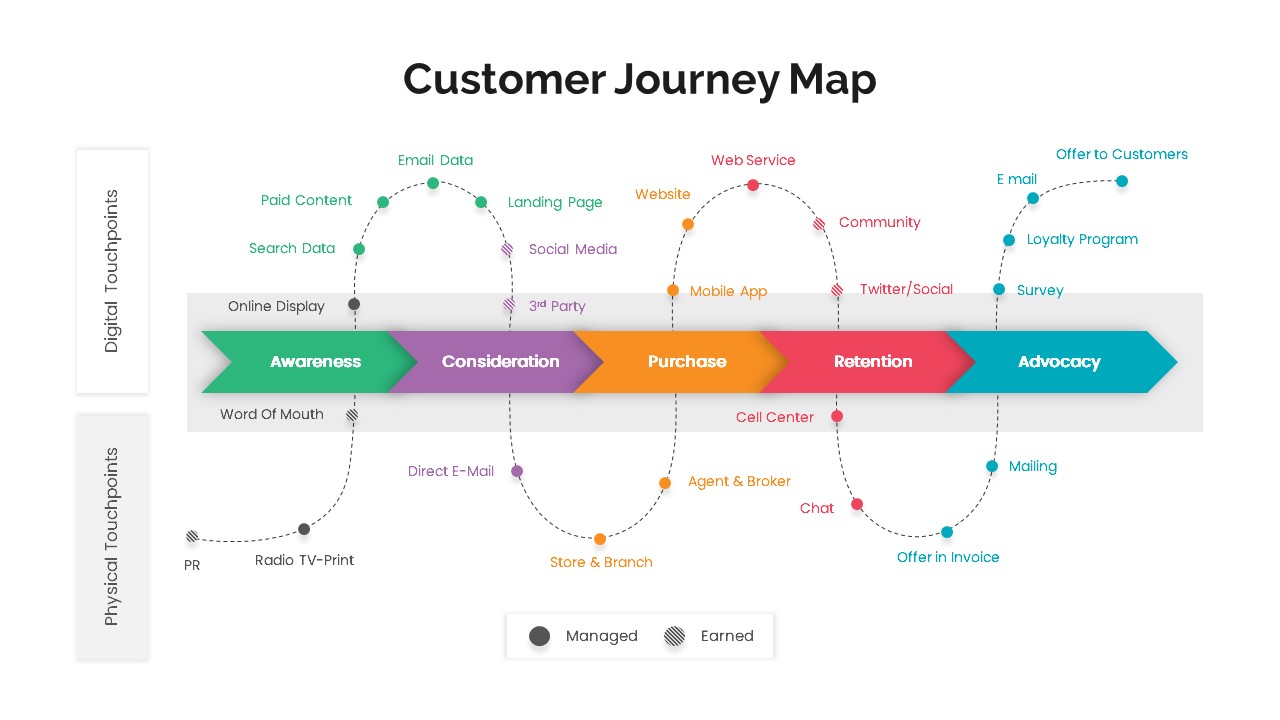
Versatile Customer Journey Map Template for PowerPoint & Google Slides
Customer Journey
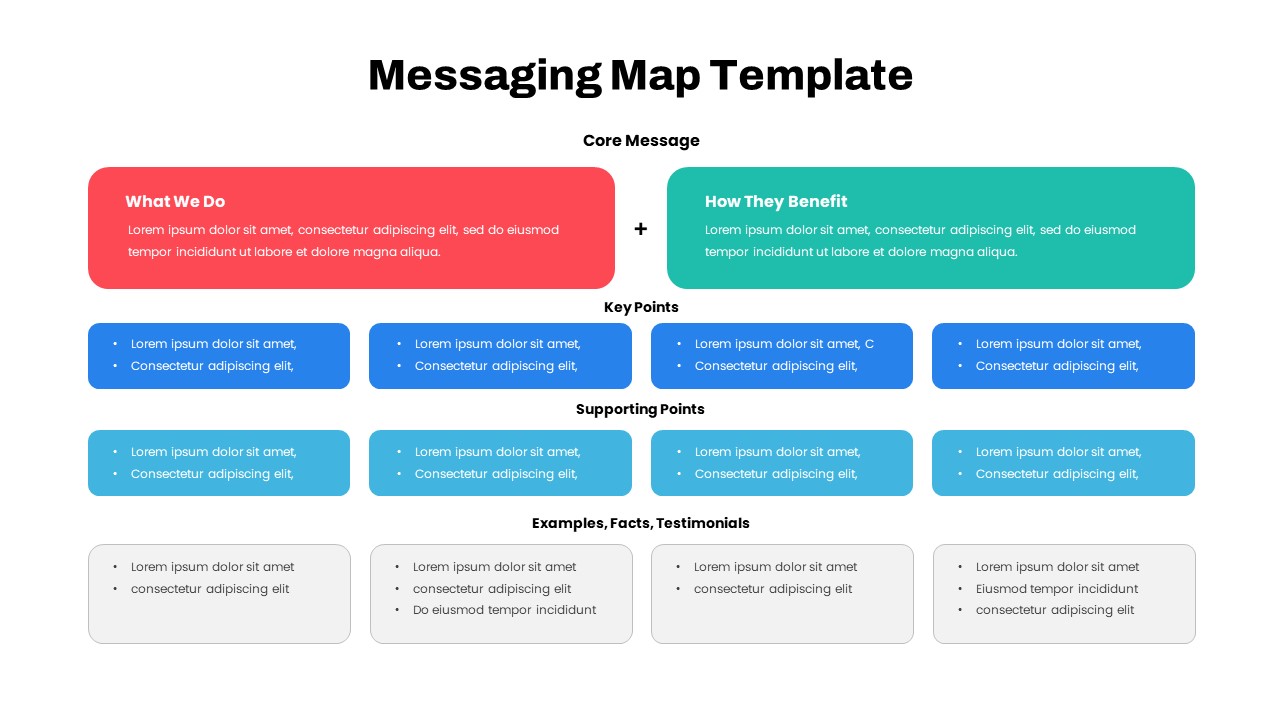
Comprehensive Messaging Map Framework Template for PowerPoint & Google Slides
Process
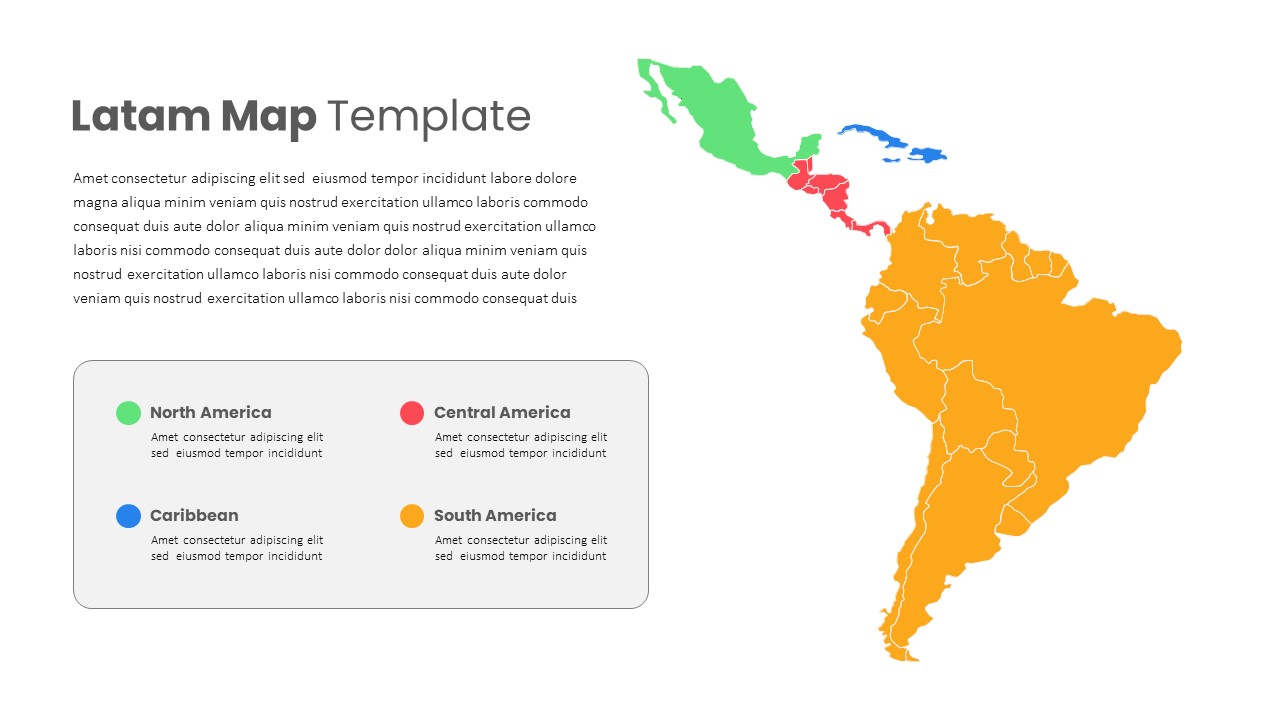
Latin America Regional Map Breakdown Template for PowerPoint & Google Slides
World Maps
Free Editable U.S. Map with Regional Metrics Template for PowerPoint & Google Slides
World Maps
Free
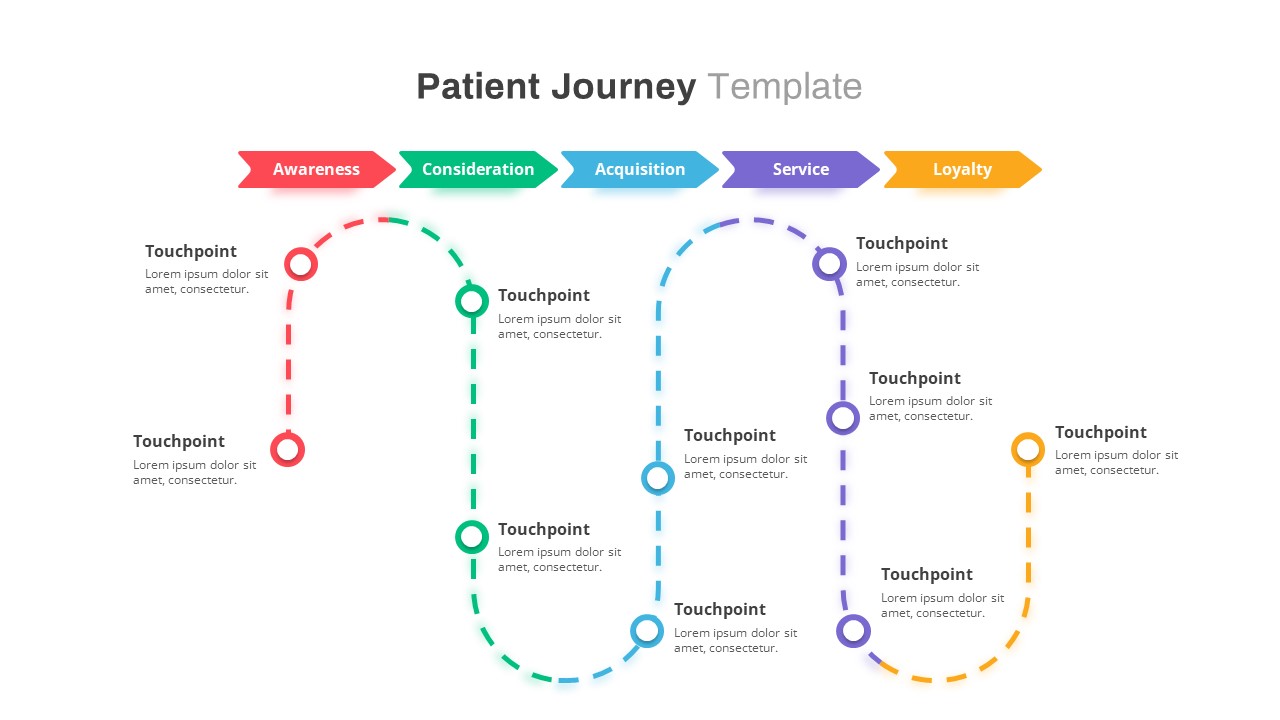
Healthcare Patient Journey Map Overview Template for PowerPoint & Google Slides
Health
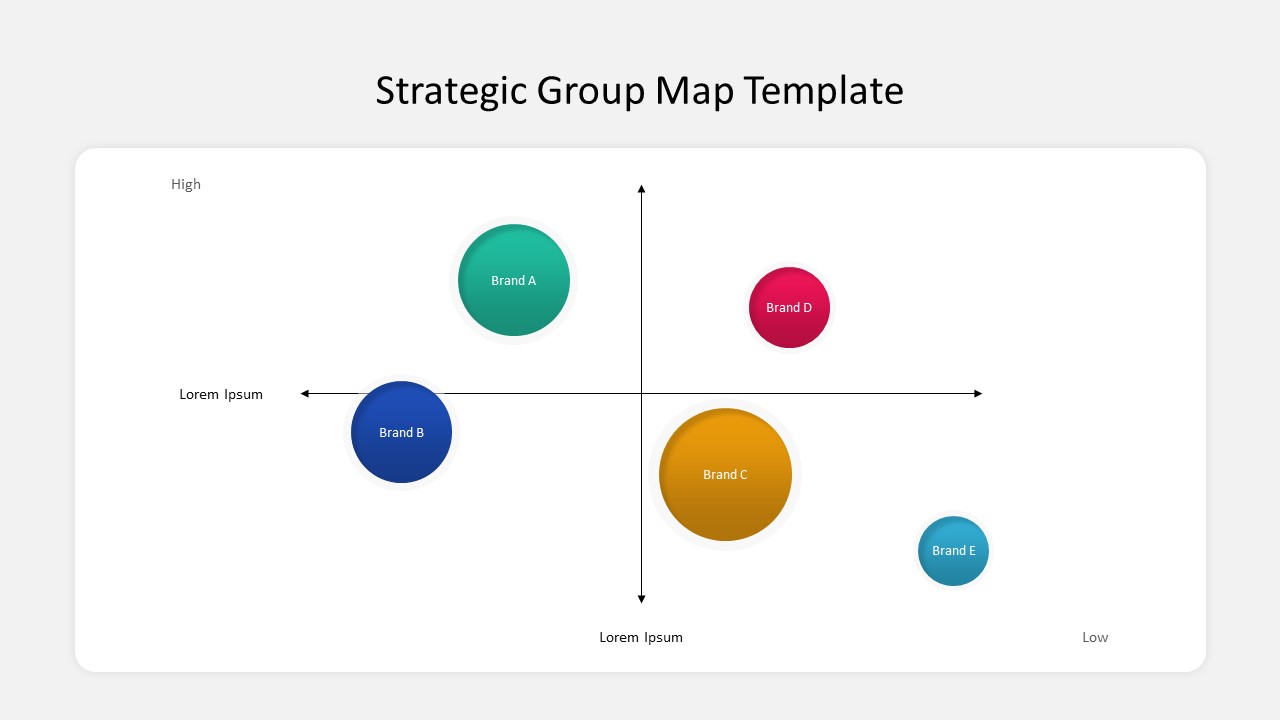
Business Strategic Group Map Analysis Template for PowerPoint & Google Slides
Competitor Analysis
Free
UK Counties Map Data Visualization Template for PowerPoint & Google Slides
World Maps
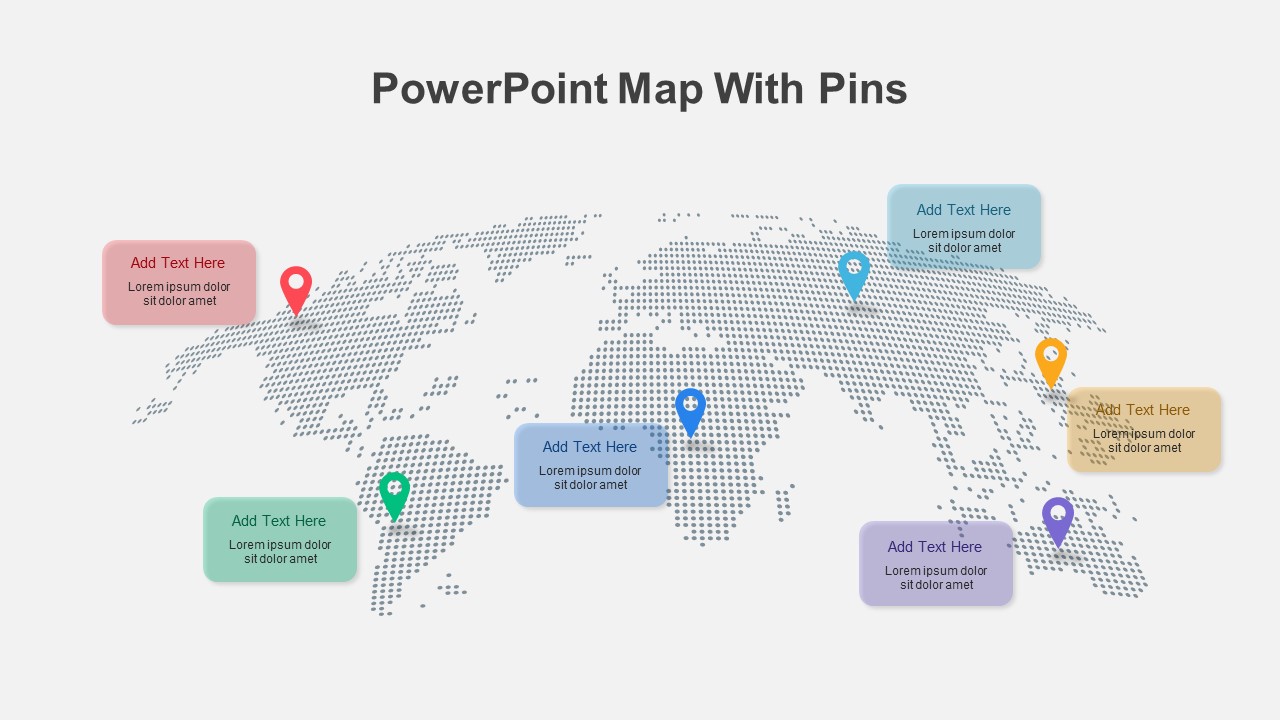
Colorful World Map with Location Pins Template for PowerPoint & Google Slides
World Maps
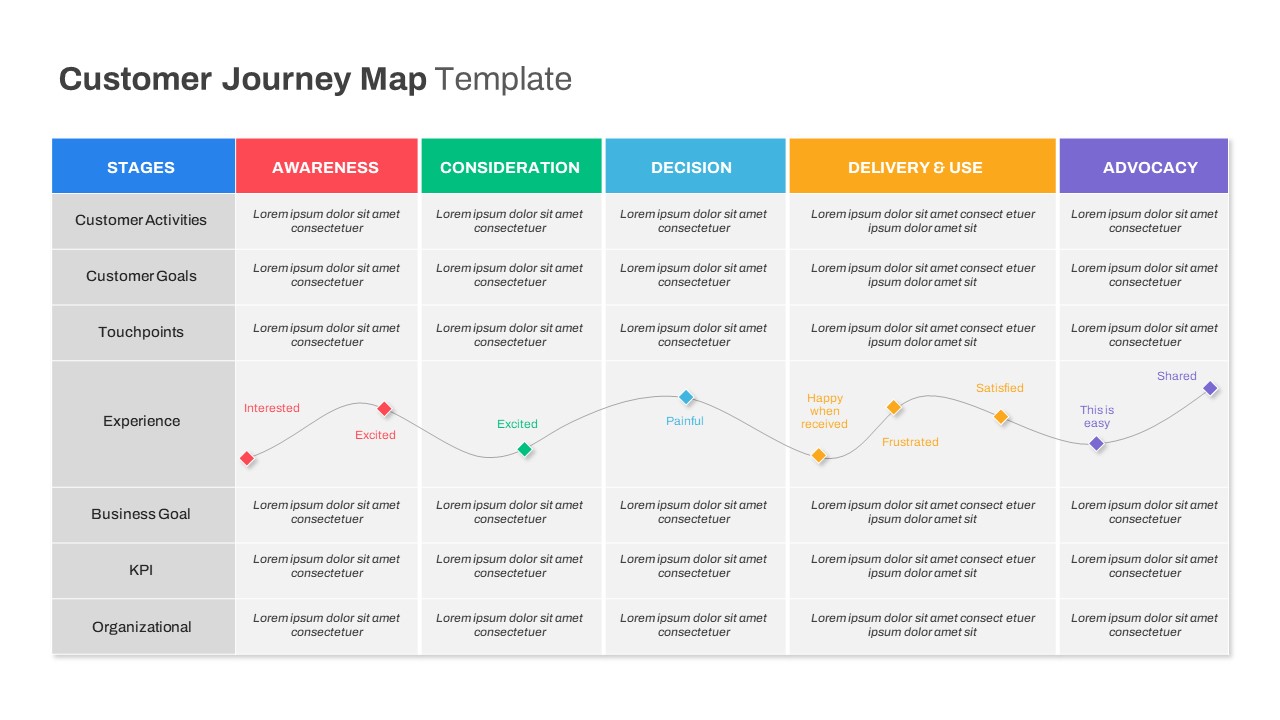
Comprehensive Customer Journey Map Template for PowerPoint & Google Slides
Customer Journey
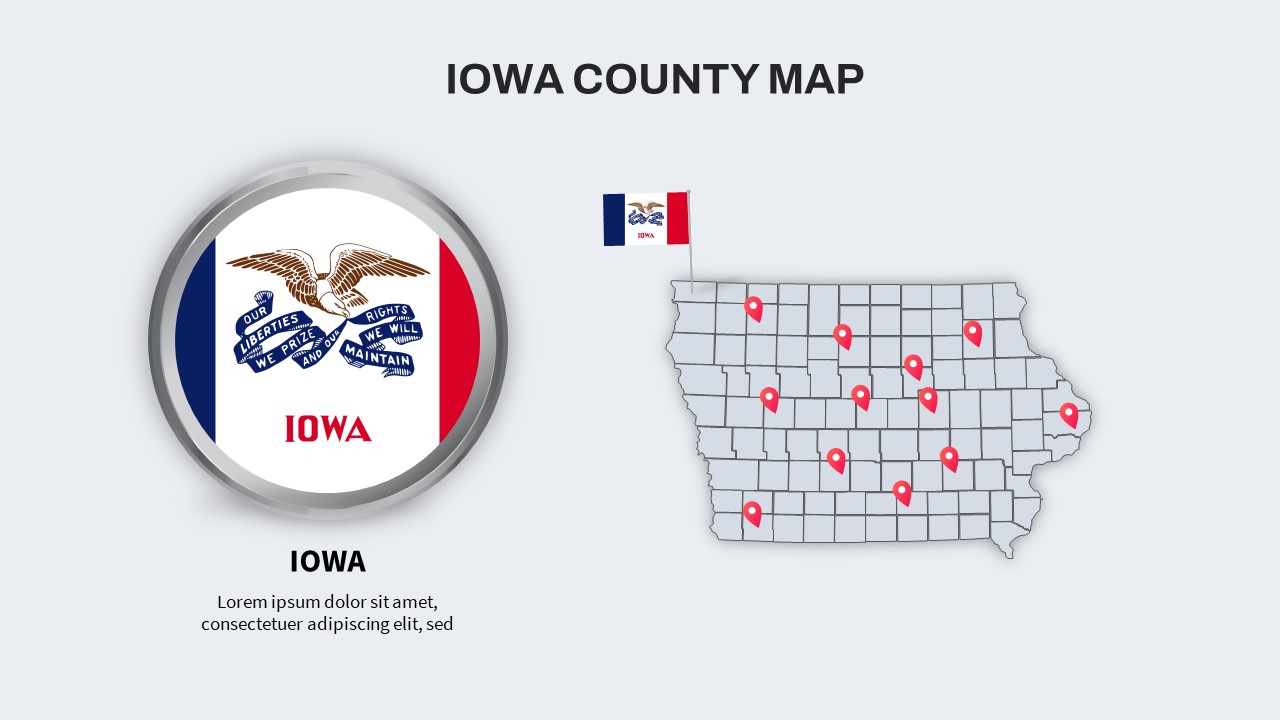
Iowa County Map with Location Markers Template for PowerPoint & Google Slides
World Maps
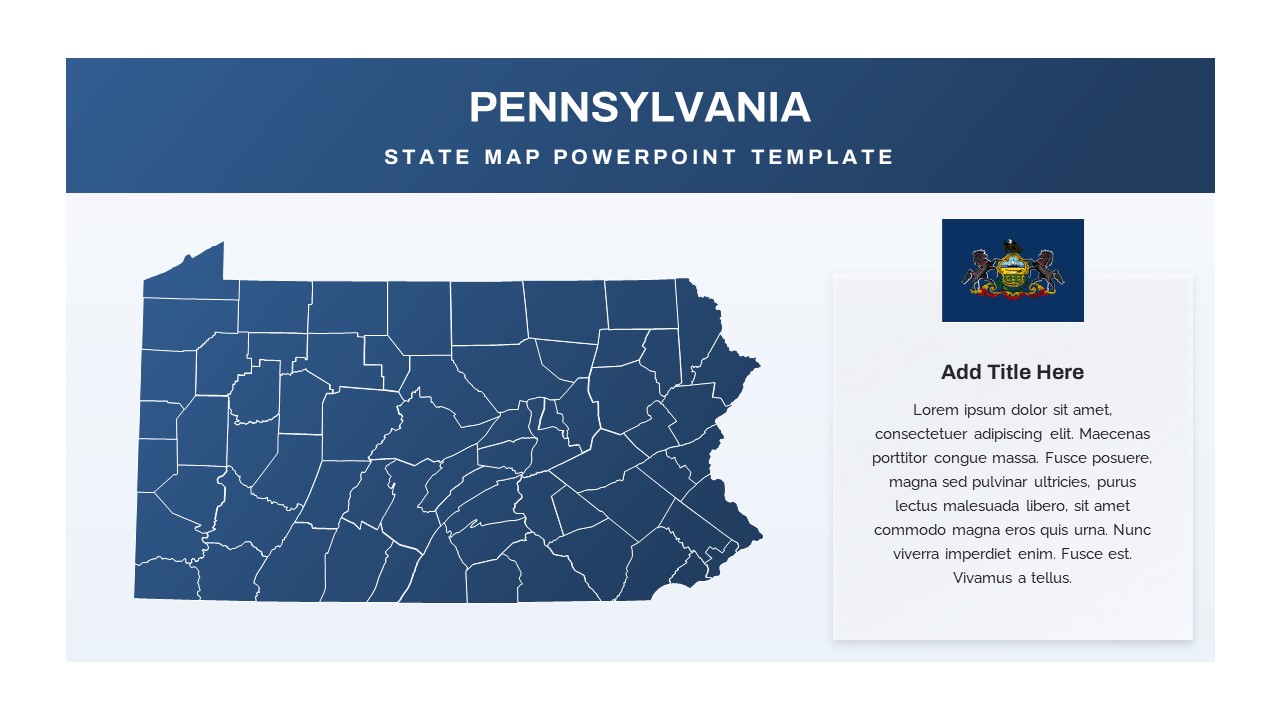
Pennsylvania State Map Diagram Template for PowerPoint & Google Slides
World Maps
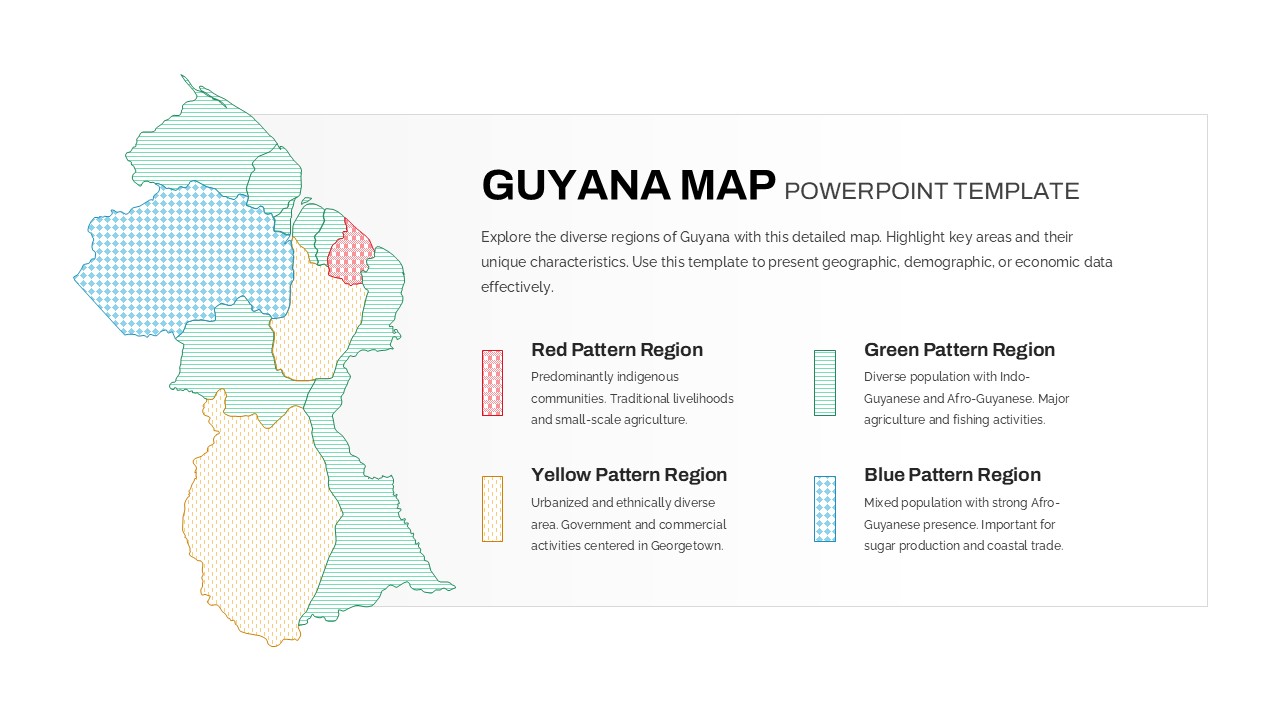
Patterned Guyana Regional Map Template for PowerPoint & Google Slides
World Maps
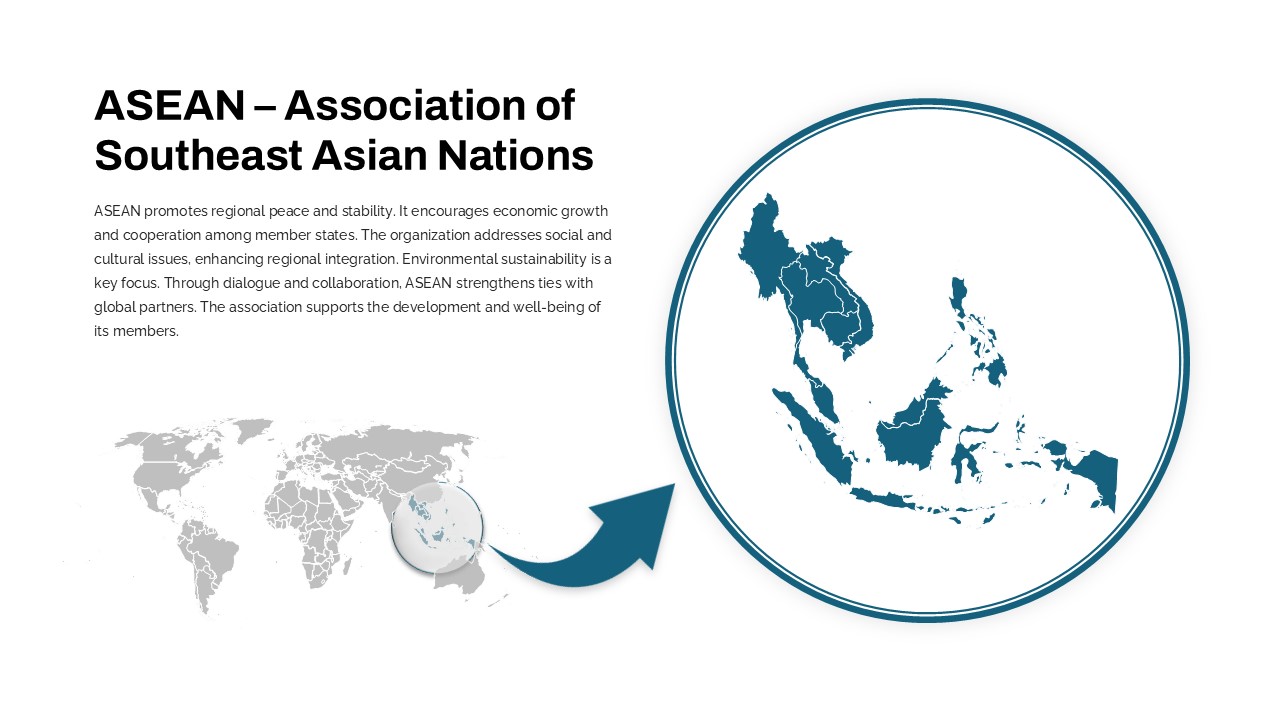
Professional ASEAN Region Zoom Map Slide Template for PowerPoint & Google Slides
World Maps
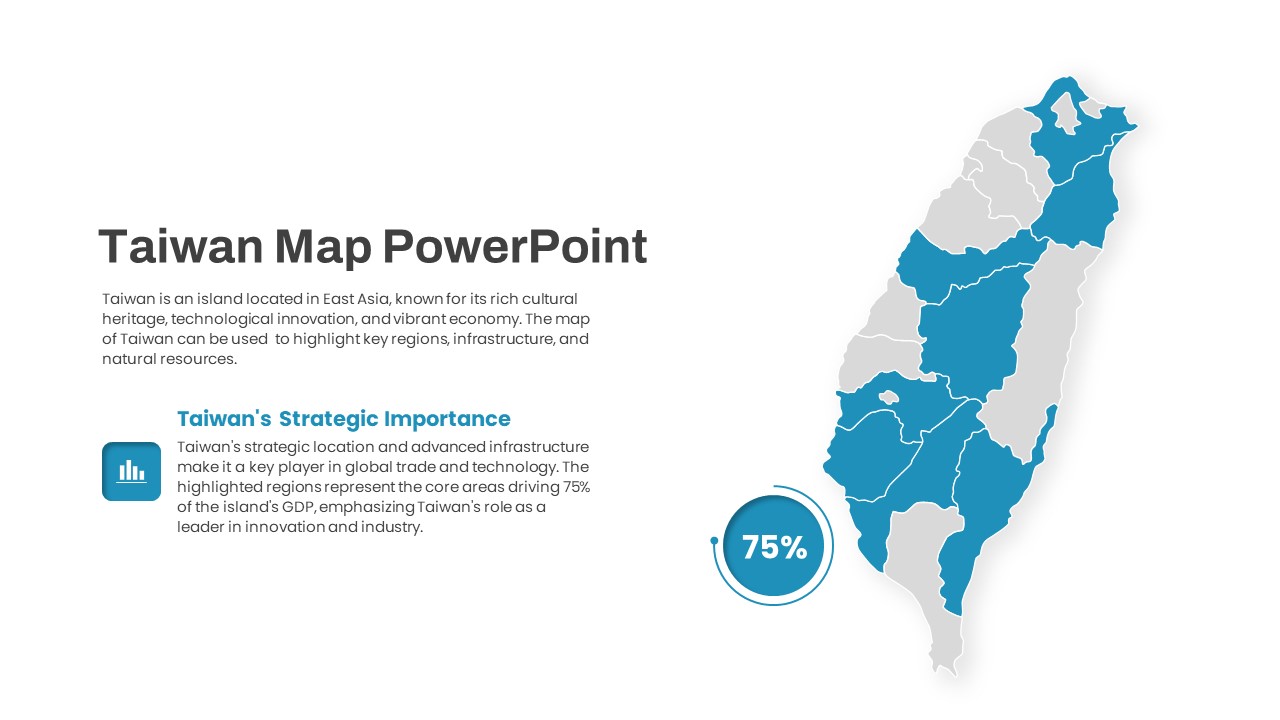
Interactive Taiwan Map Highlight Template for PowerPoint & Google Slides
World Maps