4 Staged Business Arrows Infographic Template for PowerPoint & Google Slides


Description
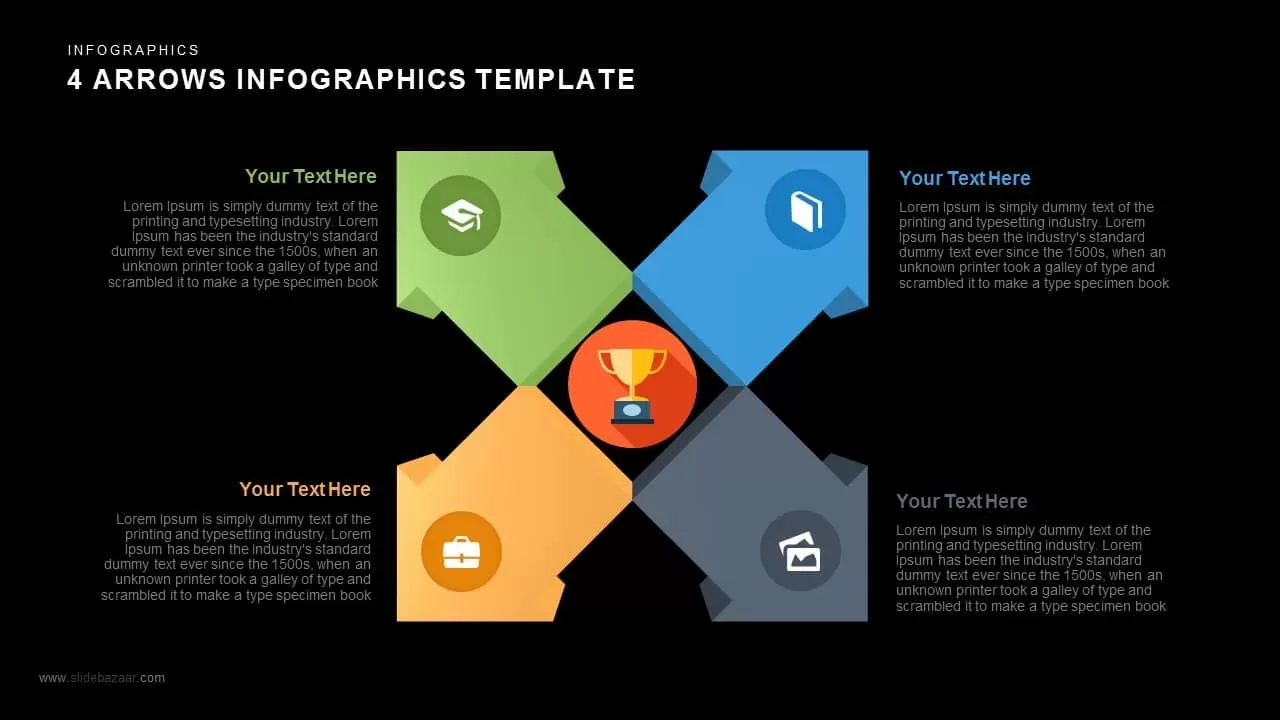
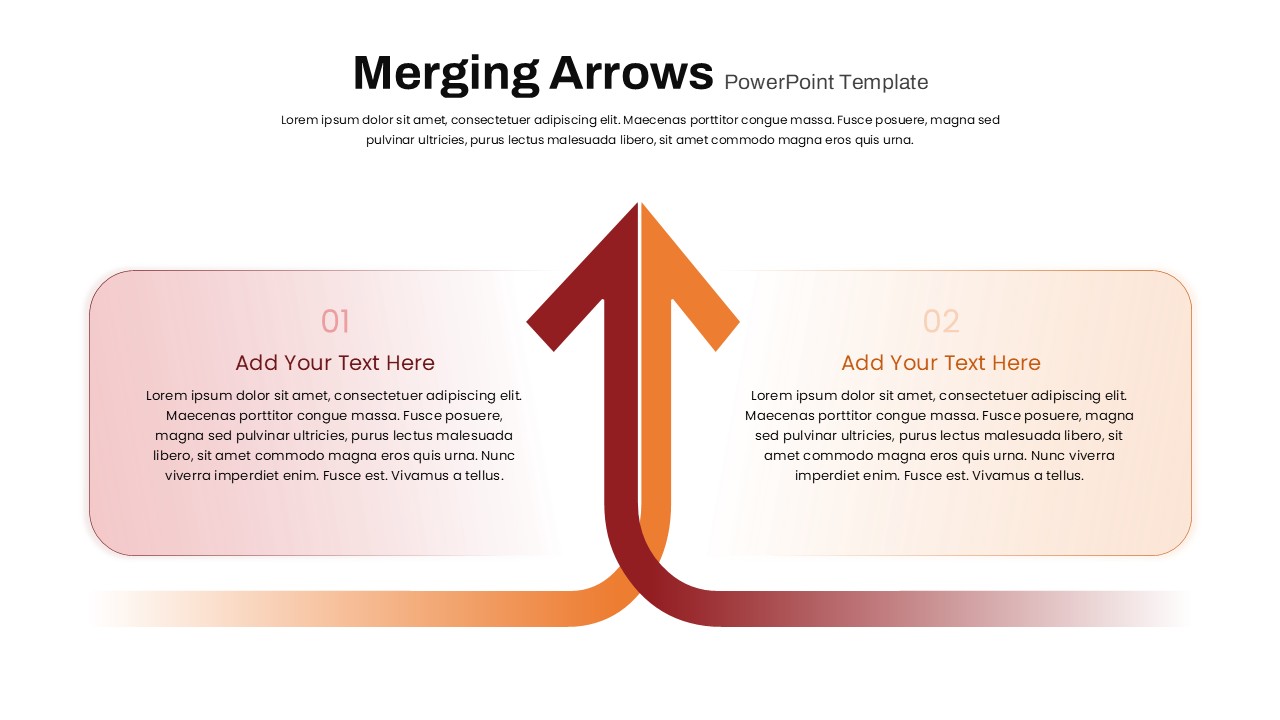
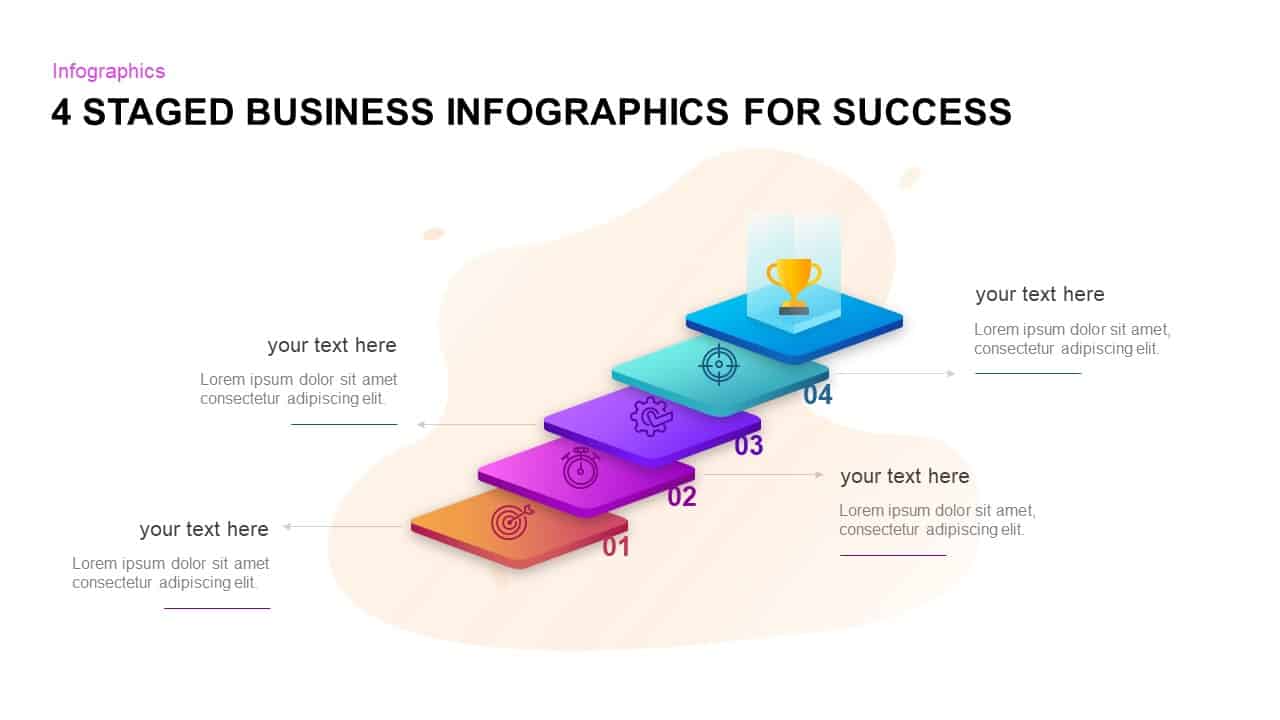
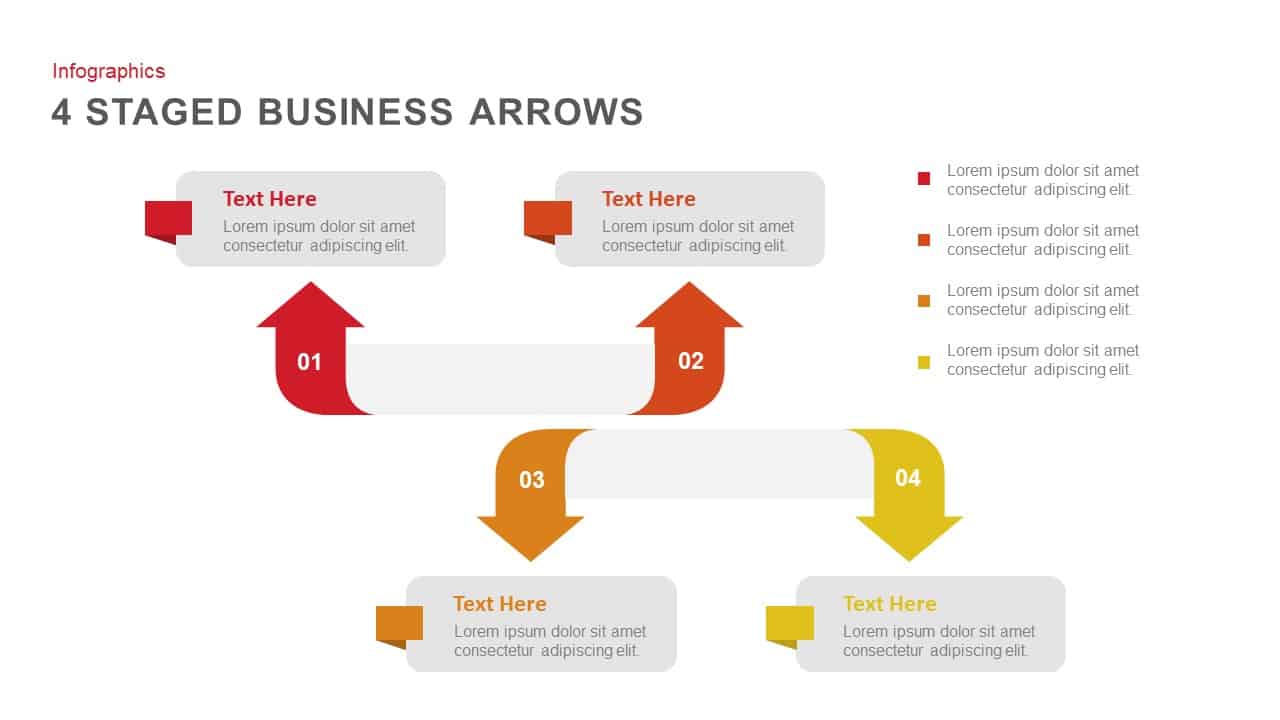
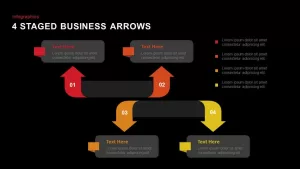
Leverage this dynamic 4-stage business arrows infographic to visualize sequential processes, workflows, or project phases with striking clarity. The slide features four curved arrows arranged in alternating upward and downward directions, each numbered and color-coded—from vibrant red and deep orange to sunny yellow—ensuring intuitive stage identification at a glance. Above and below each arrow, customizable text boxes provide ample space for concise descriptions, while a legend panel on the right correlates each arrow’s hue with its respective label, streamlining audience comprehension.
Engineered for adaptability, the slide’s minimal white background and neutral grey callout shapes let your narrative shine, while the bold arrow forms emphasize progression and directional flow. With fully editable master elements, you can modify arrow colors, adjust callout sizes, or replace data labels without breaking the layout. Typeface hierarchy and consistent padding maintain a polished, professional aesthetic, and grid-aligned placeholders guarantee pixel-perfect alignment across devices.
Whether you’re presenting business roadmaps, process optimization plans, growth strategies, or performance reviews, this infographic slide accelerates stakeholder engagement by simplifying complex information into four digestible steps. Ideal for executive briefings, training workshops, and strategy sessions, it transforms conceptual frameworks into visual stories that drive clarity and action. Equipped for both PowerPoint and Google Slides, the template ensures hassle-free sharing, theme synchronization, and crisp rendering in virtual or live environments. Download and customize this 4-stage arrow diagram slide to illuminate your next presentation with precision and impact, turning each phase of your process into a compelling narrative your audience can easily follow effortlessly.
Who is it for
Business analysts, project managers, marketing strategists, and consultants will benefit from this infographic when outlining multi-step processes, workflows, or project milestones. It’s also ideal for trainers, educators, and executives seeking to communicate sequential information clearly and memorably.
Other Uses
Beyond corporate presentations, repurpose this slide for product development roadmaps, change-management plans, onboarding procedures, or quarterly reviews. Adapt the arrows to illustrate cause-and-effect chains, decision-making workflows, or timeline overviews across departments and industries.
Login to download this file

Item ID
SB01454
Related Templates

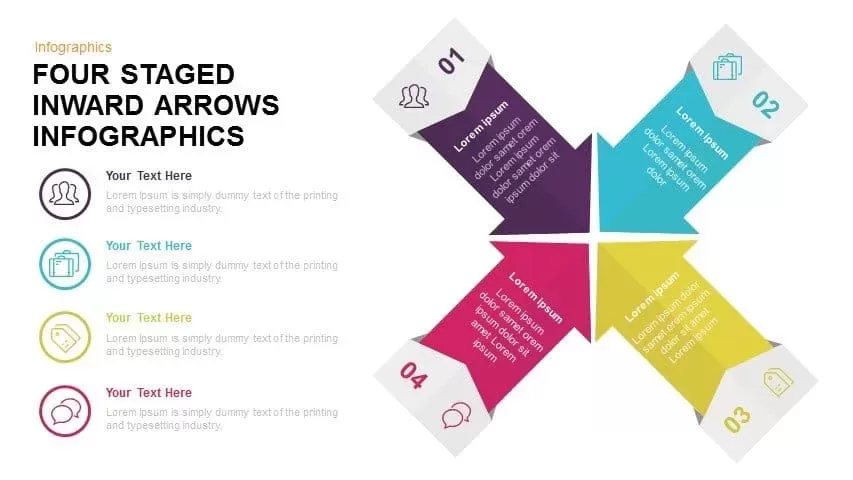
Four Staged Inward Arrows Infographic Template for PowerPoint & Google Slides
Arrow

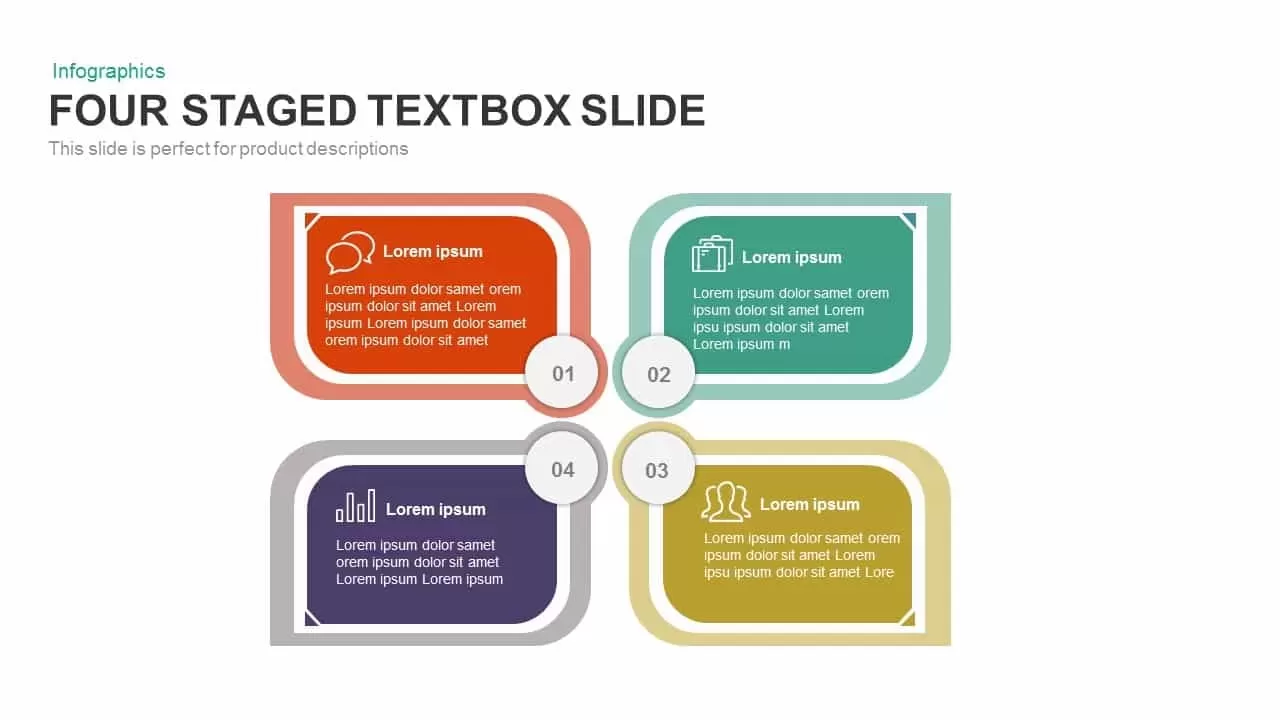
Four-Staged Textbox Infographic Template for PowerPoint & Google Slides
Process

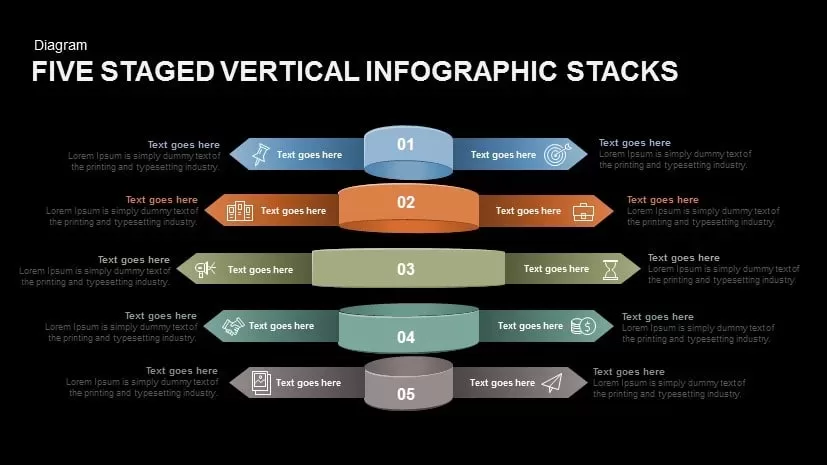
Five Staged Vertical Infographic Stacks for PowerPoint & Google Slides
Process

Four-Staged Business Arrow Diagram Template for PowerPoint & Google Slides
Process
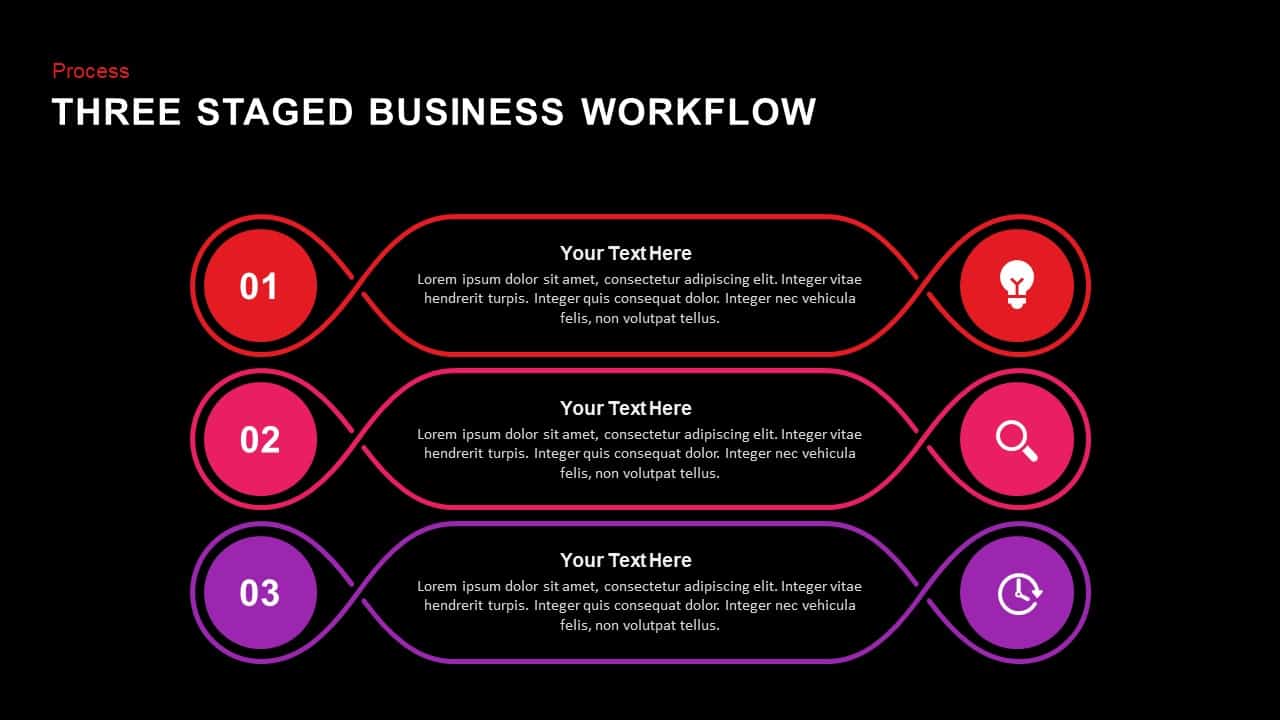
Three Staged Business Workflow template for PowerPoint & Google Slides
Business
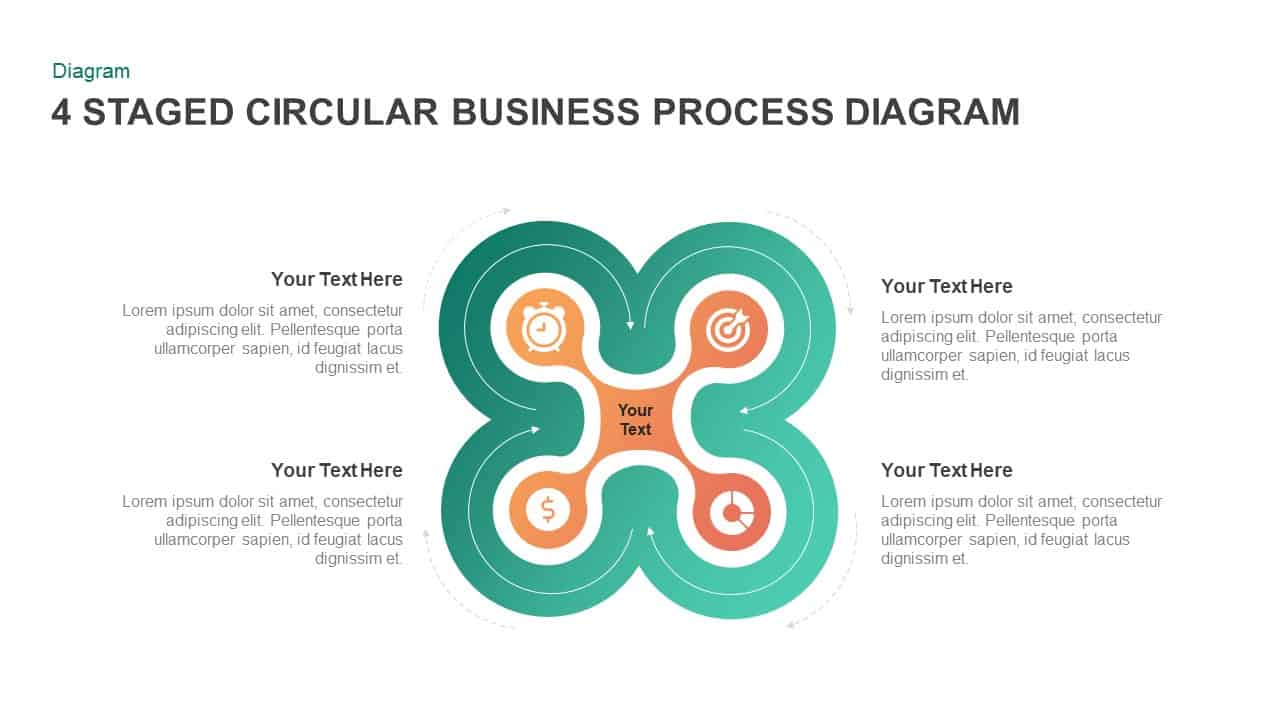
4 Staged Circular Business Process Diagram template for PowerPoint & Google Slides
Process
Five Arrows Pointing Out Infographic Template for PowerPoint & Google Slides
Arrow
Magnifying Glass Arrows Infographic Template for PowerPoint & Google Slides
Arrow
Six Directional Arrows Infographic Template for PowerPoint & Google Slides
Arrow
Four Arrows Layout Infographic with Icon Template for PowerPoint & Google Slides
Arrow
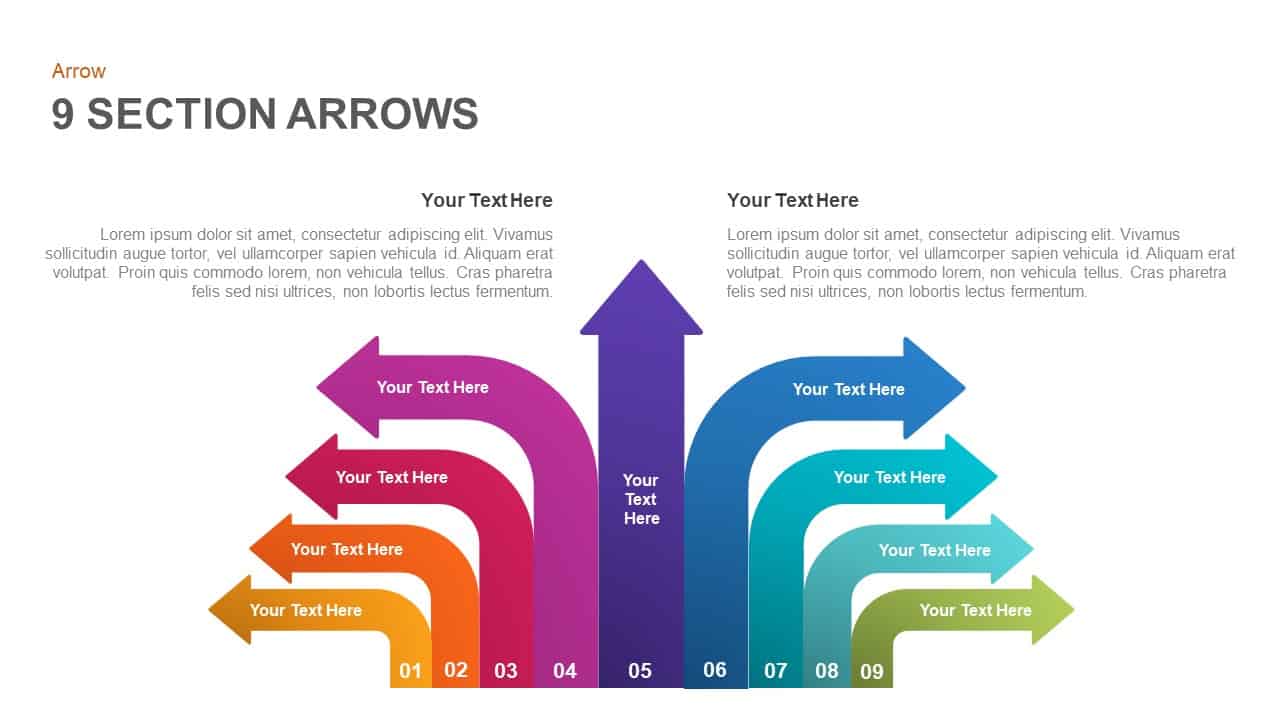
9-Section Diverging Arrows Infographic Template for PowerPoint & Google Slides
Arrow
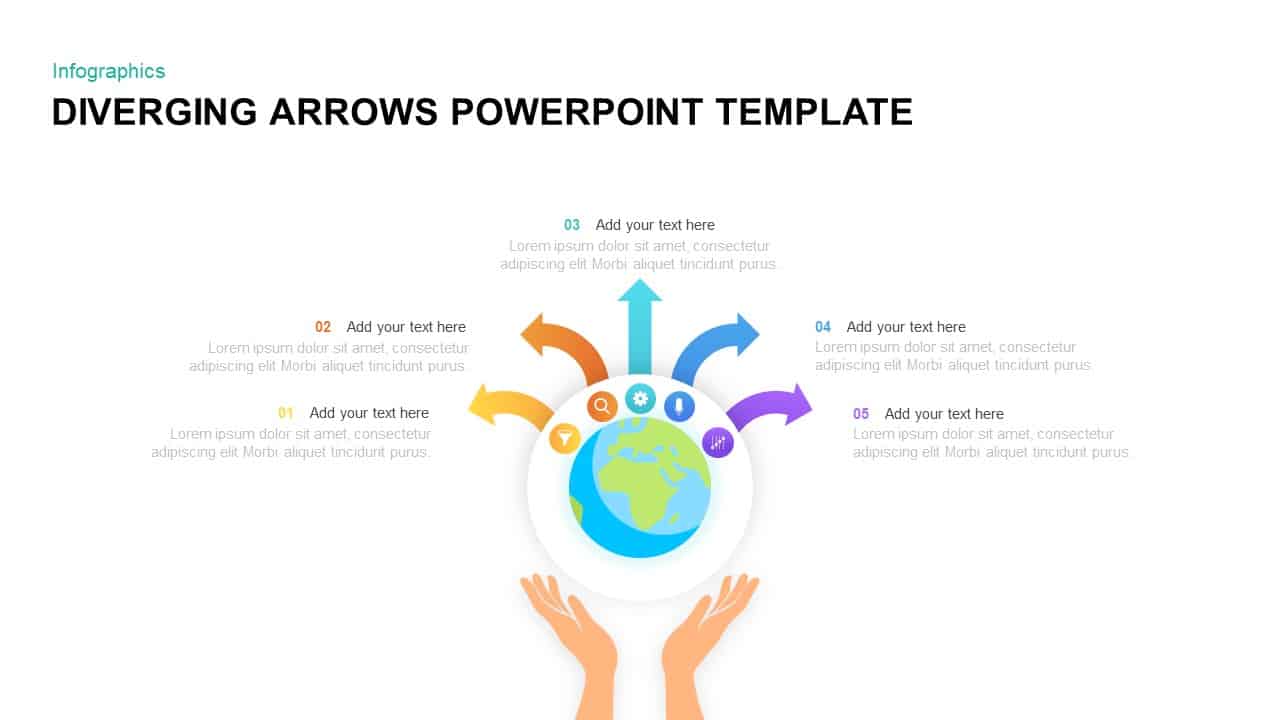
Diverging Globe Arrows Infographic Template for PowerPoint & Google Slides
Arrow
Circular Arrows Infographic Template for PowerPoint & Google Slides
Business
4 Staged Circular Business Process Diagram for PowerPoint & Google Slides
Process
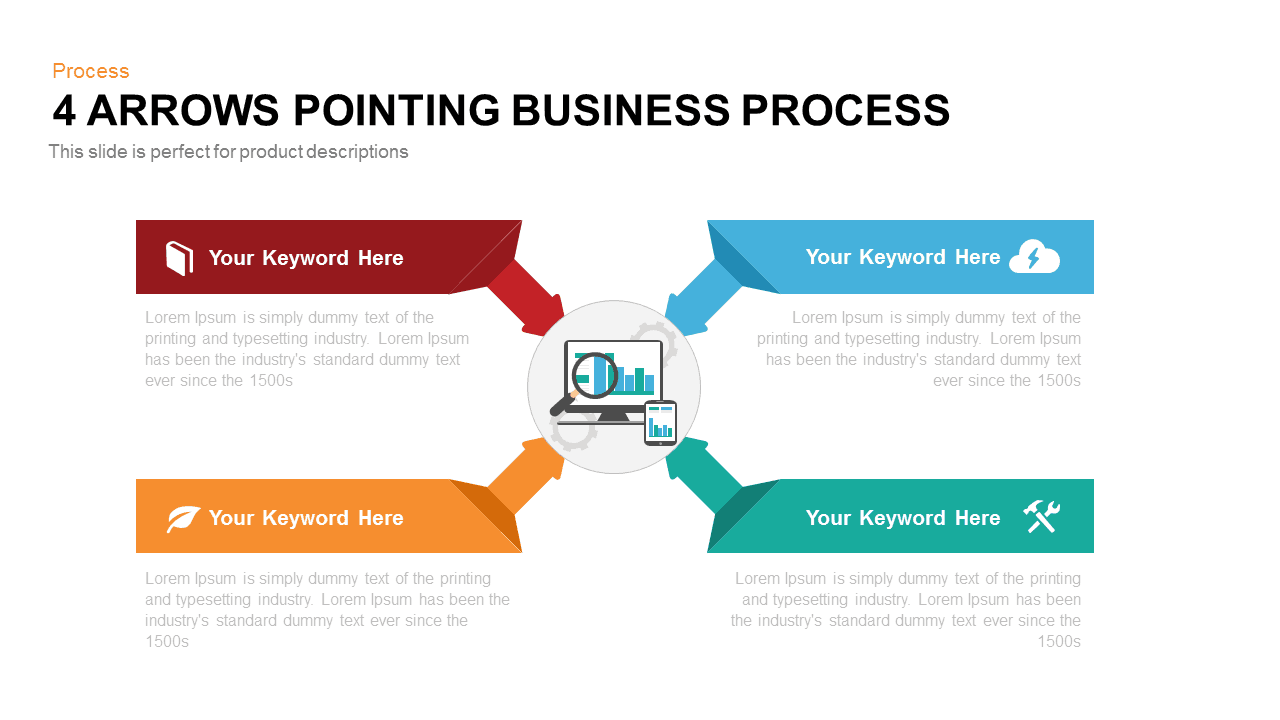
Four Arrows Business Process Diagram template for PowerPoint & Google Slides
Process
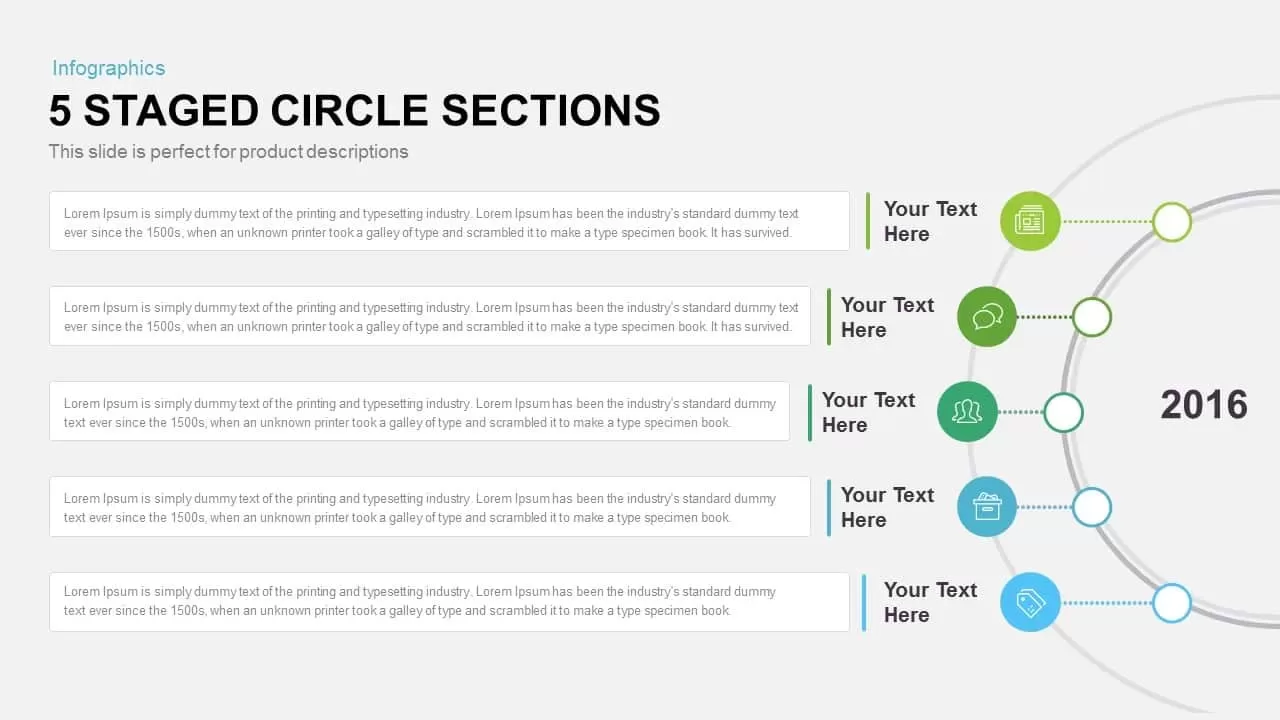
Five-Staged Circle Sections Diagram Template for PowerPoint & Google Slides
Circular
Six-Staged Gear Diagram Framework Template for PowerPoint & Google Slides
Process

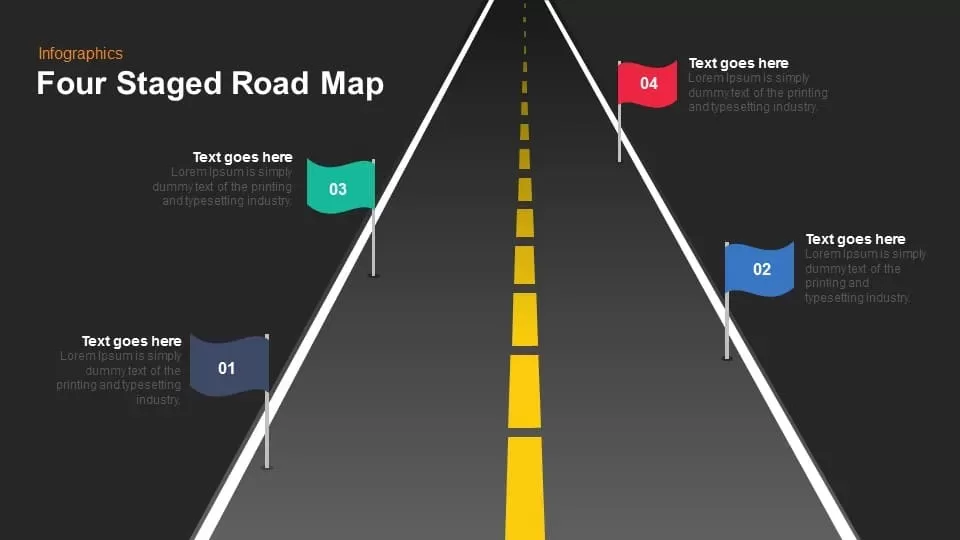
Four Staged Road Map template for PowerPoint & Google Slides
Roadmap
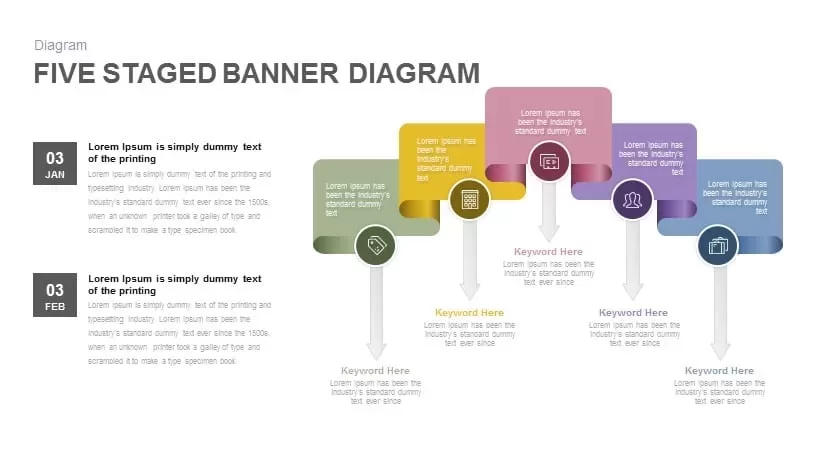
Elegant Five Staged Banner Diagram Template for PowerPoint & Google Slides
Process

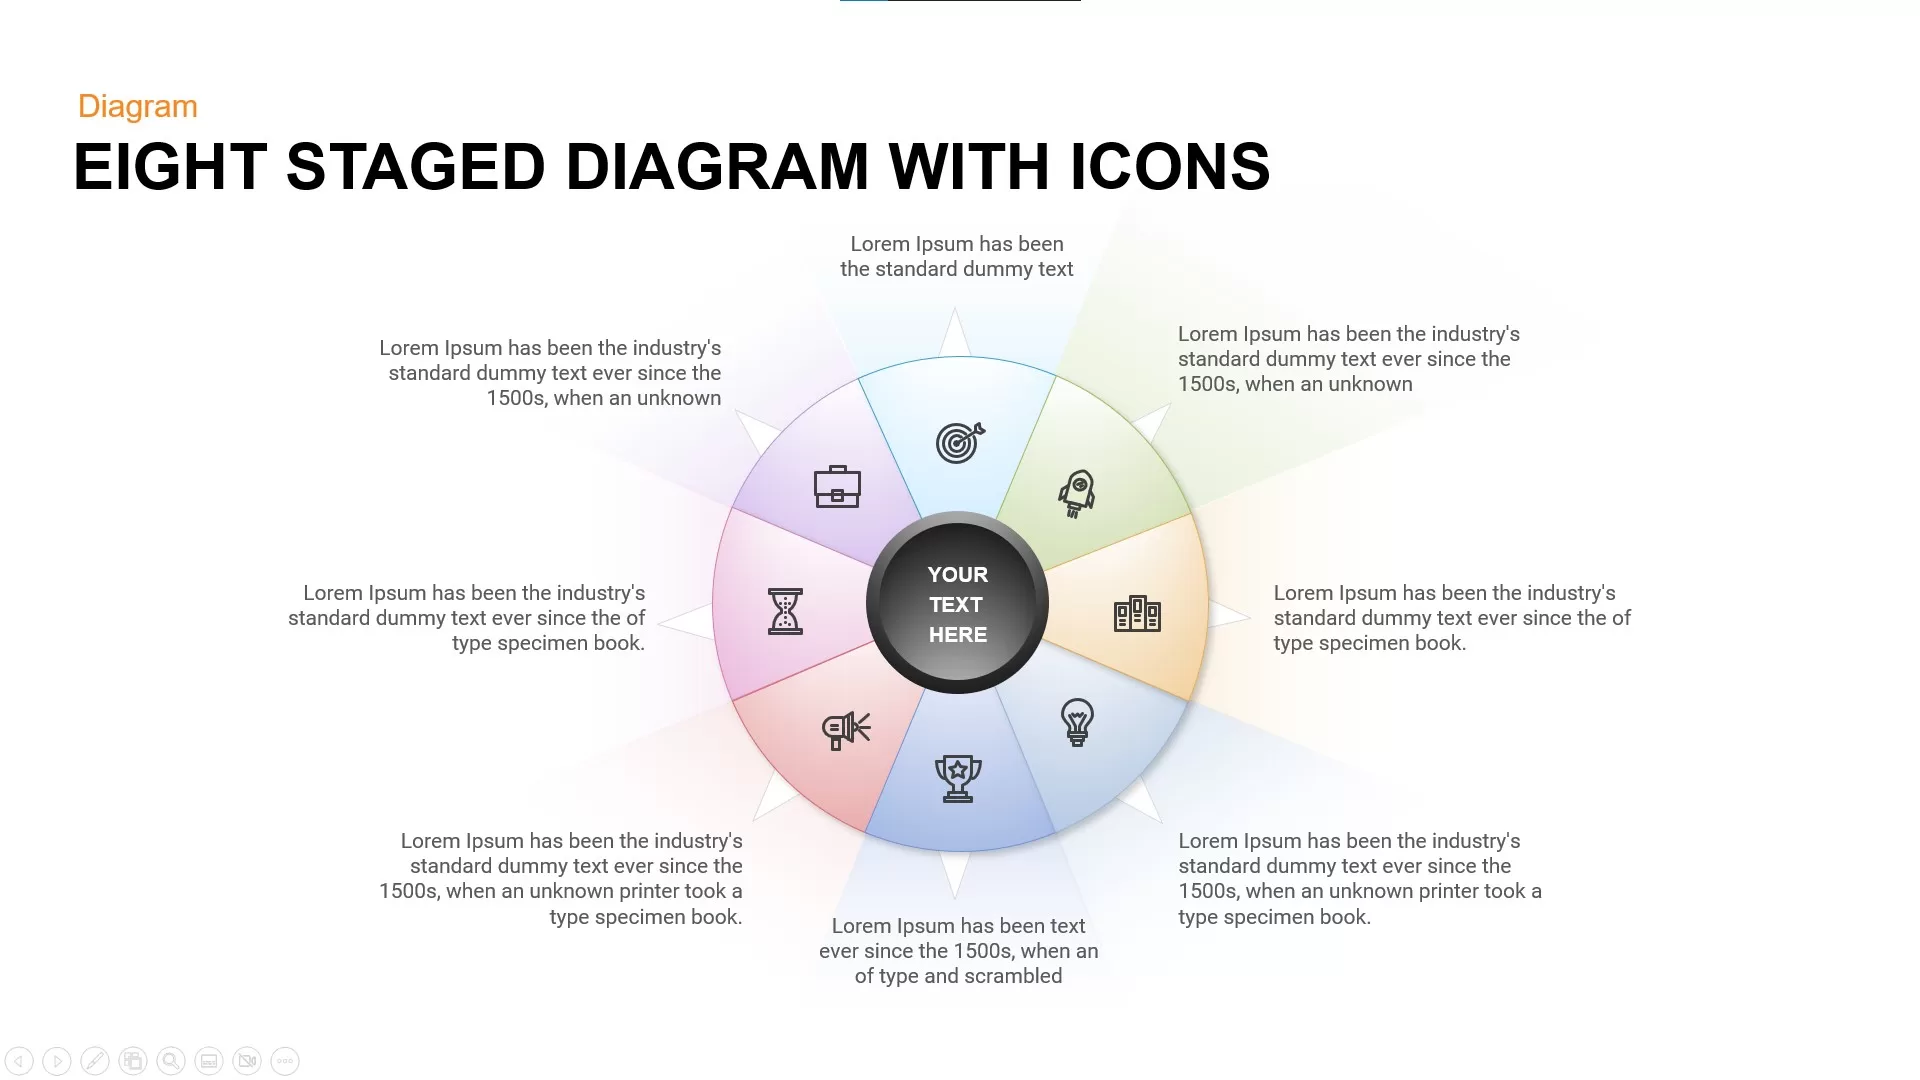
Eight Staged Diagram with Icons template for PowerPoint & Google Slides
Process
Free
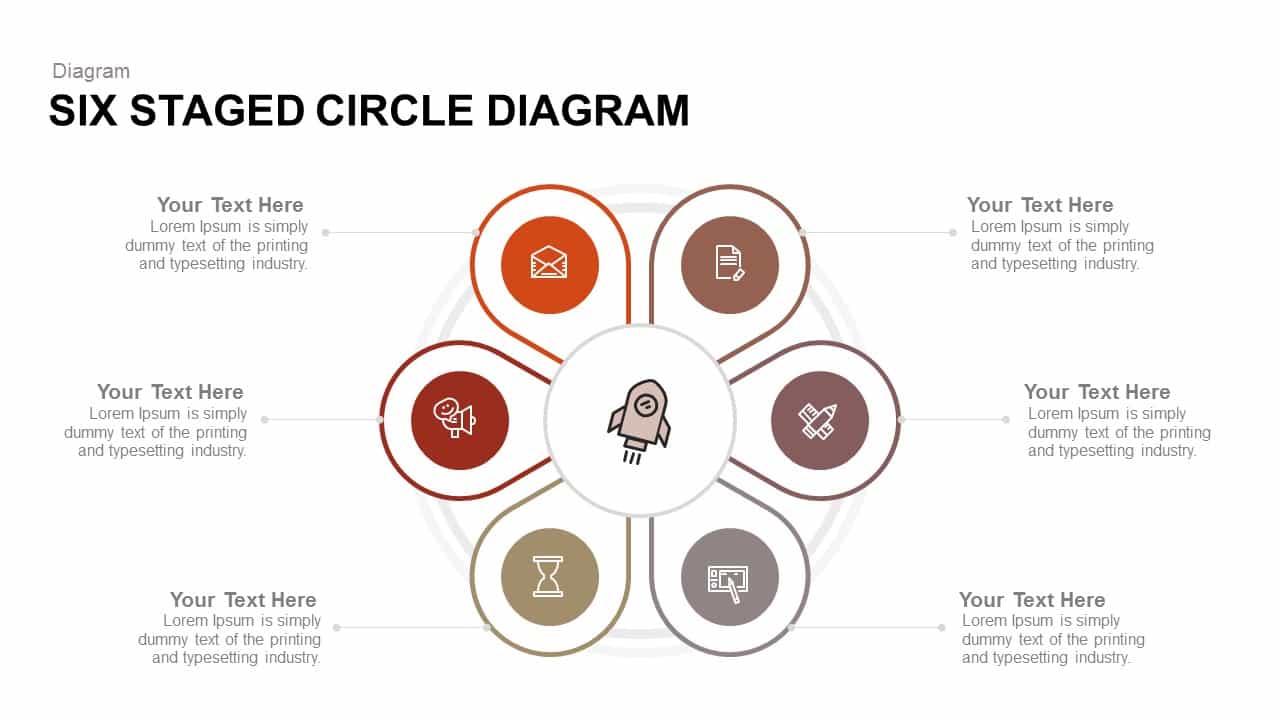
Six Staged Circle Diagram template for PowerPoint & Google Slides
Circular
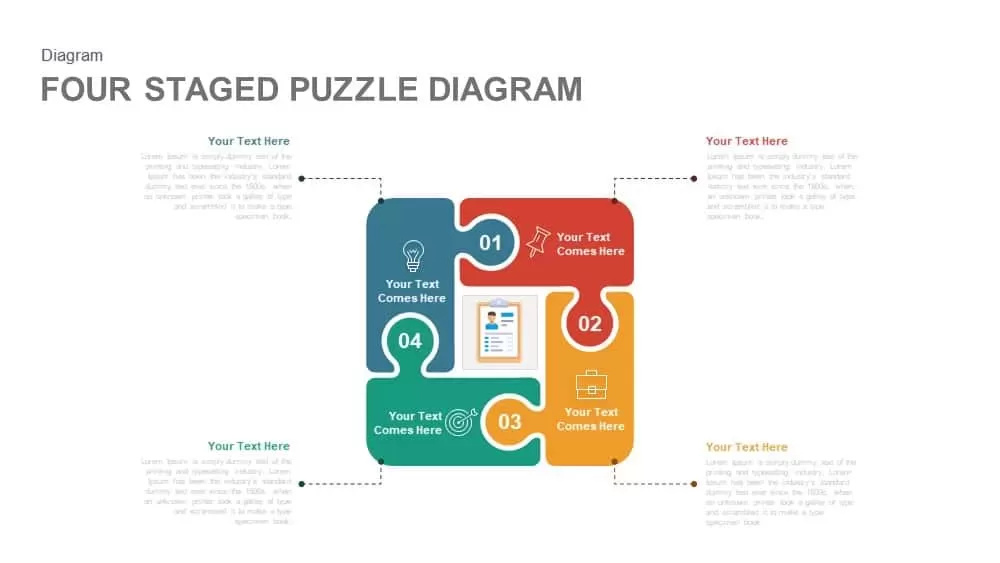
Four-Staged Puzzle Diagram Slide Template for PowerPoint & Google Slides
Process
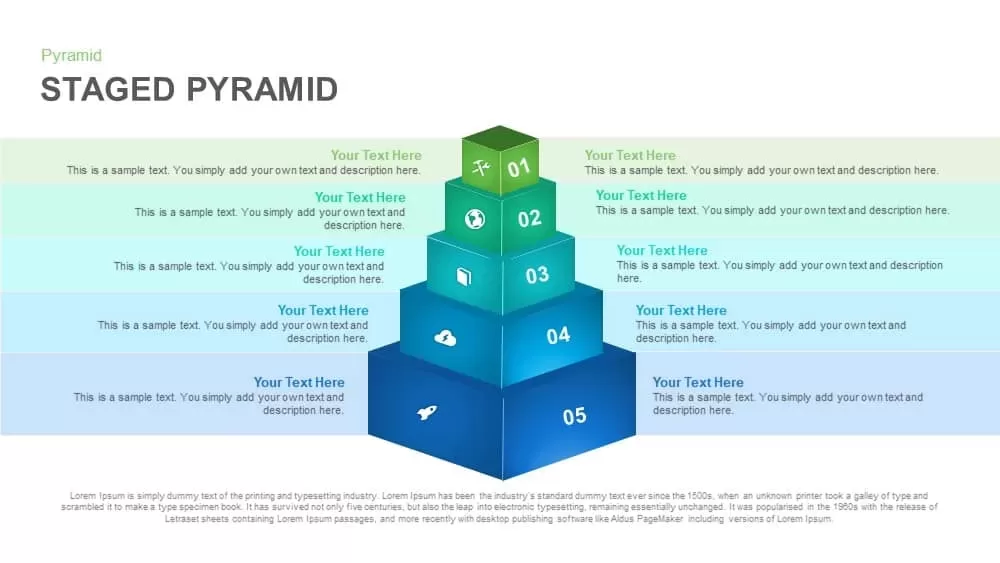
Five-Level Staged Pyramid Diagram Template for PowerPoint & Google Slides
Pyramid
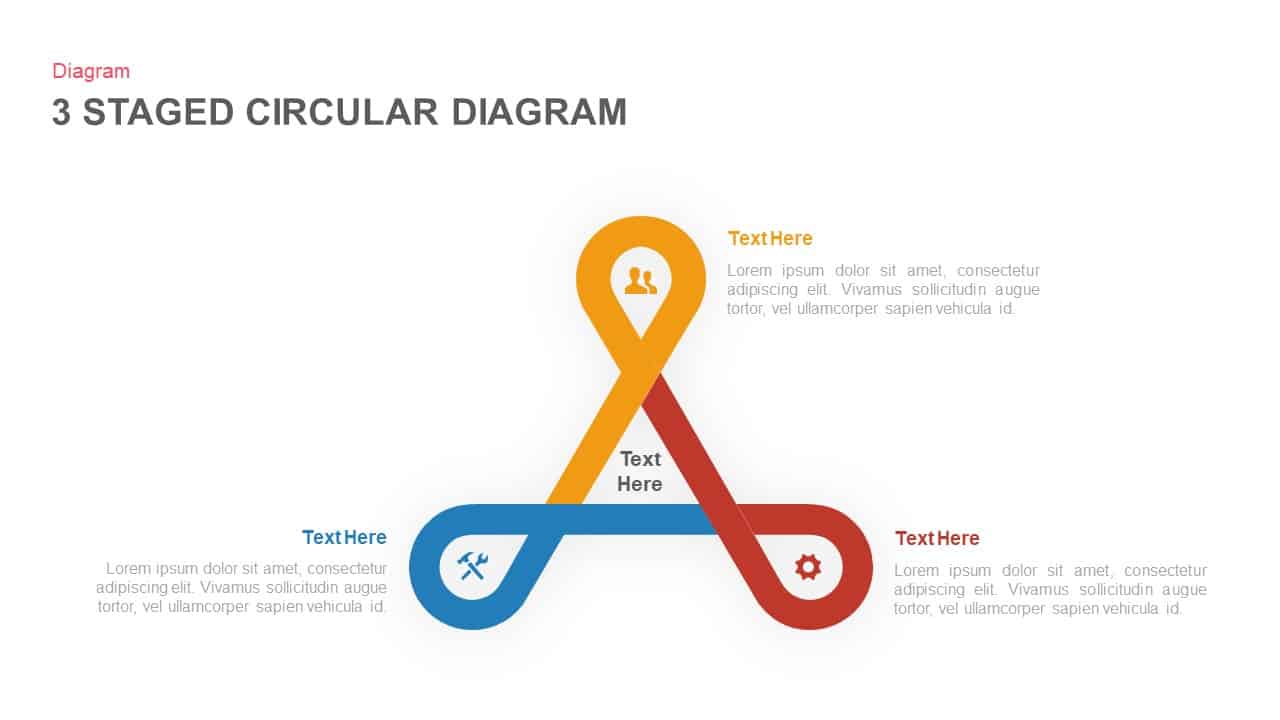
Three to Six Staged Circular Diagram Template for PowerPoint & Google Slides
Process
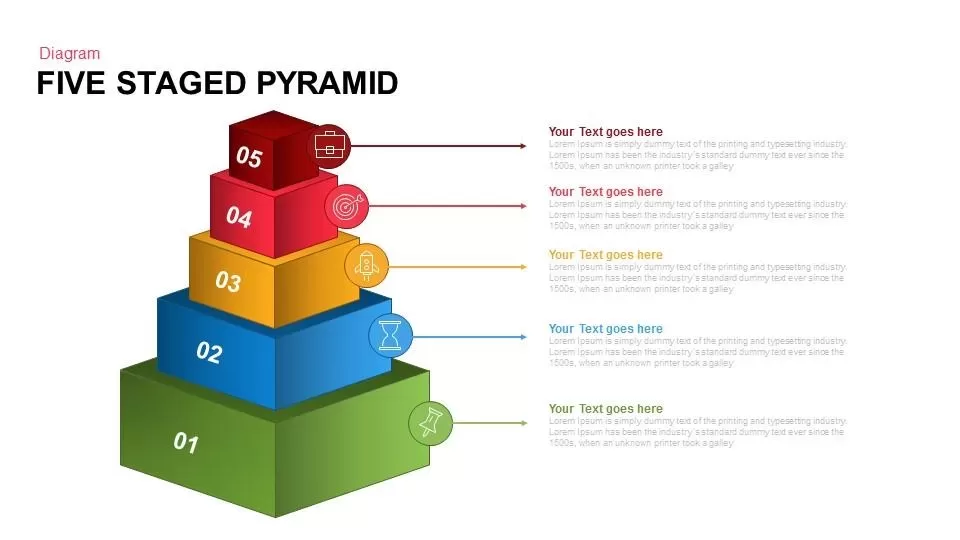
Five Staged Pyramid Diagram for PowerPoint & Google Slides
Pyramid

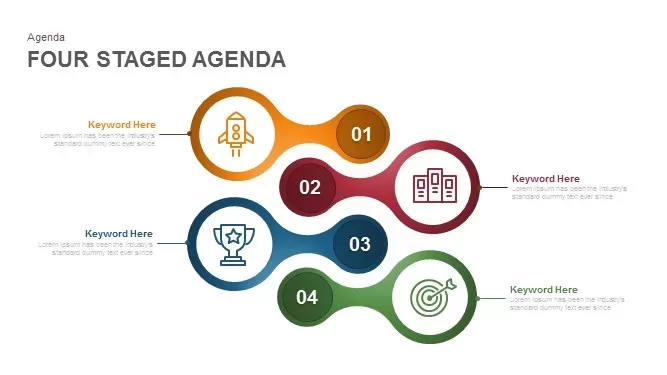
Four Staged Agenda Diagram for PowerPoint & Google Slides
Agenda
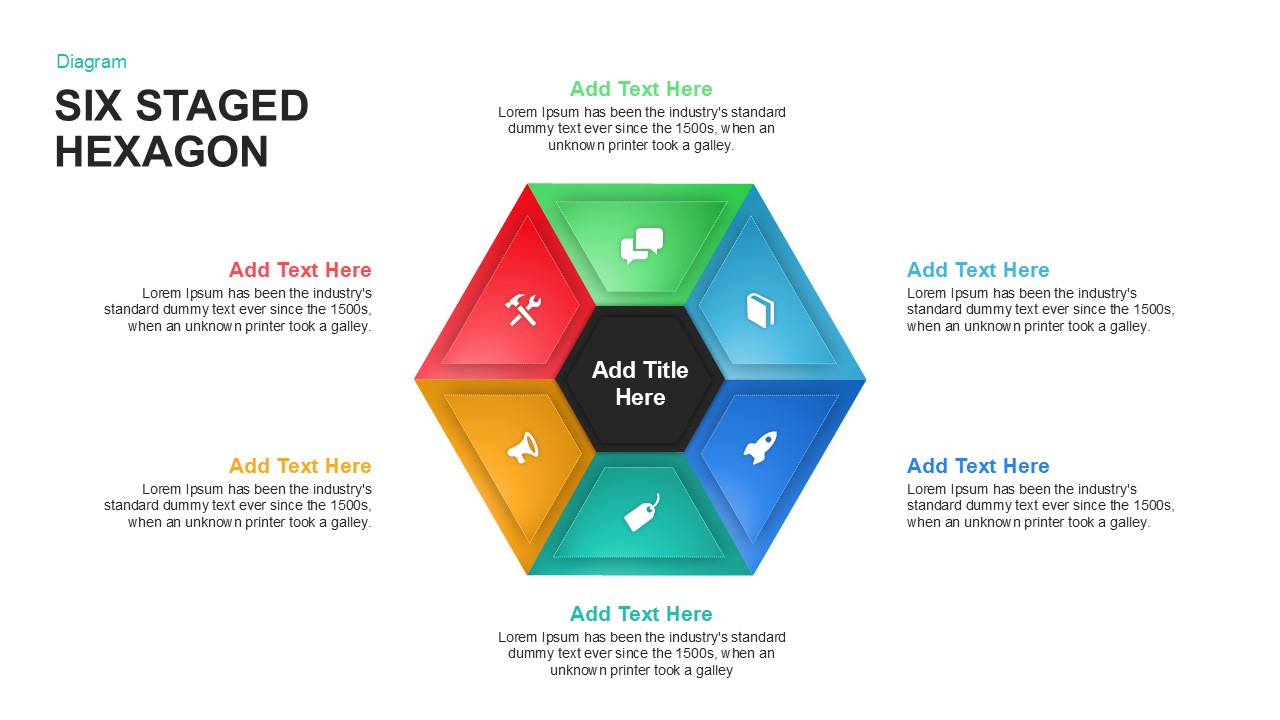
Six Staged Hexagon Diagram for PowerPoint & Google Slides
Process
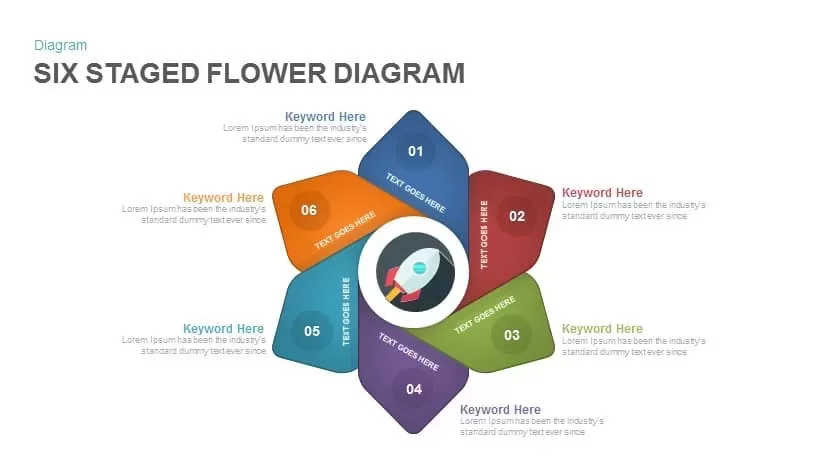
Six Staged Flower Diagram for PowerPoint & Google Slides
Process
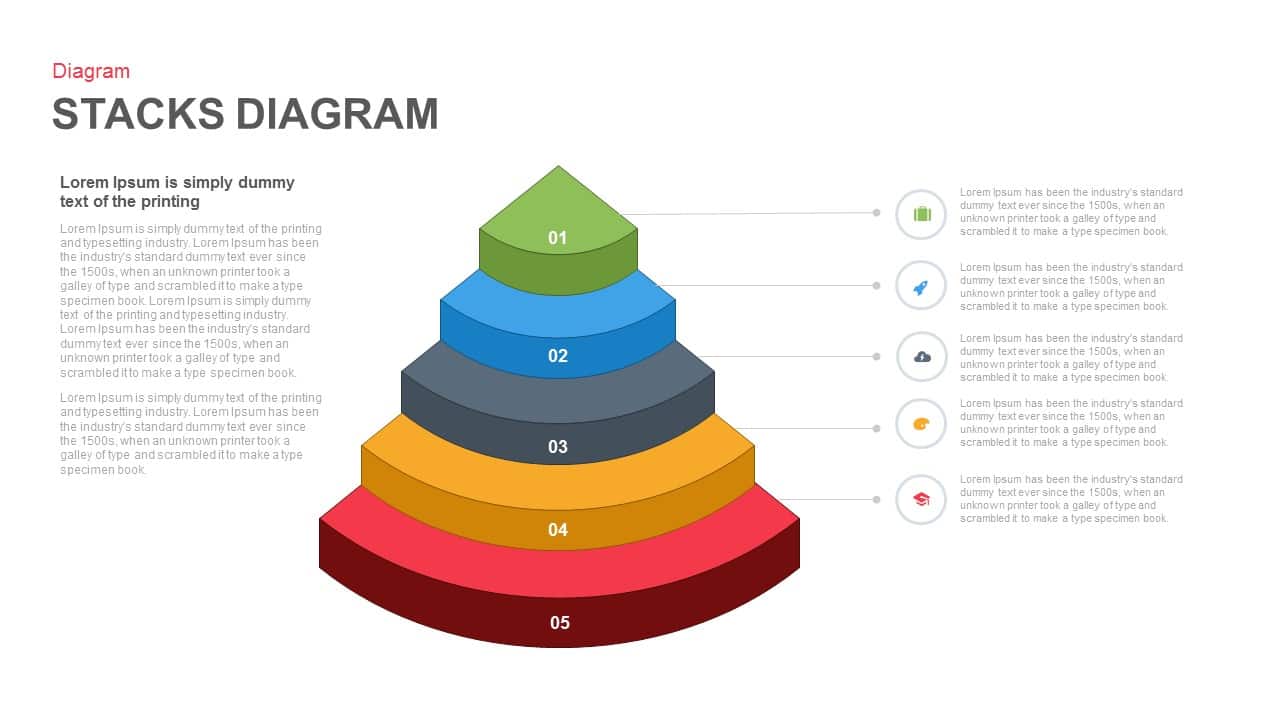
Five Staged Stacks Diagram for PowerPoint & Google Slides
Process
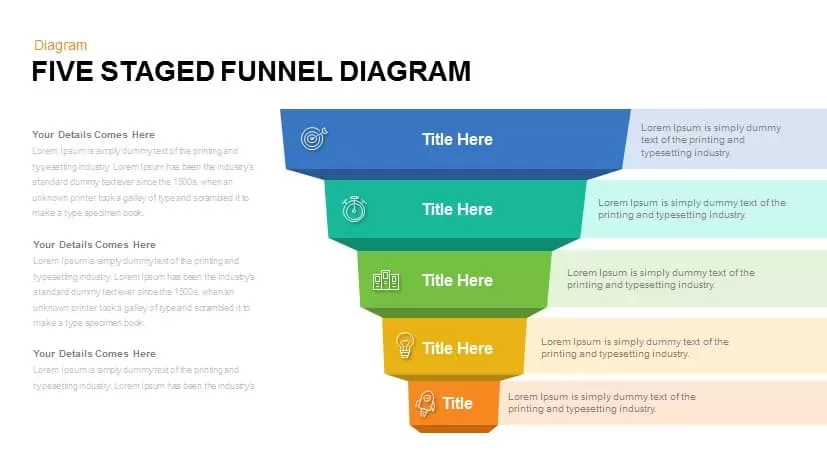
Five Staged Funnel Diagram for PowerPoint & Google Slides
Funnel
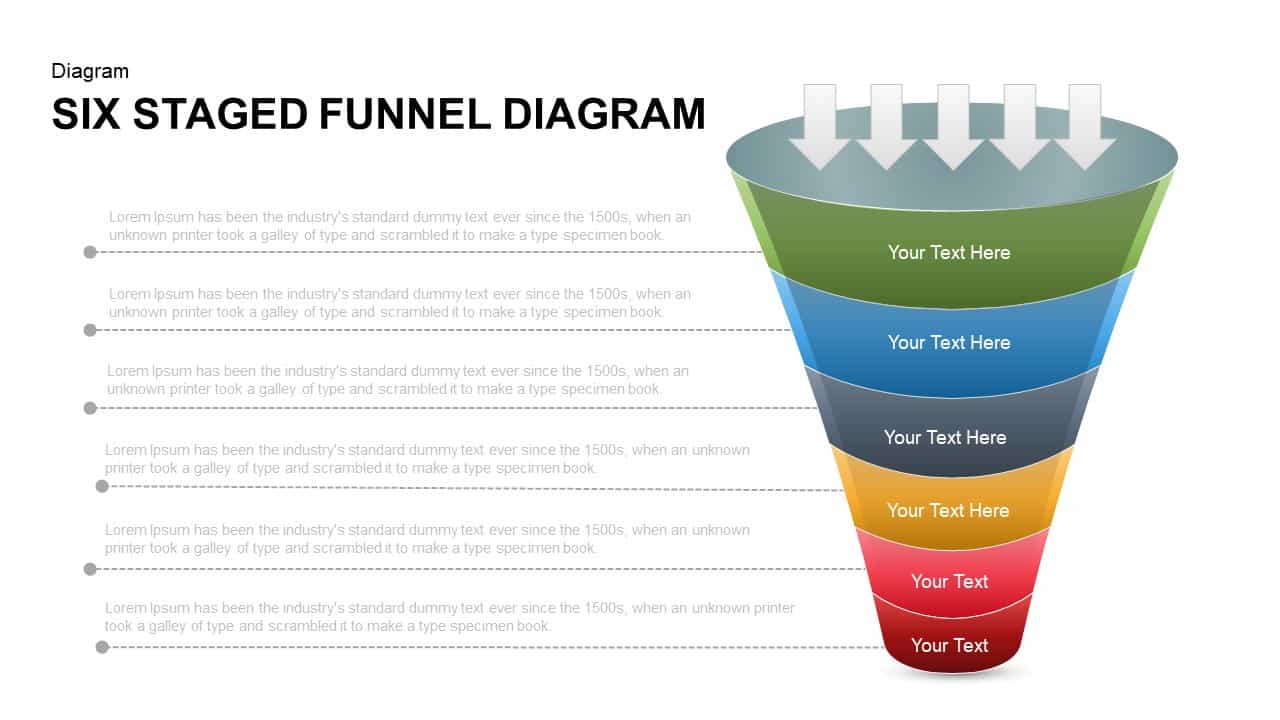
Six Staged Funnel Diagram for PowerPoint & Google Slides
Funnel
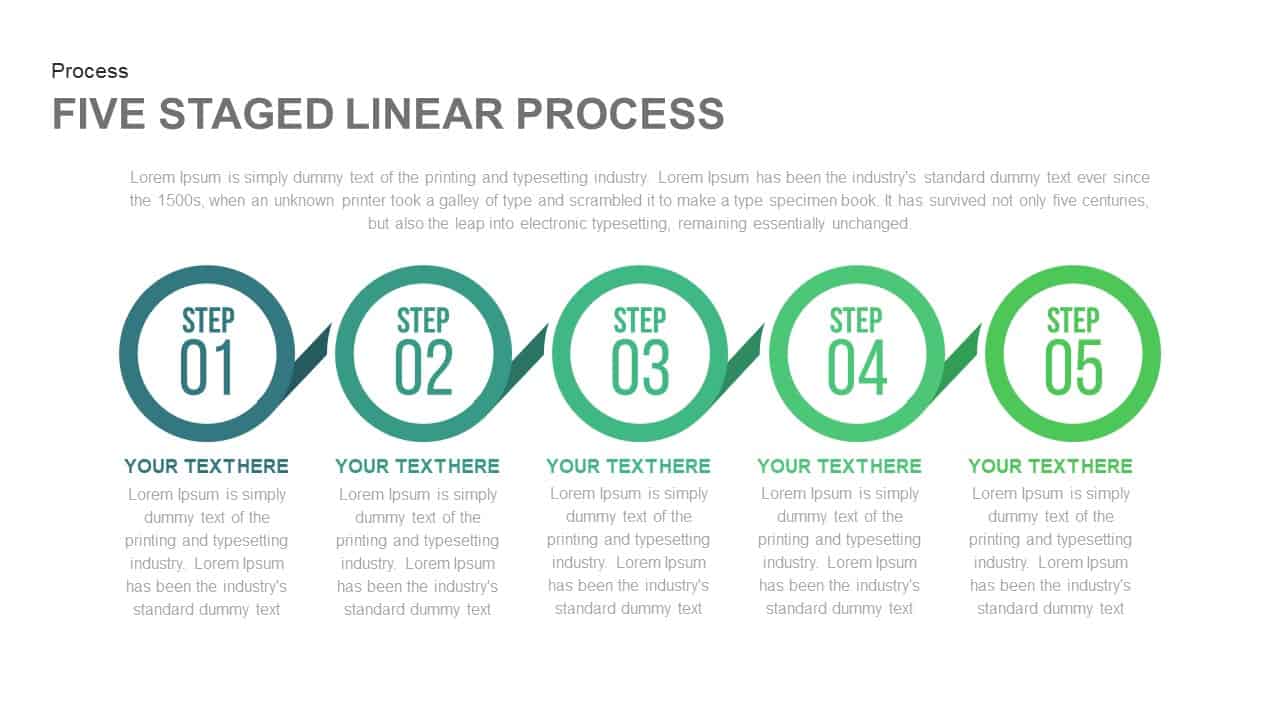
Five Staged Linear Process for PowerPoint & Google Slides
Process
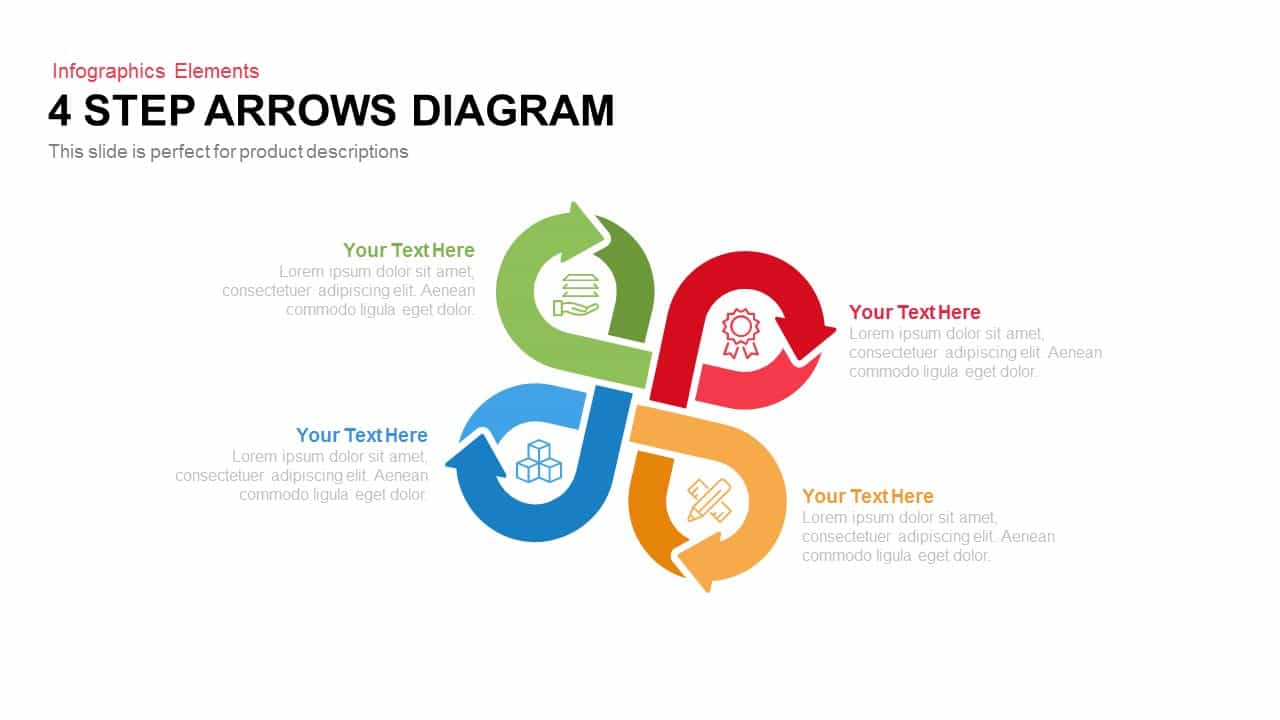
4Step Arrows Diagram Template for PowerPoint & Google Slides
Infographics
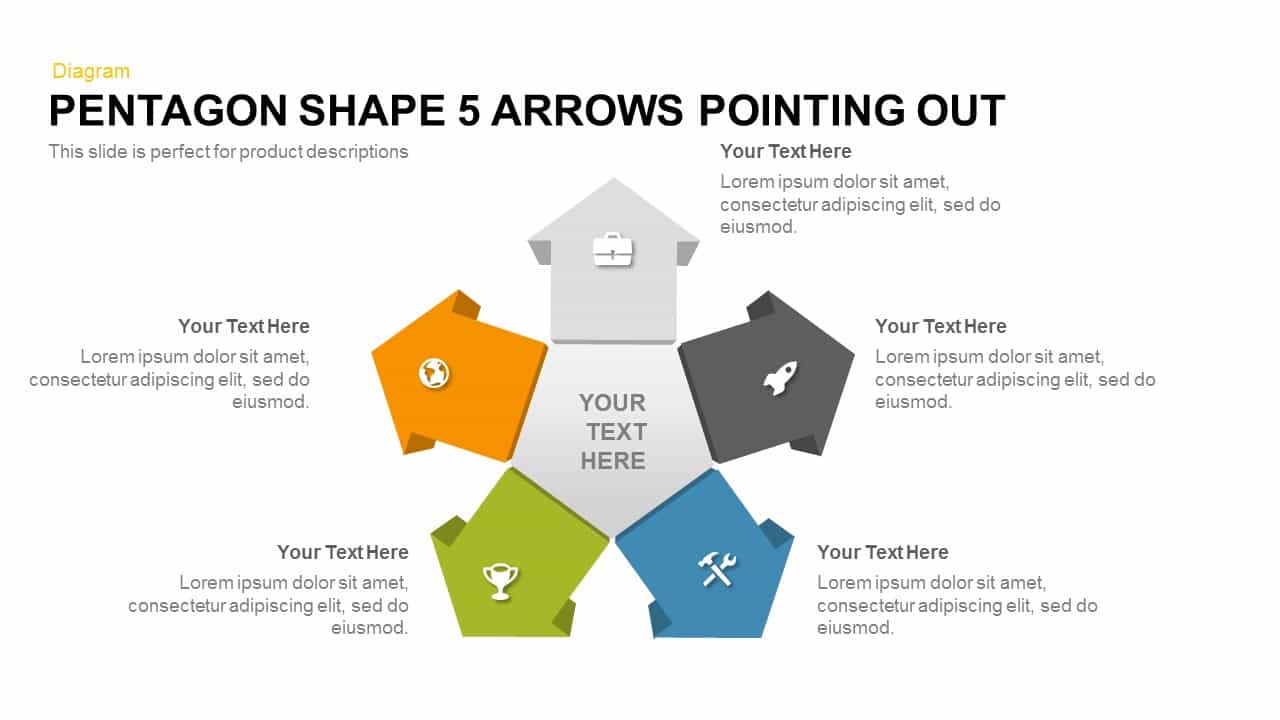
Pentagon Shape 5 Arrows Pointing Out template for PowerPoint & Google Slides
Arrow
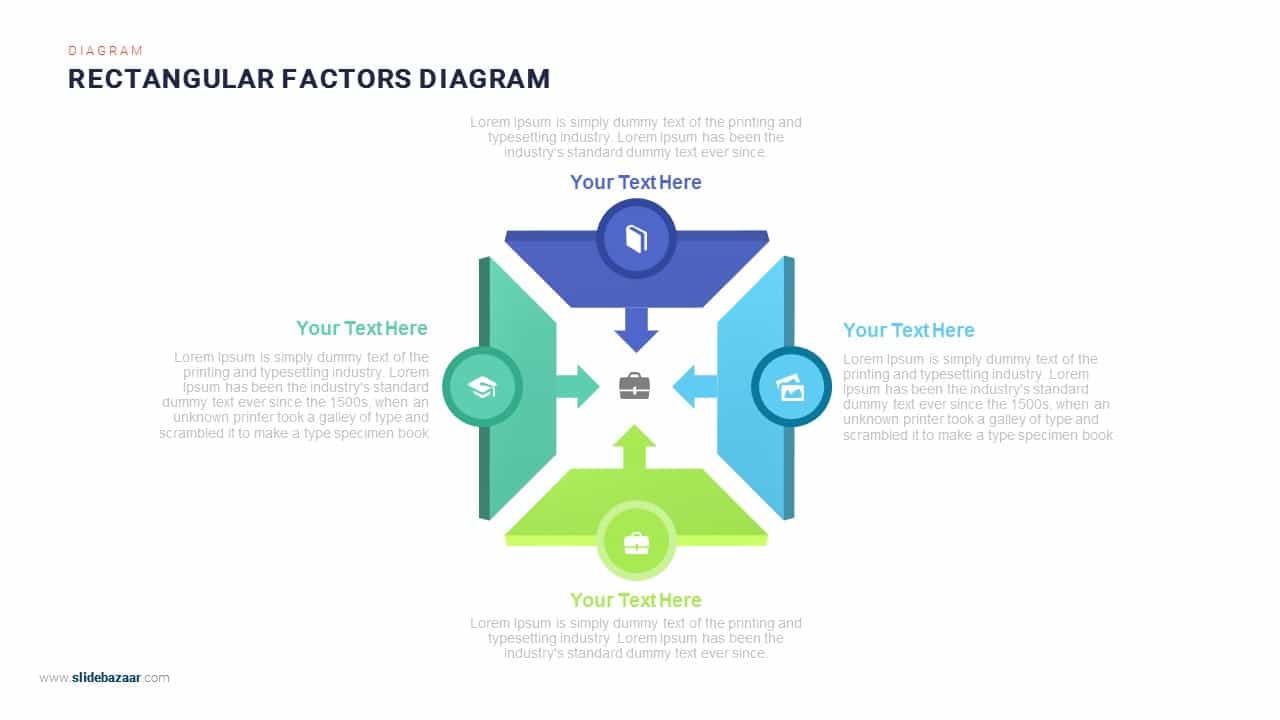
Four-Arrows Rectangular Factors Diagram Template for PowerPoint & Google Slides
Process
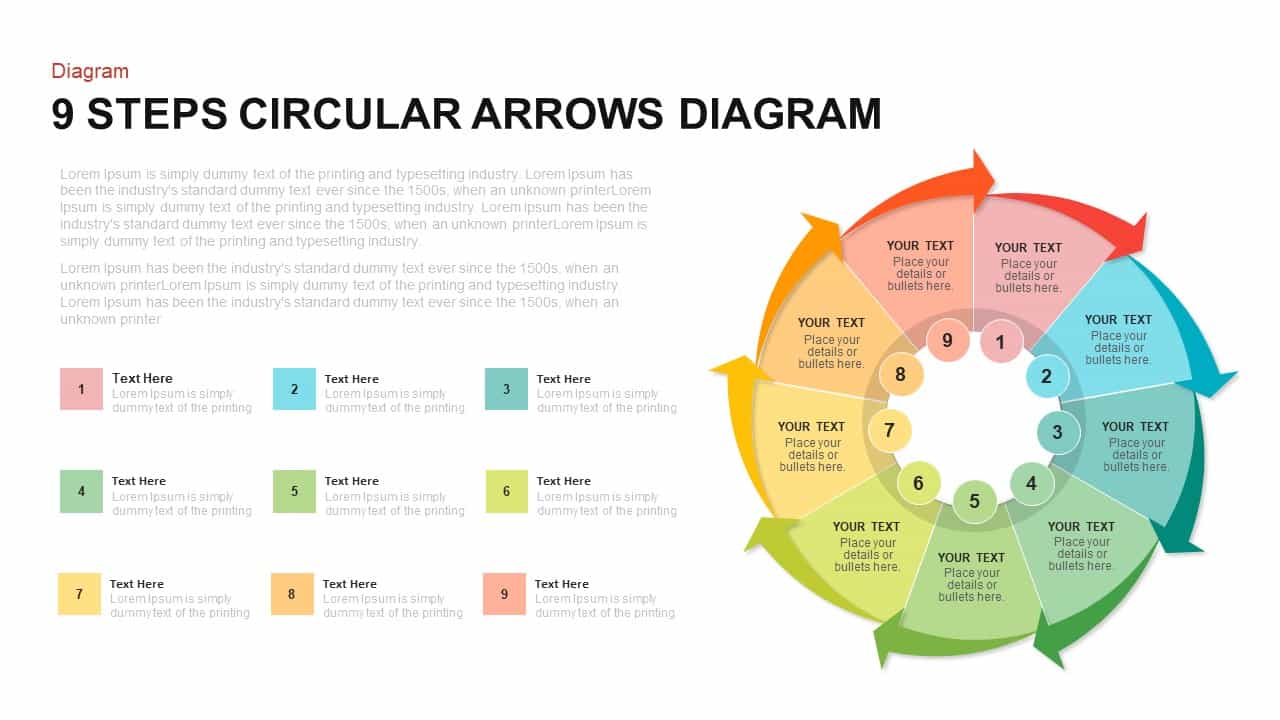
9-Step Circular Arrows Process Diagram Template for PowerPoint & Google Slides
Process
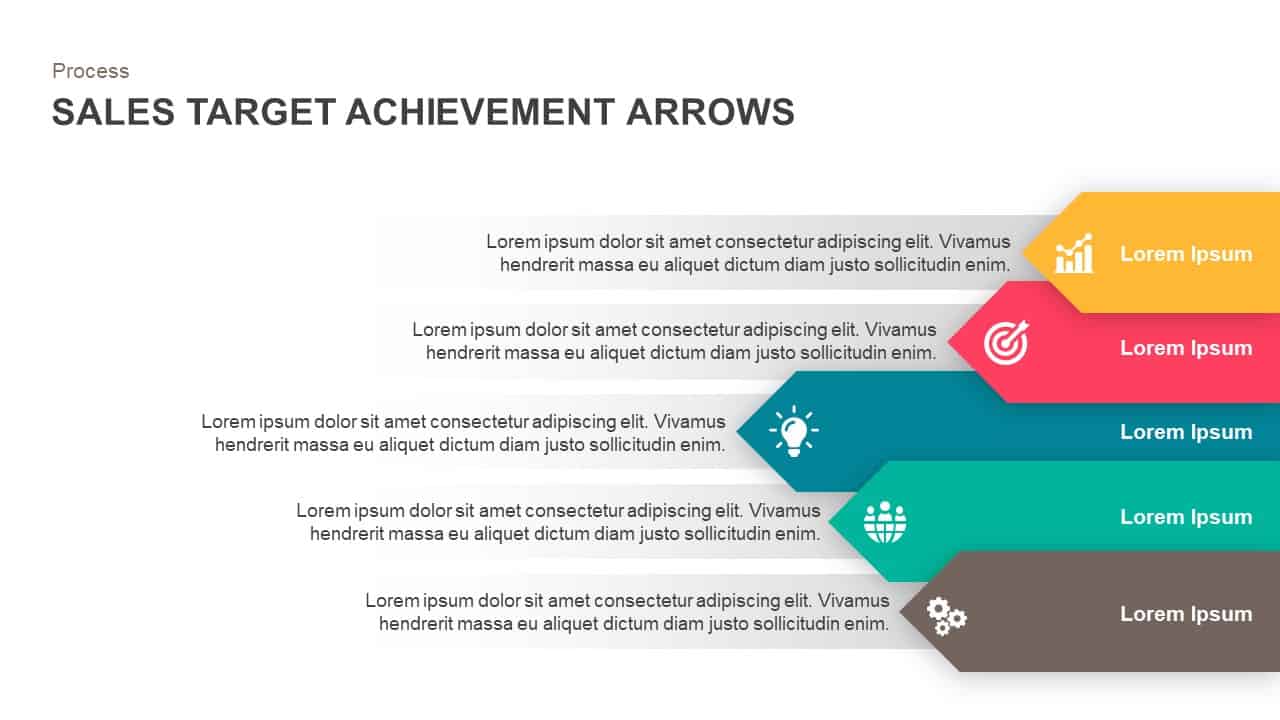
Sales Target Achievement Arrows Template for PowerPoint & Google Slides
Arrow
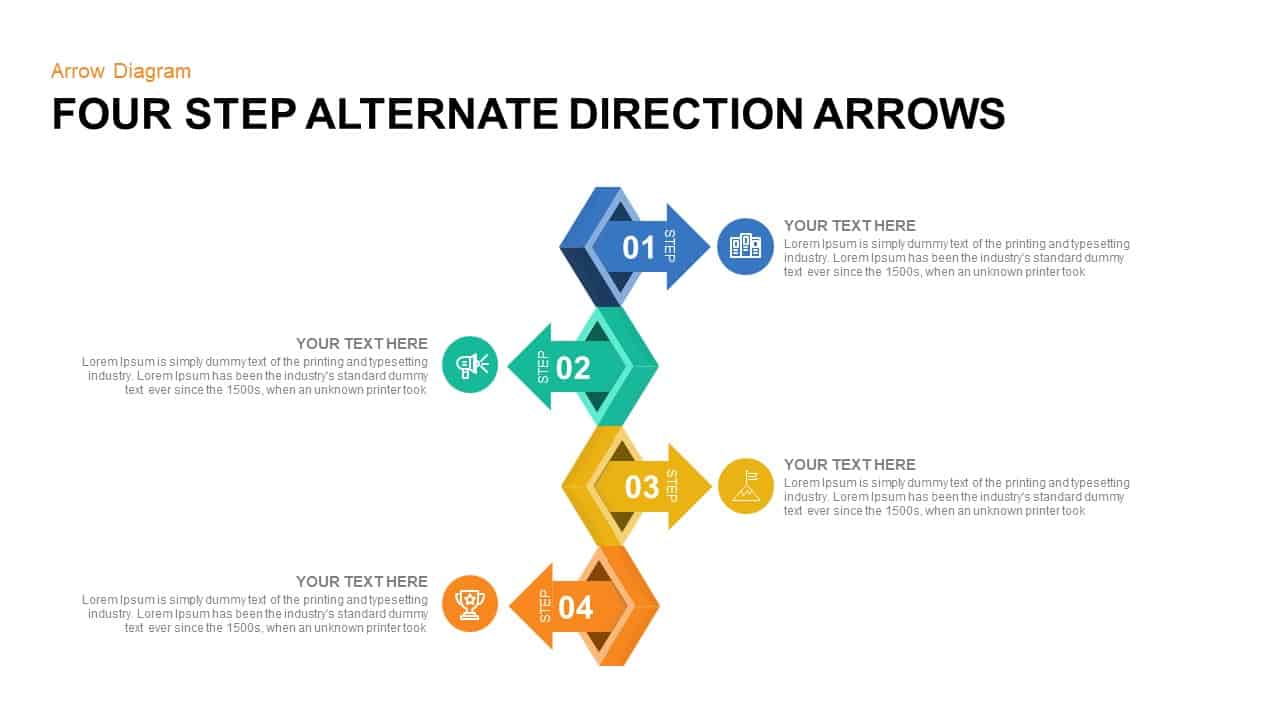
Four Step Alternate Direction Arrows Template for PowerPoint & Google Slides
Arrow
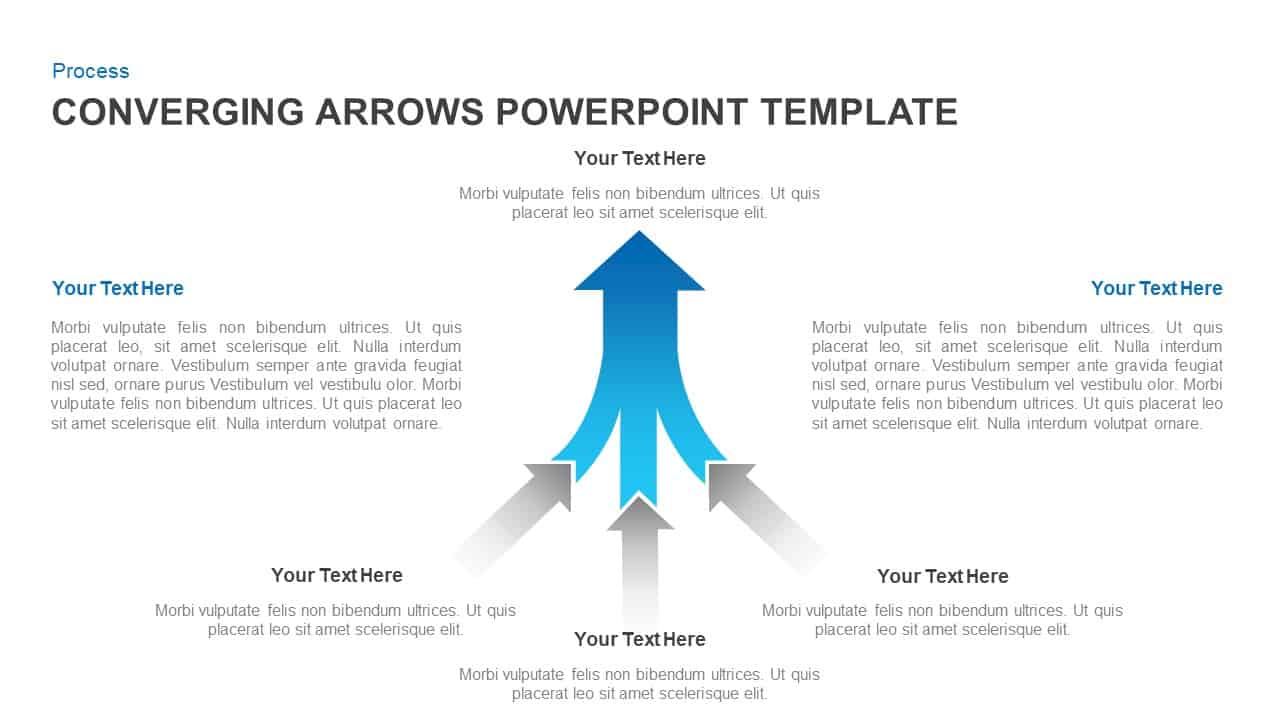
Converging Arrows Process Diagram Template for PowerPoint & Google Slides
Arrow
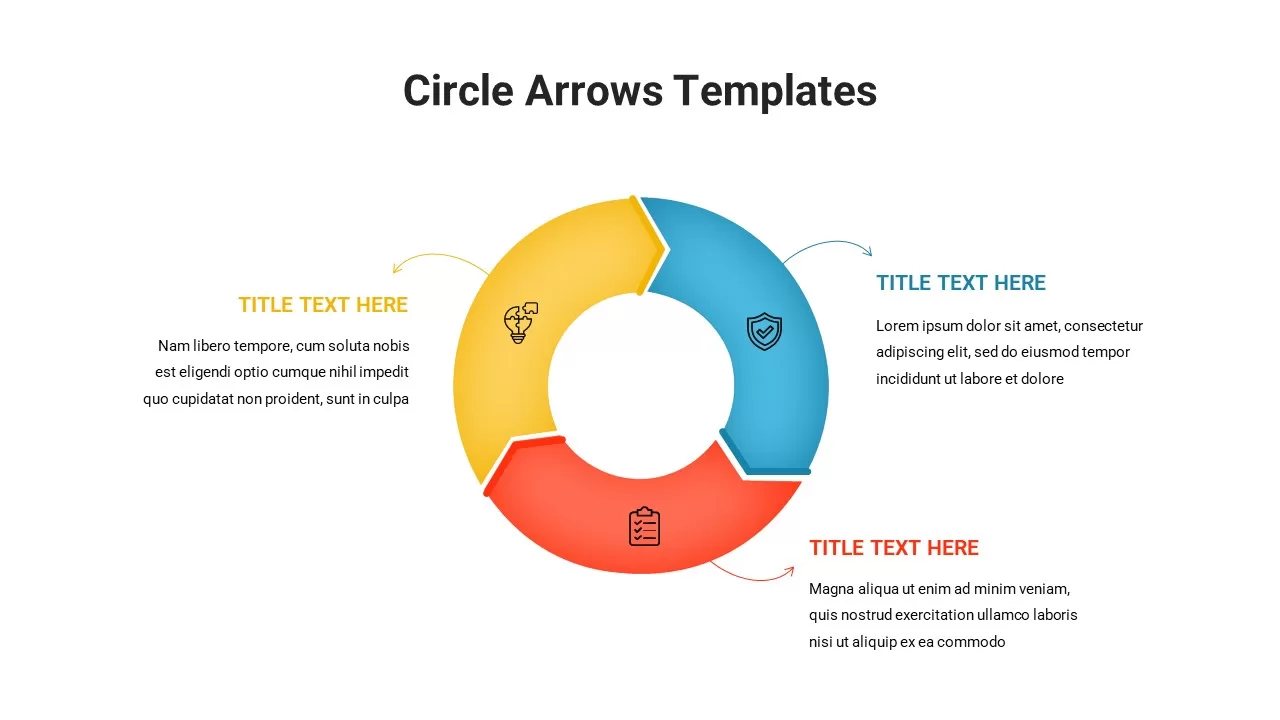
Circle Arrows Diagram template for PowerPoint & Google Slides
Process
Circle Arrows Process Flow template for PowerPoint & Google Slides
Process
Circular Arrows Process Flow template for PowerPoint & Google Slides
Process
Circular Arrows Process Flow template for PowerPoint & Google Slides
Process
Circular Arrows Process Flow template for PowerPoint & Google Slides
Process
Three-Step Circular Arrows Diagram Template for PowerPoint & Google Slides
Process
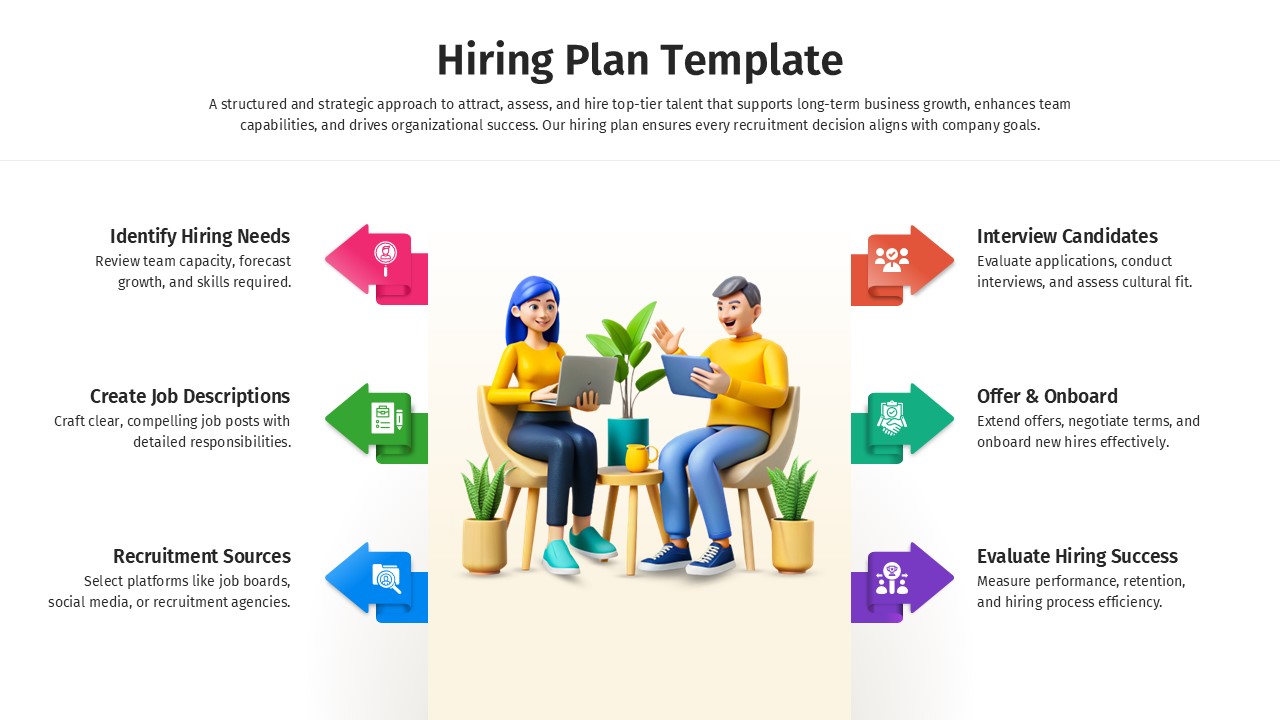
Hiring Plan Template with 6-Step Arrows for PowerPoint & Google Slides
Recruitment
Merging Arrows Process for PowerPoint & Google Slides
Arrow
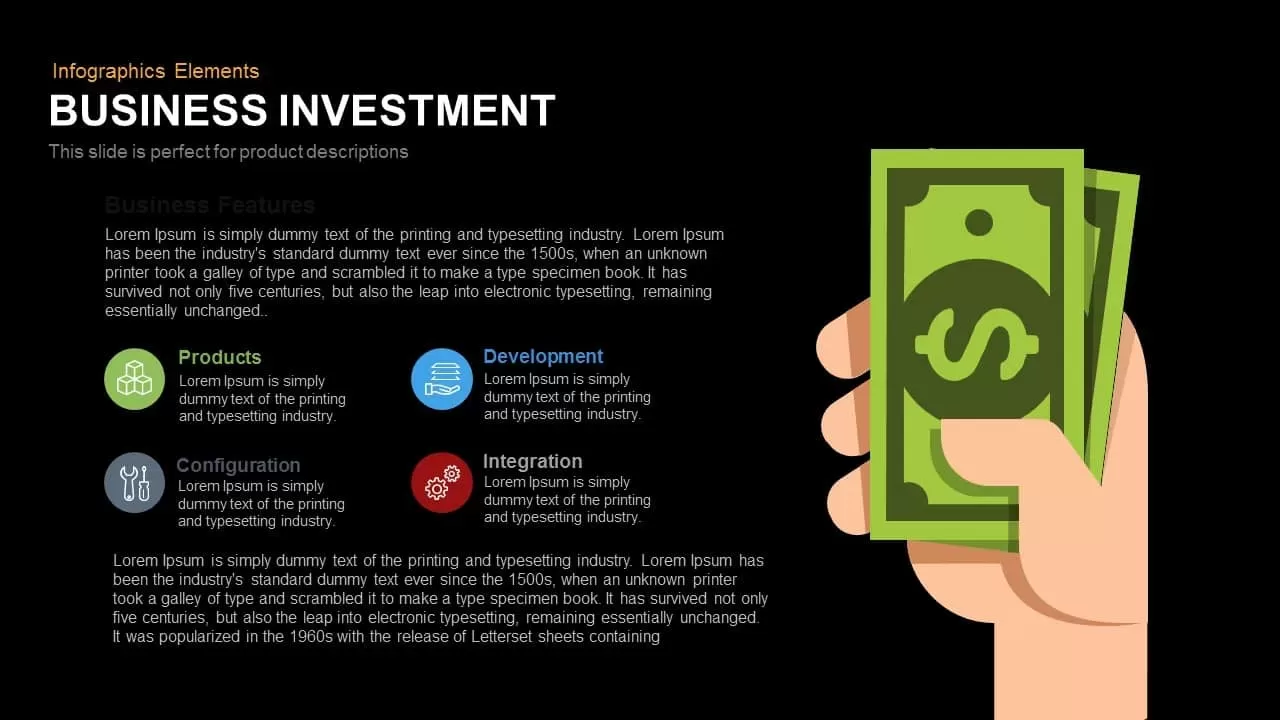
Business Investment Features Infographic Template for PowerPoint & Google Slides
Finance
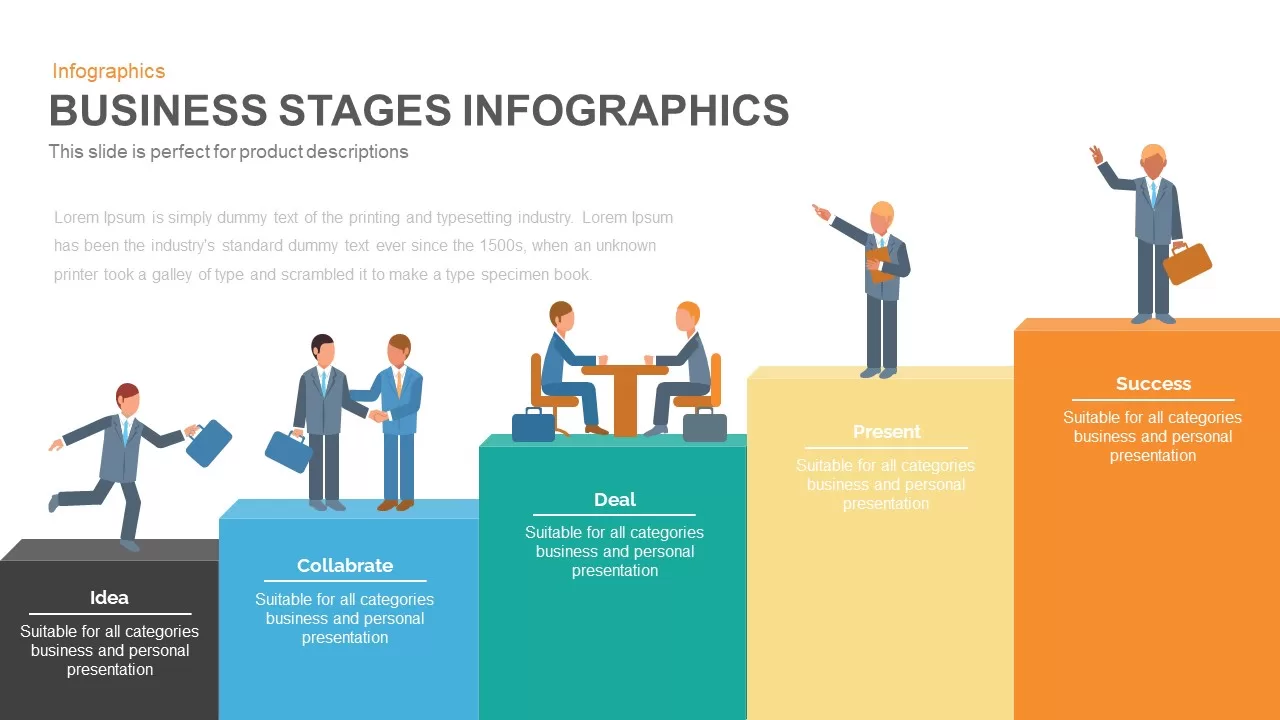
Business Stages Progression Infographic template for PowerPoint & Google Slides
Process
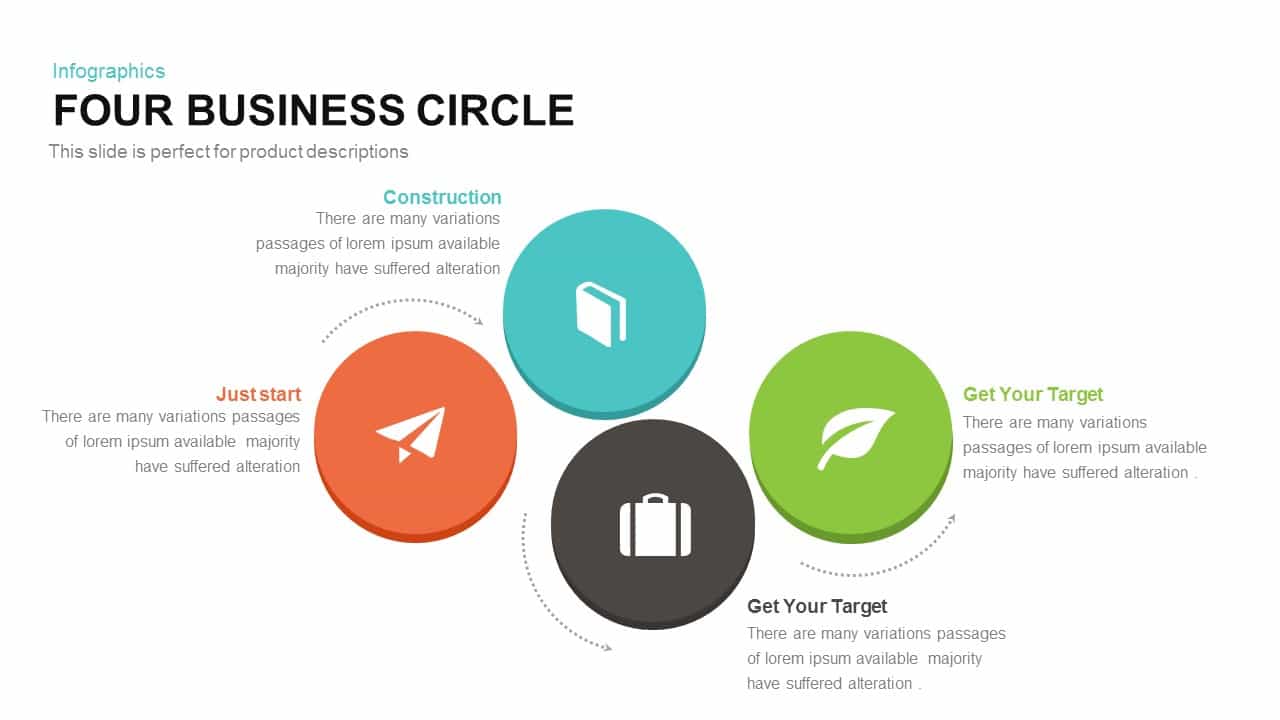
Four-Circle Business Process Infographic Template for PowerPoint & Google Slides
Circular
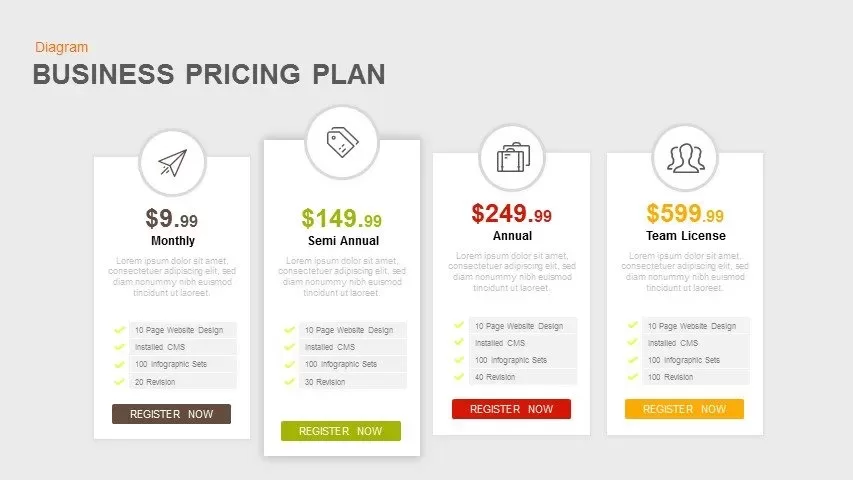
Business Pricing Plan Infographic Template for PowerPoint & Google Slides
Finance
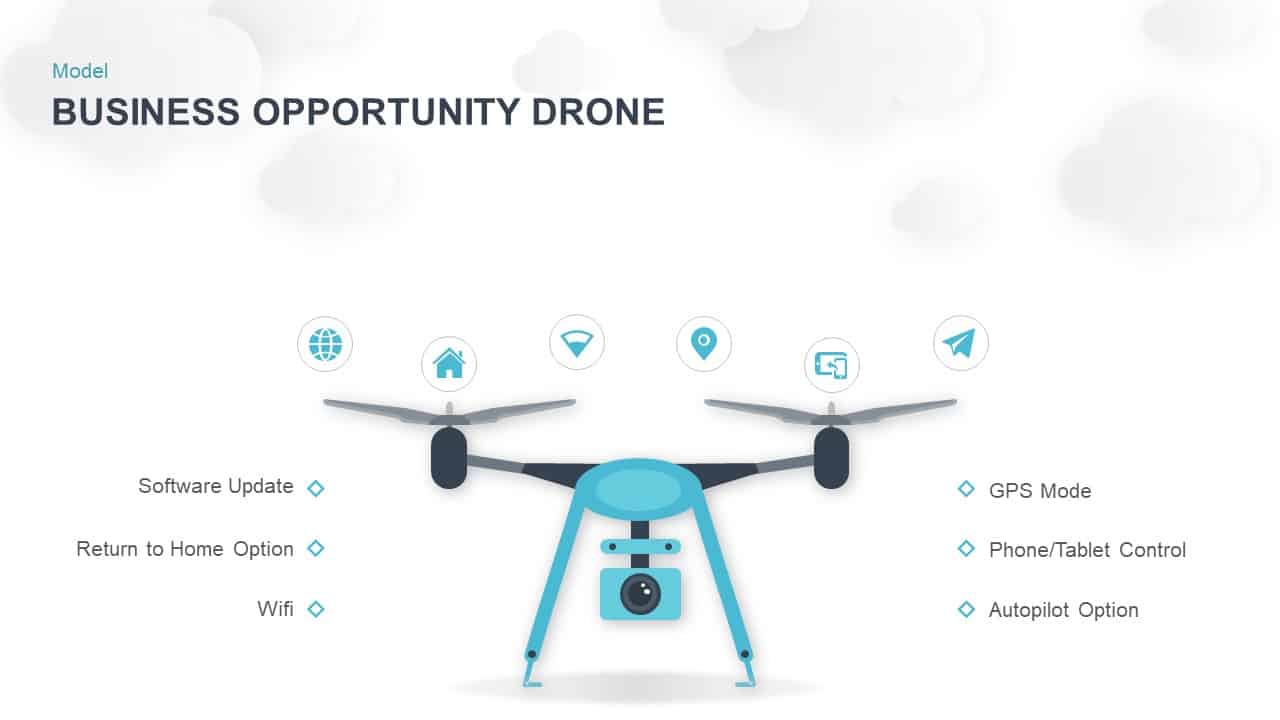
Business Opportunity Drone Infographic Template for PowerPoint & Google Slides
Opportunities Challenges
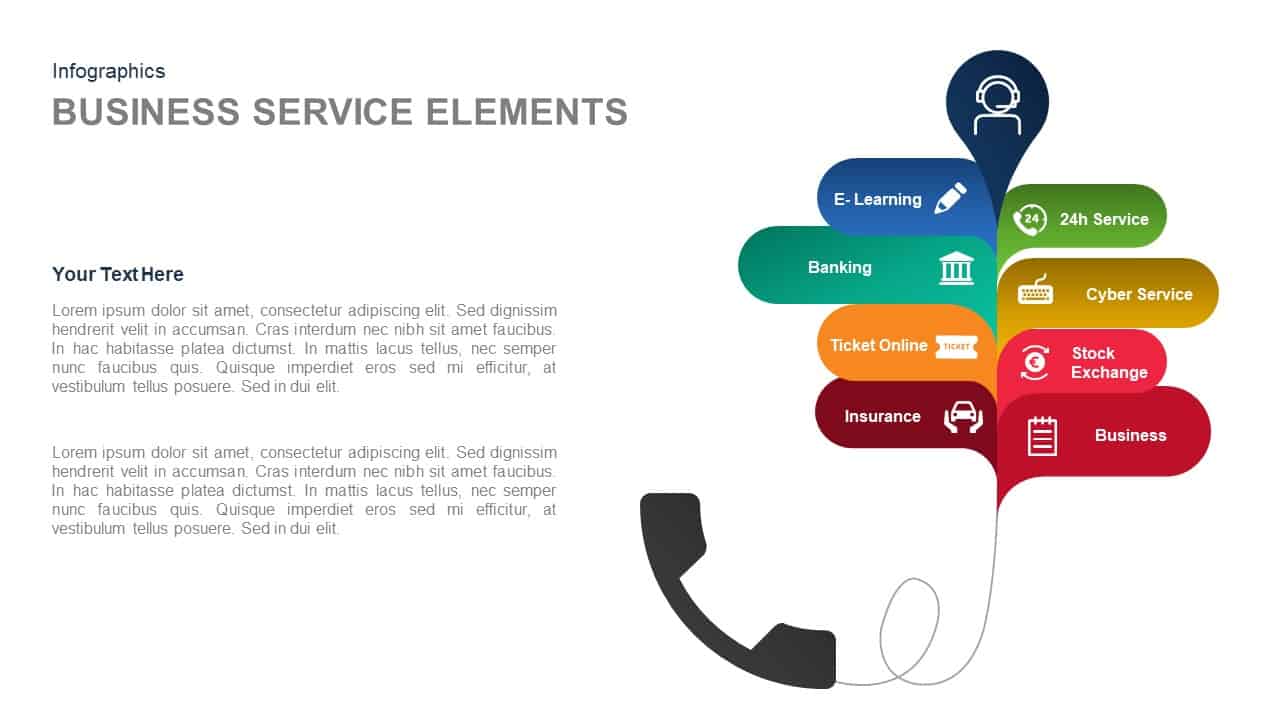
Business Services Call Center Infographic Template for PowerPoint & Google Slides
Business Models
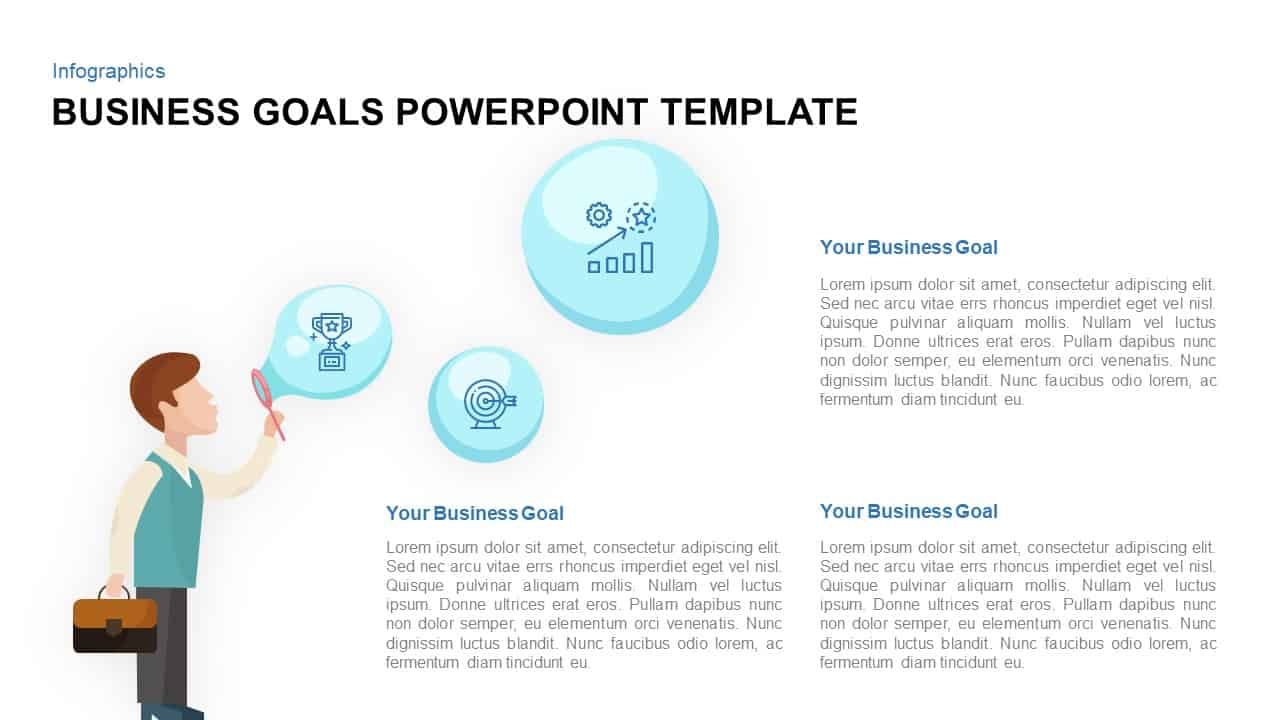
Business Goals Bubble Infographic Template for PowerPoint & Google Slides
Infographics
Business Finance Calendar Infographic Template for PowerPoint & Google Slides
Finance

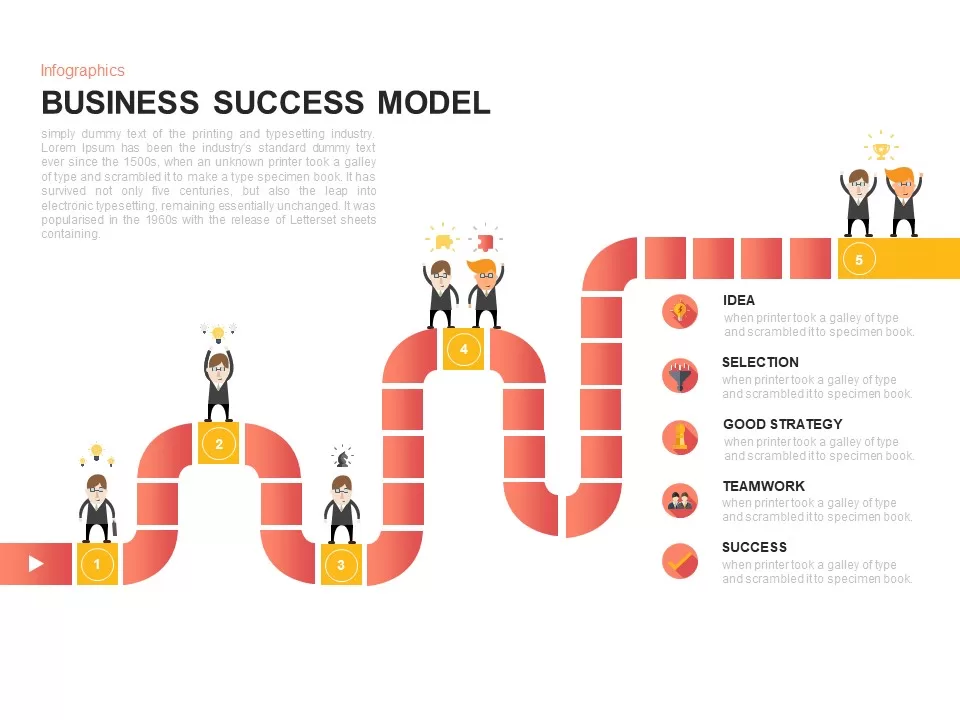
Business Success Model Infographic Template for PowerPoint & Google Slides
Roadmap
Four-Stage Business Success Infographic Template for PowerPoint & Google Slides
Process
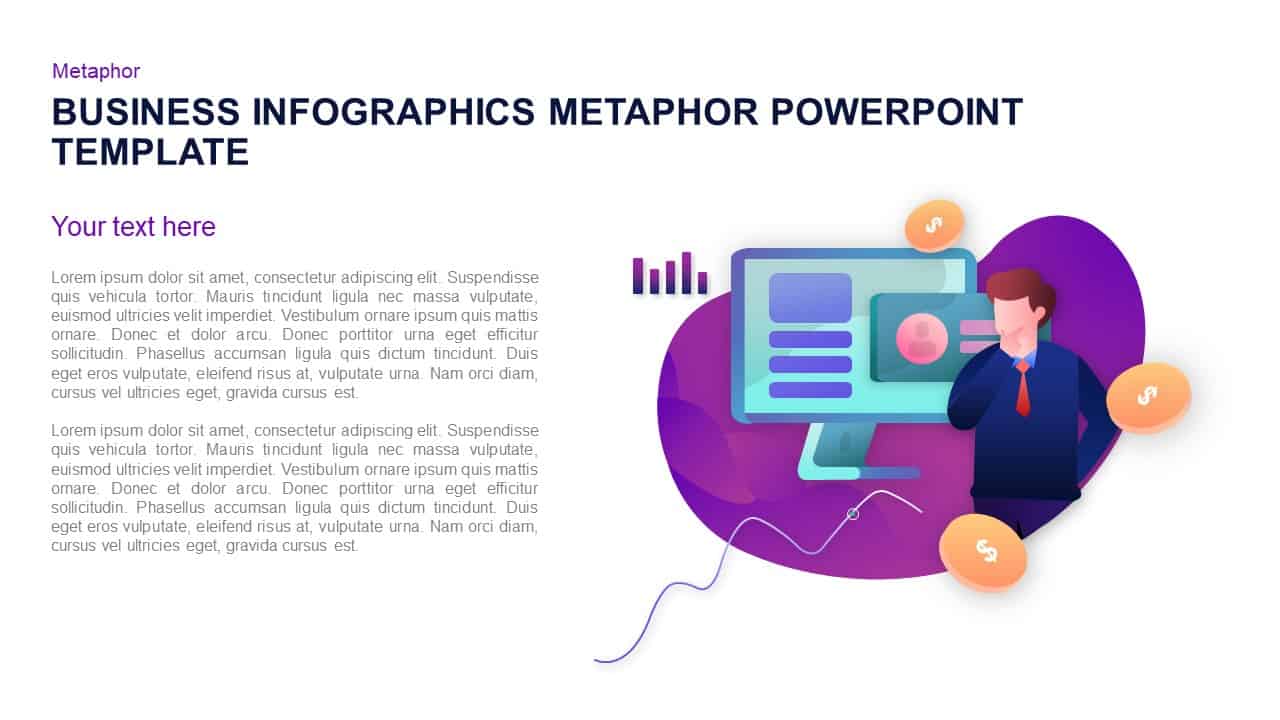
Business Growth Infographic Metaphor Template for PowerPoint & Google Slides
Revenue
Business Services Infographic Diagram Template for PowerPoint & Google Slides
Infographics
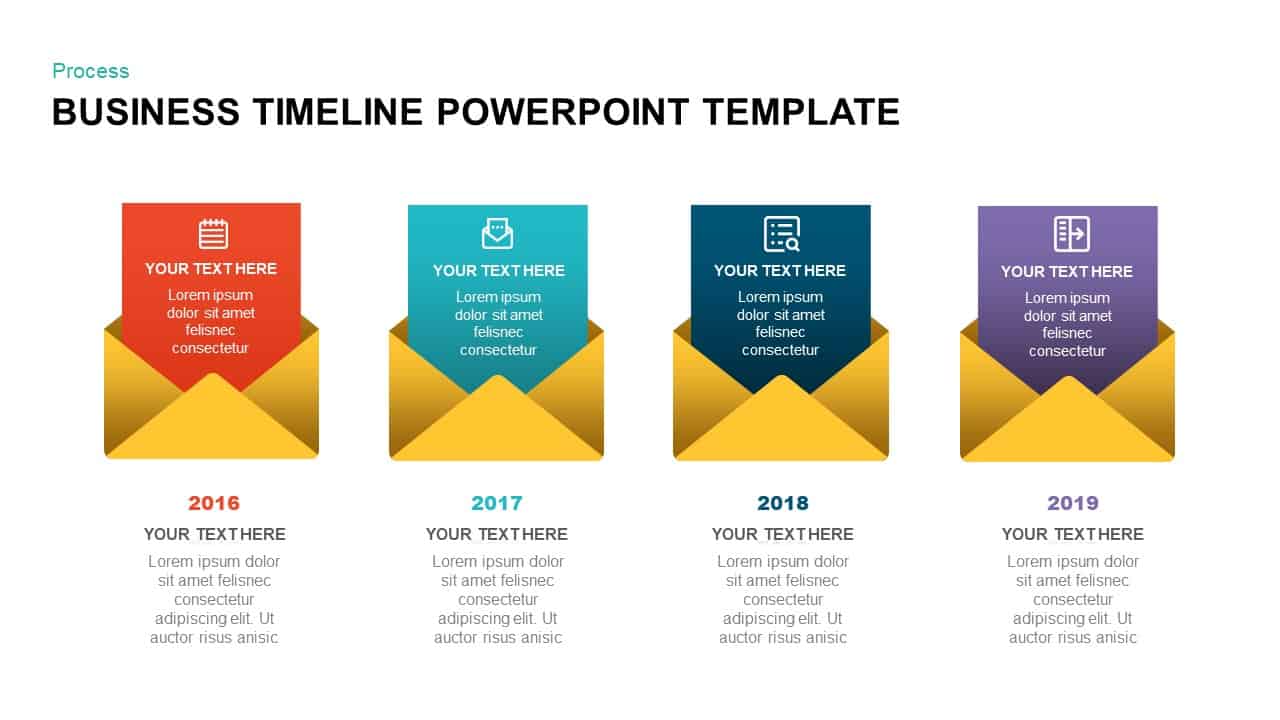
Business Timeline Envelope Infographic Template for PowerPoint & Google Slides
Timeline
Five-Step Business Plan Infographic Template for PowerPoint & Google Slides
Business Plan
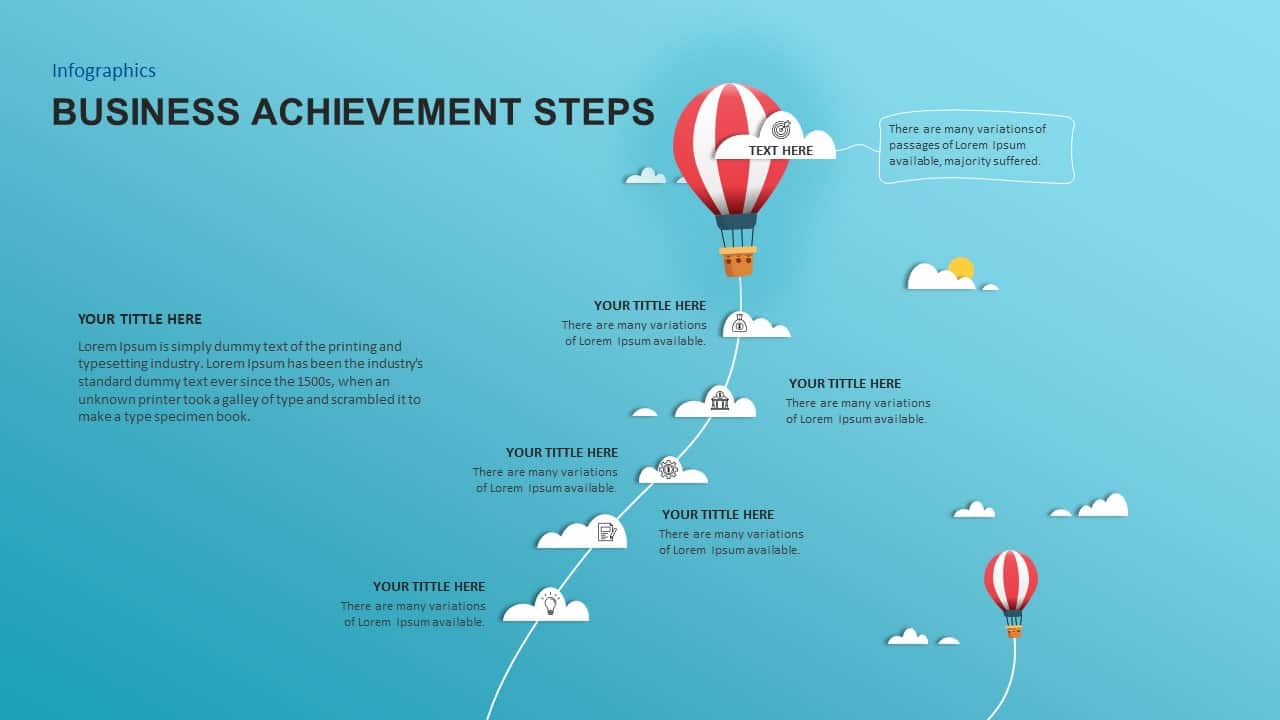
Business Achievement Steps Infographic template for PowerPoint & Google Slides
Process

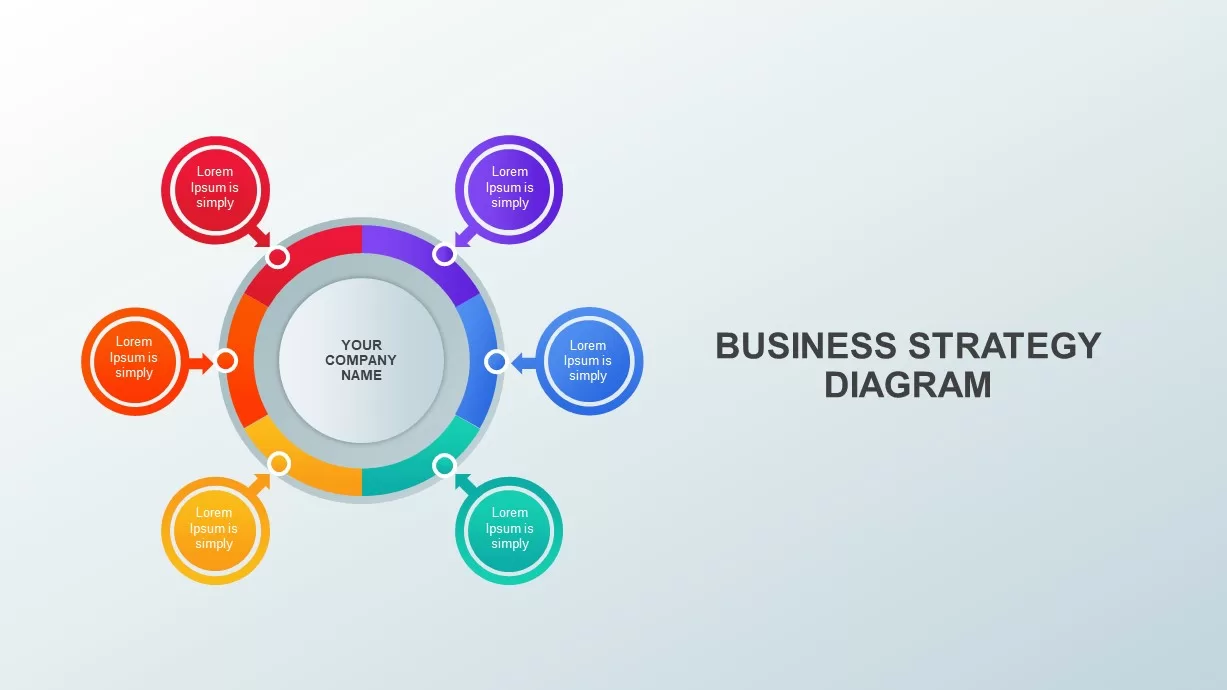
Business Strategy Infographic Template for PowerPoint & Google Slides
Business Strategy
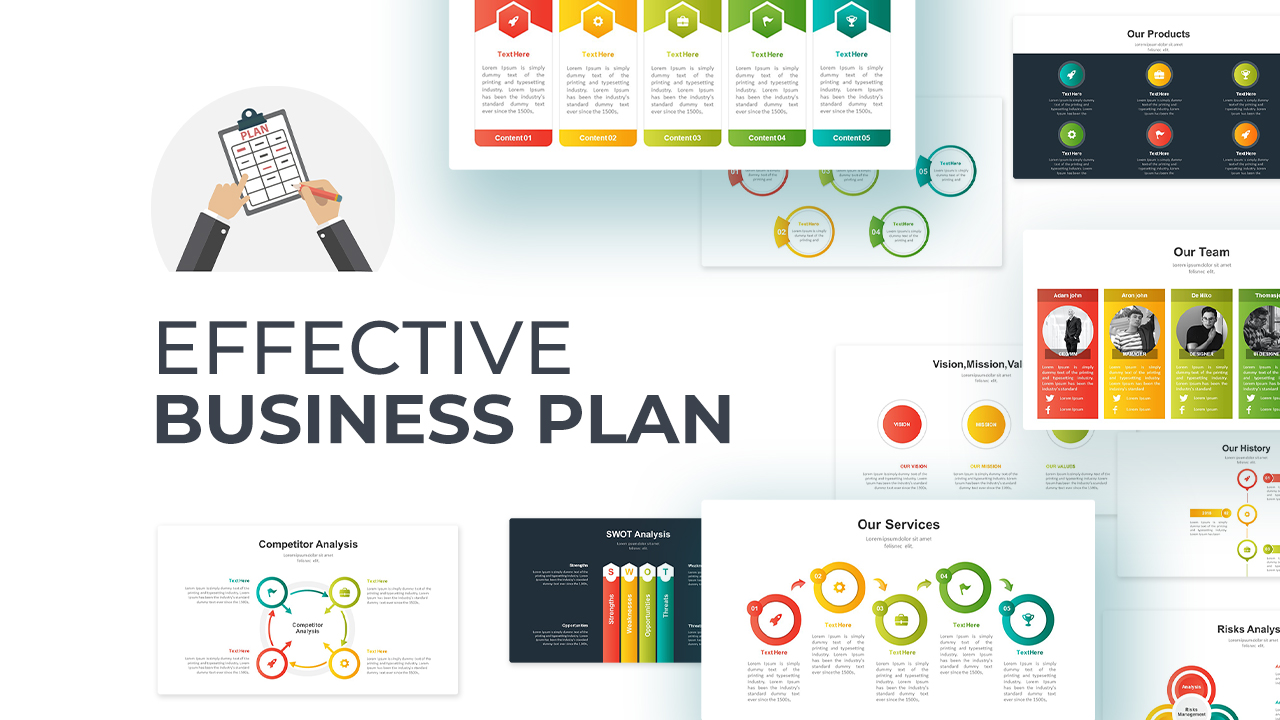
Effective Business Plan Infographic Template for PowerPoint & Google Slides
Pitch Deck
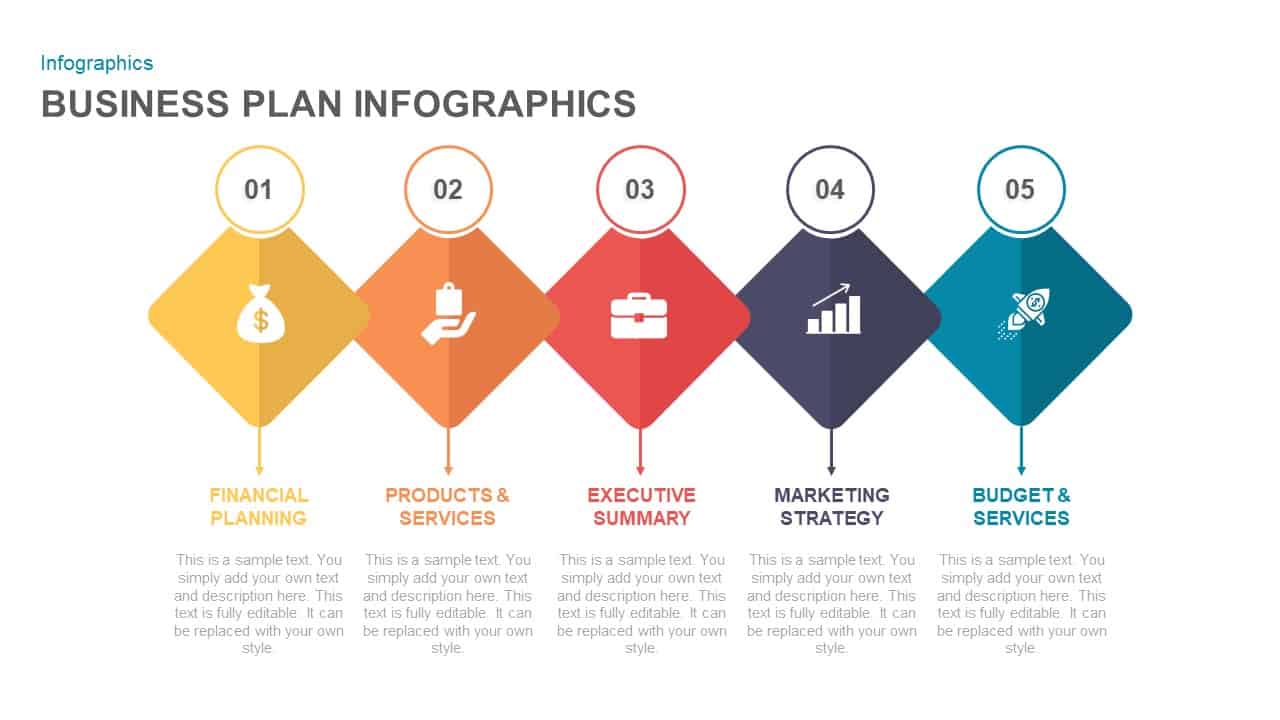
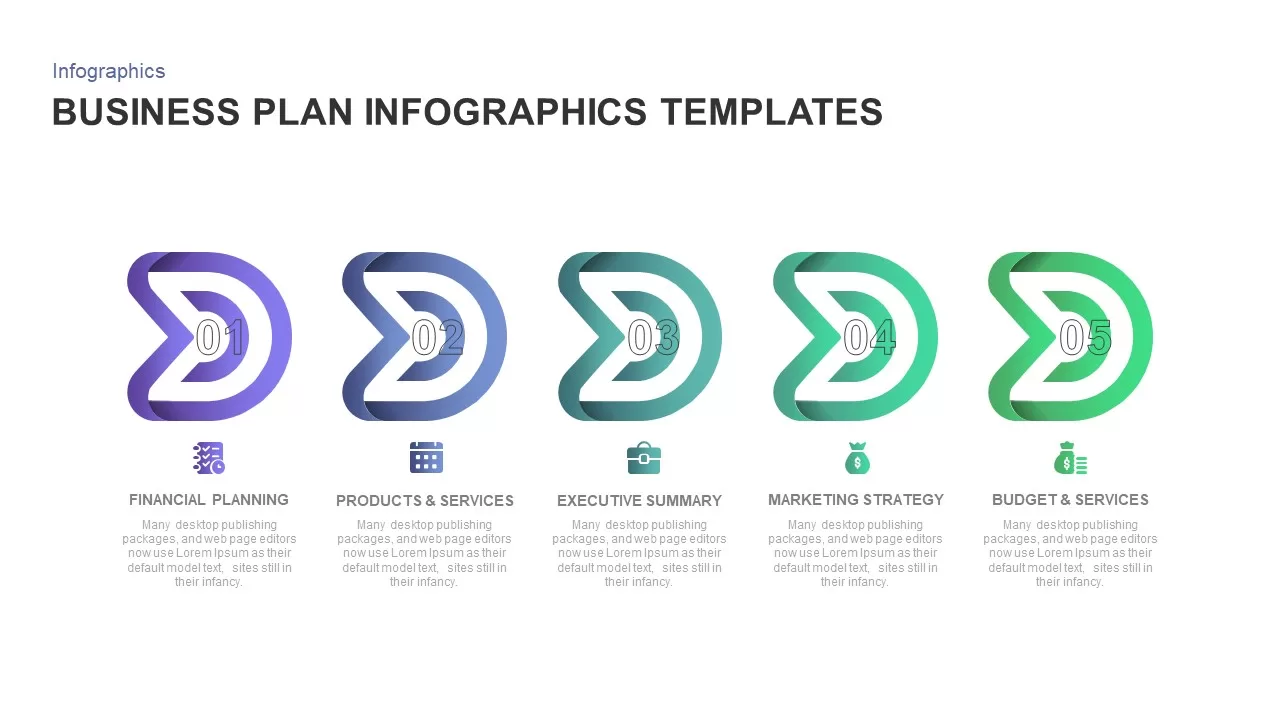
Business Plan Infographic Template for PowerPoint & Google Slides
Business Plan
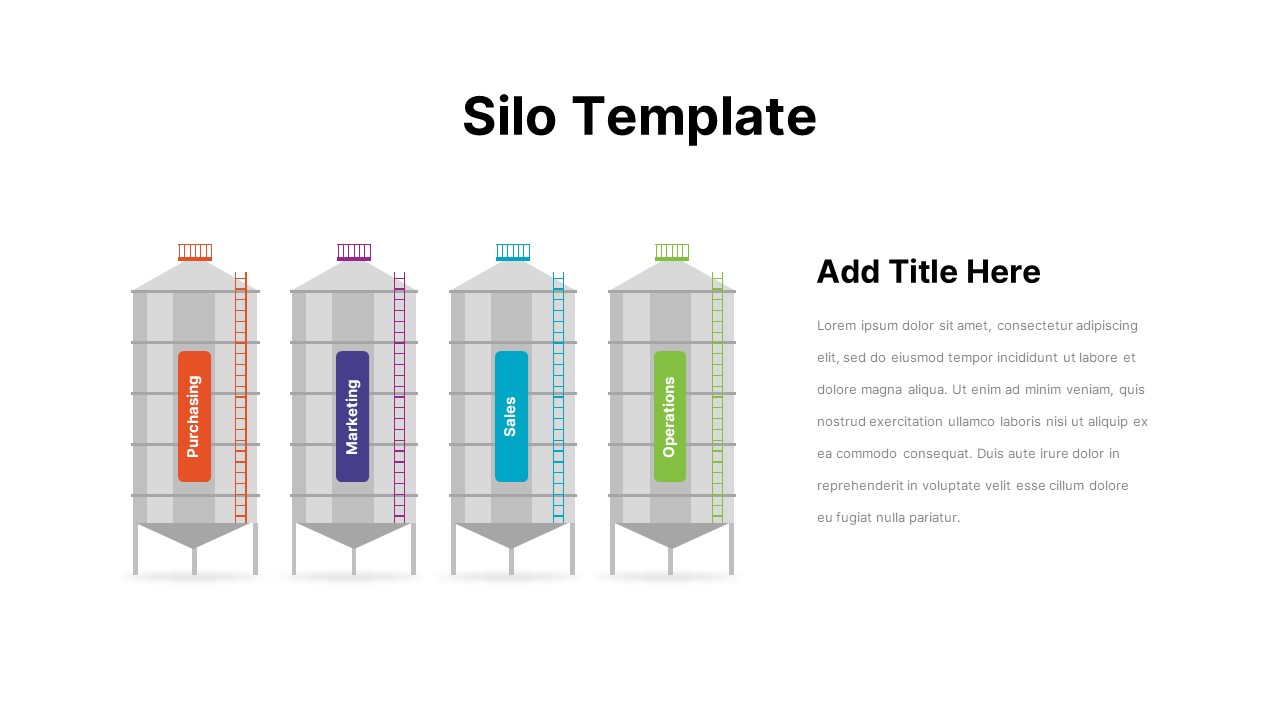
Business Silo Diagram Infographic Design Template for PowerPoint & Google Slides
Business
Business Intelligence Infographic & Flow Template for PowerPoint & Google Slides
Business Report
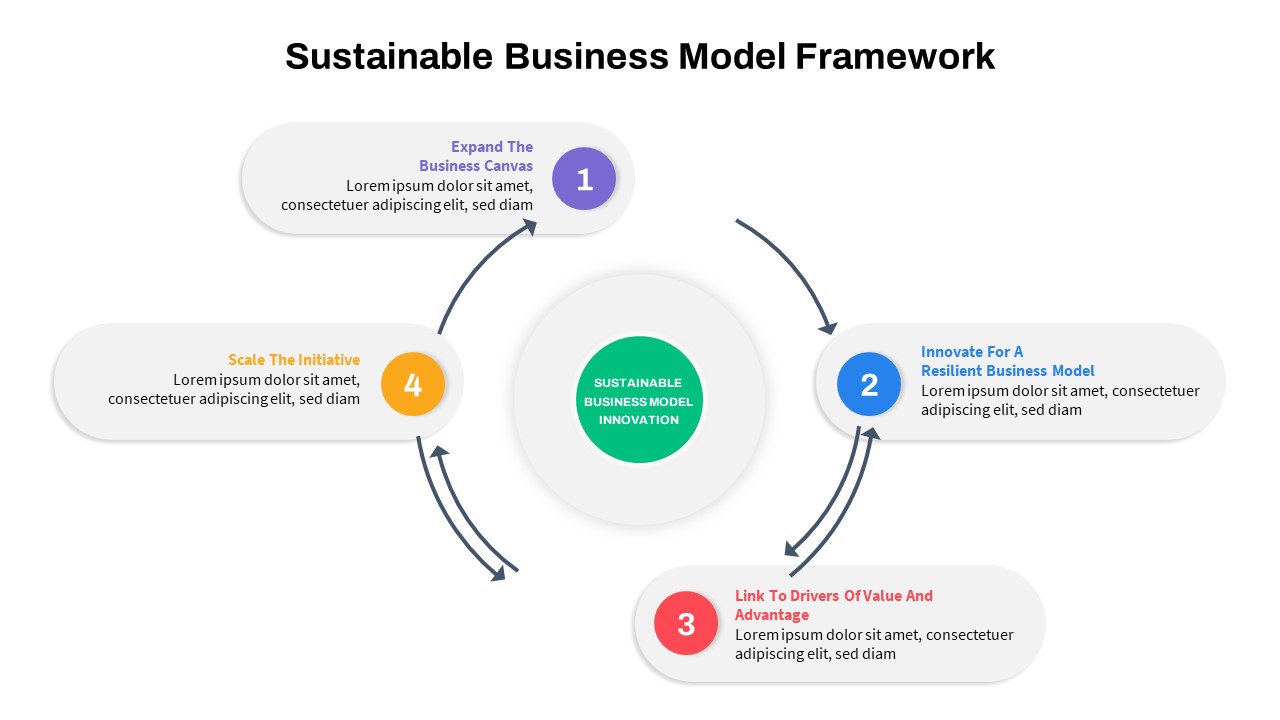
Sustainable Business Model Circular Infographic Template for PowerPoint & Google Slides
Business Strategy
Circular Business Strategy Infographic Template for PowerPoint & Google Slides
Circular
Google Ads Optimization & Performance Infographic Template for PowerPoint & Google Slides
Digital Marketing
SQ3R Study Strategy Infographic Slides Template for PowerPoint & Google Slides
Business Strategy
Six Double Diamond Infographic Slides Template for PowerPoint & Google Slides
Process
Sales Process Infographic Slides Pack Template for PowerPoint & Google Slides
Process
Casino/Poker Chips Infographic Slides template for PowerPoint & Google Slides
Business Strategy
Agenda Infographic Pack of 2 Slides Template for PowerPoint & Google Slides
Agenda
Quad Chart Infographic Pack of 8 Slides Template for PowerPoint & Google Slides
Comparison Chart
Four Options Infographic Slides Template for PowerPoint & Google Slides
Comparison
Game Plan Infographic Slides Pack Template for PowerPoint & Google Slides
Infographics
Business Slides Carnival PowerPoint Template for PowerPoint & Google Slides
Business
Teamwork PowerPoint Infographic Template for PowerPoint & Google Slides
Leadership
Kite Infographic PowerPoint Template for PowerPoint & Google Slides
Process
Cladogram Infographic Di Template for PowerPoint & Google Slides Template
Decision Tree
Workflow PowerPoint Process infographic for PowerPoint & Google Slides
Process
Free Infographic Deck PowerPoint Pack for PowerPoint & Google Slides
Infographics
Free
Professional Linear Timeline Infographic Template for PowerPoint & Google Slides
Timeline
Six-Stage Hexagon Timeline Infographic Template for PowerPoint & Google Slides
Timeline
Multi-Year Timeline Infographic Template for PowerPoint & Google Slides
Timeline
Roadmap Infographic Template for PowerPoint & Google Slides
Roadmap
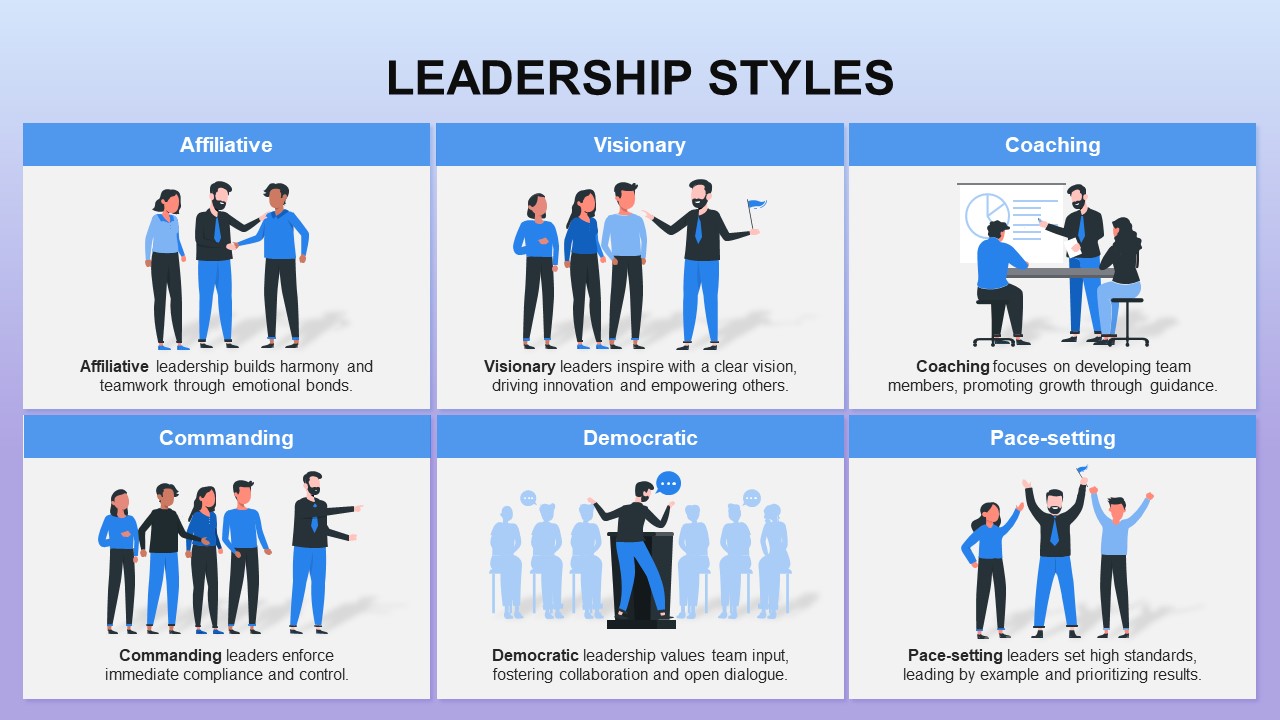
Six Leadership Styles Grid Infographic Template for PowerPoint & Google Slides
Leadership
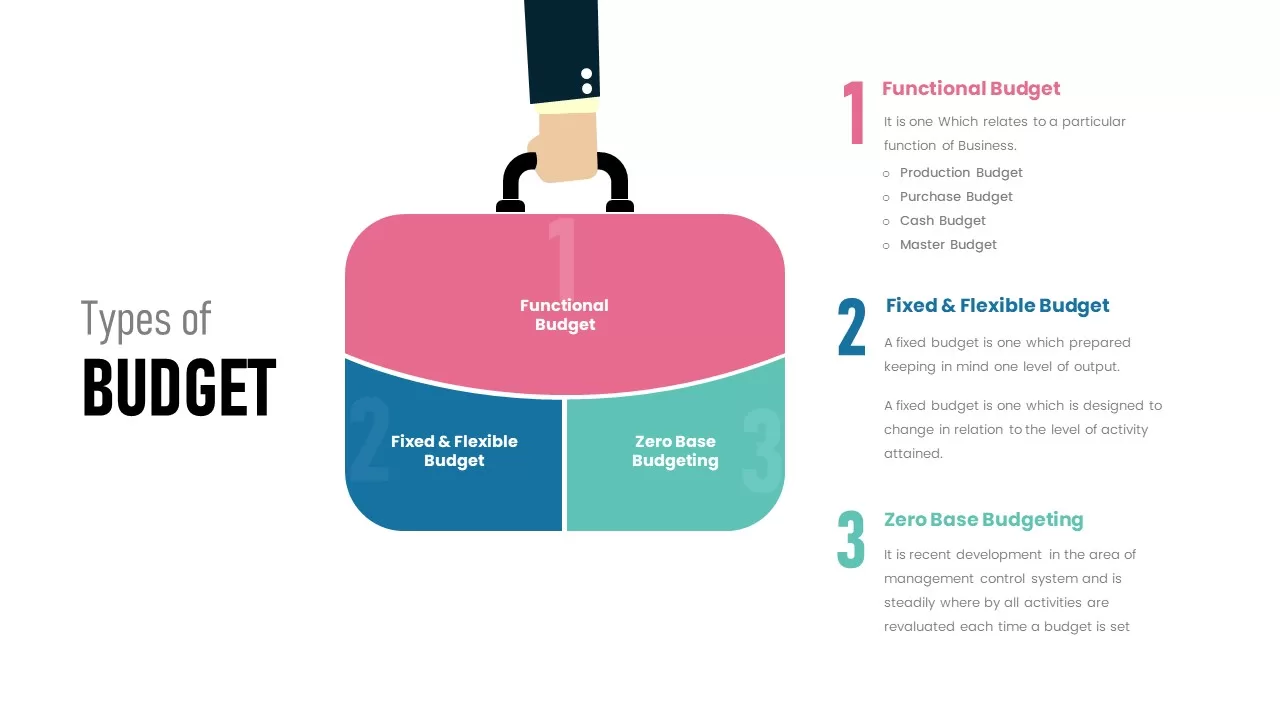
Types of Budget Infographic Pack Template for PowerPoint & Google Slides
Comparison
Four-Part Table of Contents Infographic Template for PowerPoint & Google Slides
Agenda
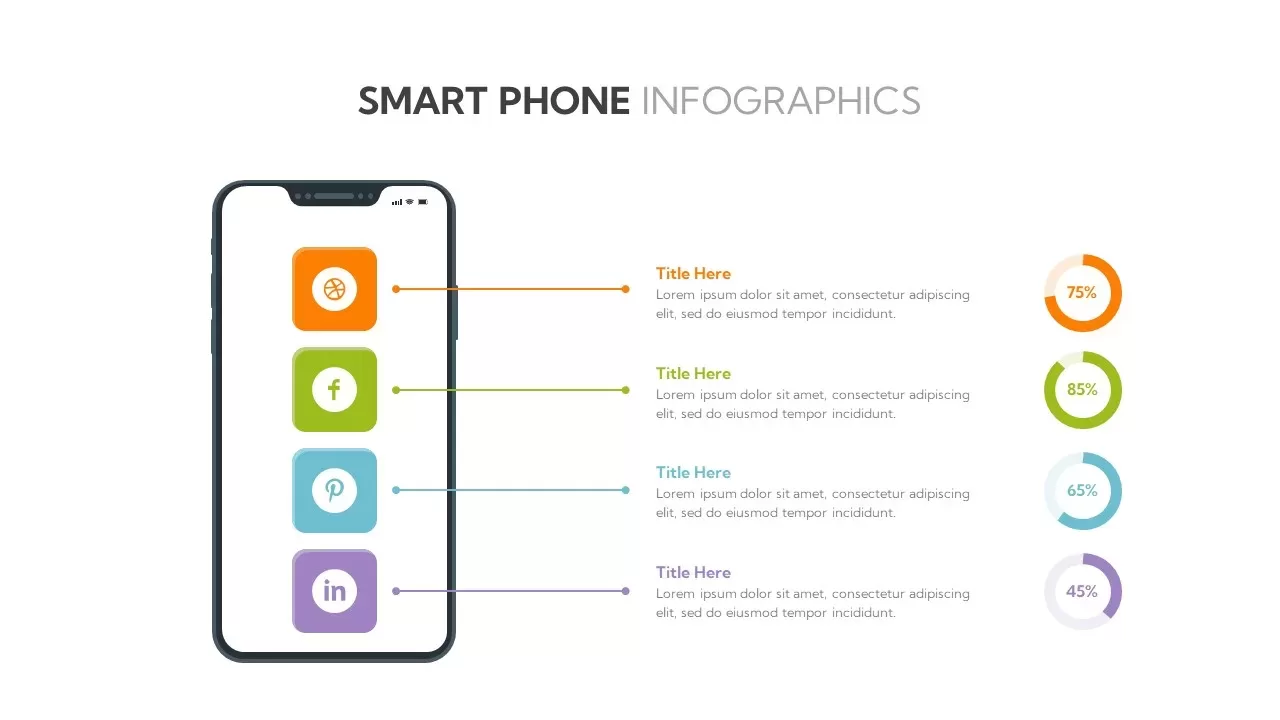
Social Media Smartphone Infographic Template for PowerPoint & Google Slides
Pie/Donut
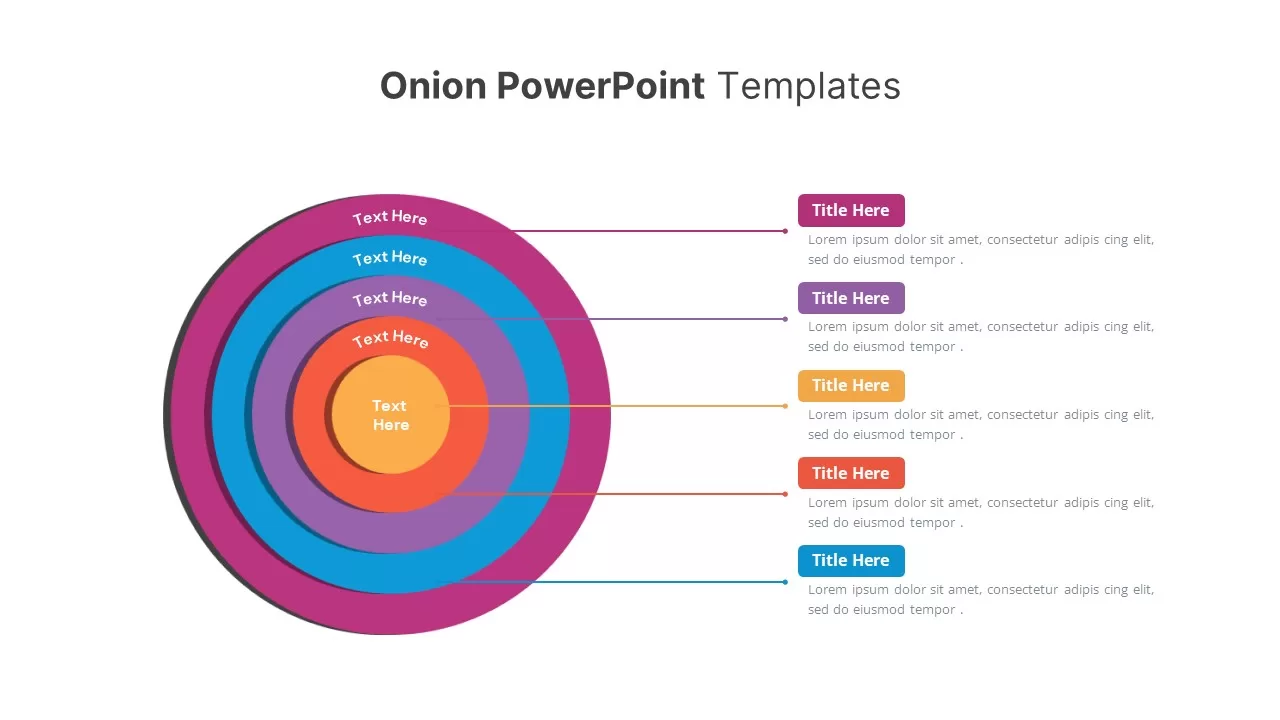
Onion Layer Infographic Diagram Template for PowerPoint & Google Slides
Process
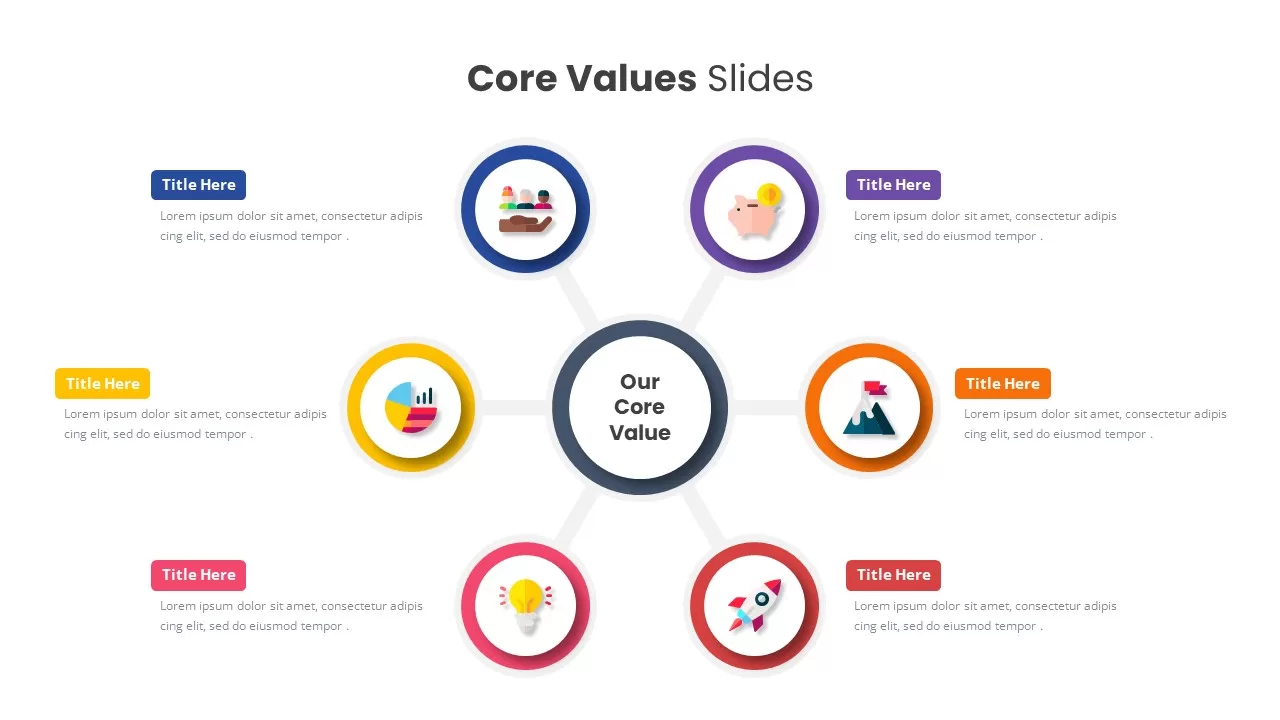
Core Values Infographic Diagram Template for PowerPoint & Google Slides
Circular
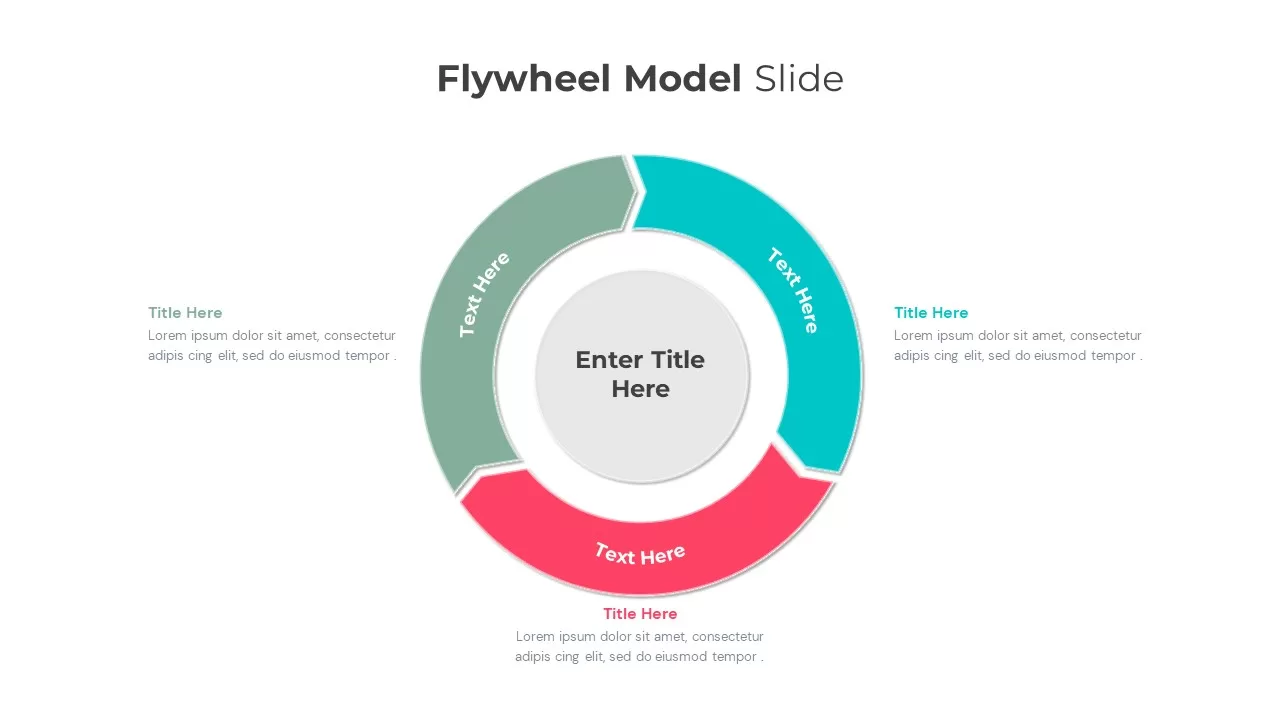
Flywheel Model Infographic Template for PowerPoint & Google Slides
Process

Modern Big Data Infographic Deck Template for PowerPoint & Google Slides
Decks
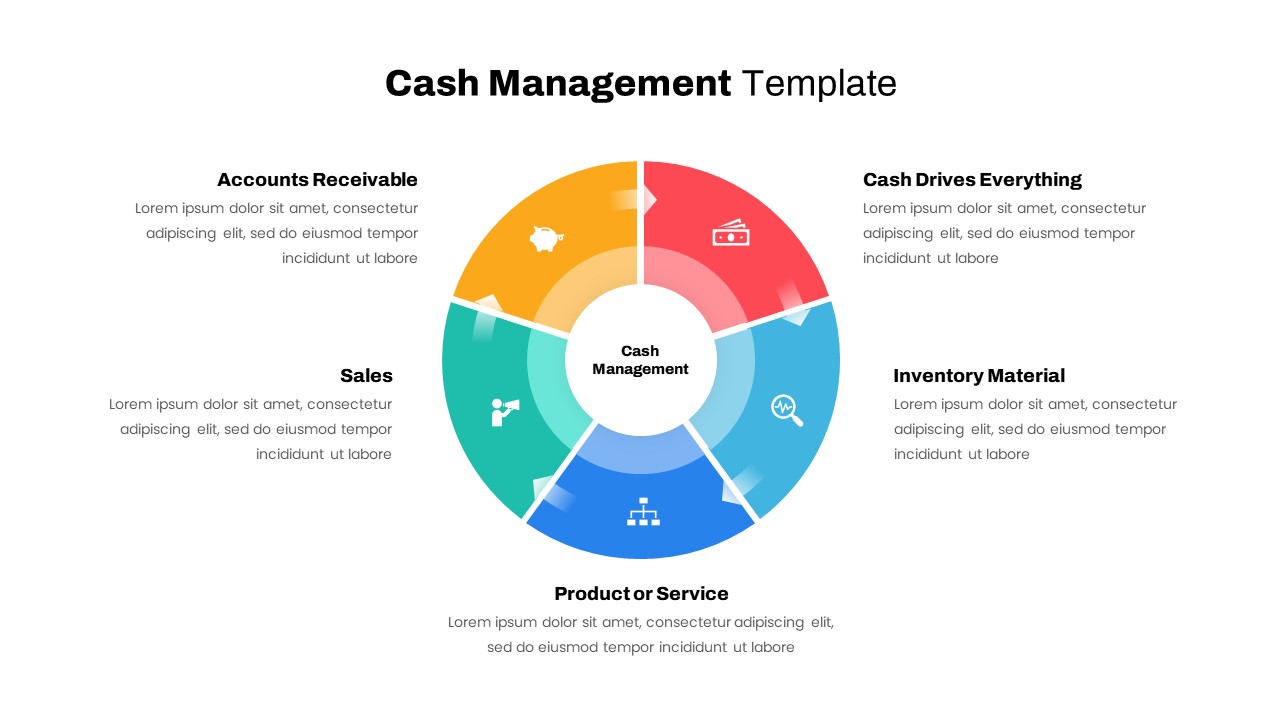
Cash Management Infographic Diagram Template for PowerPoint & Google Slides
Circular
Free ChatGPT Infographic Presentation Template for PowerPoint & Google Slides
Pitch Deck
Free
Free Radiation Hub and Spoke Infographic Template for PowerPoint & Google Slides
Circular
Free

Free Colorful Infographic Slide Pack Template for PowerPoint & Google Slides
Roadmap
Free