100% Stacked Bar Chart PowerPoint Template
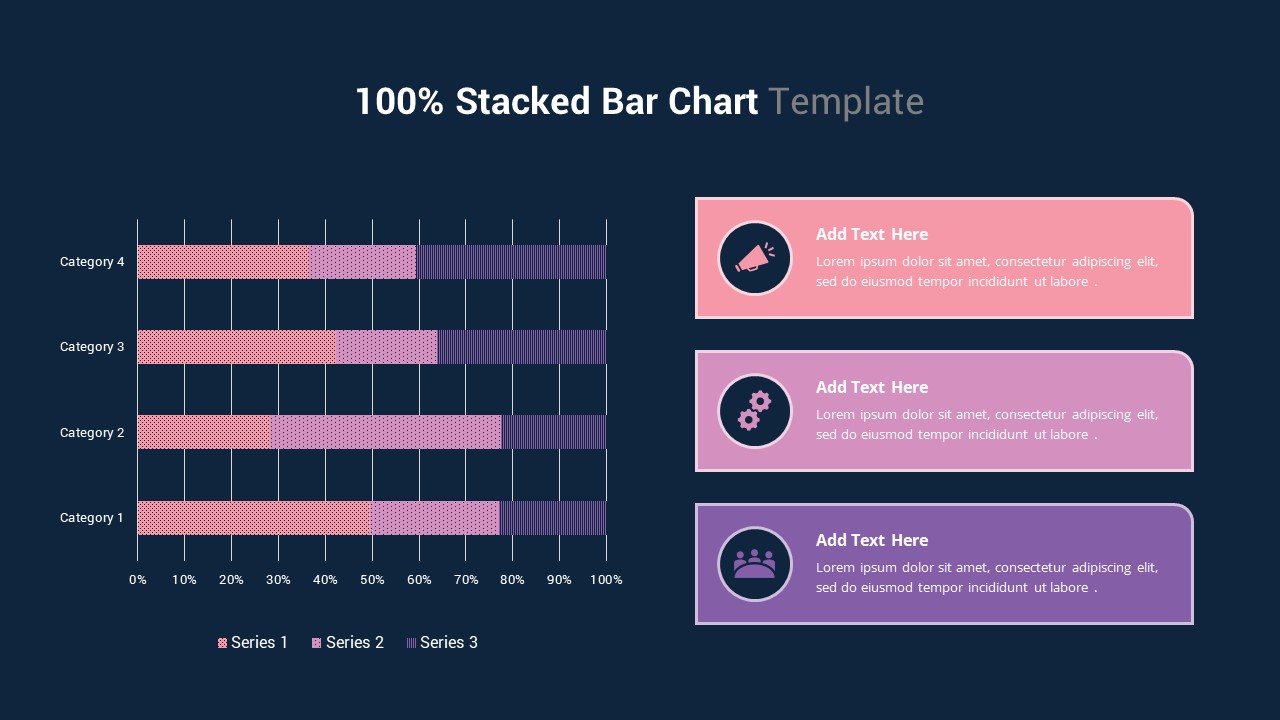
Analyze proportional information with our 100% Stacked Bar Chart PowerPoint Template. We have created an editable and visually organized chart that helps presenters explain how different data series contribute to individual categories. A 100% stacked bar chart displays each category as a complete bar and divides it into sections according to the percentage represented by each series. This visualization makes it easier to compare distributions and understand the relationship between multiple components. This PPT chart template can be useful for business reports, marketing analysis, financial presentations, sales reviews, research findings, and educational content. Additionally, you can adjust the chart data and supporting elements to fit your presentation topic. Managers, analysts, researchers, and business professionals can use this diagram to present numerical findings and discuss proportional differences in meetings and reports.
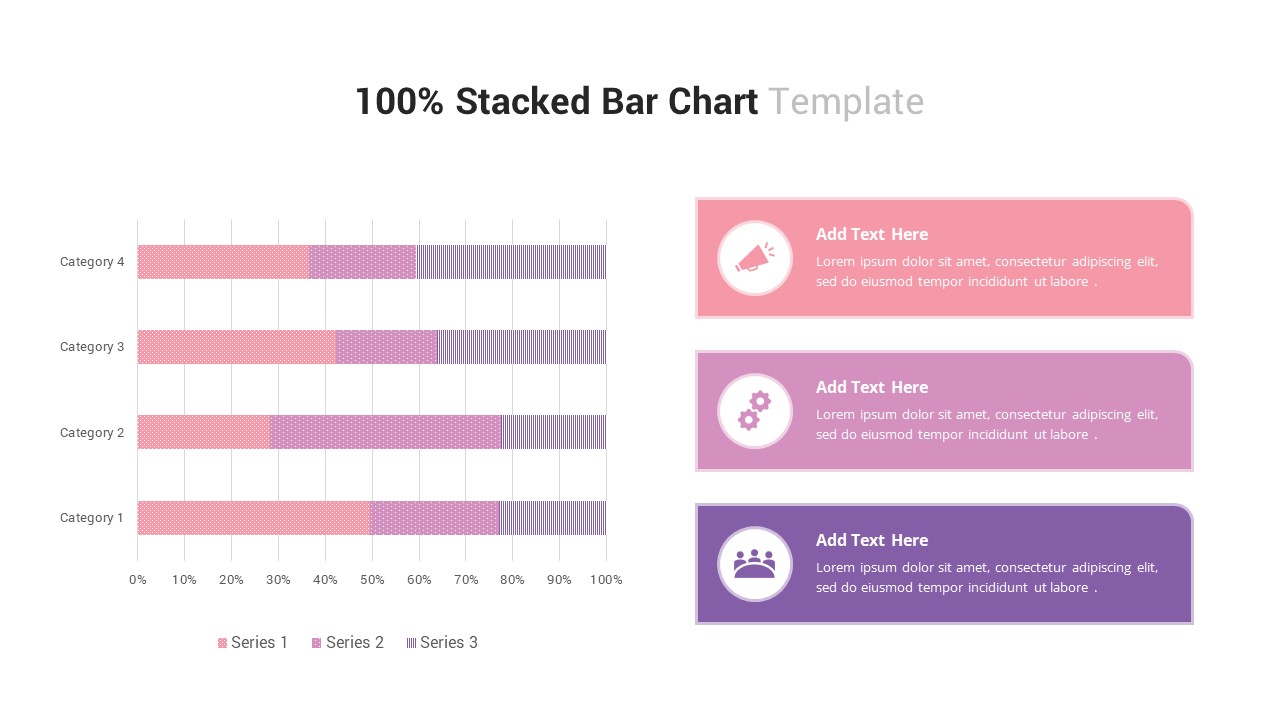
The 100% stacked bar chart template for PowerPoint presentations includes four horizontal category bars divided into three data series. Each bar reaches the 100% mark, while the individual sections vary in size according to their percentage contribution. A percentage scale below the chart provides a reference for interpreting and comparing the segments.
The three series are represented through different shades and patterned textures, making it easier to distinguish the individual portions within every category. The consistent horizontal arrangement also allows viewers to compare the composition of one category with another.
The slide combines the chart with three editable information panels positioned on the right. Each panel contains a circular icon, a heading, and a short description area, giving presenters additional space to explain observations or highlight important data points.
Users can apply this design to sales performance, customer surveys, market analysis, financial reporting, resource distribution, or other percentage-based presentations. Presenters can customize the category names, chart values, series labels, icons, colors, and descriptions in Microsoft PowerPoint. Modify the visual components to align the slide with your presentation subject and branding requirements.
Download the 100% stacked bar chart PowerPoint template to transform percentage-based information into a structured visual presentation.
Login to download this file

Item ID
SB03263


Related Templates

100% Stacked Column Chart PowerPoint Template
Bar/Column
Multi-Series Stacked Bar Chart PowerPoint Template
Bar/Column
Animated Stacked Bar Chart PowerPoint Template
Bar/Column
Stacked Bar Chart Template
Bar/Column
100-Day Action Plan PowerPoint Template
Business Plan
First 100 Days Action Plan PowerPoint Template
Timeline
Dynamic Three-Series Stacked Area Chart Template for PowerPoint & Google Slides
Comparison Chart
Stacked Waterfall Chart PowerPoint Template
Bar/Column
Stacked Gantt Chart PowerPoint Template
Gantt Chart
Stacked Column Chart Template
Bar/Column
Free

Stacked Cubes Pyramid PowerPoint Template
Pyramid
Stacked Cubes Pyramid Six-Option Diagram Template for PowerPoint & Google Slides
Pyramid
Elegant Stacked Photo Collage Layout Template for PowerPoint
Graphics
Creative 3d Stacked Circle Infographics PowerPoint
Pyramid
3D Bar Chart Infographics Template for PowerPoint Template
Bar/Column
Animated Clustered Bar Chart Template for PowerPoint
Bar/Column
Waterfall Bar Chart Template for PowerPoint & Google Slides
Bar/Column
Mirror Bar Chart PowerPoint Template
Charts
Bar of Pie Chart PowerPoint Template
Pie/Donut
Bar Gantt Chart PowerPoint Template
Gantt Chart