Year Annual Financial Results PowerPoint Template
Comprehensive Year Annual Financial Results PowerPoint Template for Professional Presentations
The Annual Financial Results PowerPoint Template is a report presentation tool designed to showcase your company’s performance over the past year. Featuring an array of statistical diagrams and metric slides, this template makes it easy to convey key achievements and future expectations. Fully editable and suitable for corporations, SMEs, and business enterprises, it provides a clear and concise overview of your strategic goals, product/service performance, and areas for improvement. With this template, stakeholders and clients can gain valuable insights into your company’s progress, helping them understand how effectively you are managing your objectives and identifying growth opportunities.
How do we present financial results in PPT?
Crafting a compelling financial PPT requires a clear structure. Open with a concise executive summary, emphasizing achievements and key figures. Leverage graphs and charts to bring data on revenue, profits, and expenses to life. Dedicate slides to detailed income statements, balance sheets, and cash flow statements. Highlight KPIs and track progress against past performance. Wrap up by summarizing future projections and strategic goals, while acknowledging areas for improvement and fostering transparency.
Year Annual financial results template for PowerPoint is best used in annual shareholder meetings, quarterly business reviews, financial performance presentations, Board meetings, investor updates, and corporate financial reports. Below are more uses of this finance review PowerPoint:
Board of Directors Reviews: Provide a detailed overview of the company’s financial health and progress over the past year, aiding in strategic decision-making and future planning.
Internal Team Meetings: Share yearly financial results with management and staff to align everyone with the company’s financial performance, goals, and areas for improvement.
Public Reports and Press Releases: Create visually appealing presentations for public disclosures, ensuring transparency and clarity in financial communications with external stakeholders and the media.
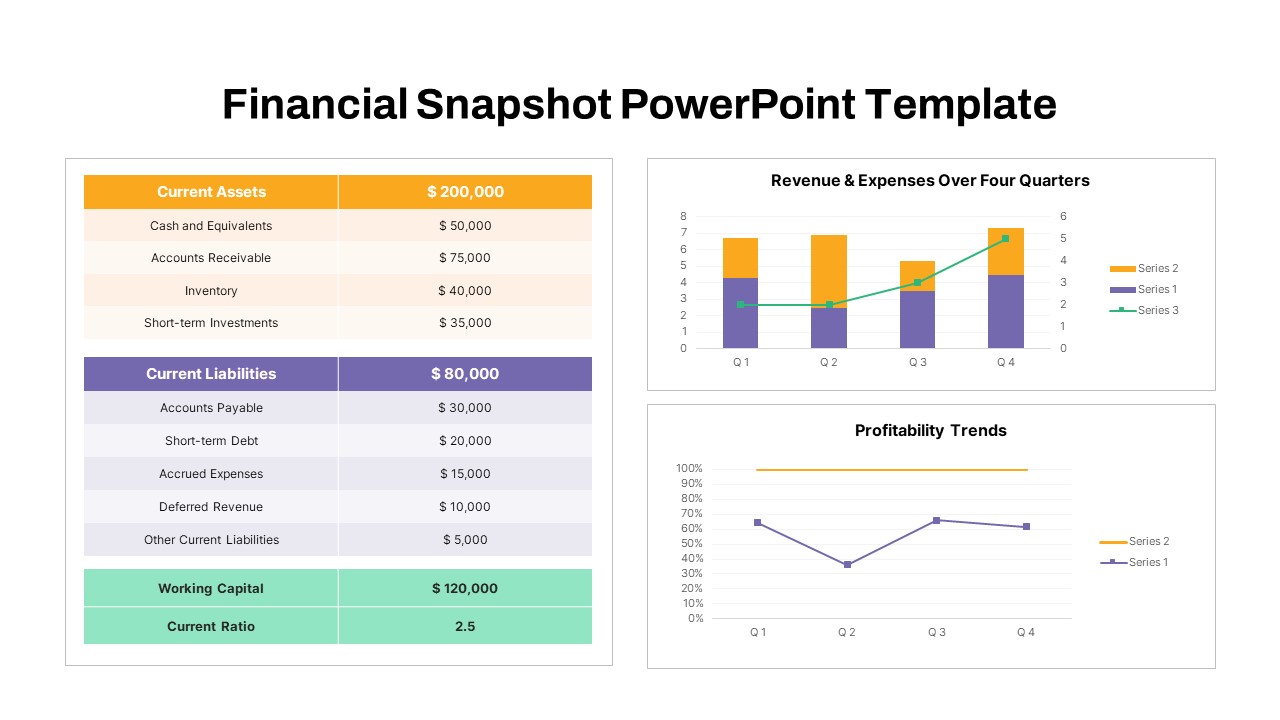
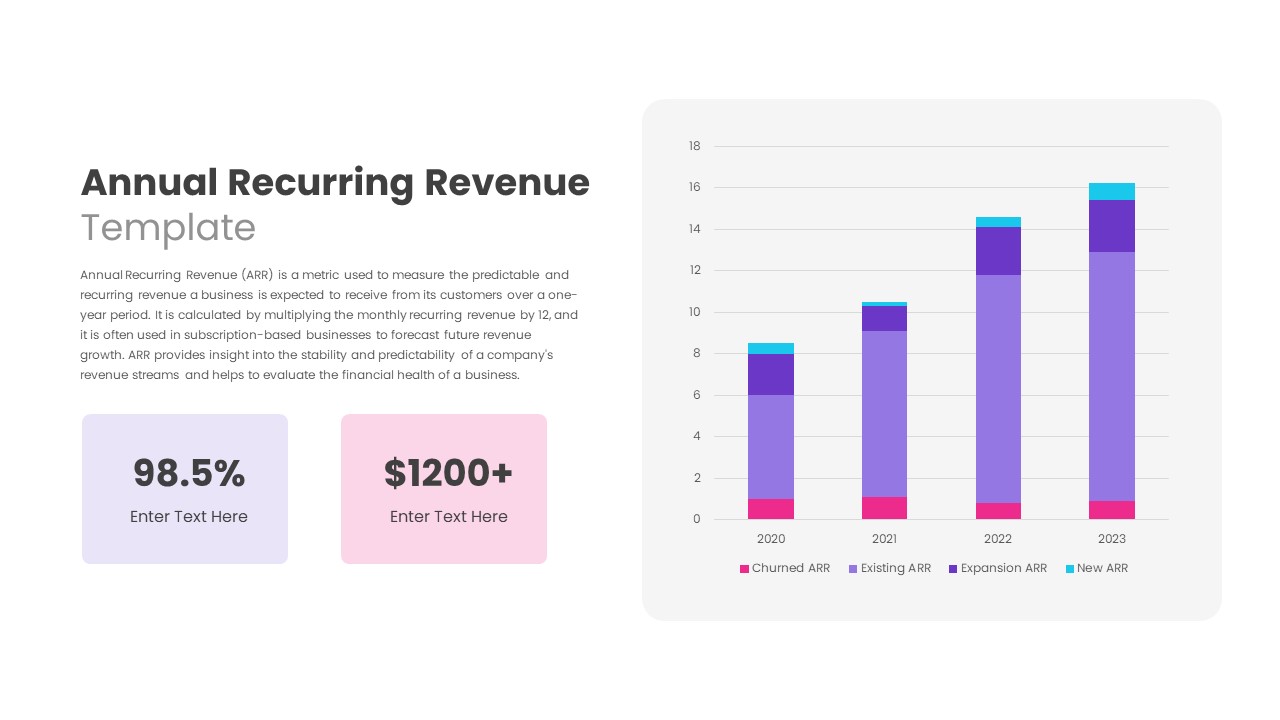
PowerPoint annual result presentation template offers 2 design variations to imprint your data in brief. The first slide is a table slideshow in columns wherein you can display adjusted earnings per share, organic sales growth, segment margin expansion, free cash flow and capital deployment. You highlight the details of each metric on the enlarged column at the end. The second slide is a dashboard wherein you can show capital allocation priorities, a strong, consistent, sustainable business, customer health separation completion, sales by business segment, platforms/products, and sales by geographic area. This slide contains a pie chart, line graph, growth chart, and bar chart to brief your data. Get it now!
Login to download this file


