Procurement KPI Dashboard & Metrics Template for PowerPoint & Google Slides
Description
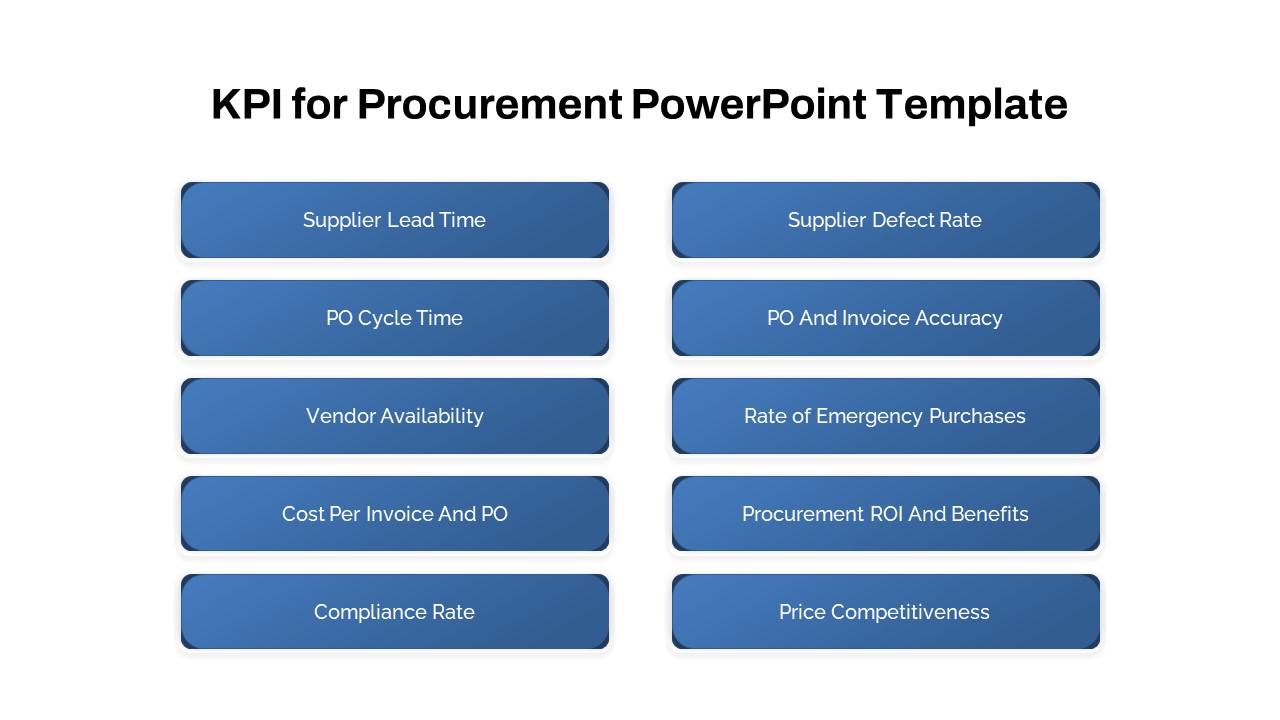
Leverage this procurement KPI dashboard slide to highlight ten critical metrics—supplier lead time, supplier defect rate, PO cycle time, PO and invoice accuracy, vendor availability, emergency purchase rate, cost per invoice and PO, procurement ROI, compliance rate, and price competitiveness—in a balanced two-column layout. Each KPI is enclosed in a rounded rectangle with a subtle blue gradient and drop shadow for clear visual separation against a white background, creating a polished, professional look.
Fully customizable via master slides, this asset empowers presenters to edit KPI labels, adjust gradient fills, modify shape sizes, or swap icons in seconds. The design is built on a uniform grid to preserve alignment when rearranging or duplicating KPI blocks. Vector-based elements guarantee high-resolution clarity on screens or in print, while text placeholders let you update metrics without manual reformatting. Transition seamlessly between PowerPoint and Google Slides—no formatting issues, no extra tweaks.
Ideal for quarterly business reviews, supplier performance meetings, or C-suite presentations, this slide streamlines data-driven discussions by organizing KPIs that drive sourcing strategy. Use it to compare vendor performance, track operational efficiency, or demonstrate procurement ROI during board meetings. The layout also supports animations for dynamic reveals, maintaining audience engagement in virtual or in-person settings.
Optimized for seamless collaboration, this slide supports co-editing in Google Slides and offline work in PowerPoint. Real-time chart updates, linked data tables, and theme presets maintain consistency across presentations. Reduce development time with prebuilt KPI blocks and intuitive design. Customize fonts, borders, and layout effortlessly to align with brand guidelines, then duplicate dashboards to scale reporting frameworks across departments.
Who is it for
Procurement professionals, supply chain managers, and operations directors reporting on supplier and purchasing performance. CFOs, consultants, and executive teams can leverage this dashboard to align on cost-saving initiatives and efficiency goals.
Other Uses
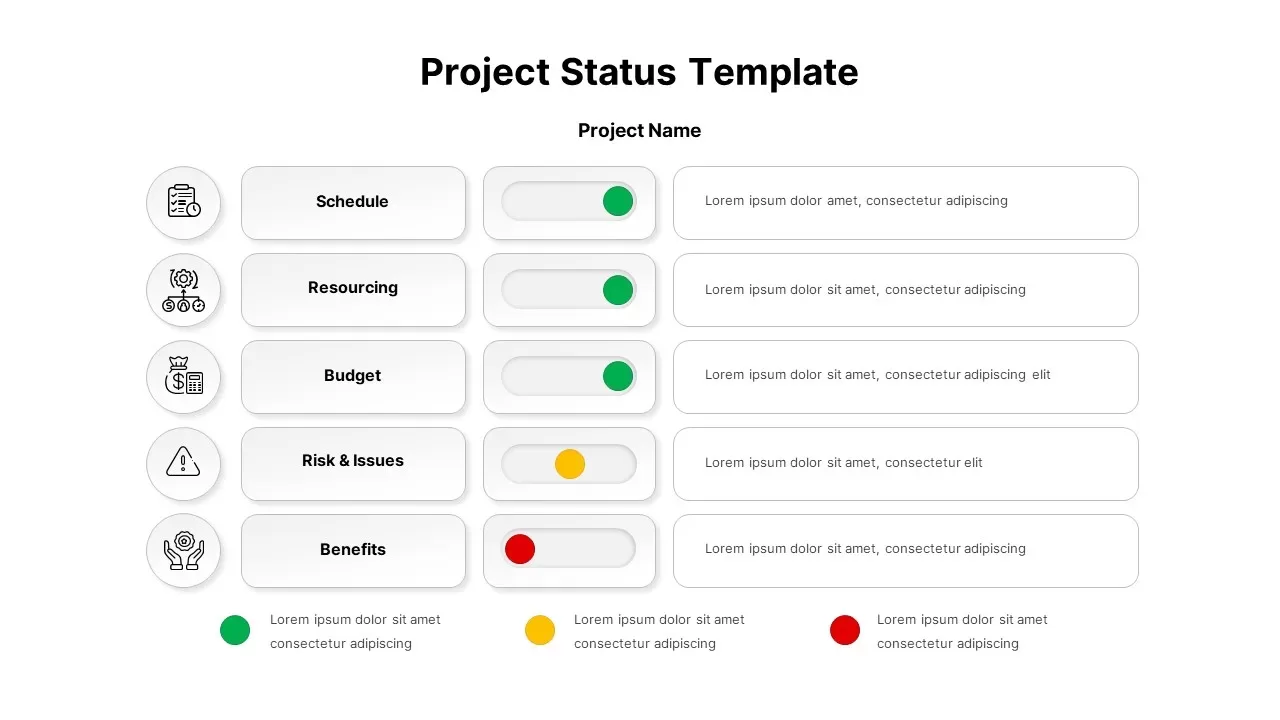
Repurpose the layout to showcase sales KPIs, marketing metrics, HR dashboards, or project progress indicators. Simply relabel each block, adjust color accents, and replace KPI titles to suit any department’s performance review.
Login to download this file


