Consumer Decision Journey Radial Diagram Template for PowerPoint & Google Slides


Description
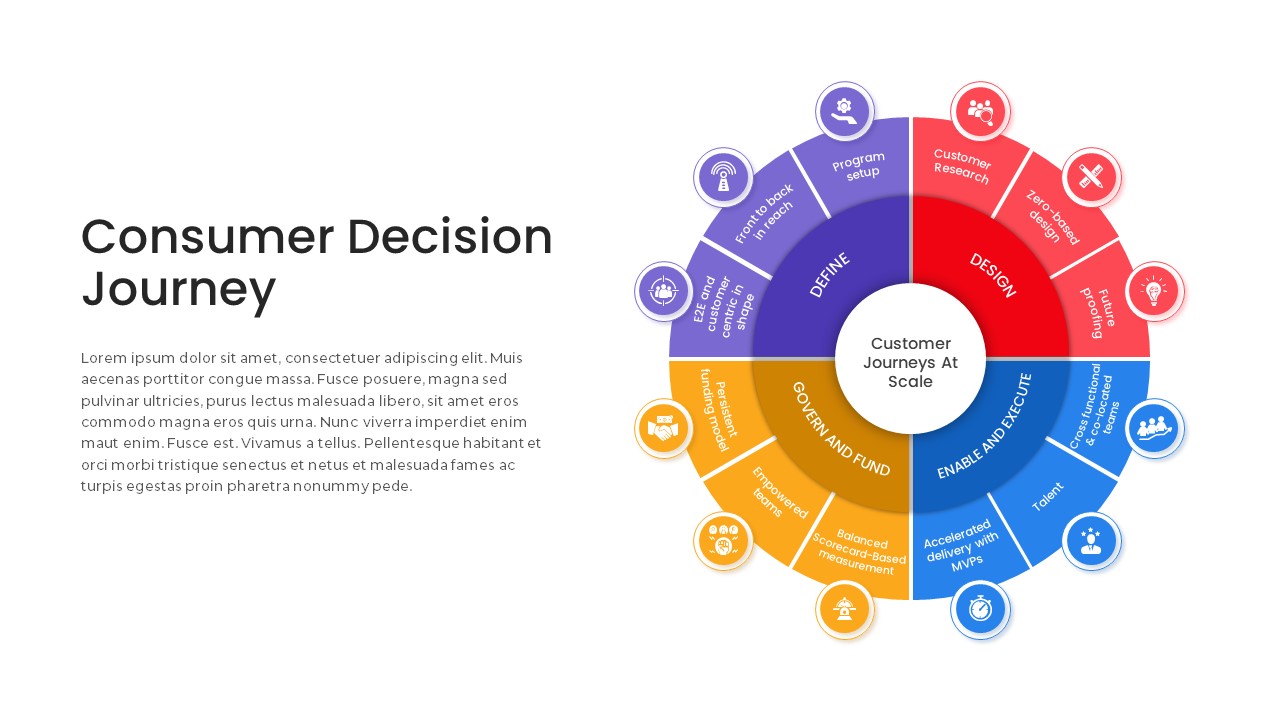
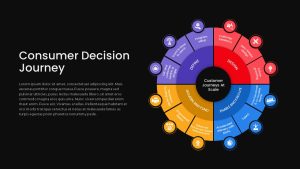
Leverage this radial consumer decision journey slide to map customer touchpoints across four core phases—Define, Design, Enable & Execute, and Govern & Fund—with clarity and visual balance. The circular infographic features a centralized hub labeled “Customer Journeys At Scale,” surrounded by four colored quadrants: purple for Define, red for Design, blue for Enable & Execute, and orange for Govern & Fund. Each quadrant is subdivided into three segments with concise labels—E2E and customer-centric IT shape, front-to-back IT reach, program setup; customer research, zero-based design, future proofing; cross-functional co-located teams, talent, accelerated delivery with MVPs; balanced scorecard-based measurement, empowered teams, persistent funding model—each paired with a representative icon to reinforce key concepts and improve retention. The modern flat design employs subtle drop shadows, crisp typography, and fully editable vector shapes, ensuring seamless customization of colors, labels, and icons via master slides.
Engineered for both PowerPoint and Google Slides, this template maintains consistent layout integrity across platforms, eliminating formatting issues and streamlining collaboration. Intuitive placeholders allow effortless swapping of text and graphics, while scalable elements guarantee high-resolution clarity on any display. Whether you’re presenting a strategic transformation roadmap, aligning stakeholders on process enhancements, or guiding cross-functional teams through change initiatives, this radial framework offers an engaging, structured format that fosters insight-driven discussions and decision-making.
Beyond customer journey mapping, repurpose this asset to illustrate product life cycles, service design workflows, program governance models, or innovation roadmaps. Adjust segment labels, recolor quadrants, or duplicate sections to highlight additional phases. This versatile radial diagram empowers consultants, project managers, and business analysts to visually communicate complex processes with maximum impact and minimal effort.
Who is it for
Marketing and customer experience leaders, business analysts, consultants, and project managers will benefit from this slide when defining customer-centric programs, designing future-proof initiatives, accelerating MVP delivery, or establishing governance and funding models.
Other Uses
Repurpose this radial framework for product lifecycle mapping, service design sprints, program governance workshops, or innovation roadmaps. Use the editable segments to highlight project milestones, team roles, performance metrics, or cross-departmental workflows in any strategic presentation.
Login to download this file

Item ID
SB03872
Related Templates

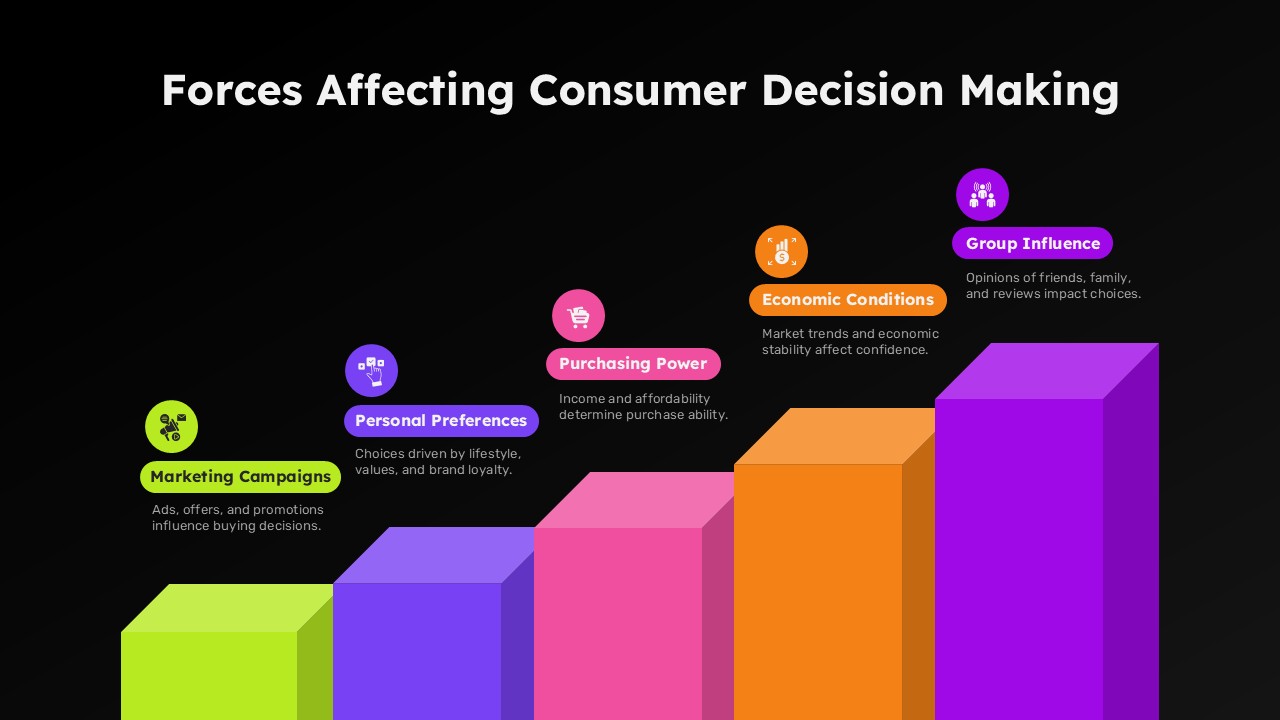
Forces Affecting Consumer Decision Making Template for PowerPoint & Google Slides
Marketing
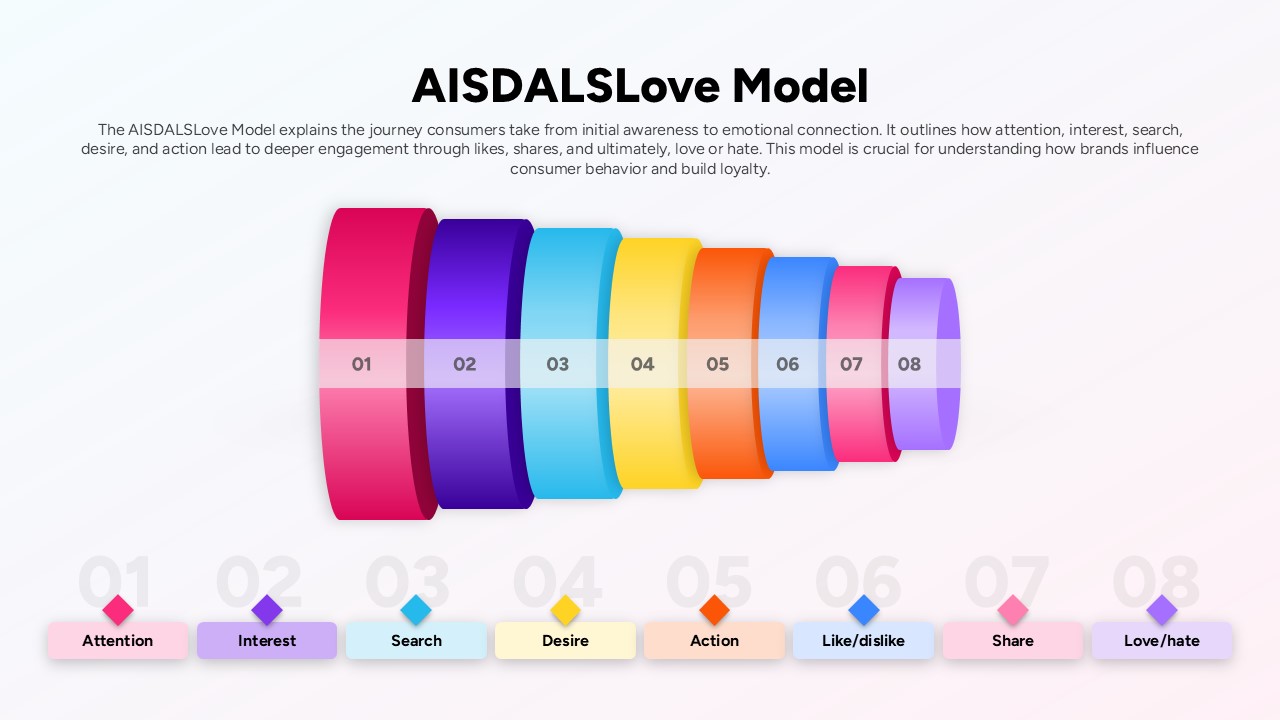
AISDALSLove Consumer Journey Model Slide Template for PowerPoint & Google Slides
Customer Journey
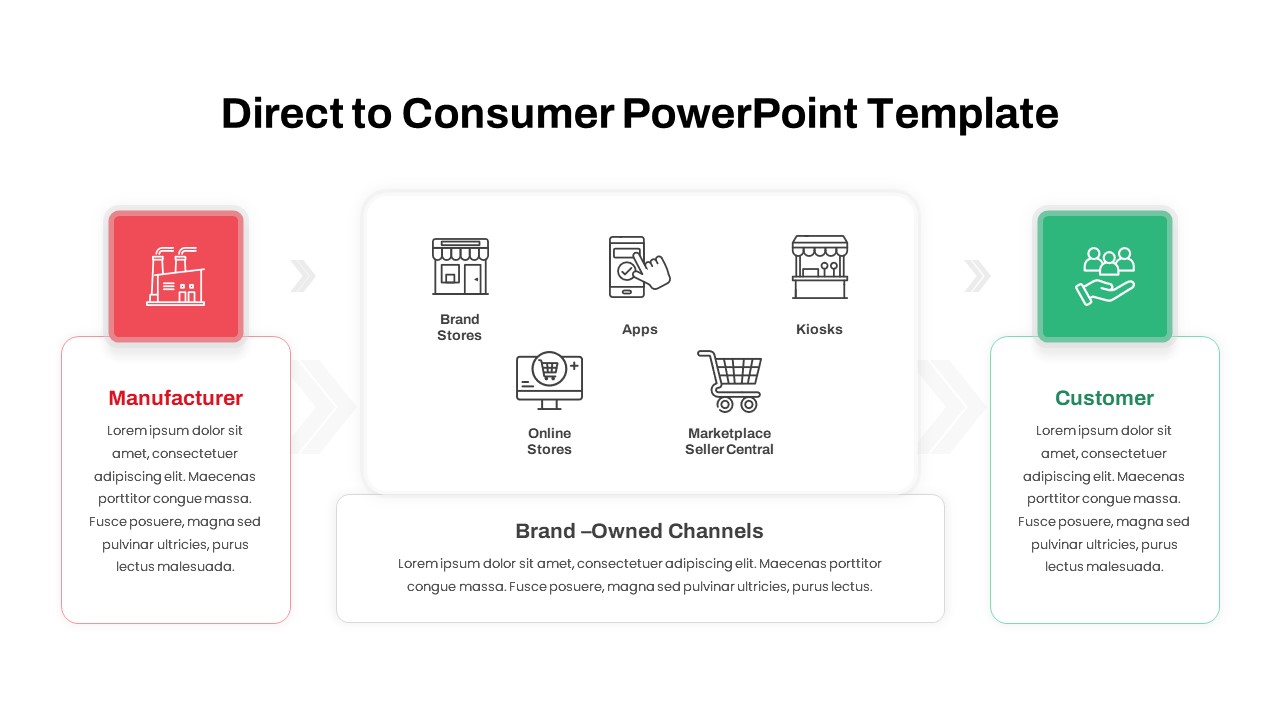
Direct to Consumer Brand Channels Flow Template for PowerPoint & Google Slides
Business Models
Six Arrow Radial Process Diagram template for PowerPoint & Google Slides
Infographics
Risk Management Mind Map Radial Diagram template for PowerPoint & Google Slides
Mind Maps

Eight-Stage Radial Process Flow Diagram Template for PowerPoint & Google Slides
Process
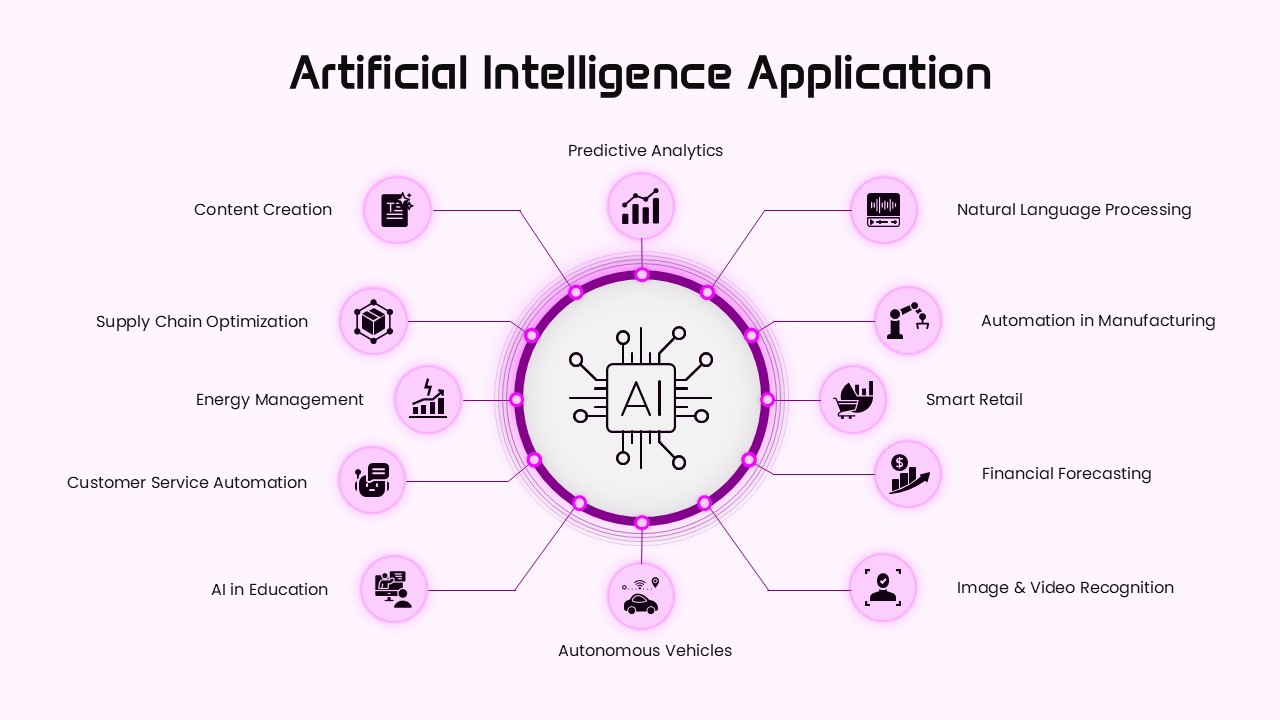
AI Applications Radial Hub Diagram Template for PowerPoint & Google Slides
Circular
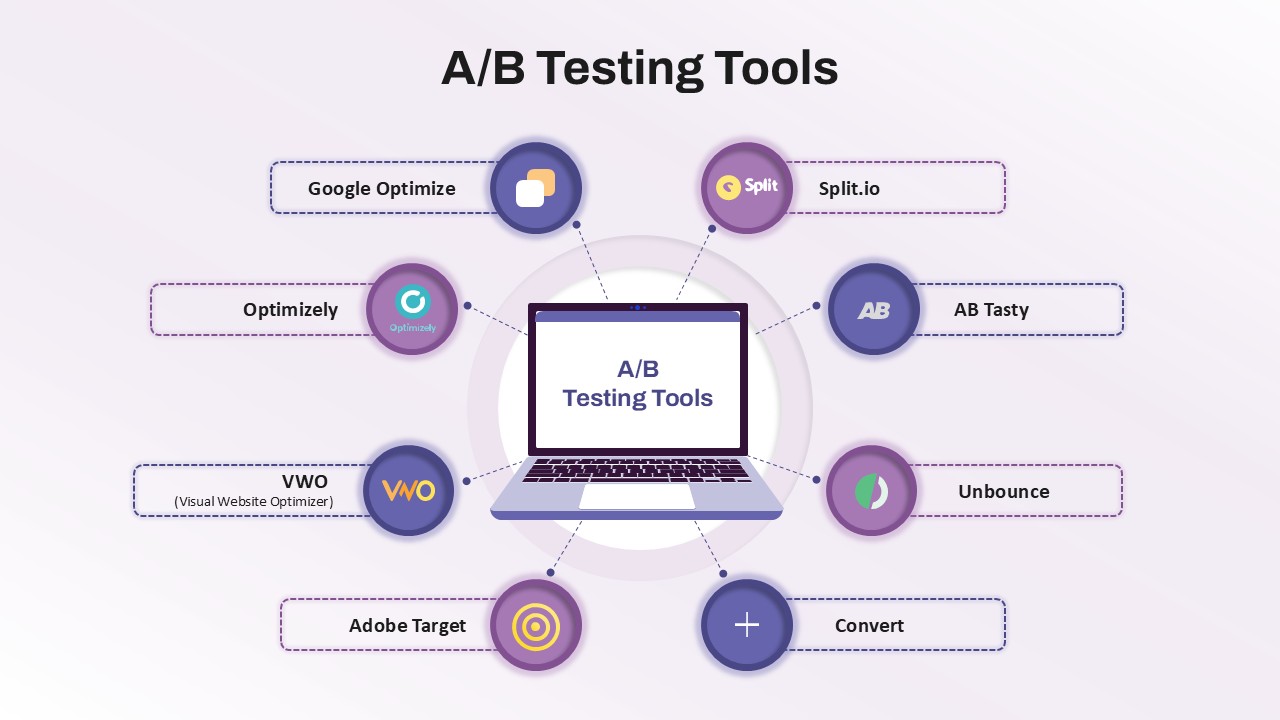
A/B Testing Tools Radial Diagram Template for PowerPoint & Google Slides
Information Technology
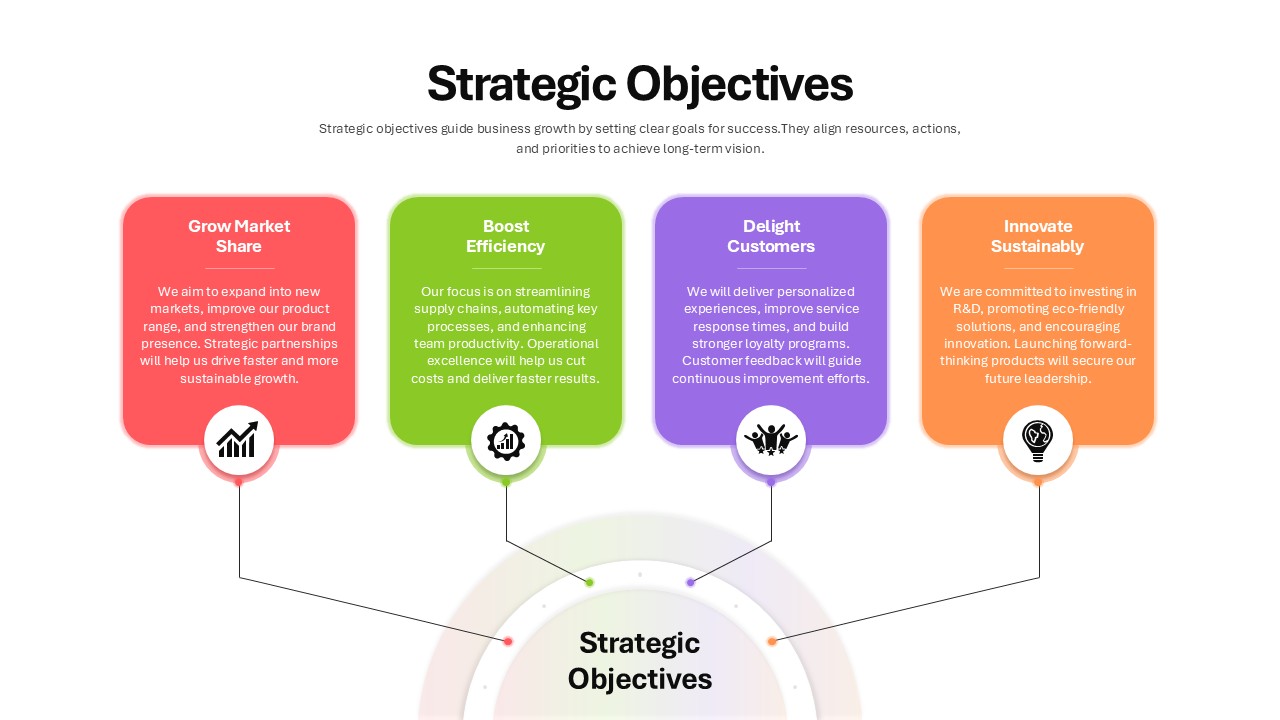
Four Strategic Objectives Radial Diagram Template for PowerPoint & Google Slides
Business Strategy
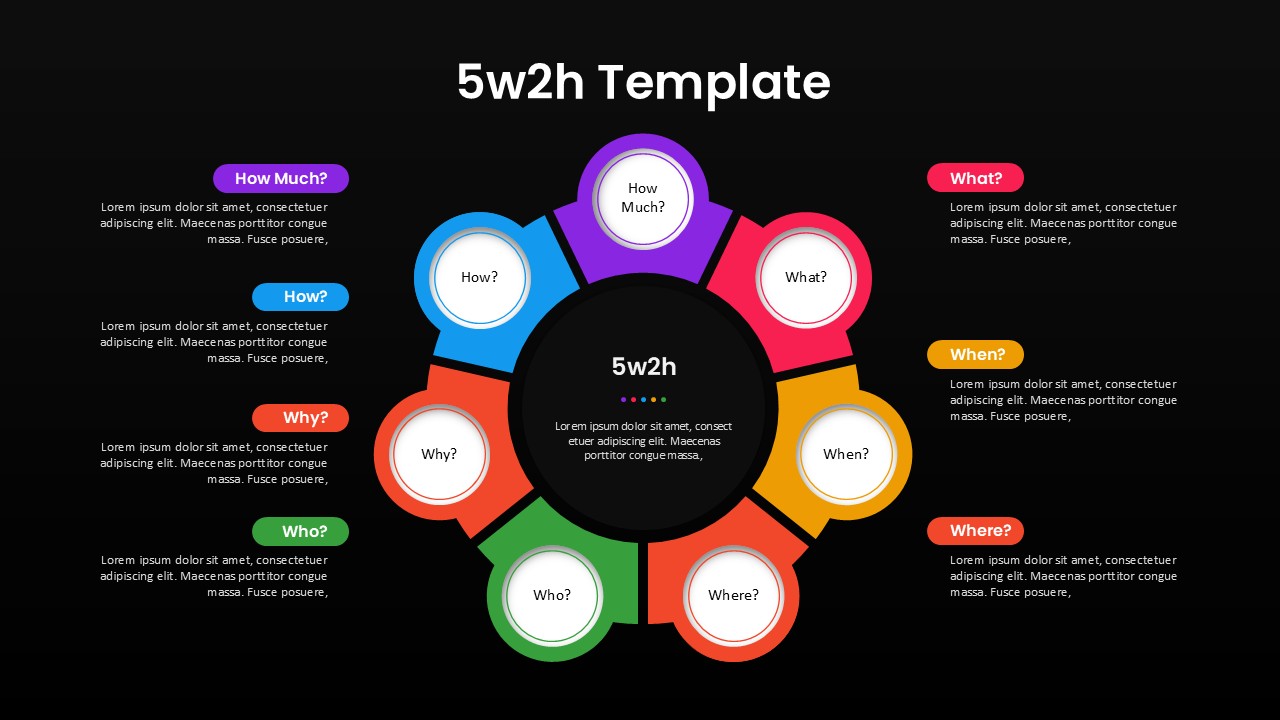
5W2H Analysis Radial Diagram Template for PowerPoint & Google Slides
Decision Tree
Radial Bar Chart Diagram for PowerPoint & Google Slides
Bar/Column
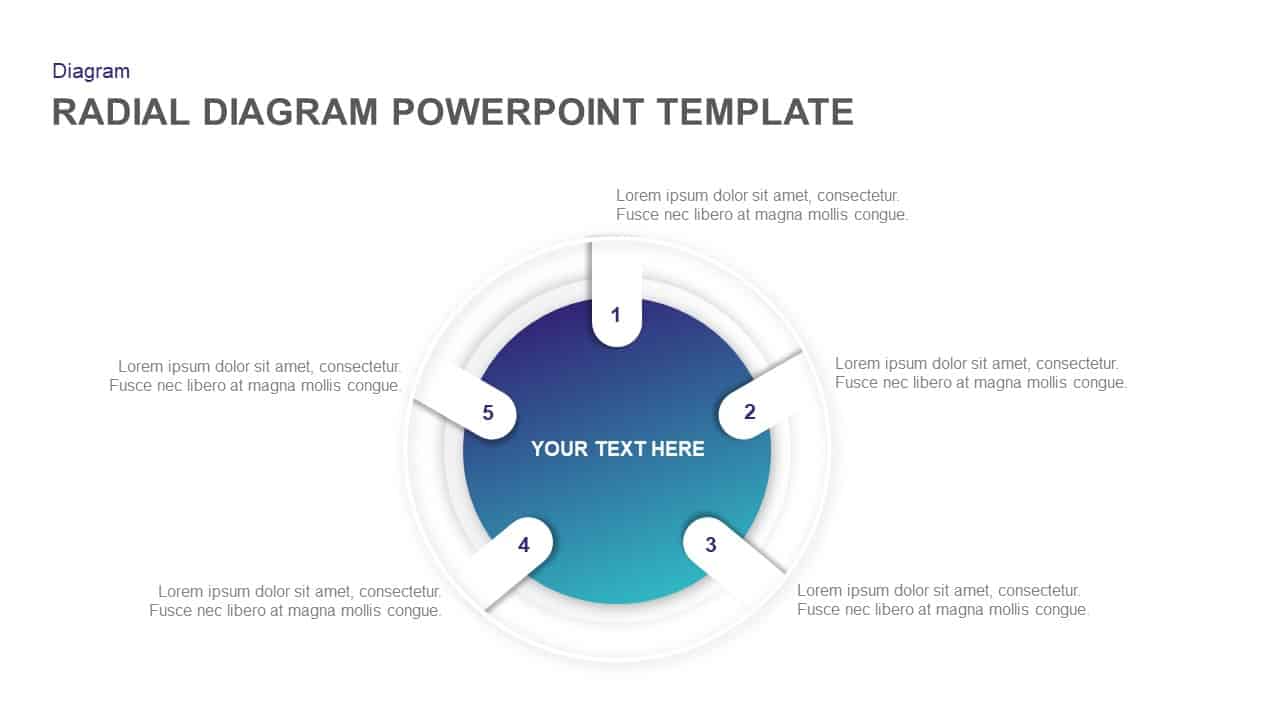
Radial Diagram for PowerPoint & Google Slides
Process

Colorful Radial Bar Chart Template for PowerPoint & Google Slides
Bar/Column
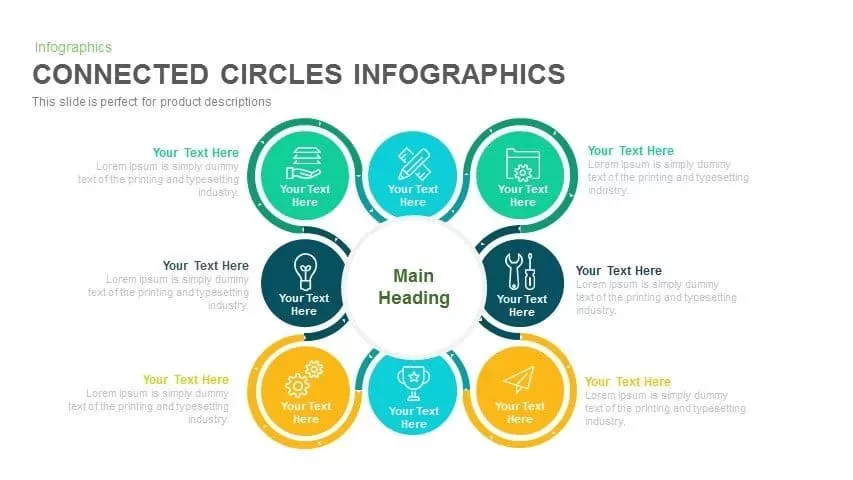
Radial Connected Circles Infographic Template for PowerPoint & Google Slides
Circular
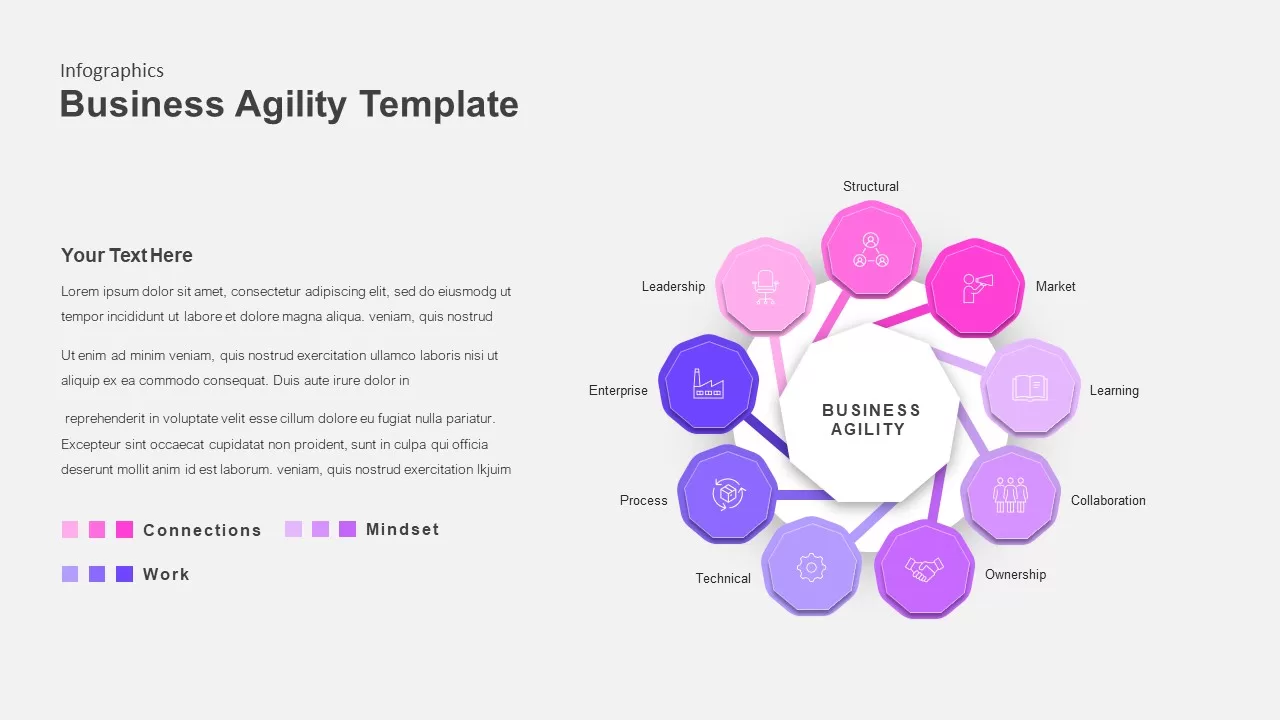
Business Agility Template for PowerPoint
Business
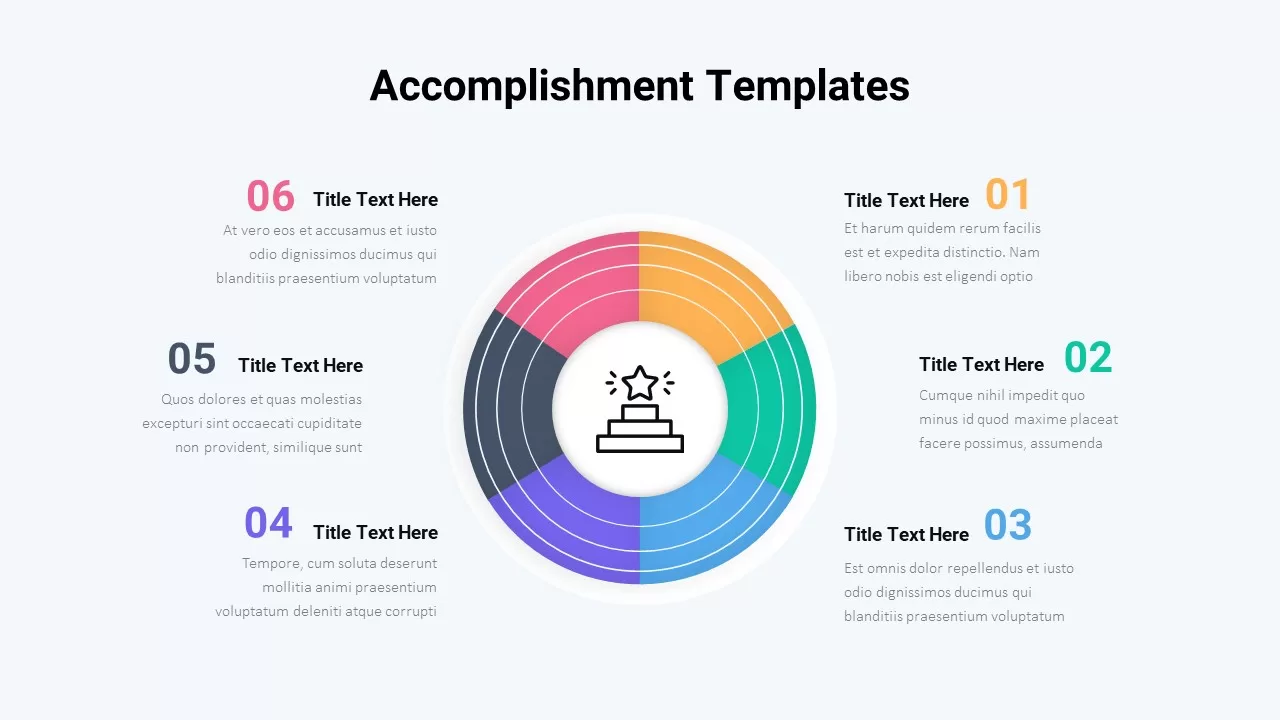
Six-Step Accomplishment Radial Infographic Template for PowerPoint & Google Slides
Accomplishment
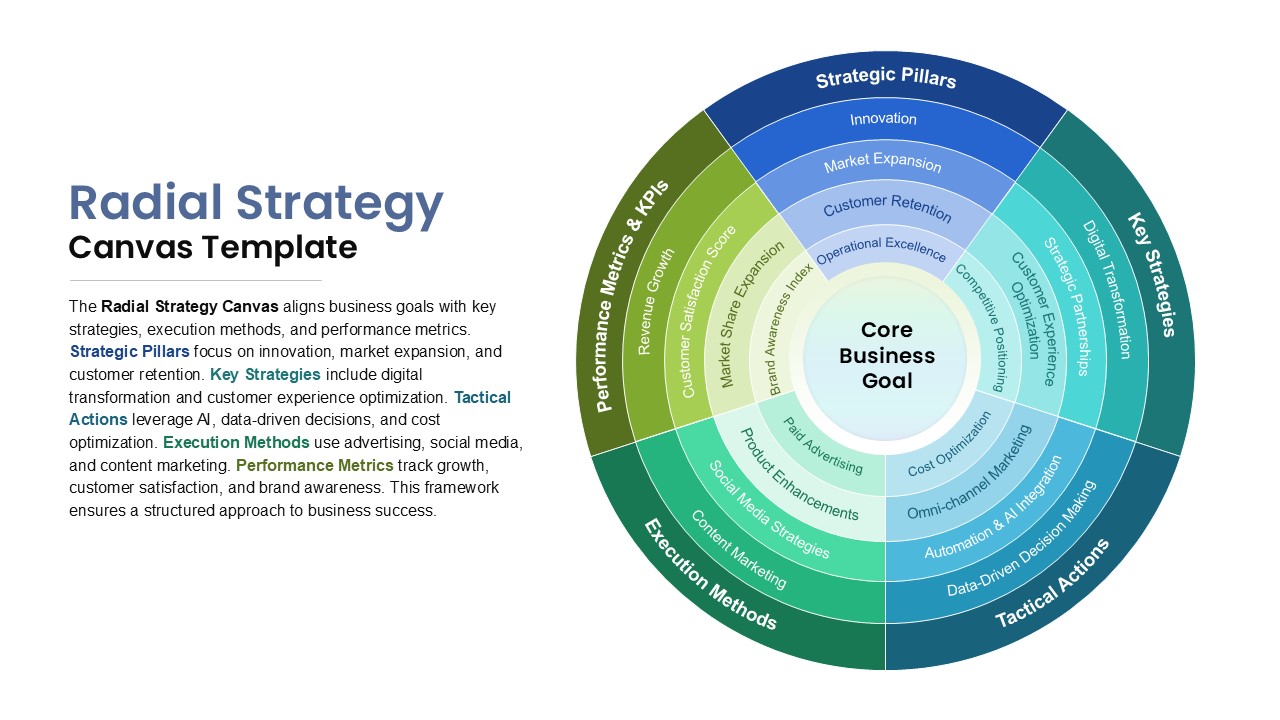
Radial Strategy Canvas for Goals Template for PowerPoint & Google Slides
Circular
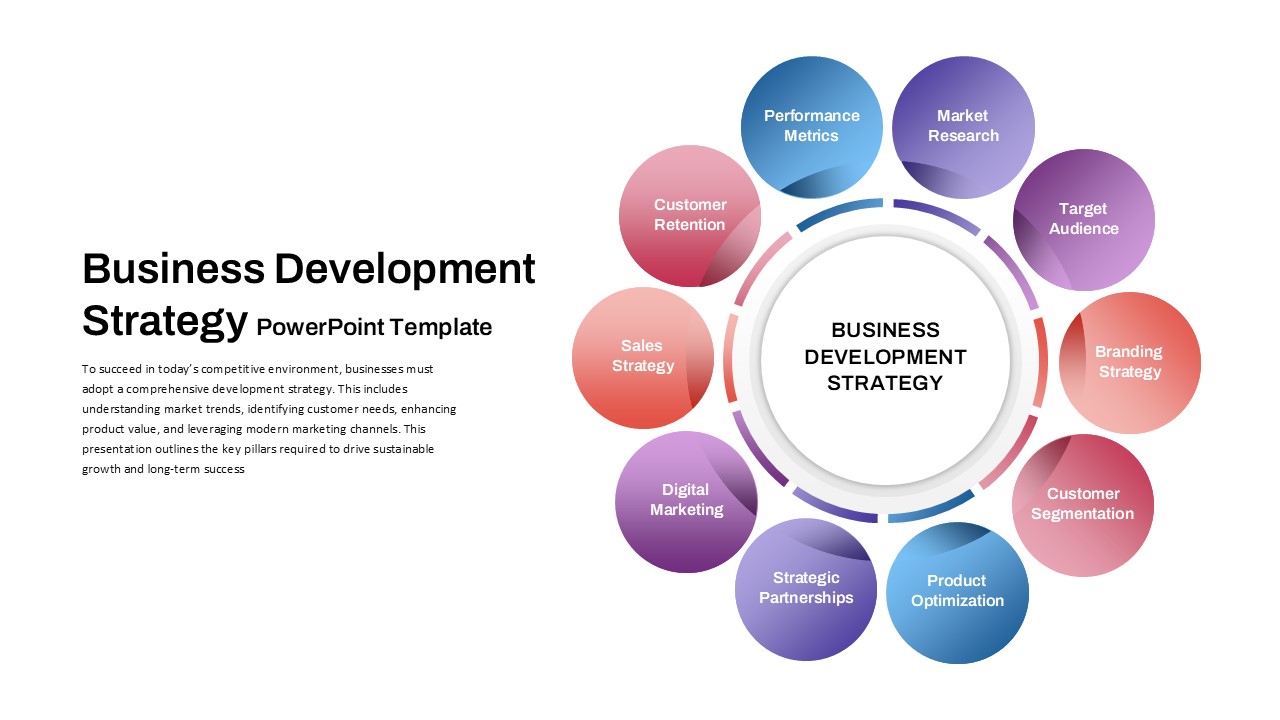
Business Development Strategy Radial Hub Template for PowerPoint & Google Slides
Circular
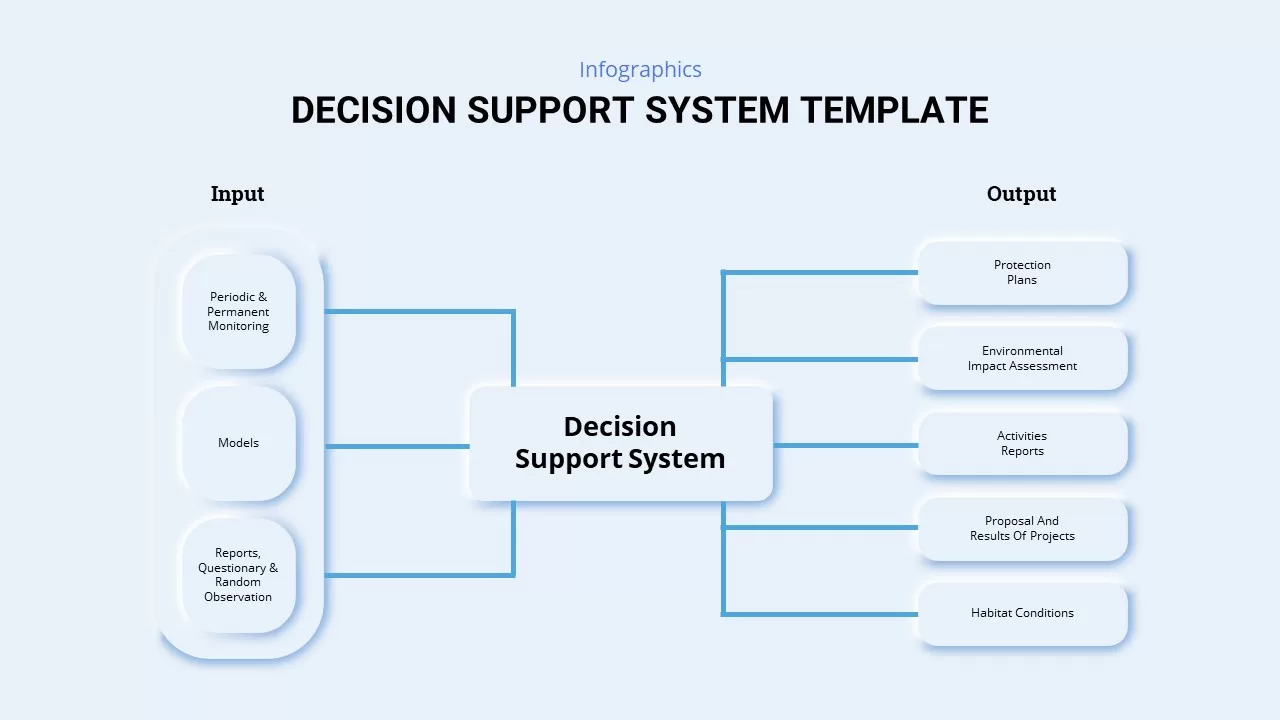
Decision Support System Diagram Template for PowerPoint & Google Slides
Process
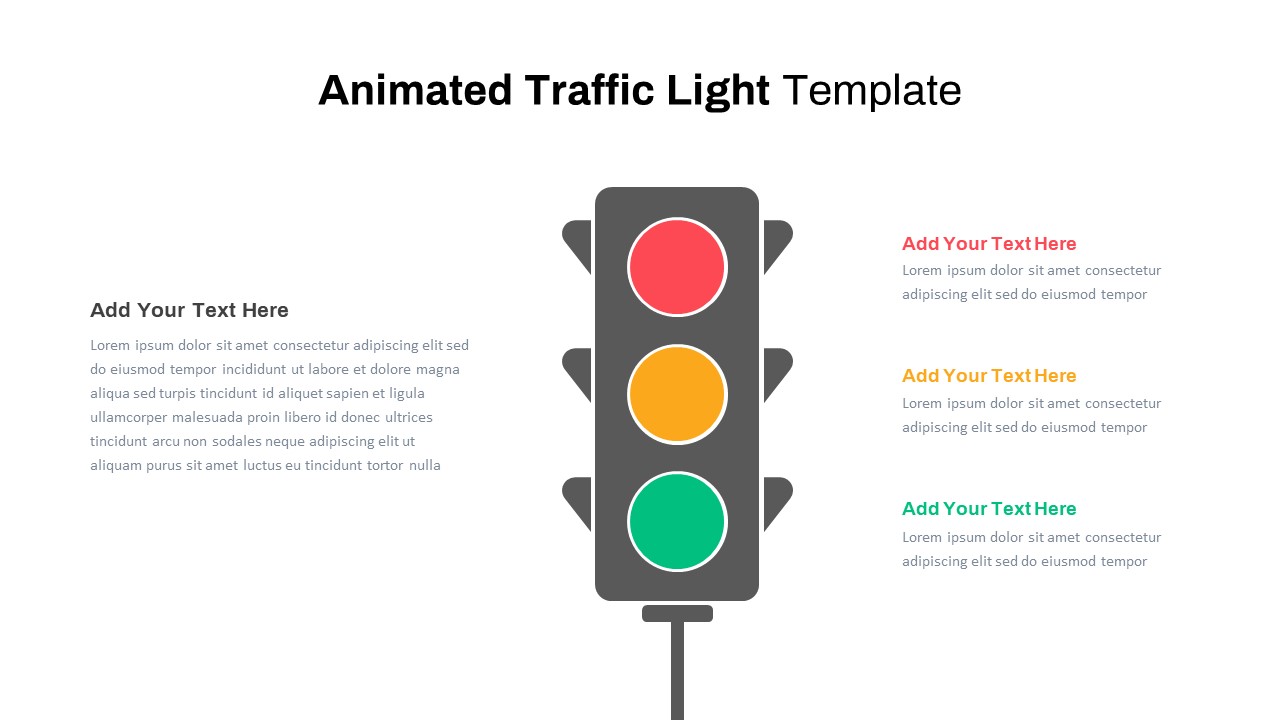
Animated Traffic Light Decision Diagram Template for PowerPoint & Google Slides
Process