5 Staged Linear Process Template for PowerPoint and Keynote
5 Staged Linear Process Diagram PowerPoint Template
5 staged linear process diagram template for PowerPoint presentation contains five and seven stages linear diagrams. The template is ideal for the presentation of linear or successive development of a phenomenon or an event. Linear development or linear process is a continuous horizontal process, in this process, the preceding and subsequent stages are connected together and create a sequence. Business development is either cyclical or linear. Therefore this diagram is ideal to show the linear development of business and organization. A linear relationship is a statistical term used to describe the connection between a variable and a constant. The five stages linear diagram ppt template shows the business timeline model. A business timeline shows the business process in chronological order. It is a business presentation of progress review analysis. The major achievements have been already attained and future prospects of business development can be shown by this five and seven-stage business ppt template.
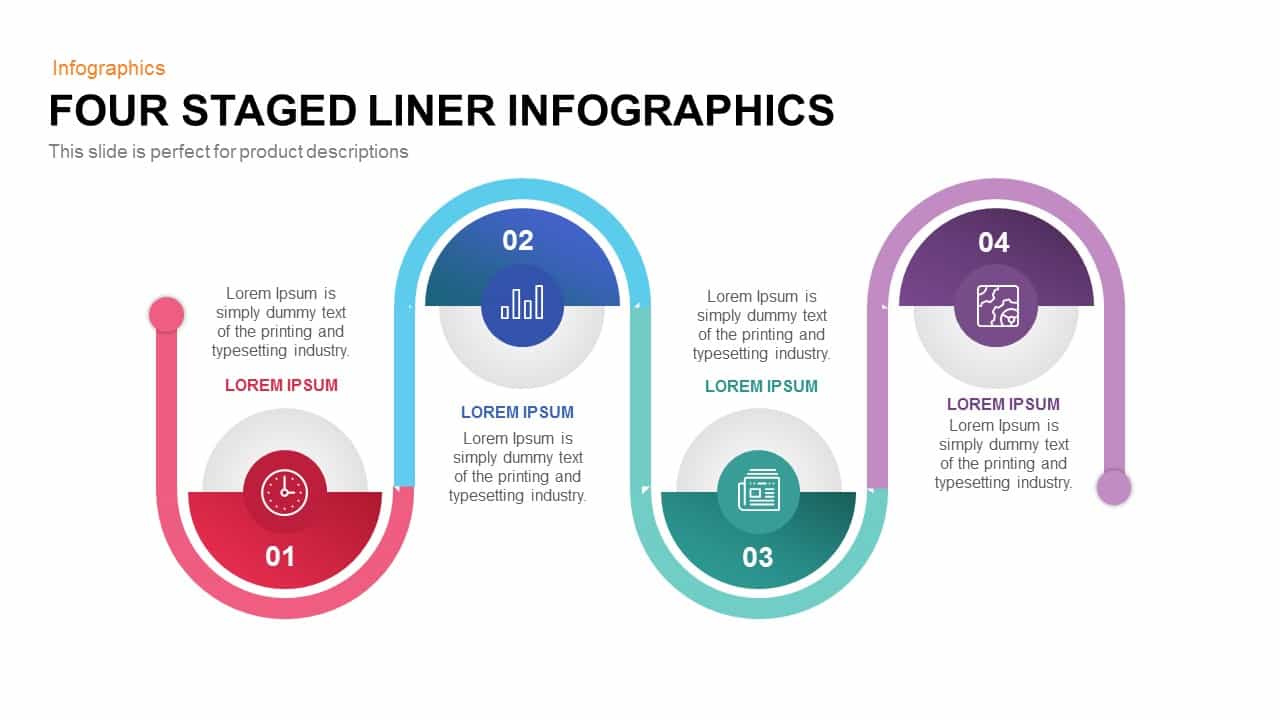
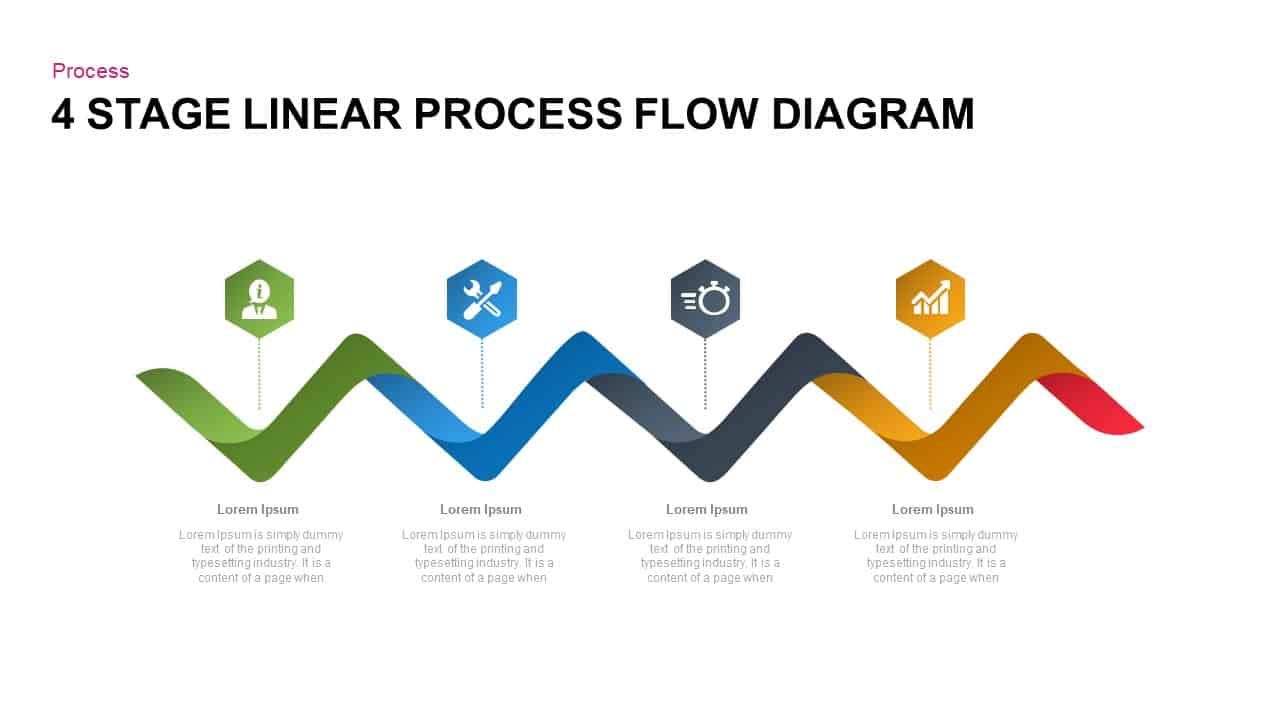
The five staged linear process diagram PowerPoint template is a horizontal and zigzag timeline template that illustrates a linear growth of the business through sequential phases. This PowerPoint can demonstrate the historical events or future predictions by analyzing the current and past situation of a company. The users can show the connection between the concepts with this symbolic diagram. The design itself is showing the connection by touching each zone in the first diagram and shows the connection by the zigzag layout in the second seven-stage linear process ppt templates.
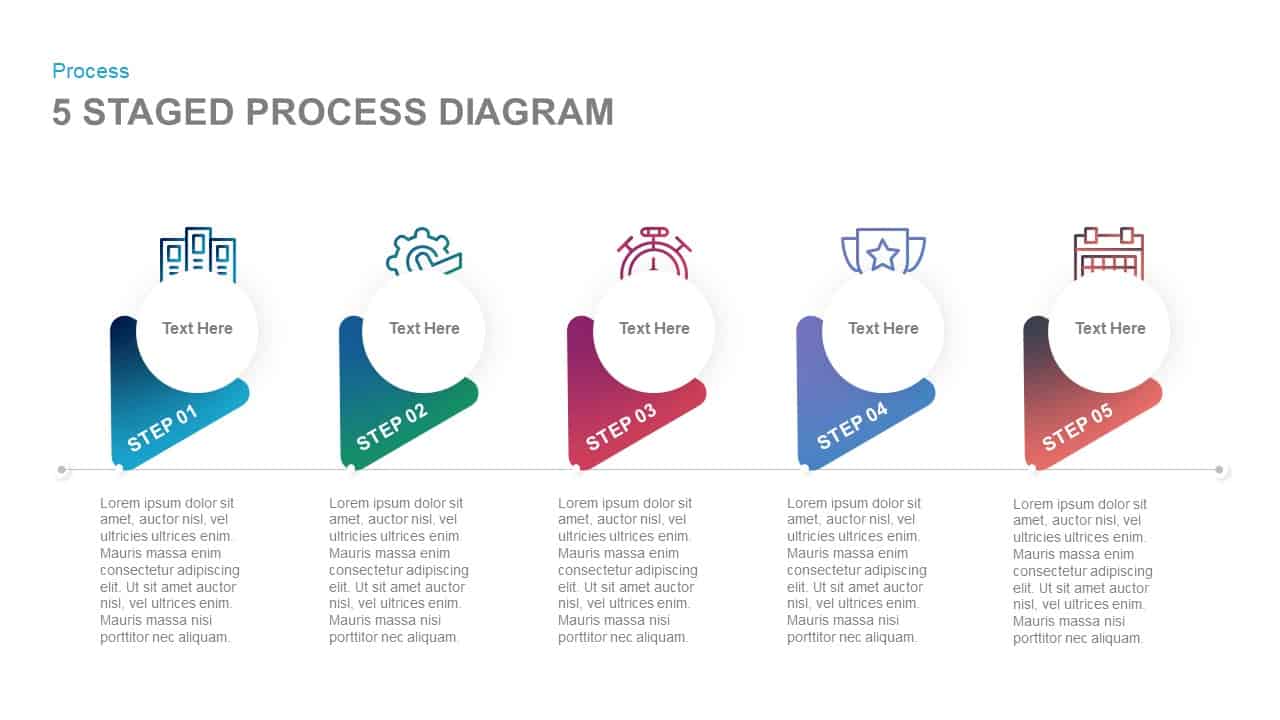
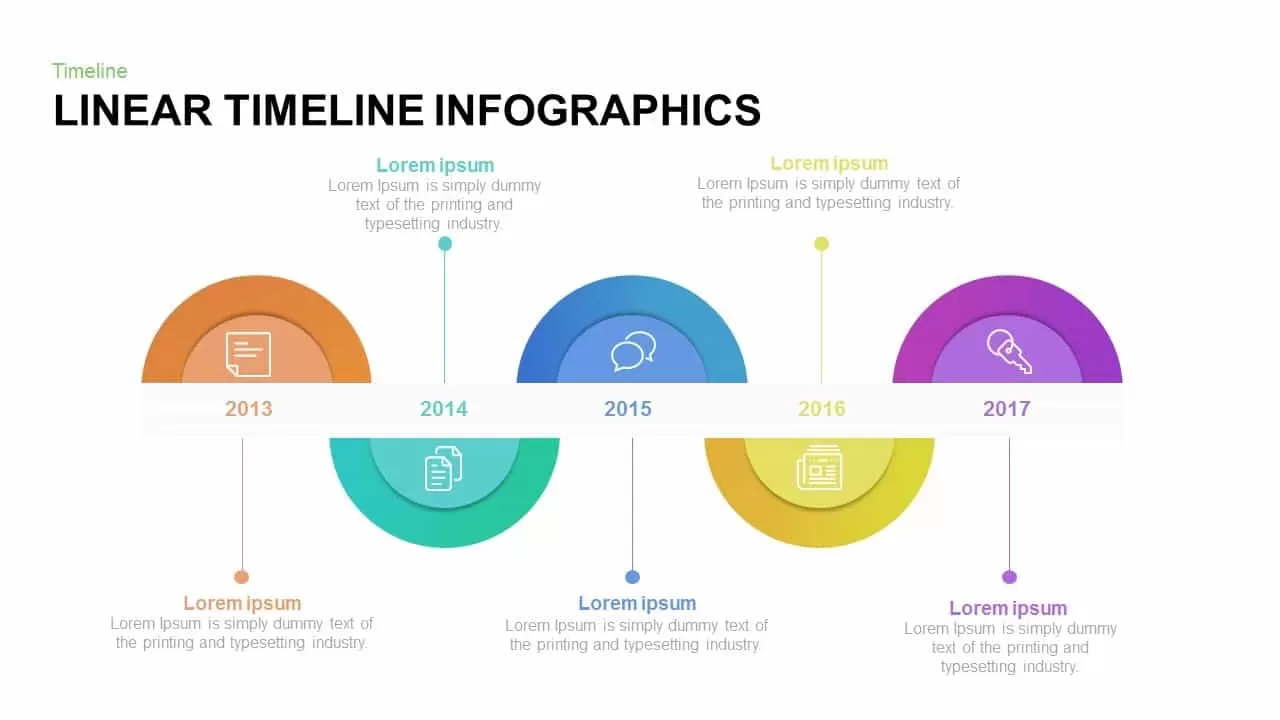
A five-stage diagram ppt template shows the steps of the process by numbering each circle and have text zones beneath the connected circles. In the second slide, each section is ornamented by infographic icons, these icons are complementary for the presenters, that is, they can use the meaning of the icons and amalgamate with the presentation topic. The uses can modify or alter the size and shape of the diagram or add more bright colors using PowerPoint color filling options.
You can access more Free PowerPoint Templates & PowerPoint timeline here. Grab the free ppt now!
Login to download this file


