Project Management Funnel Template for PowerPoint & Google Slides
Description
Leverage this dynamic project management funnel timeline slide to visualize case processing workflows and track both volume and cycle times across four stages: Case Created, Assigned, Reviewed, and Approved. A smoothly curved area chart for each stage illustrates the decline in case counts—from 100 at creation to 40 approvals—while accompanying callouts display average time spent per stage, reinforcing efficiency insights. Each stage is color-coded in gradient hues of green, teal, cyan, and blue, with editable titles and metrics placeholders.
Designed with a clean white backdrop and generous white space, the slide directs attention to your data. The subtle dotted connectors and minimalist axis labels support clear comparisons without clutter. Modern sans-serif fonts provide easy readability for headlines and numeric highlights, while the master slide configuration ensures consistent formatting across your deck. Fully editable vector shapes, including bars, borders, and connectors, allow you to adjust stage names, counts, and time metrics in seconds. Swap color fills, recolor shapes, or replace callouts to match corporate branding or project themes effortlessly.
Ideal for project managers, PMO teams, and operations leads, this funnel timeline template simplifies complex workflows into a single, comprehensive visual. Present cycle-time analyses, capacity planning, or process bottleneck assessments with confidence, and empower stakeholders to identify areas for improvement. Use the funnel to drive data-driven decision making and streamline stakeholder discussions. Duplicate and adapt layouts to showcase month-on-month progress or compare parallel processes, ensuring your project reporting remains clear and actionable.
Optimized for both PowerPoint and Google Slides, this asset preserves full-resolution clarity across devices, minimizing formatting conflicts during virtual meetings or in-person presentations. Leverage the master slide setup to quickly generate comparative funnels for different teams or time periods, accelerating your reporting workflow and enhancing stakeholder engagement. The slide’s intuitive grouping and axis labeling also support quick annotations for presentations, allowing you to highlight key trends or outliers directly on the chart.
Who is it for
Project managers, PMO teams, operations leads, and process improvement consultants will benefit from this funnel timeline slide when analyzing workflow efficiency, case volumes, and cycle-time performance.
Other Uses
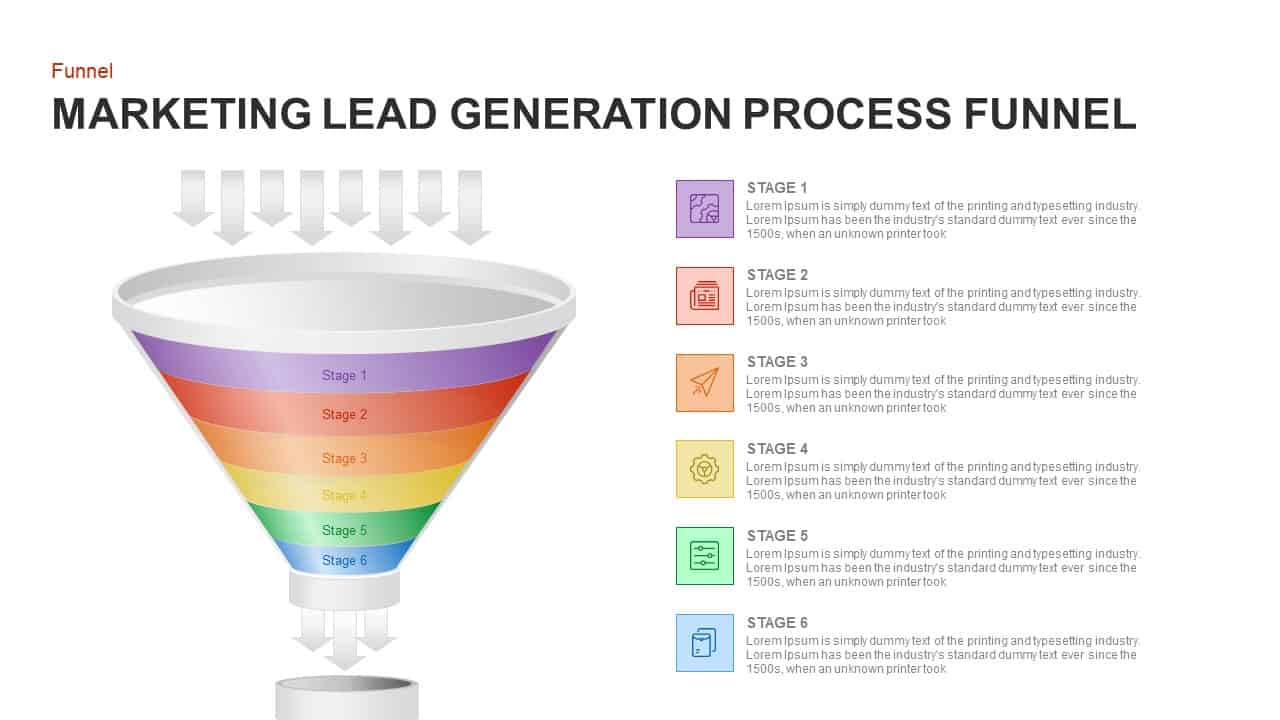
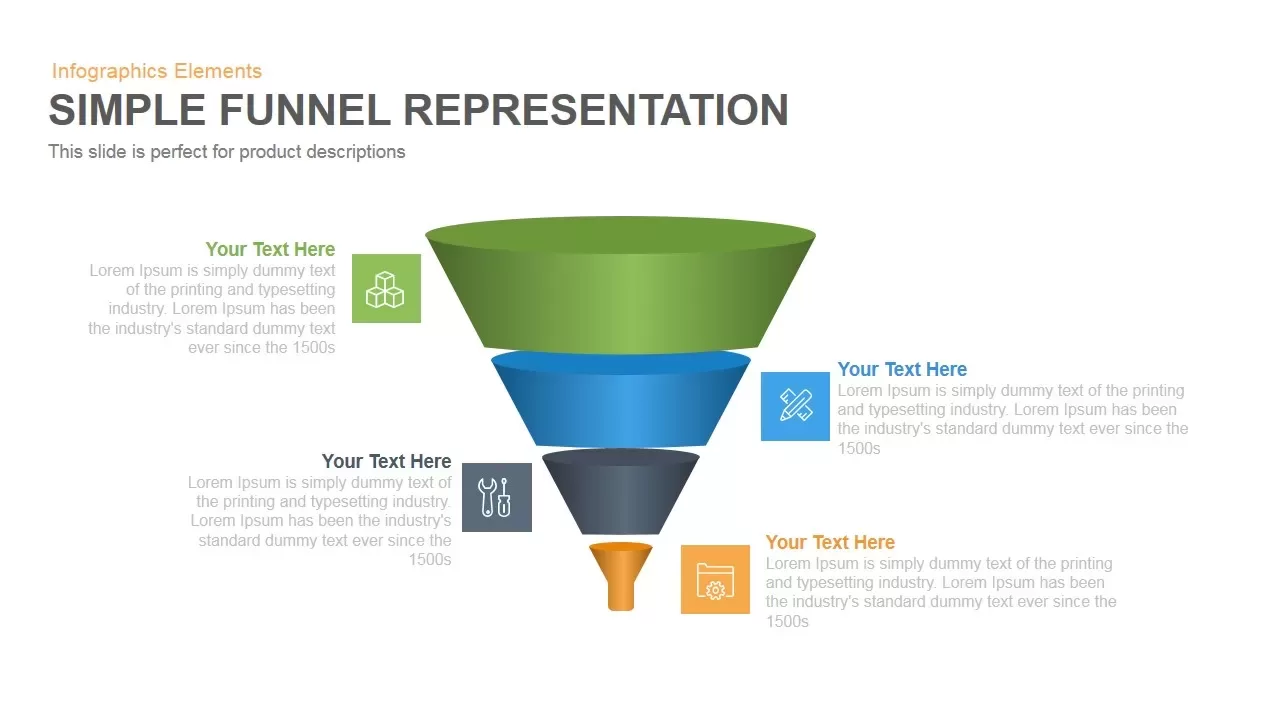
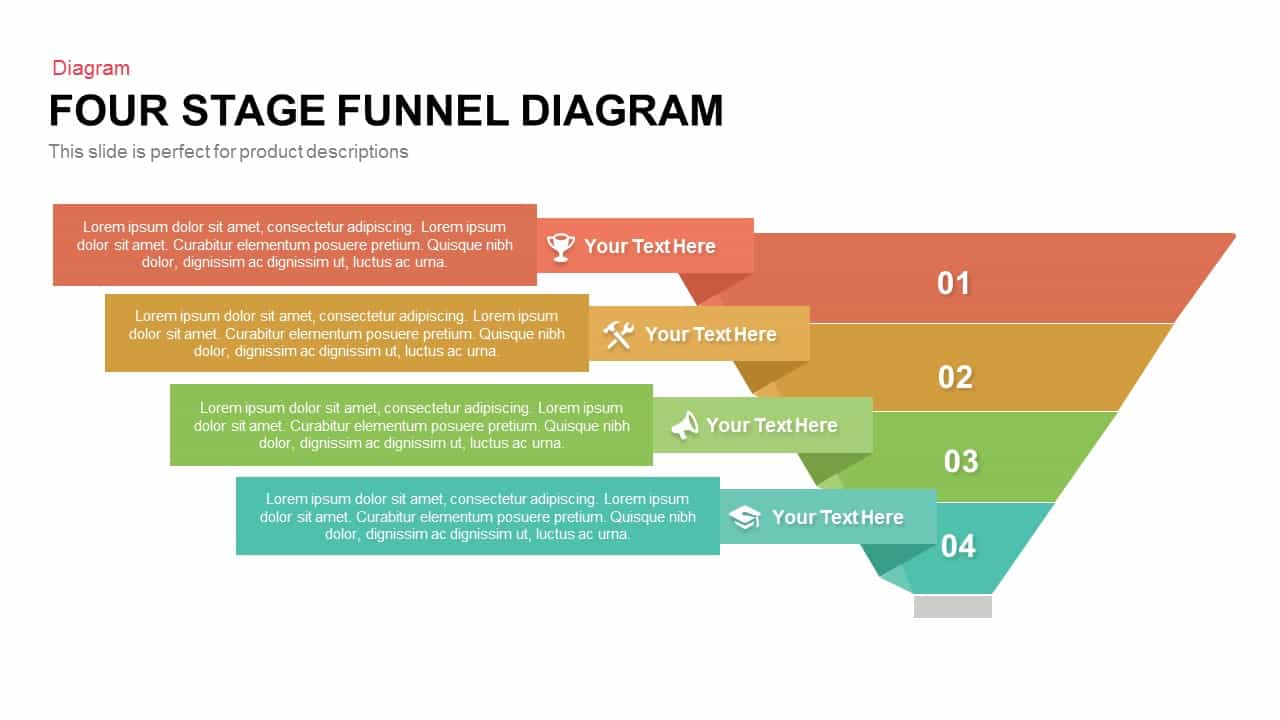
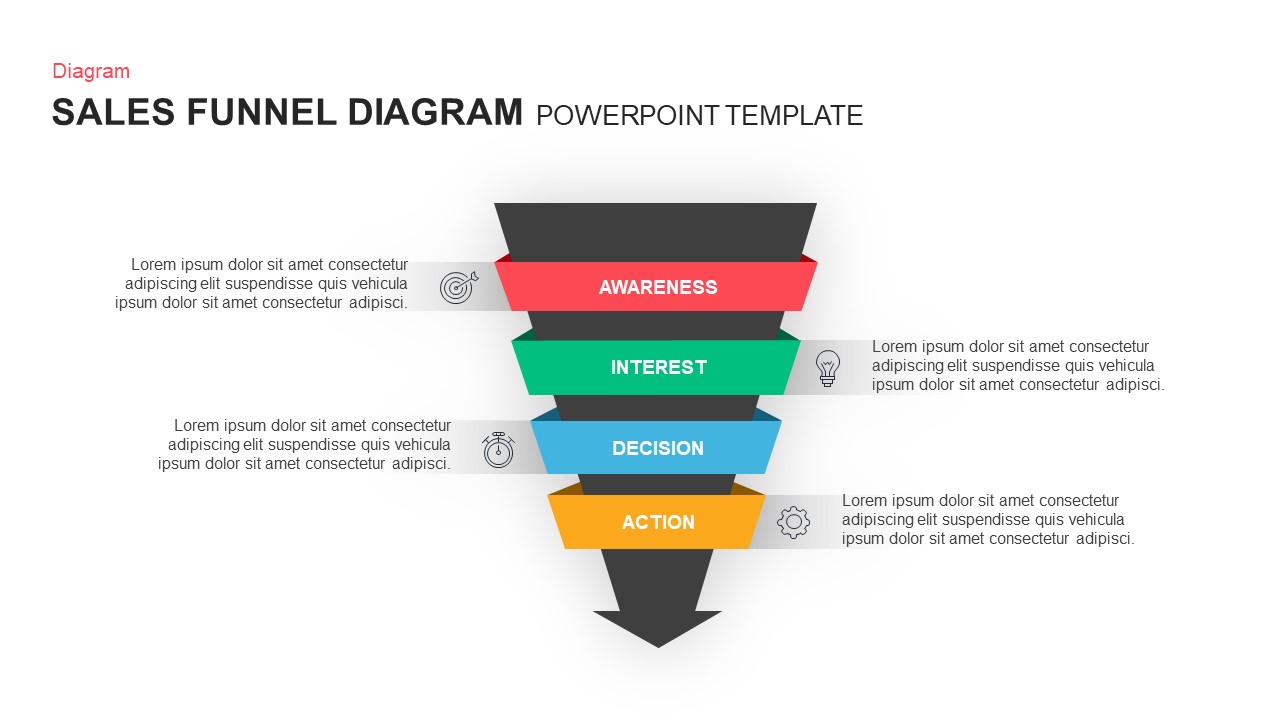
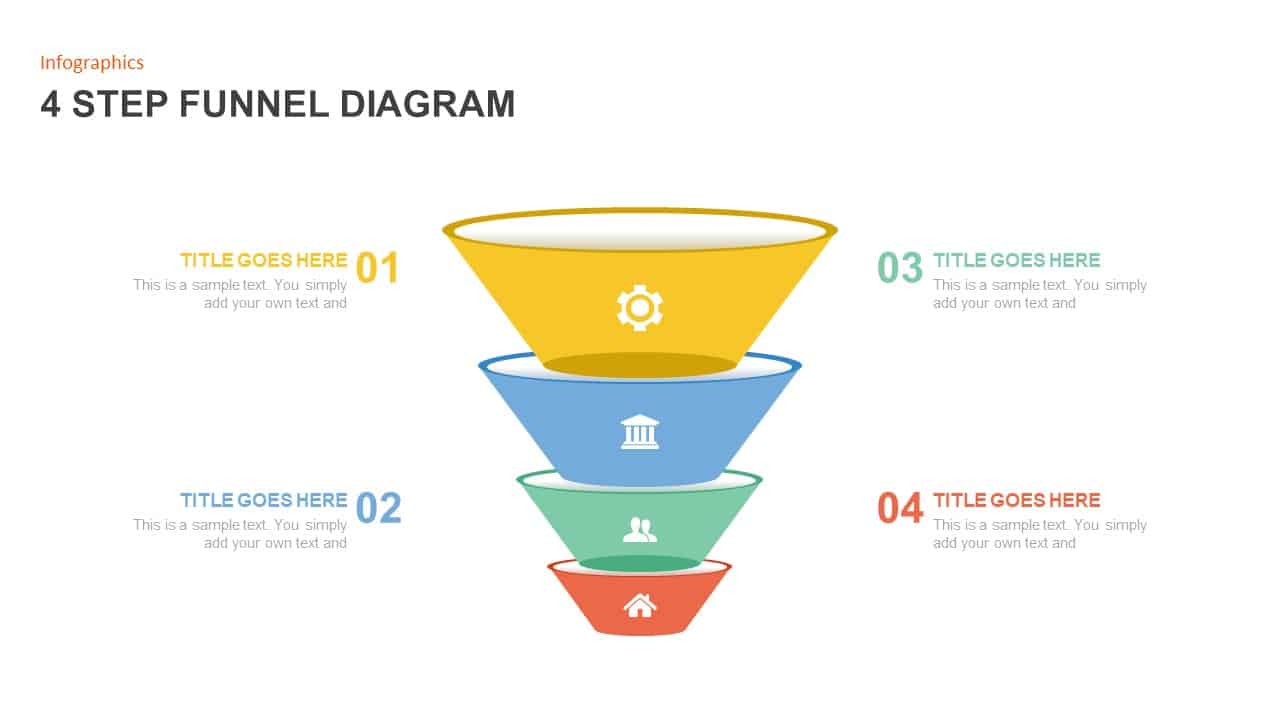
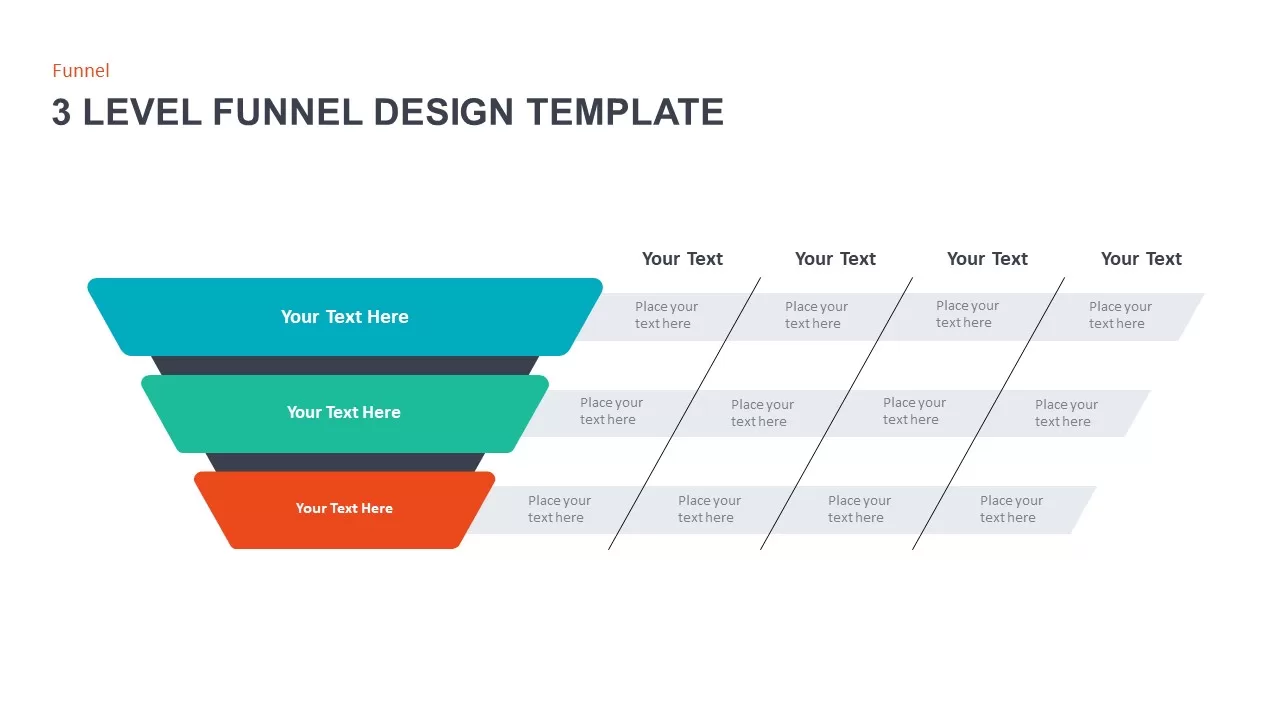
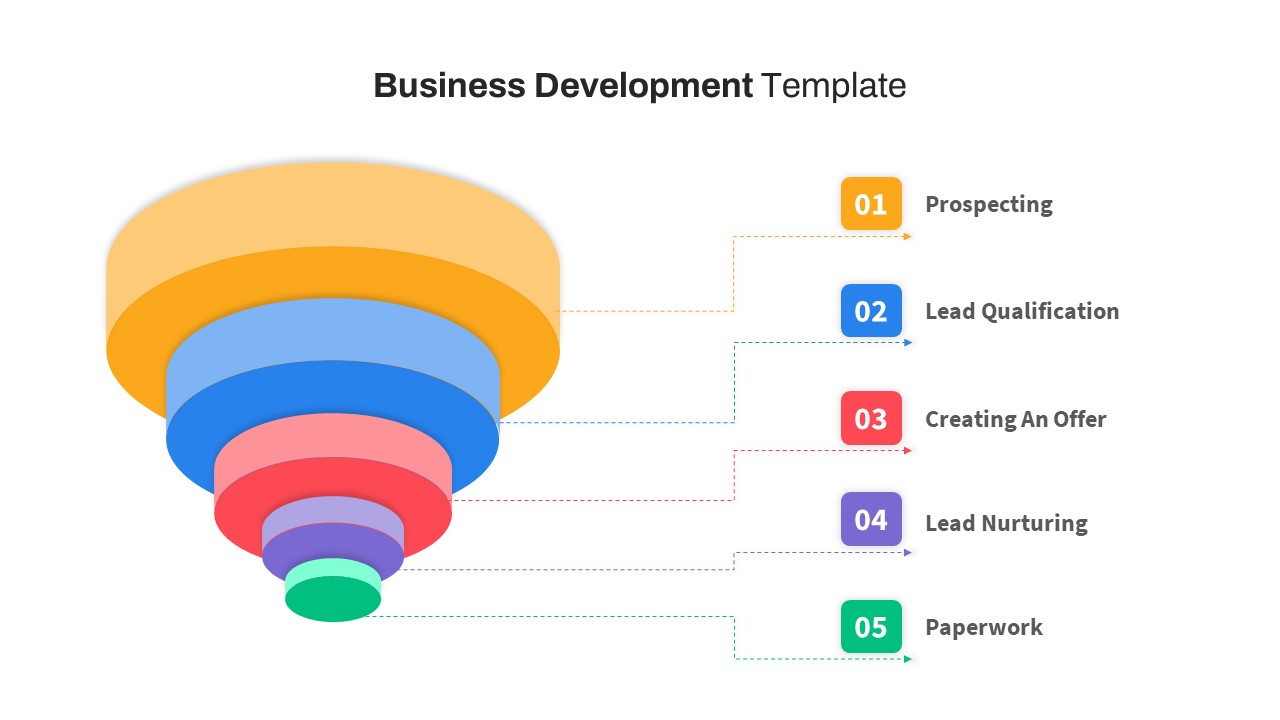
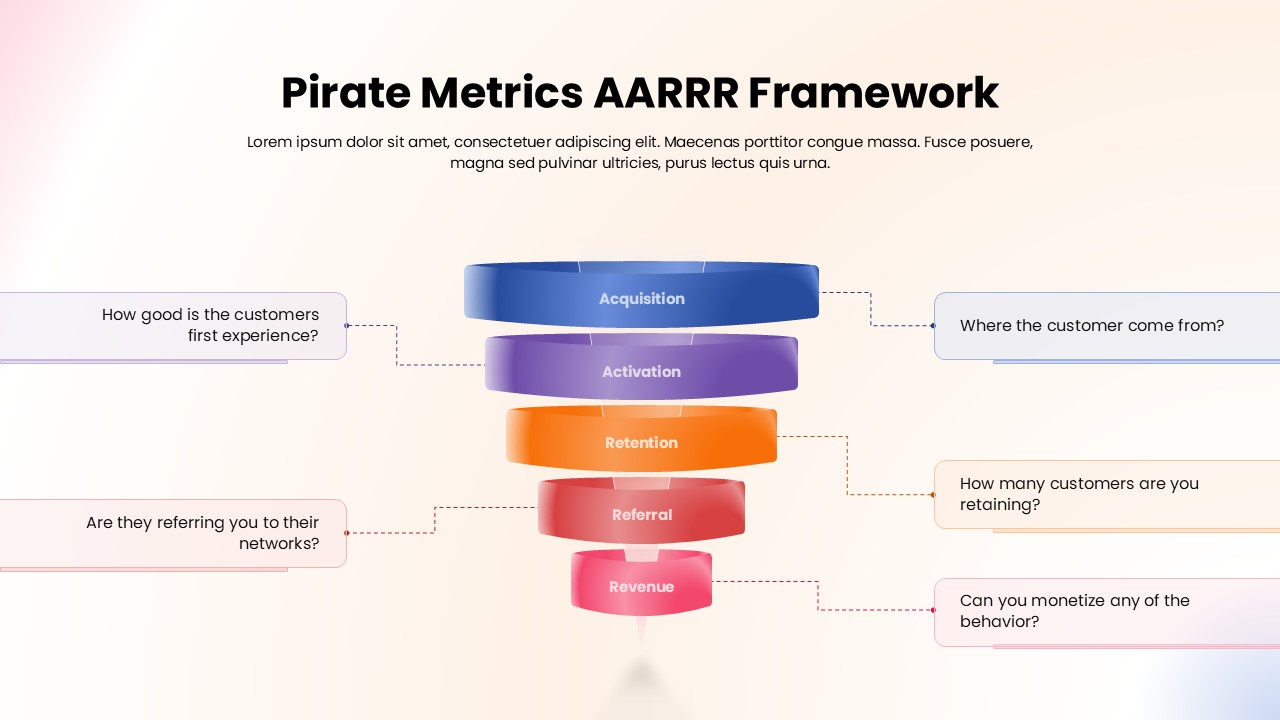
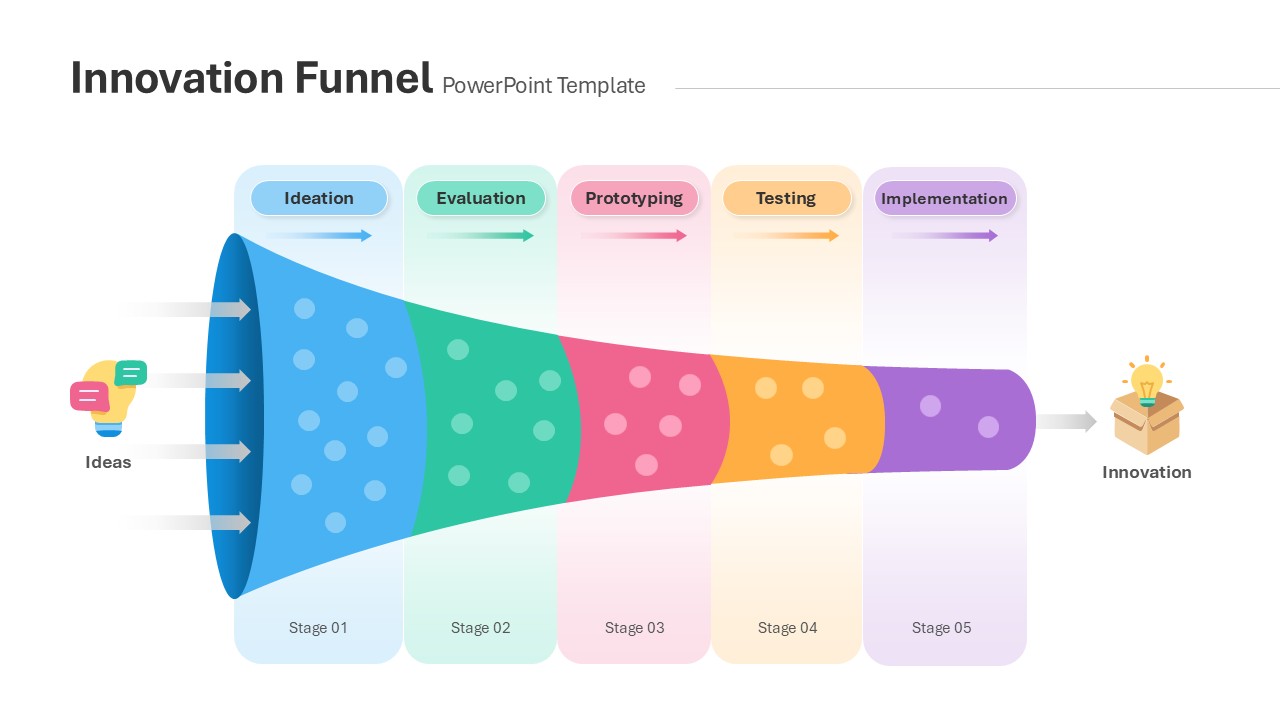
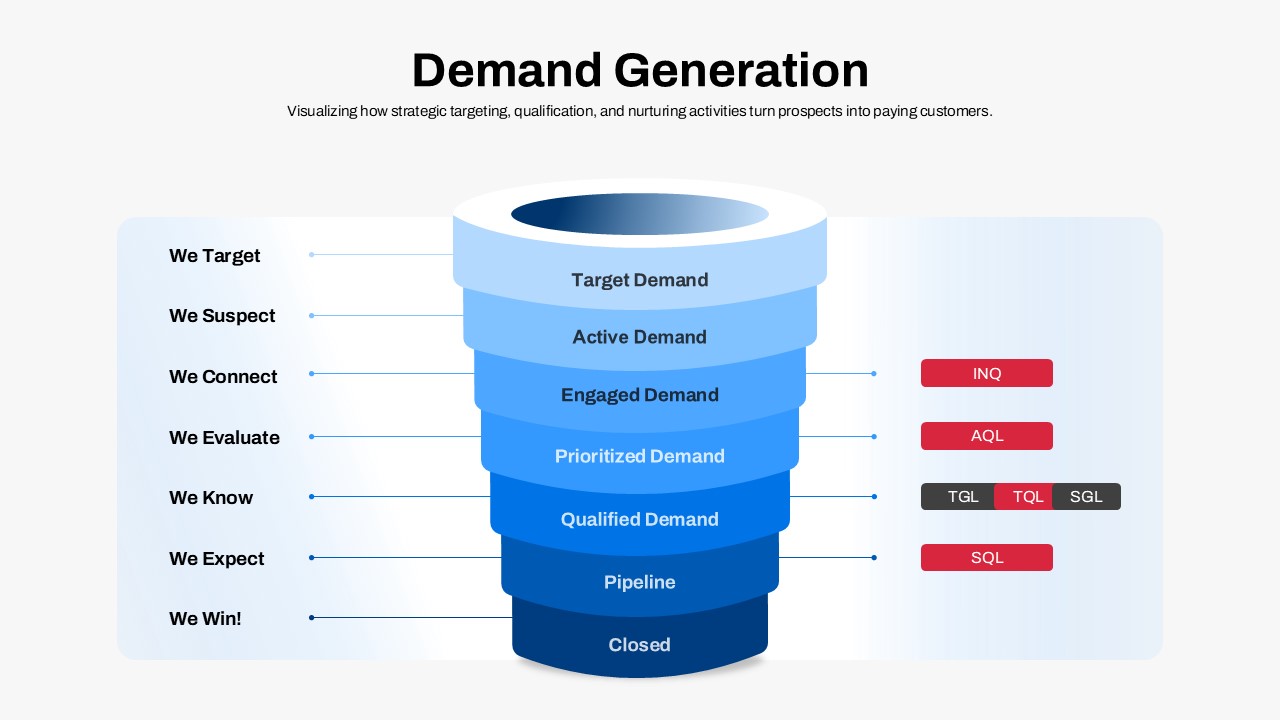
Repurpose this diagram for sales or marketing funnels, lead conversion tracking, customer support ticket workflows, recruitment pipelines, or manufacturing defect rate analyses. Adjust labels and metrics to visualize any four-stage process decline or conversion sequence.
Login to download this file


