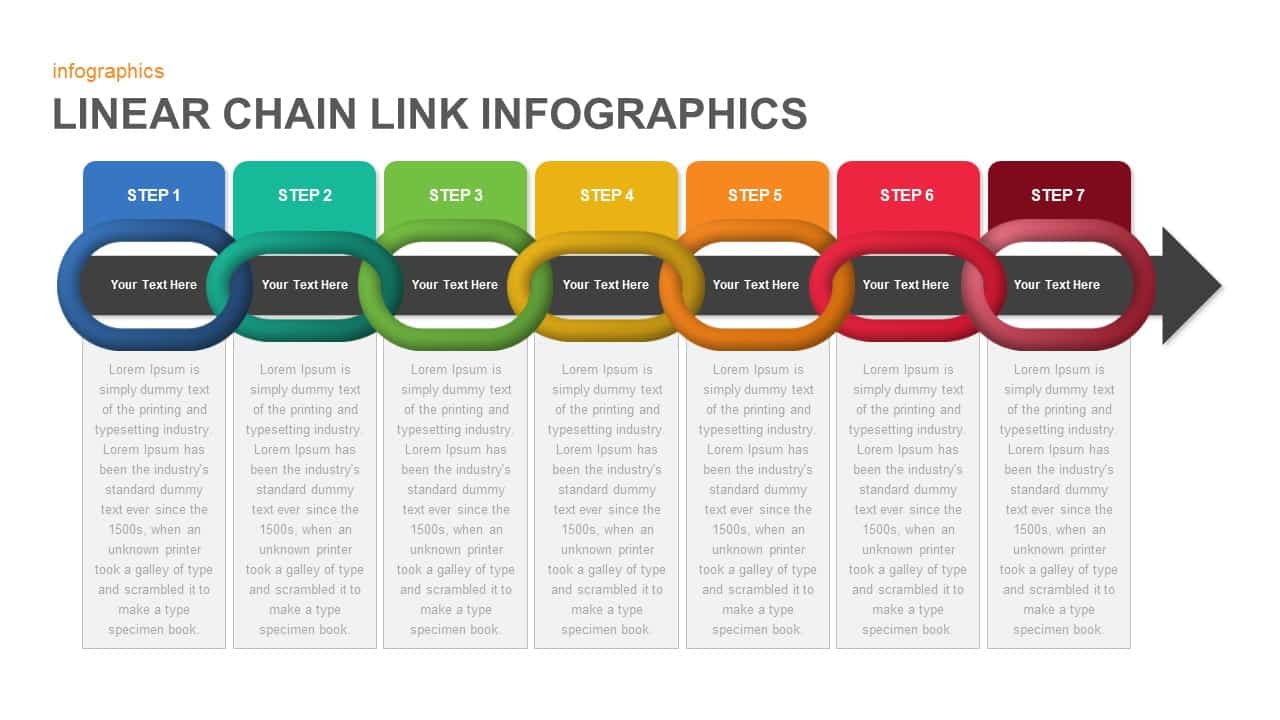
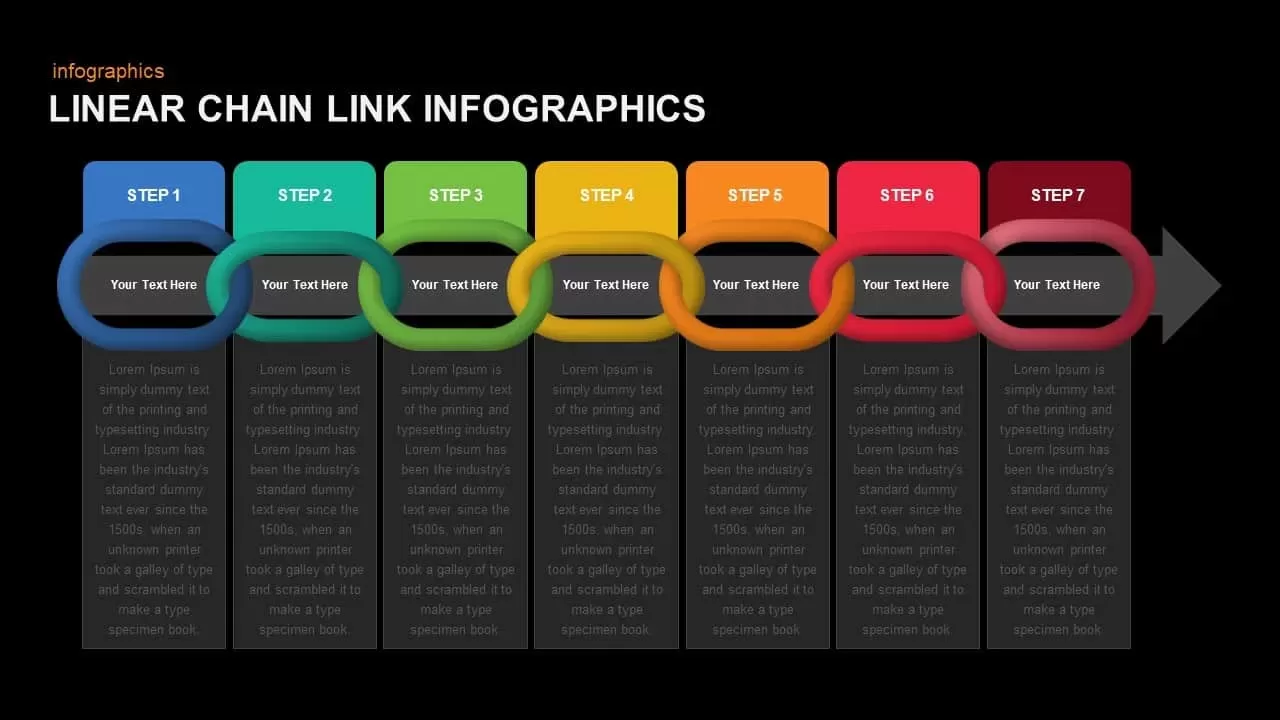
Linear Chain Link Infographics Template for PowerPoint & Google Slides
Description
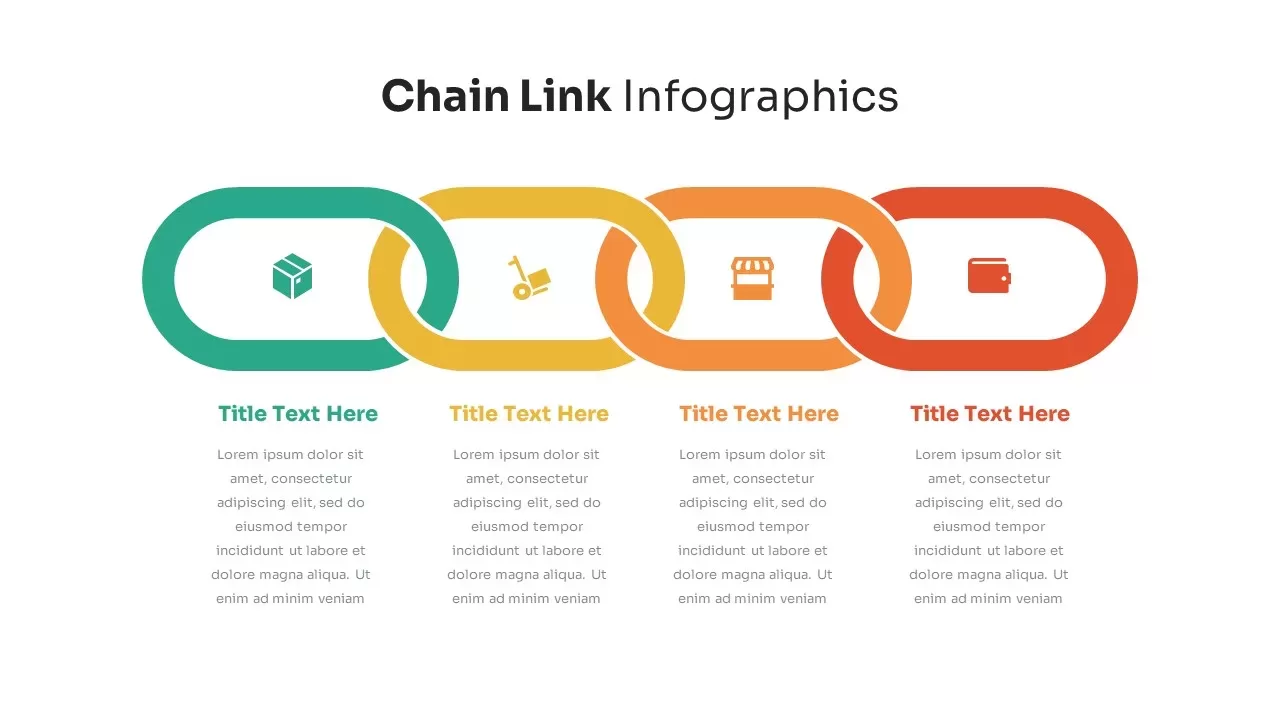
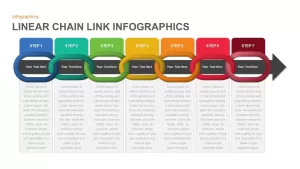
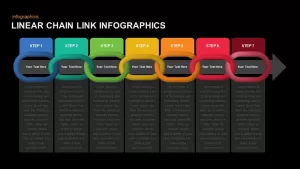
Communicate sequential processes, project milestones, or workflow steps with this dynamic linear chain link infographic slide. Seven interlocking chain links in gradient hues—blue, teal, green, yellow, orange, red, and burgundy—span from left to right, each paired with a numbered header and vertical text block for detailed annotations. A bold arrowhead anchor signals forward momentum, while layered vector shapes create a subtle 3D effect that enhances visual engagement. The minimalist white background and clean typography ensure that your content remains the focal point without unnecessary distractions.
Built on fully editable master slides for both PowerPoint and Google Slides, this design leverages vector elements and gradient shading for seamless customization. Effortlessly adjust link colors, swap step labels, resize shapes, or update text placeholders to align with your brand’s style guide. The chain link texture is achieved through layered shapes and bevel effects, all of which can be recolored or modified to suit any presentation theme. Add entrance animations to each link to guide viewer attention and emphasize the sequential flow of information.
Ideal for illustrating seven-step processes, operational workflows, supply chain mappings, or timeline overviews, this infographic slide brings clarity to complex narratives. Use it in strategy workshops, stakeholder presentations, or training sessions to map customer journeys, outline project phases, or highlight risk assessment stages. The visual continuity of the chain links helps audiences track interdependencies and maintain context throughout your discussion.
The clean layout also supports high-resolution exports for print or large-screen displays. Combine this chain link infographic with complementary layouts—such as Gantt charts, milestone timelines, or comparison diagrams—to build a cohesive, professional deck. Elevate your presentations with this polished, data-driven visual framework and keep your audience engaged from start to finish.
Who is it for
Business analysts, project managers, and operations leaders can leverage this slide to map multi-step processes, illustrate supply chains, or outline project milestones. Marketing teams, product managers, and customer experience professionals can deploy the design to visualize customer journey stages. Trainers, consultants, and educators will appreciate the clear sequential layout for workshops, trainings, or stakeholder briefings.
Other Uses
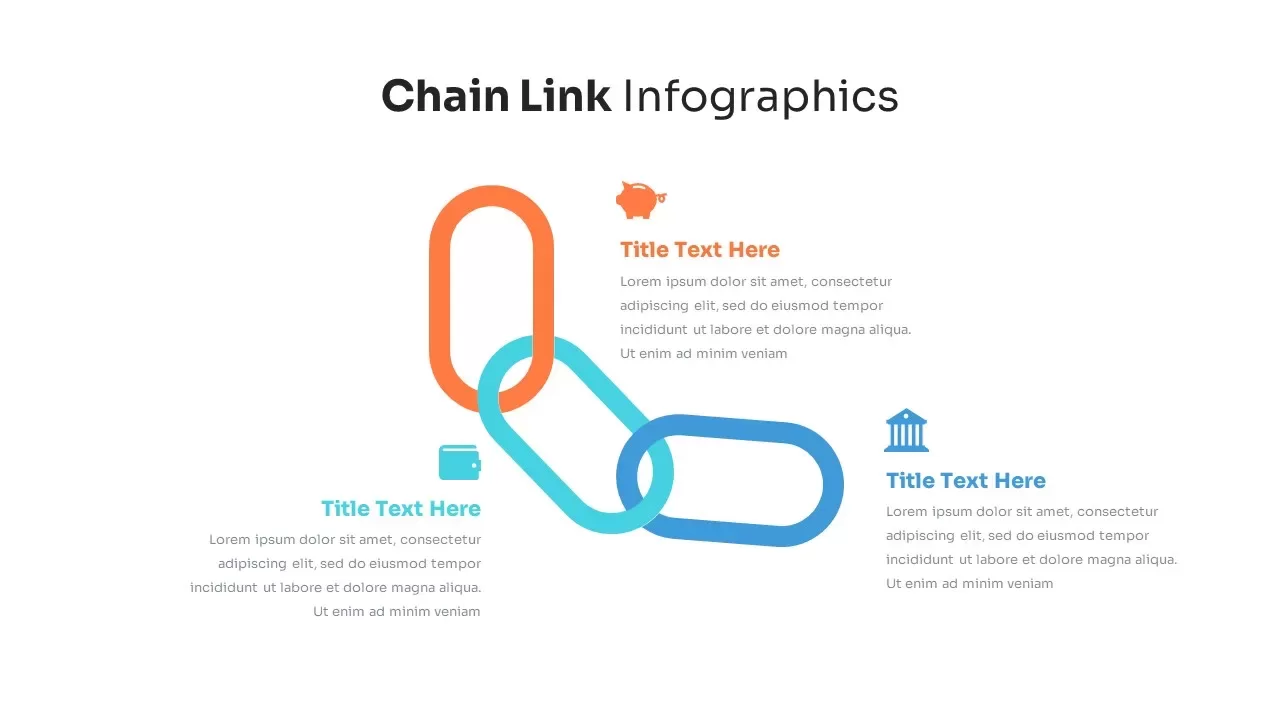
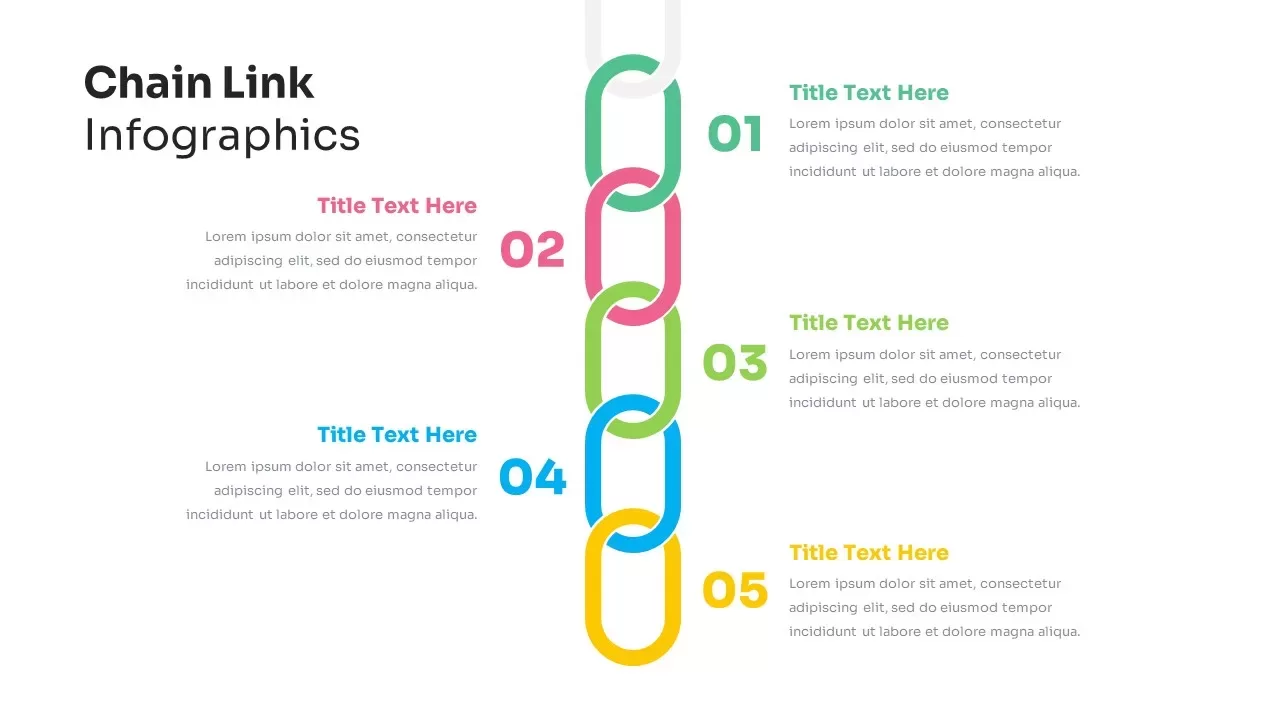
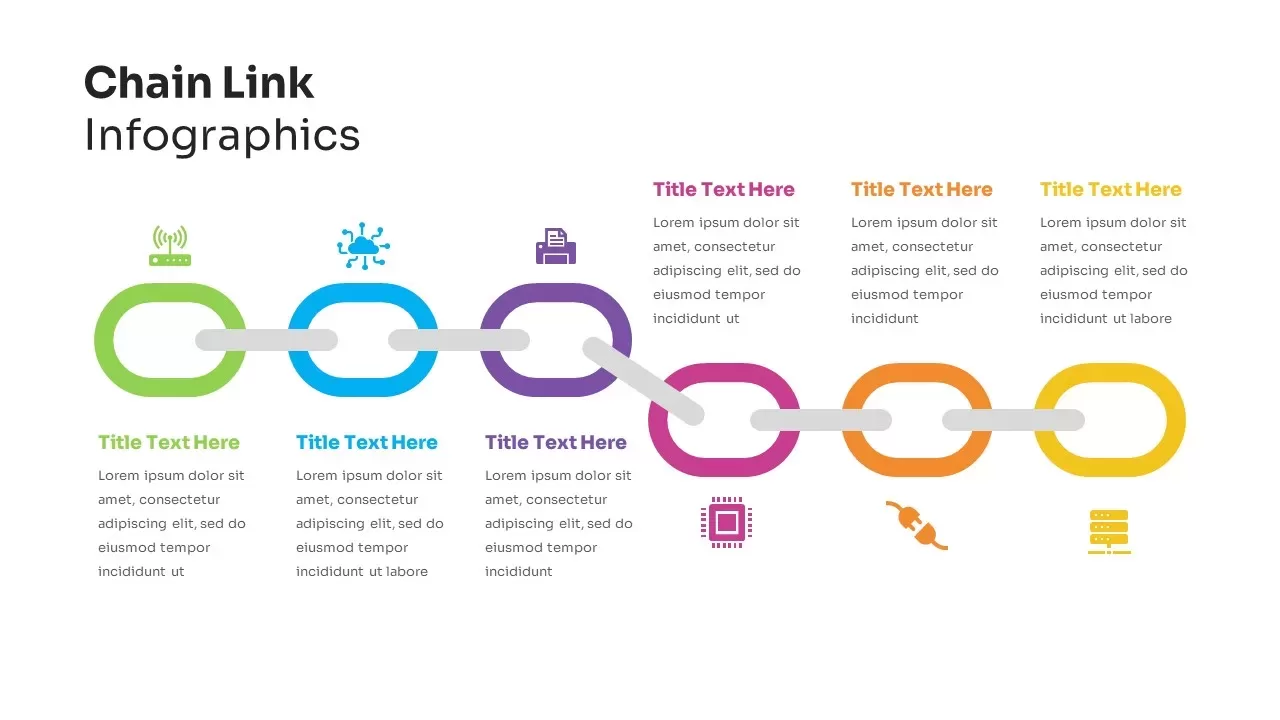
Repurpose this infographic for timeline overviews, Gantt chart introductions, or comparative analyses by adjusting link count and colors. Use the links to display feature roadmaps, risk assessments, or vendor workflows. The modular chain structure also adapts to before-and-after presentations, performance metrics, or multi-phase project summaries.
Login to download this file

Item ID
SB00920
Related Templates

Chain Link Process Infographic Diagram Template for PowerPoint & Google Slides
Process
Premium
Chain Link Process Infographic Diagram Template for PowerPoint & Google Slides
Process
Premium
Chain Link Process Infographic Diagram Template for PowerPoint & Google Slides
Process
Premium
Five-Step Chain Link Process Infographic Template for PowerPoint & Google Slides
Process
Premium
Six-Step Chain Link Technology Process Template for PowerPoint & Google Slides
Process
Premium
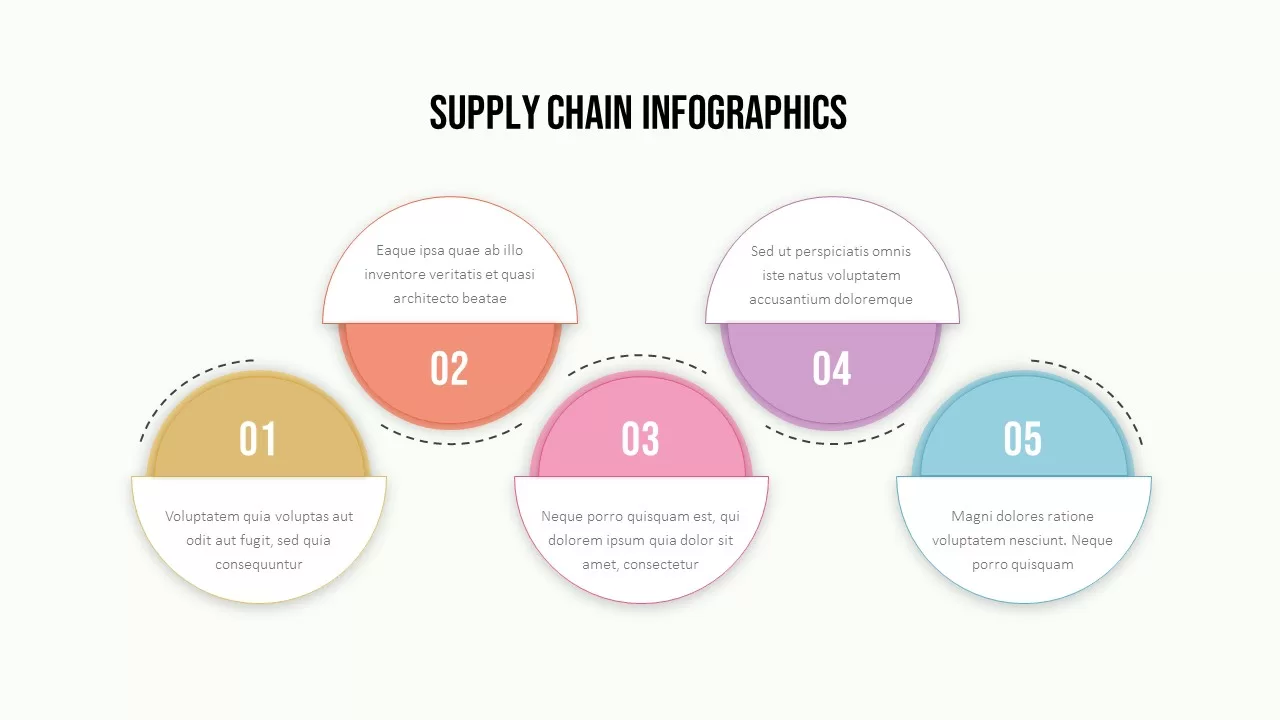
Supply Chain Circular Process Infographics Template for PowerPoint & Google Slides
Business Strategy
Premium
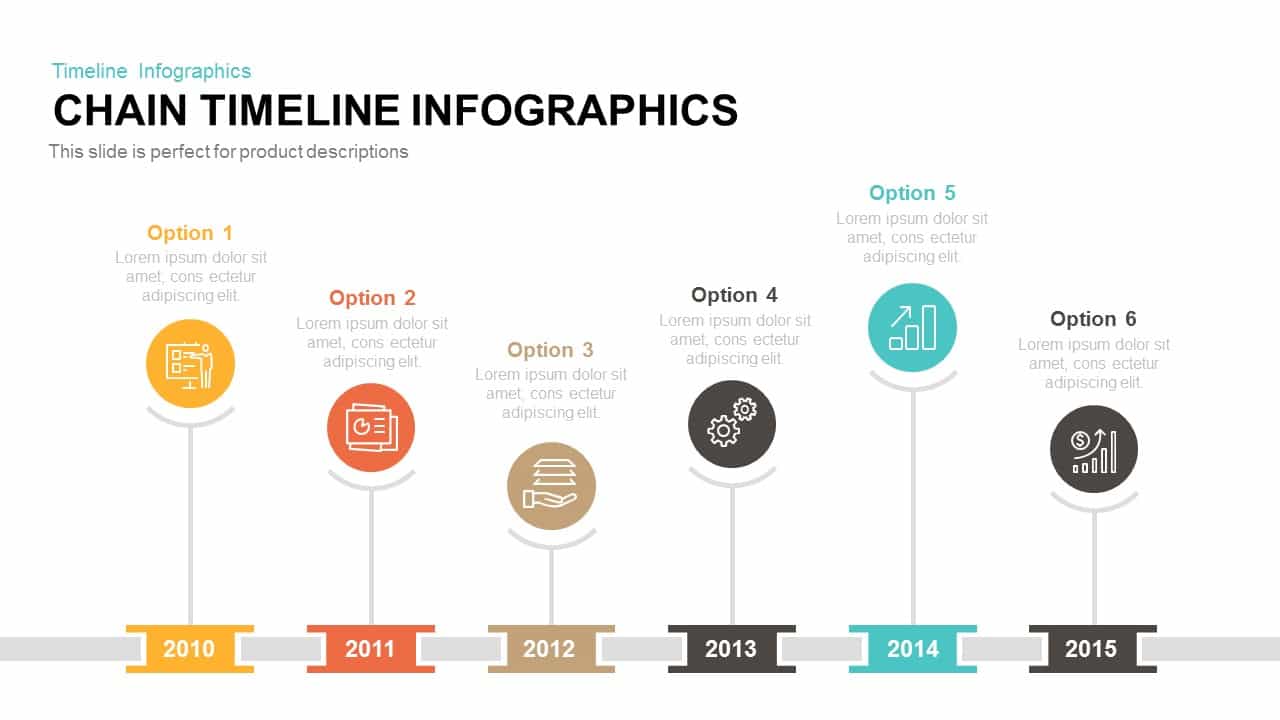
Chain Timeline template for PowerPoint & Google Slides
Timeline
Premium
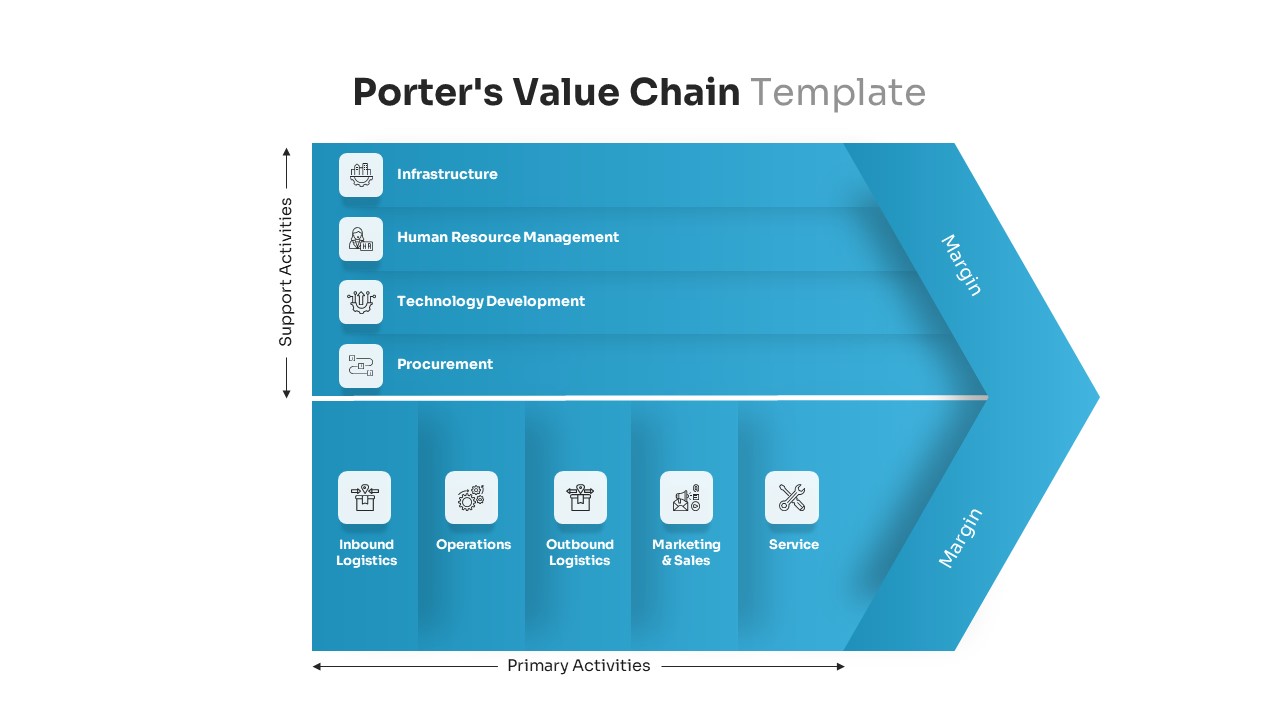
Porter’s Value Chain Analysis Diagram Template for PowerPoint & Google Slides
Business Strategy
Premium
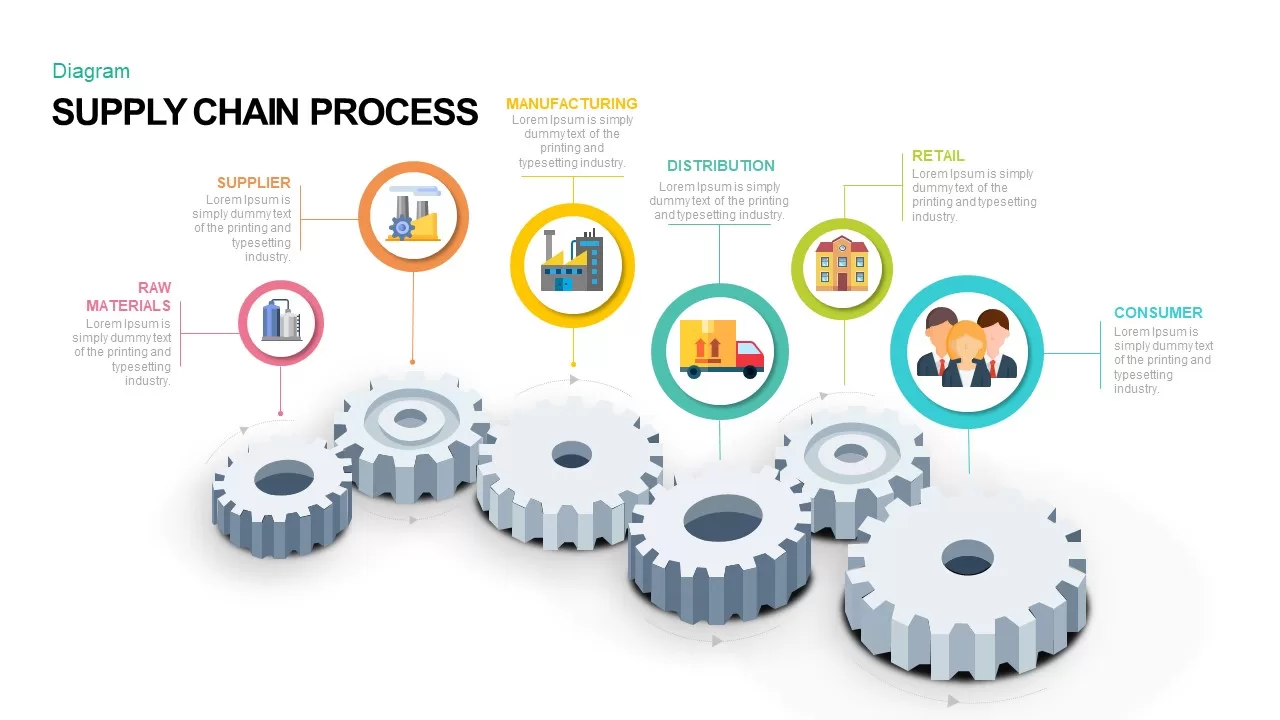
Supply Chain Process Gear Diagram Template for PowerPoint & Google Slides
Process
Premium
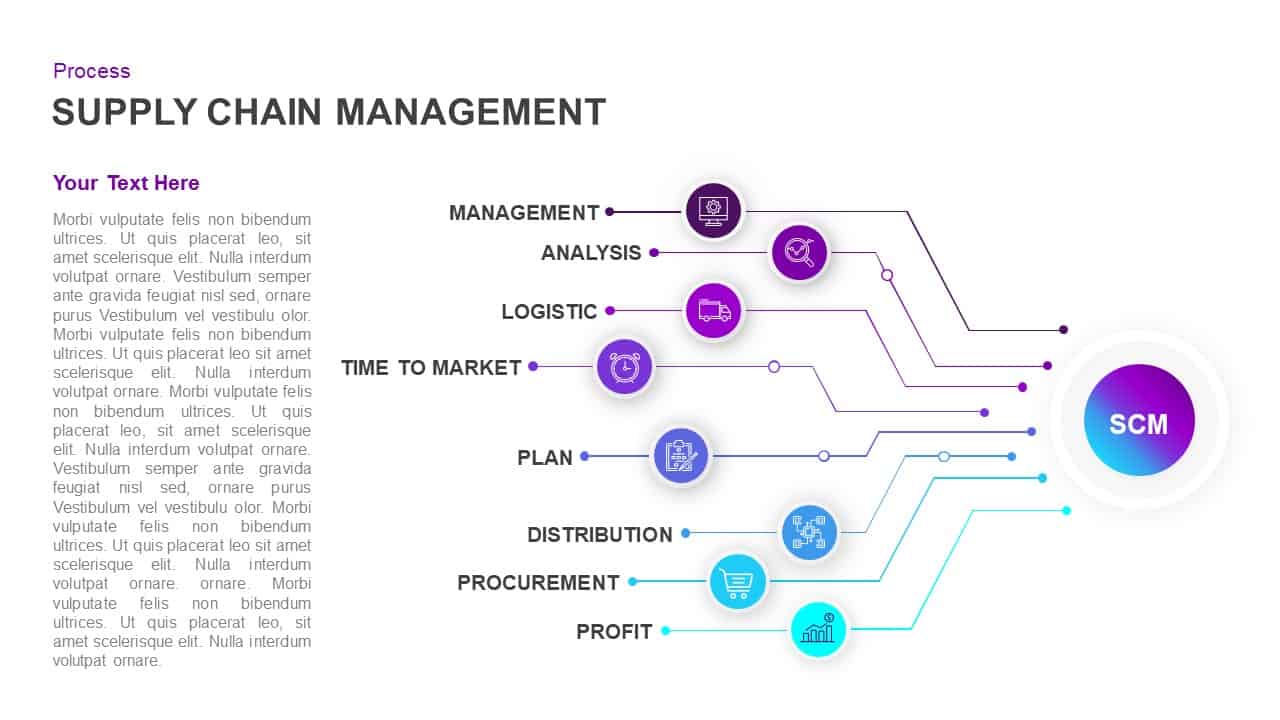
Logistics and Supply Chain Management Template for PowerPoint & Google Slides
Process
Premium
Supply Chain Analytics Process Template for PowerPoint & Google Slides
Process
Premium
Supply Chain Management Logistics Cover Template for PowerPoint & Google Slides
Pitch Deck
Premium
Hexagonal Supply Chain Diagram Template for PowerPoint & Google Slides
Process
Premium
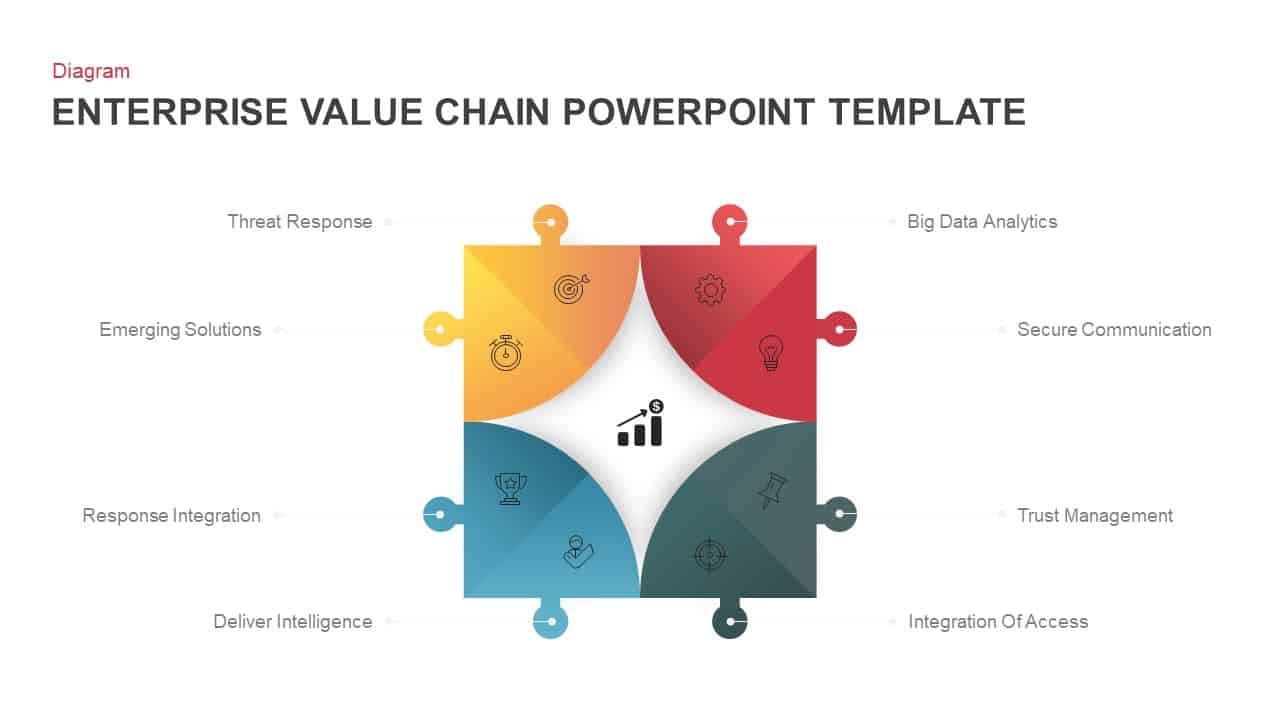
Enterprise Value Chain Puzzle Diagram Template for PowerPoint & Google Slides
Business Models
Premium
Supply Chain Management Process Diagram Template for PowerPoint & Google Slides
Process
Premium
Value Chain Circular Process Diagram Template for PowerPoint & Google Slides
Business Models
Premium
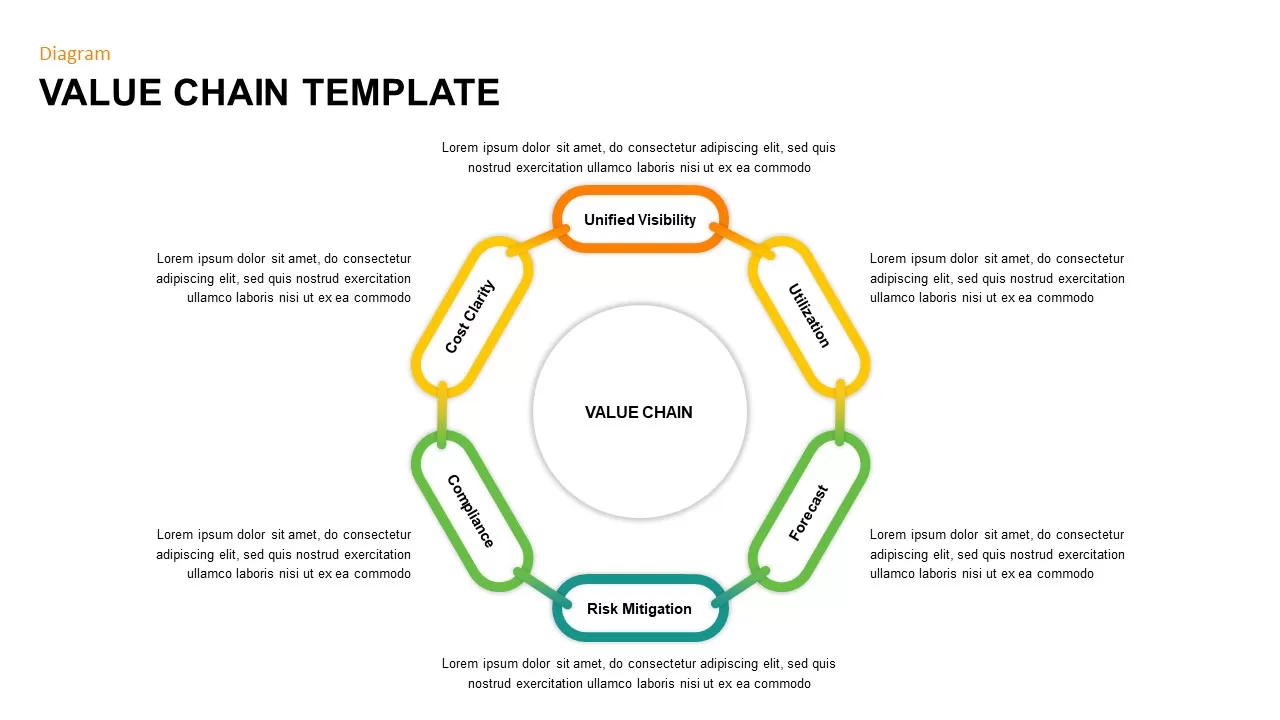
Value Chain Diagram template for PowerPoint & Google Slides
Business Strategy
Premium
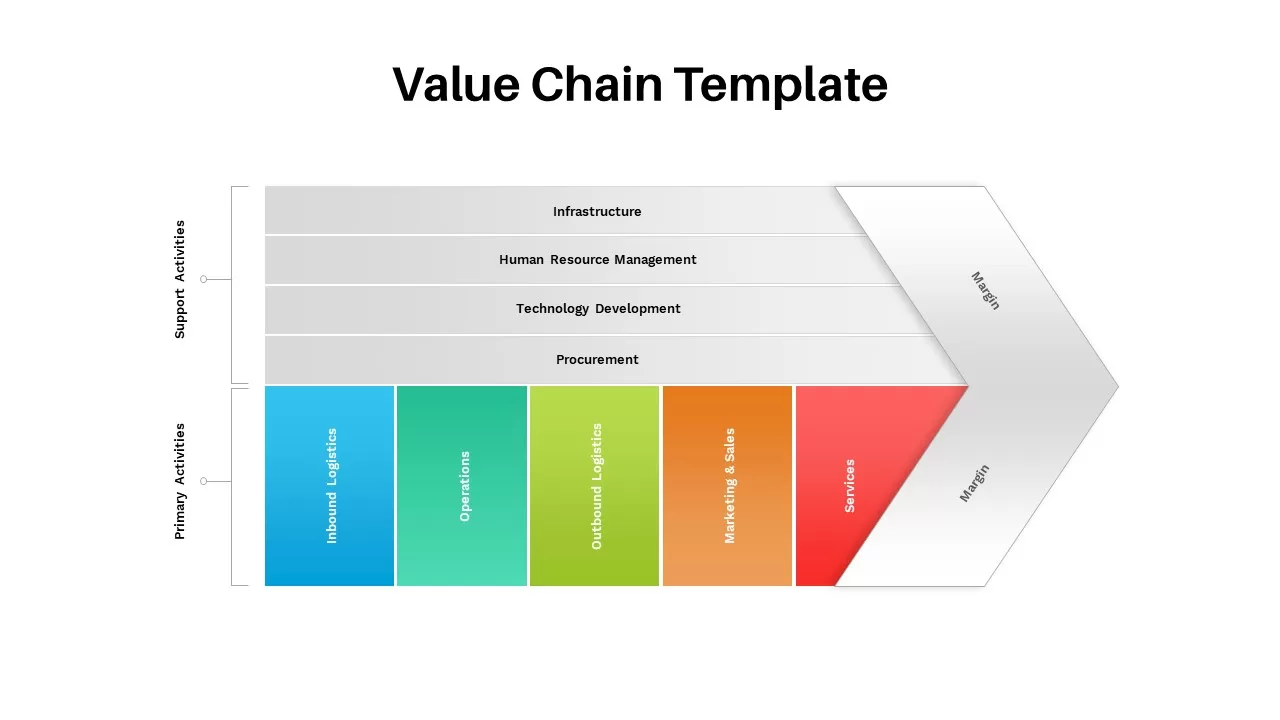
Value Chain Template for PowerPoint & Google Slides
Business Strategy
Premium
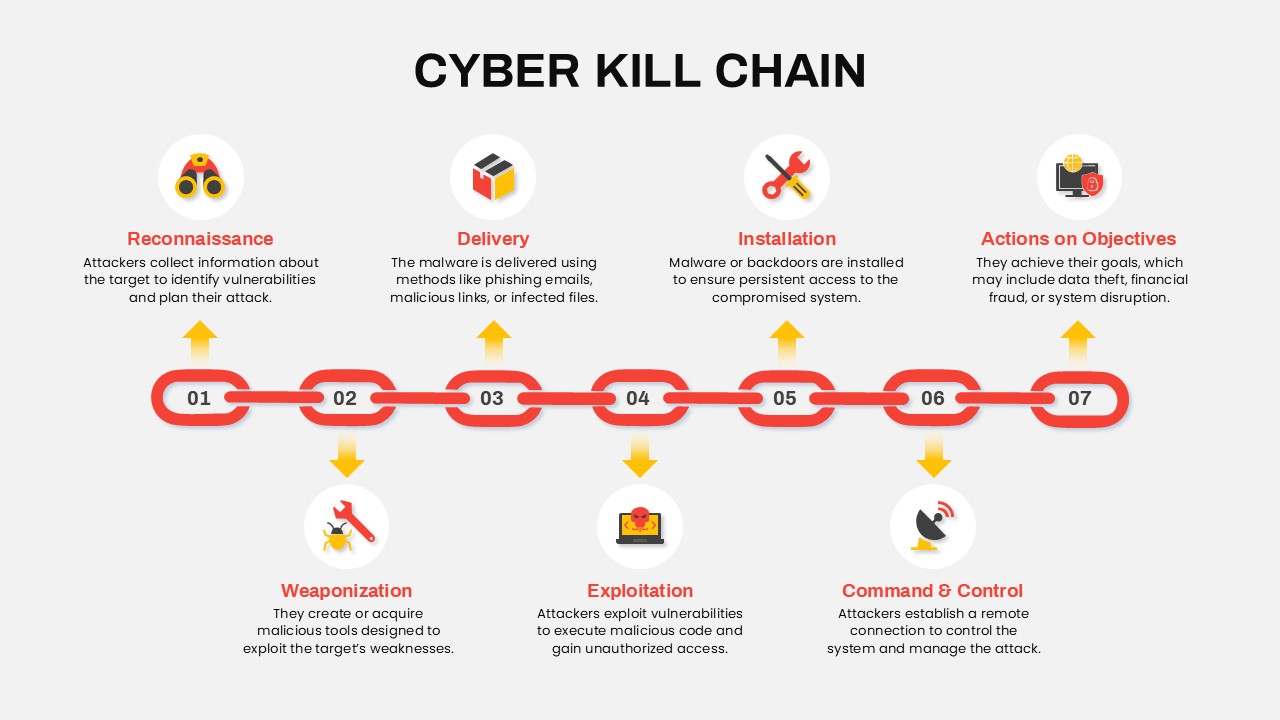
Cyber Kill Chain Template for PowerPoint & Google Slides
Information Technology
Premium
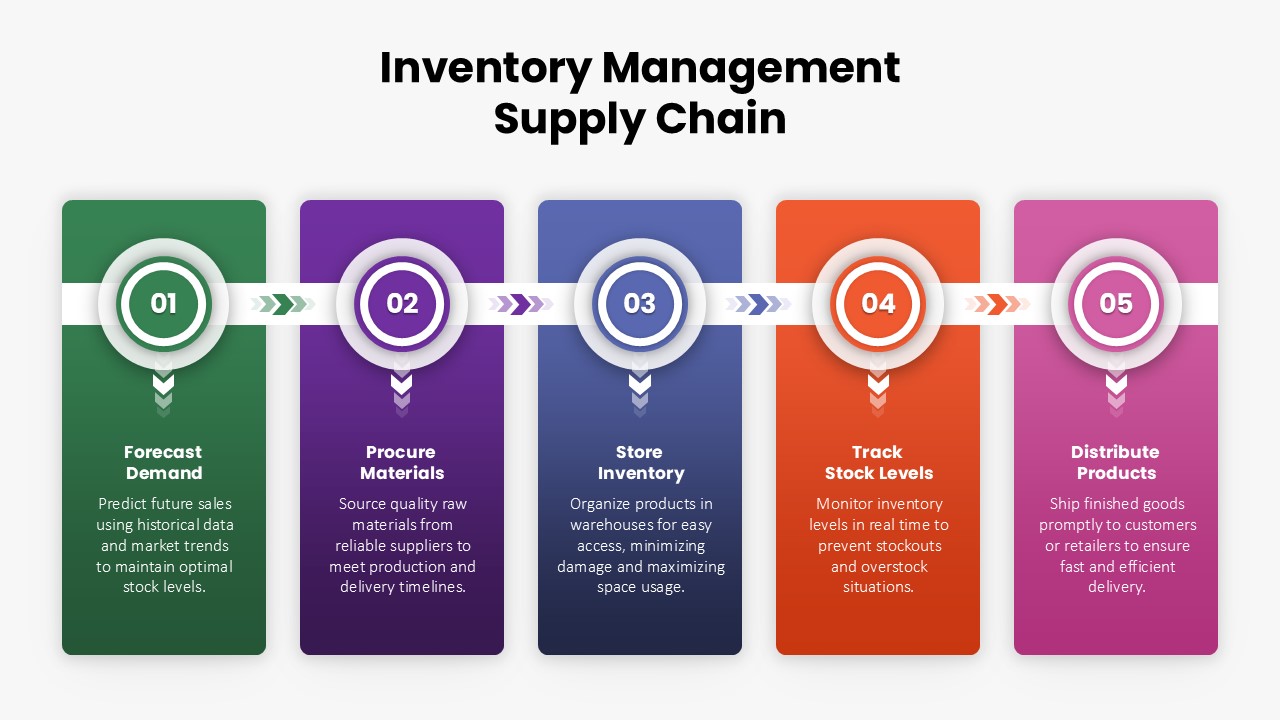
Inventory Management Supply Chain Template for PowerPoint & Google Slides
Process
Premium
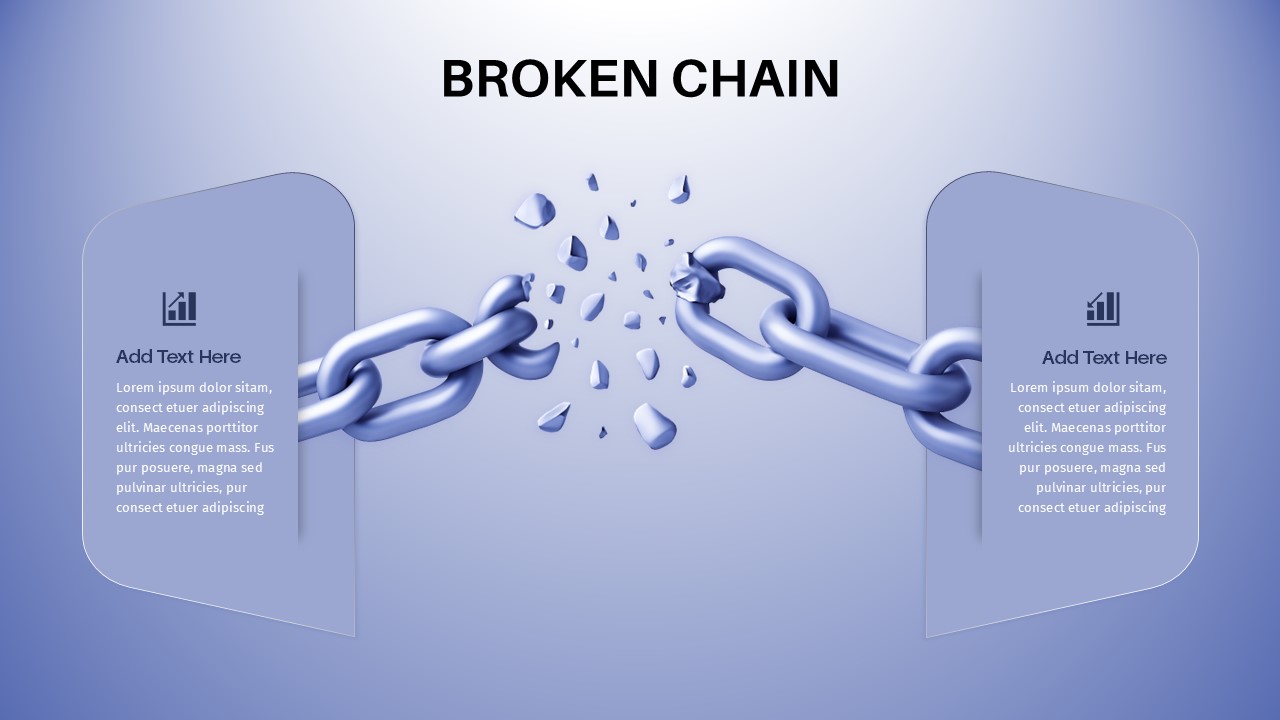
Broken Chain Concept template for PowerPoint & Google Slides
Business
Premium
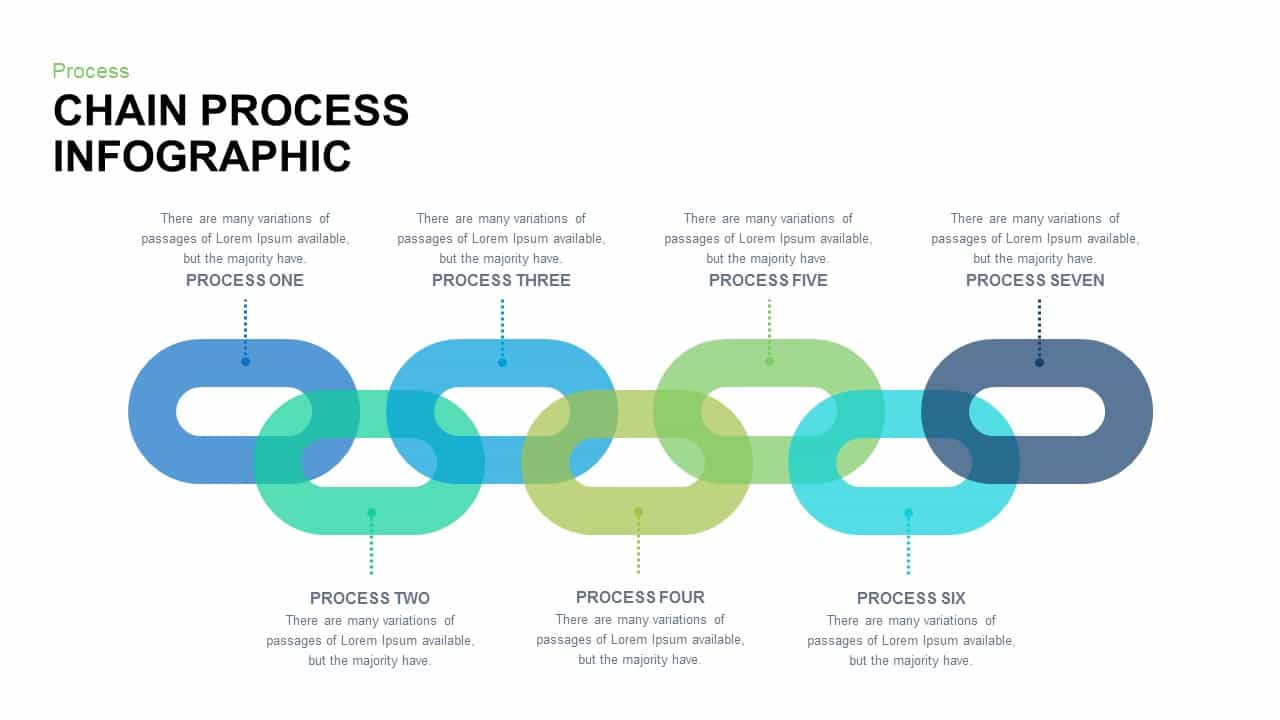
Chain Process Infographic for PowerPoint & Google Slides
Process
Premium
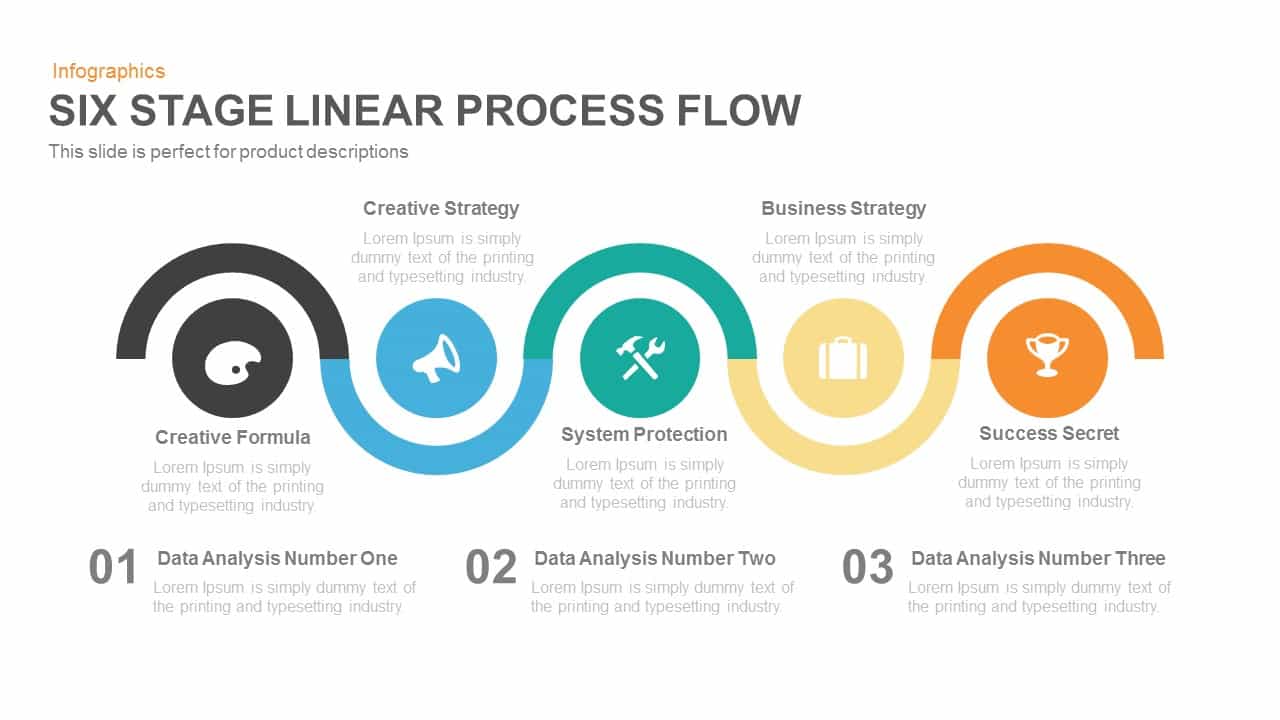
Five Stage Linear Process Flow Template for PowerPoint & Google Slides
Process
Premium
3D Shape Linear Process Flow Diagram Template for PowerPoint & Google Slides
Process
Premium
Linear Process Flow Circles Diagram Template for PowerPoint & Google Slides
Process
Premium
Four-Stage Linear Infographic Diagram Template for PowerPoint & Google Slides
Process
Premium
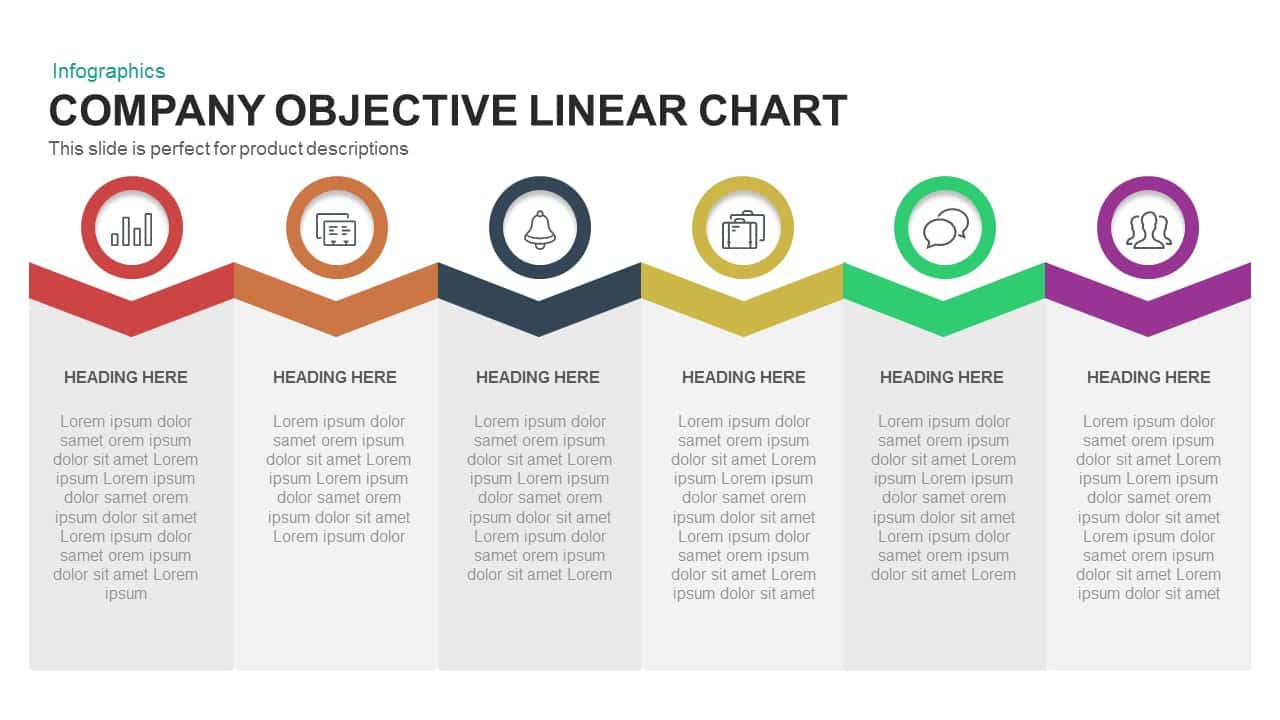
Company Objective Linear Chart Template for PowerPoint & Google Slides
Flow Charts
Premium
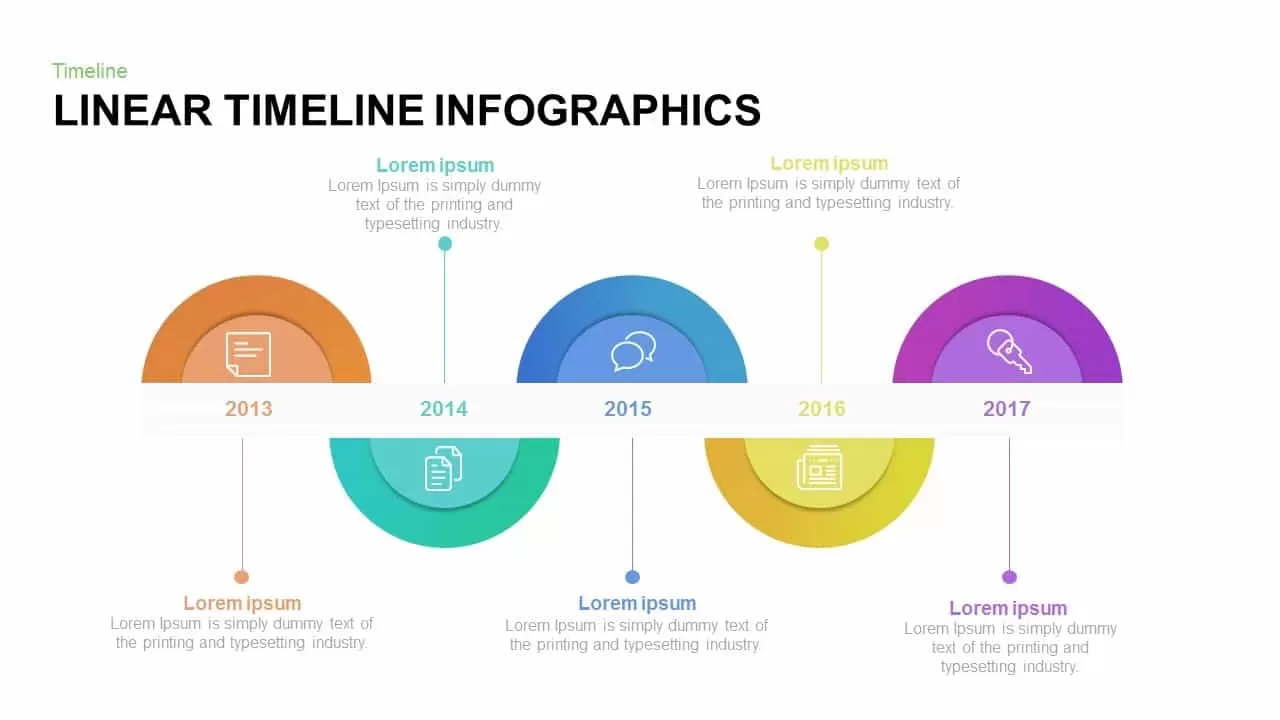
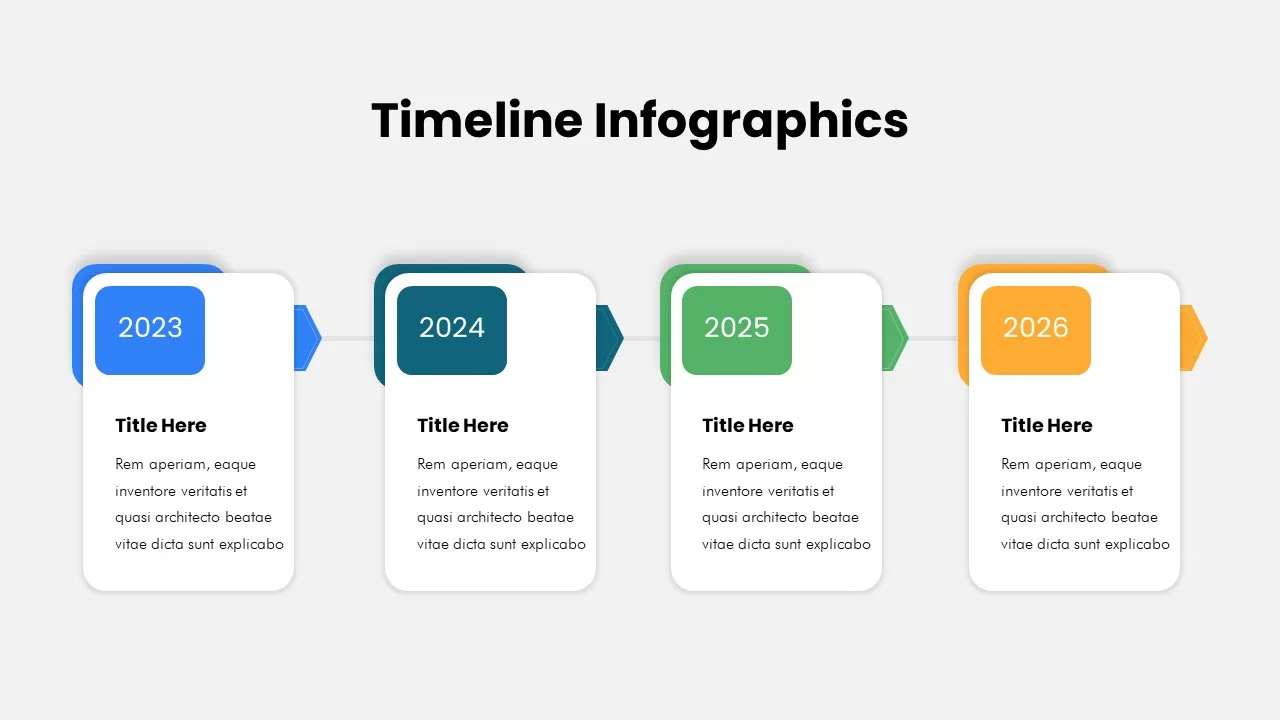
Professional Linear Timeline Infographic Template for PowerPoint & Google Slides
Timeline
Premium

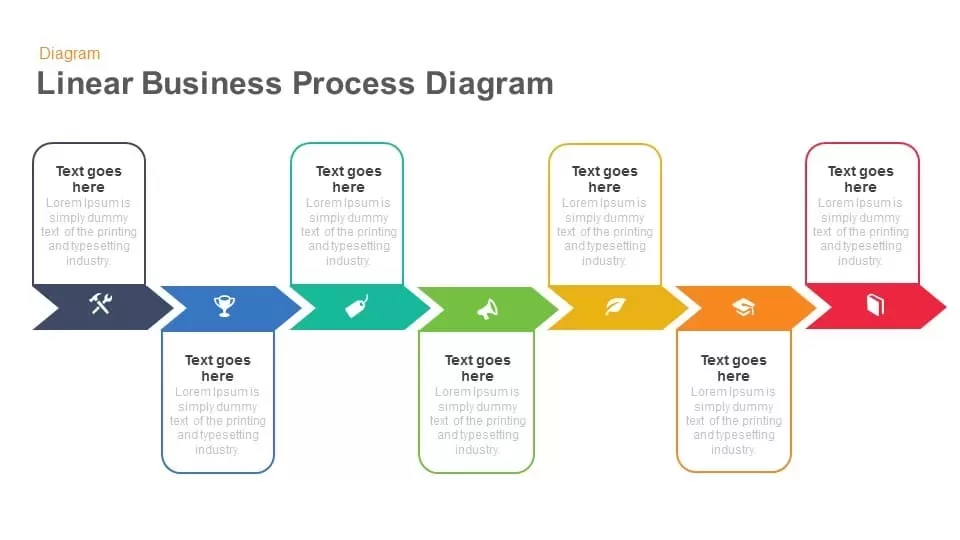
Linear Business Process Diagram template for PowerPoint & Google Slides
Process
Premium

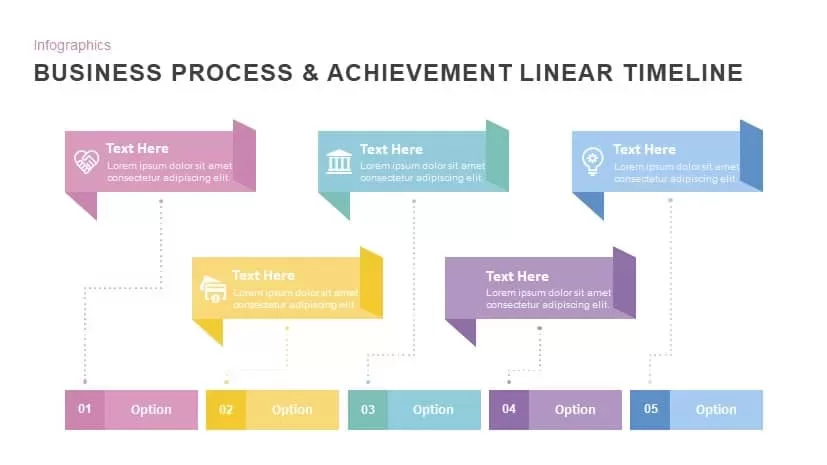
Business Process & Achievement Linear Timeline template for PowerPoint & Google Slides
Timeline
Premium
Six-Step Linear Arrow Process Diagram Template for PowerPoint & Google Slides
Process
Premium
Five Stage Linear Process Flow Diagram Template for PowerPoint & Google Slides
Process
Premium
Five-Stage Linear Process Flow Diagram Template for PowerPoint & Google Slides
Process
Premium
Four-Stage Linear Process Flow Diagram Template for PowerPoint & Google Slides
Process
Premium
5-Stage Linear Process Flow Diagram Template for PowerPoint & Google Slides
Process
Premium
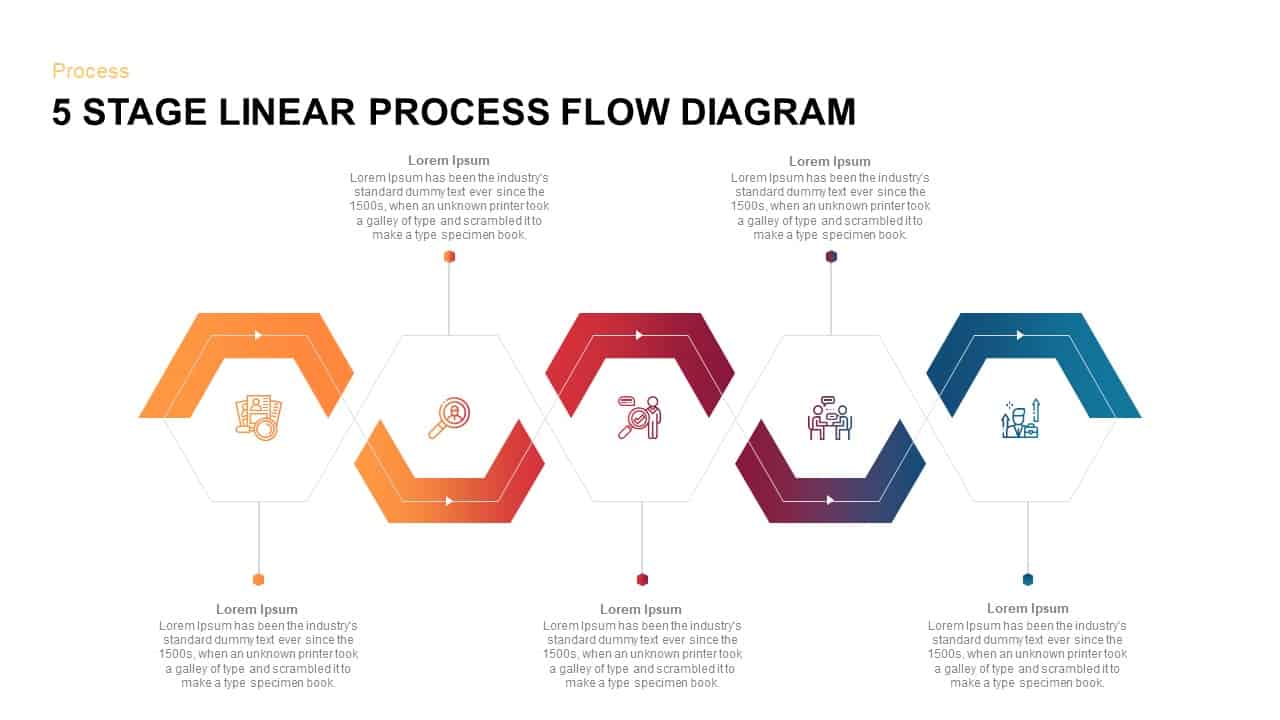
5 Stage Linear Process Flow Diagram Template for PowerPoint & Google Slides
Process
Premium
4 Stage Linear Process Flow Diagram Template for PowerPoint & Google Slides
Process
Premium
7 Stage Linear Process Flow Diagram Template for PowerPoint & Google Slides
Process
Premium
4 Stage Linear Process Flow Diagram Template for PowerPoint & Google Slides
Process
Premium
4-Stage Linear Process Flow Diagram Template for PowerPoint & Google Slides
Process
Premium
4-Step Linear Process Flow Diagram Template for PowerPoint & Google Slides
Process
Premium
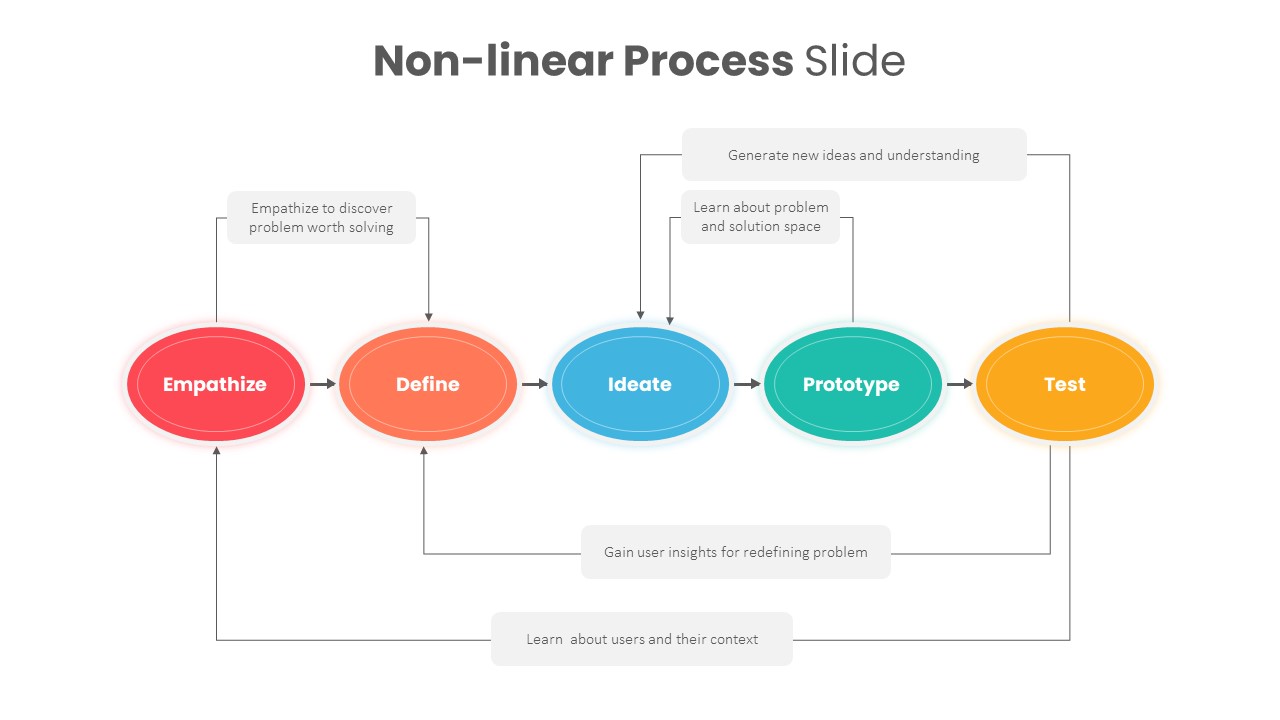
Non-linear Design Thinking Process Template for PowerPoint & Google Slides
Process
Premium
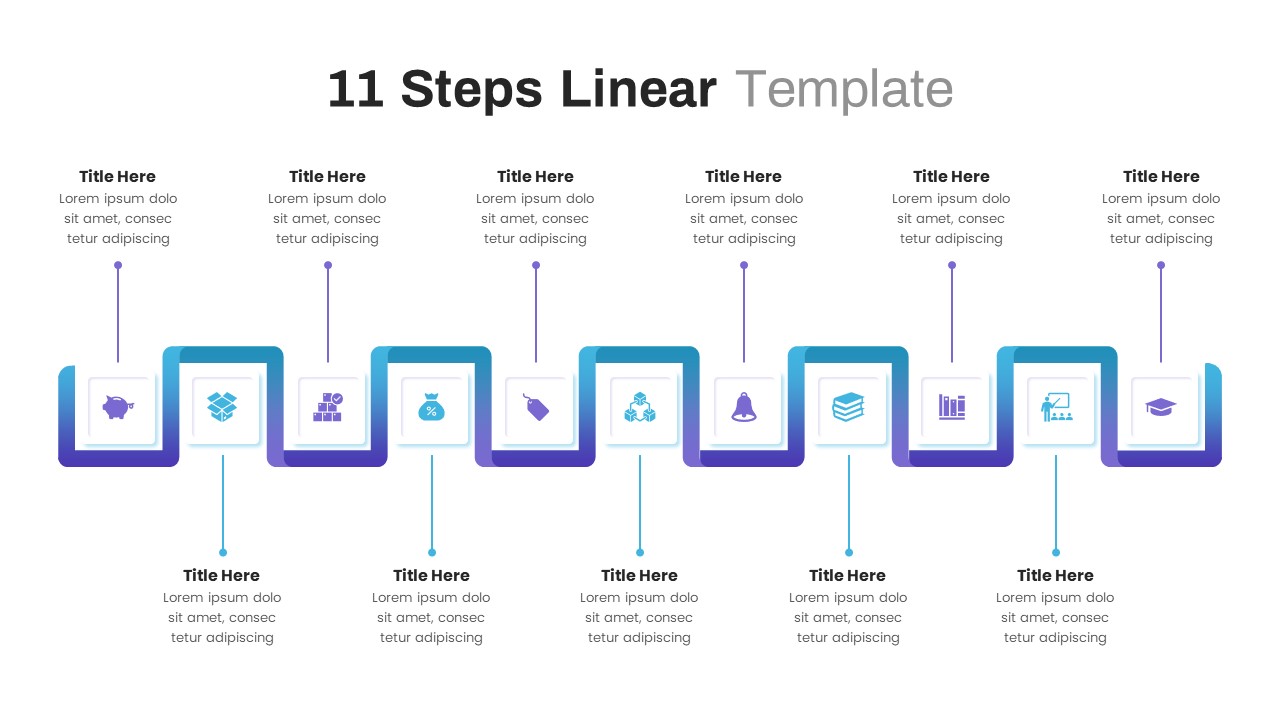
Modern 11-Step Linear Timeline Template for PowerPoint & Google Slides
Timeline
Premium
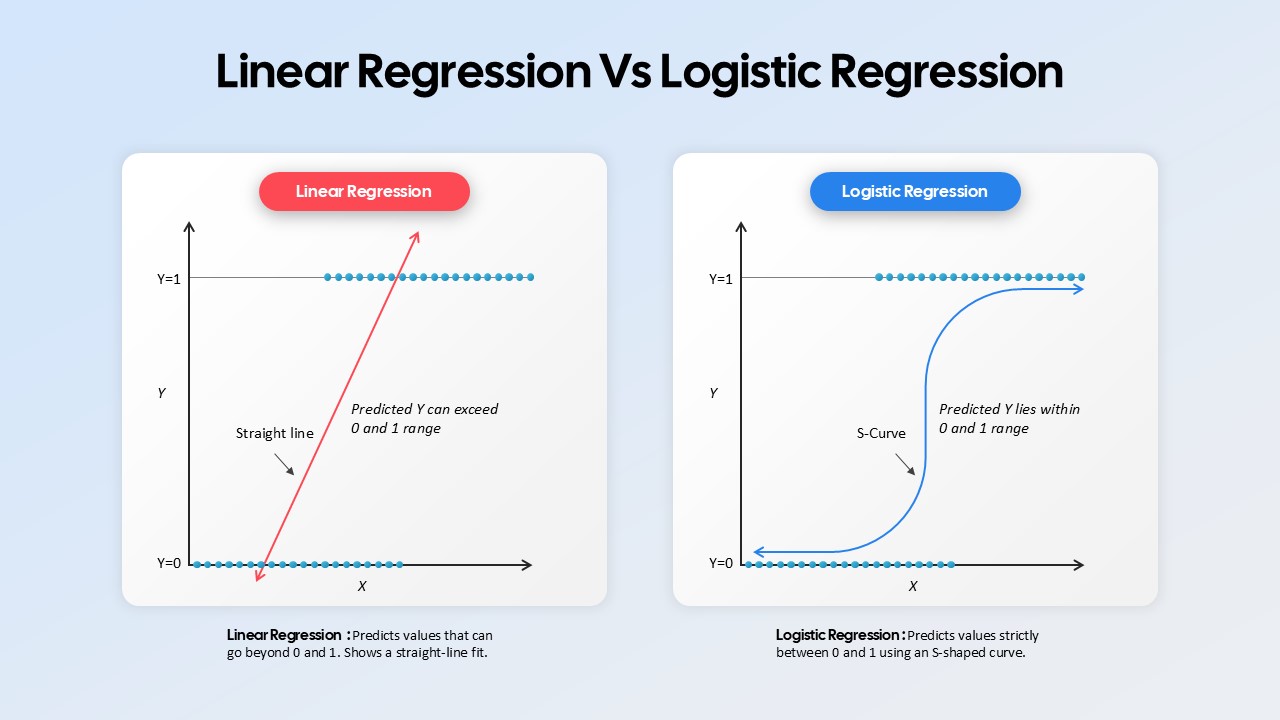
Linear Regression vs Logistic Regression Comparison template for PowerPoint & Google Slides
Comparison
Premium
Five and Six Step Line Linear Stage Diagram for PowerPoint & Google Slides
Infographics
Premium
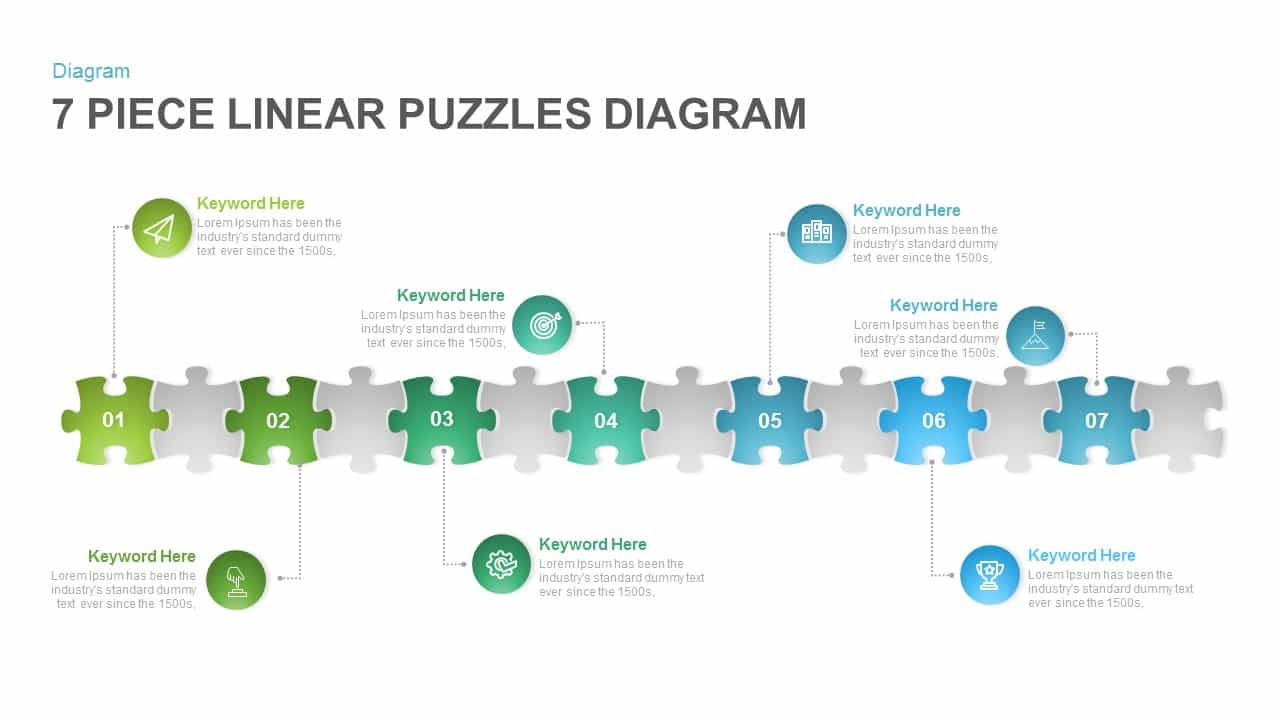
7 Piece Linear Puzzles Diagram for PowerPoint & Google Slides
Process
Premium
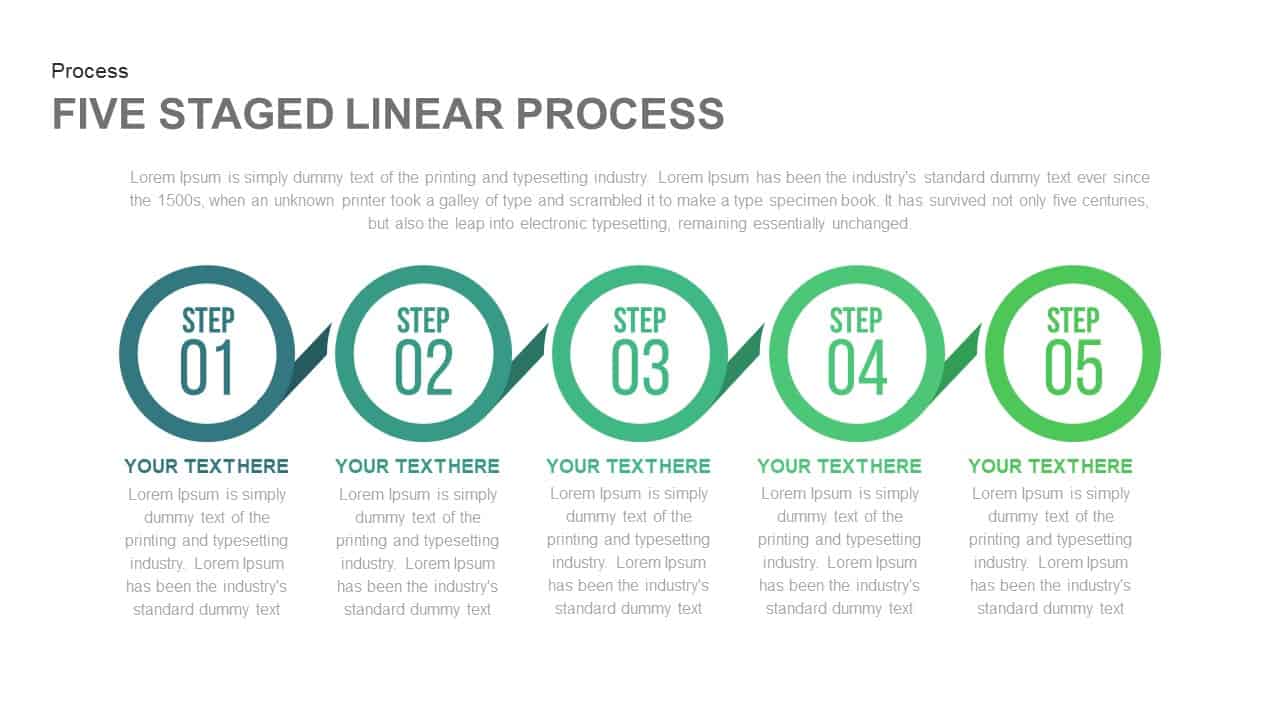
Five Staged Linear Process for PowerPoint & Google Slides
Process
Premium
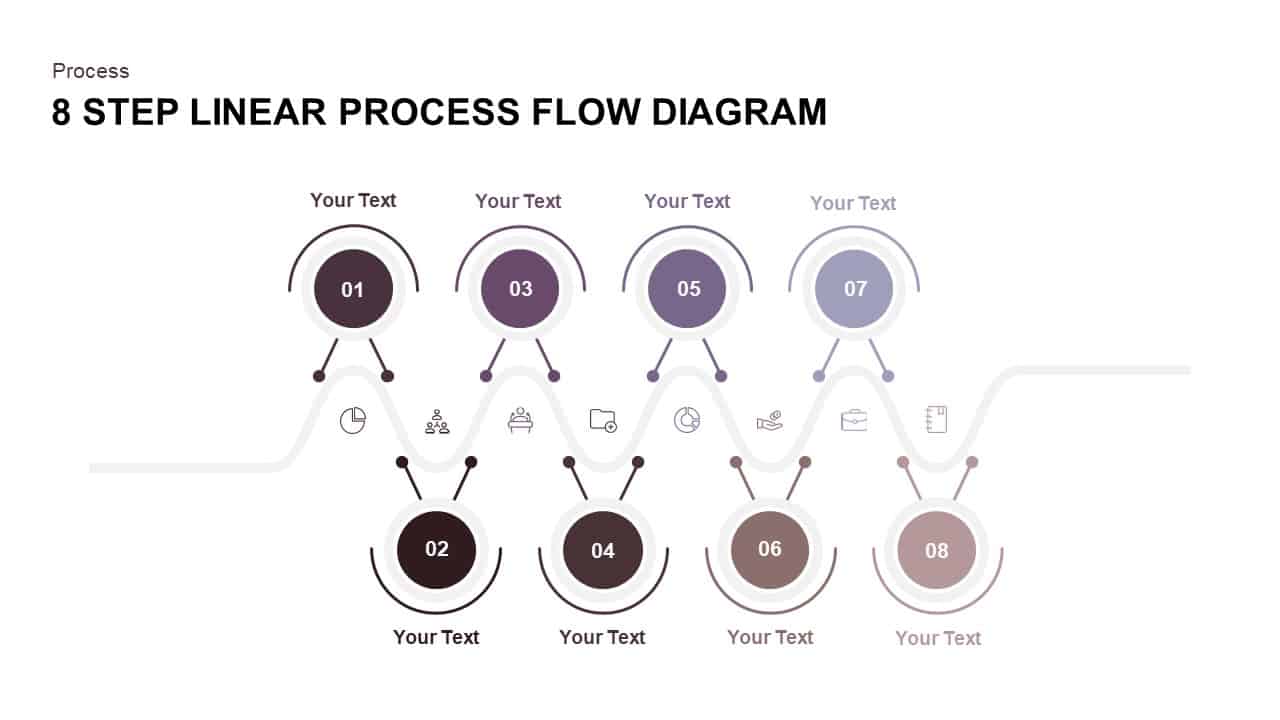
8 Step Linear Process Flow Diagram for PowerPoint & Google Slides
Process
Premium
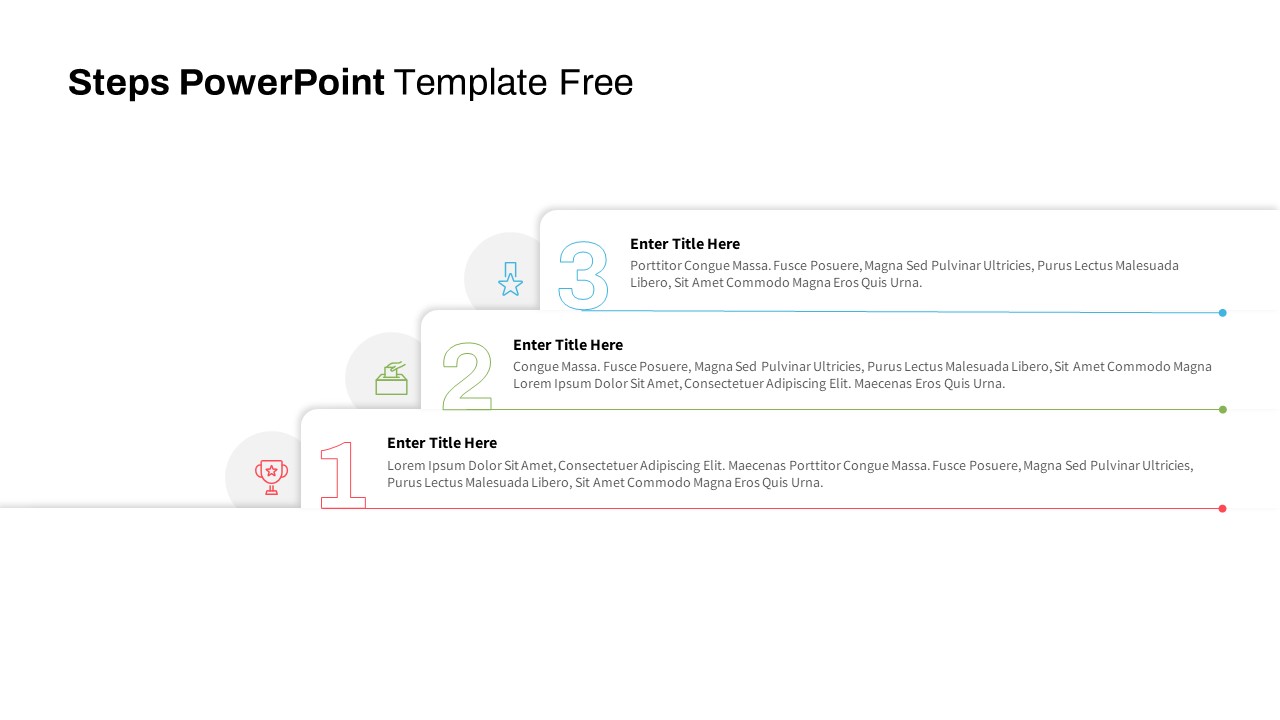
Free Linear Step Process Slide for PowerPoint & Google Slides
Process
Free
5 Steps Linear Process Flow Diagram template
Process
Premium
Free Cycle Object Infographics template for PowerPoint & Google Slides
Process
Free
Arrow Infographics template for PowerPoint & Google Slides
Infographics
Premium
3D Arrow Infographics Circular Flow Template for PowerPoint & Google Slides
Arrow
Premium
Car Gear Infographics Template for PowerPoint & Google Slides
Infographics
Premium
Modern Step Growth Infographics Template for PowerPoint & Google Slides
Process
Premium
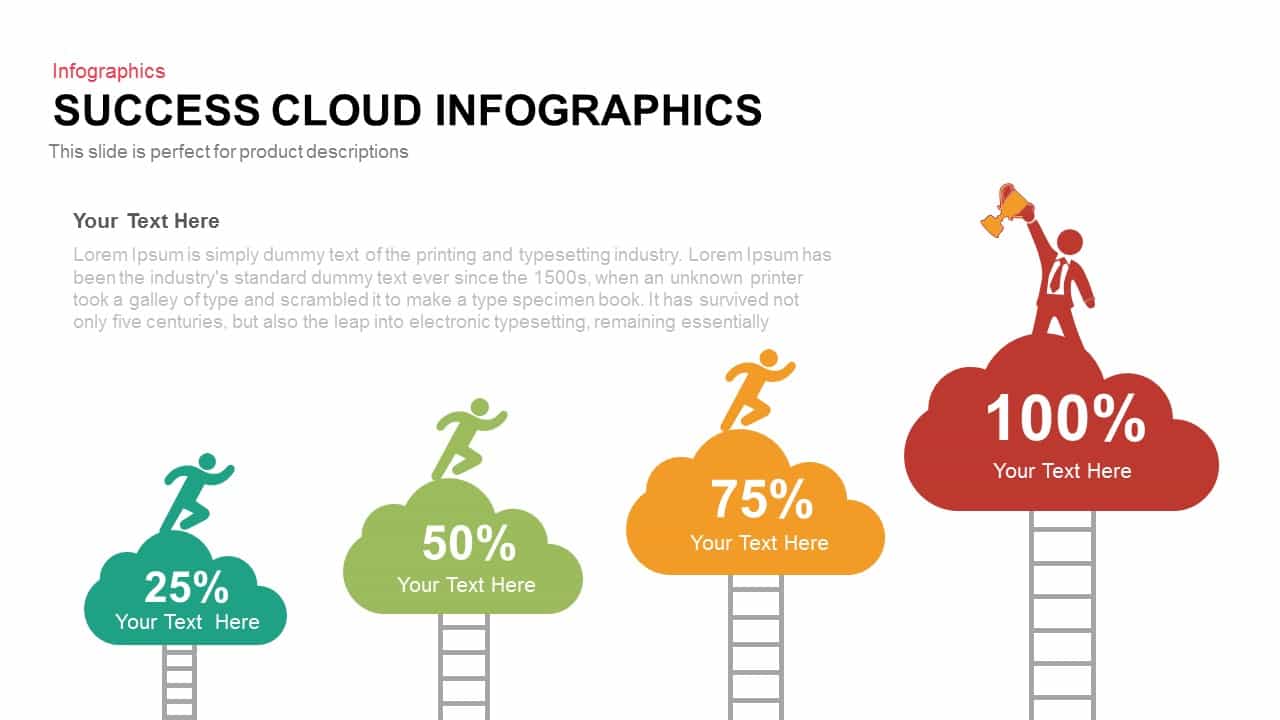
Success Cloud Progress Infographics Template for PowerPoint & Google Slides
Charts
Premium

Dynamic Circle Timeline Infographics template for PowerPoint & Google Slides
Timeline
Premium

Arrow Step Infographics Workflow Template for PowerPoint & Google Slides
Arrow
Premium
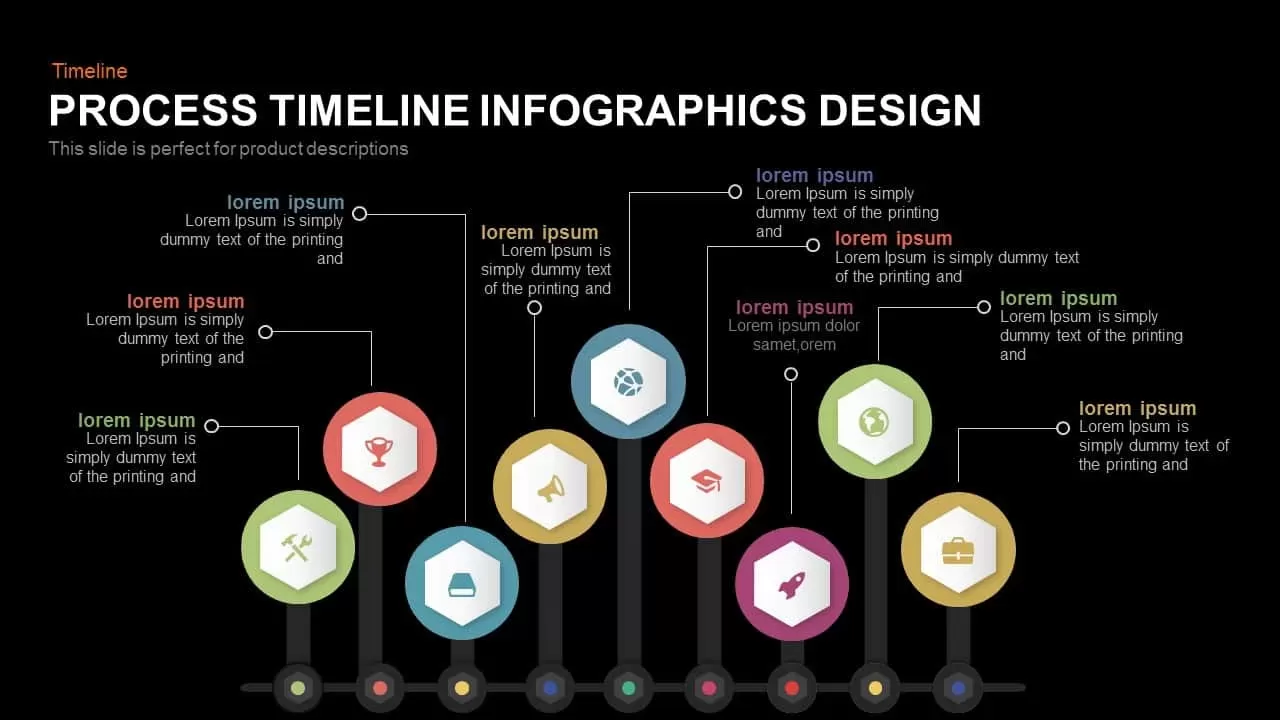
Process Timeline Infographics Design template for PowerPoint & Google Slides
Timeline
Premium
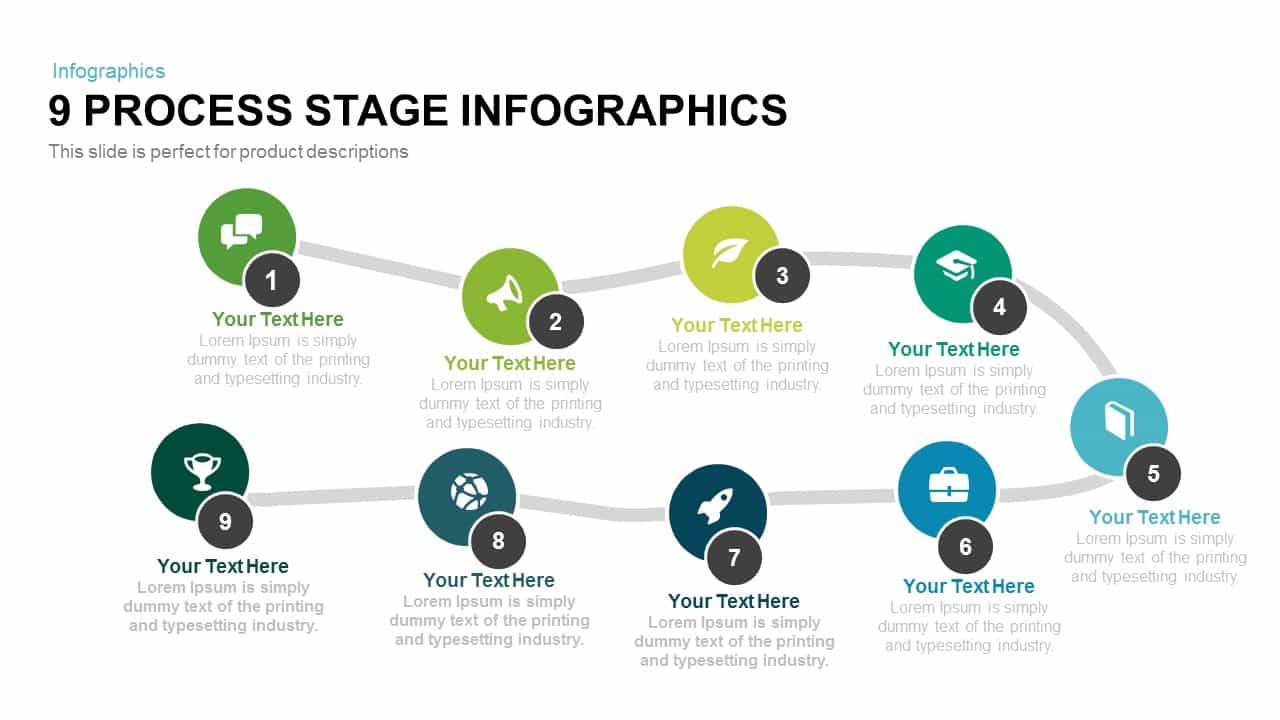
9 Process Stage Infographics template for PowerPoint & Google Slides
Process
Premium
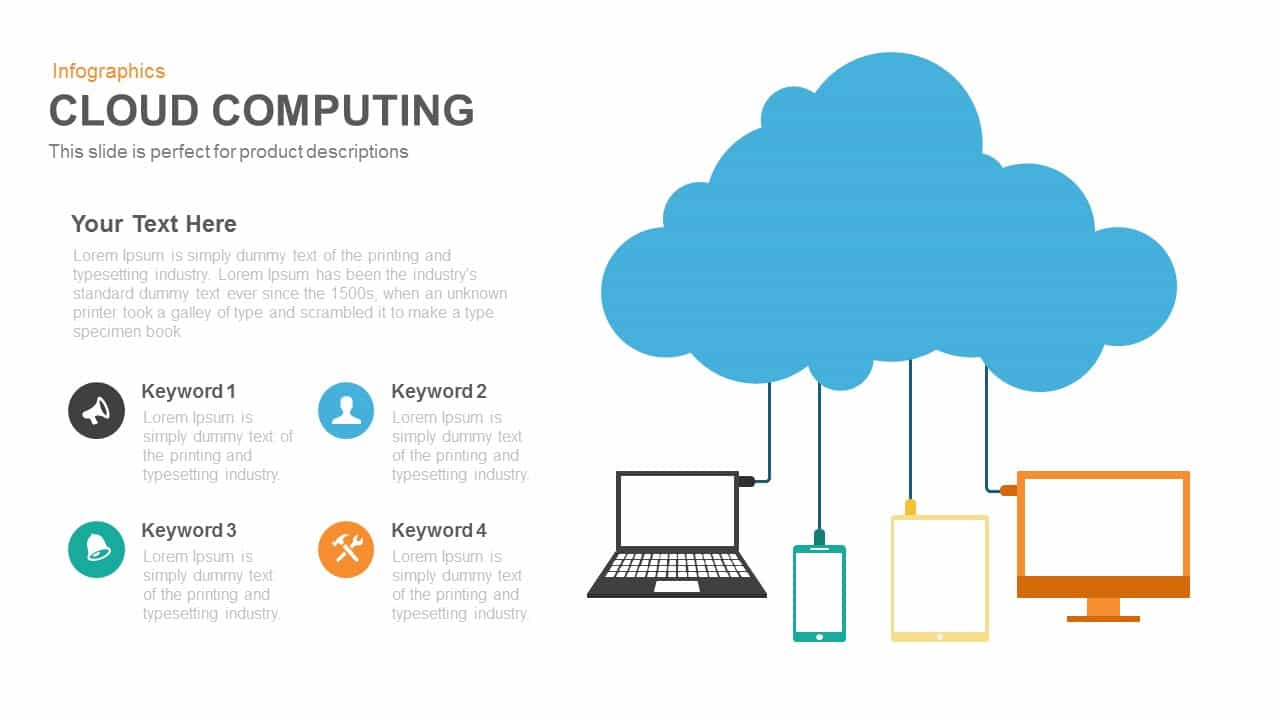
Cloud Computing Infographics template for PowerPoint & Google Slides
Cloud Computing
Premium
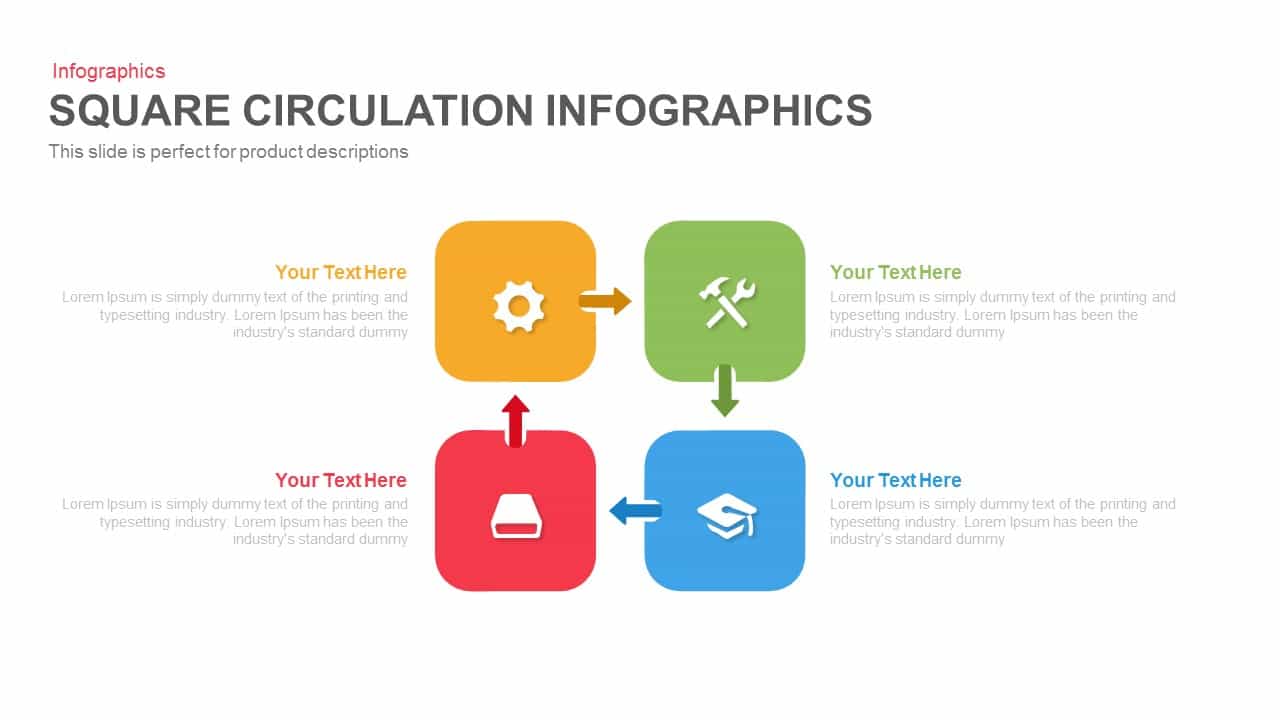
Square Circulation Infographics Template for PowerPoint & Google Slides
Process
Premium
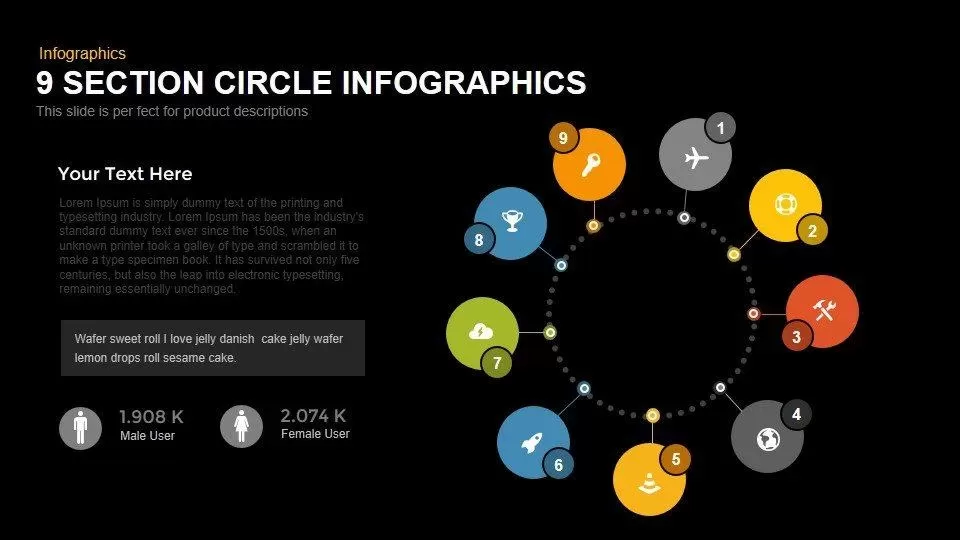
Modern 9-Section Circle Infographics Template for PowerPoint & Google Slides
Circle
Premium
3D Four-Directional Arrow Infographics Template for PowerPoint & Google Slides
Arrow
Premium
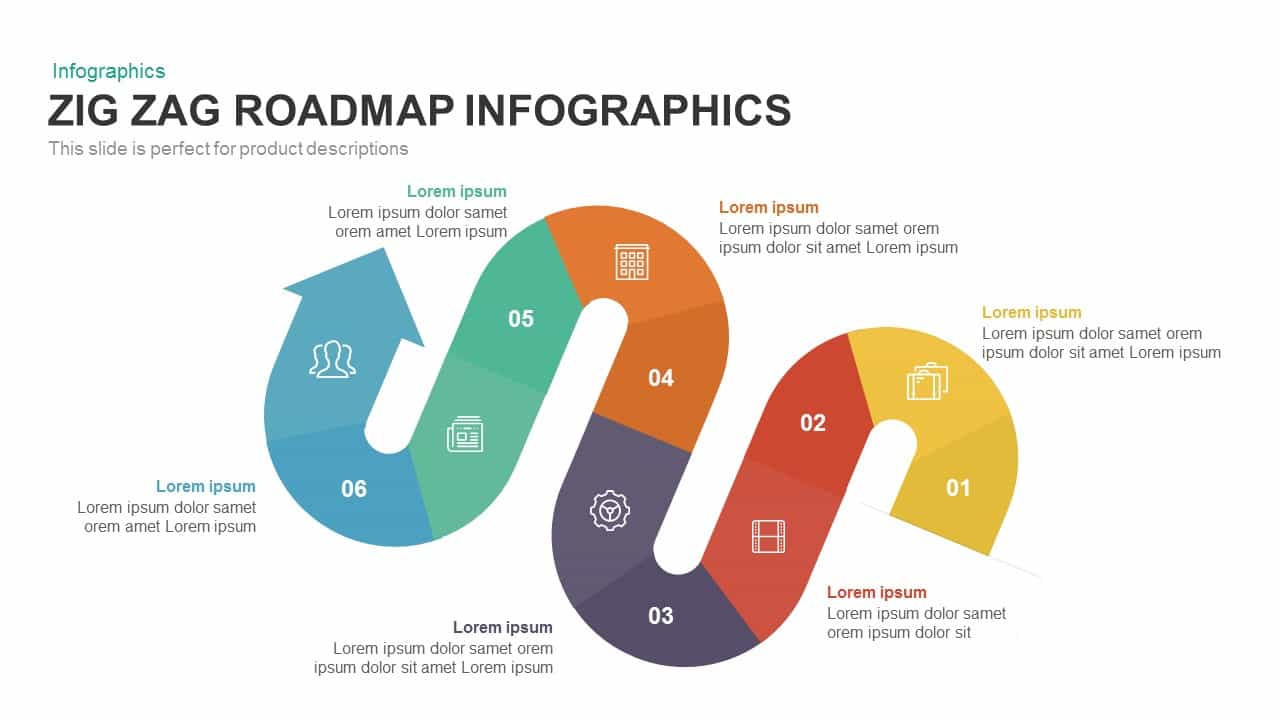
Six-Stage Zig-Zag Roadmap Infographics Template for PowerPoint & Google Slides
Roadmap
Premium
Timeline Arrow Infographics Diagram Template for PowerPoint & Google Slides
Timeline
Premium
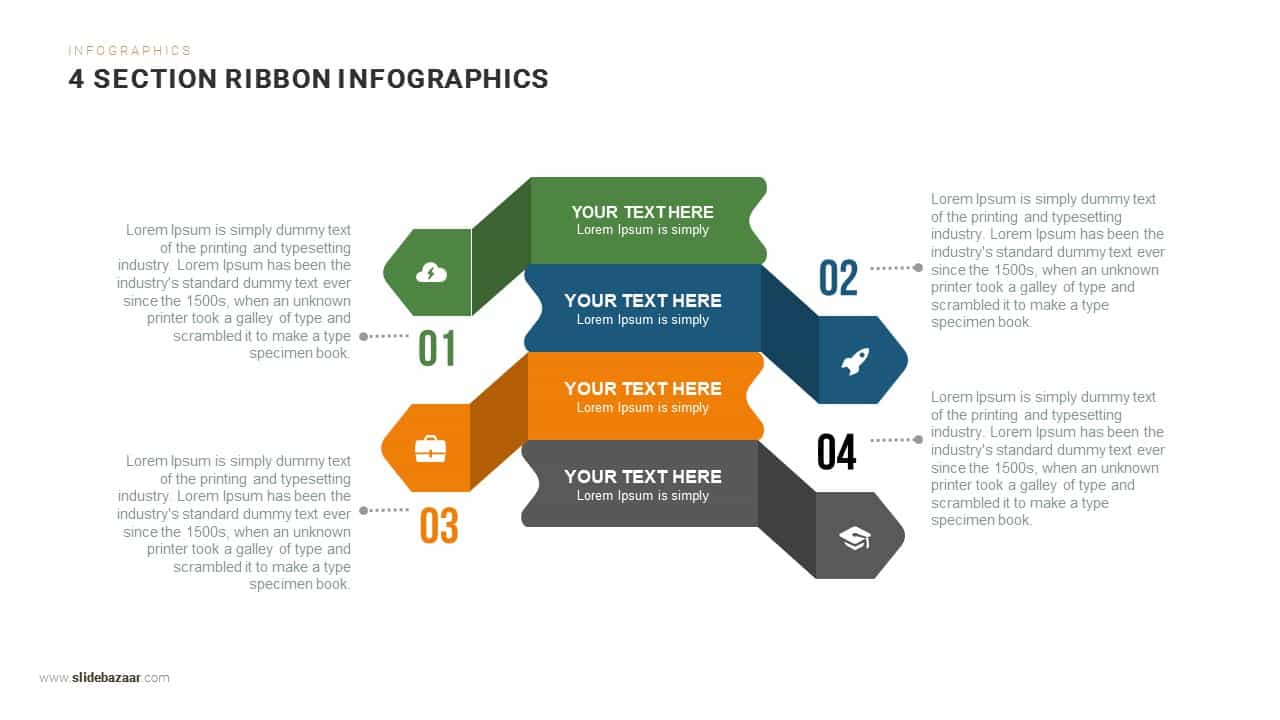
Four-Section Ribbon Infographics Template for PowerPoint & Google Slides
Process
Premium
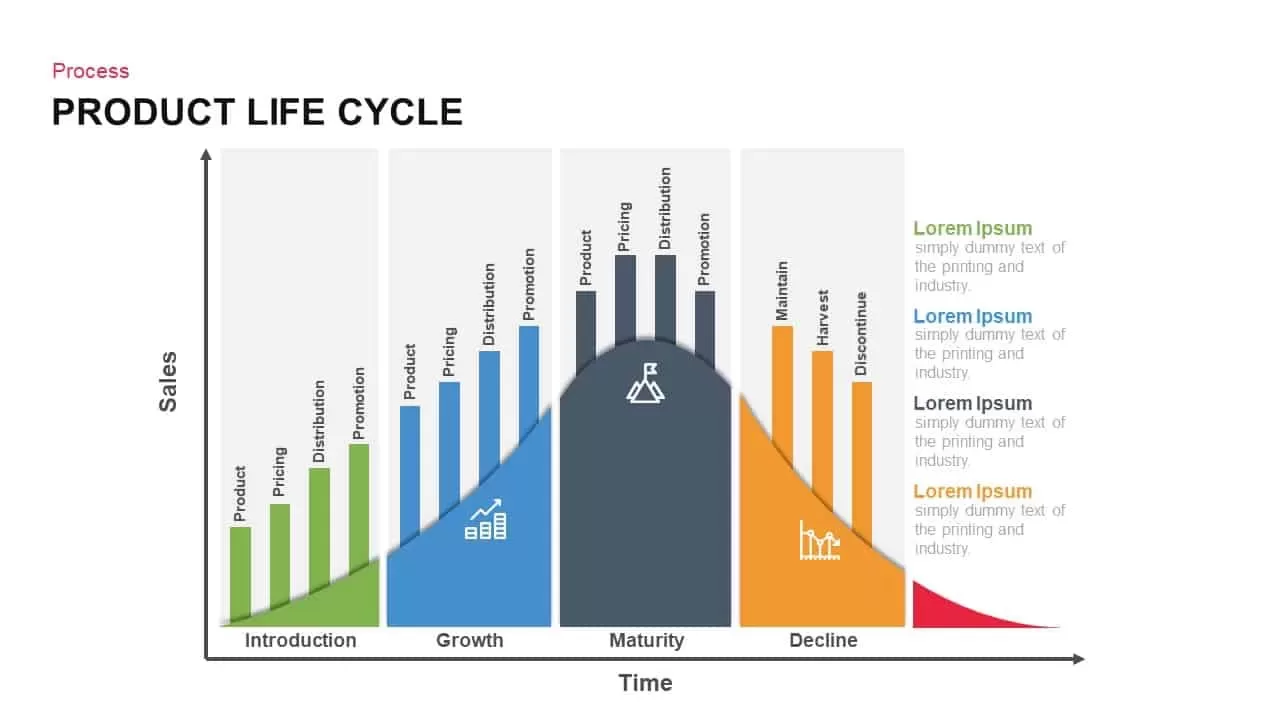
Product Life Cycle Infographics template for PowerPoint & Google Slides
Business
Premium
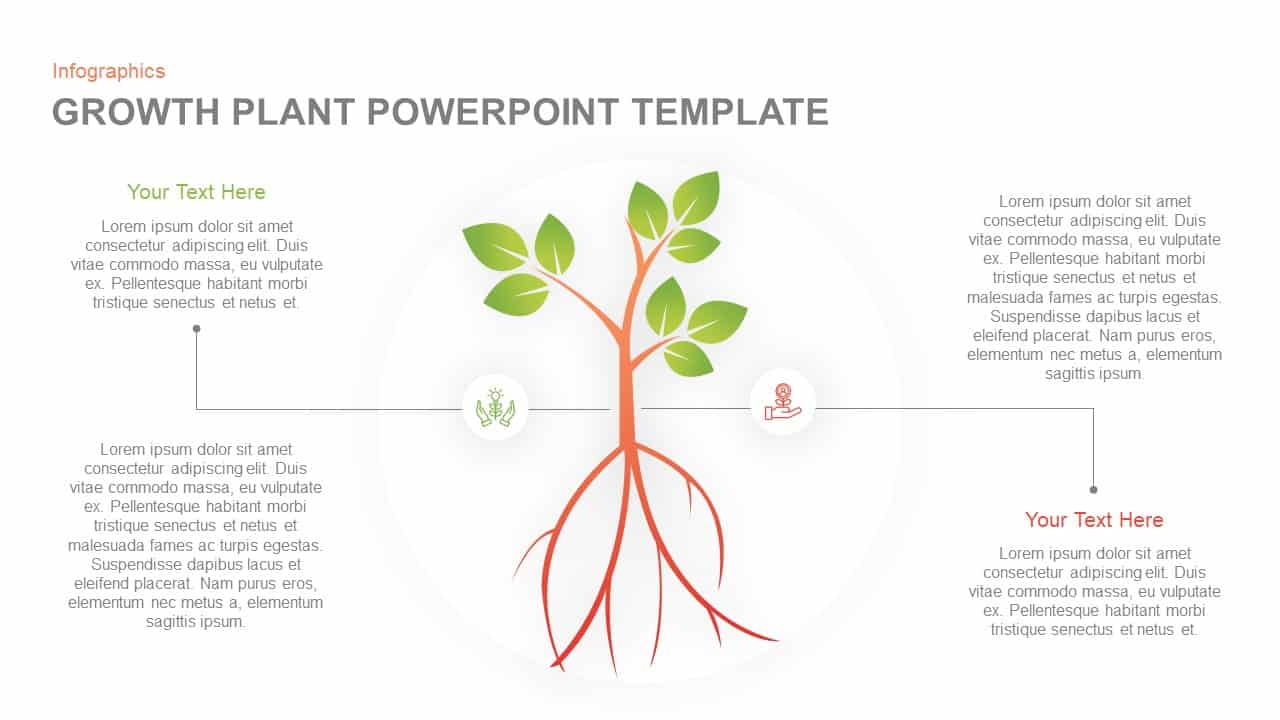
Growth Plant Infographics template for PowerPoint & Google Slides
Process
Premium
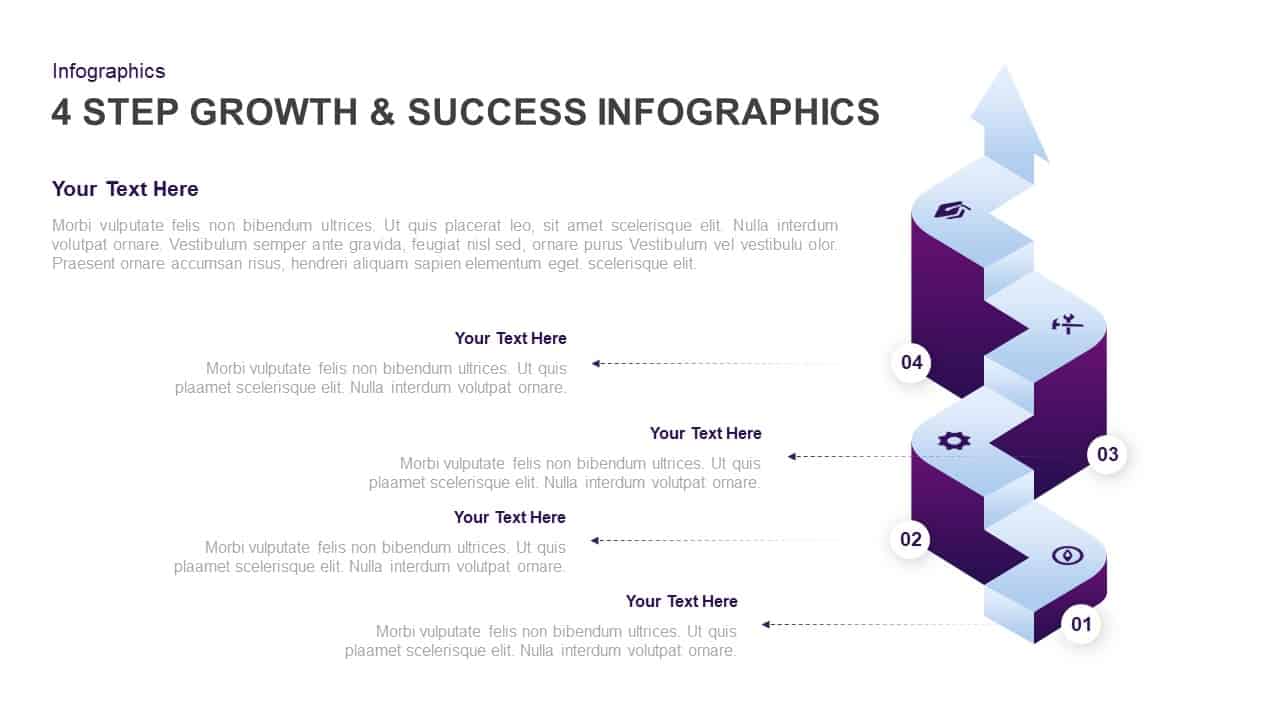
4-Step Growth & Success Infographics Template for PowerPoint & Google Slides
Accomplishment
Premium
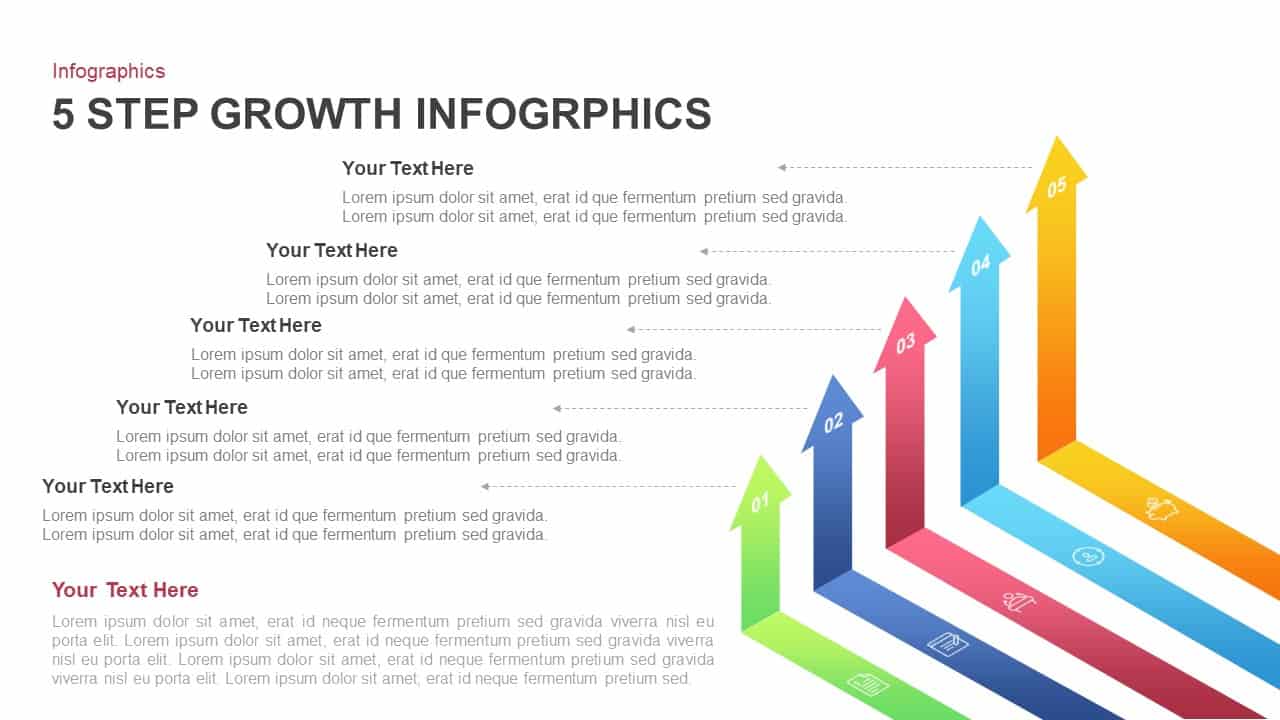
5-Step Growth Arrow Infographics Template for PowerPoint & Google Slides
Arrow
Premium
Colorful Venn Diagram Infographics Template for PowerPoint & Google Slides
Circle
Premium
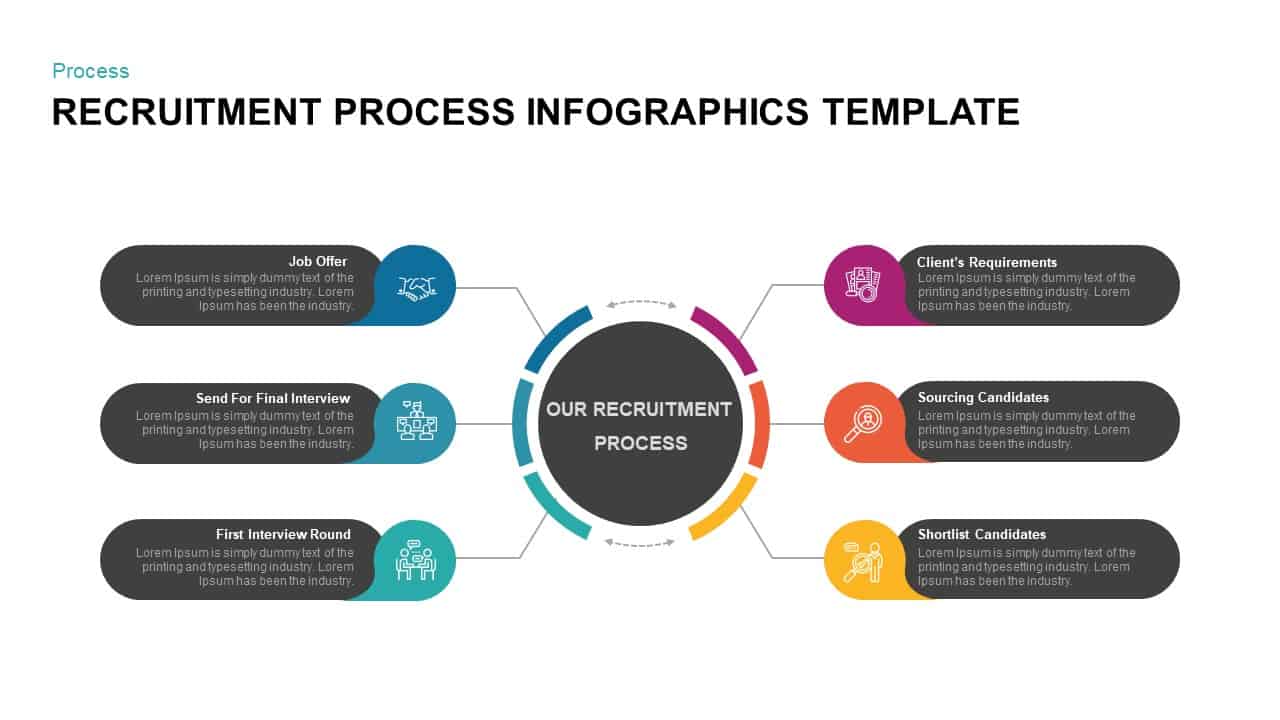
Recruitment Process Infographics Template for PowerPoint & Google Slides
Process
Premium
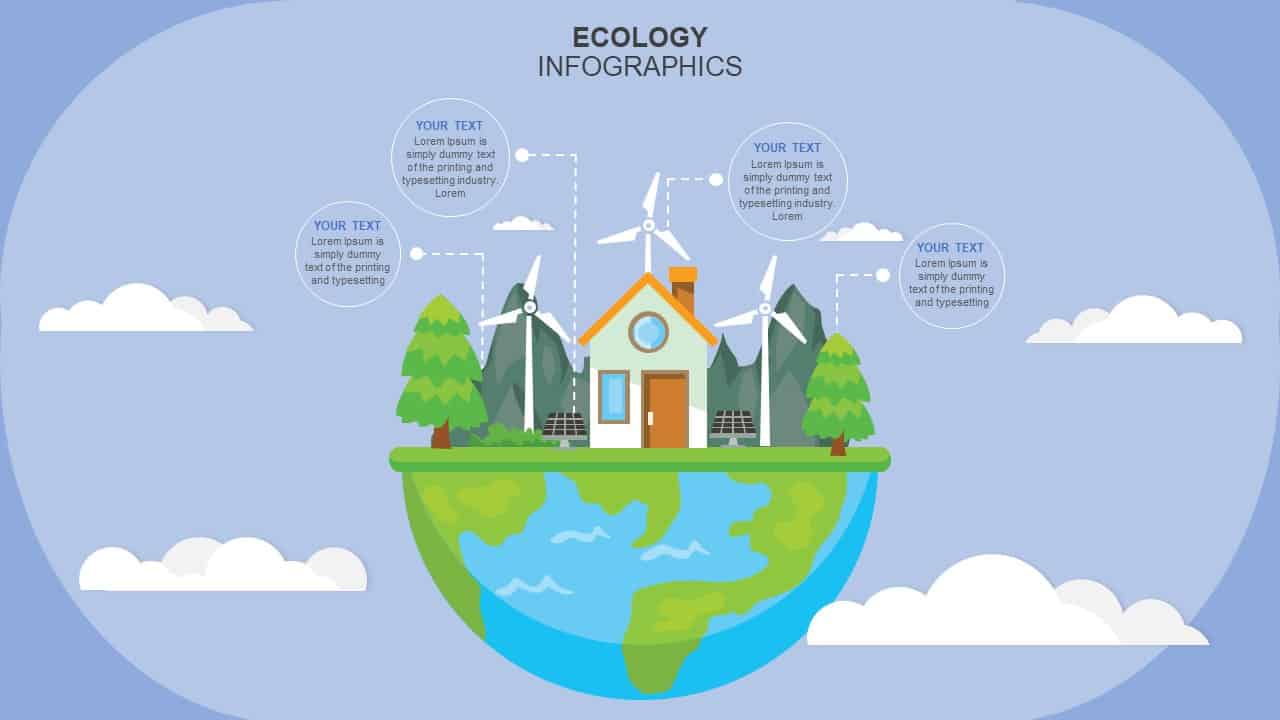
Ecology Infographics Overview template for PowerPoint & Google Slides
Business Proposal
Premium
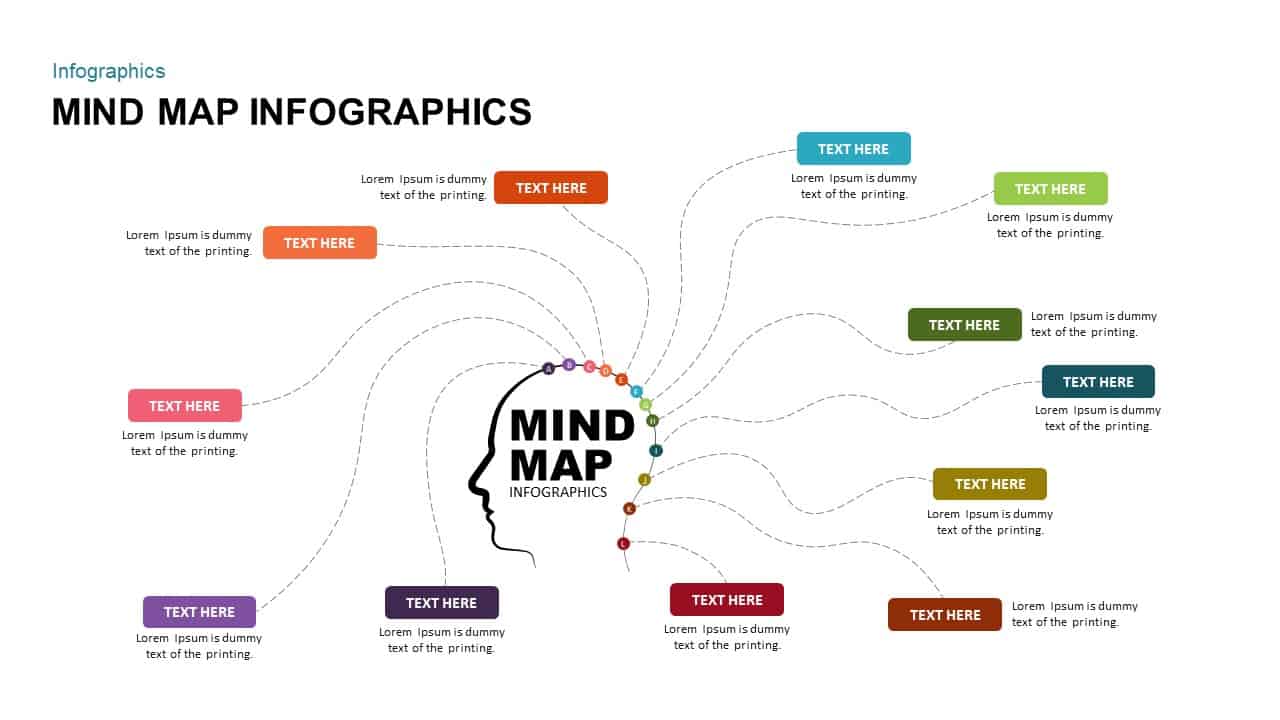
Mind Map Infographics template for PowerPoint & Google Slides
Mind Maps
Premium

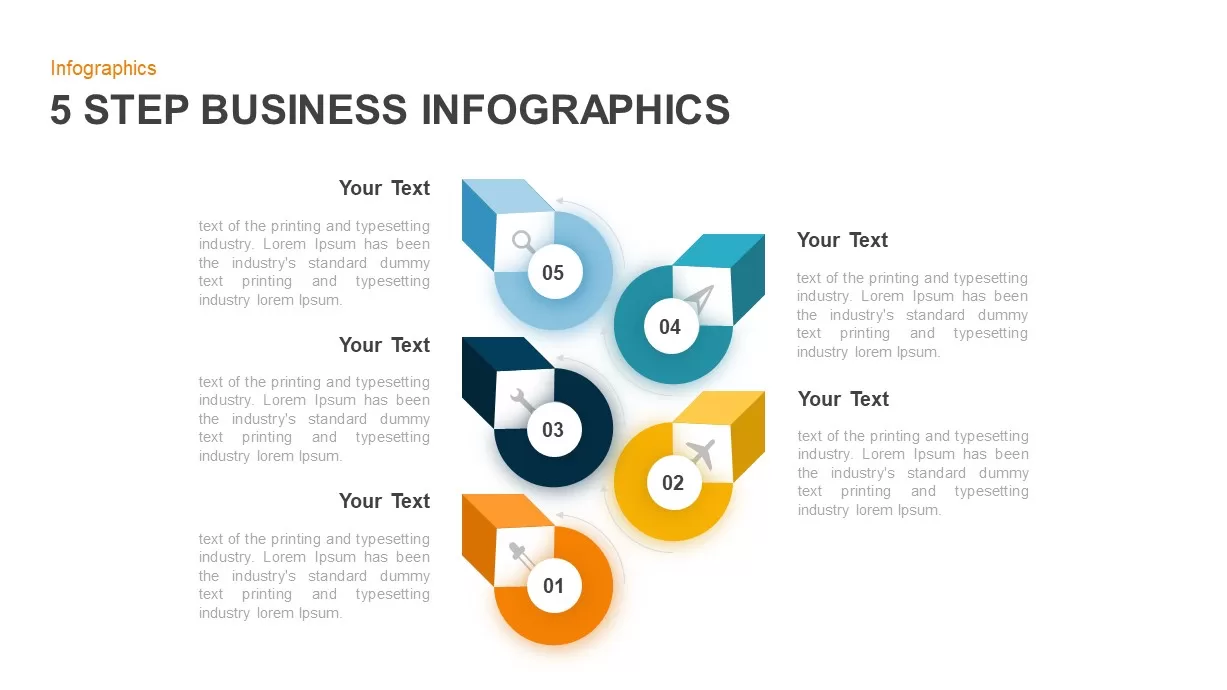
Five-Step Business Infographics Template for PowerPoint & Google Slides
Infographics
Premium
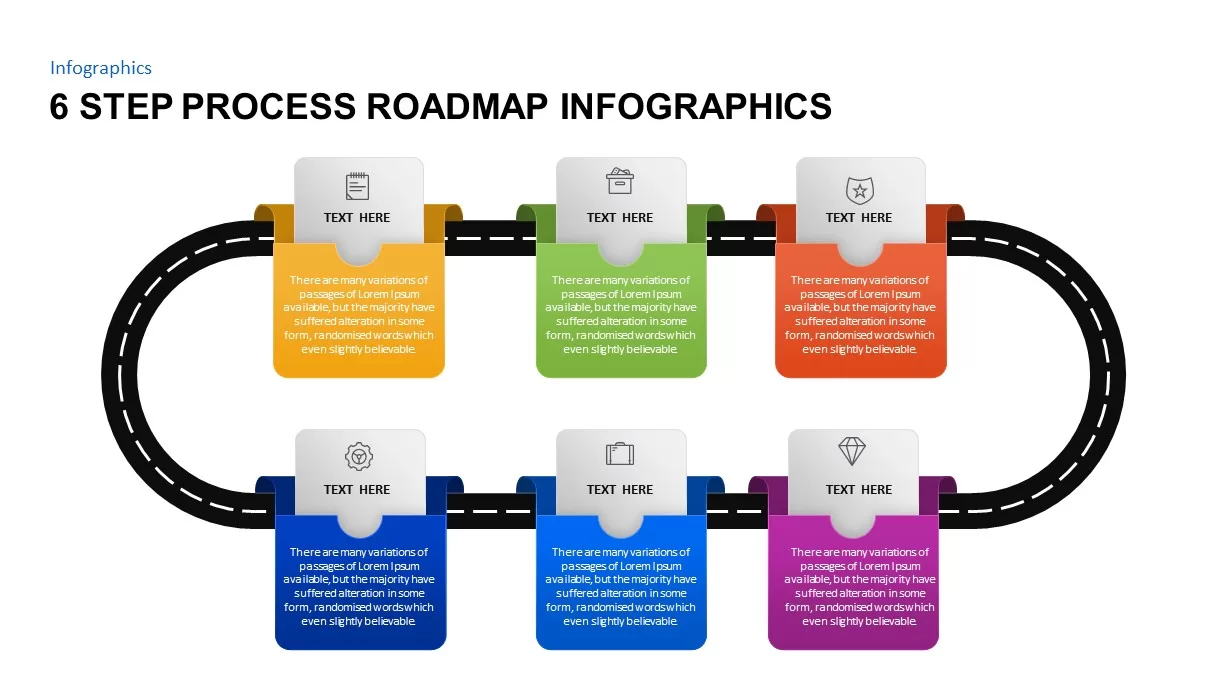
6 Step Process Roadmap Infographics Template for PowerPoint & Google Slides
Roadmap
Premium
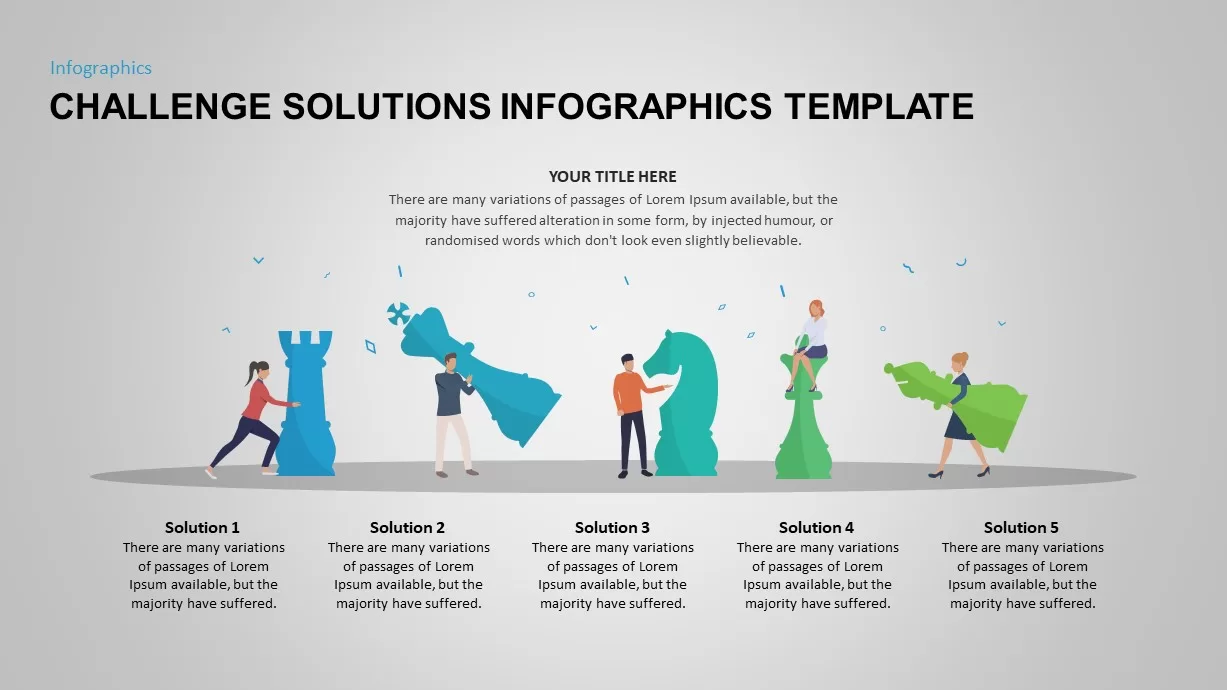
Challenge Solutions Infographics Template for PowerPoint & Google Slides
Opportunities Challenges
Premium
Four-Step Circular Process Infographics Template for PowerPoint & Google Slides
Circle
Premium
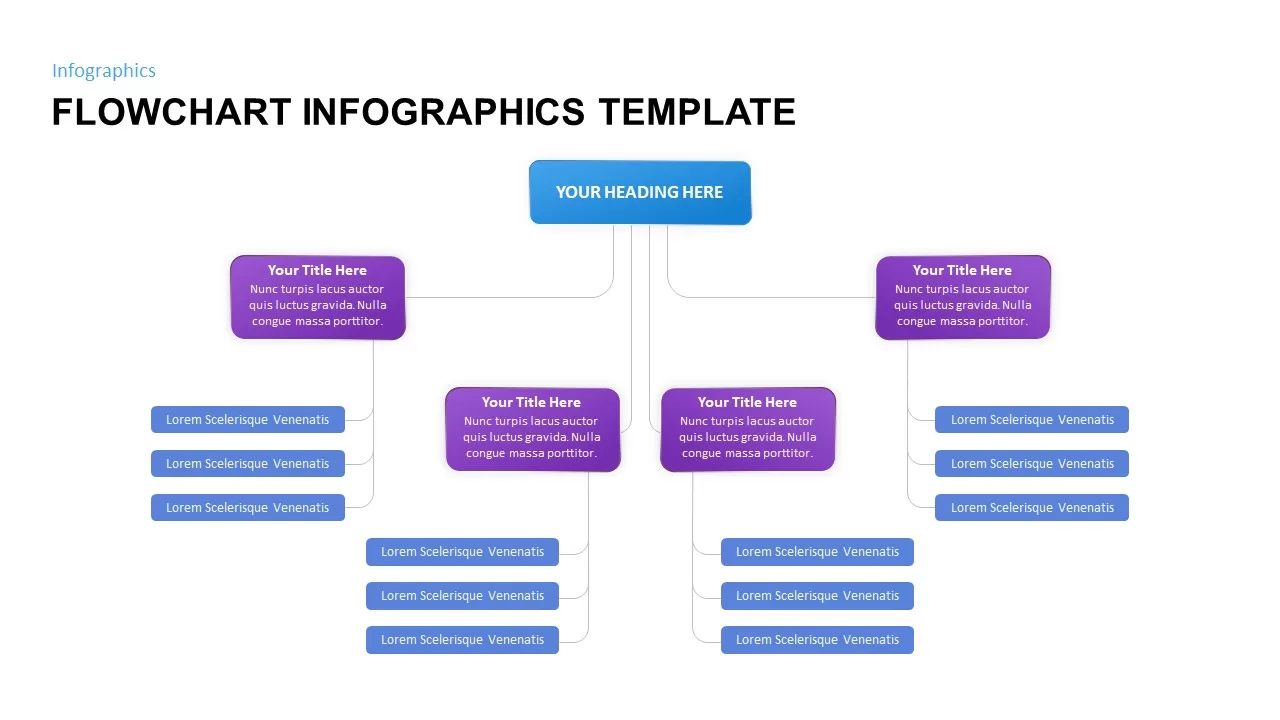
Flowchart Infographics Template for PowerPoint & Google Slides
Infographics
Premium
Business Growth Plant Infographics Pack Template for PowerPoint & Google Slides
Process
Premium
8-Step Circular Diagram Infographics Template for PowerPoint & Google Slides
Circle
Premium
Dynamic Gear Diagram Infographics Template for PowerPoint & Google Slides
Process
Premium
Floating Island Ecosystem Infographics Template for PowerPoint & Google Slides
Graphics
Premium
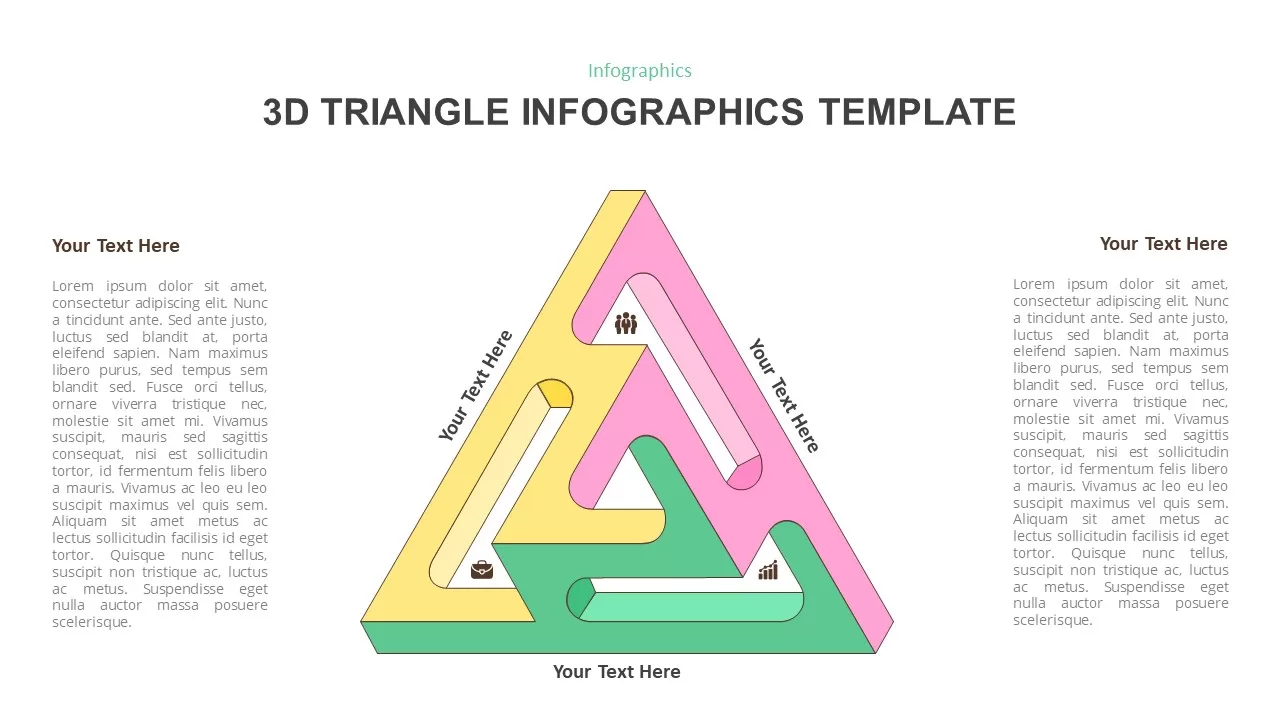
Versatile 3D Modular Shape Infographics Template for PowerPoint & Google Slides
Infographics
Premium
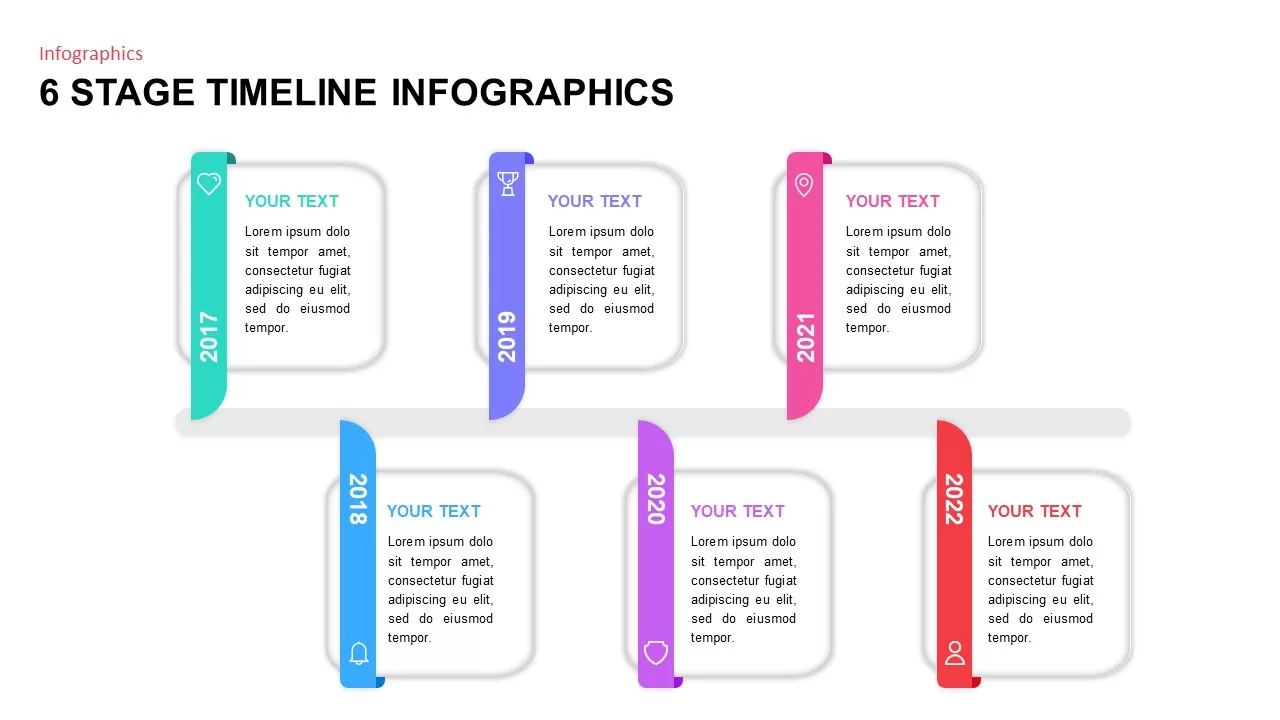
6 Stage Timeline Infographics template for PowerPoint & Google Slides
Timeline
Premium

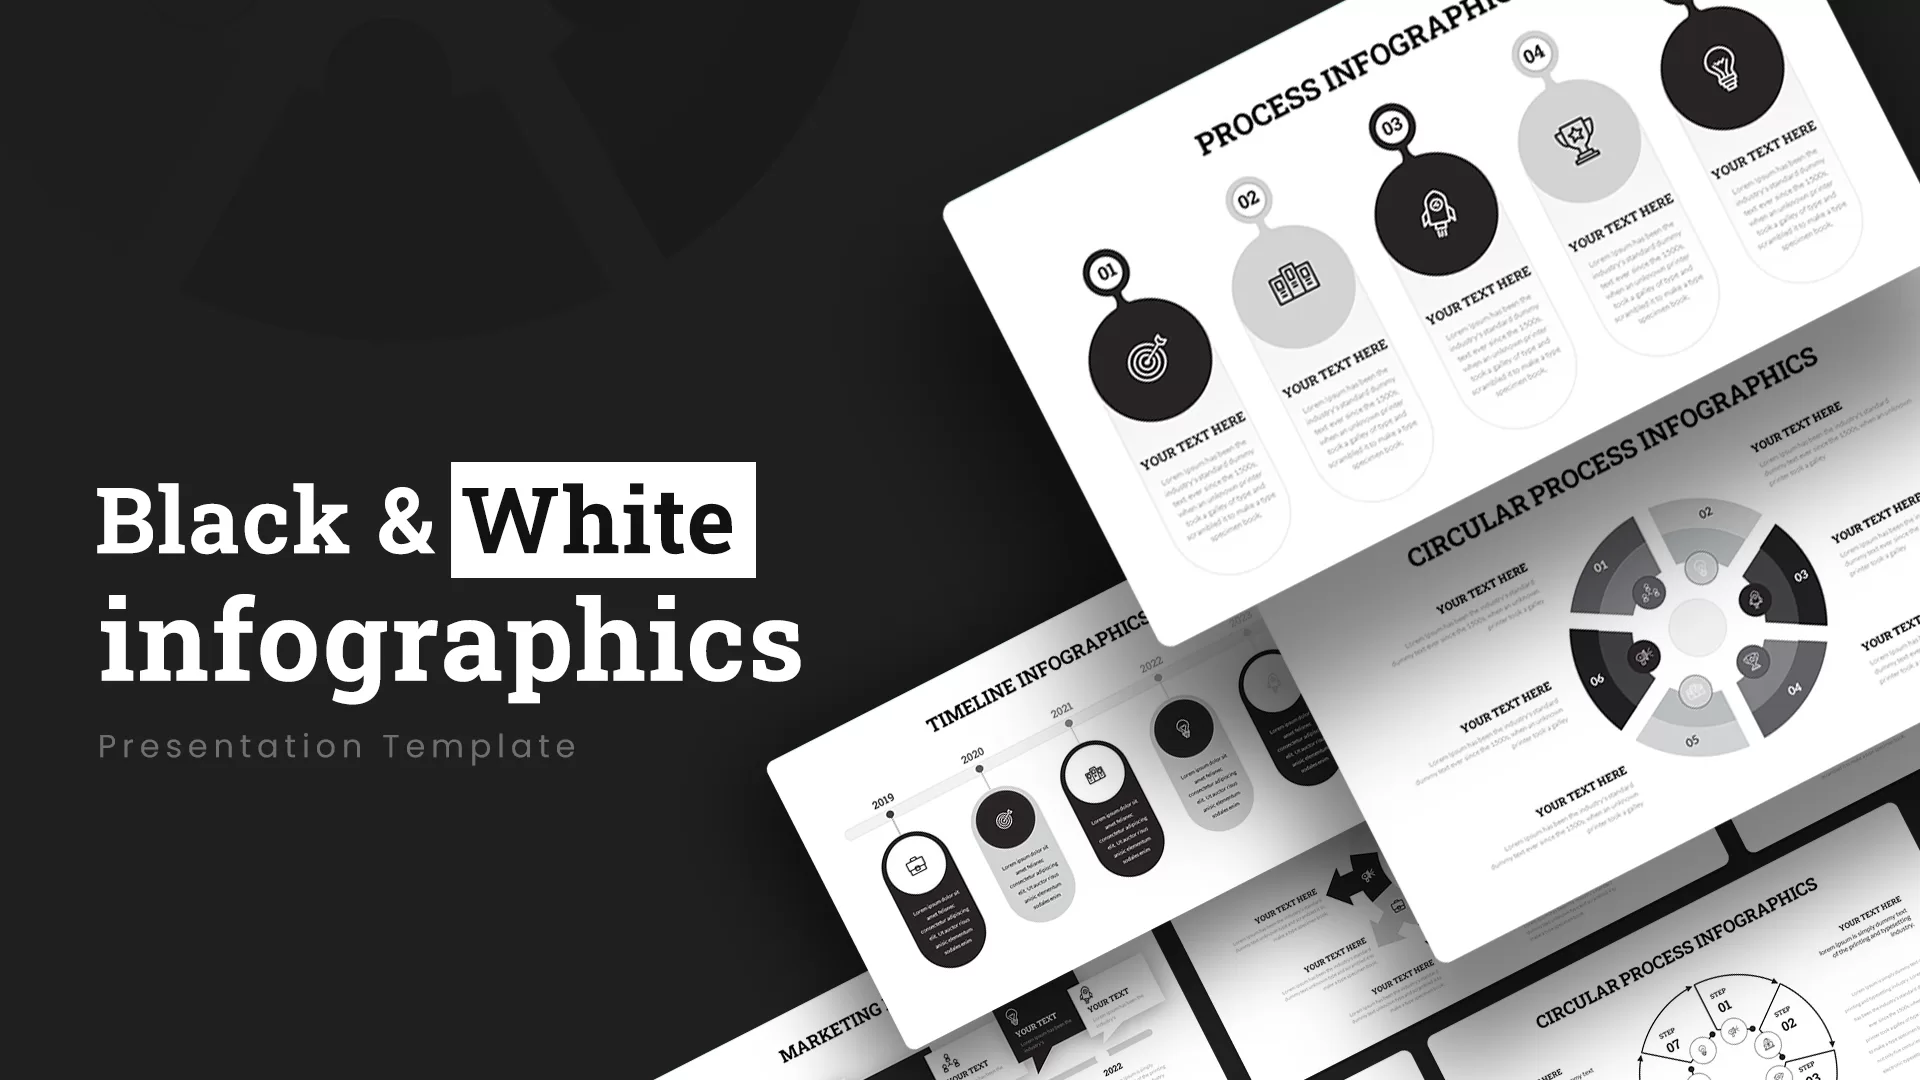
Black and White Infographics template for PowerPoint & Google Slides
Business
Premium
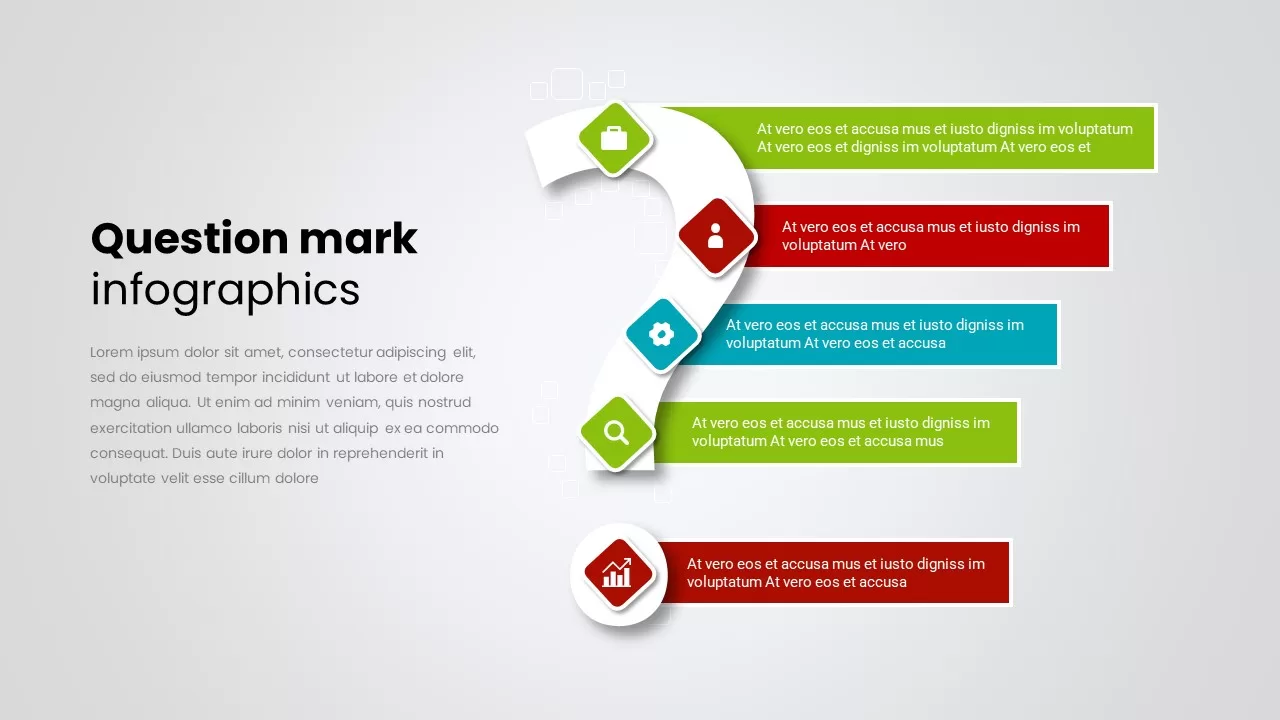
Question Mark Infographics template for PowerPoint & Google Slides
Infographics
Premium
Animated Timeline Infographics template for PowerPoint & Google Slides
Timeline
Premium
Before and After Comparison Infographics Template for PowerPoint & Google Slides
Comparison
Premium
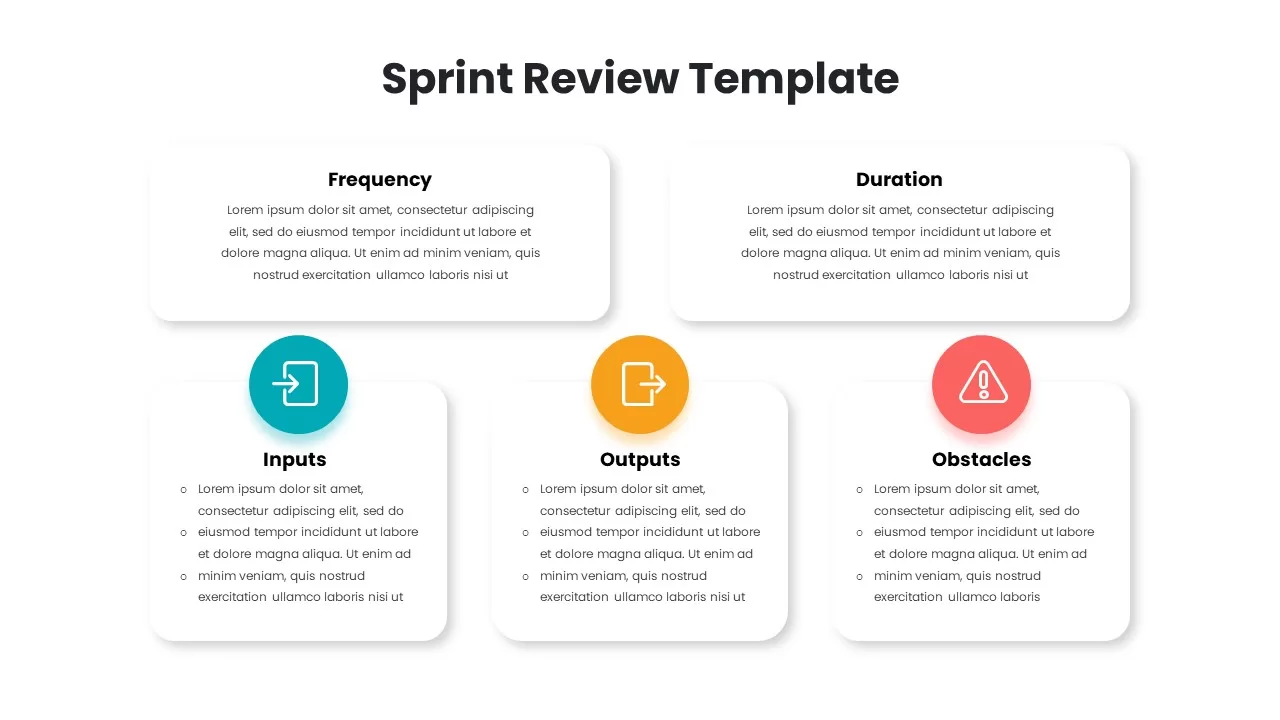
Sprint Review Process Infographics Pack Template for PowerPoint & Google Slides
Infographics
Premium
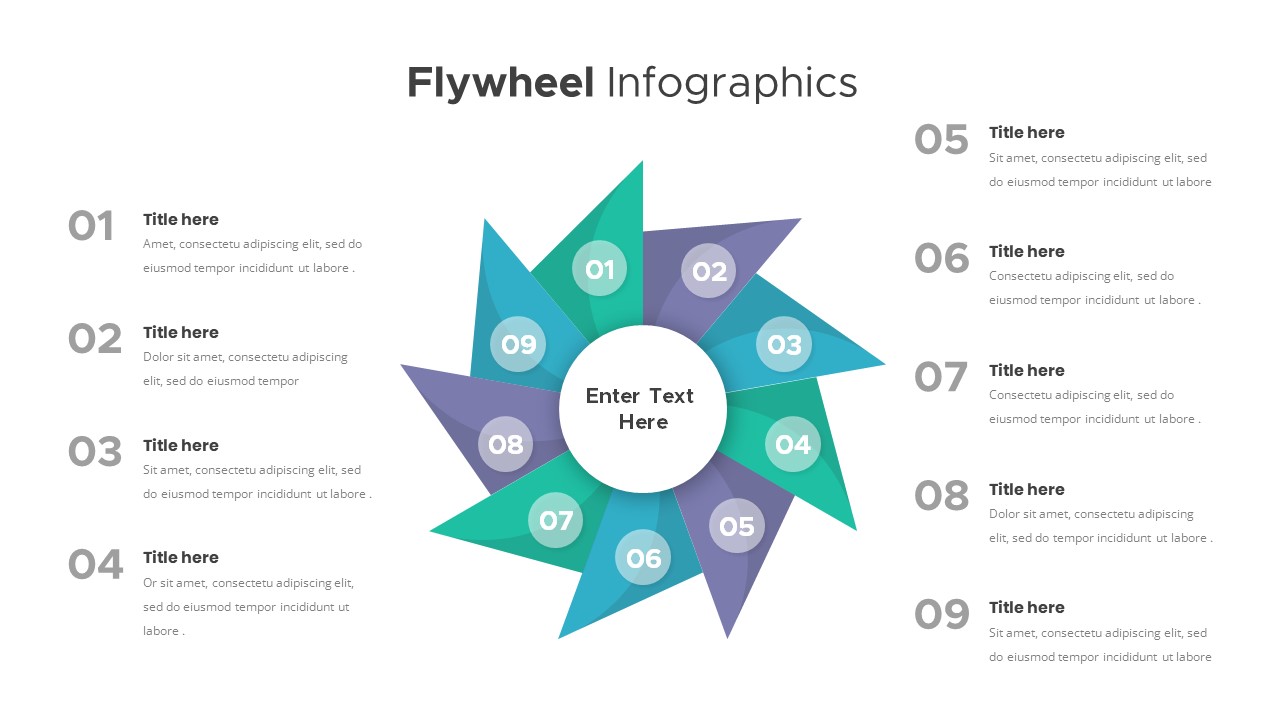
Flywheel Infographics template for PowerPoint & Google Slides
Process
Premium
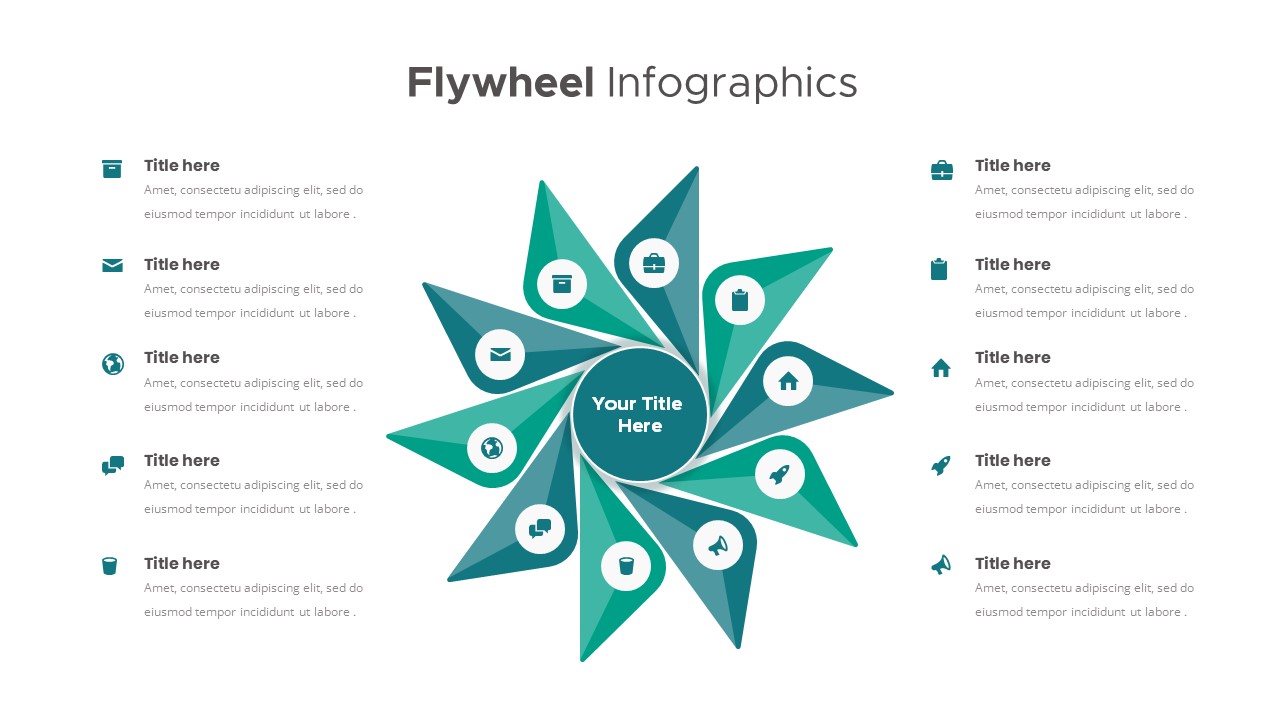
Flywheel Infographics template for PowerPoint & Google Slides
Business Strategy
Premium
Social Media Hub-and-Spoke Infographics Template for PowerPoint & Google Slides
Circle
Premium

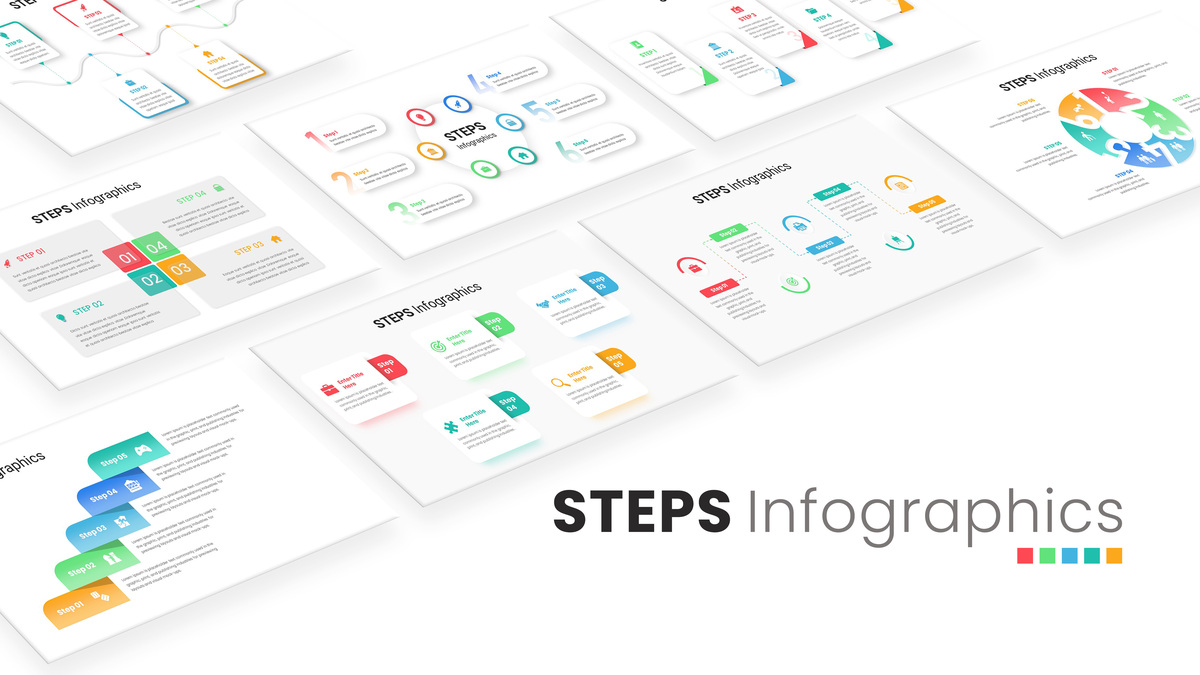
Steps Infographics Template for PowerPoint & Google Slides
Decks
Premium
Free Mental Health Awareness & Infographics Presentation Template for PowerPoint & Google Slides
Health
Free
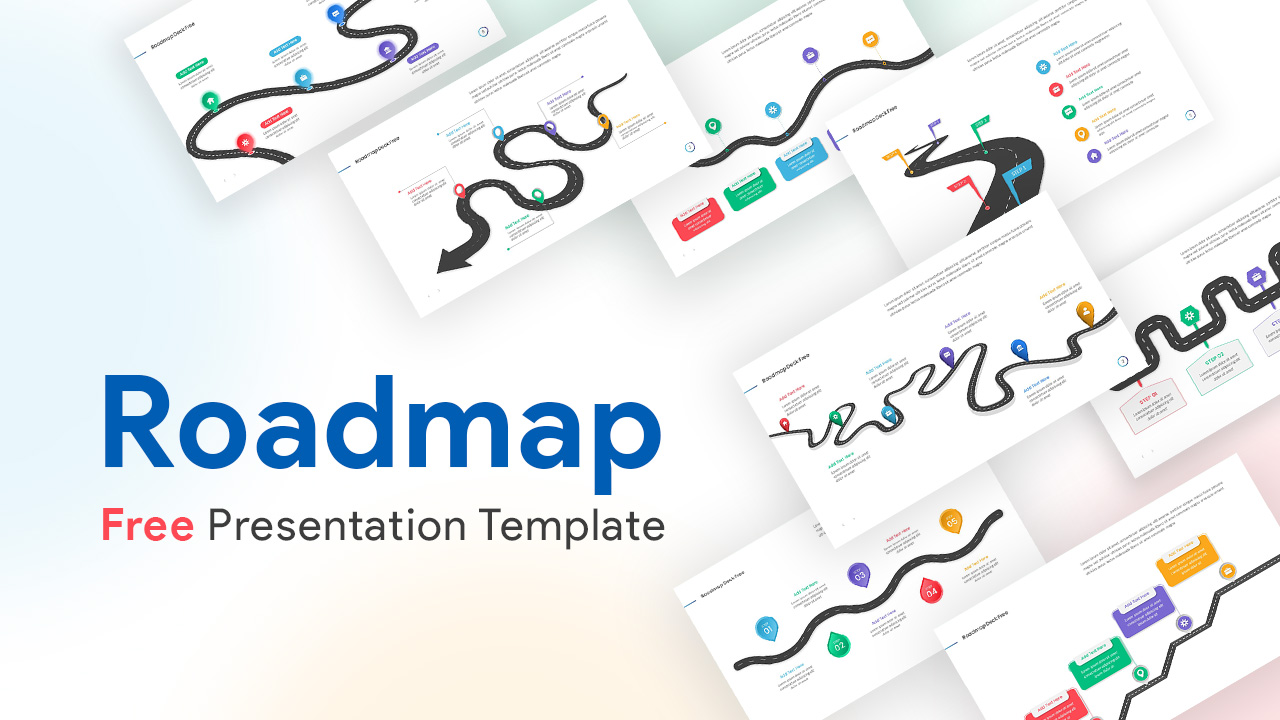
Free Roadmap Infographics Pack Template for PowerPoint & Google Slides
Pitch Deck
Free
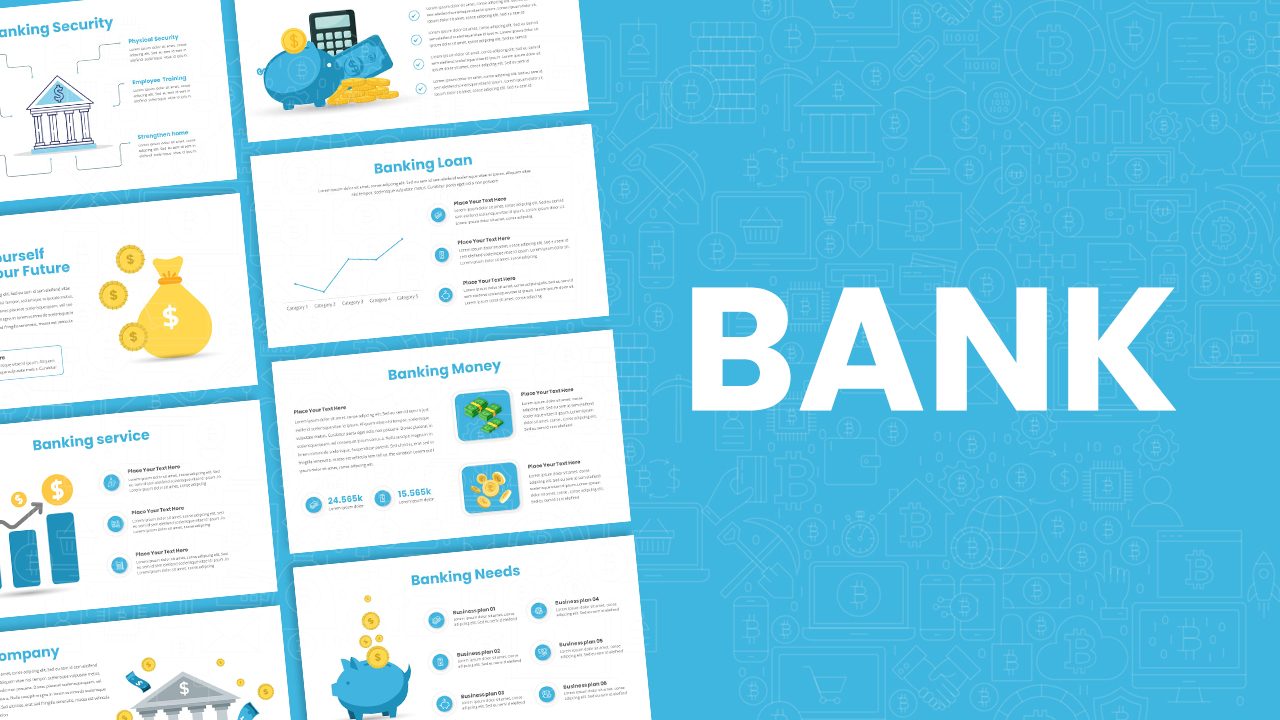
Banking Service & Finance Infographics Template for PowerPoint & Google Slides
Finance
Free
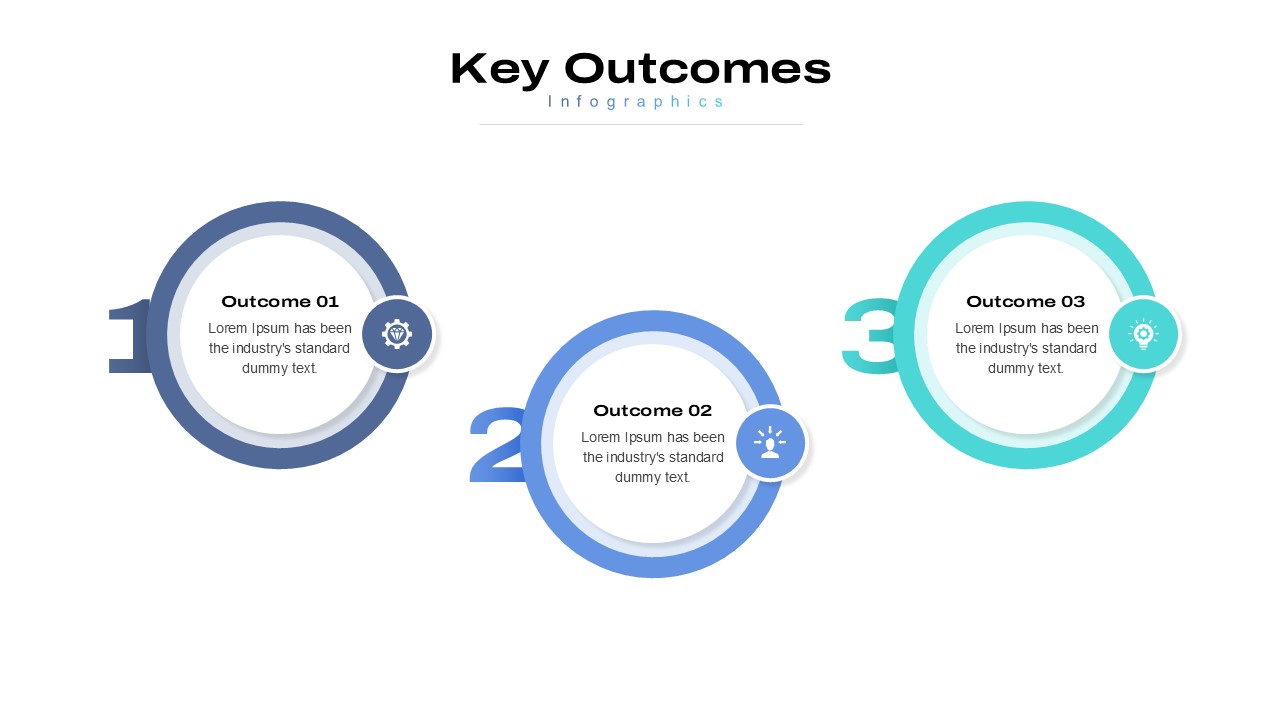
5 Styles Key Outcomes Infographics Pack Template for PowerPoint & Google Slides
Infographics
Premium
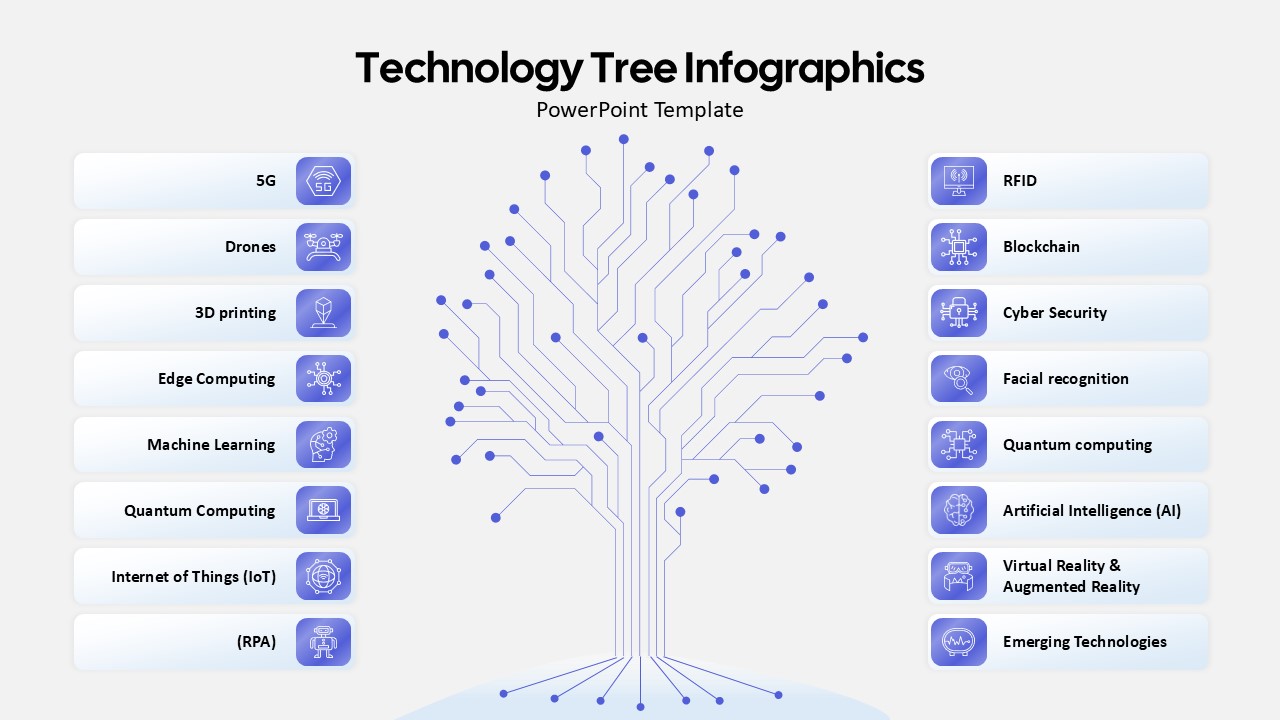
Technology Tree Infographics Template for PowerPoint & Google Slides
AI
Premium