Wicked Problems Conceptual Diagram Template for PowerPoint & Google Slides
Description
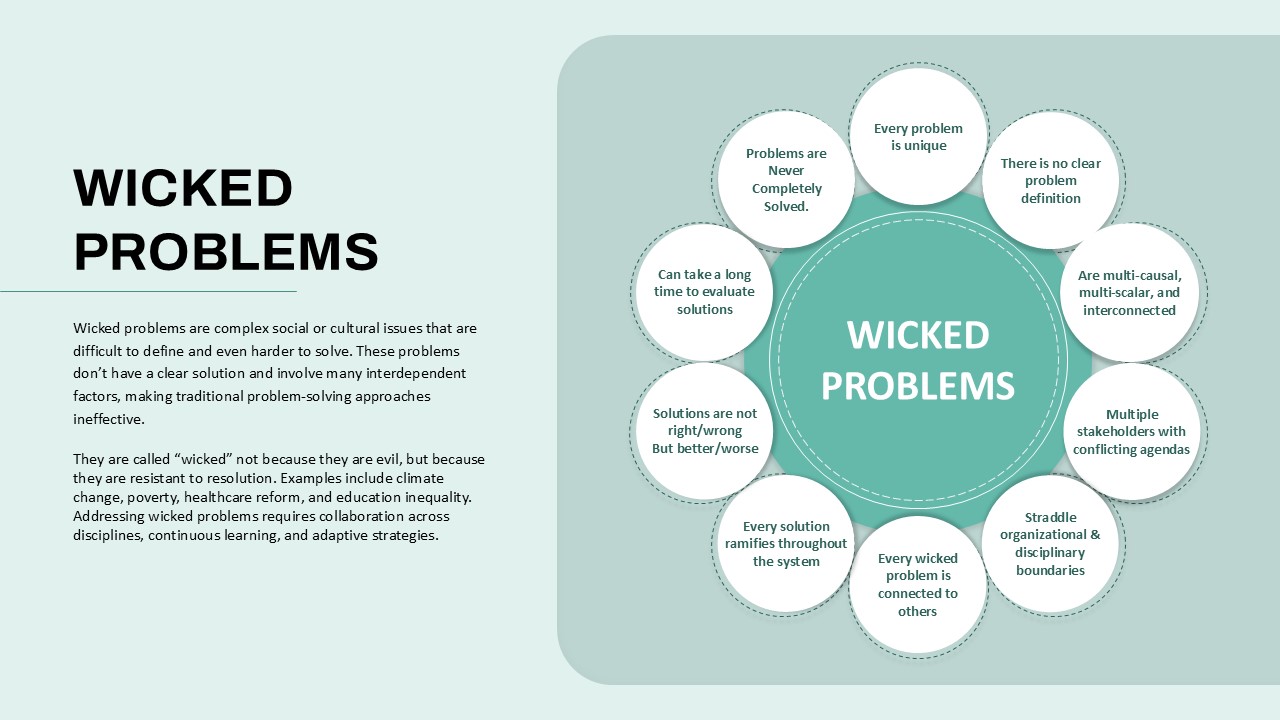
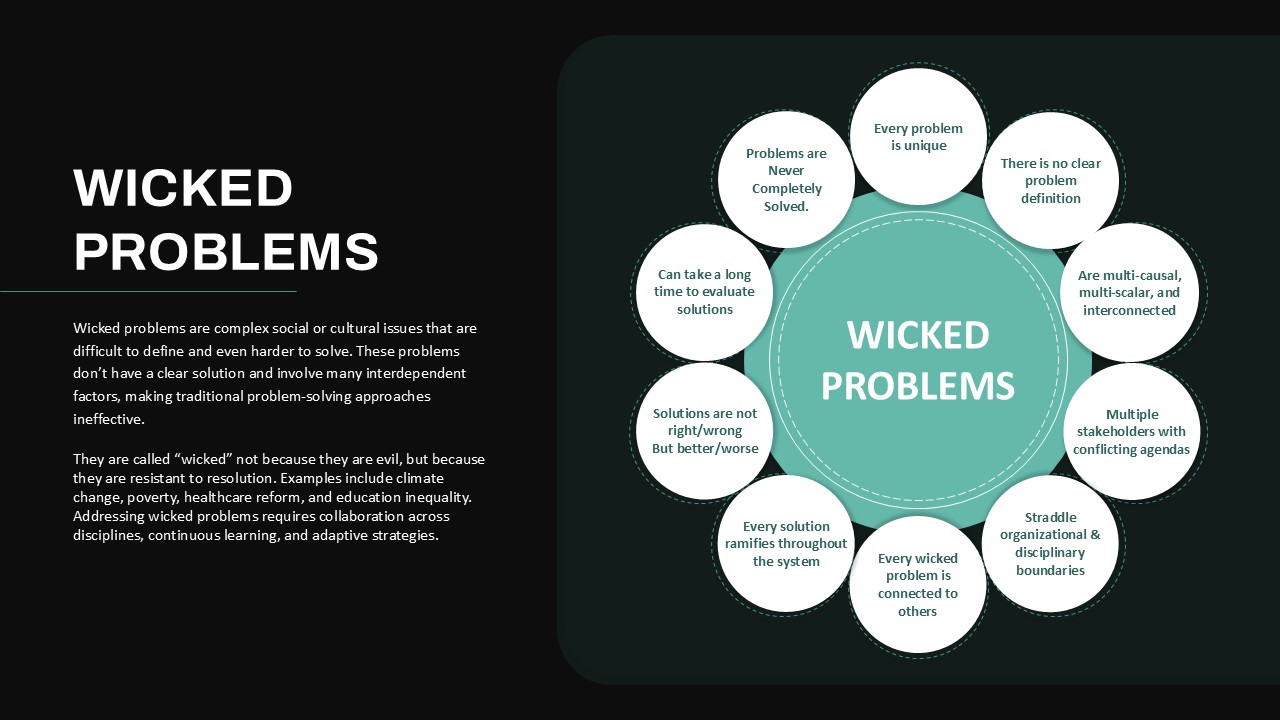
Visualize the defining traits of wicked problems with this clean, circular infographic slide. A soft mint background frames a large central teal circle labeled “WICKED PROBLEMS,” surrounded by ten evenly spaced white callout circles—each with a dashed outline—detailing characteristics like “Every problem is unique,” “No clear problem definition,” and “Multiple stakeholders with conflicting agendas.” Dark green typography and subtle drop shadows ensure legibility, while the balanced radial layout guides the audience’s eye through each interrelated concept. Built on master slides with editable placeholders, this design lets you adjust circle colors, swap icons, or modify text in seconds without disrupting alignment.
Leverage built-in connector guides and auto-snap grids to add or remove characteristics effortlessly; simply duplicate circles or change border styles to match your branding. All elements are fully vector-based, guaranteeing crisp rendering across screen resolutions. Whether you need to emphasize specific traits with custom icons or translate the diagram into a different color theme, the slide scales seamlessly for both PowerPoint and Google Slides, preserving layout integrity and eliminating version-control headaches.
Who is it for
Consultants, policy analysts, design thinkers, and academic instructors will find this circular diagram invaluable for introducing the complexity of wicked problems in workshops, lectures, or stakeholder presentations. Product managers and innovation teams can use it to frame strategic discussions around system-level challenges and interdisciplinary collaboration.
Other Uses
Beyond explaining wicked problems, repurpose this radial layout to map systems thinking frameworks, stakeholder influence networks, risk assessment criteria, or multi-factor project evaluations. Use the modular circle elements to compare alternative scenarios, illustrate decision-making pathways, or visualize interdependencies in any complex process.
Login to download this file

Item ID
SB04924
Related Templates

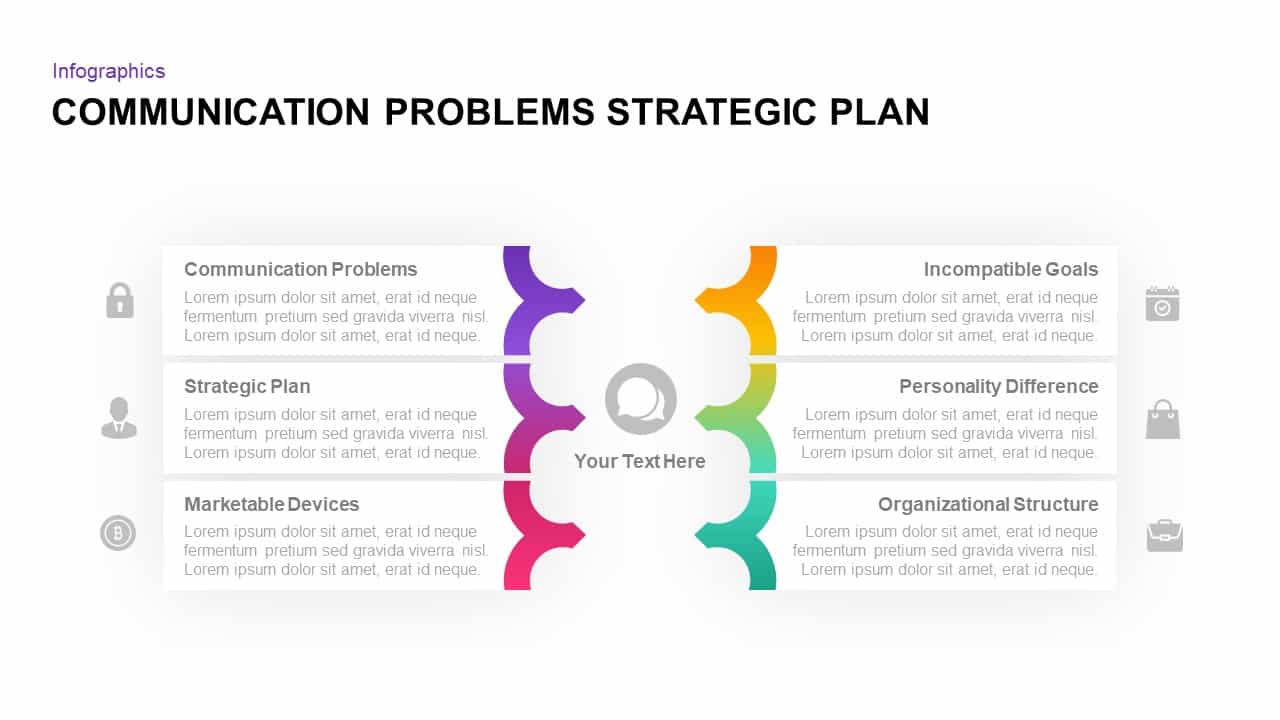
Communication Problems & Strategic Plan Template for PowerPoint & Google Slides
Process
Snake Diagram Pack of 8 Slides template for PowerPoint & Google Slides
Process
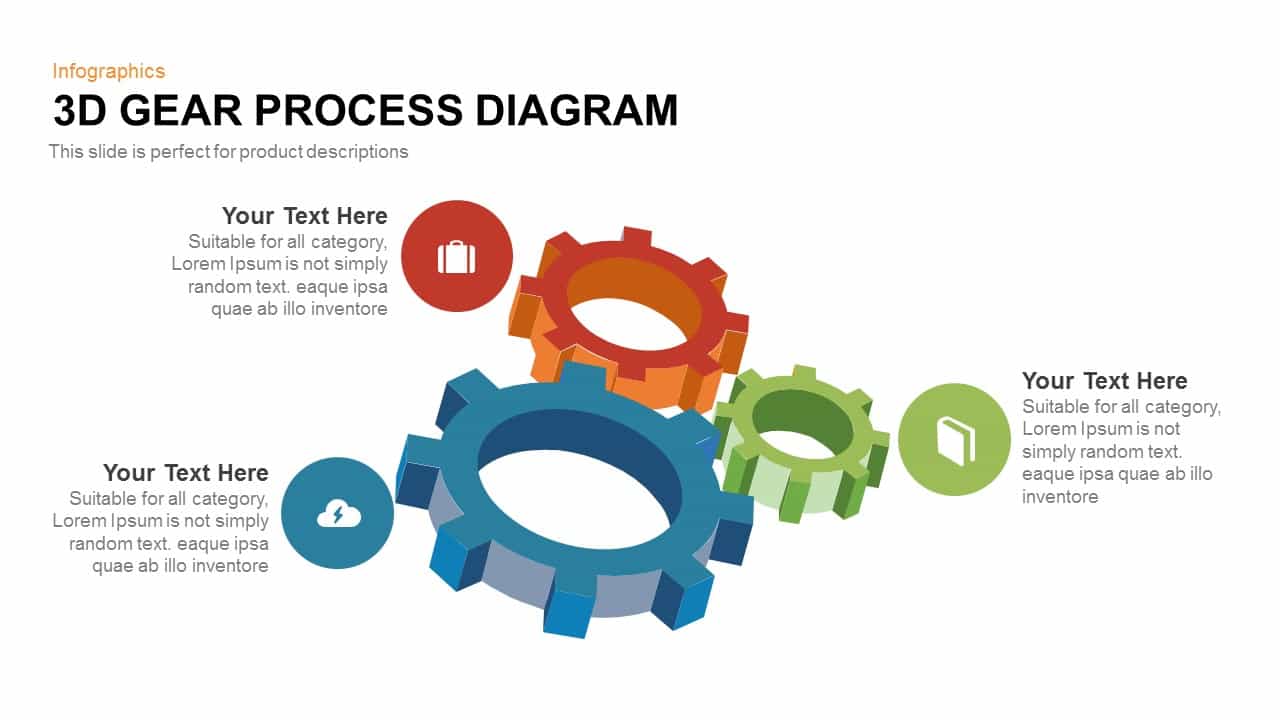
Gear Process Diagram PowerPoint Template for PowerPoint & Google Slides
Process
Sales Process Workflow Funnel Diagram PowerPoint Template for PowerPoint & Google Slides
Funnel
Puzzle Diagram PowerPoint Template for PowerPoint & Google Slides
Process
Transportation Logistics PowerPoint Diagram template for PowerPoint & Google Slides
Process
Emoji Scale PowerPoint Diagram for PowerPoint & Google Slides
Infographics
4 Step Problem Solving PowerPoint Diagram for PowerPoint & Google Slides
Process
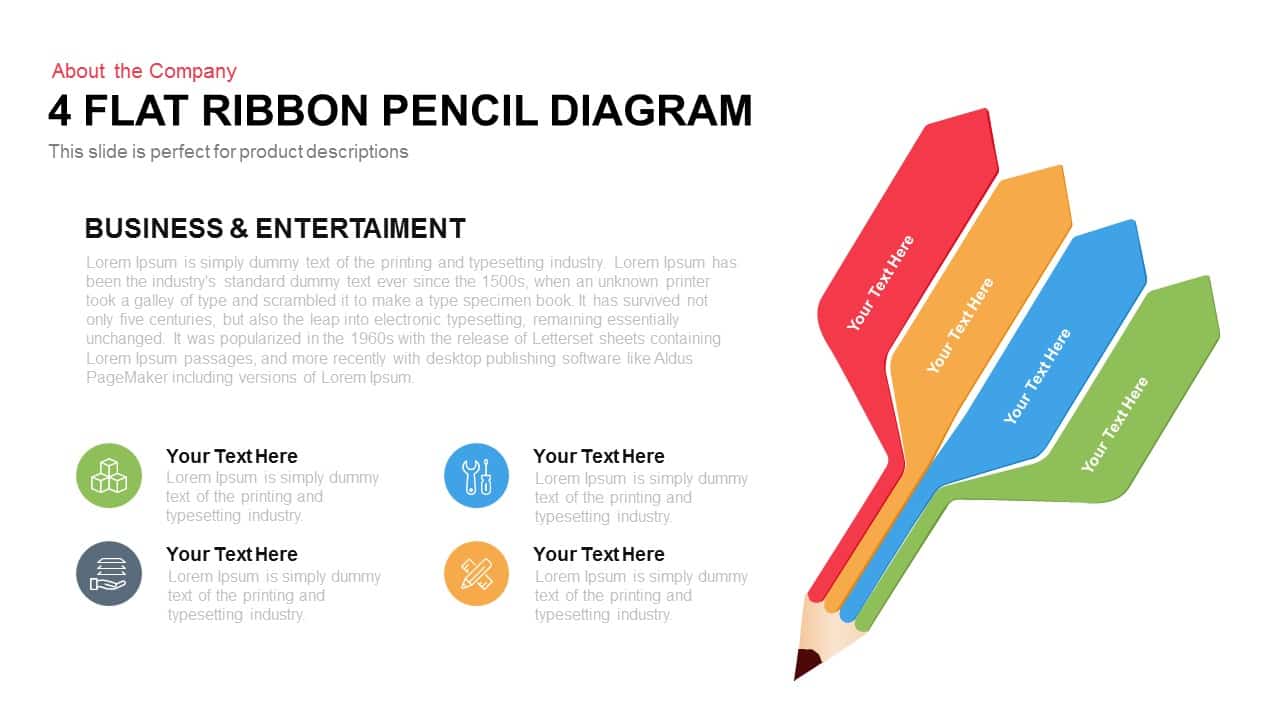
4-Step Flat Ribbon Pencil Diagram Template for PowerPoint & Google Slides
Process
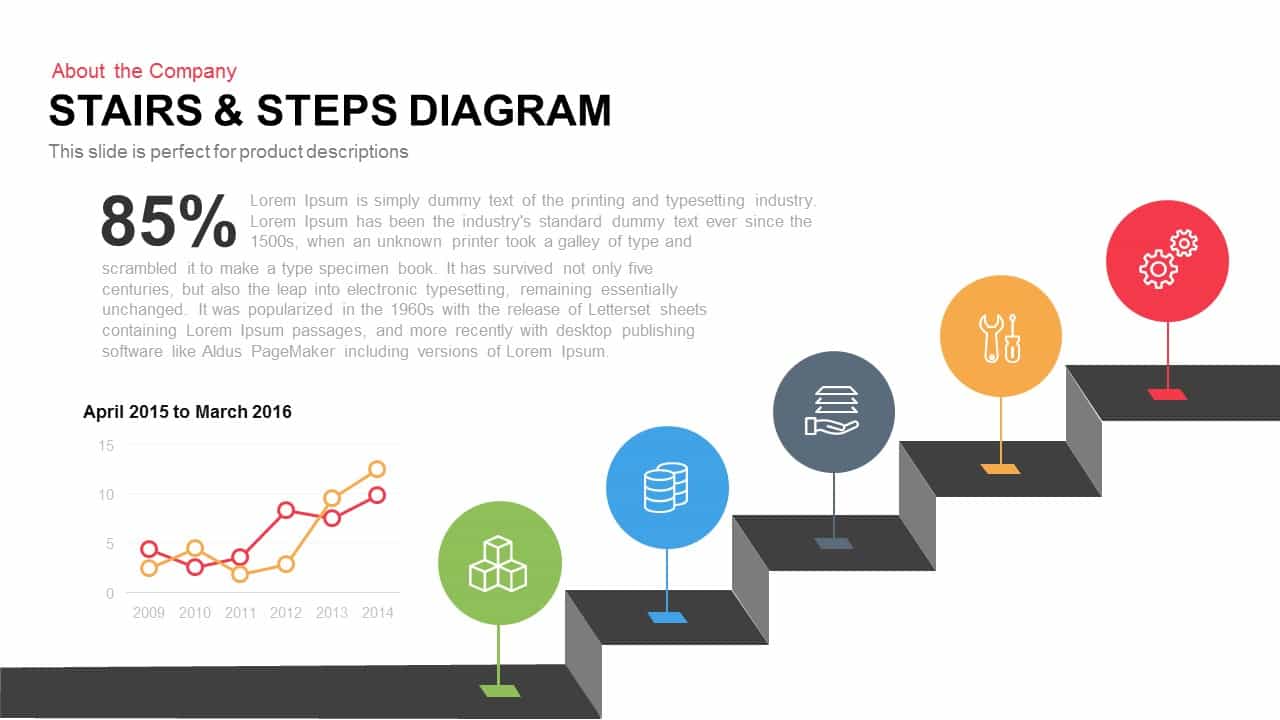
Stairs & Steps Process Diagram template for PowerPoint & Google Slides
Process
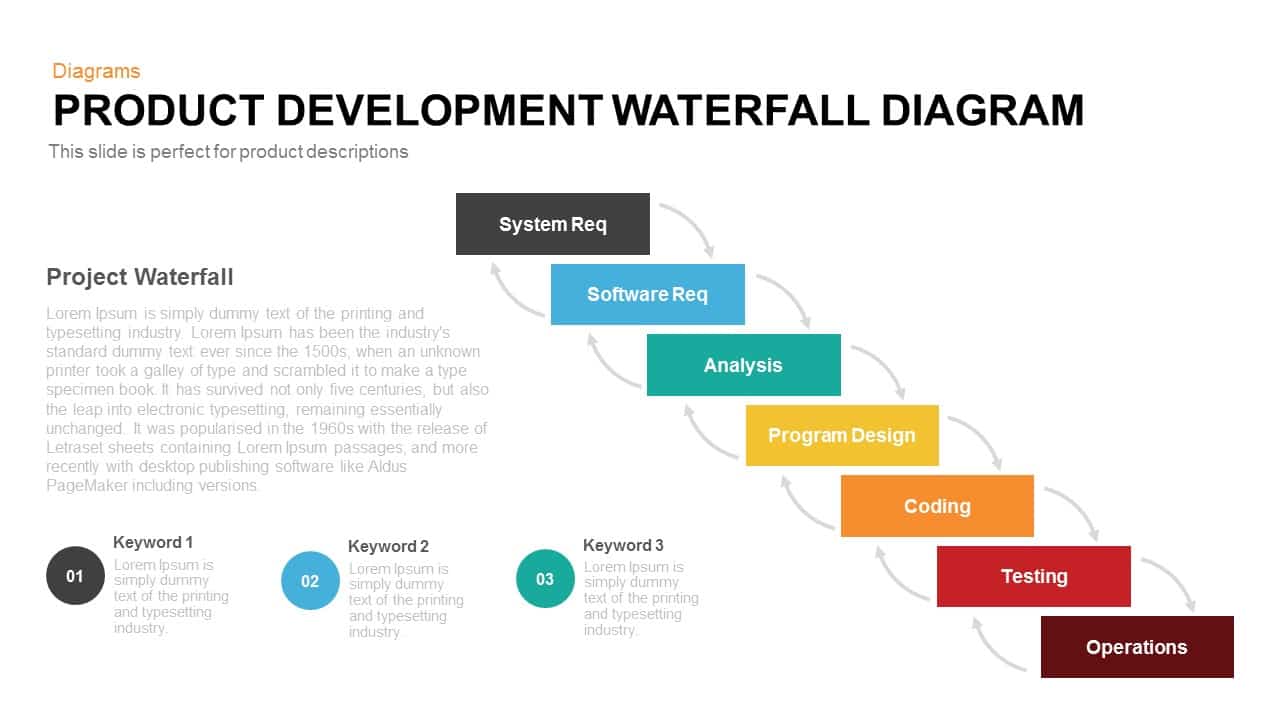
Product Development Waterfall Diagram Template for PowerPoint & Google Slides
Process
Professional 3D Gear Process Diagram Template for PowerPoint & Google Slides
Process
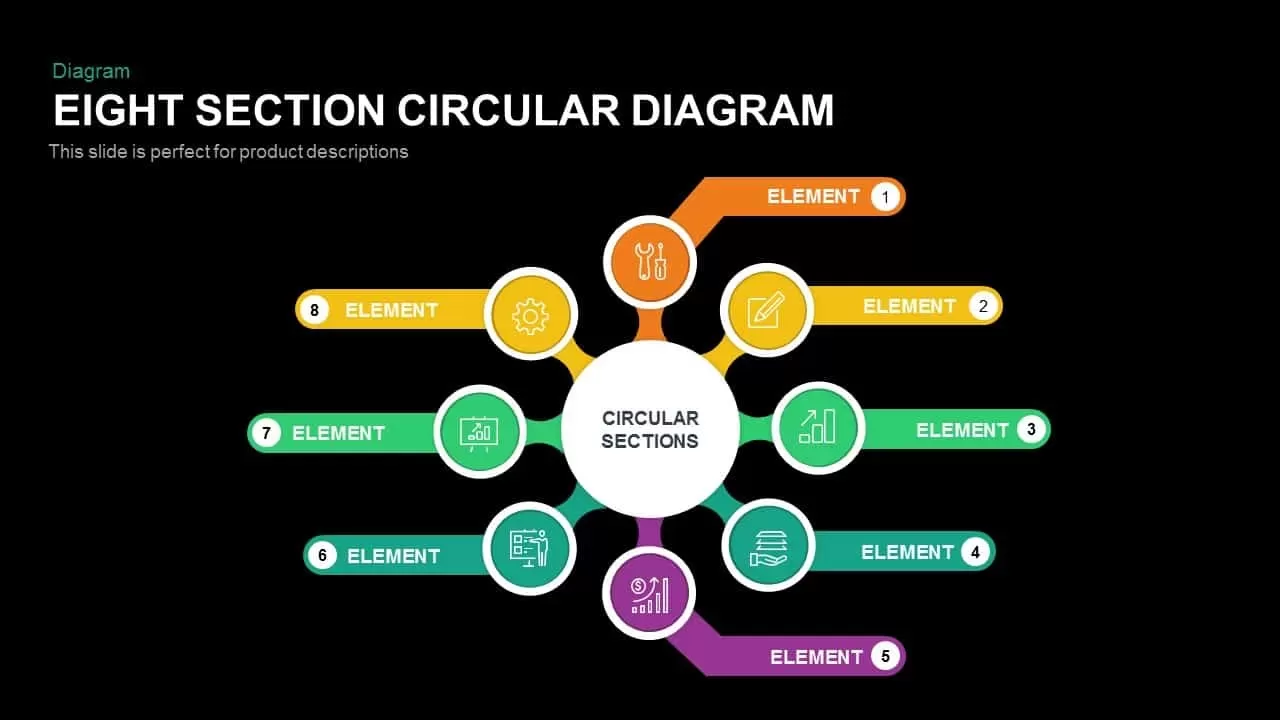
Eight Section Circular Diagram Template for PowerPoint & Google Slides
Circular
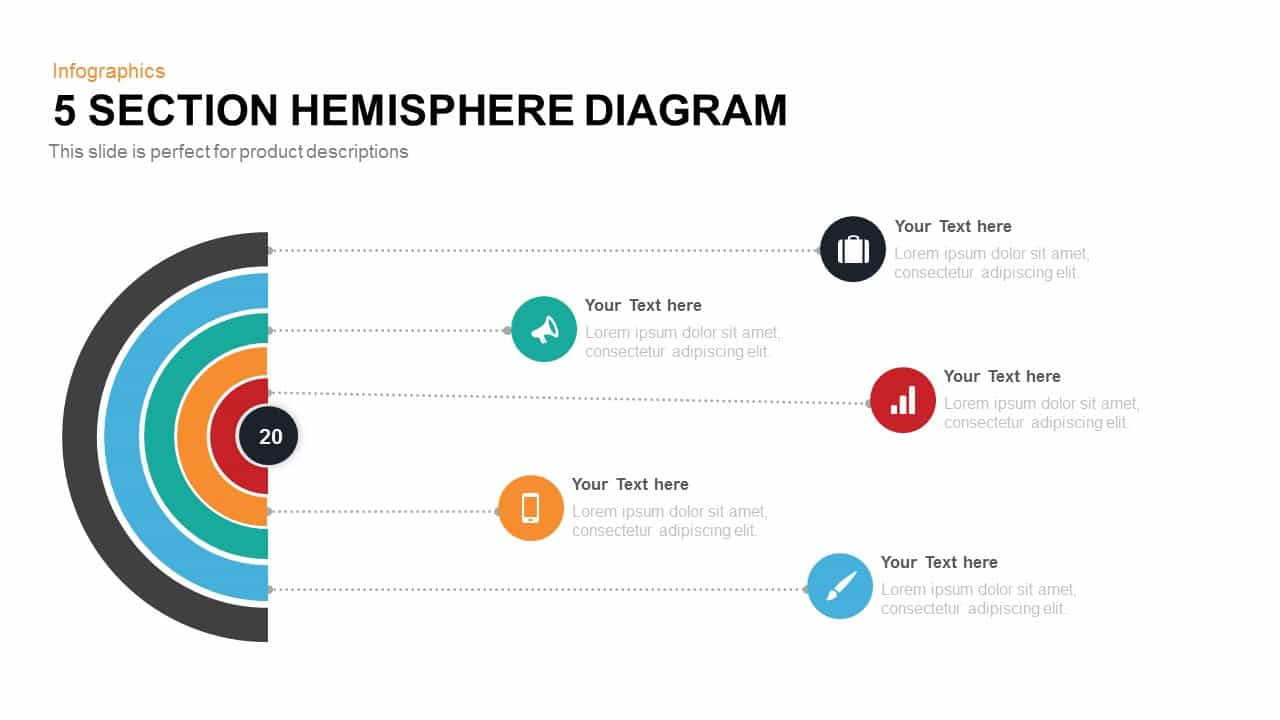
Hemisphere Diagram template for PowerPoint & Google Slides
Infographics
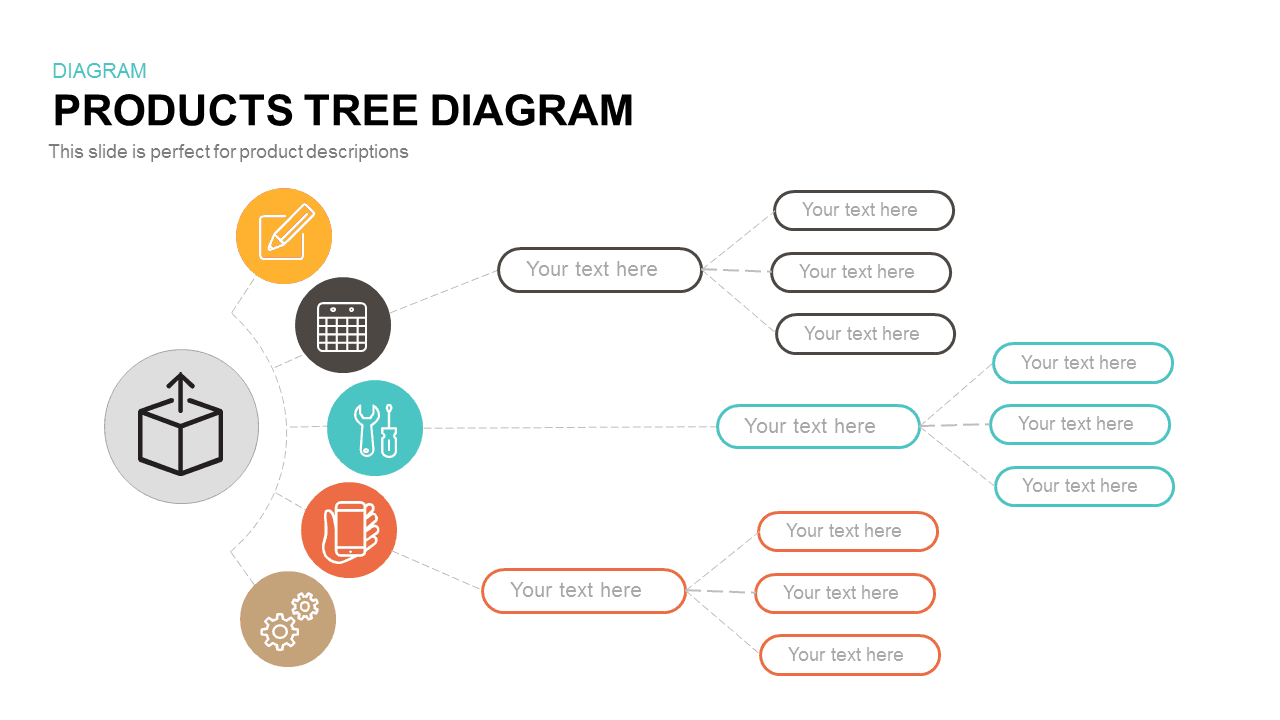
Interactive Products Tree Diagram template for PowerPoint & Google Slides
Org Chart

8-Section Split Diagram with Hub Icon template for PowerPoint & Google Slides
Circular
Dynamic Key Points Diagram Template for PowerPoint & Google Slides
Process

User Profile Hub-and-Spoke Diagram Template for PowerPoint & Google Slides
Our Team

Product Design Process Diagram Template for PowerPoint & Google Slides
Timeline
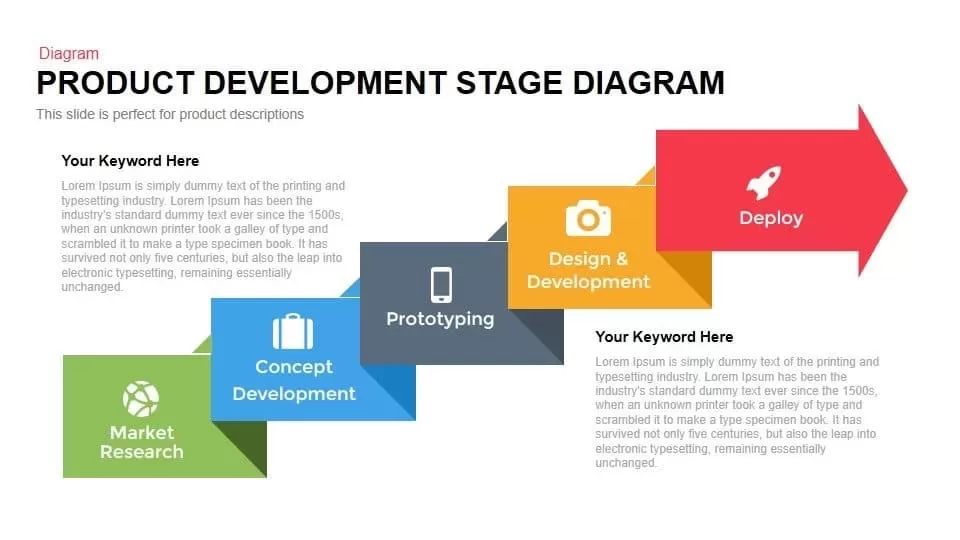
Product Development Stage Diagram Template for PowerPoint & Google Slides
Process
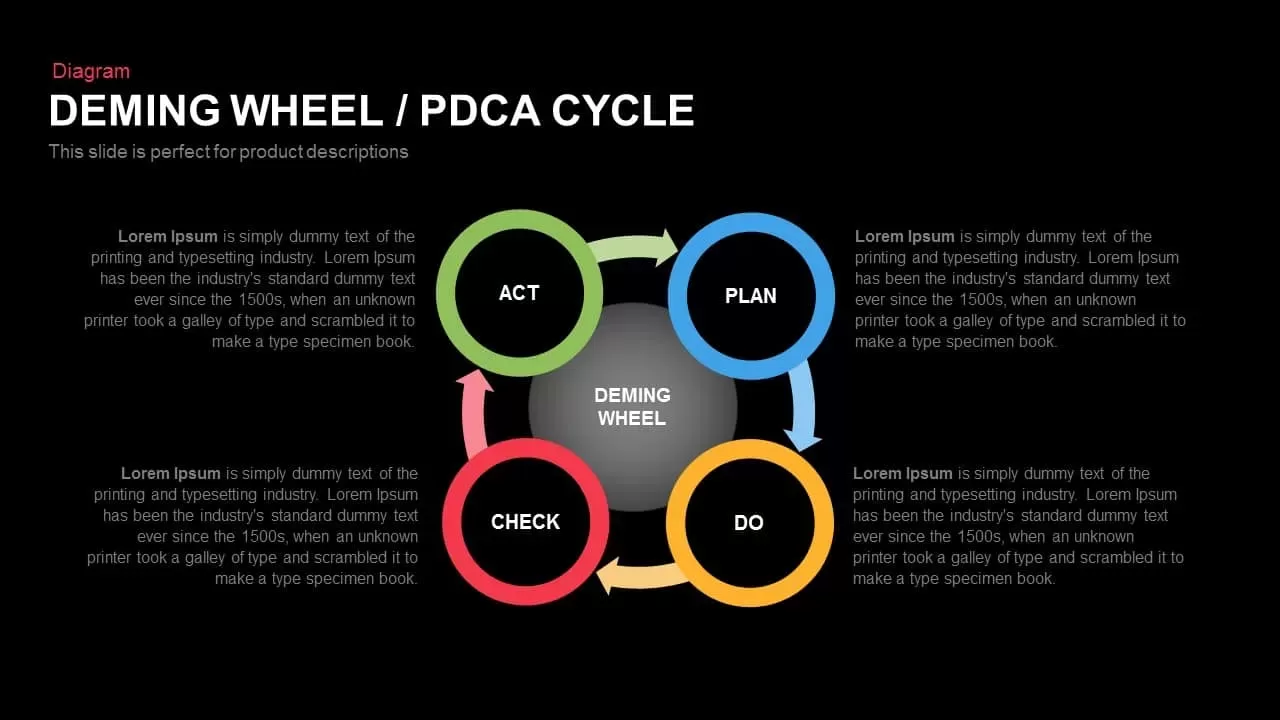
Deming Wheel PDCA Cycle Diagram Template for PowerPoint & Google Slides
Business Plan
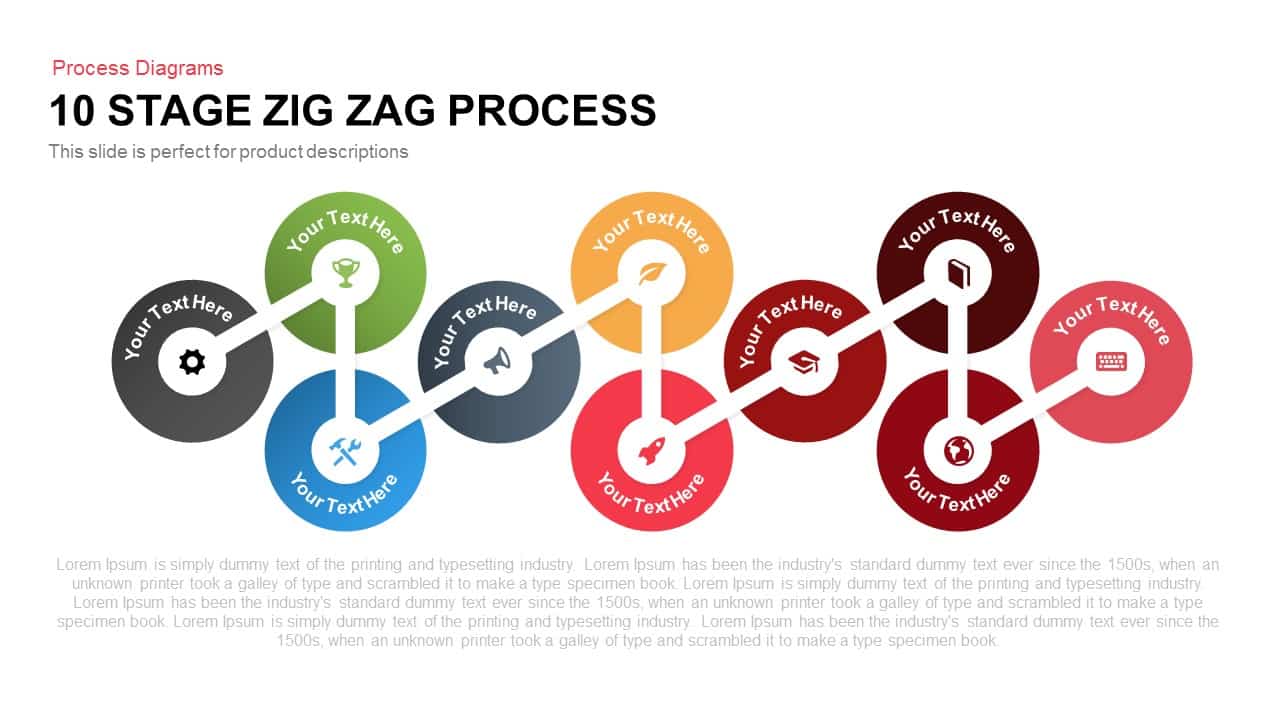
Ten-Stage Zig-Zag Process Diagram Template for PowerPoint & Google Slides
Process
Vertical Business Process Flow Diagram Template for PowerPoint & Google Slides
Process
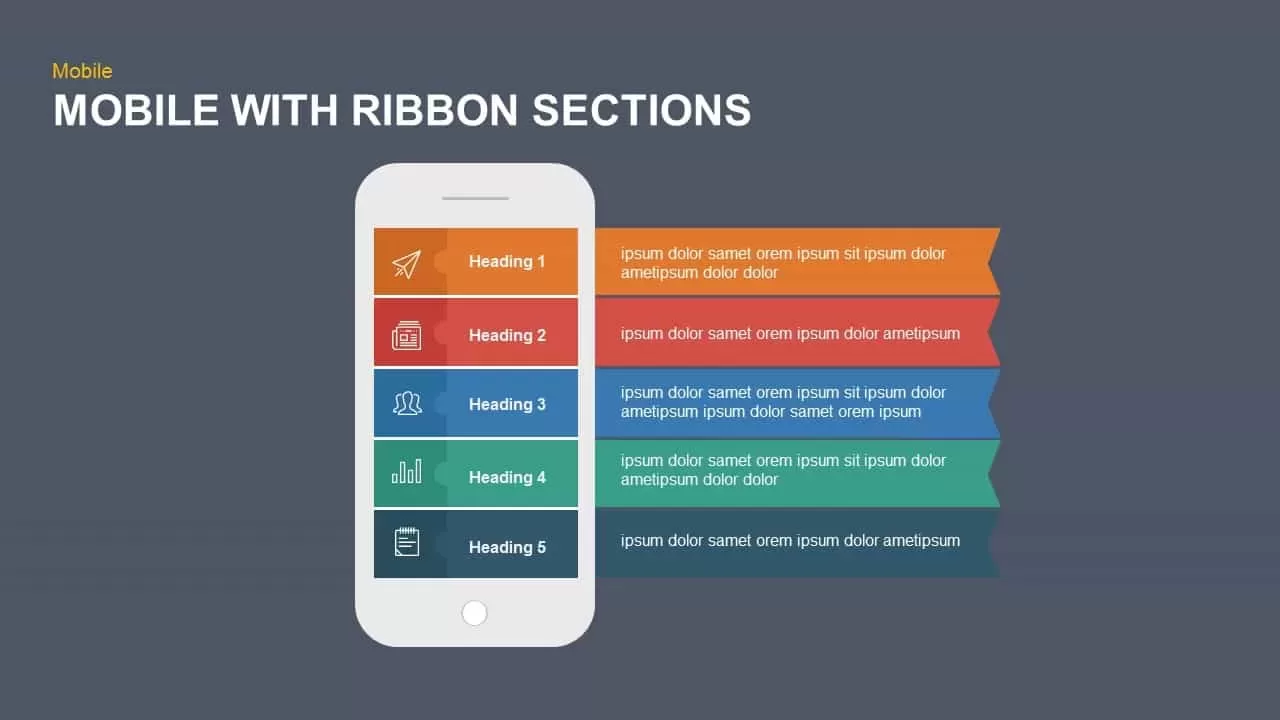
Mobile Ribbon Sections Diagram Template for PowerPoint & Google Slides
Process
Clean Four-Section Review Diagram Template for PowerPoint & Google Slides
Agenda
Timeline Arrow Infographics Diagram Template for PowerPoint & Google Slides
Timeline
Six-Stage Circular Cycle Diagram Template for PowerPoint & Google Slides
Process
Seven-Segment Circular Arrow Diagram Template for PowerPoint & Google Slides
Arrow
Multi-Color Eight-Step Ribbon Diagram Template for PowerPoint & Google Slides
Process
Five-Point Circle Timeline Diagram Template for PowerPoint & Google Slides
Timeline

Ten-Piece Circular Puzzle Diagram Template for PowerPoint & Google Slides
Circular
Six Stage Circular Diagram with Icons Template for PowerPoint & Google Slides
Circular
12-Stage Zig Zag Process Diagram Template for PowerPoint & Google Slides
Process
Six Segment Hexagon Circular Diagram Template for PowerPoint & Google Slides
Circular
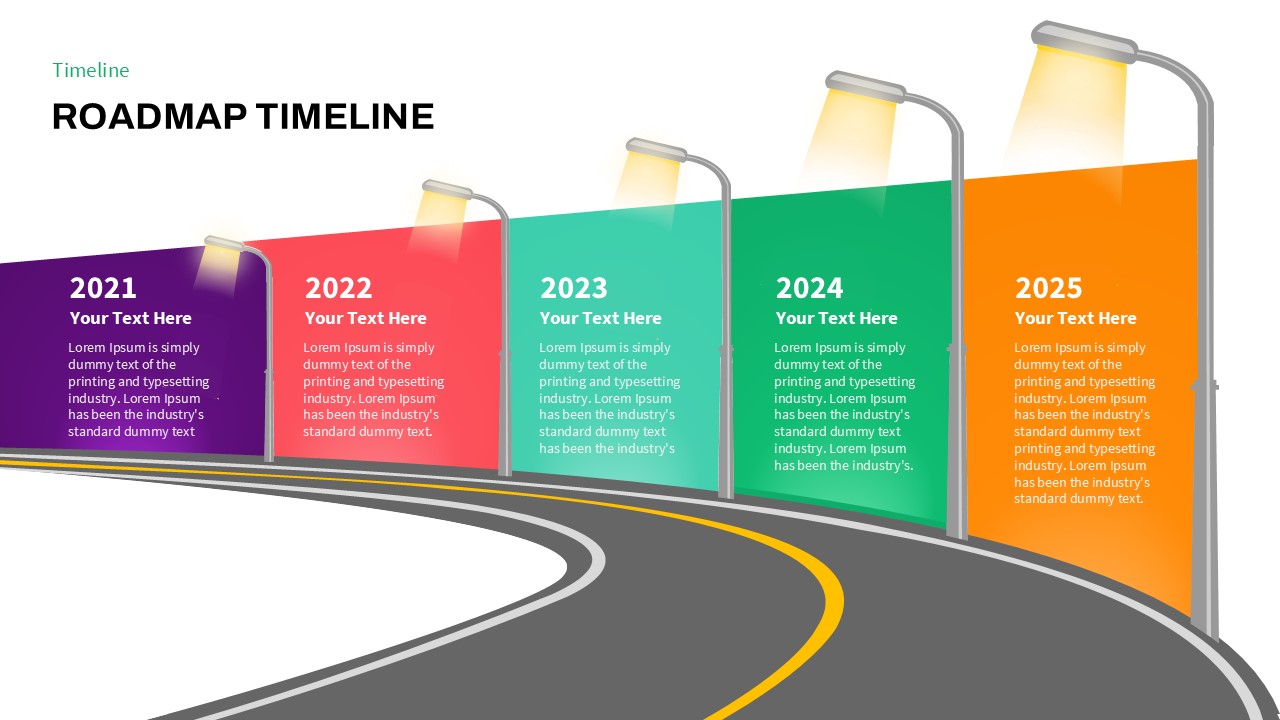
Curved Road Roadmap Timeline Diagram Template for PowerPoint & Google Slides
Roadmap
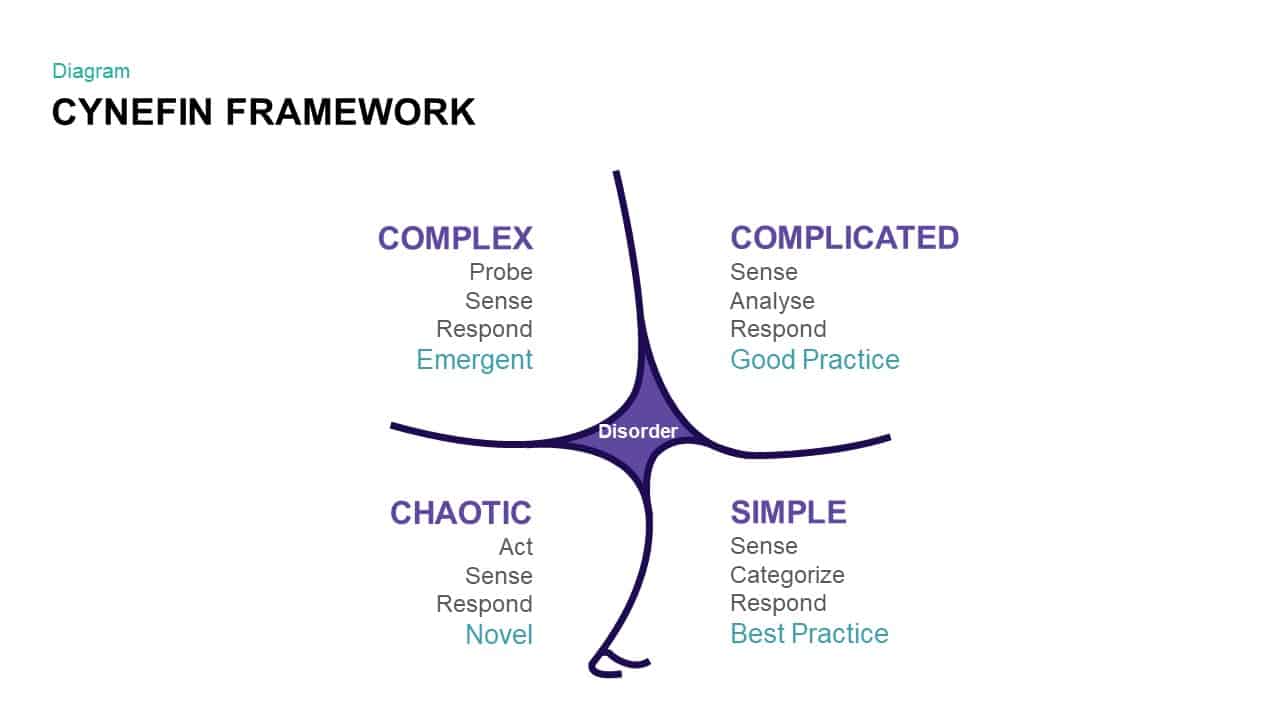
Comprehensive Cynefin Framework Diagram Template for PowerPoint & Google Slides
Opportunities Challenges
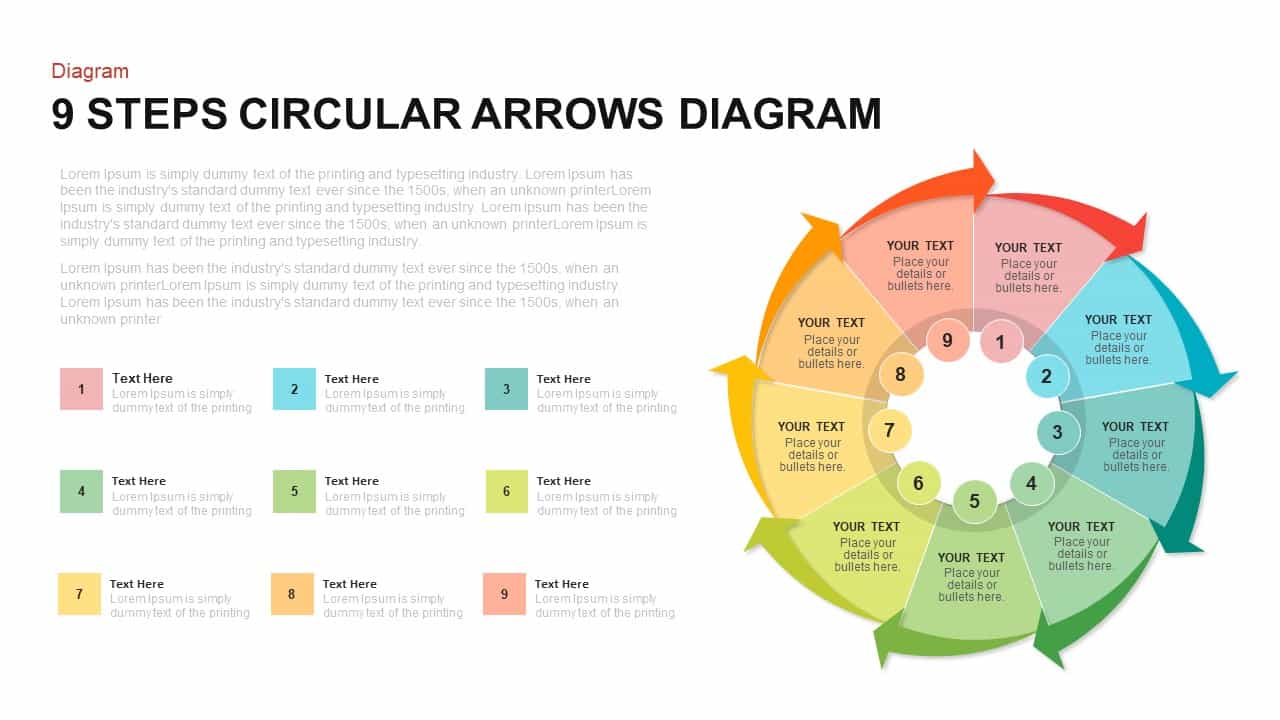
9-Step Circular Arrows Process Diagram Template for PowerPoint & Google Slides
Process
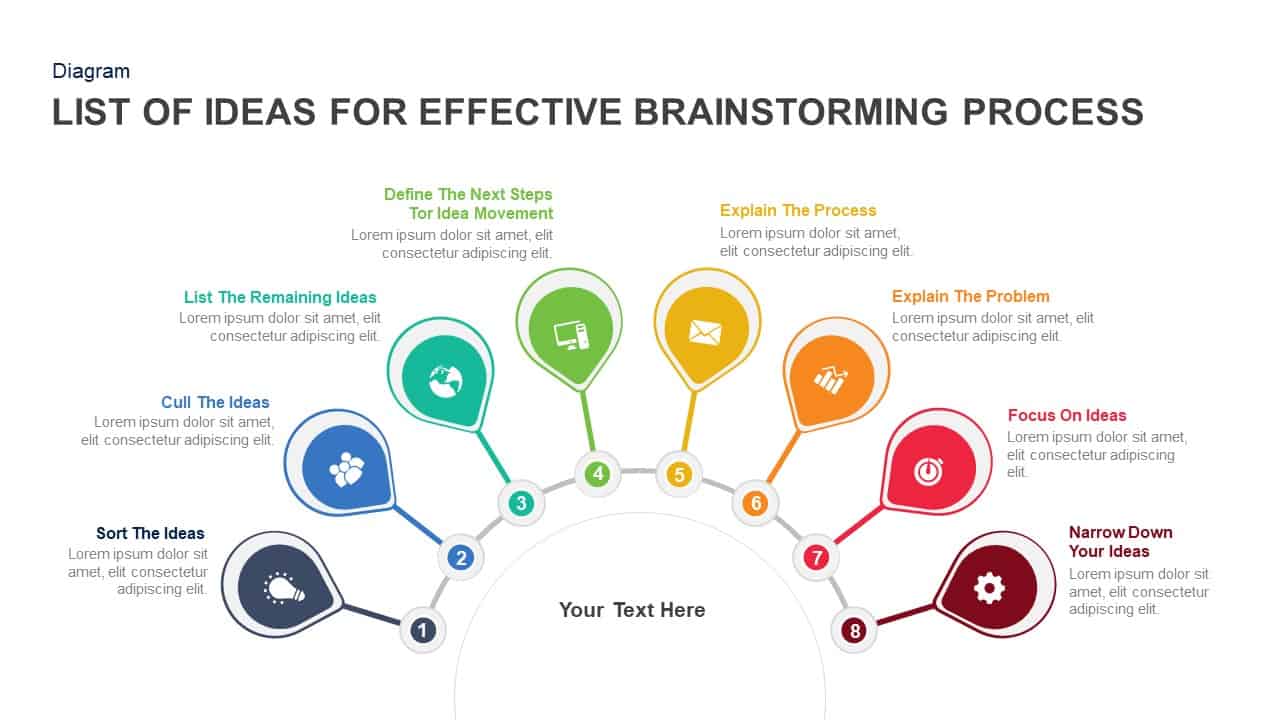
Eight-Step Brainstorming Process Diagram Template for PowerPoint & Google Slides
Process
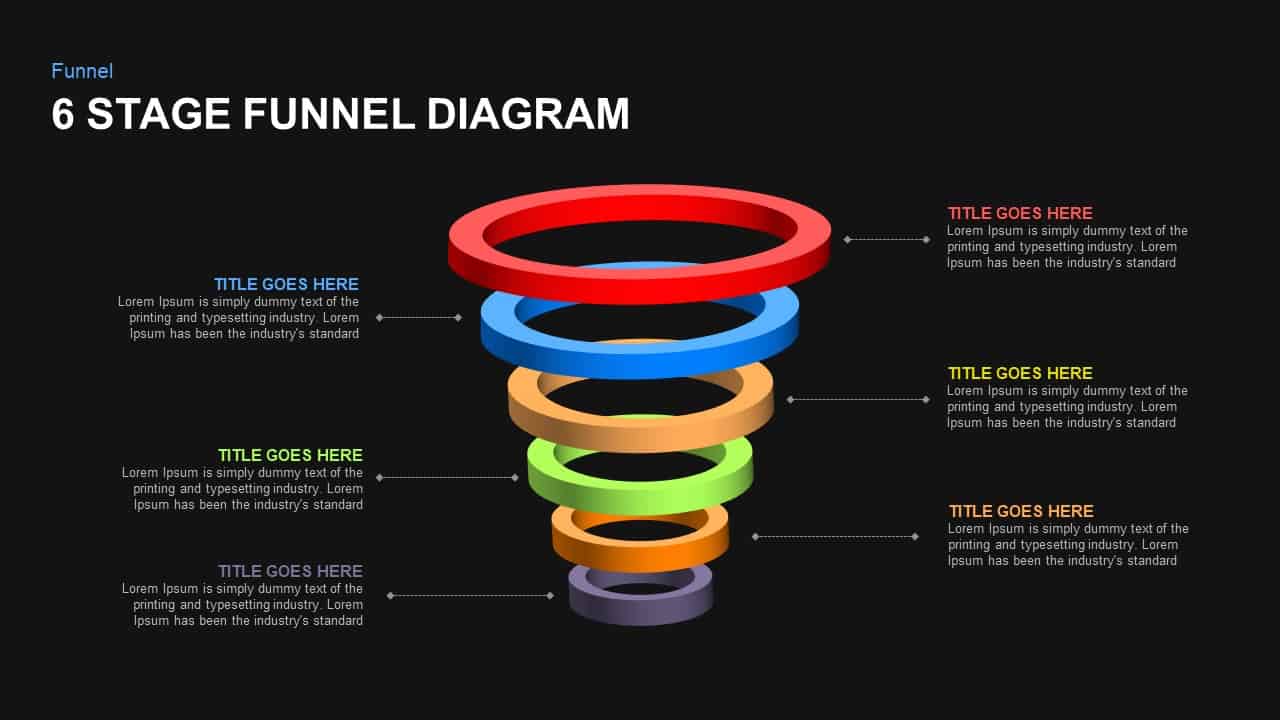
6-Stage Funnel Diagram Infographic Template for PowerPoint & Google Slides
Funnel
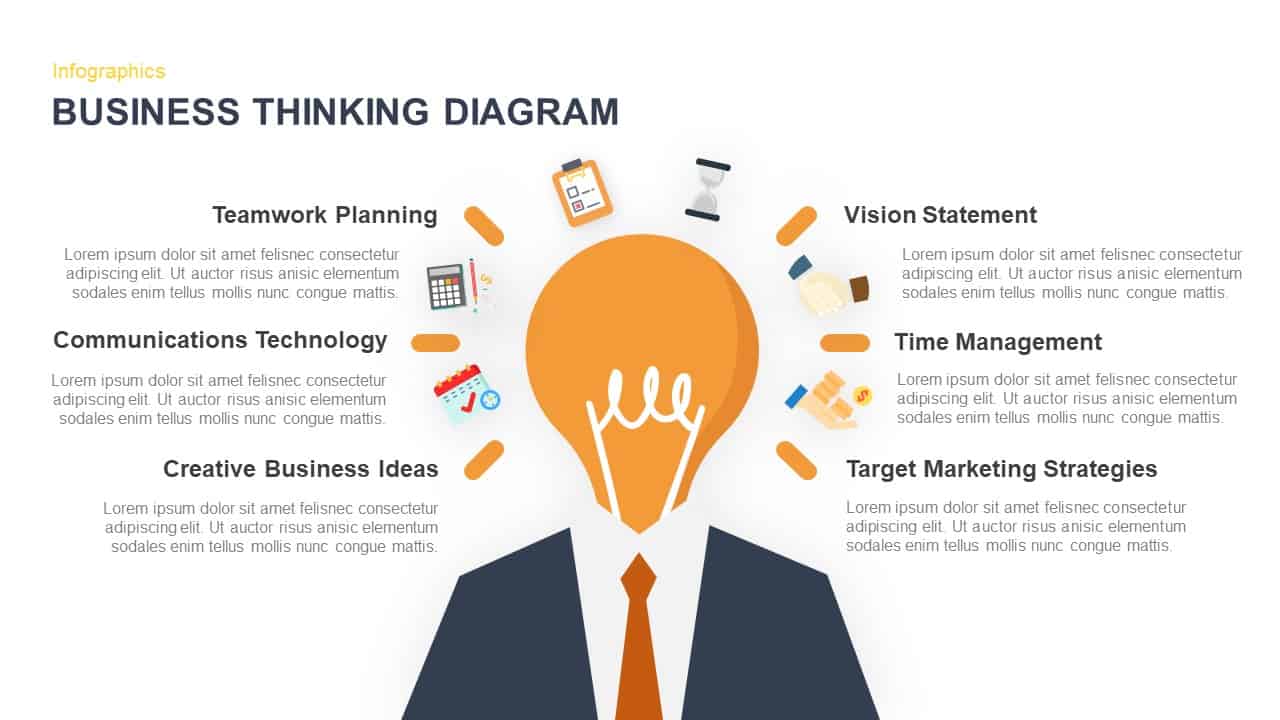
Business Thinking Concept Diagram Template for PowerPoint & Google Slides
Business Strategy
Five Stage Linear Process Flow Diagram Template for PowerPoint & Google Slides
Process
Five-Stage Circular Infographic Diagram Template for PowerPoint & Google Slides
Process
Four-Stage Gear Process Diagram Template for PowerPoint & Google Slides
Process
Six-Stage Arrow Timeline Diagram Template for PowerPoint & Google Slides
Timeline
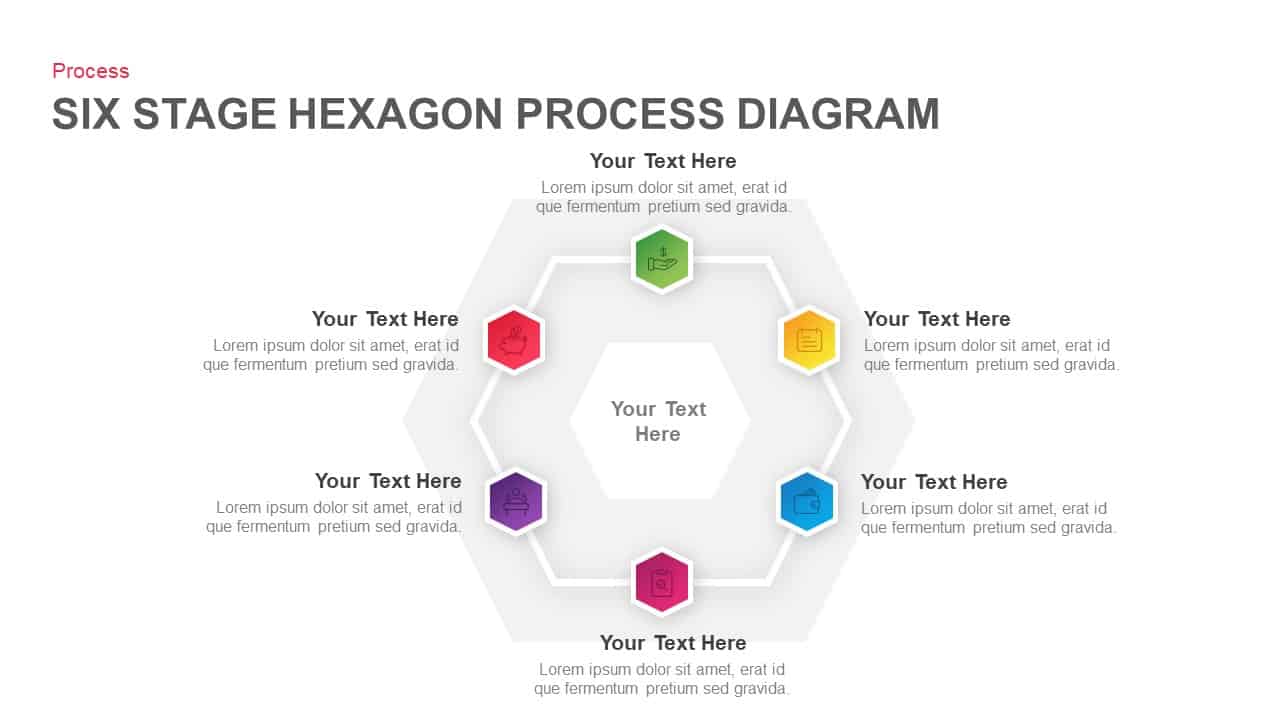
Six Stage Hexagon Process Diagram Template for PowerPoint & Google Slides
Process
5-Stage Gear Process Flow Diagram Template for PowerPoint & Google Slides
Process
Four-Stage Linear Process Flow Diagram Template for PowerPoint & Google Slides
Process
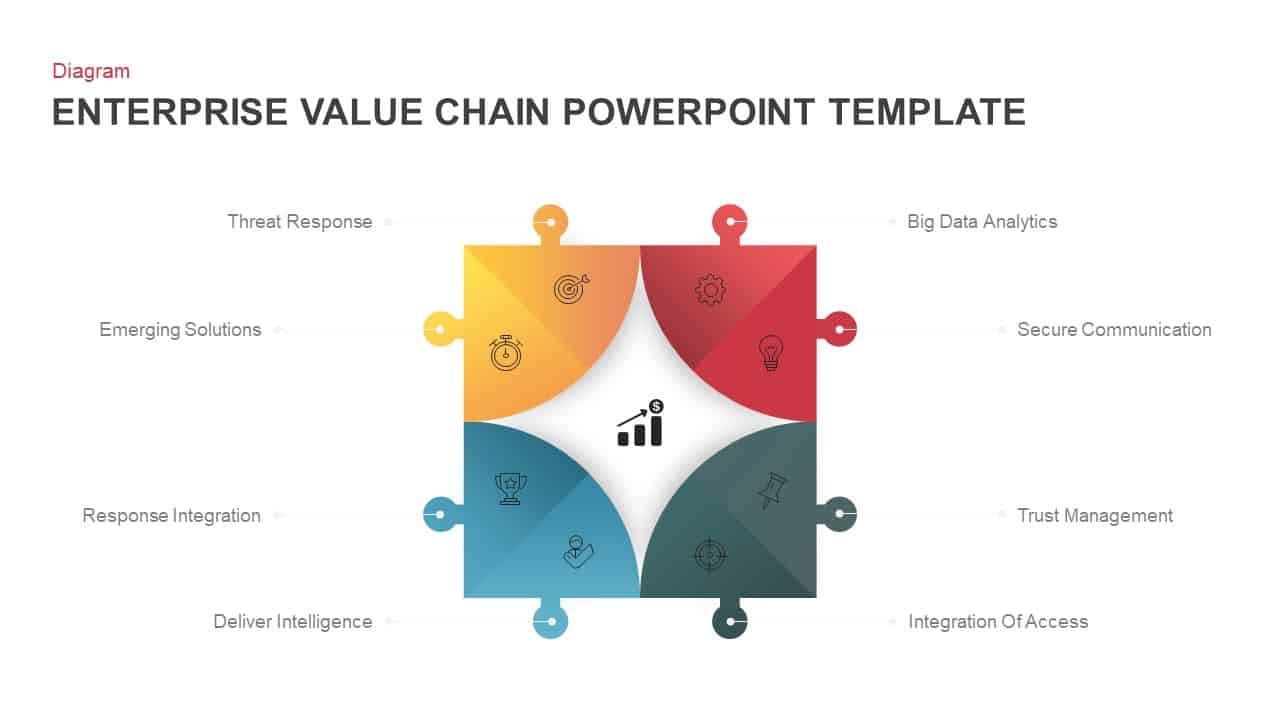
Enterprise Value Chain Puzzle Diagram Template for PowerPoint & Google Slides
Business Models
5-Stage Linear Process Flow Diagram Template for PowerPoint & Google Slides
Process
Creative Three-Circle Venn Diagram Template for PowerPoint & Google Slides
Comparison
Communication Strategy Framework Diagram Template for PowerPoint & Google Slides
Circular
4-Segment Business Project Diamond Diagram Template for PowerPoint & Google Slides
Process
3D Milestone Roadmap Staircase Diagram Template for PowerPoint & Google Slides
Timeline
7 Stage Linear Process Flow Diagram Template for PowerPoint & Google Slides
Process
Butterfly SWOT Analysis Diagram Template for PowerPoint & Google Slides
SWOT
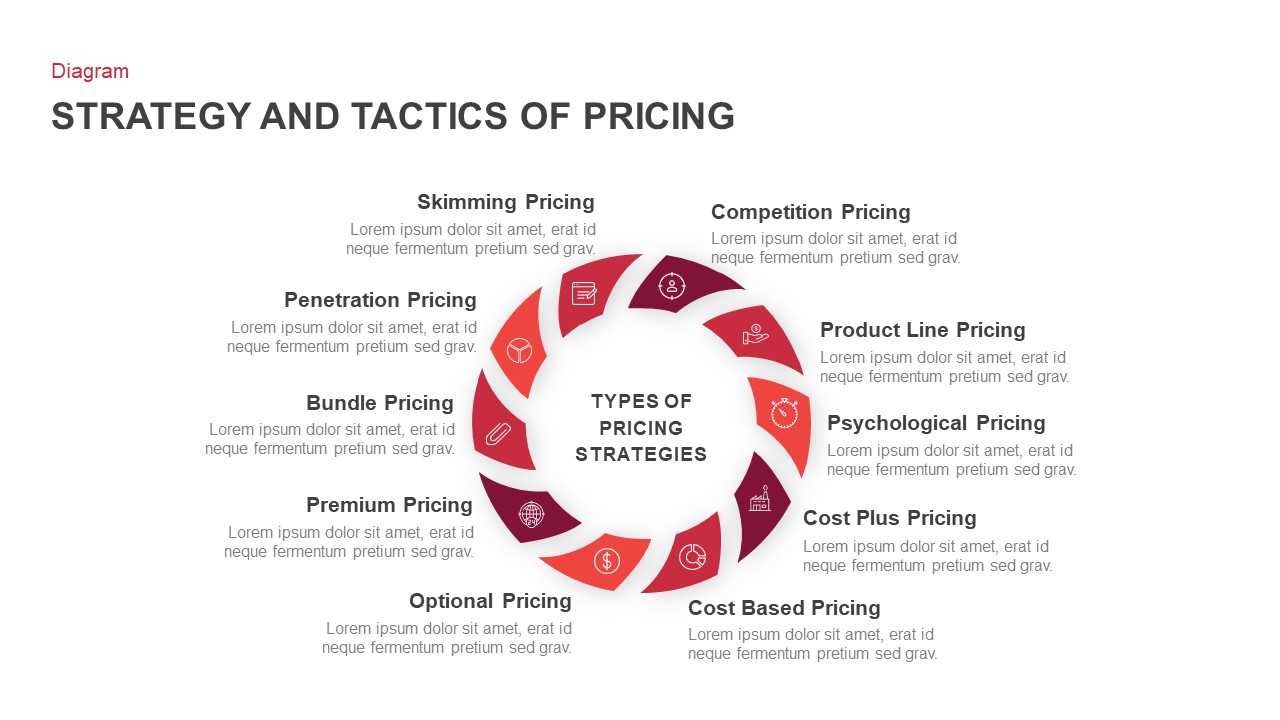
Pricing Strategy and Tactics Diagram Template for PowerPoint & Google Slides
Circular
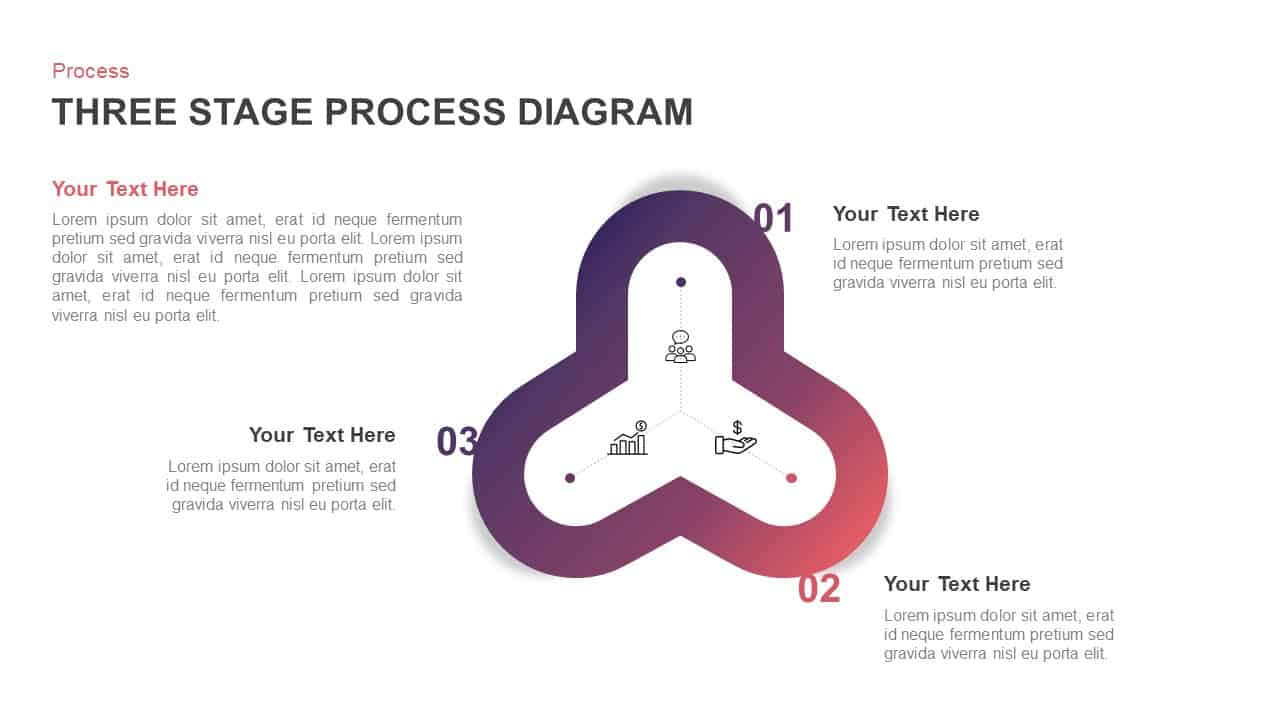
Three-Stage Loop Process Diagram Template for PowerPoint & Google Slides
Process
4-Step Linear Process Flow Diagram Template for PowerPoint & Google Slides
Process
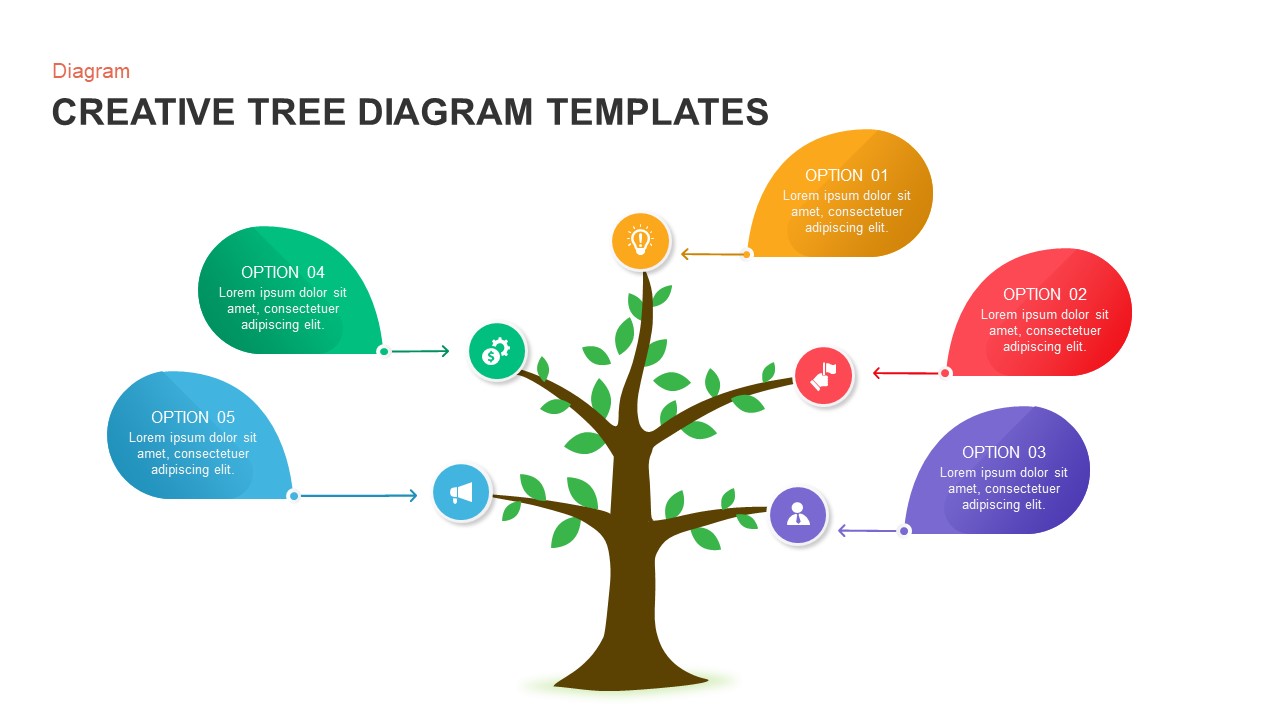
Creative Tree Diagram Infographic Template for PowerPoint & Google Slides
Decision Tree
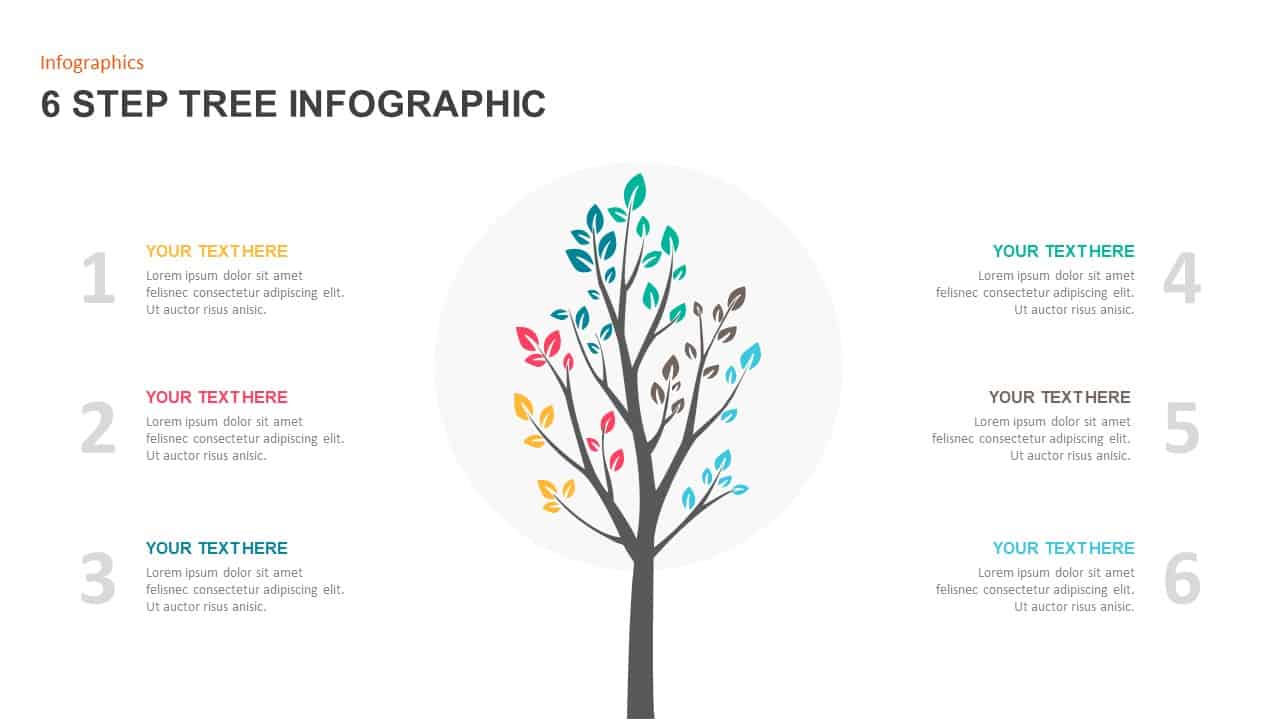
Six-Step Tree Diagram Infographic Template for PowerPoint & Google Slides
Infographics

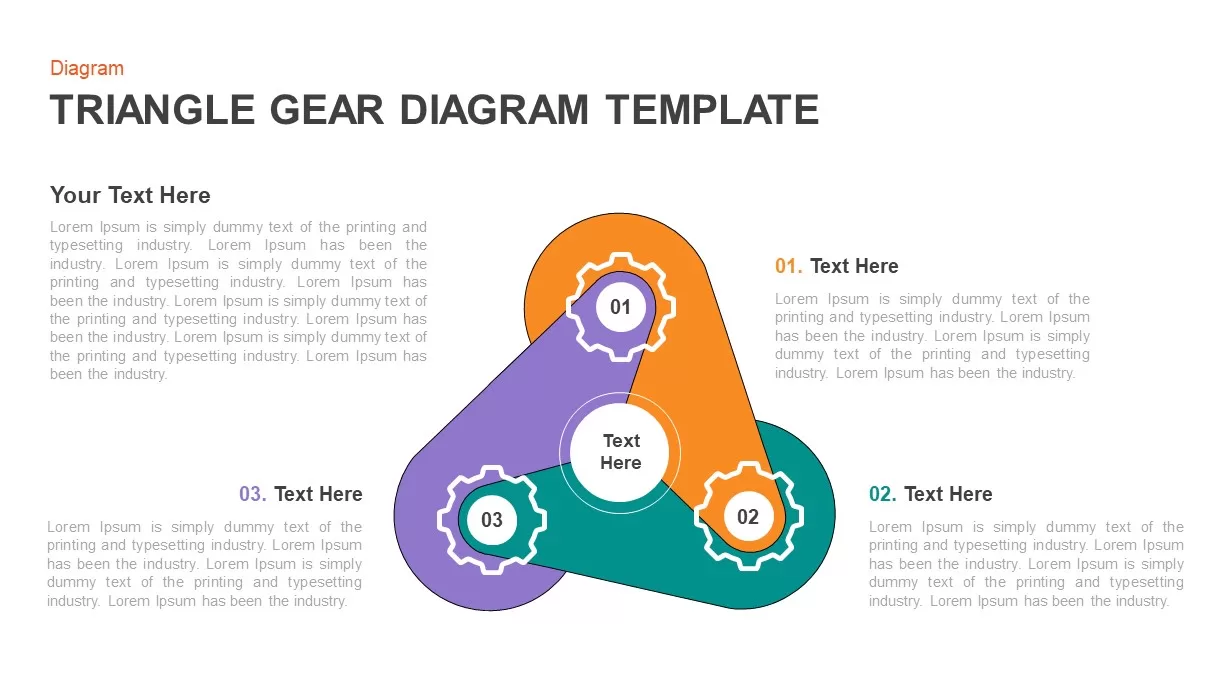
Three-Step Triangular Gear Diagram Template for PowerPoint & Google Slides
Process
3D Spheres Sliced Diagram – 2 Divisions template for PowerPoint & Google Slides
Infographics
3 Section Infographic Diagram Template for PowerPoint & Google Slides
Process
Three-Step Result Diagram Infographic Template for PowerPoint & Google Slides
Process
Risk Management Process Diagram Template for PowerPoint & Google Slides
Risk Management
Creative Tree Diagram Infographic Template for PowerPoint & Google Slides
Decision Tree
Structured Mind Map Infographic Diagram Template for PowerPoint & Google Slides
Mind Maps
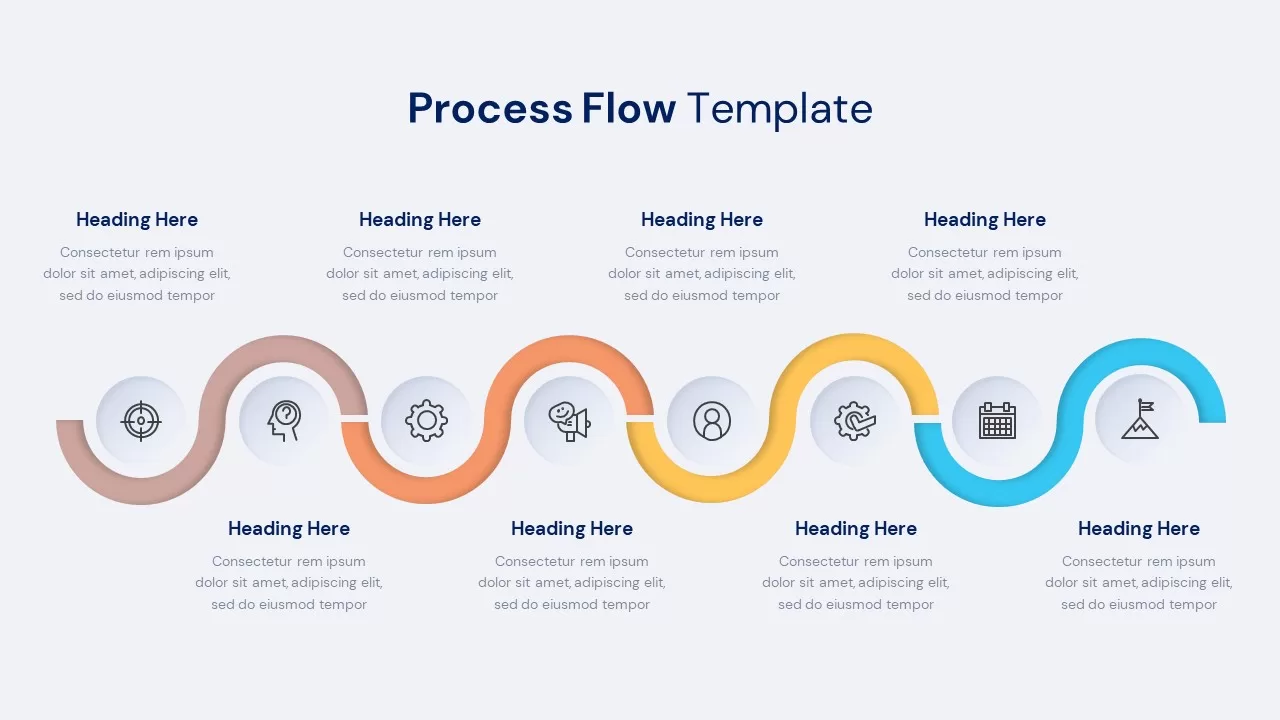
Process Flow Diagram template for PowerPoint & Google Slides
Process
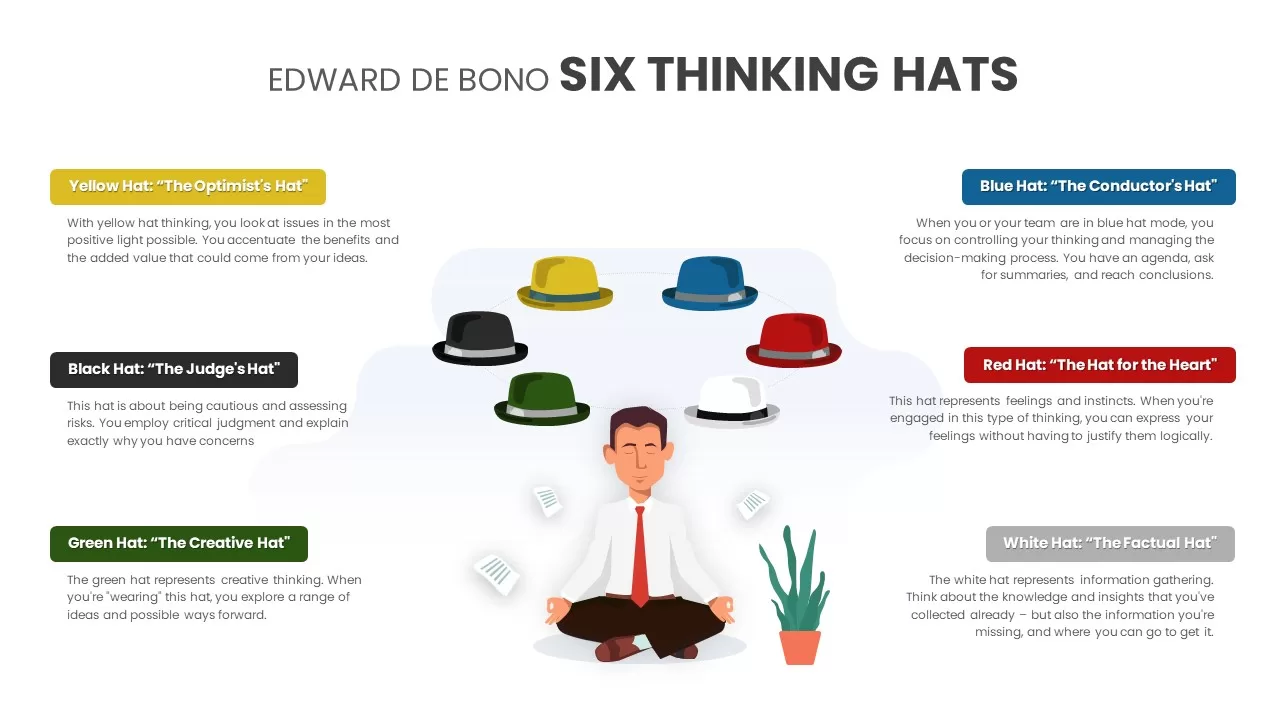
Six Thinking Hats Diagram Presentation Template for PowerPoint & Google Slides
Infographics
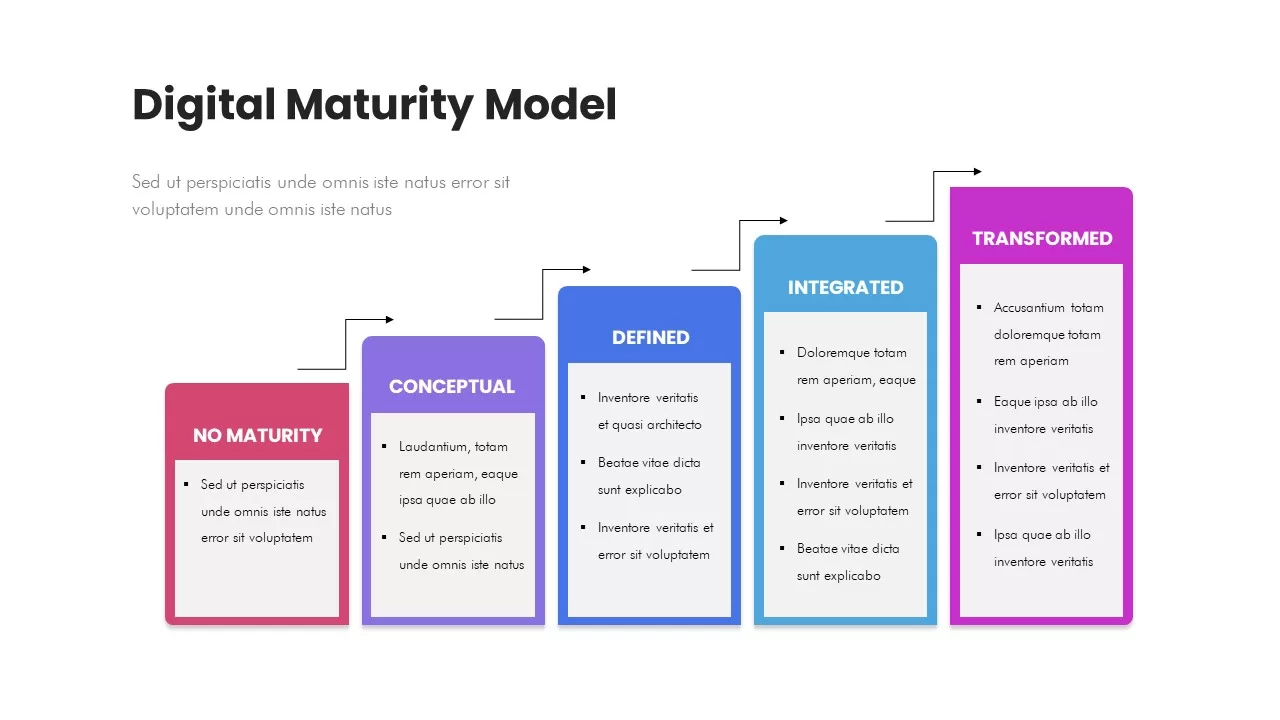
Digital Maturity Model Stages Diagram Template for PowerPoint & Google Slides
Process
Curved Arrow Process Flow Diagram Template for PowerPoint & Google Slides
Arrow
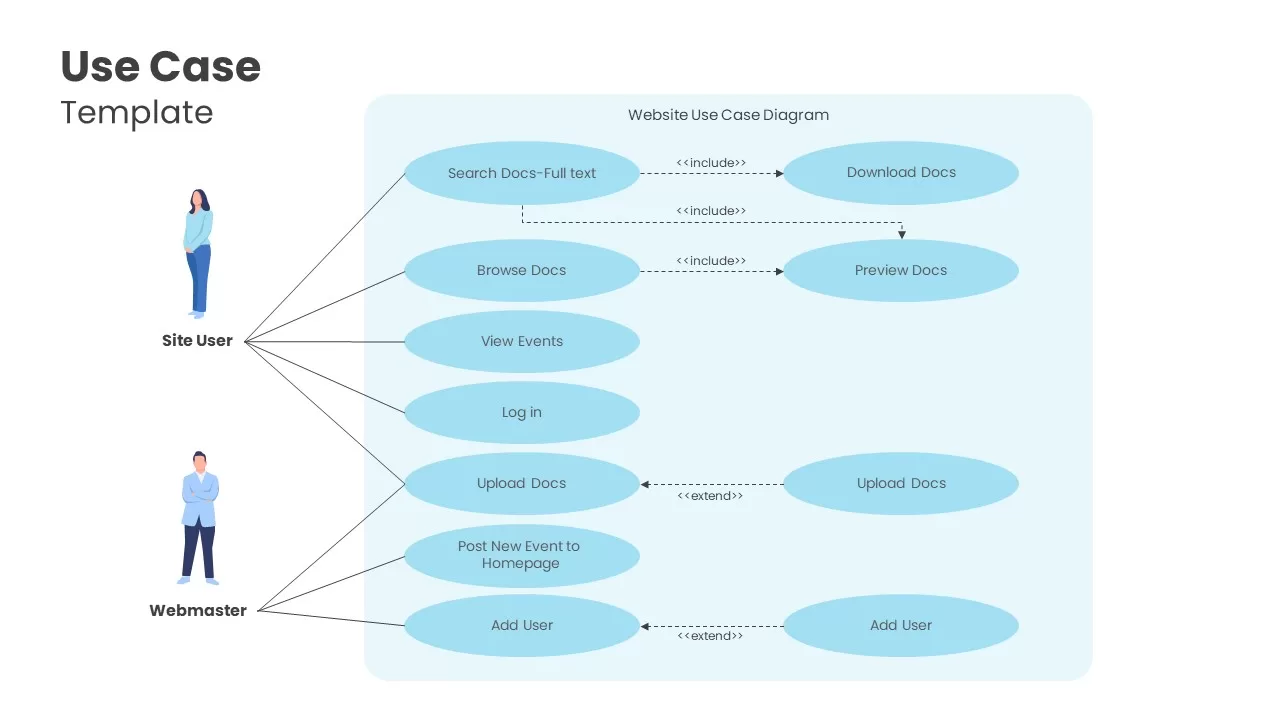
Website Use Case Diagram Template for PowerPoint & Google Slides
Software Development
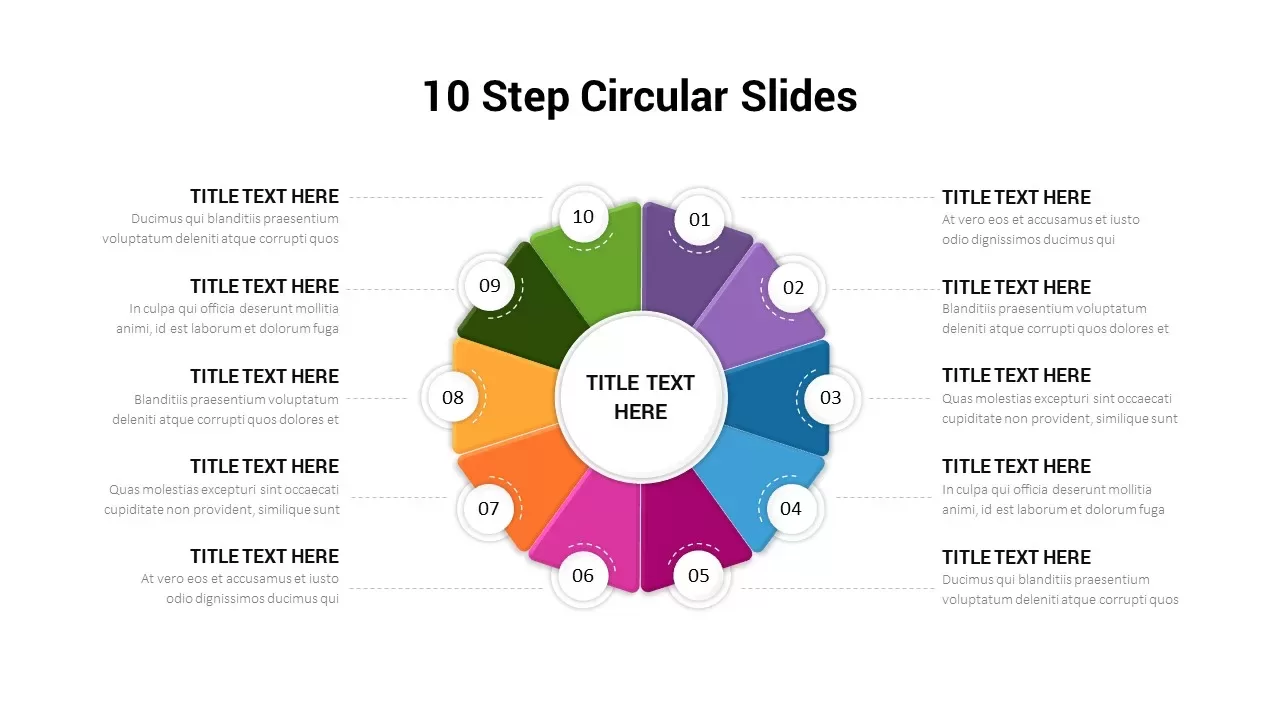
10-Step Circular Process Diagram Template for PowerPoint & Google Slides
Process
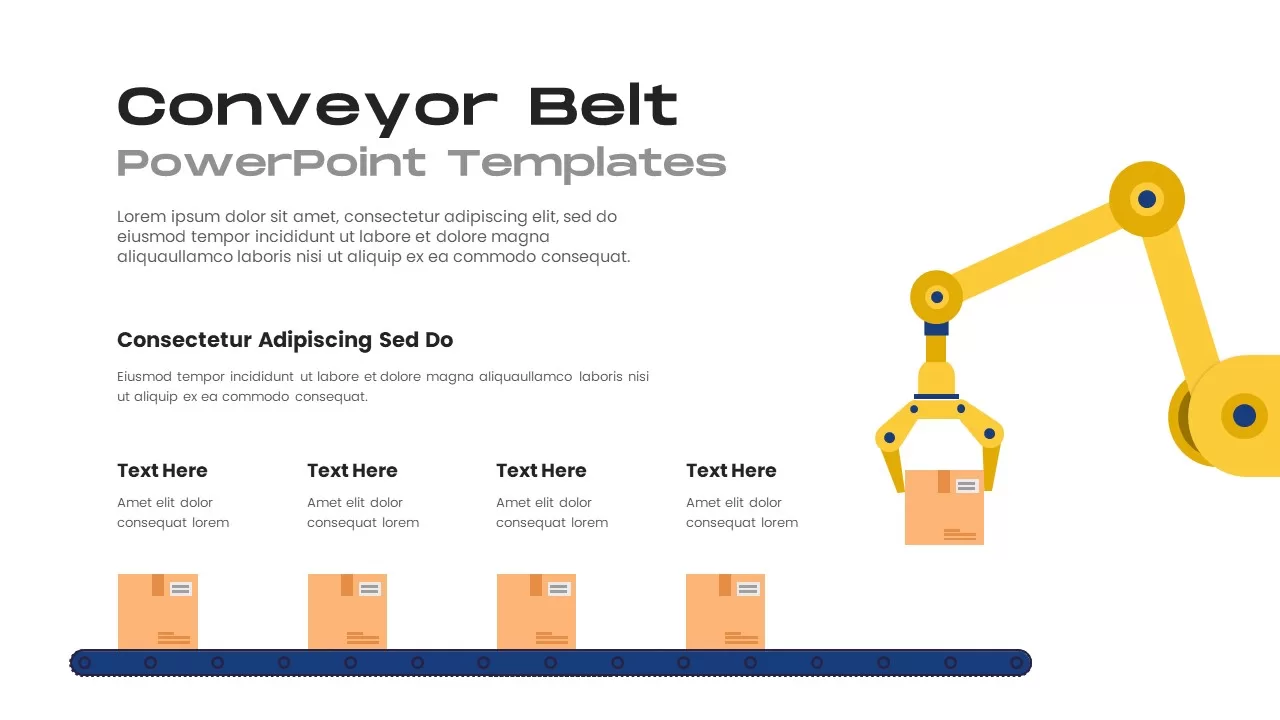
Robotic Conveyor Belt Process Diagram Template for PowerPoint & Google Slides
Process
Business Strategy House Model Diagram Template for PowerPoint & Google Slides
Business Strategy
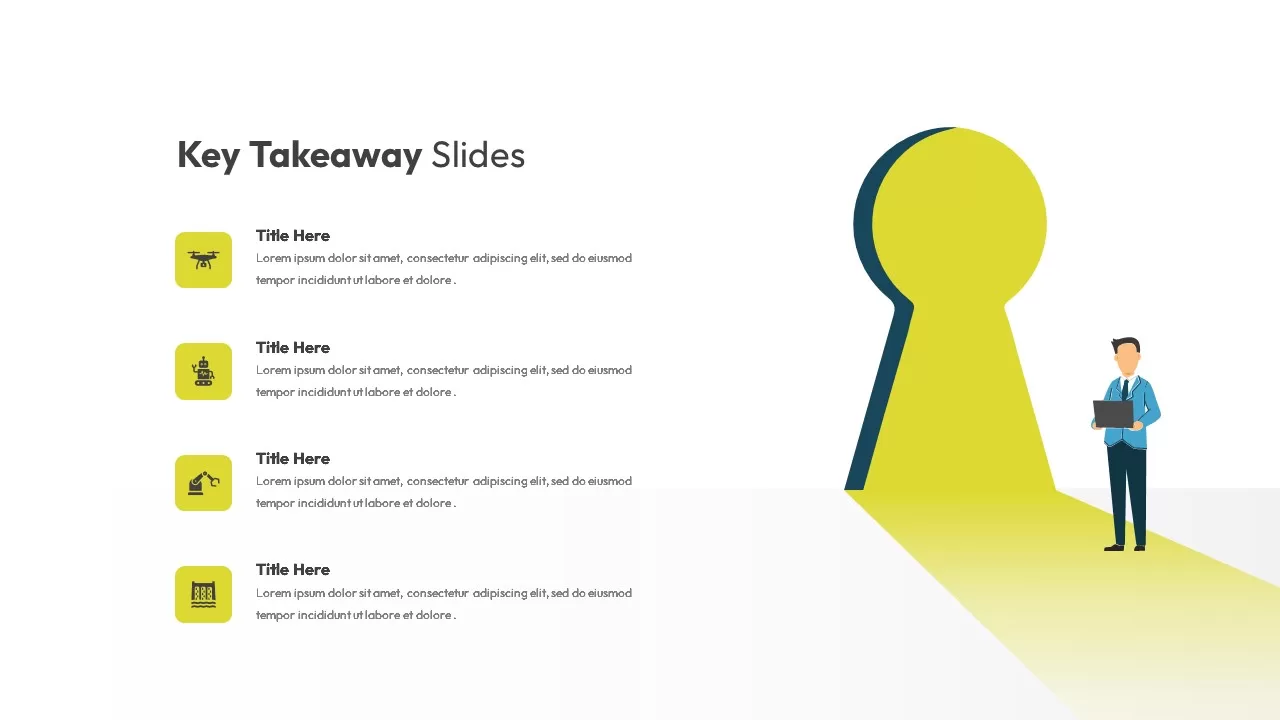
Key Takeaway Infographic Keyhole Diagram Template for PowerPoint & Google Slides
Process
Five-Step Interlocking Gears Diagram Template for PowerPoint & Google Slides
Process
Circular Revenue Generation Diagram Template for PowerPoint & Google Slides
Revenue
Double Funnel Lifecycle Diagram Template for PowerPoint & Google Slides
Funnel
Free Animated DNA Infographic Diagram Template for PowerPoint & Google Slides
Infographics
Free
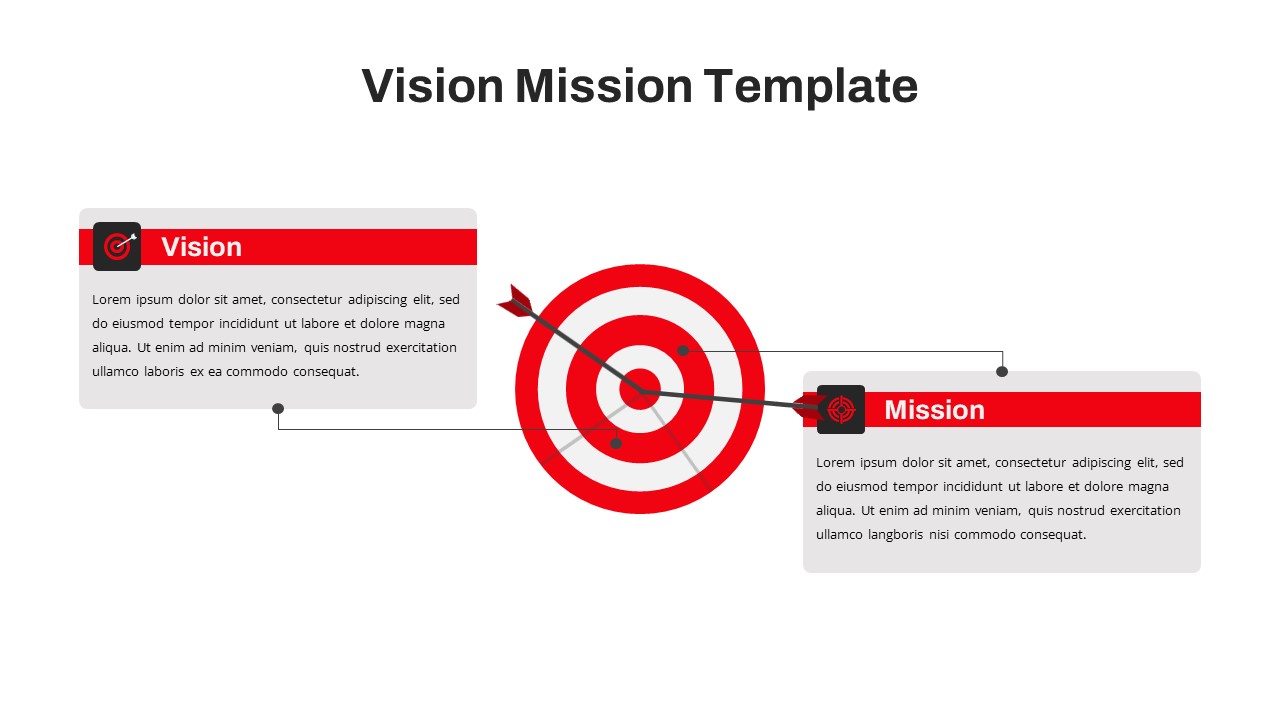
Free Vision and Mission Target Diagram Template for PowerPoint & Google Slides
Vision and Mission
Free
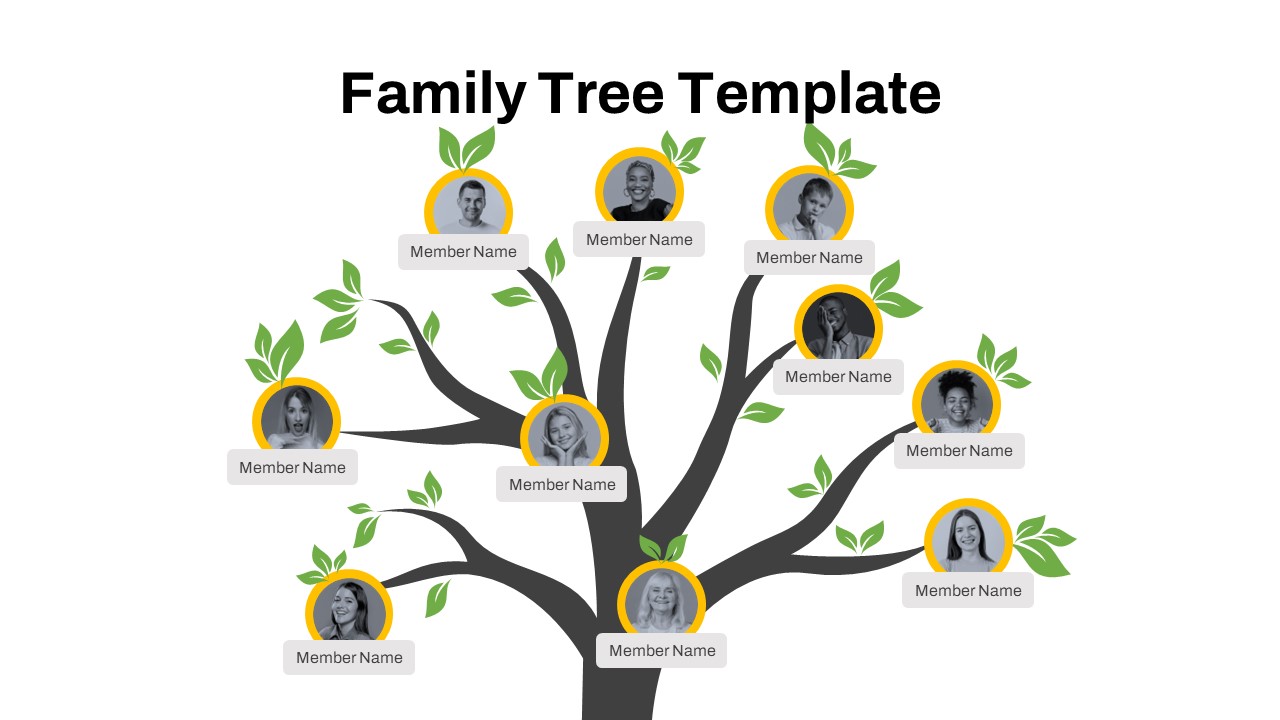
Free Editable Family Tree Genealogy Diagram Template for PowerPoint & Google Slides
Org Chart
Free
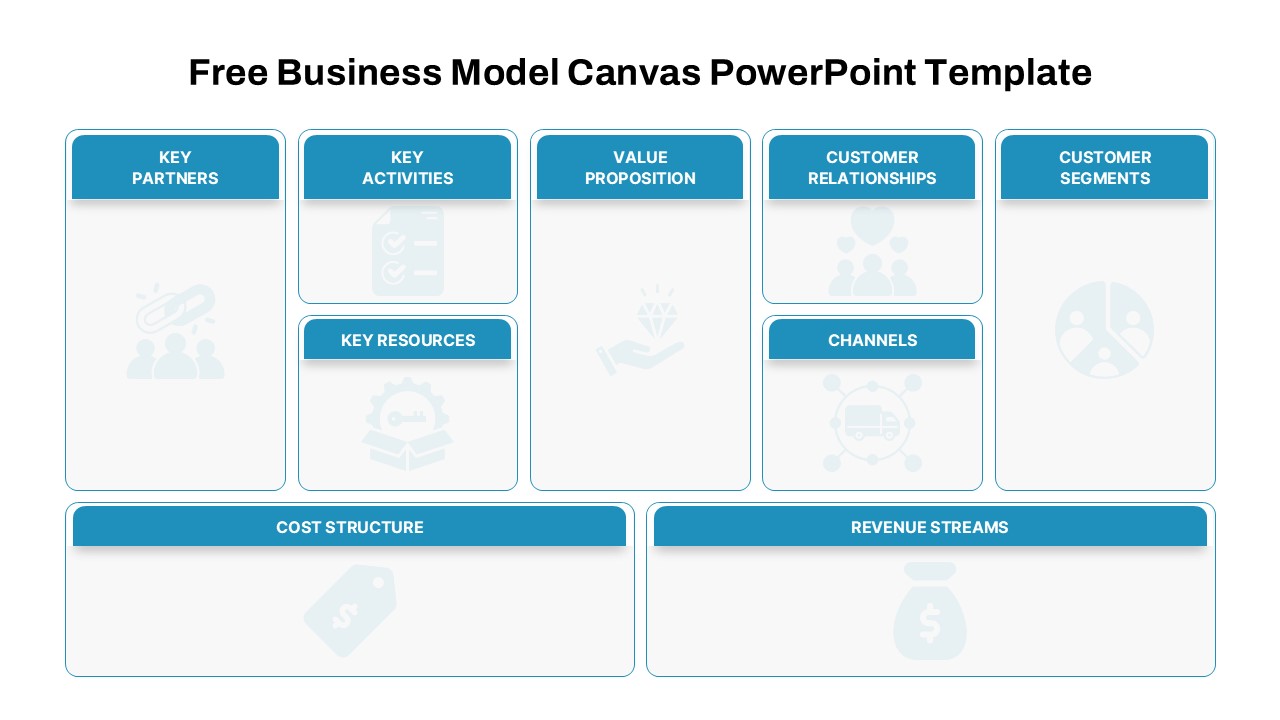
Free Business Model Canvas Diagram Slide Template for PowerPoint & Google Slides
Business Models
Free
Capital Investments Process Flow Diagram Template for PowerPoint & Google Slides
Process
Salience Model Venn Diagram Infographic Template for PowerPoint & Google Slides
Circular
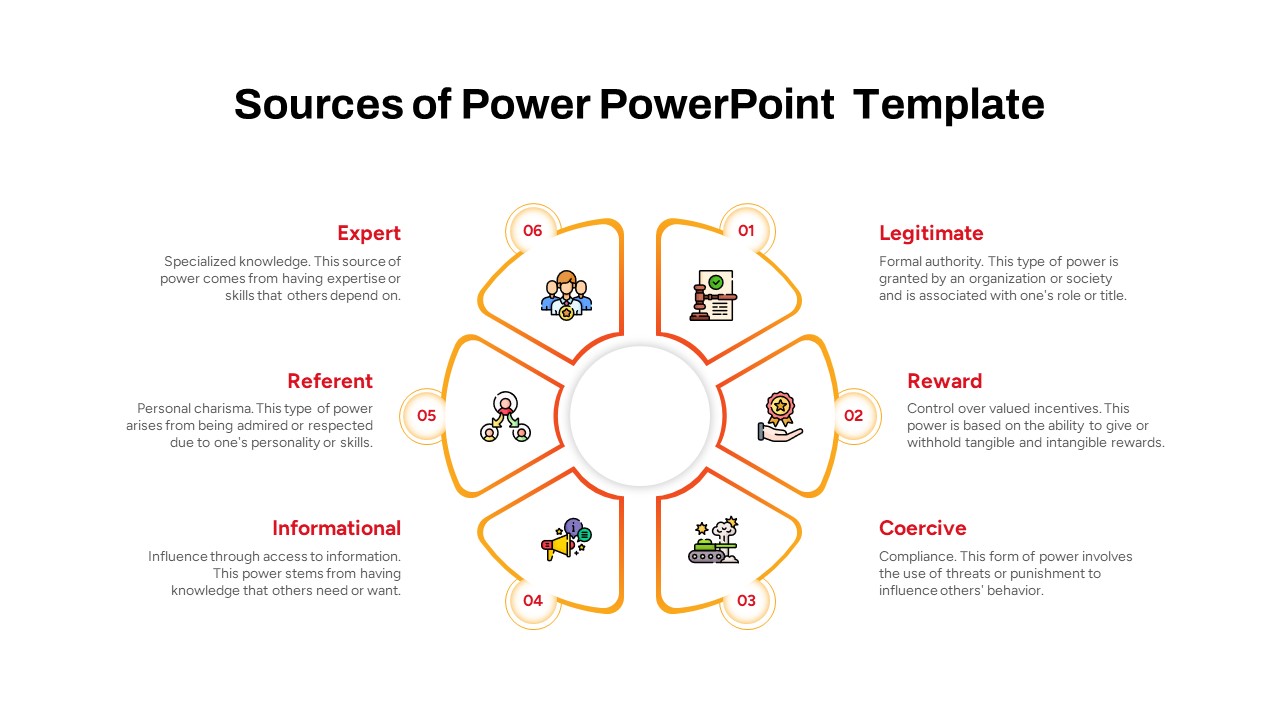
Sources of Power Circular Diagram Template for PowerPoint & Google Slides
Circular
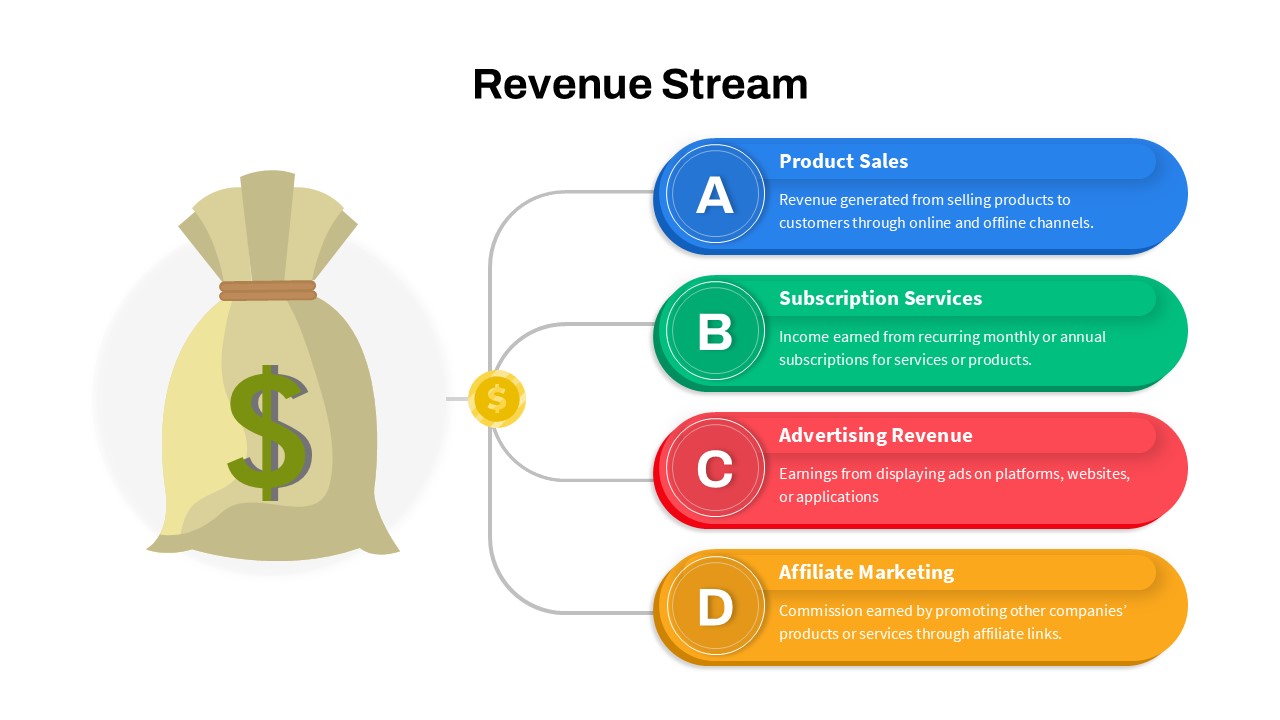
Revenue Streams: Four Channels Diagram Template for PowerPoint & Google Slides
Business Models
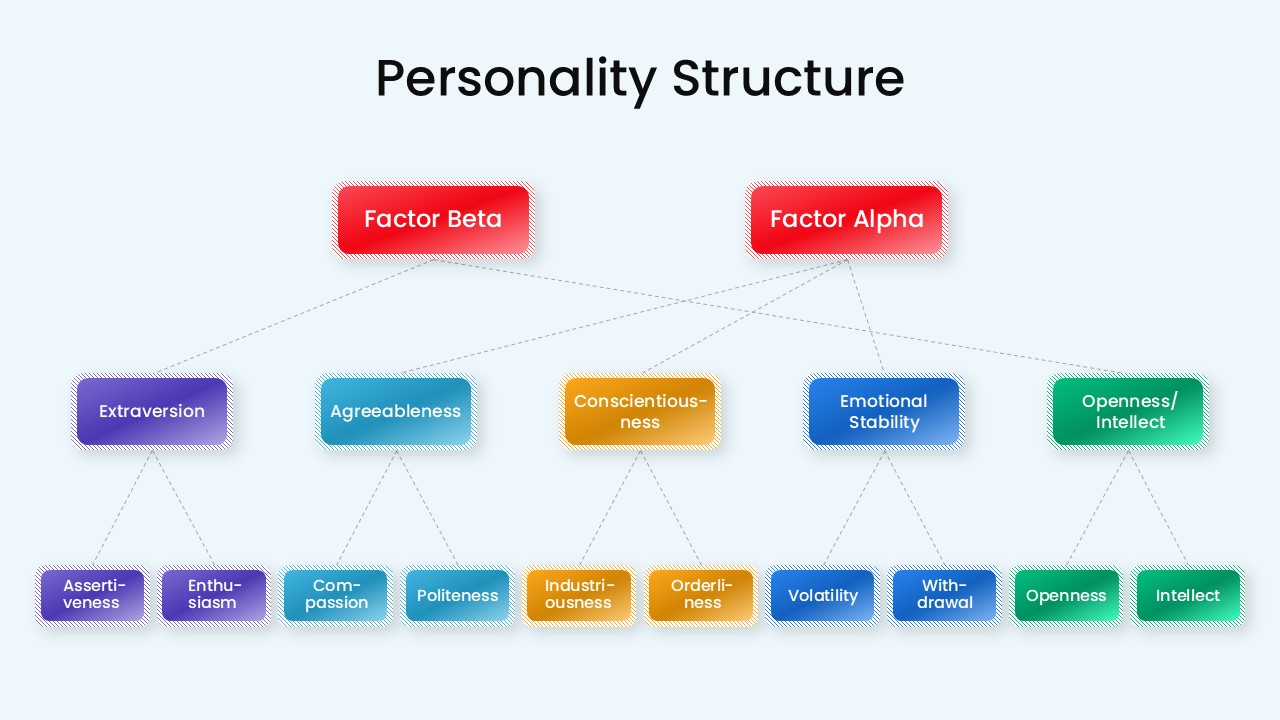
Personality Structure Hierarchy Diagram Template for PowerPoint & Google Slides
Org Chart
Colorful Startup Financing Cycle Diagram Template for PowerPoint & Google Slides
Finance
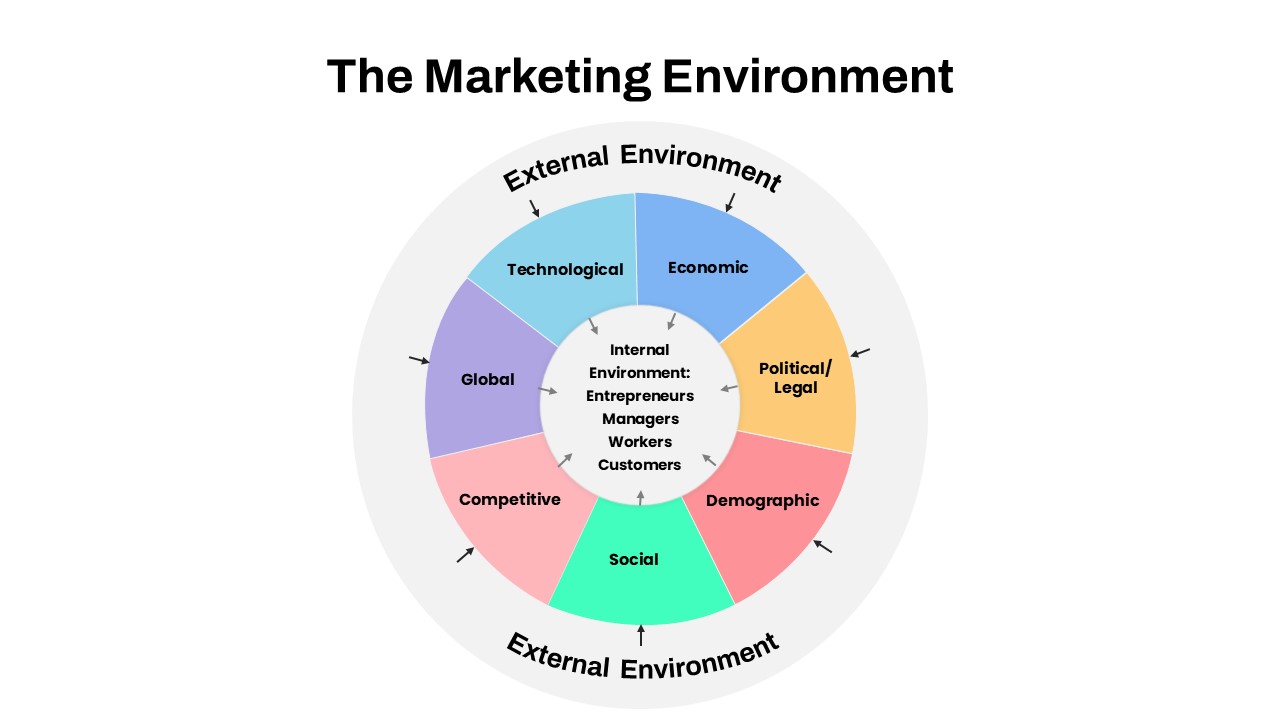
Marketing Environment Circular Diagram template for PowerPoint & Google Slides
Marketing
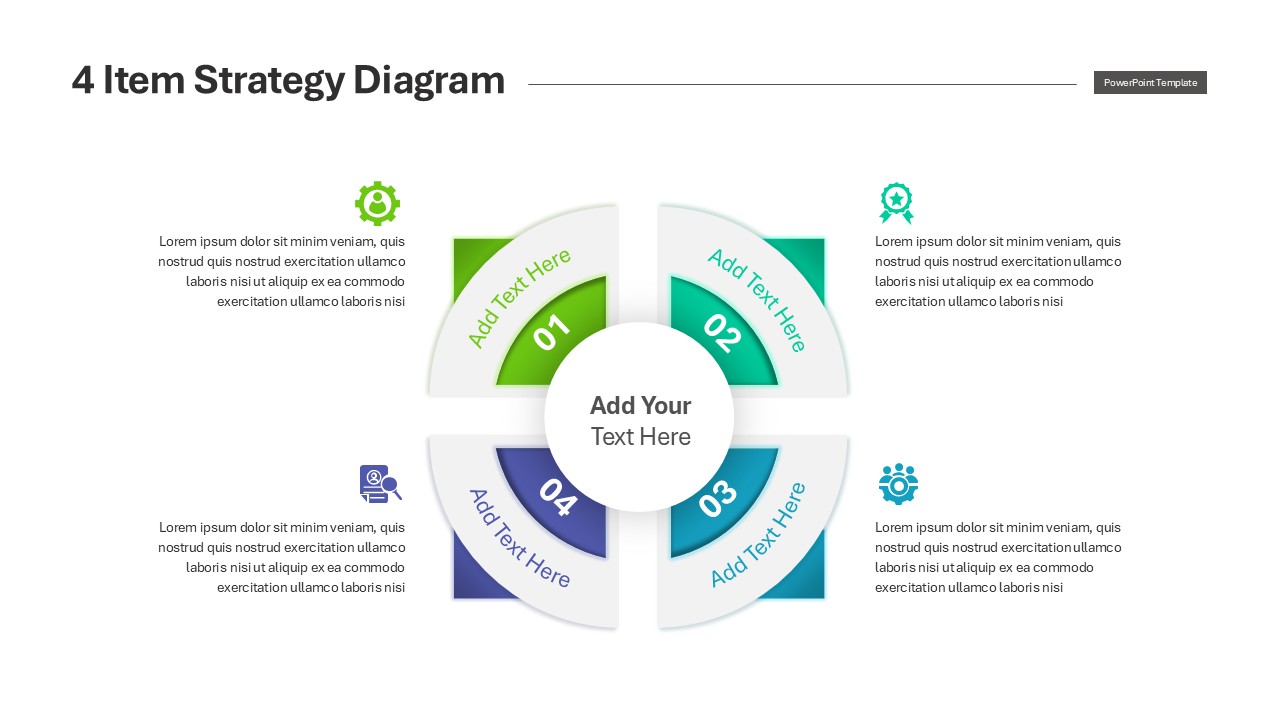
Engaging Four-Option Strategy Diagram Template for PowerPoint & Google Slides
Business Strategy
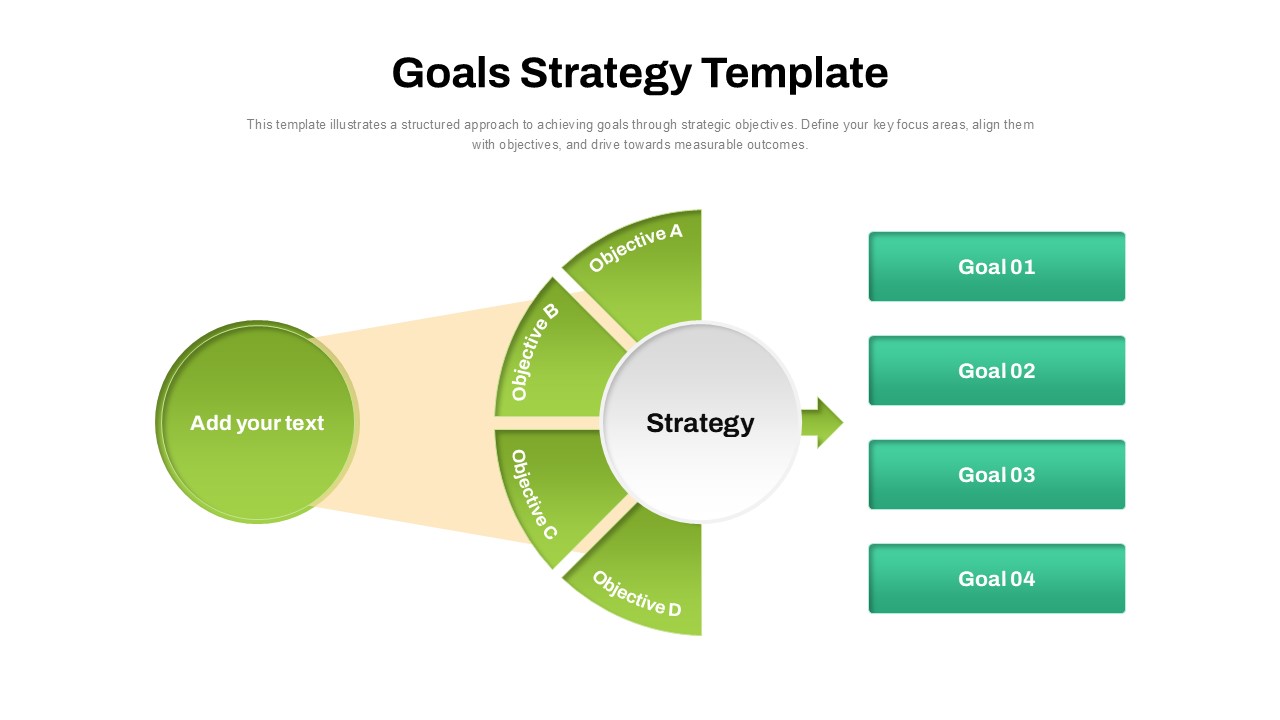
Goals Strategy Semicircle Diagram Template for PowerPoint & Google Slides
Process
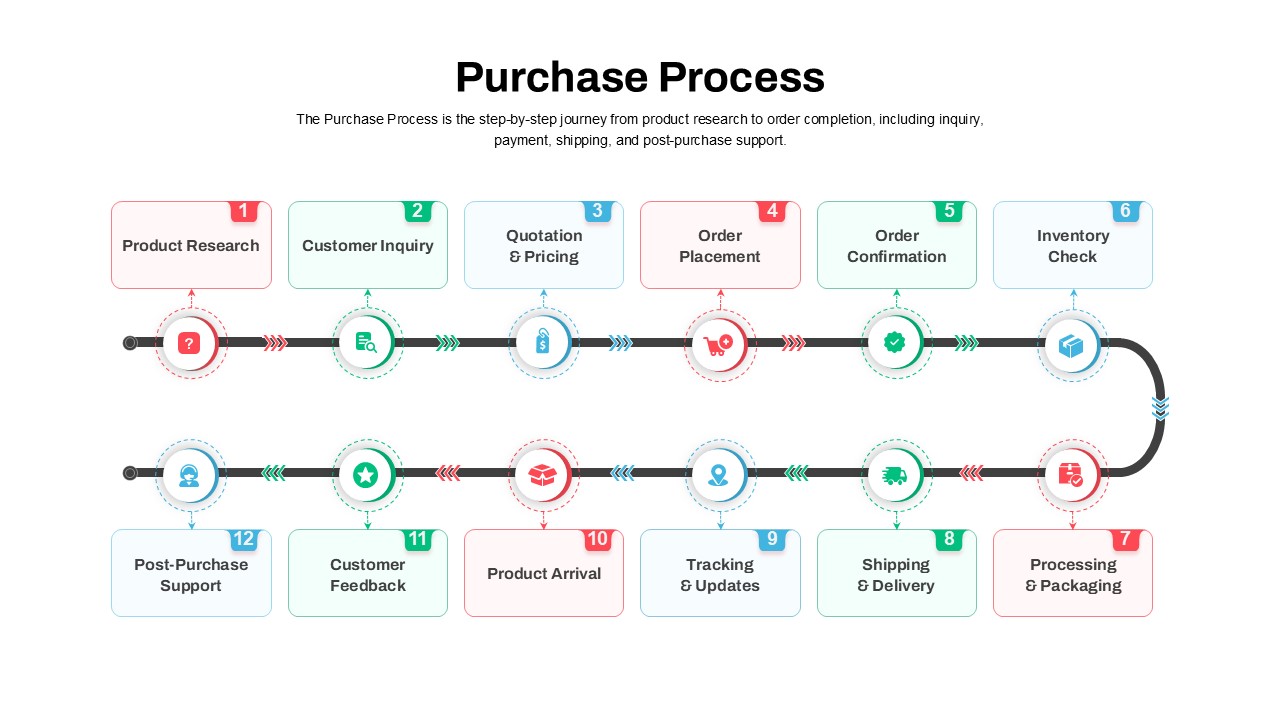
Streamlined Purchase Process Diagram Template for PowerPoint & Google Slides
Timeline
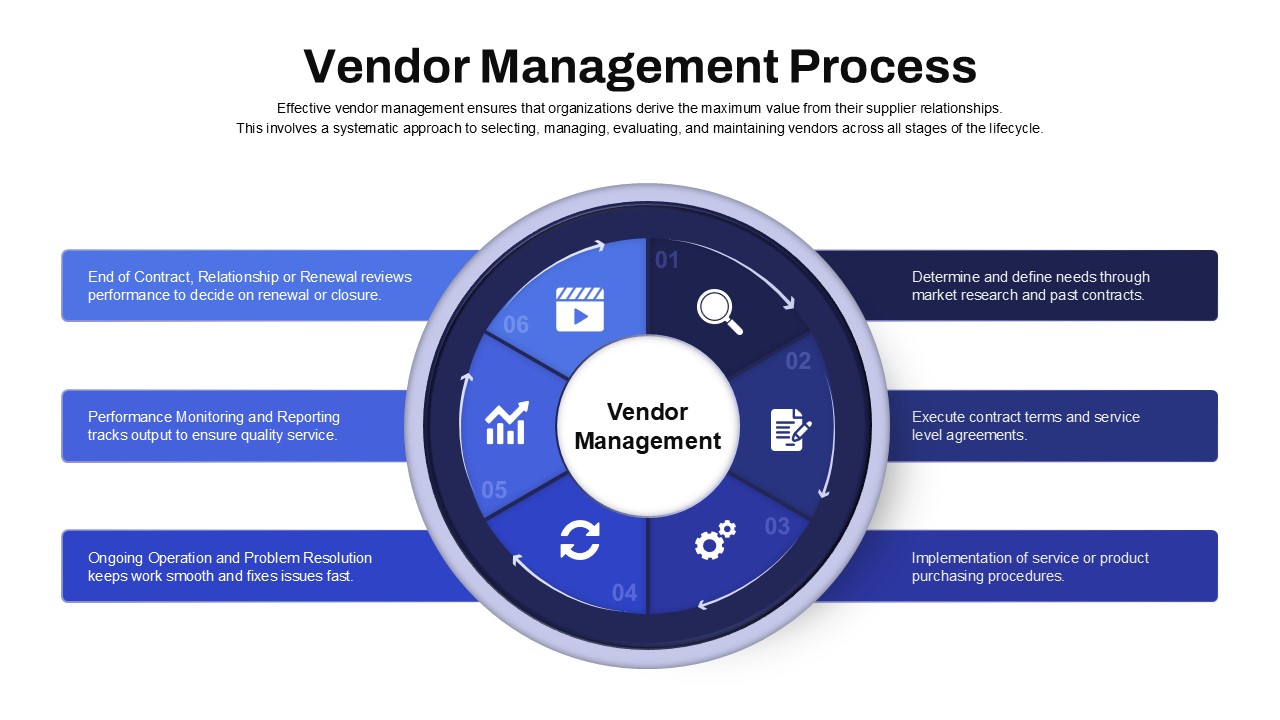
Vendor Management Process Diagram Template for PowerPoint & Google Slides
Process
Dynamic Carousel Icon Hub Diagram Template for PowerPoint & Google Slides
Circular
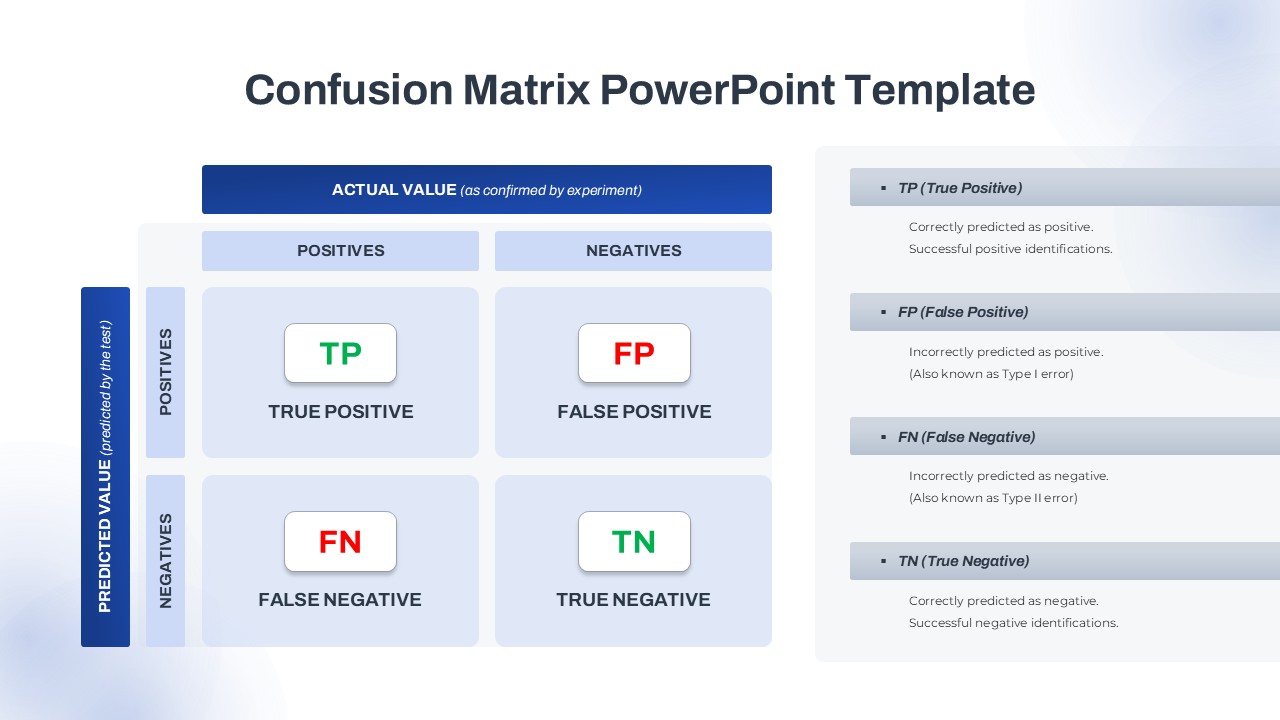
Confusion Matrix Diagram Overview Template for PowerPoint & Google Slides
Comparison
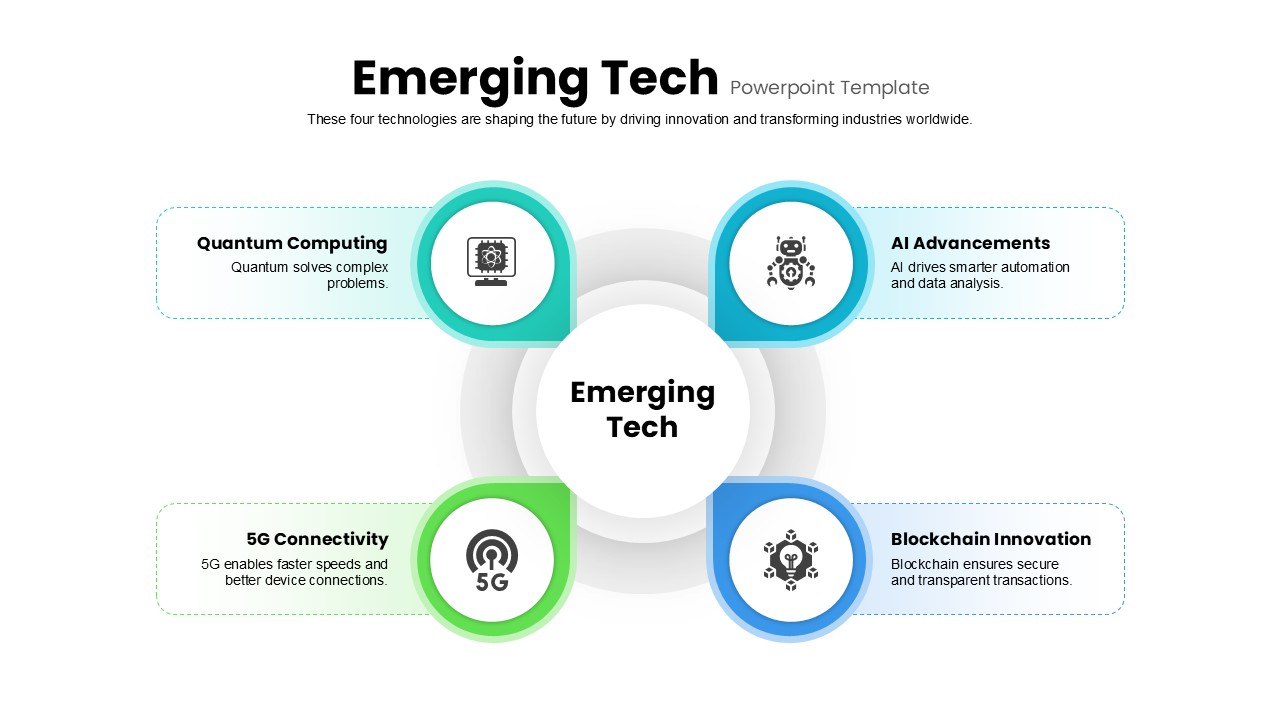
Emerging Tech Hub-and-Spoke Diagram Template for PowerPoint & Google Slides
Technology
Attribution Models Comparison Diagram Template for PowerPoint & Google Slides
Comparison
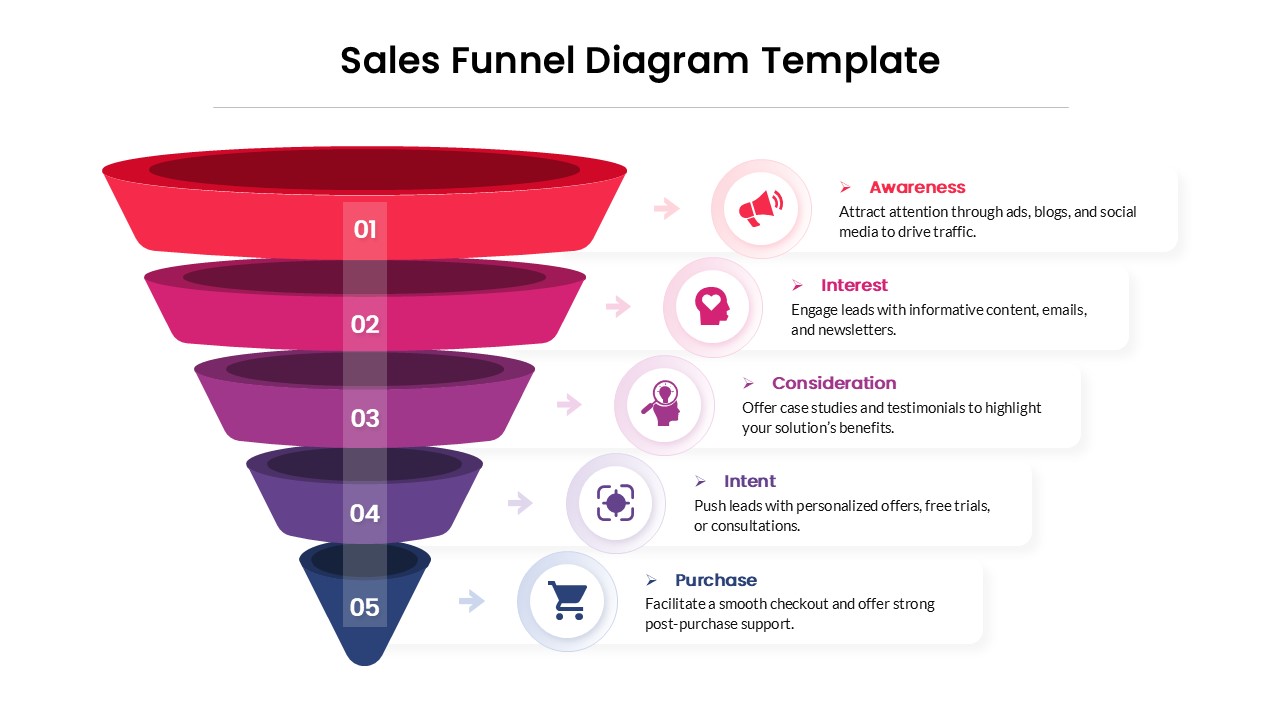
5 Stage Sales Funnel Diagram Template for PowerPoint & Google Slides
Funnel
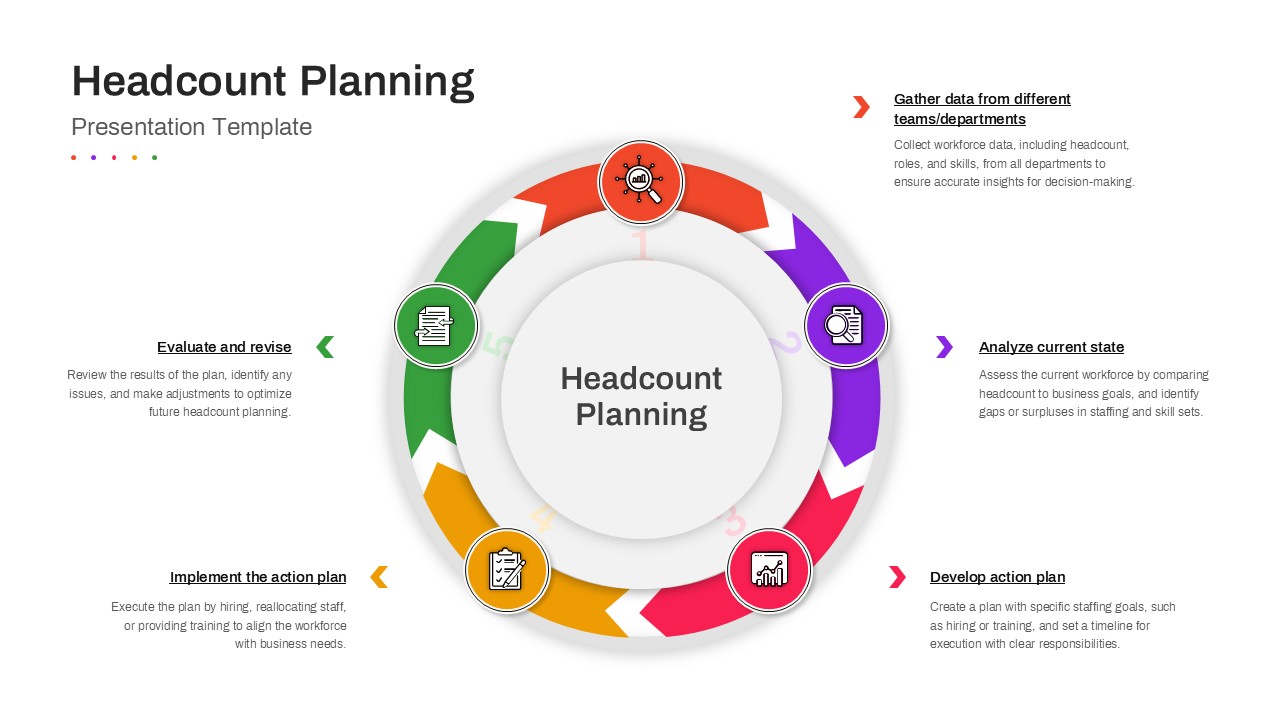
Headcount Planning Circular Process Diagram Template for PowerPoint & Google Slides
HR