Tree Keyword Petals Infographic Template for PowerPoint & Google Slides


Description
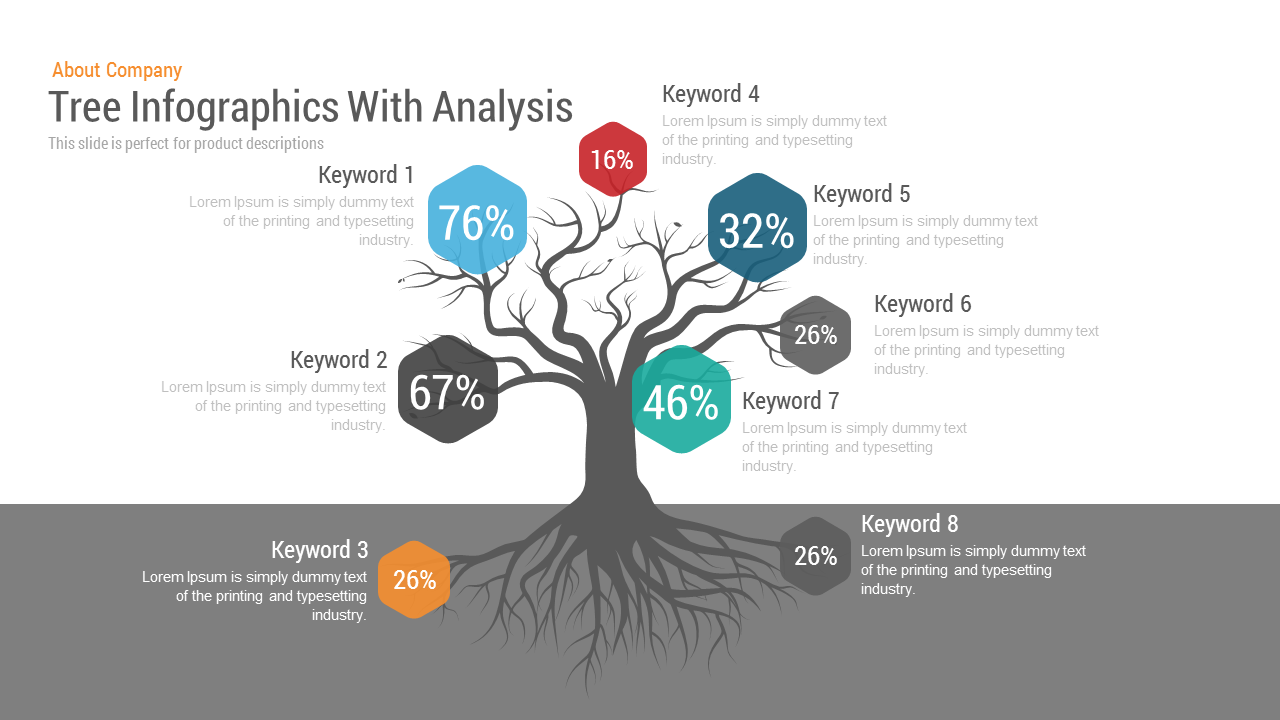
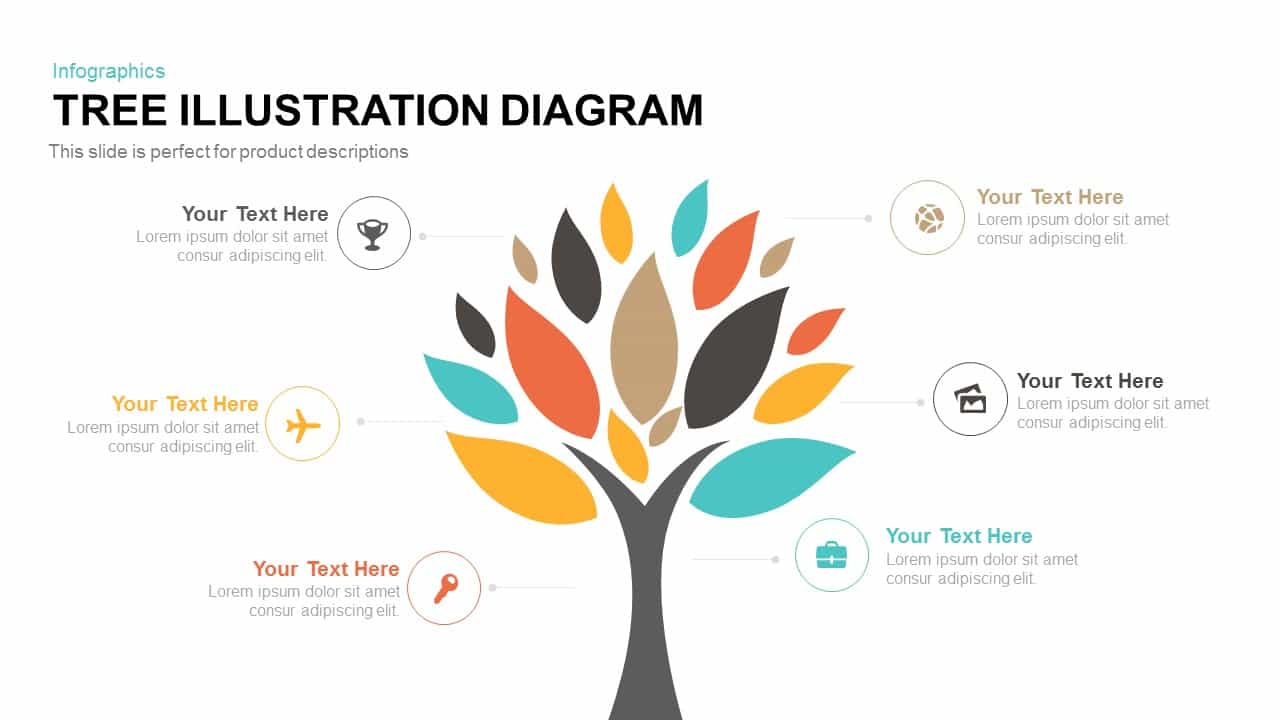
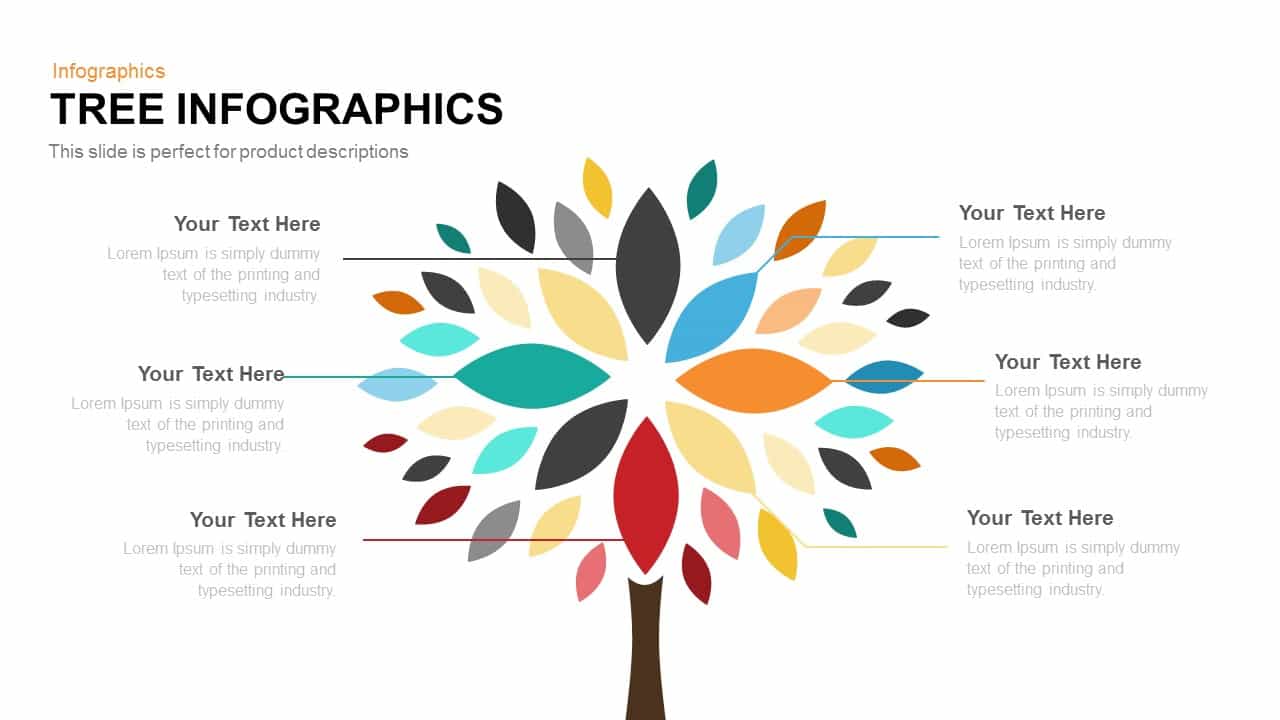
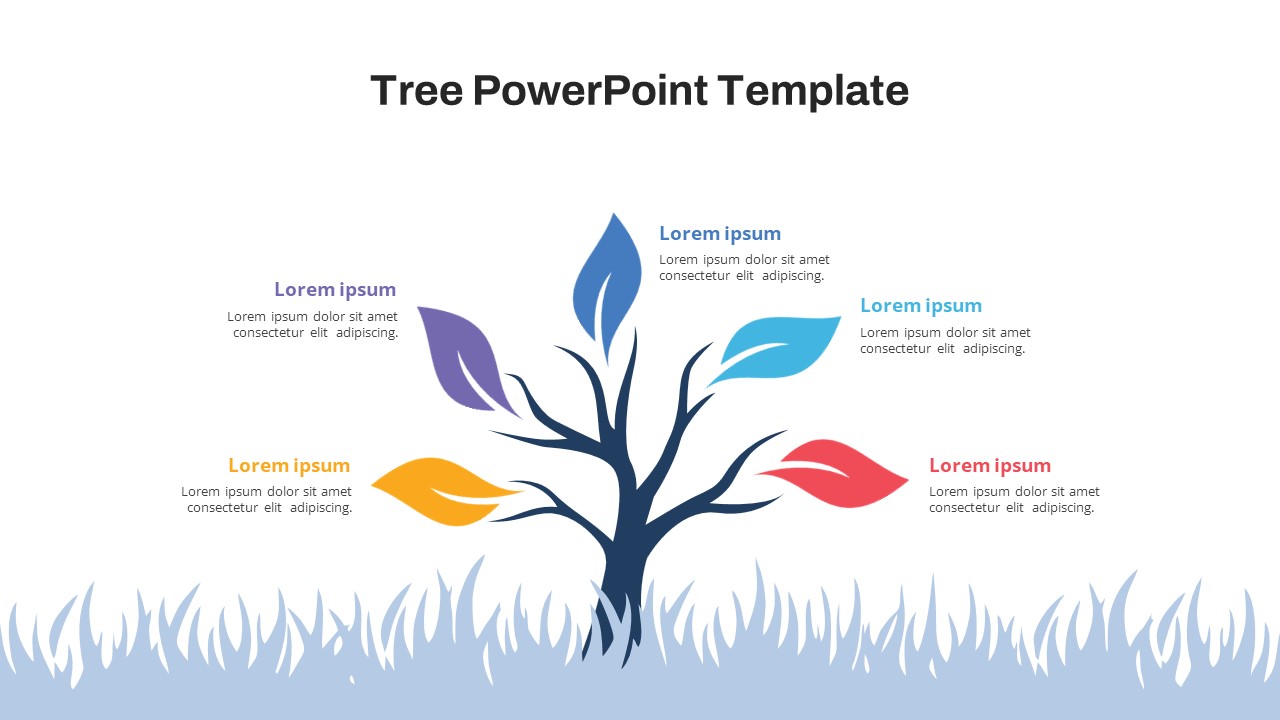
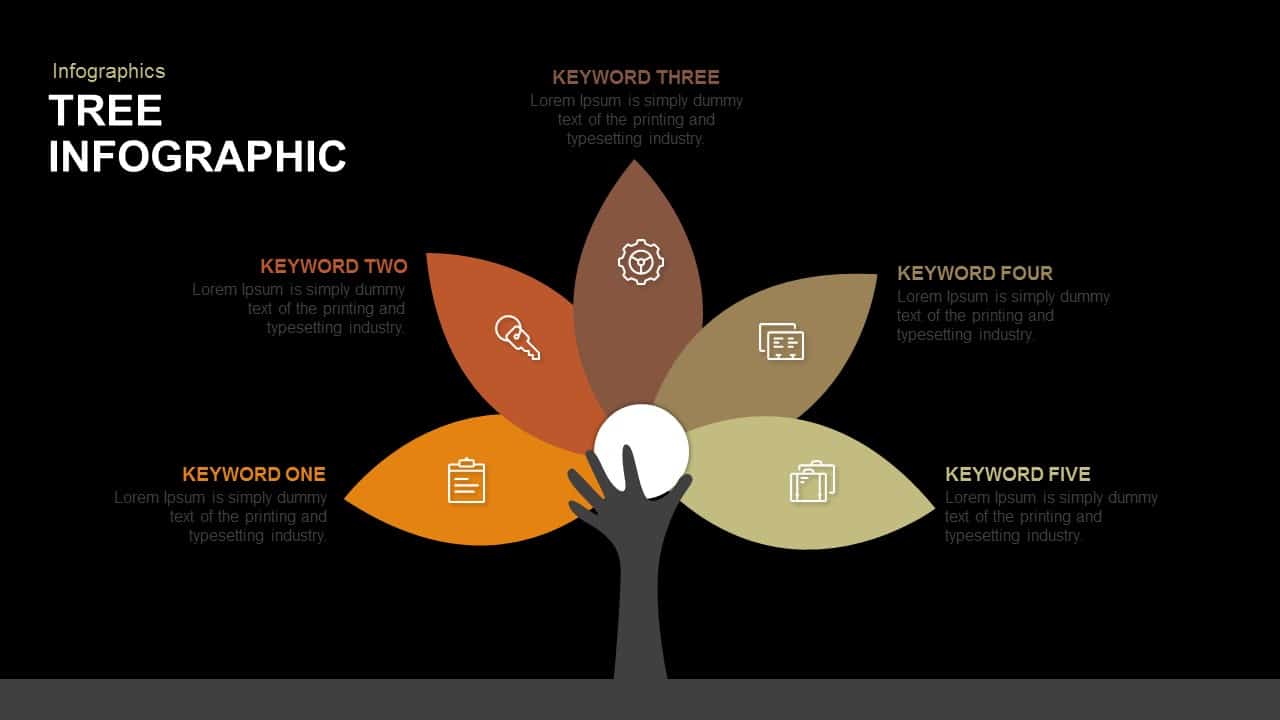
This tree infographic slide features a sleek trunk graphic anchoring five leaf-shaped segments radiating outward in warm autumnal hues—orange, rust, brown, olive, and light green. Each leaf includes an icon placeholder and text label for up to five keywords, concepts, or process steps. The symmetrical radial layout and subtle shading create visual depth and guide audience focus from the trunk to each individual element.
Built on master slides with fully editable vector shapes, this template enables rapid customization: swap icons via drag-and-drop, adjust leaf colors or gradients to match your brand palette, and edit text placeholders in seconds. The minimalist white backdrop and clean sans-serif typography ensure readability, while compatibility with PowerPoint and Google Slides preserves layout integrity and clarity across devices.
This slide supports advanced customization—add sequential animations to reveal leaves one at a time, overlay numeric metrics or timelines on leaf shapes, and expand or remove segments to fit project scope. The vector format allows infinite scaling without quality loss, making it suitable for large displays or print materials. Accessibility features include color-blind friendly defaults and grayscale compatibility.
With theme-aware formatting, you can switch color palettes instantly to align with corporate or startup branding guidelines. Each vector component supports easy resizing, and the slide uses built-in placeholders to streamline content updates. Combining aesthetic appeal with functional clarity, this infographic slide will enhance audience engagement, support data-driven storytelling, and reinforce key messages in any context.
Who is it for
Business leaders, marketing managers, project managers, and consultants will benefit from this slide when presenting five-part frameworks, mapping conceptual relationships, or showcasing key themes. Trainers, educators, and product teams can also leverage its clear visual structure for strategy workshops and stakeholder alignment.
Other Uses
Repurpose this infographic for customer segmentation analyses, risk category mapping, organizational overviews, process breakdowns, product feature comparisons, OKR frameworks, or team structure visuals. Expand the design by duplicating leaves or rotating the layout to suit diverse presentation contexts.
Login to download this file

Item ID
SB00639
Related Templates

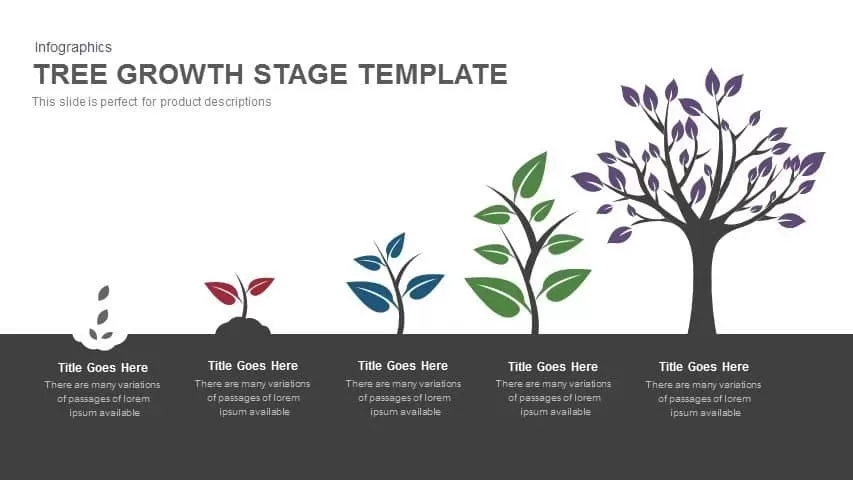
Tree Growth Stage Infographic Template for PowerPoint & Google Slides
Timeline

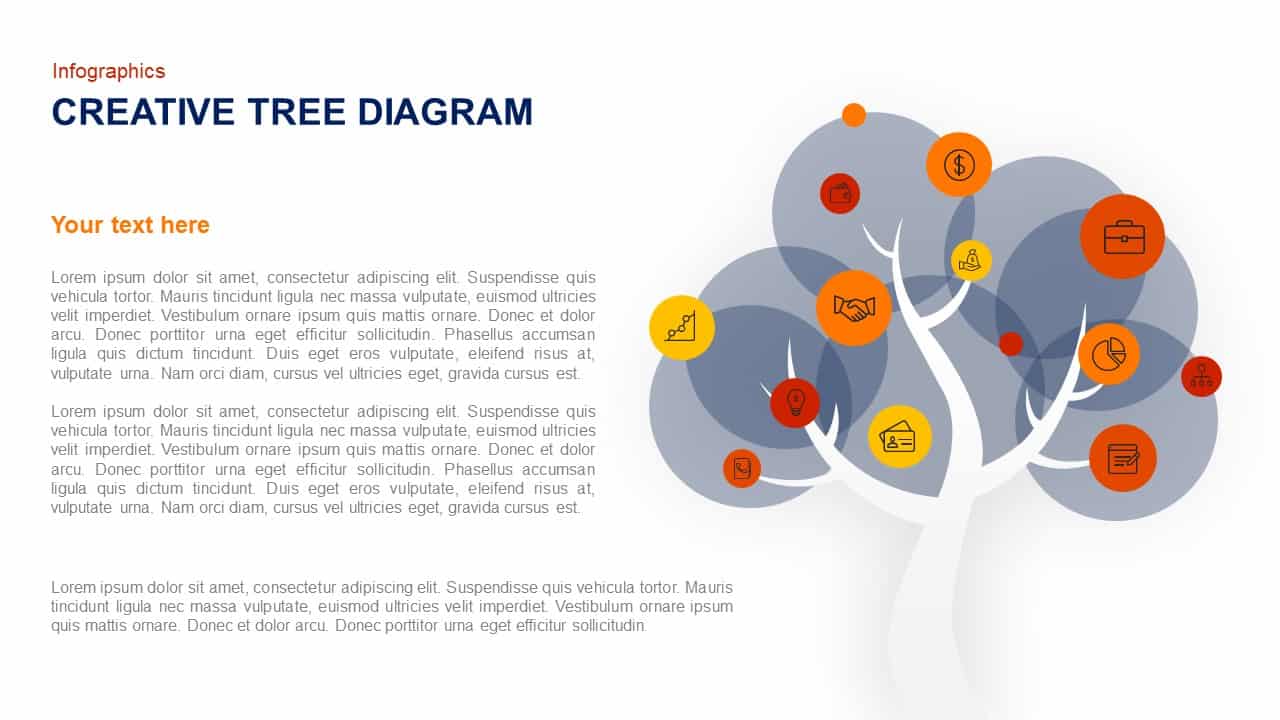
Creative Tree Infographic Diagram Template for PowerPoint & Google Slides
Infographics
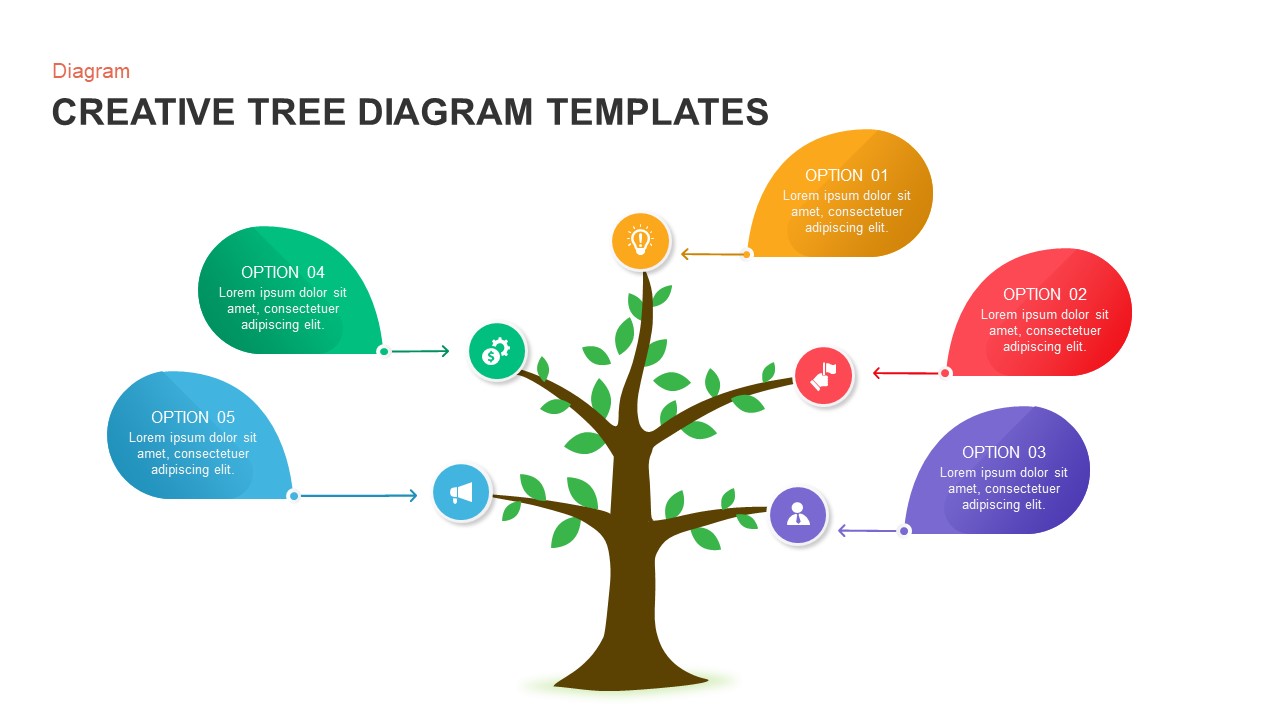
Creative Tree Diagram Infographic Template for PowerPoint & Google Slides
Decision Tree
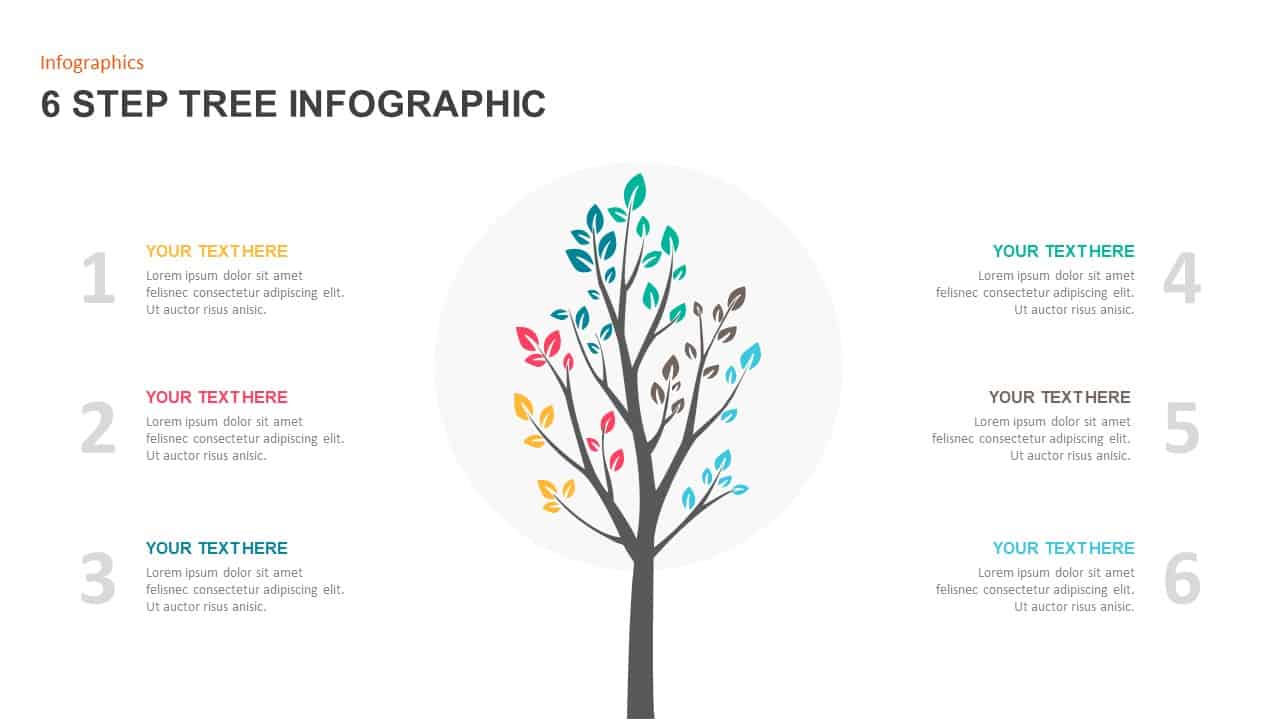
Six-Step Tree Diagram Infographic Template for PowerPoint & Google Slides
Infographics
Creative Tree Diagram Infographic Template for PowerPoint & Google Slides
Decision Tree
Tree Infographics template for PowerPoint & Google Slides
Decision Tree
Tree Diagram template for PowerPoint & Google Slides
Decision Tree
Business Tree Diagram template for PowerPoint & Google Slides
Business Strategy
Engaging Creative Tree Diagram Slide Template for PowerPoint & Google Slides
Flow Charts
Tree Illustration template for PowerPoint & Google Slides
Process
Interactive Products Tree Diagram template for PowerPoint & Google Slides
Org Chart
Colorful Decision Tree Diagram template for PowerPoint & Google Slides
Decision Tree
Editable Hierarchical Tree Diagram Template for PowerPoint & Google Slides
Decision Tree
Tree Infographics template for PowerPoint & Google Slides
Infographics
Decision Tree Diagram template for PowerPoint & Google Slides
Decision Tree

Creative Tree Diagram with Percentages Template for PowerPoint & Google Slides
Decision Tree
Five-Stage Eco Tree Process Diagram Template for PowerPoint & Google Slides
Process
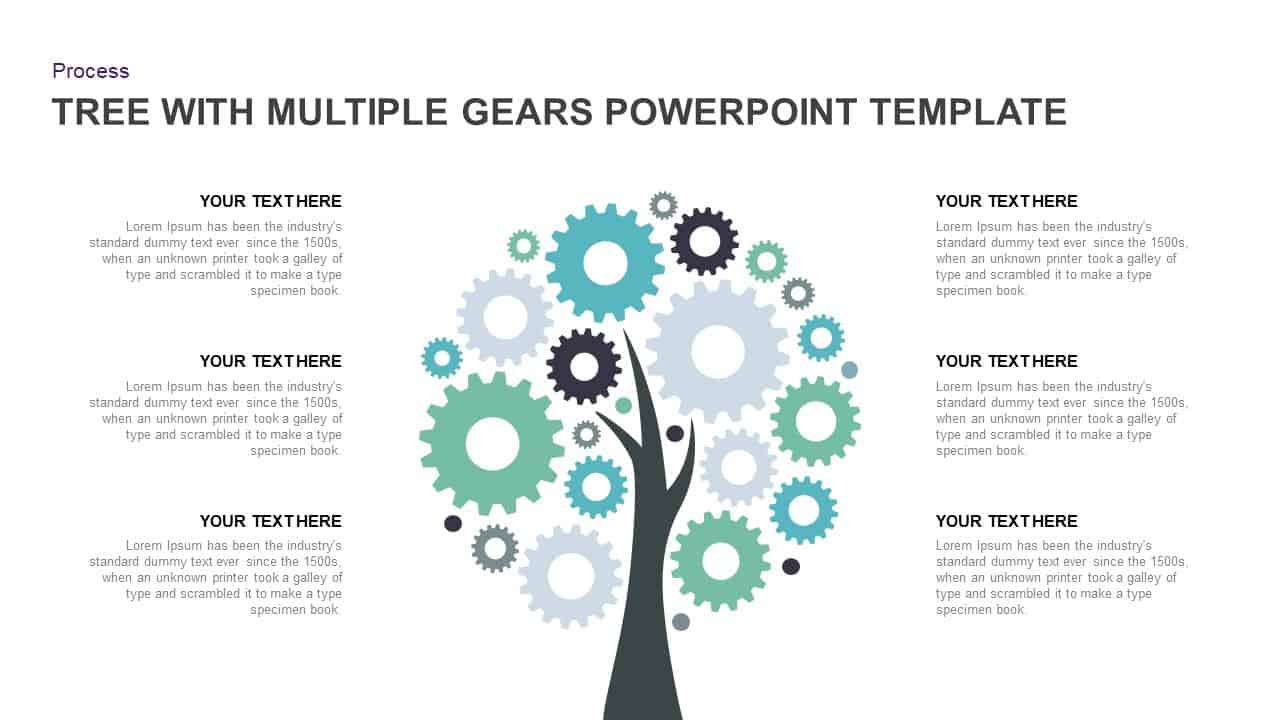
Tree Diagram with Gears Process Template for PowerPoint & Google Slides
Process
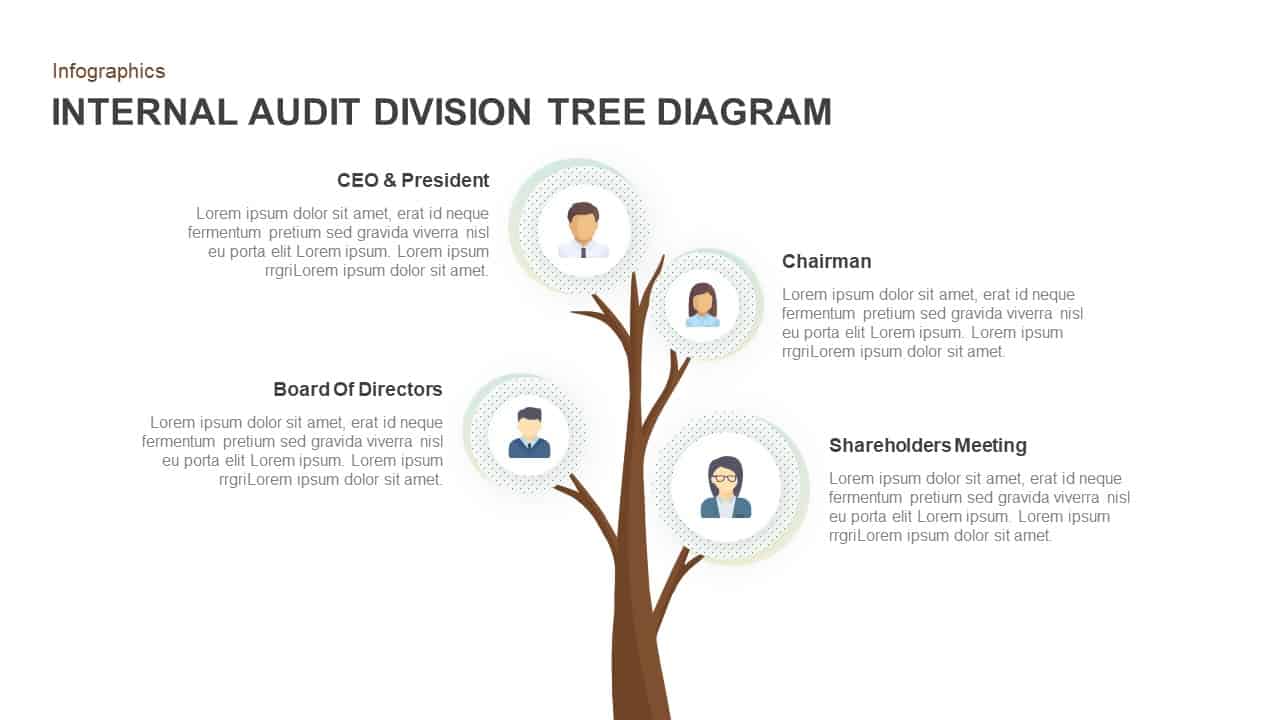
Internal Audit Division Tree Diagram Template for PowerPoint & Google Slides
Org Chart
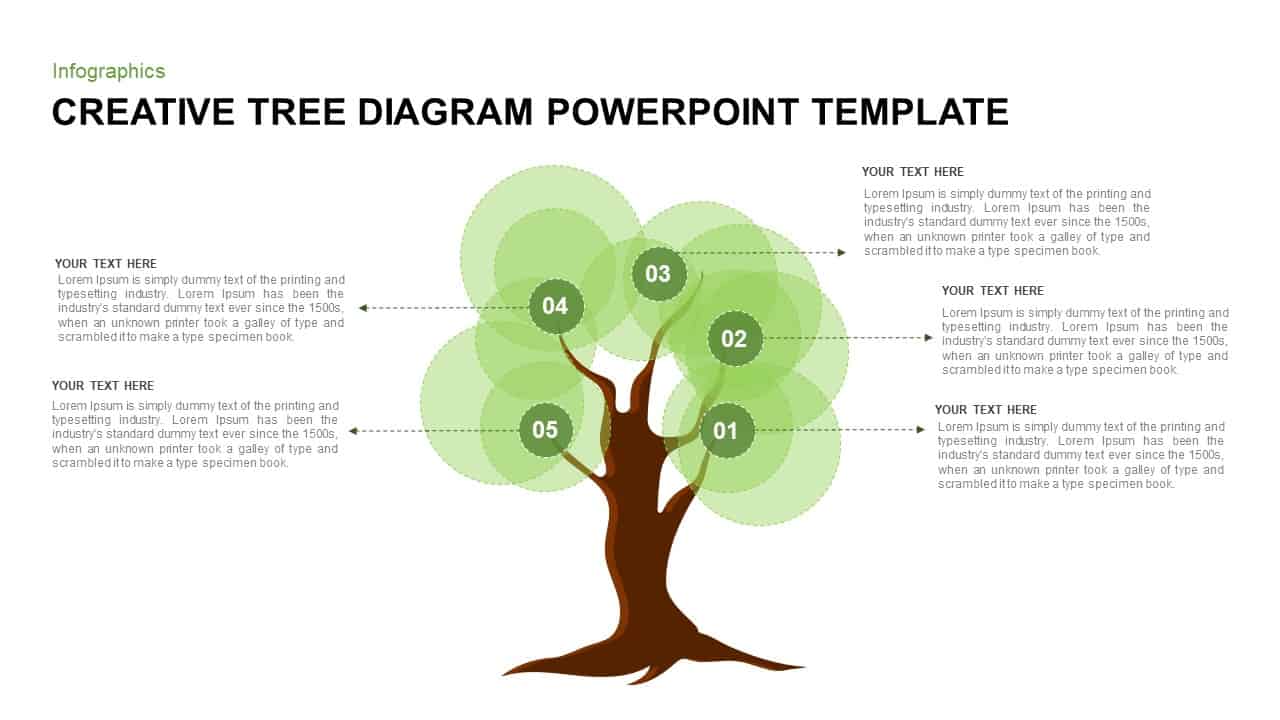
Creative Tree Diagram template for PowerPoint & Google Slides
Process
Sky and Tree Root Cause Analysis Deck Template for PowerPoint & Google Slides
Opportunities Challenges
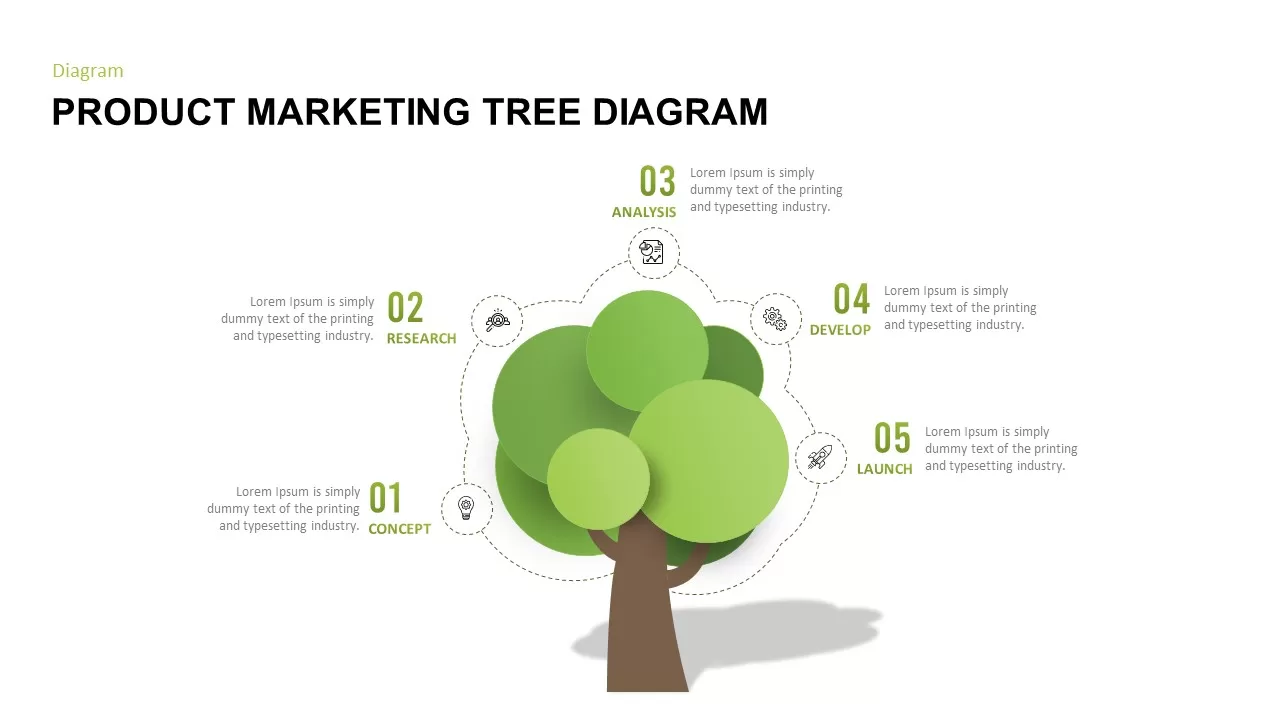
Product Marketing Tree Diagram Template for PowerPoint & Google Slides
Marketing
Paper Tree Business Introduction Template for PowerPoint & Google Slides
Company Profile
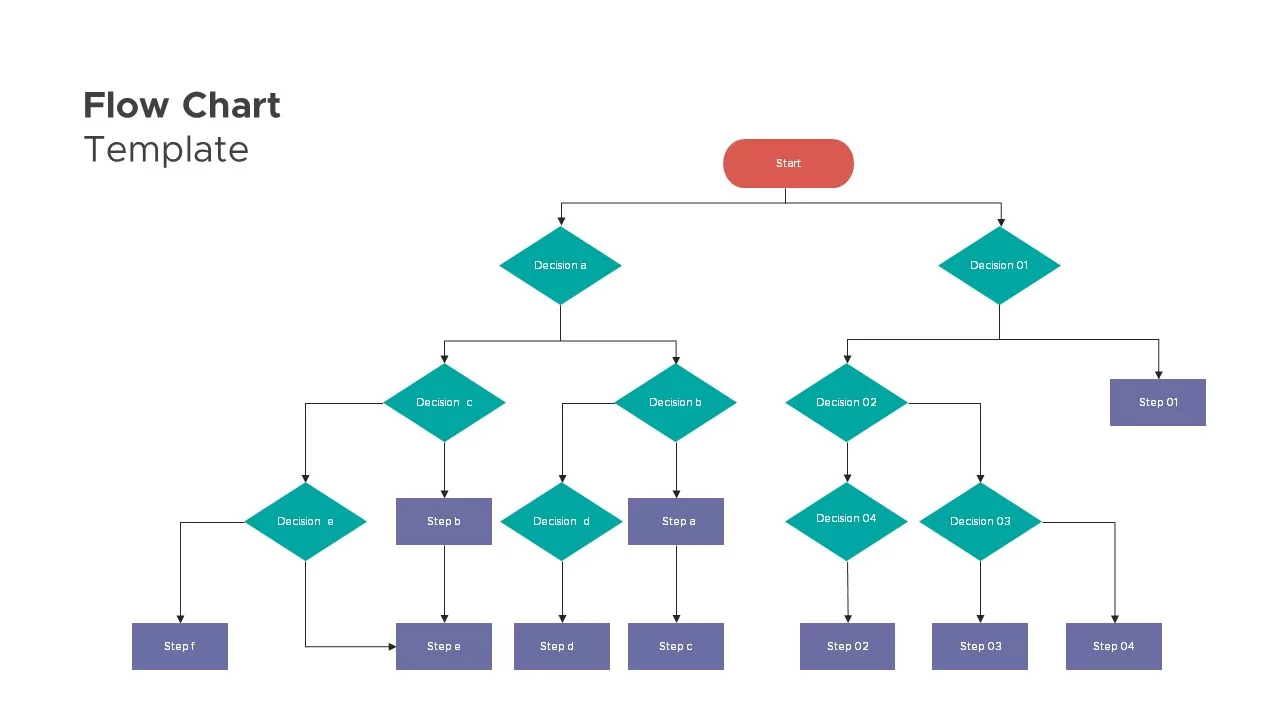
Flow Chart Decision Tree Template for PowerPoint & Google Slides
Flow Charts
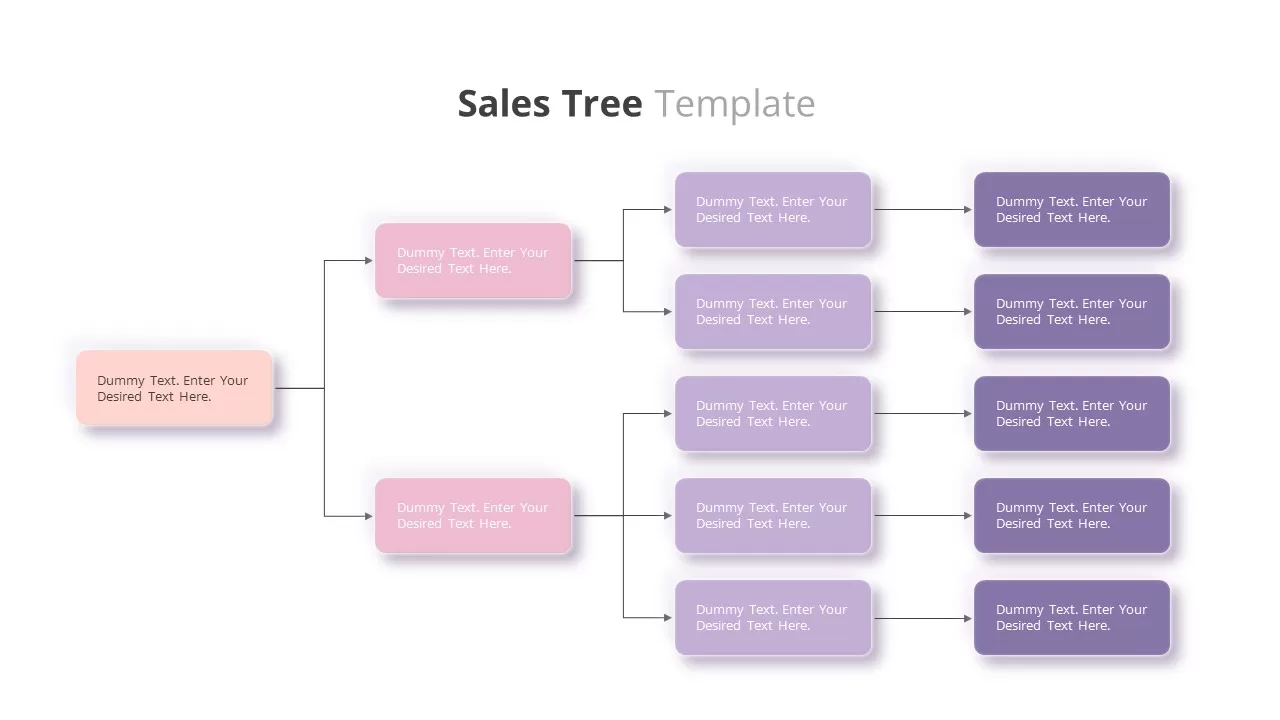
Customizable Sales Tree Diagram Template for PowerPoint & Google Slides
Org Chart
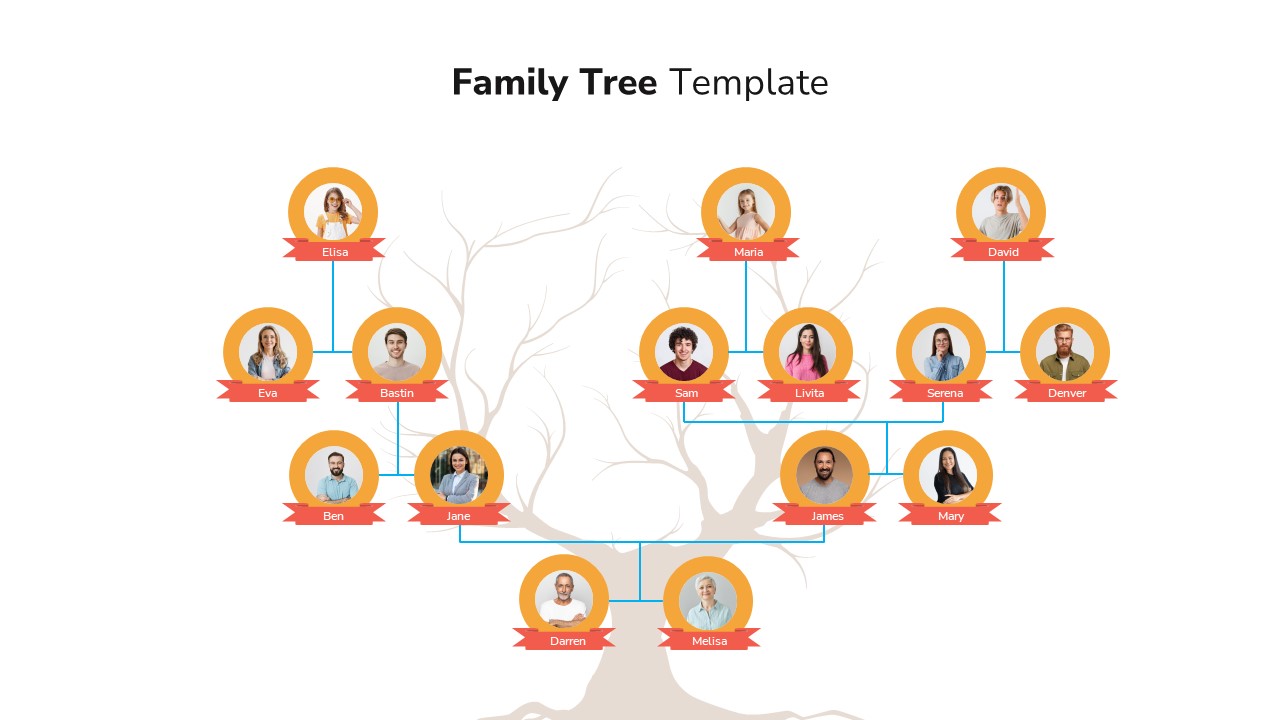
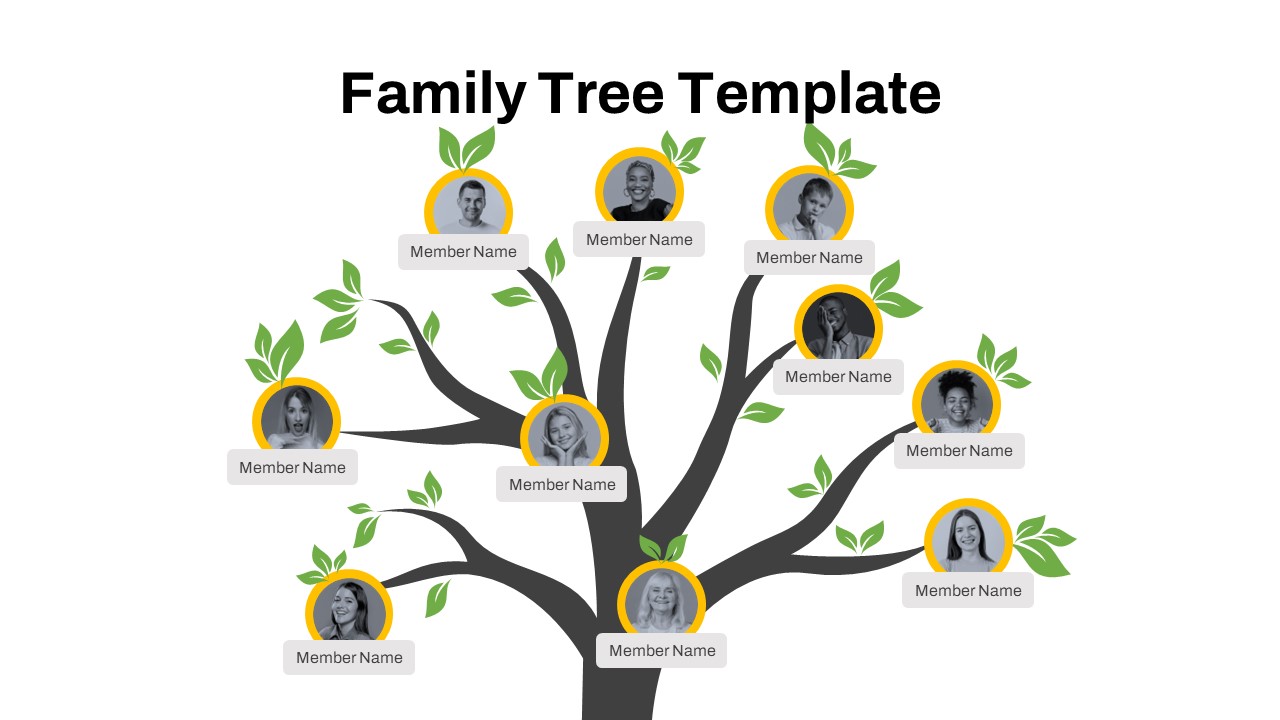
Classic Family Tree Diagram Layout Template for PowerPoint & Google Slides
Infographics
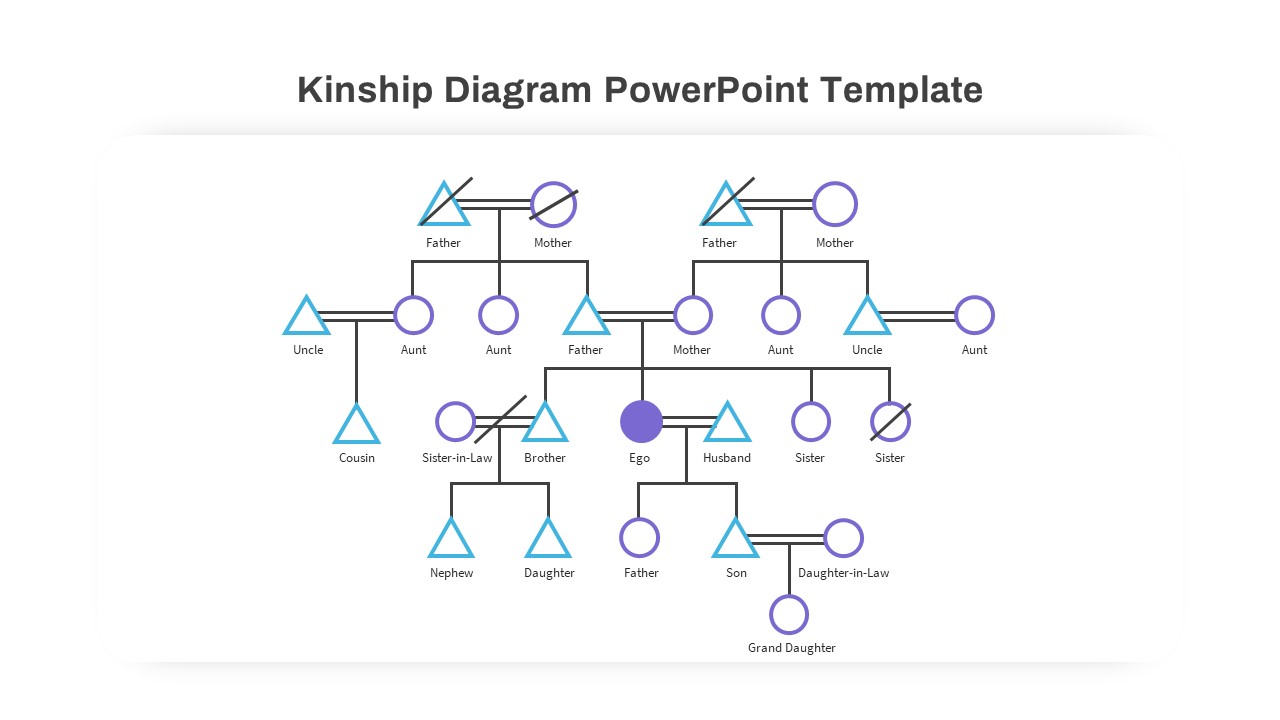
Elegant Kinship Diagram Family Tree Template for PowerPoint & Google Slides
Org Chart
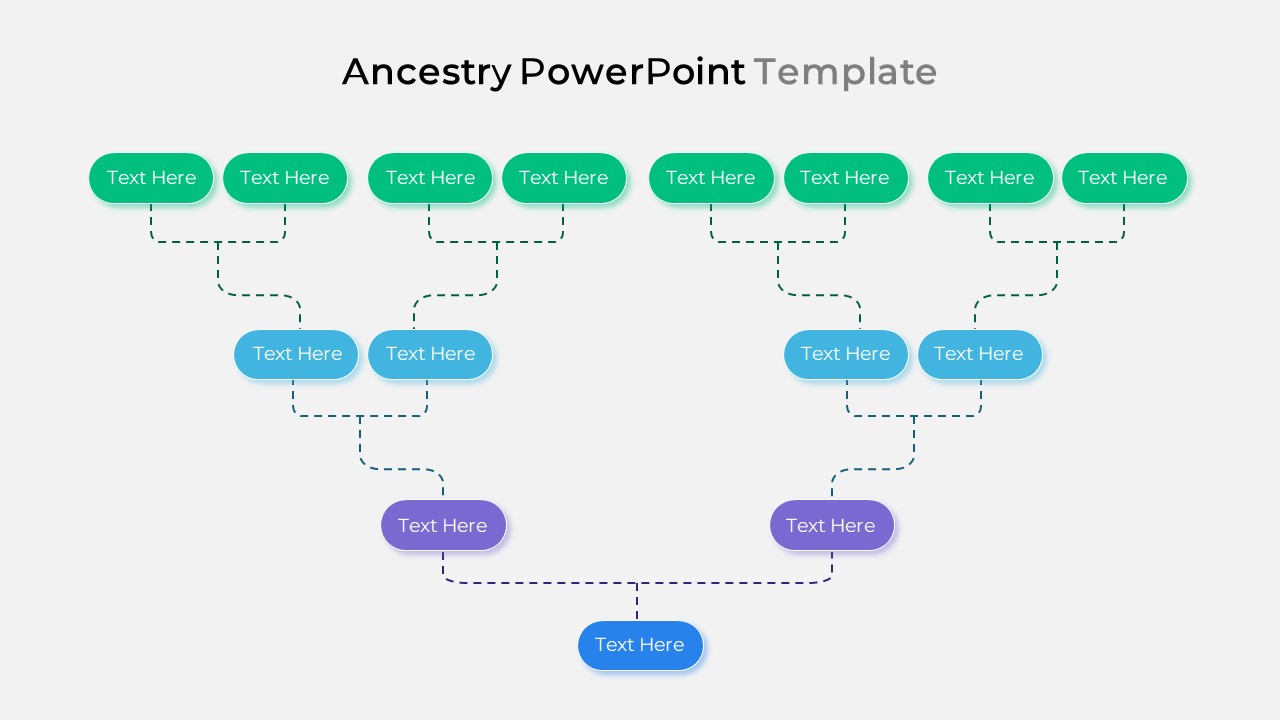
Smart Ancestry Diagram Family Tree Template for PowerPoint & Google Slides
Org Chart
Free Editable Family Tree Genealogy Diagram Template for PowerPoint & Google Slides
Org Chart
Free
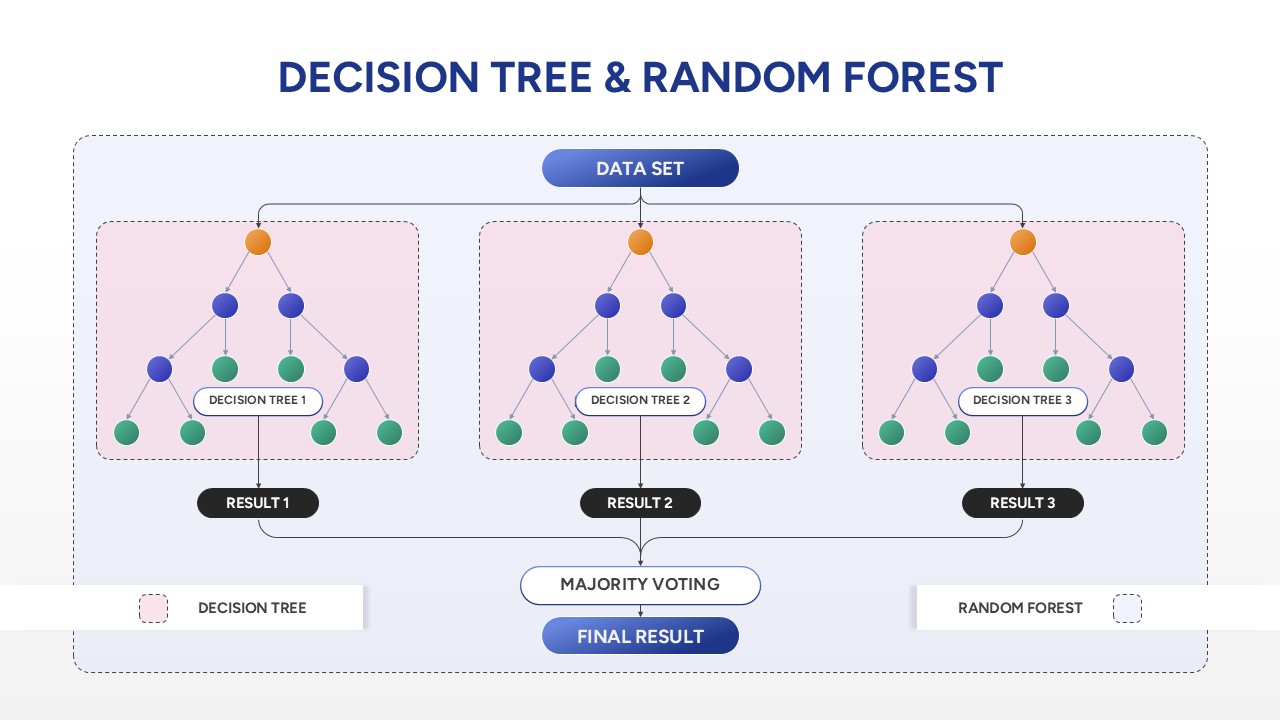
Decision Tree & Random Forest template for PowerPoint & Google Slides
Technology
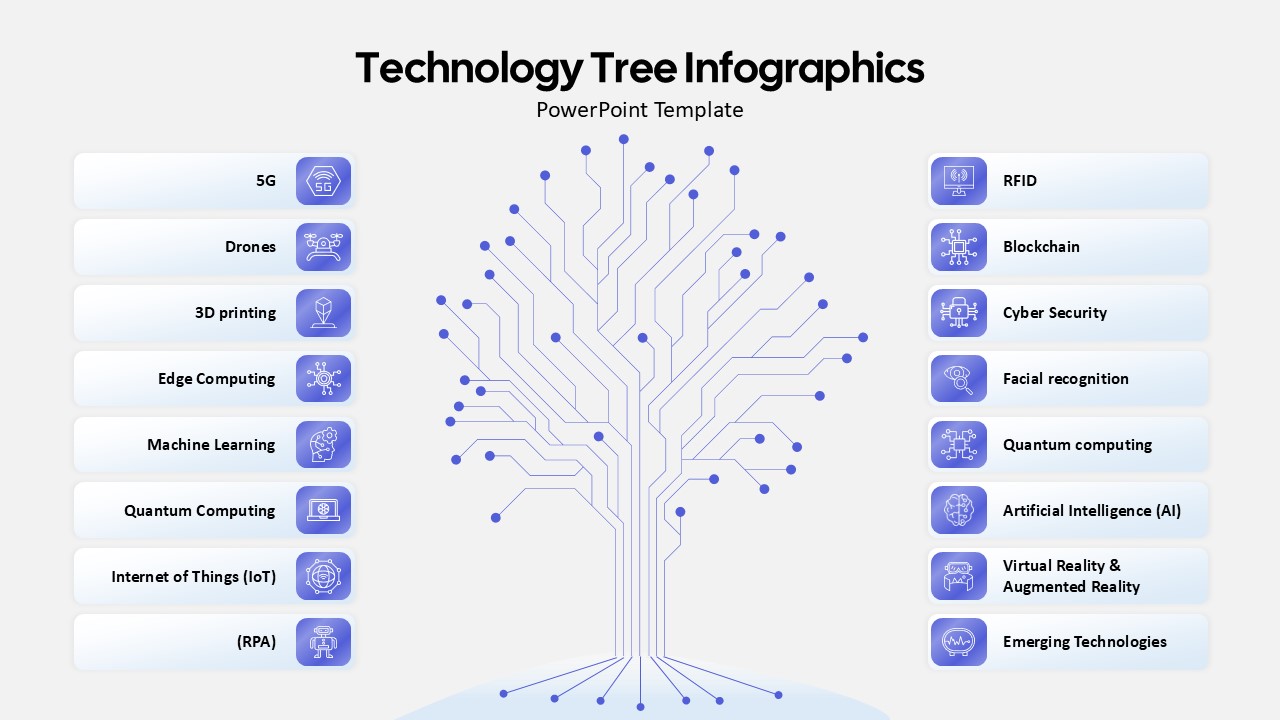
Technology Tree Infographics Template for PowerPoint & Google Slides
AI
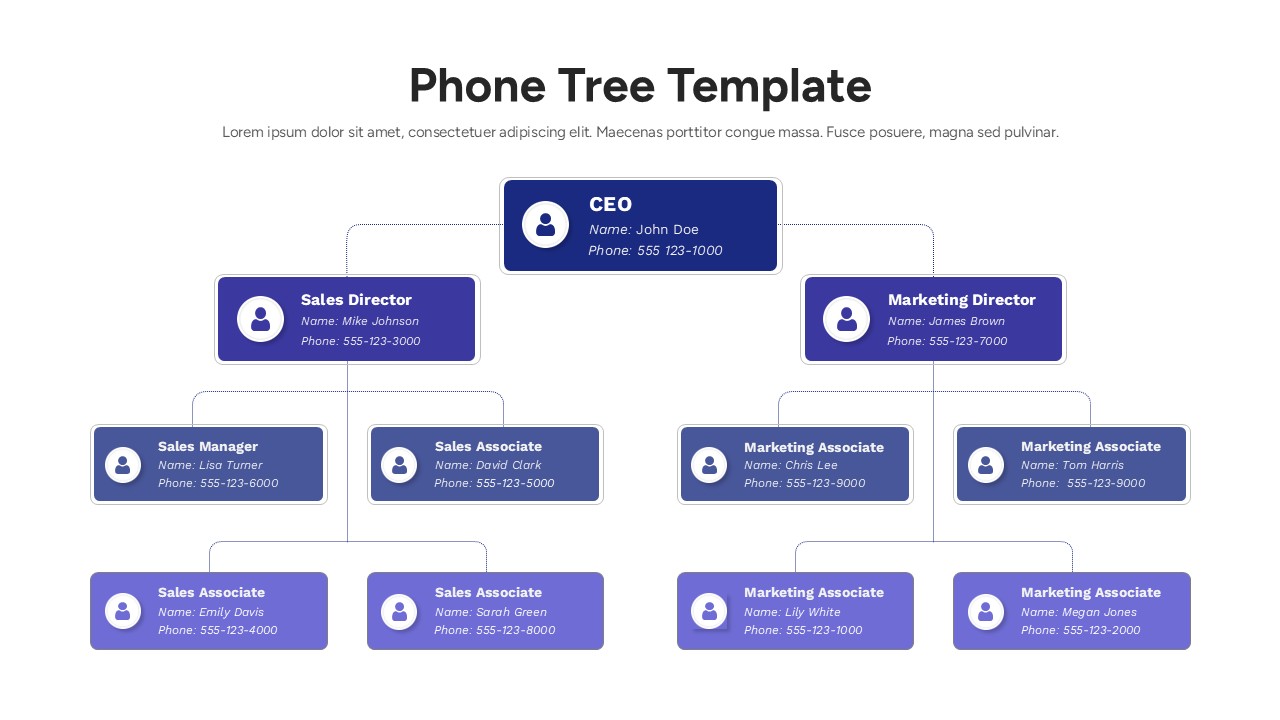
Corporate Phone Tree Hierarchy Template for PowerPoint & Google Slides
Org Chart
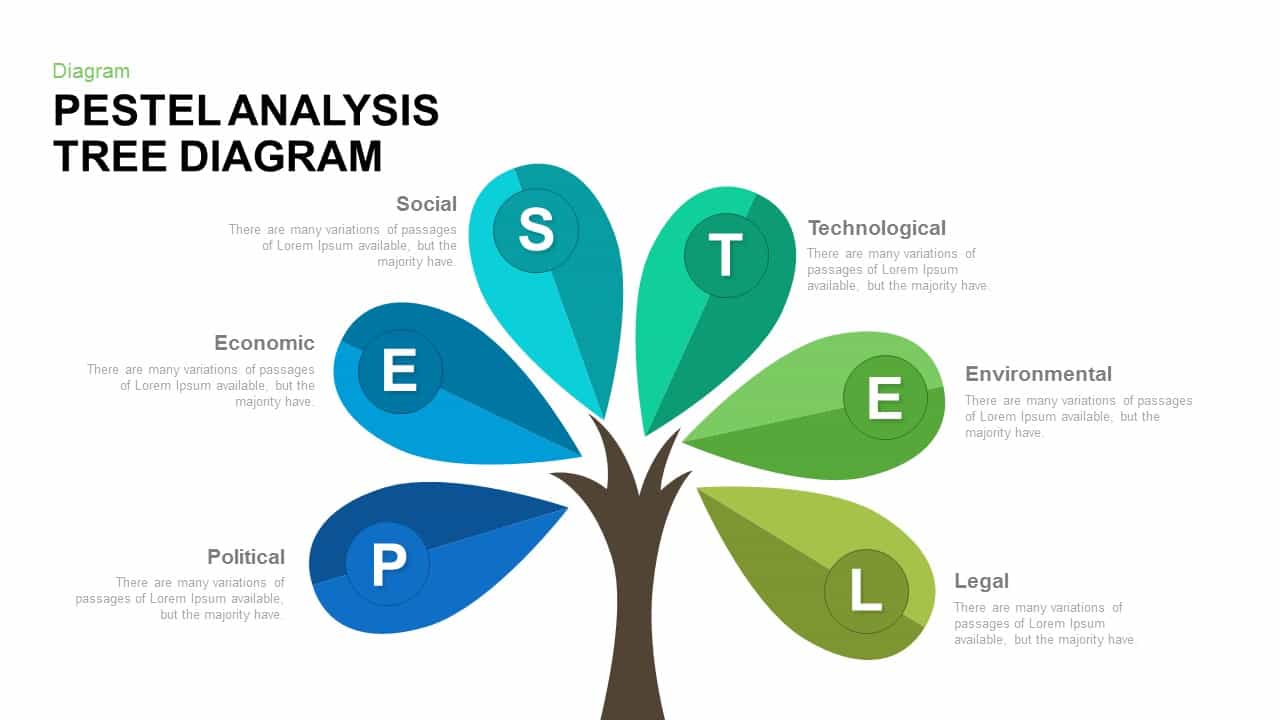
PESTEL Analysis Tree Diagram for PowerPoint & Google Slides
Process
Free Colorful Tree Diagram for Growth & Strategy in PowerPoint & Google Slides
Infographics
Free
Google Ads Optimization & Performance Infographic Template for PowerPoint & Google Slides
Digital Marketing
SQ3R Study Strategy Infographic Slides Template for PowerPoint & Google Slides
Business Strategy
Six Double Diamond Infographic Slides Template for PowerPoint & Google Slides
Process

Sales Process Infographic Slides Pack Template for PowerPoint & Google Slides
Process
Casino/Poker Chips Infographic Slides template for PowerPoint & Google Slides
Business Strategy
Agenda Infographic Pack of 2 Slides Template for PowerPoint & Google Slides
Agenda
Quad Chart Infographic Pack of 8 Slides Template for PowerPoint & Google Slides
Comparison Chart
Four Options Infographic Slides Template for PowerPoint & Google Slides
Comparison
Game Plan Infographic Slides Pack Template for PowerPoint & Google Slides
Infographics
Teamwork PowerPoint Infographic Template for PowerPoint & Google Slides
Leadership
Kite Infographic PowerPoint Template for PowerPoint & Google Slides
Process
Cladogram Infographic Di Template for PowerPoint & Google Slides Template
Decision Tree
Workflow PowerPoint Process infographic for PowerPoint & Google Slides
Process
Free Infographic Deck PowerPoint Pack for PowerPoint & Google Slides
Infographics
Free
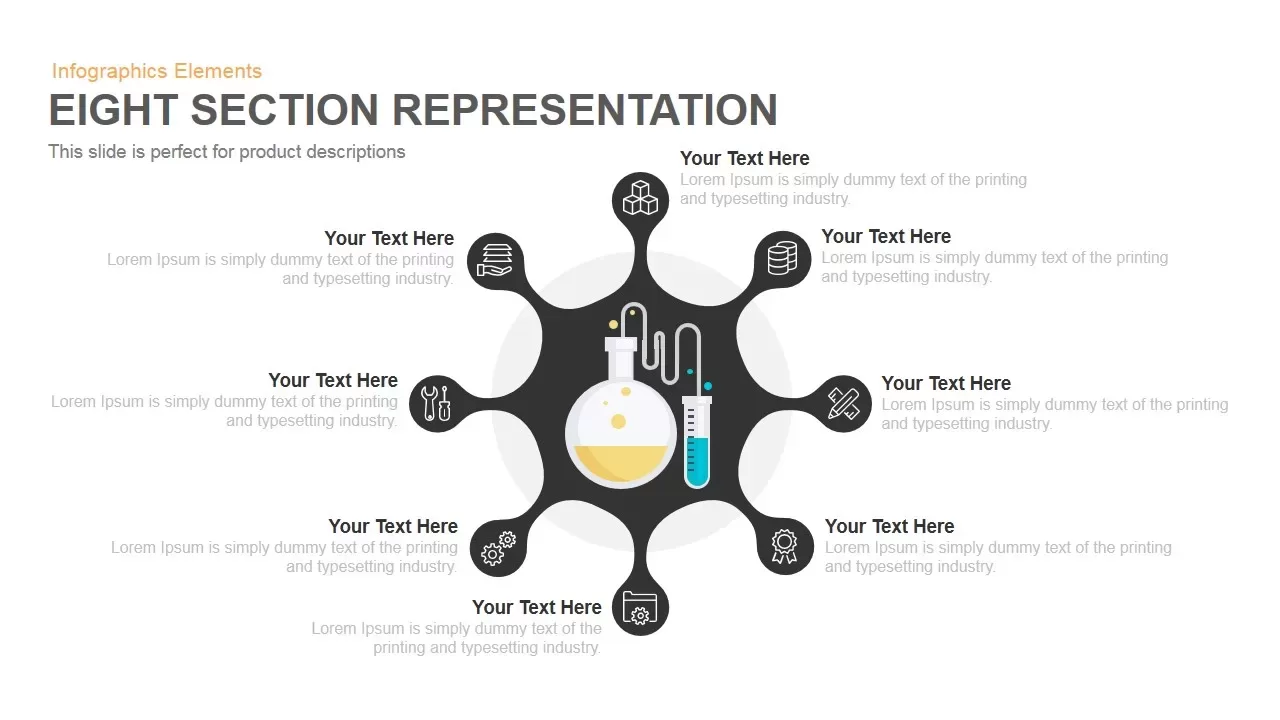
Eight Section Lab Infographic with Icons Template for PowerPoint & Google Slides
Circular
Six Section Circular Infographic Diagram Template for PowerPoint & Google Slides
Circular
Curved Five-Section Timeline Infographic template for PowerPoint & Google Slides
Timeline

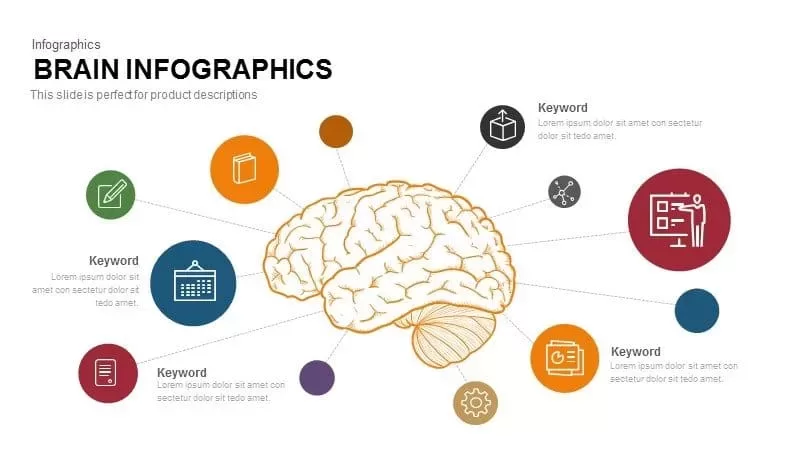
Brain Hub-and-Spoke Infographic template for PowerPoint & Google Slides
Org Chart
Arrow Infographic Template for PowerPoint & Google Slides
Arrow
Cause and Effect Diagram Infographic Template for PowerPoint & Google Slides
Bar/Column

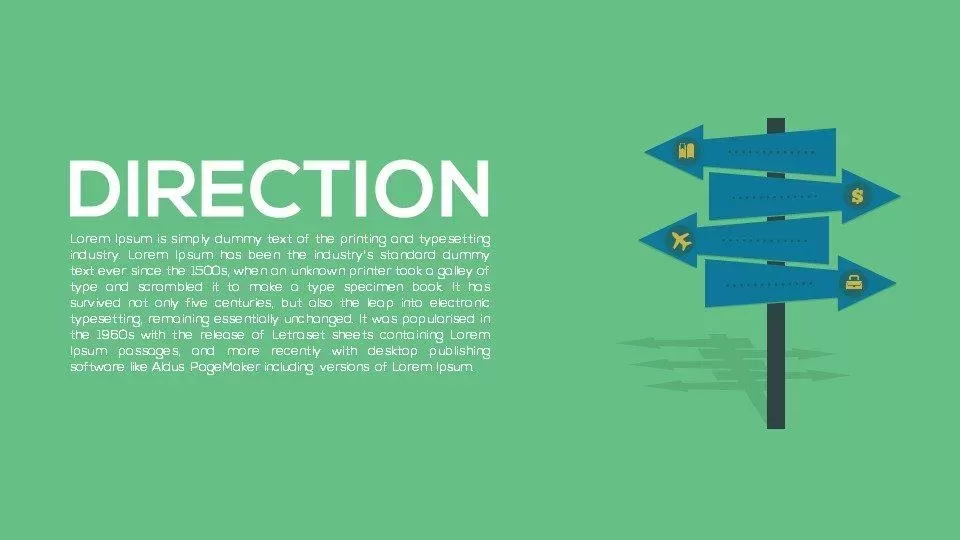
Direction Signpost Infographic Template for PowerPoint & Google Slides
Arrow
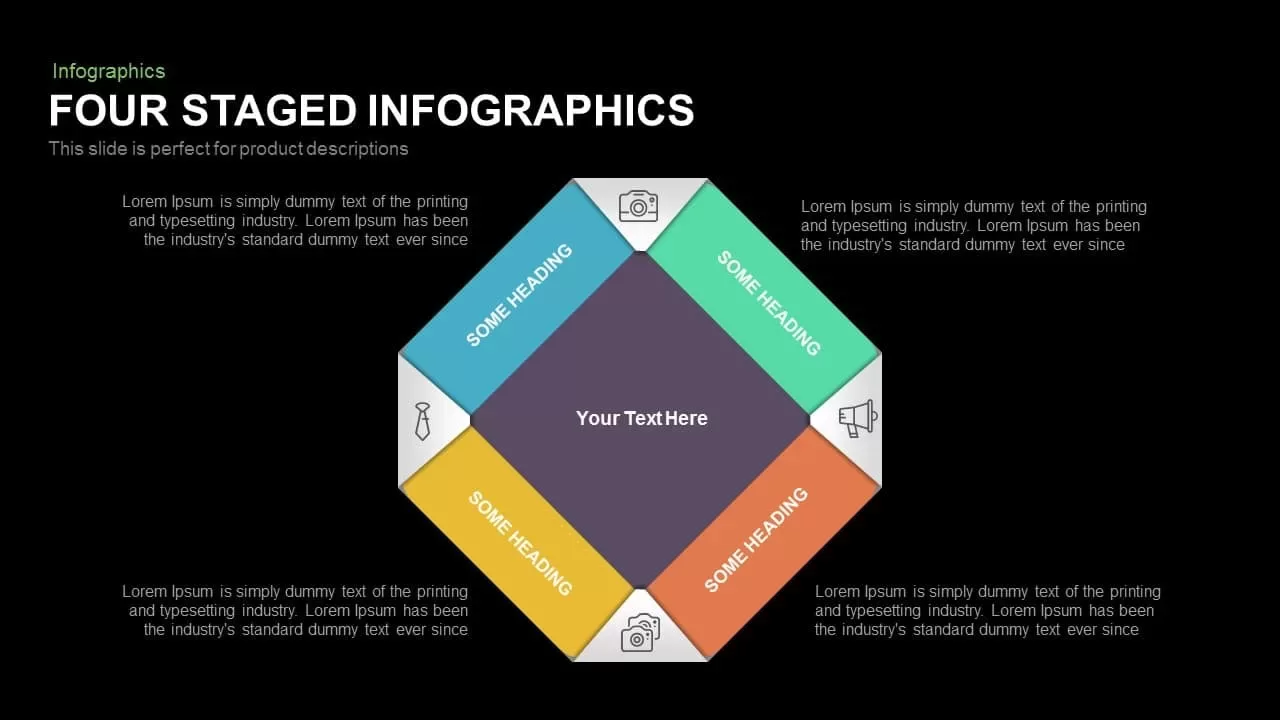
Colorful Four-Stage Infographic Process Template for PowerPoint & Google Slides
Process
Six-Stage Hexagon Timeline Infographic Template for PowerPoint & Google Slides
Timeline
Eight-Step Circular Diagram Infographic Template for PowerPoint & Google Slides
Circular
Comparison Pricing Table Infographic Template for PowerPoint & Google Slides
Comparison Chart
Multi-Year Timeline Infographic Template for PowerPoint & Google Slides
Timeline
Teamwork Key Infographic Slide Template for PowerPoint & Google Slides
Process
Globe Infographic Template for PowerPoint & Google Slides
Process
Vertical Stacked Process Infographic Template for PowerPoint & Google Slides
Process
Business Growth Infographic Metaphor Template for PowerPoint & Google Slides
Revenue
Diverging Globe Arrows Infographic Template for PowerPoint & Google Slides
Arrow
Six-Circle Process Infographic Diagram Template for PowerPoint & Google Slides
Circular
3D Layered Infographic Diagram Template for PowerPoint & Google Slides
Infographics
Infinity Loop Infographic template for PowerPoint & Google Slides
Process

Circular CRM Process Infographic Diagram Template for PowerPoint & Google Slides
Circular
Technology Arrow Infographic Template for PowerPoint & Google Slides
Pitch Deck
Circular Arrows Infographic Template for PowerPoint & Google Slides
Business
Pill-Style 30-60-90 Timeline Infographic Template for PowerPoint & Google Slides
Timeline
Tri-Cluster Mind Map Infographic Template for PowerPoint & Google Slides
Mind Maps
Go No Go Decision Infographic Template for PowerPoint & Google Slides
Comparison
Project Update & Timeline Infographic Template for PowerPoint & Google Slides
Business
5-Day Calendar Event Infographic Template for PowerPoint & Google Slides
Agenda
Free Multi-Year Arrow Timeline Infographic Template for PowerPoint & Google Slides
Timeline
Free
Timeline Infographic Steps template for PowerPoint & Google Slides
Business Plan
Six-Step Table of Contents Infographic Template for PowerPoint & Google Slides
Agenda
Isometric Block Steps Infographic Template for PowerPoint & Google Slides
Process
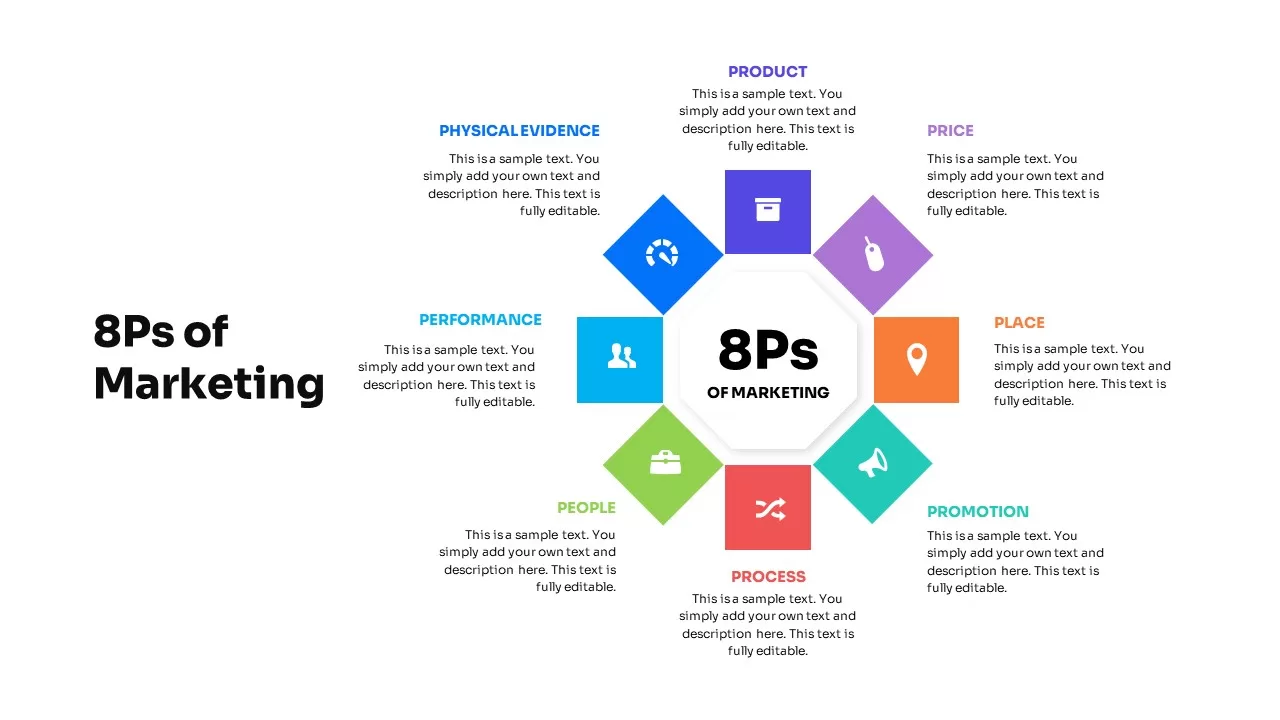
8Ps of Marketing Strategy Infographic Template for PowerPoint & Google Slides
Marketing
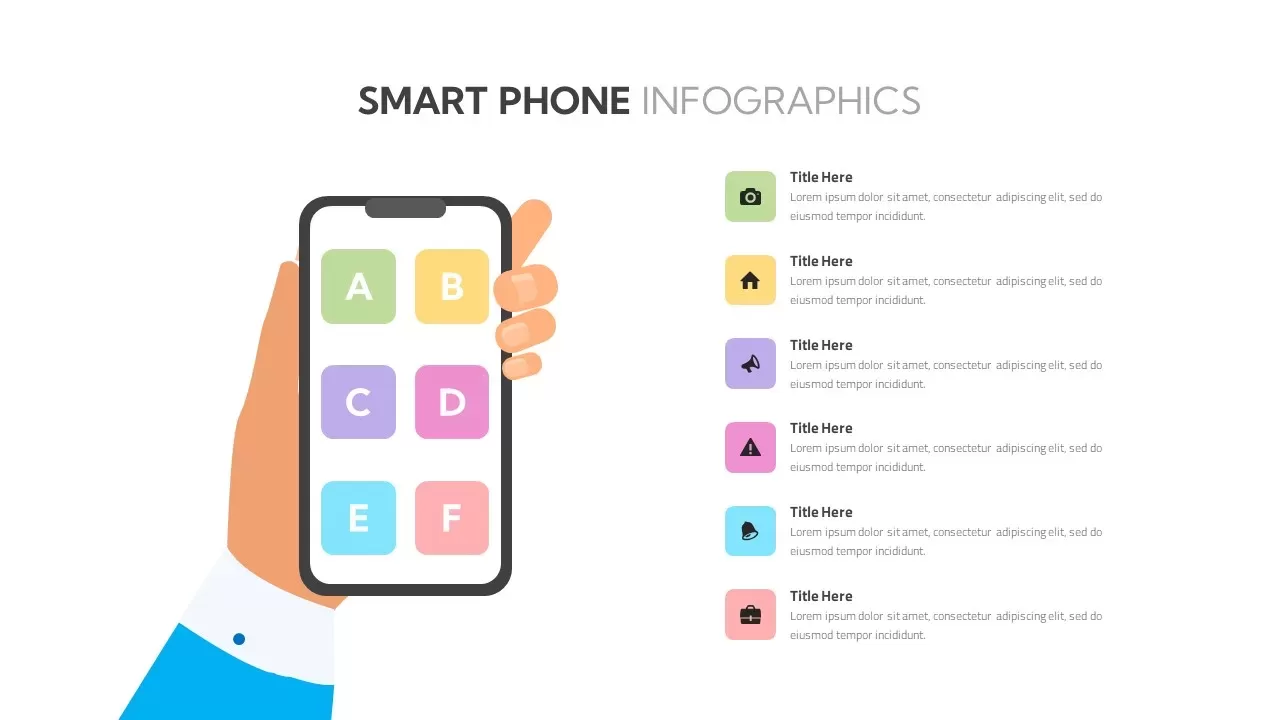
Smartphone Infographic Diagram Template for PowerPoint & Google Slides
Comparison
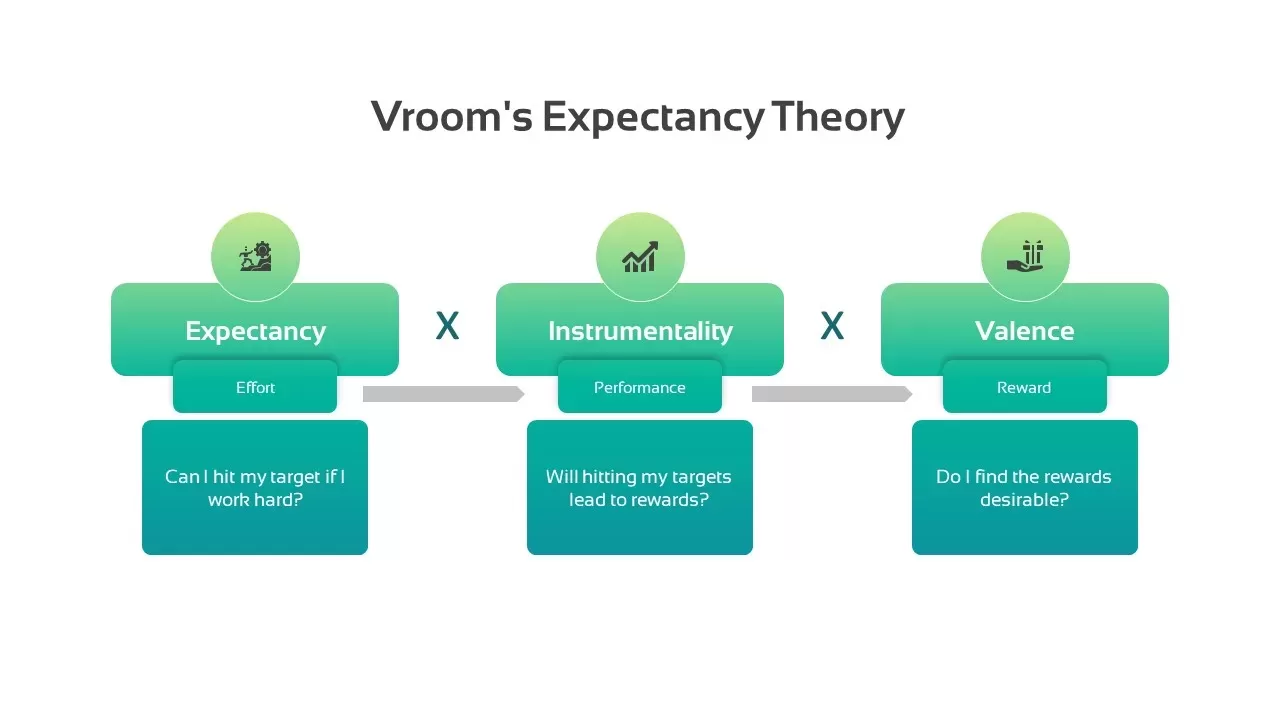
Vroom’s Expectancy Theory Infographic Template for PowerPoint & Google Slides
Process
Animated Key Takeaway Spoke Infographic Template for PowerPoint & Google Slides
Infographics
Competitive Battle Card Infographic Pack Template for PowerPoint & Google Slides
Competitor Analysis
Mastodon Metrics Infographic Dashboard Template for PowerPoint & Google Slides
Business Report
Colorful Agile Timeline Infographic Template for PowerPoint & Google Slides
Timeline
Free
Triangle Infographic Slide Collection Template for PowerPoint & Google Slides
Decks
Quarterly Timeline Infographic Template for PowerPoint & Google Slides
Timeline
Fishbone Timeline Infographic Series Template for PowerPoint & Google Slides
Manufacturing
Free Multi-Step Funnel Infographic Slide Pack Template for PowerPoint & Google Slides
Funnel
Free
Curved Roadmap Infographic Vision Journey Template for PowerPoint & Google Slides
Business Strategy
Versatile 6 Options Infographic Layout Template for PowerPoint & Google Slides
Process
Vision & Strategy Infographic Pack Template for PowerPoint & Google Slides
Vision and Mission
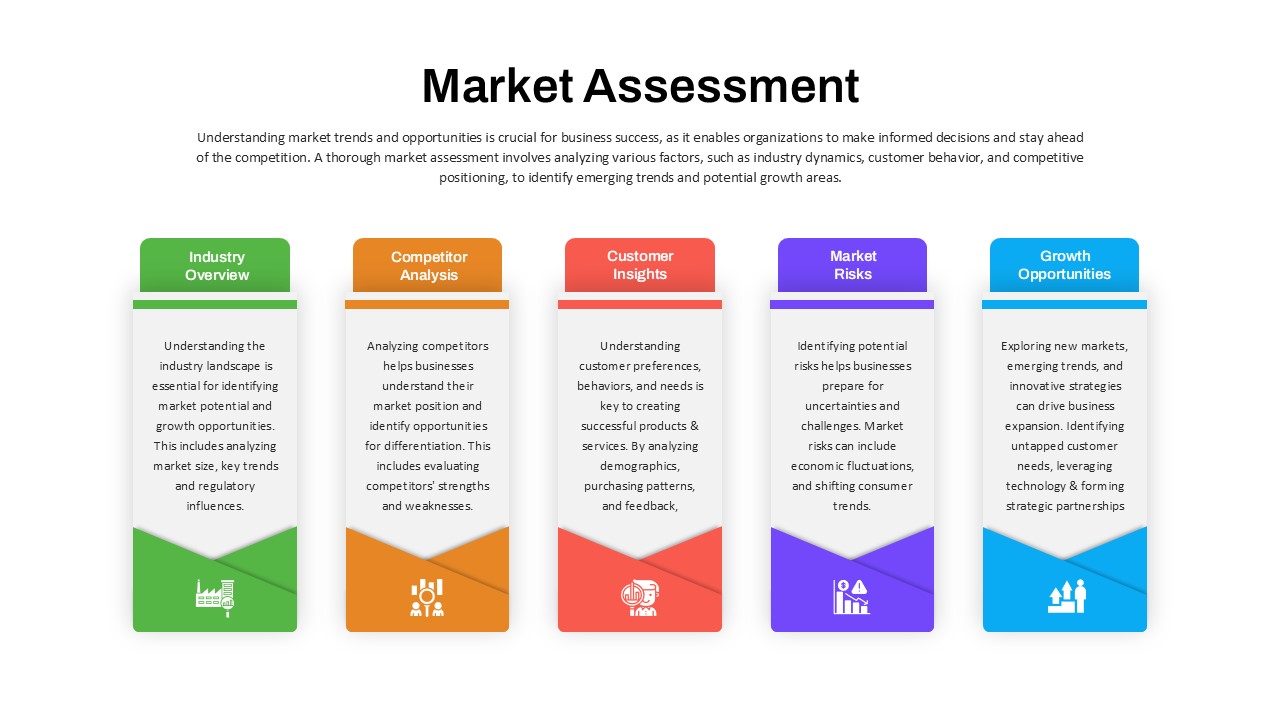
Market Assessment Infographic Slide Template for PowerPoint & Google Slides
Process
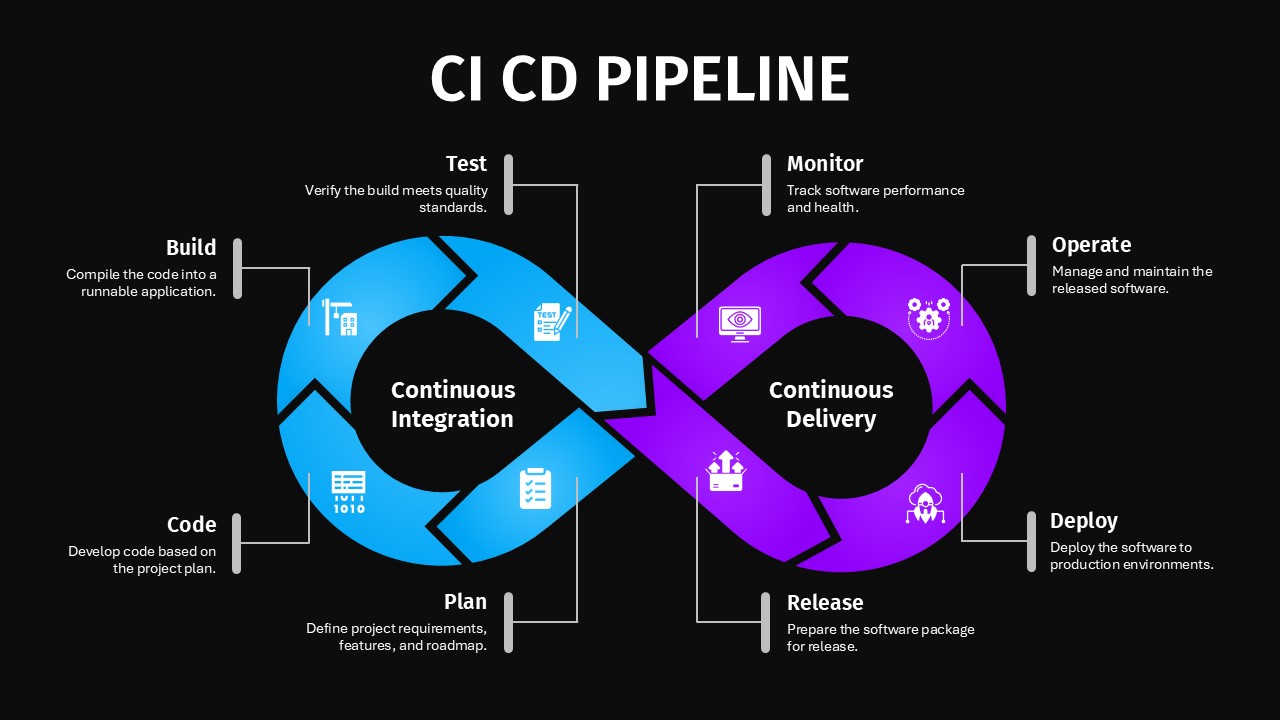
CI/CD Pipeline Infographic Template for PowerPoint & Google Slides
Flow Charts
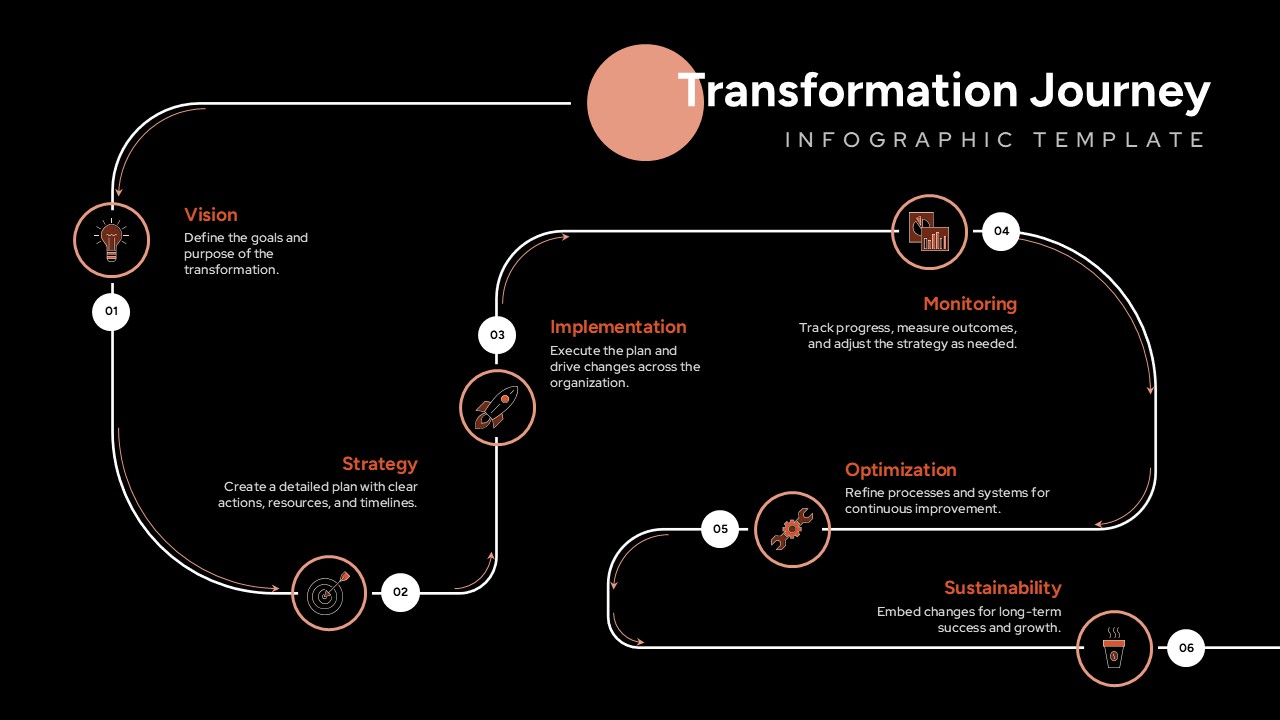
Transformation Journey Infographic Template for PowerPoint & Google Slides
Process
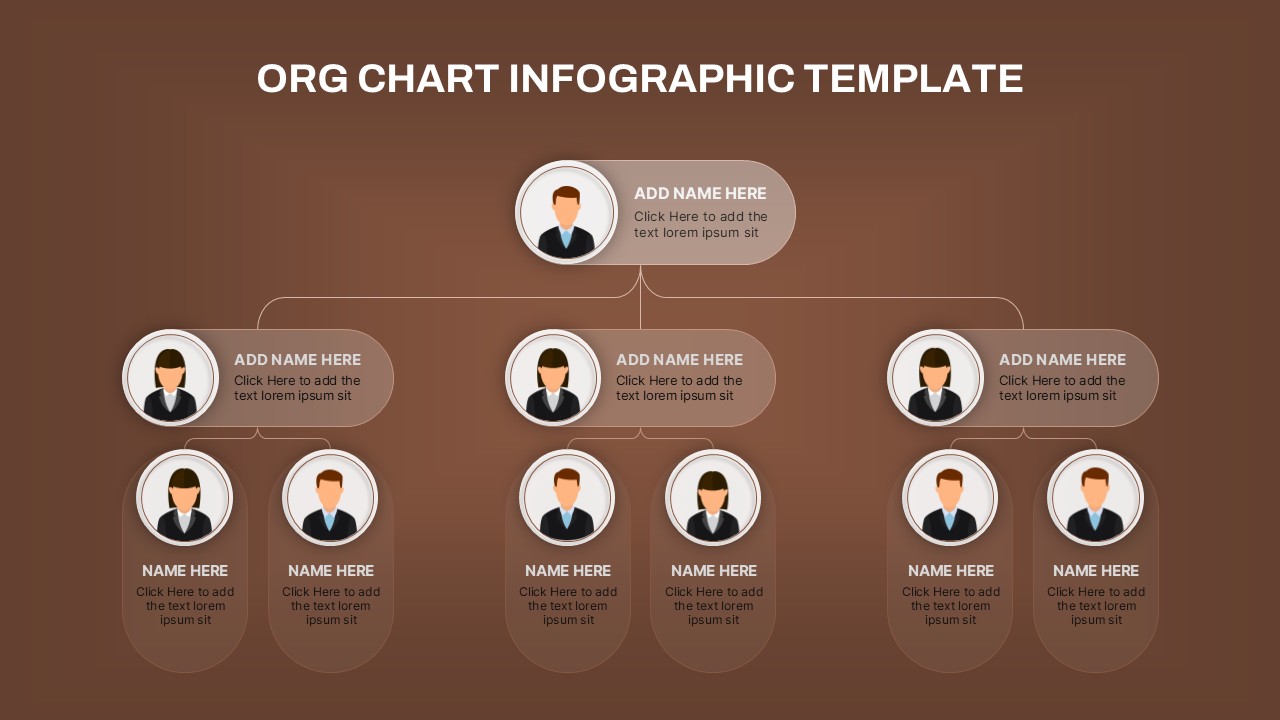
Hierarchical Org Chart Infographic Template for PowerPoint & Google Slides
Org Chart
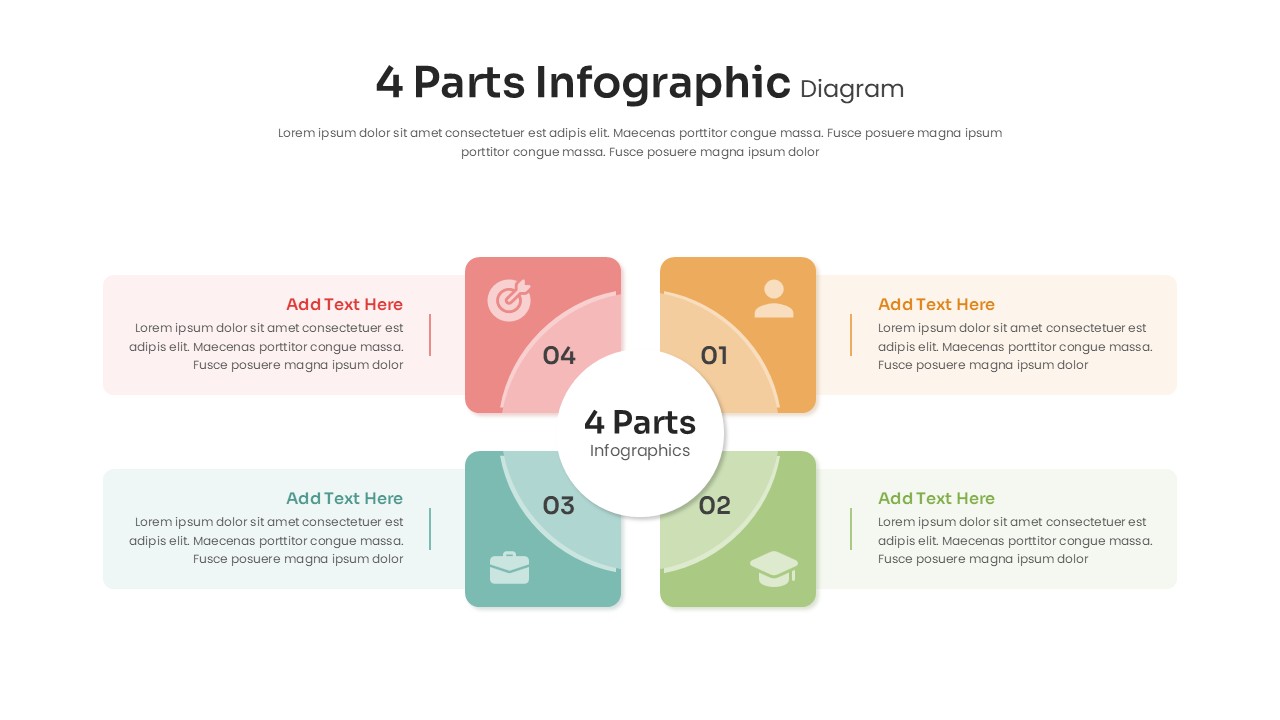
4 Parts Infographic Diagram Template for PowerPoint & Google Slides
Process
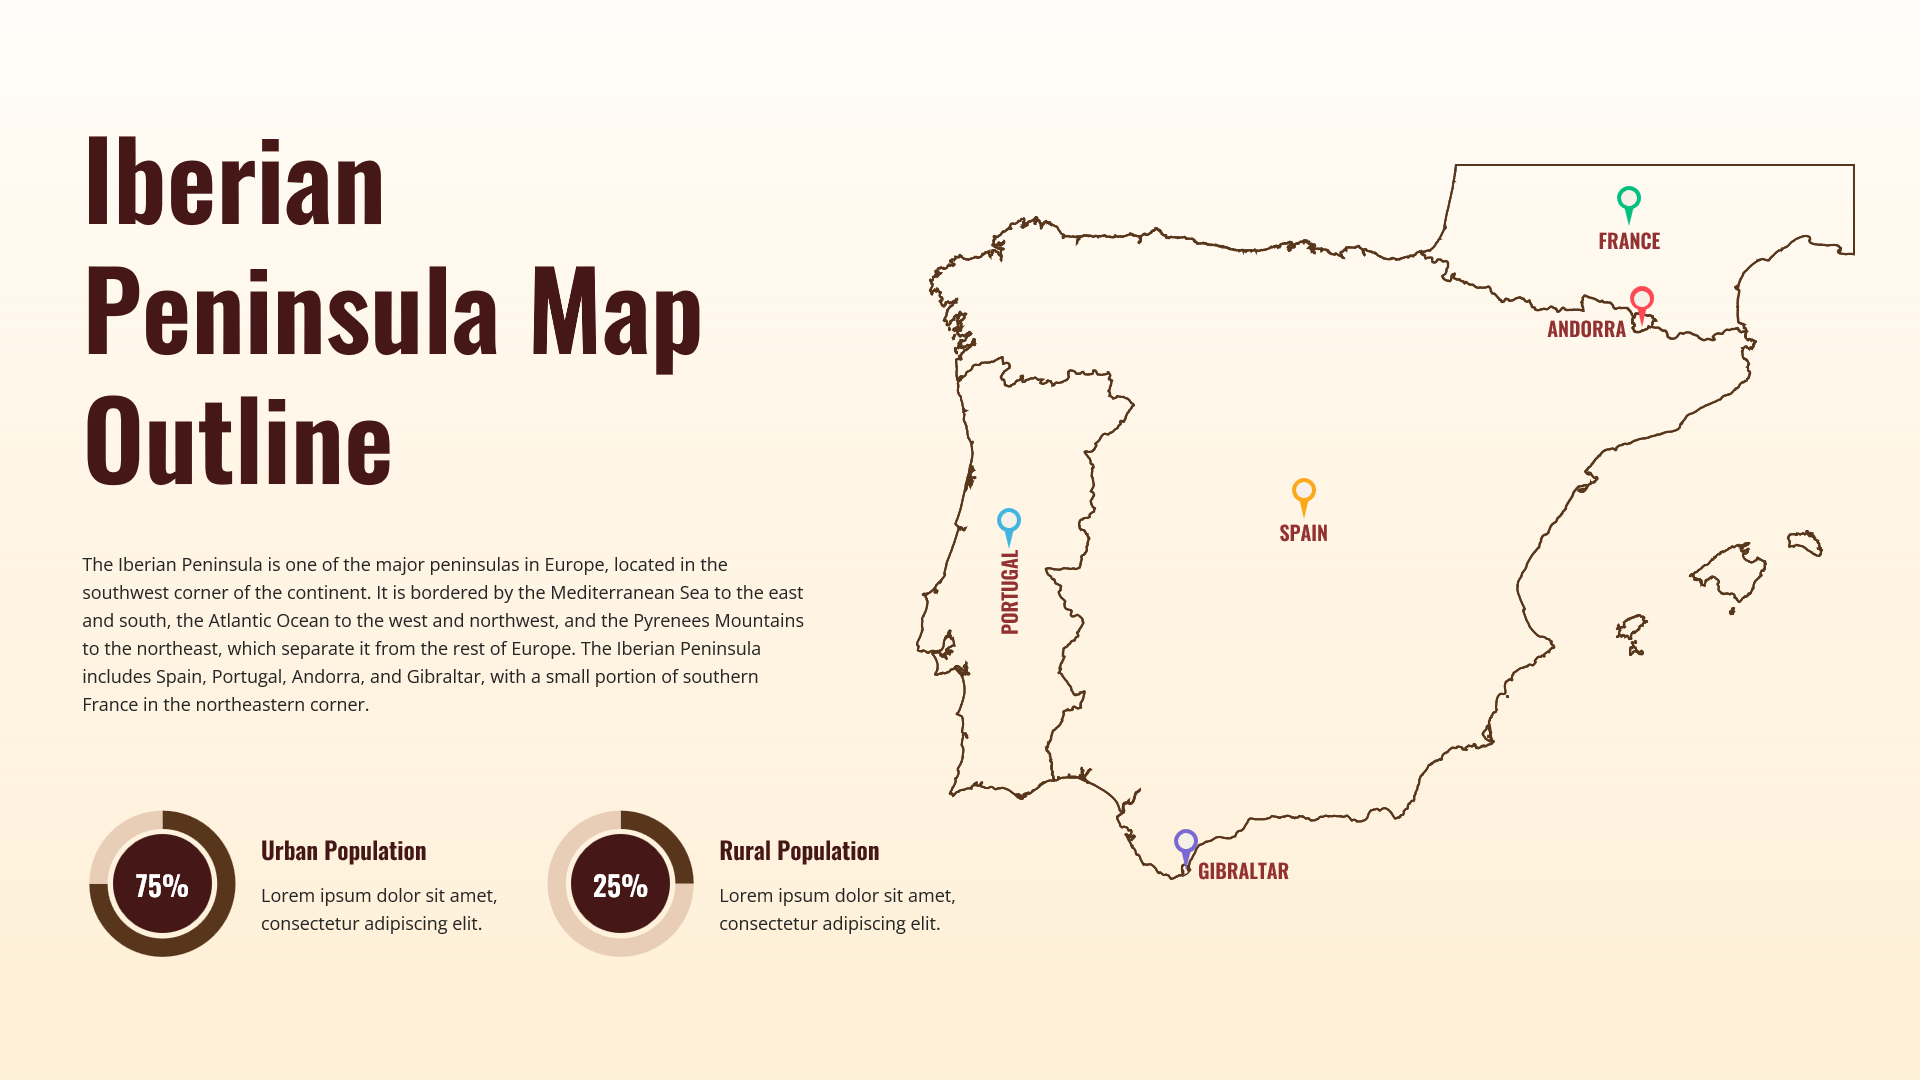
Iberian Peninsula Map Outline Infographic Template for PowerPoint & Google Slides
World Maps