Comparative Tourism Infographics Template for PowerPoint & Google Slides

Description
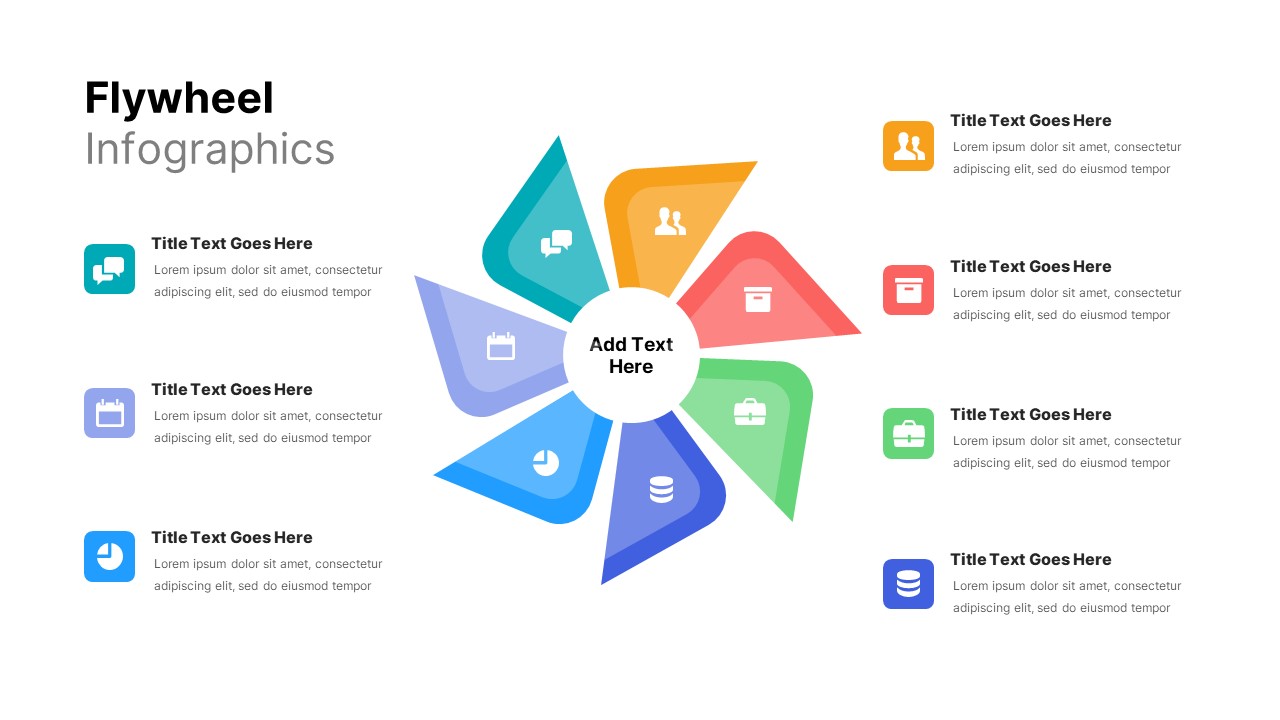
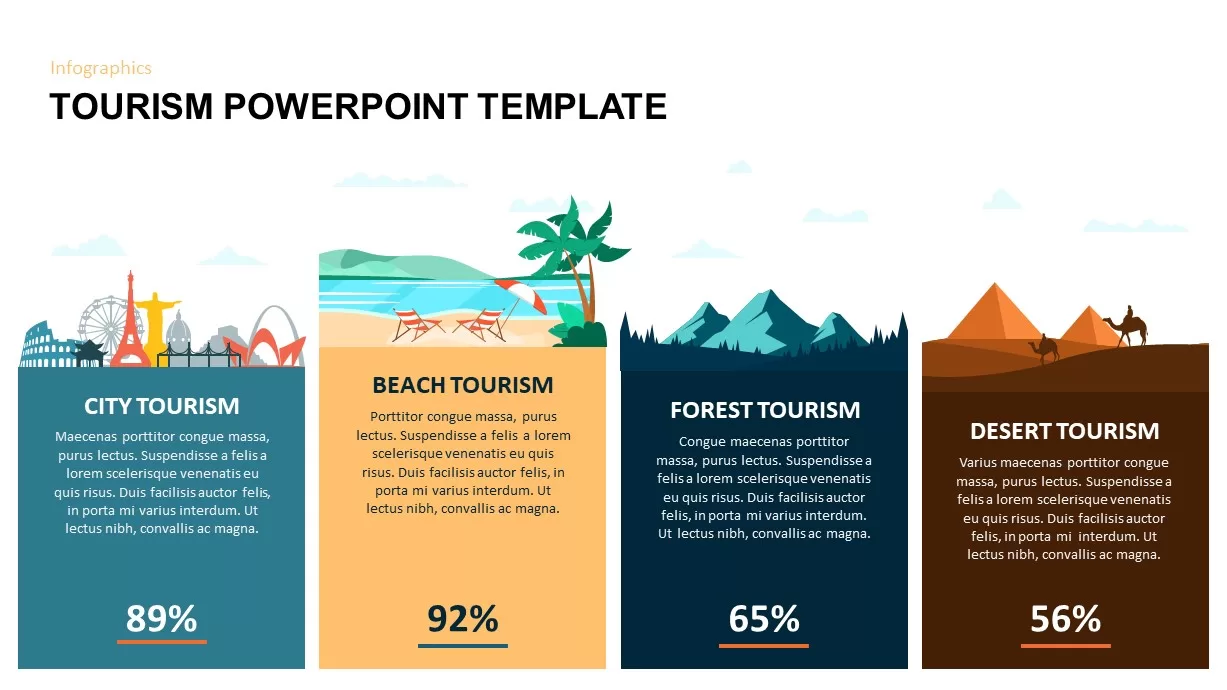
This eight-item central idea diagram template offers a dynamic way to showcase interrelated concepts, phases, or categories around a central theme. The design features eight hexagon-shaped nodes arranged in a radial pattern, each connected by a ring of color-coded arrows to a central circle placeholder. The outer nodes can be labeled with numbers, icons, or short titles to highlight steps or components, while the inner circle serves as a clear anchor for your core message. Using a balanced palette of orange, yellow, green, cyan, blue, deep blue, purple, and magenta, the template maintains visual distinction among items, ensuring that each segment stands out within the overall layout.
Every shape is a high-resolution vector object, so you can resize, recolor, or reposition elements without loss of quality. The template is built on master slides for both PowerPoint and Google Slides, enabling you to update fonts, apply custom color themes, or replace icons with drag-and-drop ease. Snap-to-grid alignment and grouped layers streamline editing, helping you maintain precise spacing and consistent formatting across multiple slides. Whether you need to map out city attractions, beach amenities, forest excursions, or desert excursions, this slide accelerates your workflow by offering pre-defined text placeholders and flexible layout options.
Optimized for seamless collaboration, this infographic preserves formatting integrity during cloud-based editing and across platform versions. Duplicate the diagram to compare successive iterations or illustrate multi-phase progress. You can also layer additional charts or embed images within the nodes for deeper context. With its clean white canvas and vibrant accent colors, the template delivers a polished, professional look suitable for boardroom presentations, marketing pitches, or travel expos. Equip your team with a versatile visual tool that turns complex destination data into an engaging, story-driven narrative.
Who is it for
Travel marketers, tourism boards, tour operators, and hospitality managers who need to compare city, beach, forest, and desert tourism offerings in a clear, engaging visual format.
Other Uses
Repurpose this radial diagram for product comparisons, service portfolios, feature roadmaps, stakeholder mappings, or any scenario requiring eight interconnected categories around a central theme.
Login to download this file

Item ID
SB01766
Related Templates

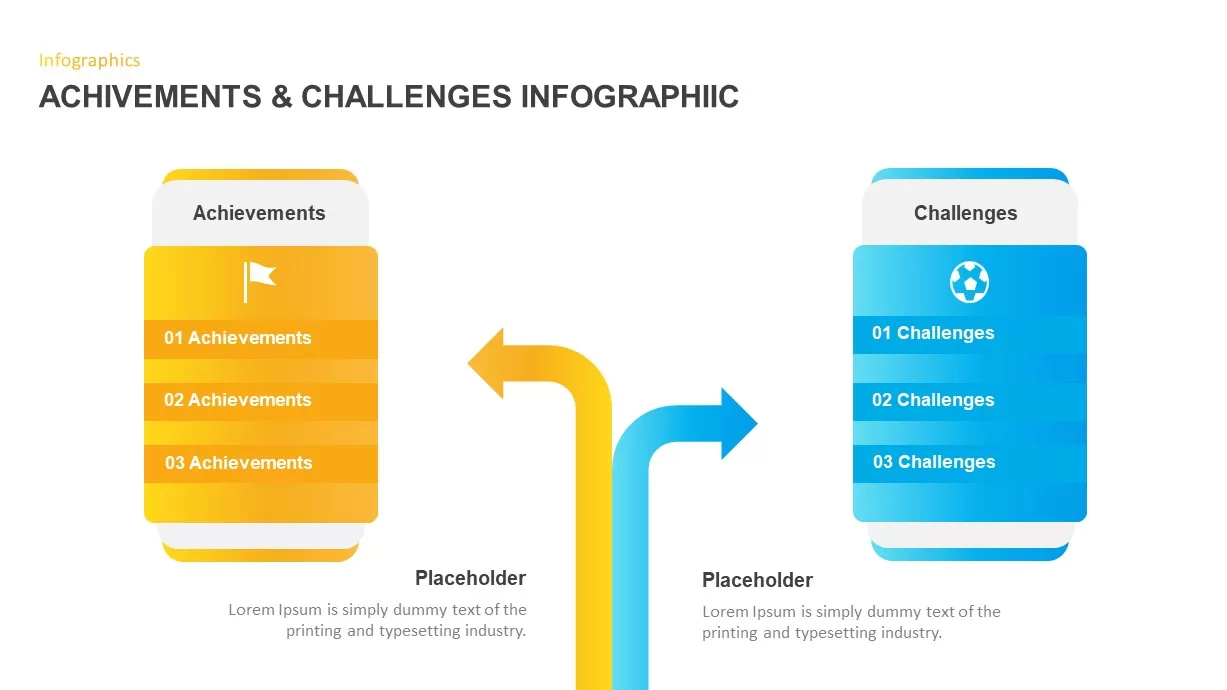
Achievements and Challenges Comparative Infographic Template for PowerPoint & Google Slides
Opportunities Challenges

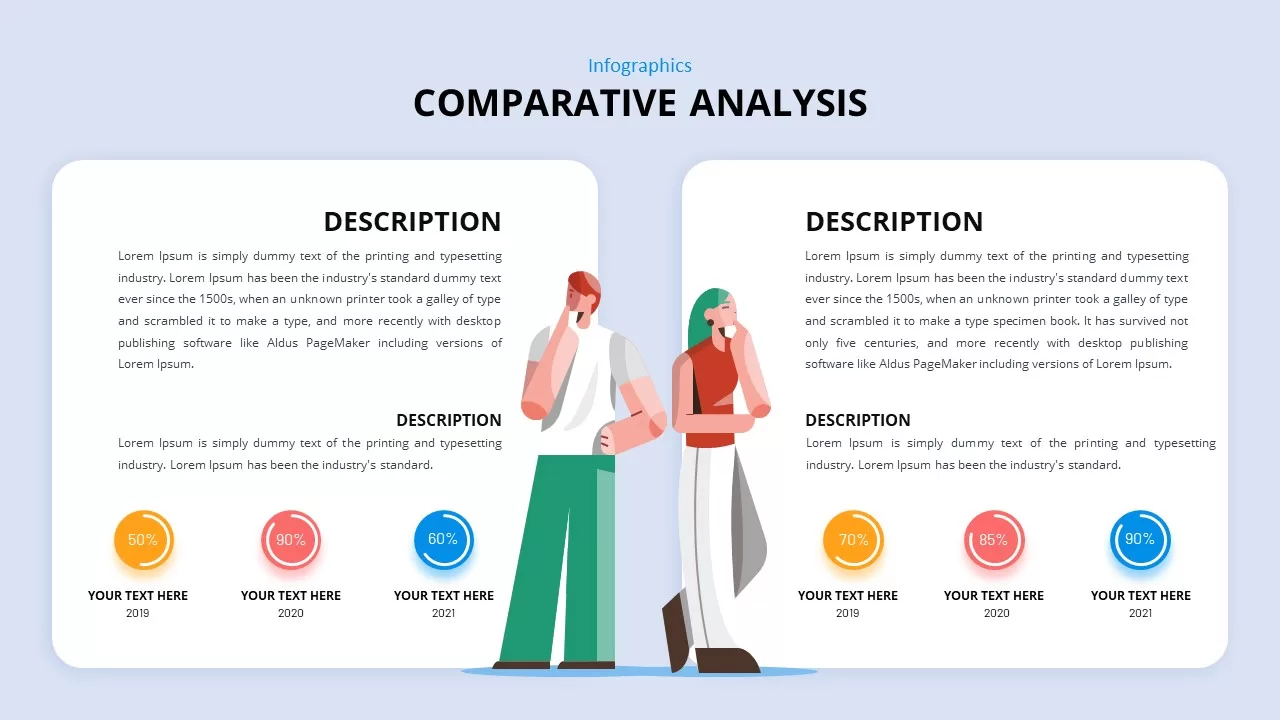
Comparative Analysis Template for PowerPoint & Google Slides
Comparison
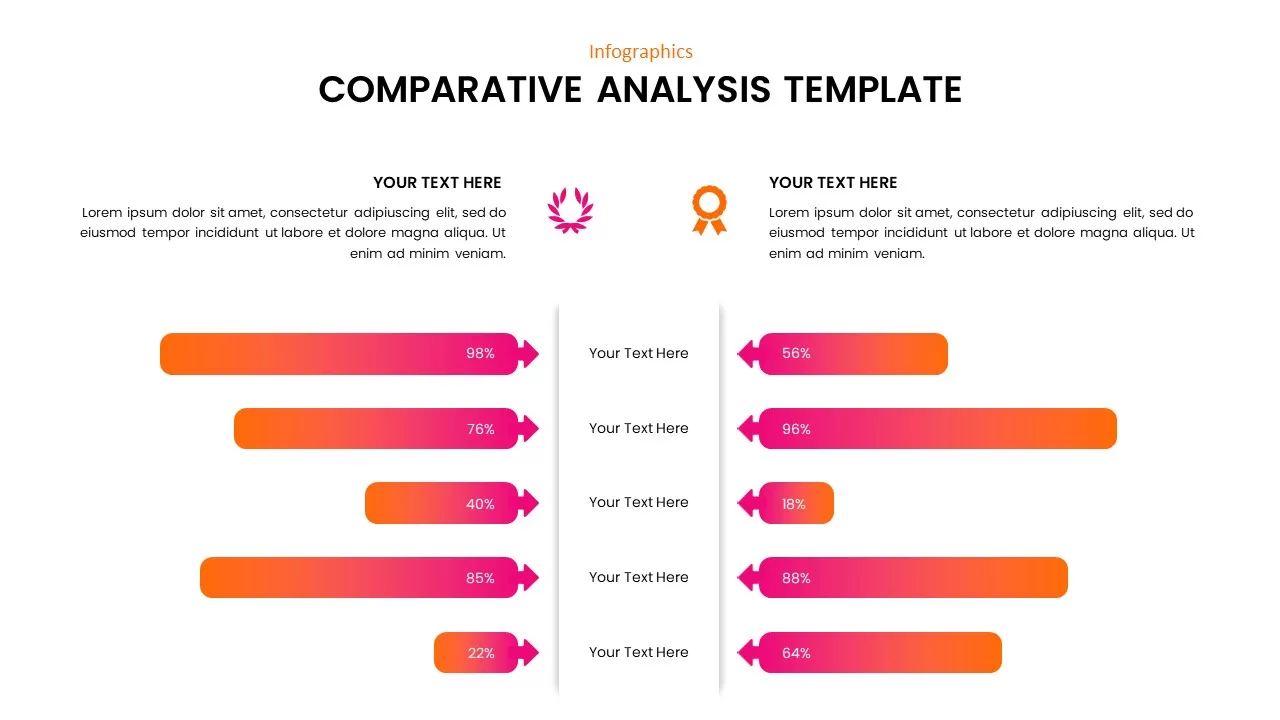
Comparative Analysis template for PowerPoint & Google Slides
Business Report
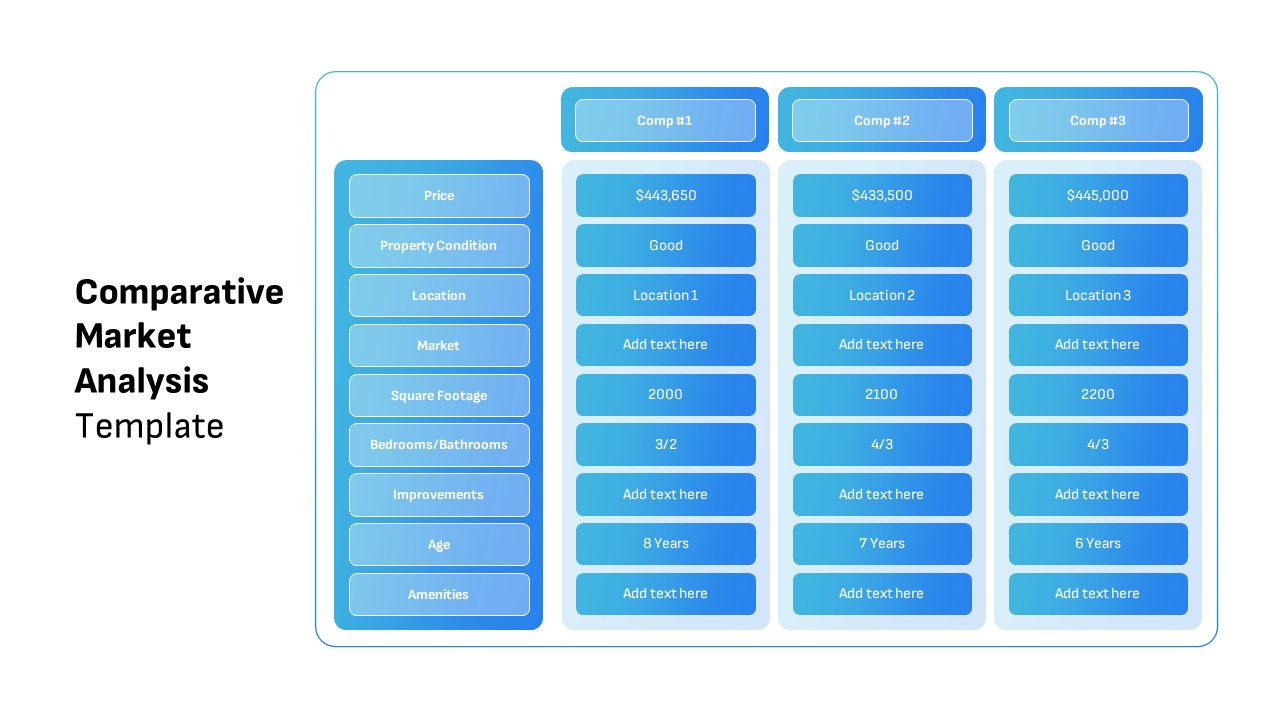
Comparative Market Analysis Template for PowerPoint & Google Slides
Comparison
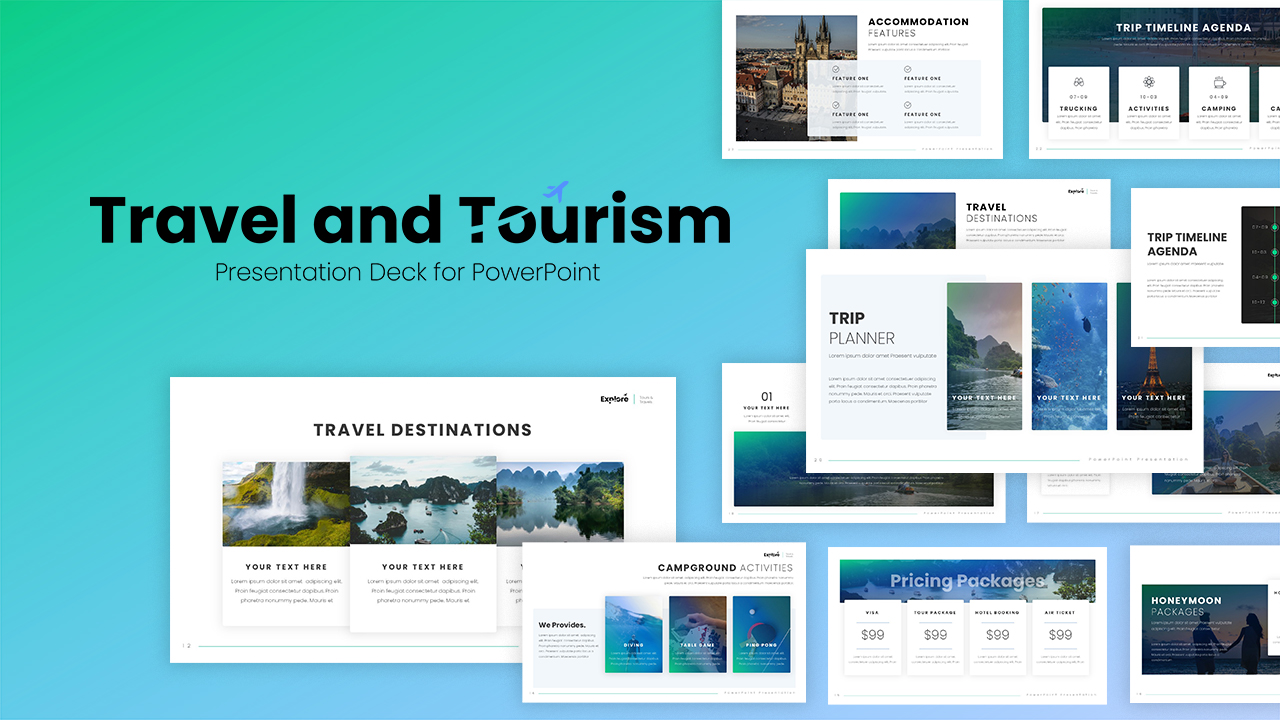
Travel and Tourism Presentation Deck Template for PowerPoint & Google Slides
Pitch Deck

Travel & Tourism Theme Presentation Template for PowerPoint & Google Slides
Company Profile
Free Travel and Tourism Presentation template for PowerPoint & Google Slides
Pitch Deck
Free
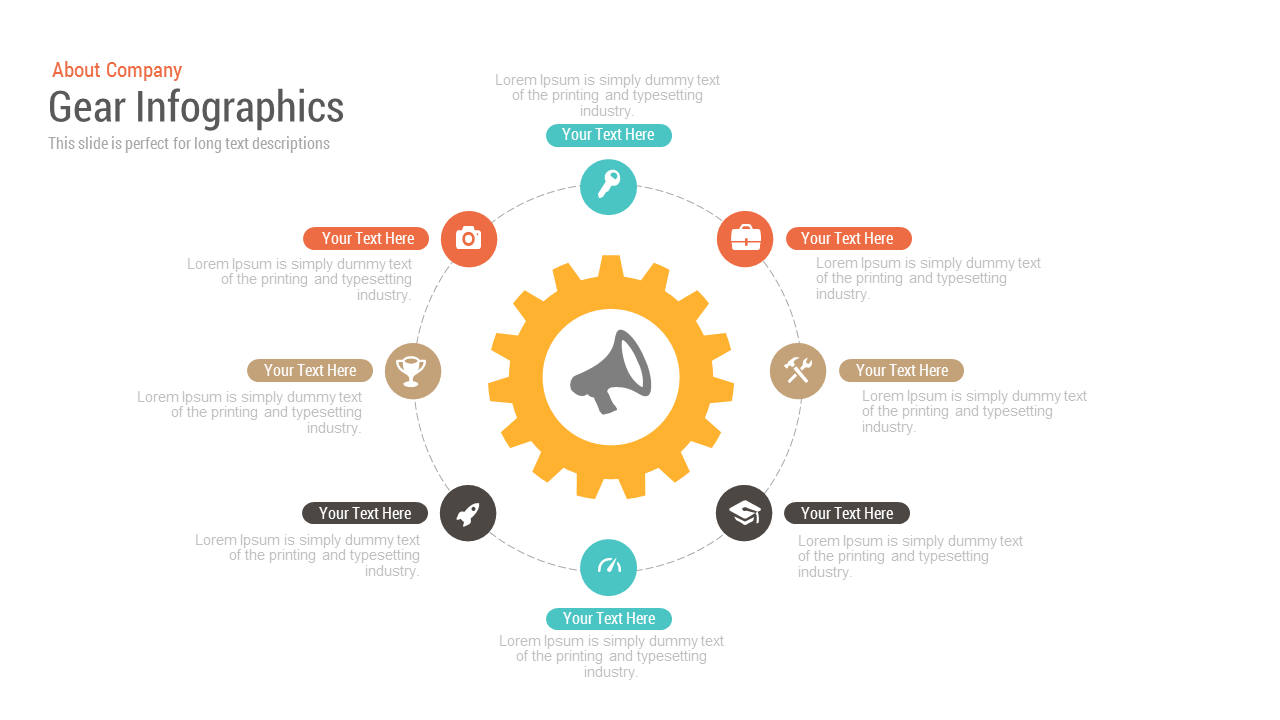
Free Gear Infographics template for PowerPoint & Google Slides
Process
Free
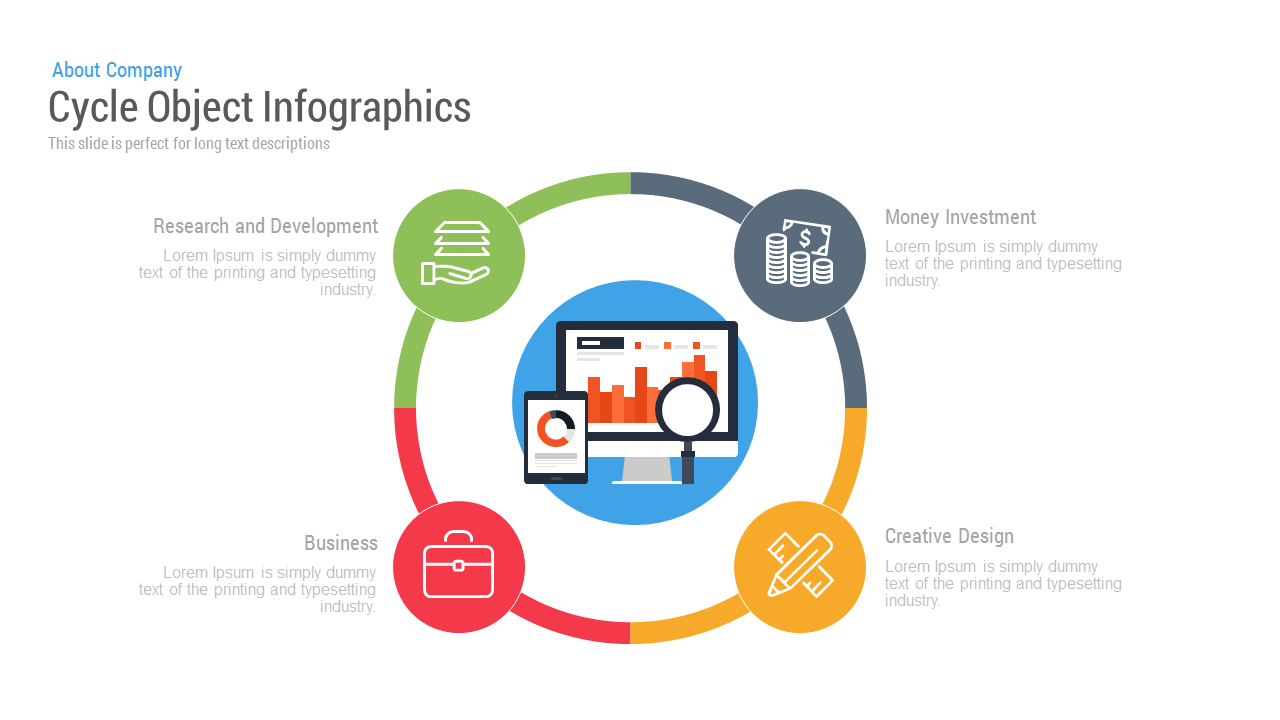
Free Cycle Object Infographics template for PowerPoint & Google Slides
Process
Free
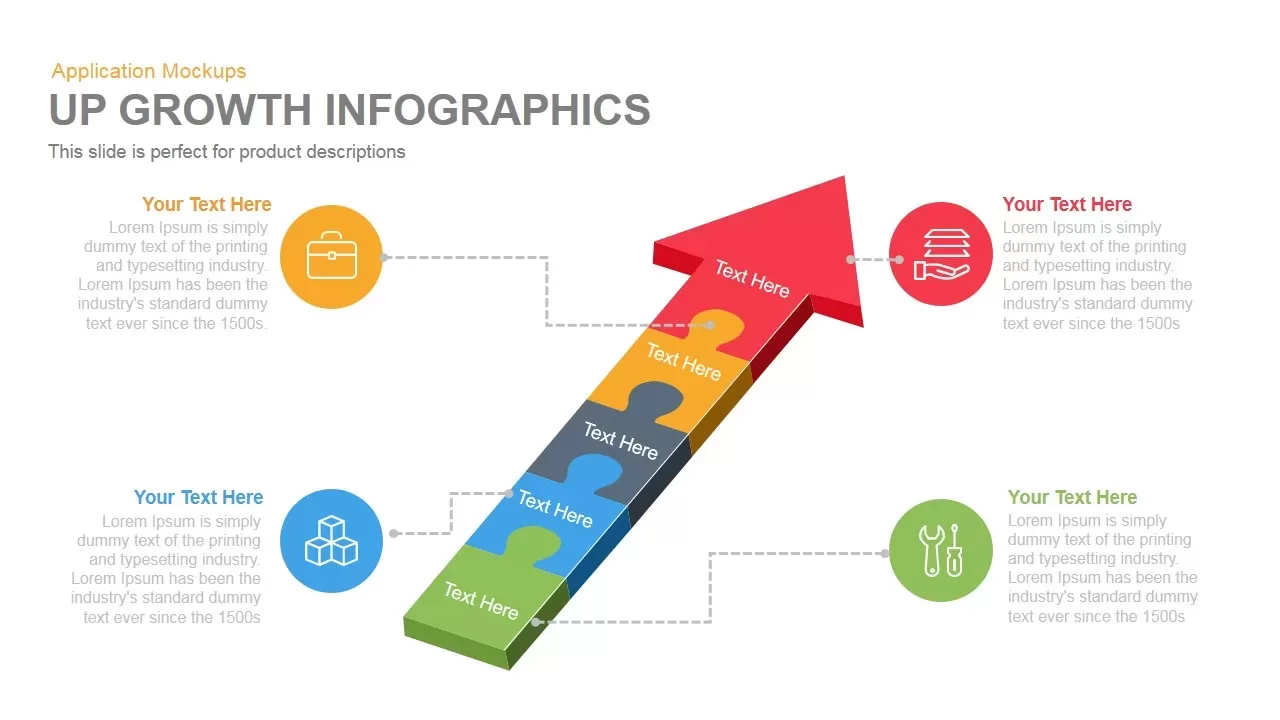
Growth Infographics template for PowerPoint & Google Slides
Arrow
Arrow Infographics template for PowerPoint & Google Slides
Infographics
3D Arrow Infographics Circular Flow Template for PowerPoint & Google Slides
Arrow
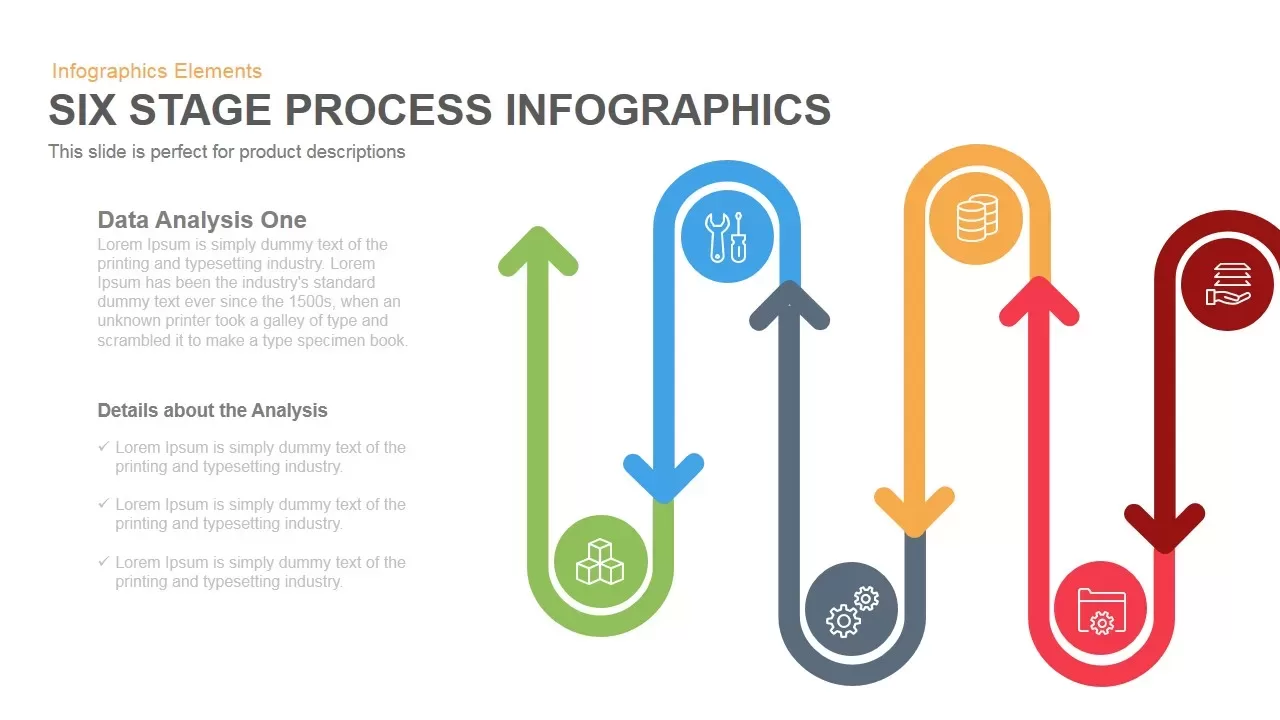
Six-Stage Process Infographics Template for PowerPoint & Google Slides
Process
3D Bar Chart Data Infographics Template for PowerPoint & Google Slides
Bar/Column
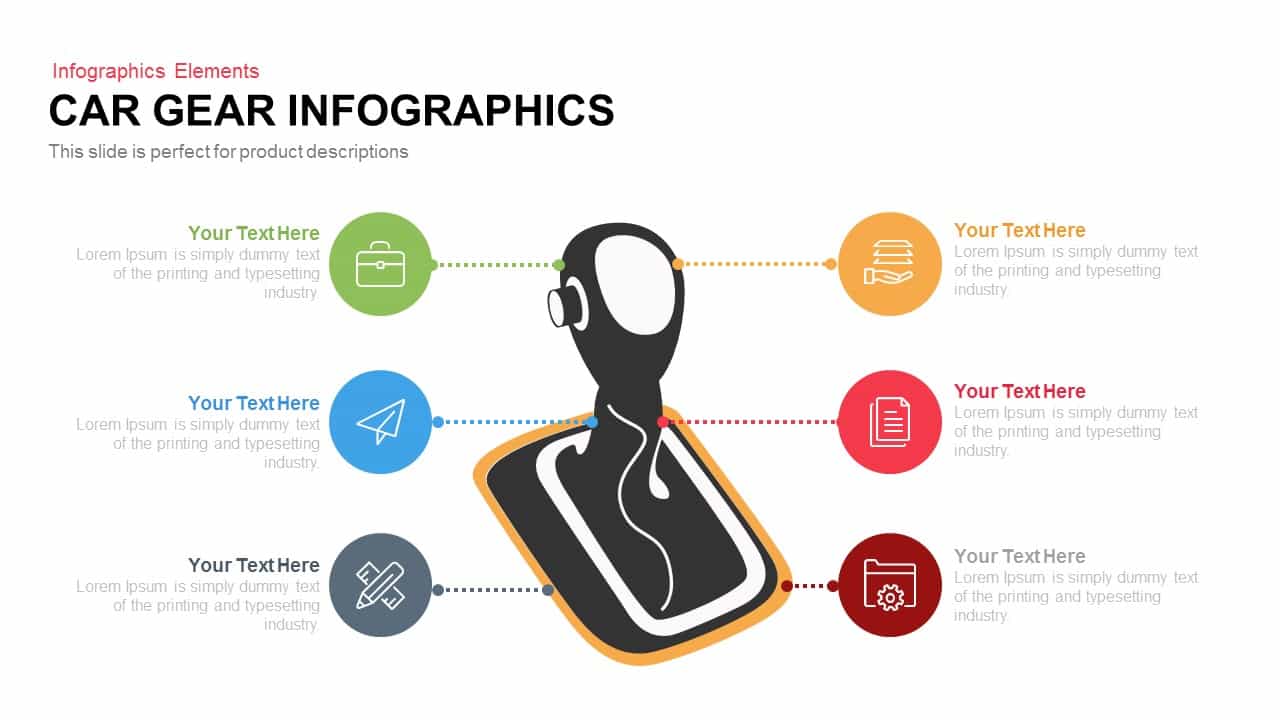
Car Gear Infographics Template for PowerPoint & Google Slides
Infographics
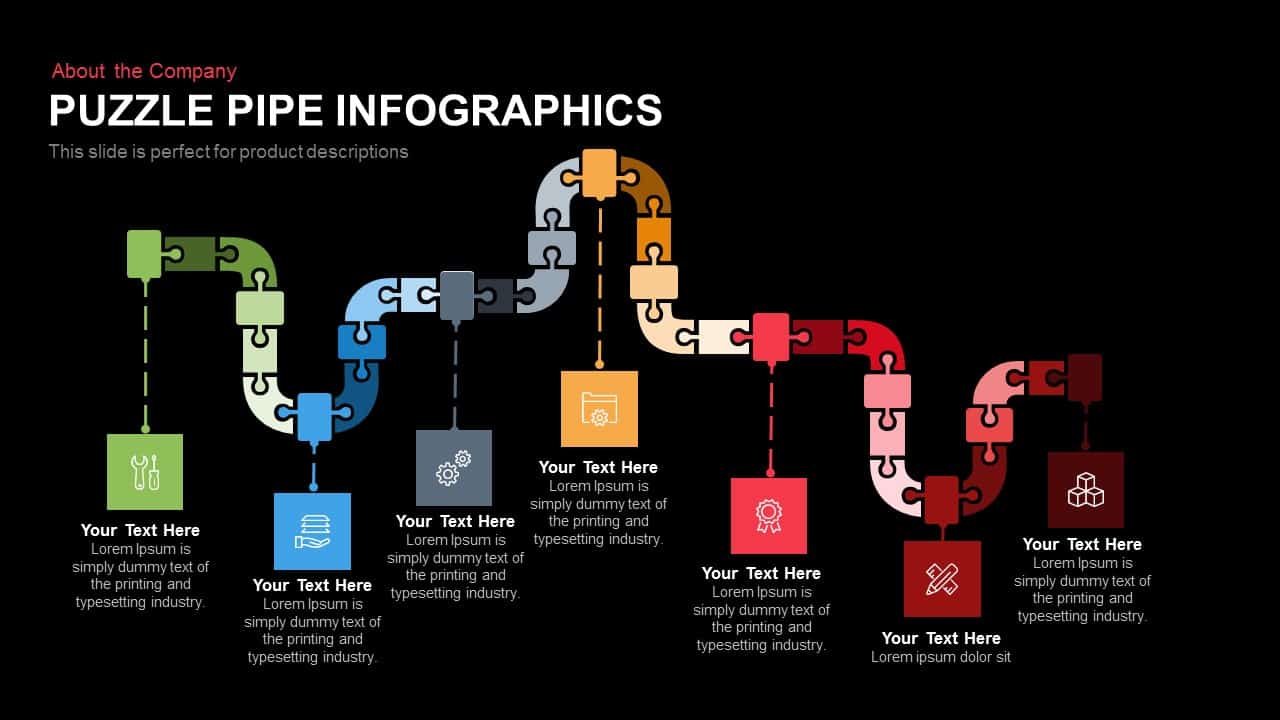
Puzzle Pipe Infographics Process Flow Template for PowerPoint & Google Slides
Process
5-Stage Arrow Infographics Process Flow Template for PowerPoint & Google Slides
Arrow
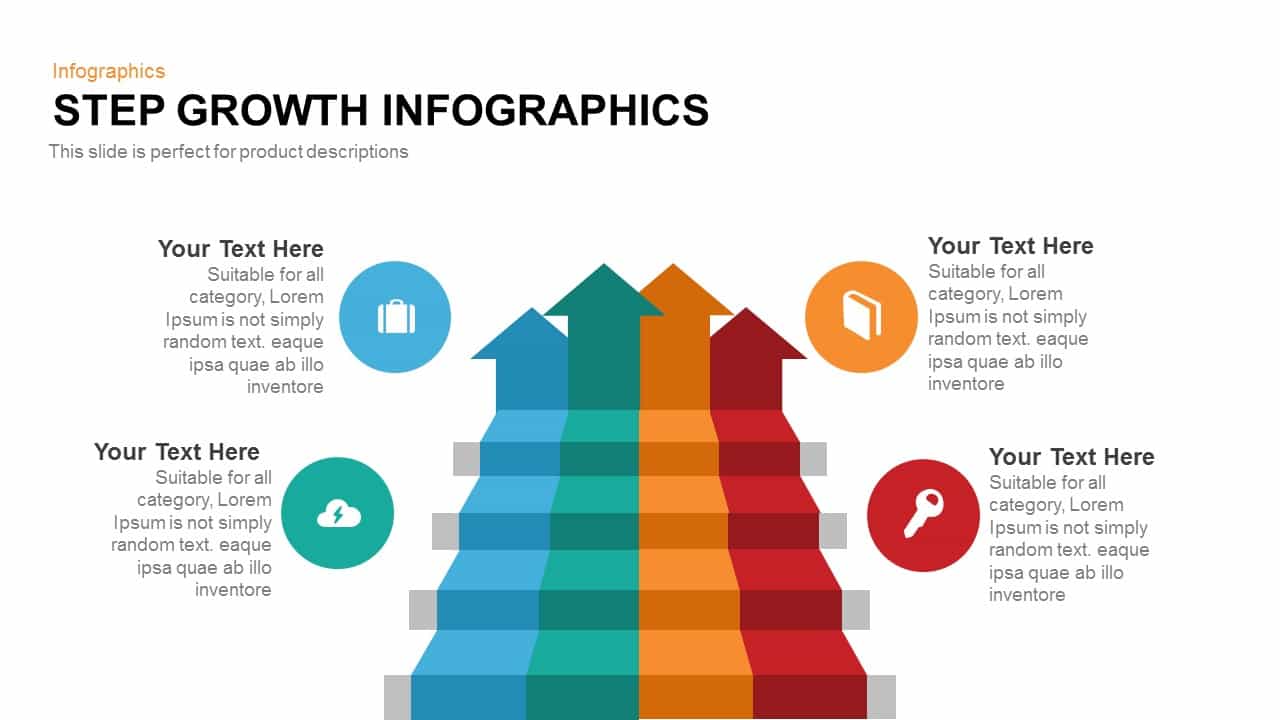
Modern Step Growth Infographics Template for PowerPoint & Google Slides
Process
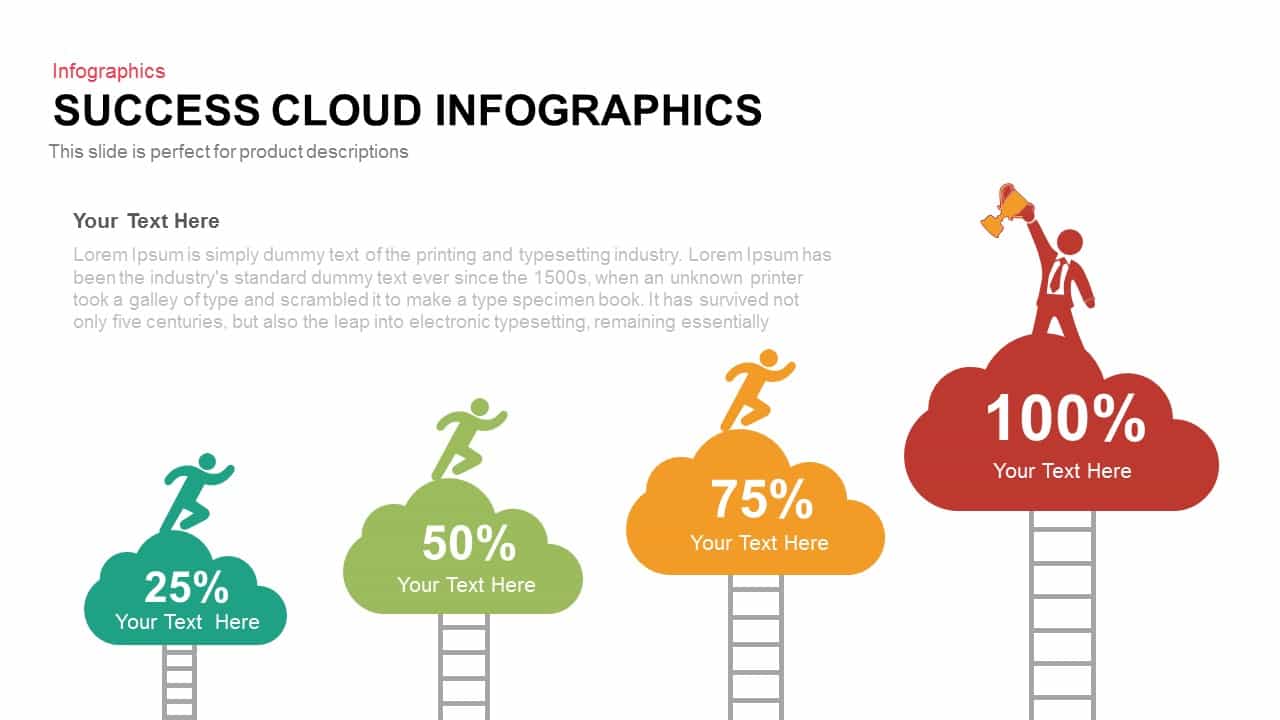
Success Cloud Progress Infographics Template for PowerPoint & Google Slides
Charts
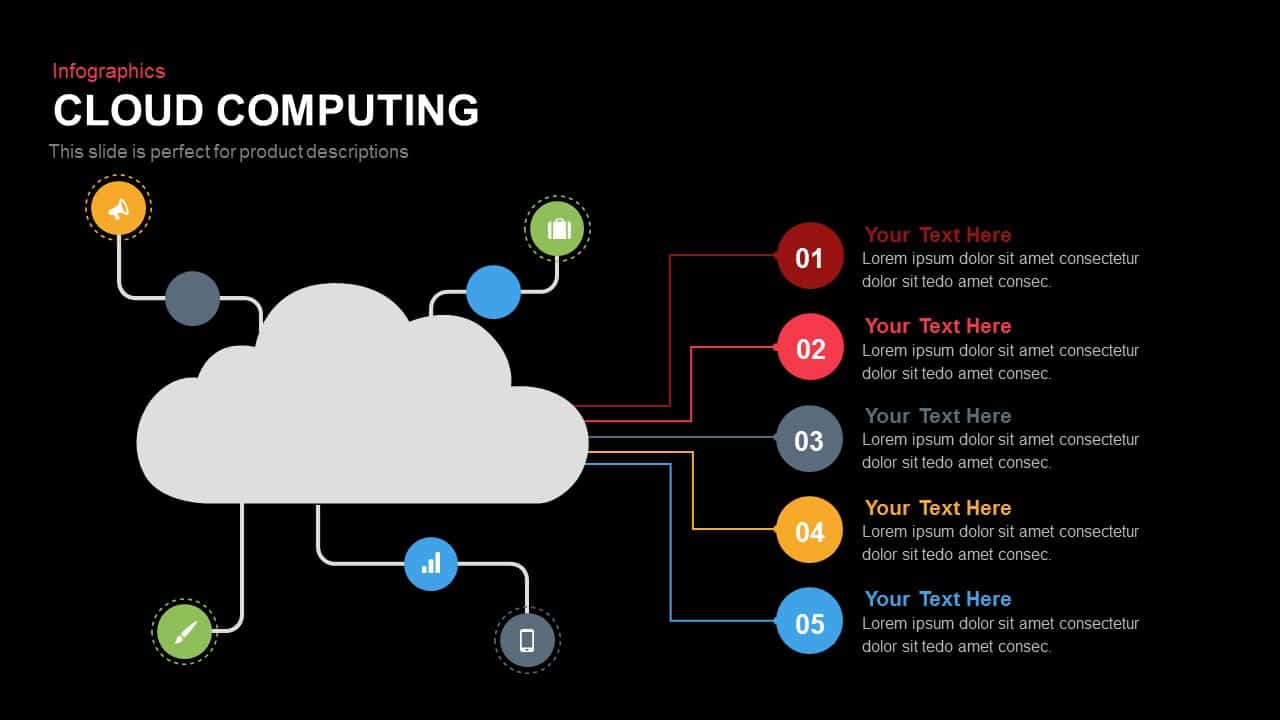
Cloud Computing Infographics template for PowerPoint & Google Slides
Cloud Computing
Brain Gear Hub-and-Spoke Infographics template for PowerPoint & Google Slides
Org Chart
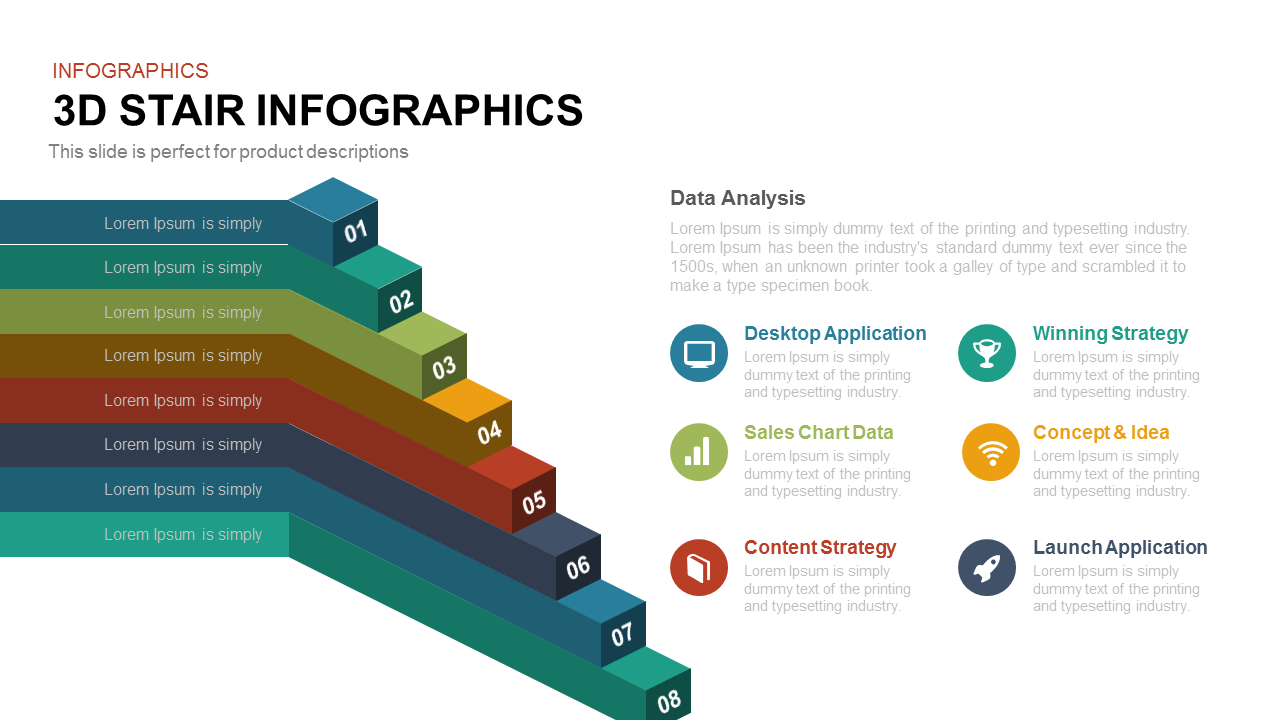
8-Step 3D Stair Infographics Slide template for PowerPoint & Google Slides
Process
Four Swoosh Arrow Infographics template for PowerPoint & Google Slides
Arrow

Dynamic Circle Timeline Infographics template for PowerPoint & Google Slides
Timeline

Arrow Step Infographics Workflow Template for PowerPoint & Google Slides
Arrow
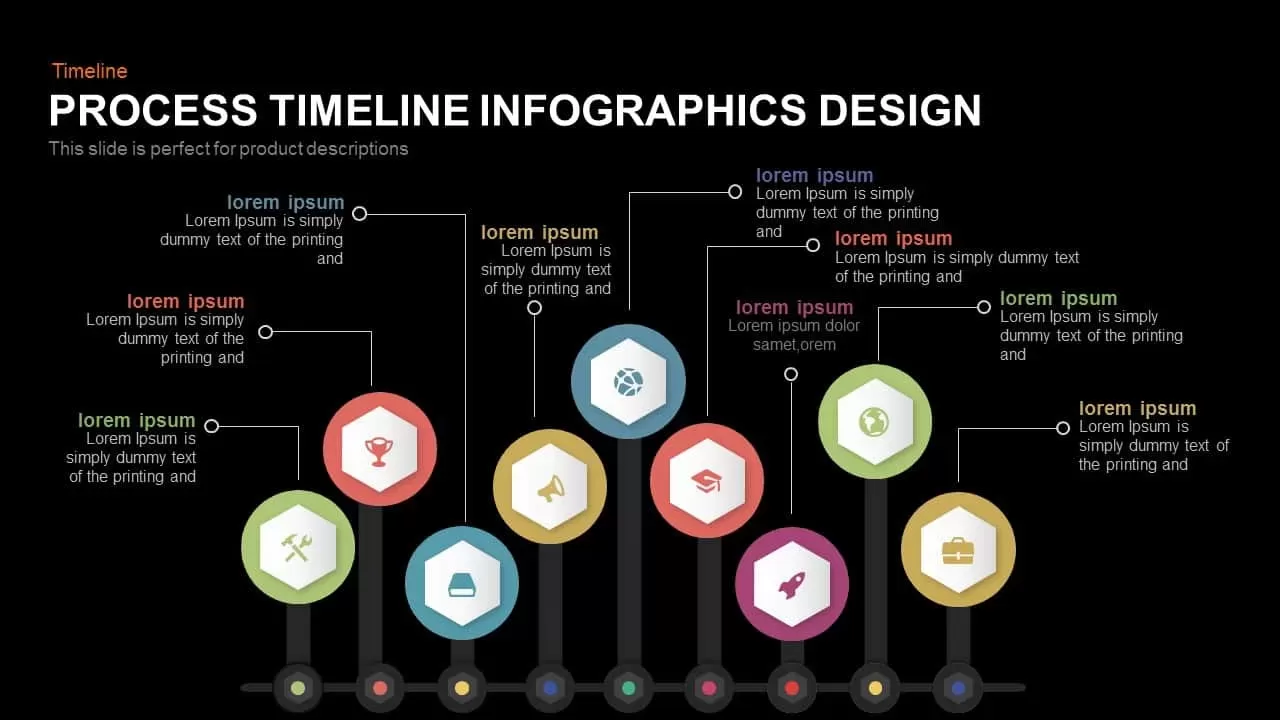
Process Timeline Infographics Design template for PowerPoint & Google Slides
Timeline
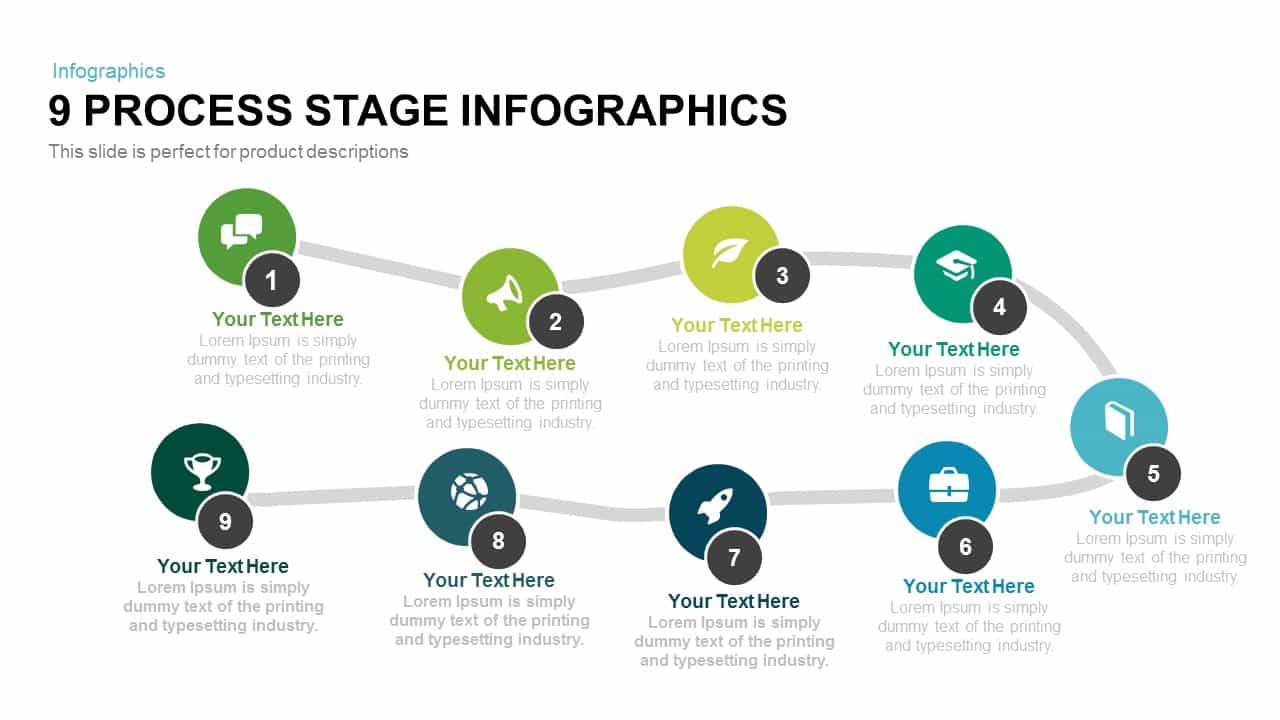
9 Process Stage Infographics template for PowerPoint & Google Slides
Process
Cloud Computing Infographics template for PowerPoint & Google Slides
Cloud Computing
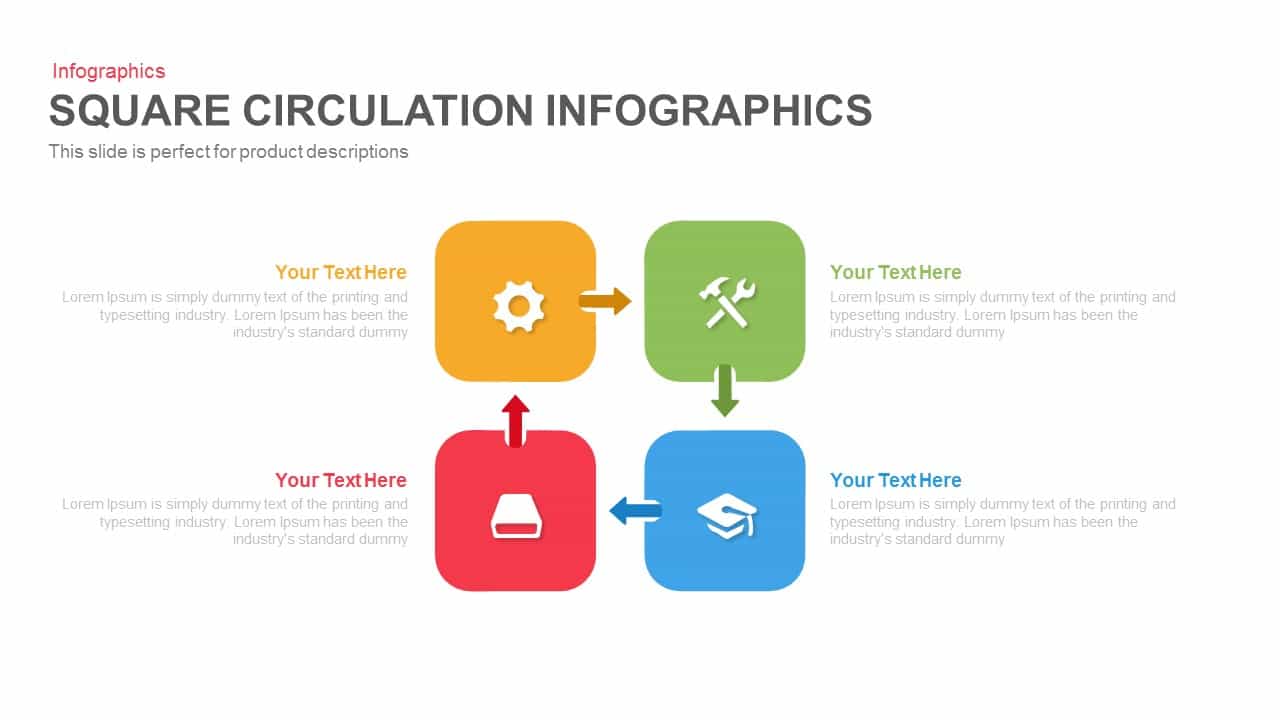
Square Circulation Infographics Template for PowerPoint & Google Slides
Process

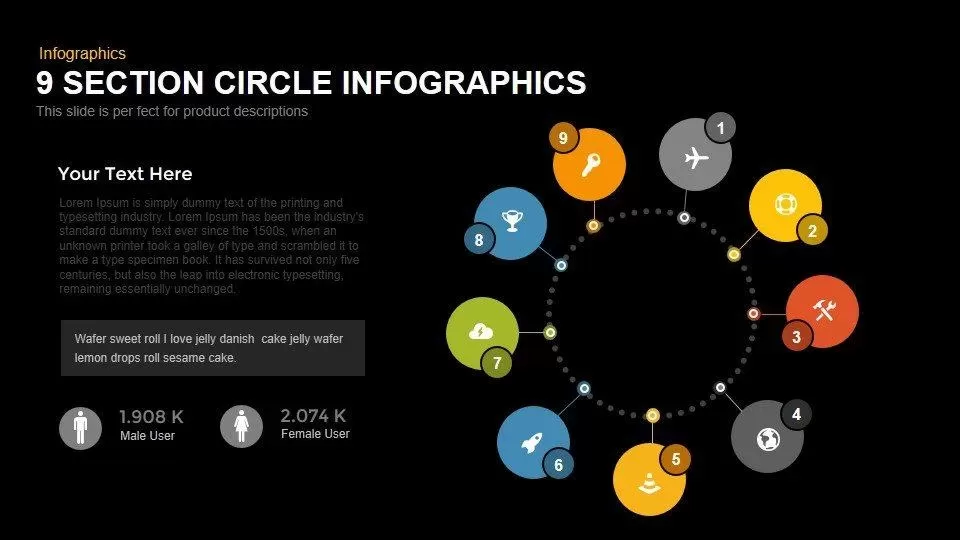
Modern 9-Section Circle Infographics Template for PowerPoint & Google Slides
Circular
Eight-Segment 3D Arrow Infographics Template for PowerPoint & Google Slides
Arrow
Multi-Stage Timeline Infographics Template for PowerPoint & Google Slides
Timeline
Five Arrow Infographics Diagram Template for PowerPoint & Google Slides
Arrow
3D Four-Directional Arrow Infographics Template for PowerPoint & Google Slides
Arrow
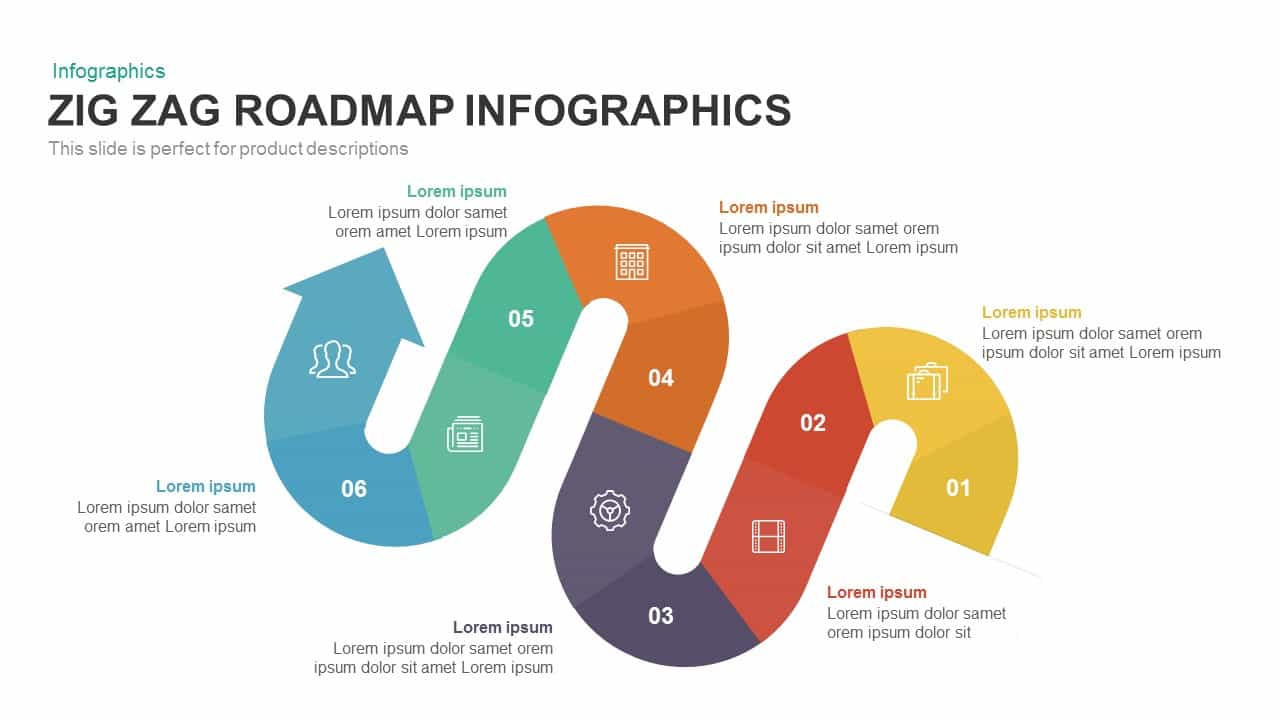
Six-Stage Zig-Zag Roadmap Infographics Template for PowerPoint & Google Slides
Roadmap
Timeline Arrow Infographics Diagram Template for PowerPoint & Google Slides
Timeline
Six Stage Timeline Infographics Template for PowerPoint & Google Slides
Timeline
Four-Section Ribbon Infographics Template for PowerPoint & Google Slides
Process
Growth Sign Board Infographics template for PowerPoint & Google Slides
Timeline
3D Arrow Infographics template for PowerPoint & Google Slides
Arrow
Triangle Process Infographics template for PowerPoint & Google Slides
Process
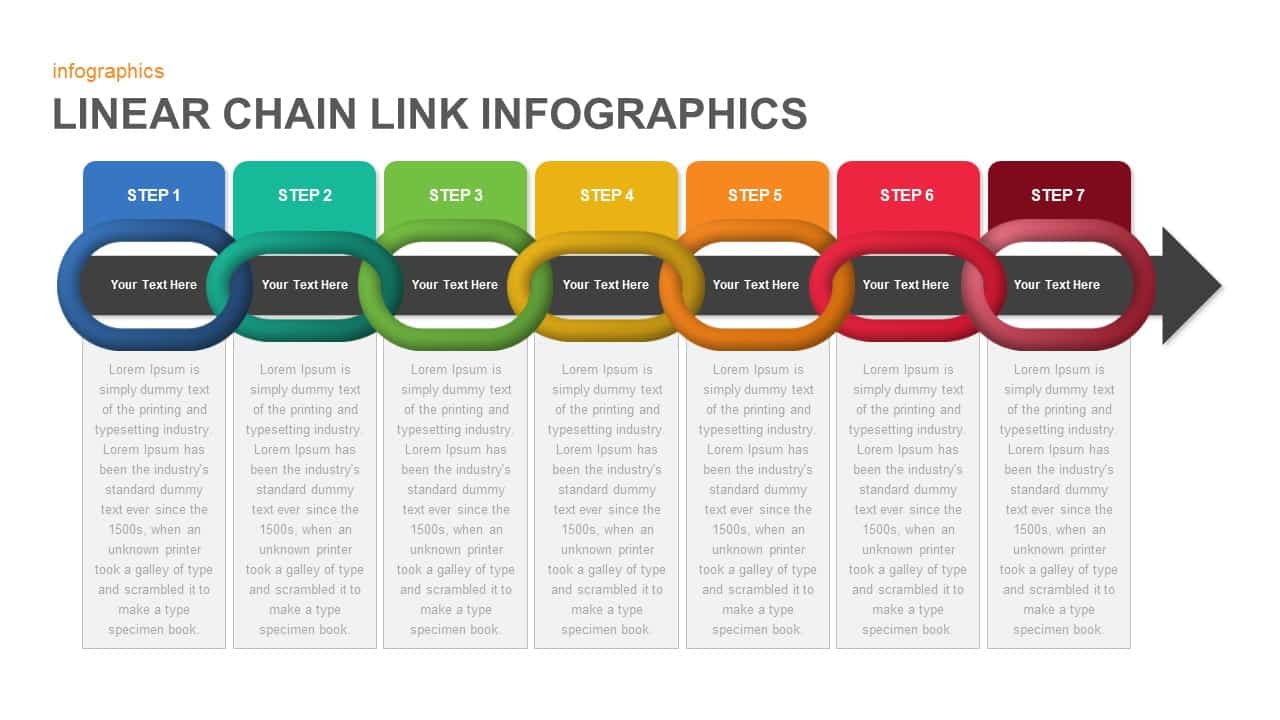
Linear Chain Link Infographics Template for PowerPoint & Google Slides
Process
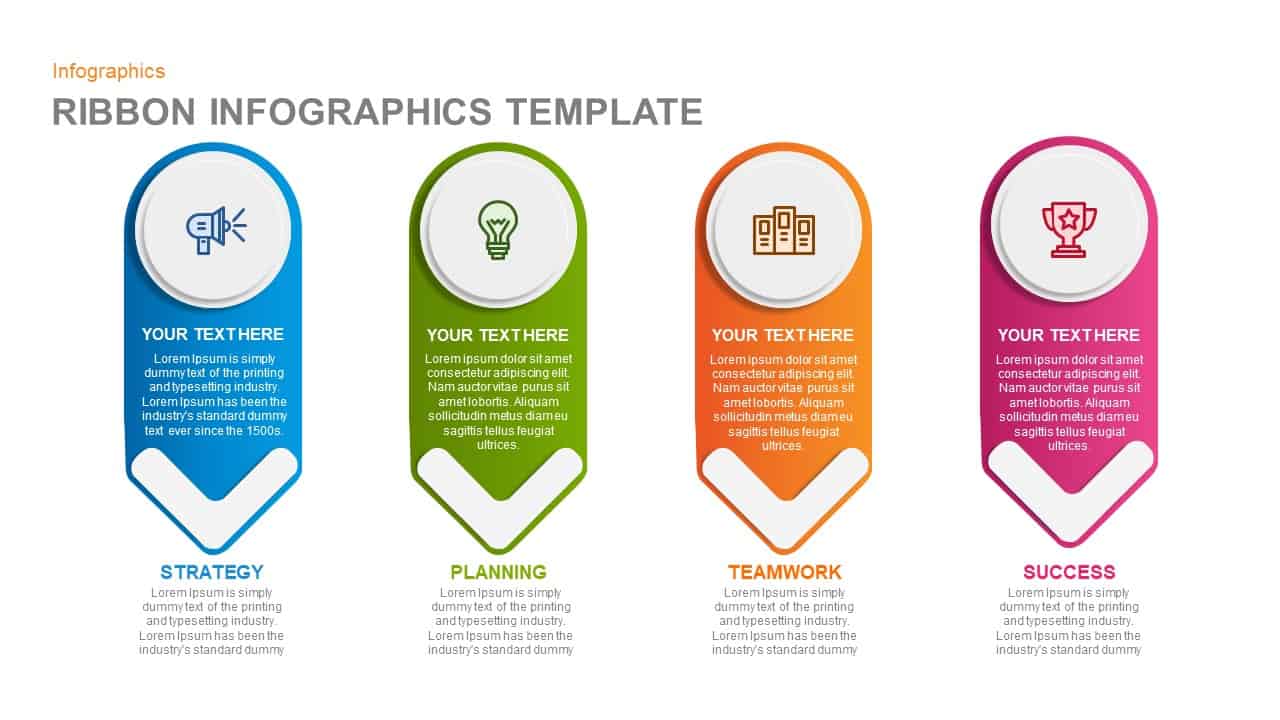
Ribbon Infographics Step-by-Step Process Template for PowerPoint & Google Slides
Process
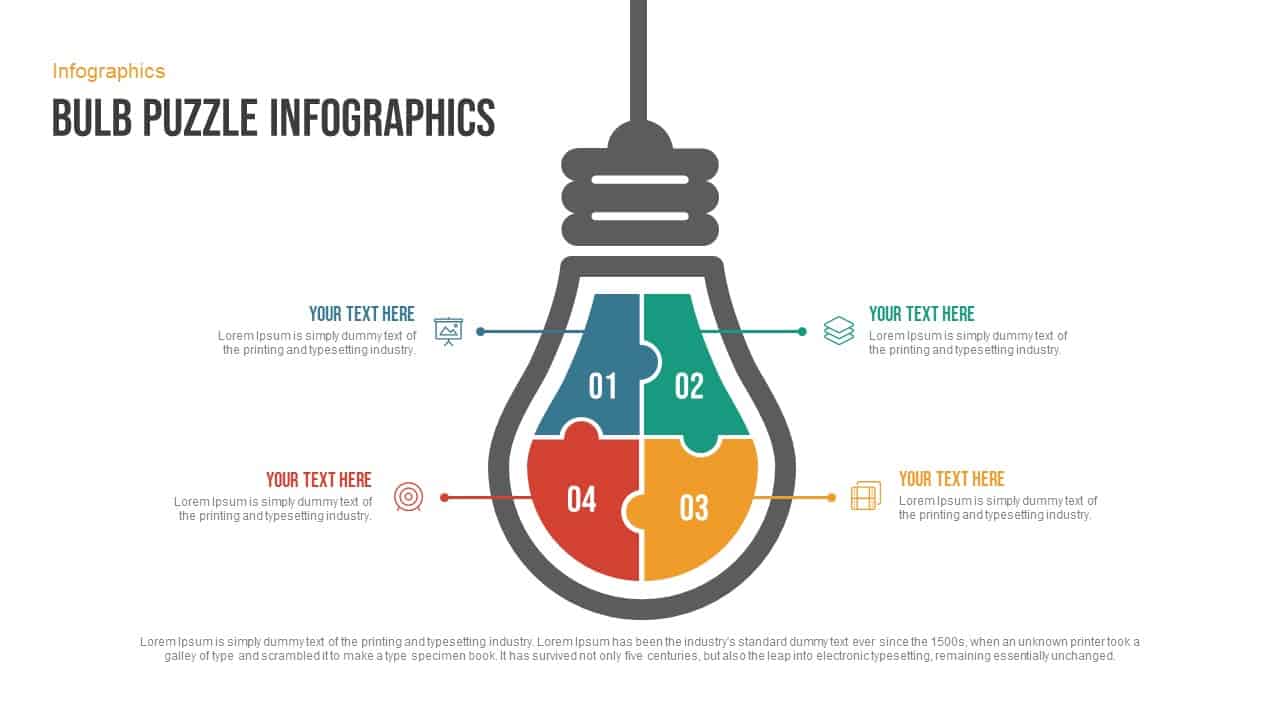
Free Bulb Puzzle Infographics Diagram Template for PowerPoint & Google Slides
Process
Free
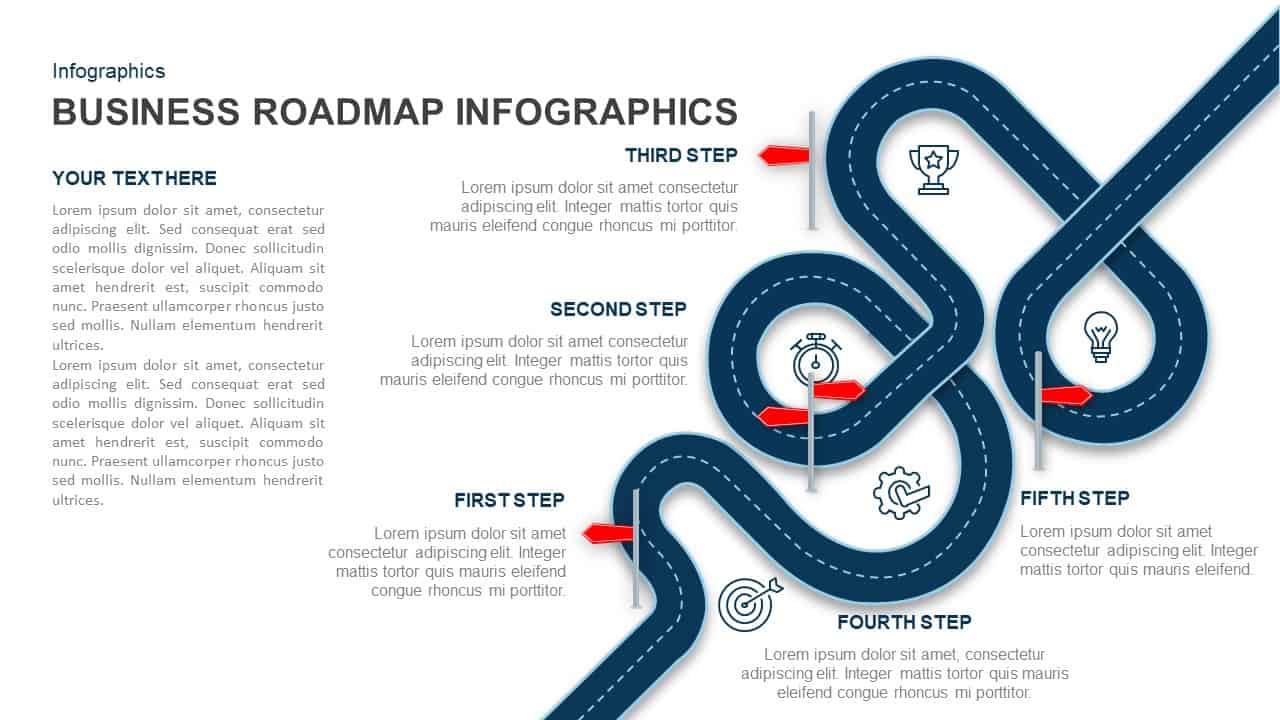
Business Roadmap Infographics template for PowerPoint & Google Slides
Roadmap
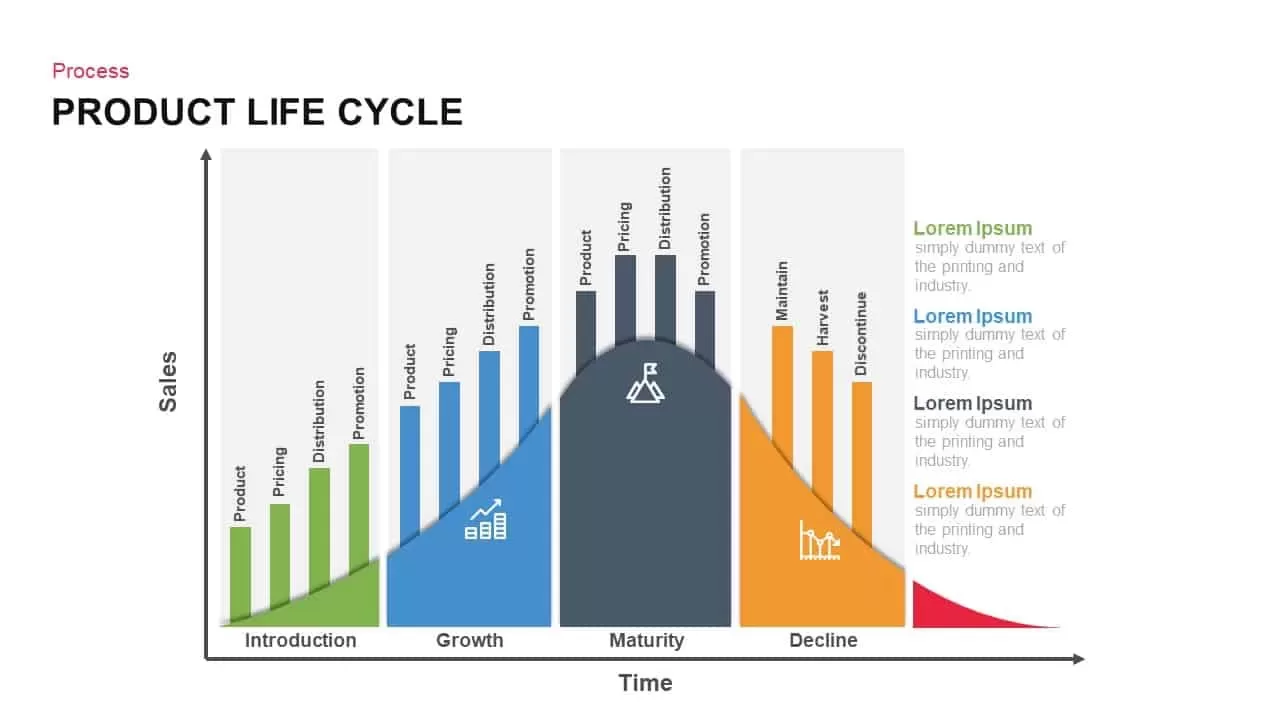
Product Life Cycle Infographics template for PowerPoint & Google Slides
Business
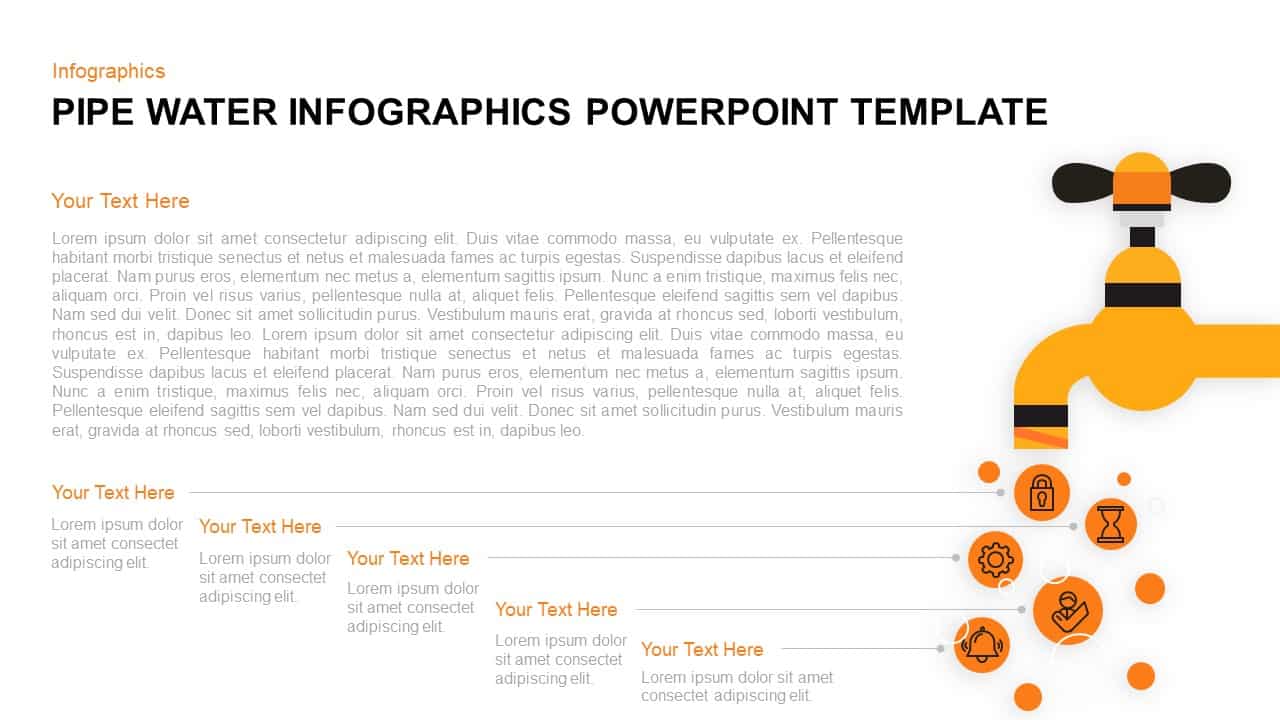
Pipe Water Infographics Flow Diagram Template for PowerPoint & Google Slides
Process
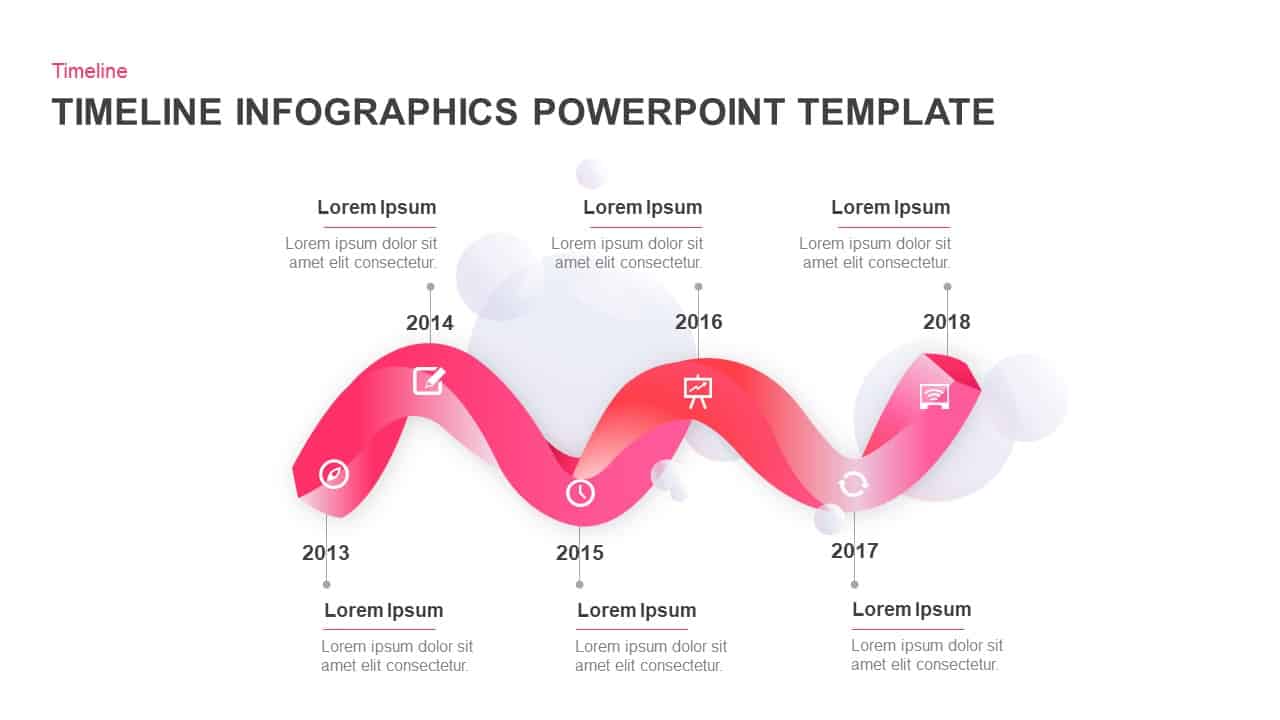
Wavy Ribbon Timeline Infographics Template for PowerPoint & Google Slides
Timeline
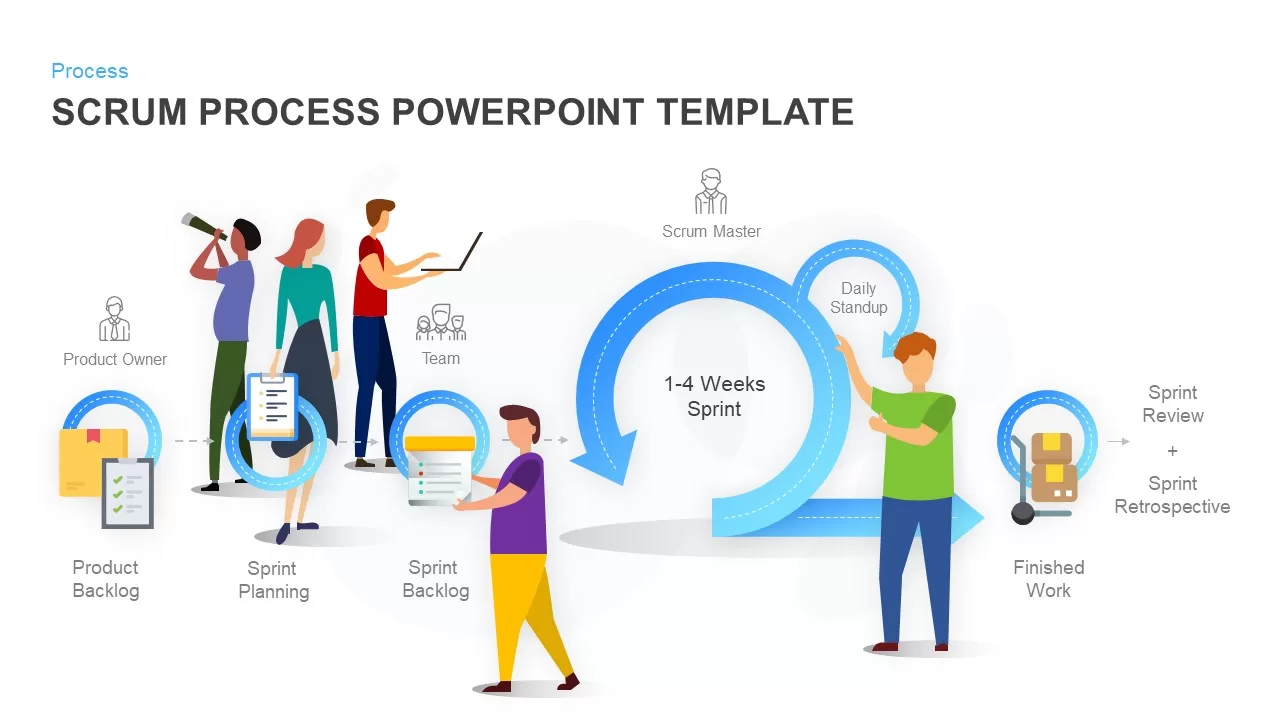
Scrum Process & Roles Infographics Template for PowerPoint & Google Slides
Scrum
Venn Diagram Infographics Pack Template for PowerPoint & Google Slides
Circular
Comprehensive Scrum Infographics Pack Template for PowerPoint & Google Slides
Scrum
Canada Population Infographics Template for PowerPoint & Google Slides
World Maps
Editable Pillars Infographics Pack Template for PowerPoint & Google Slides
Infographics
4-Step Growth & Success Infographics Template for PowerPoint & Google Slides
Accomplishment
5-Step Growth Arrow Infographics Template for PowerPoint & Google Slides
Arrow
Six-Stage Timeline Infographics Slide Template for PowerPoint & Google Slides
Timeline
3D Pyramid Infographics Slide Template for PowerPoint & Google Slides
Pyramid
3D Cube Pyramid Infographics Slide Template for PowerPoint & Google Slides
Pyramid
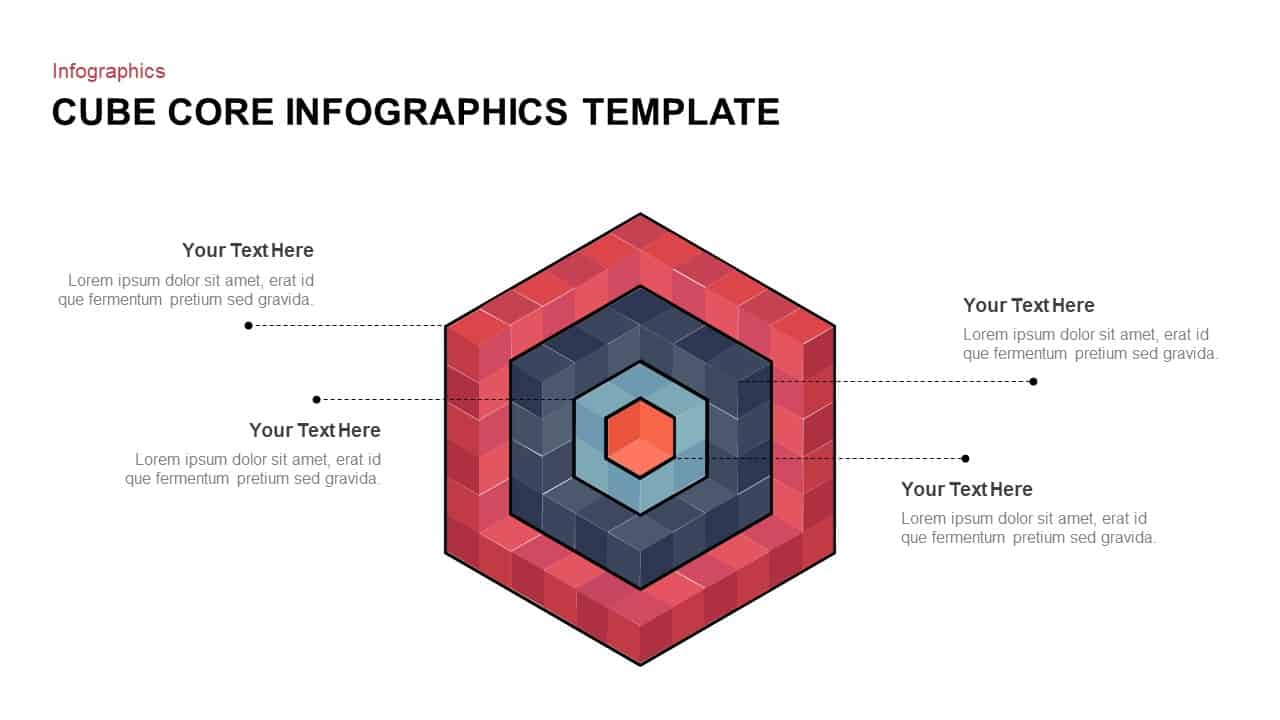
Cube Core Infographics Template for PowerPoint & Google Slides
Process
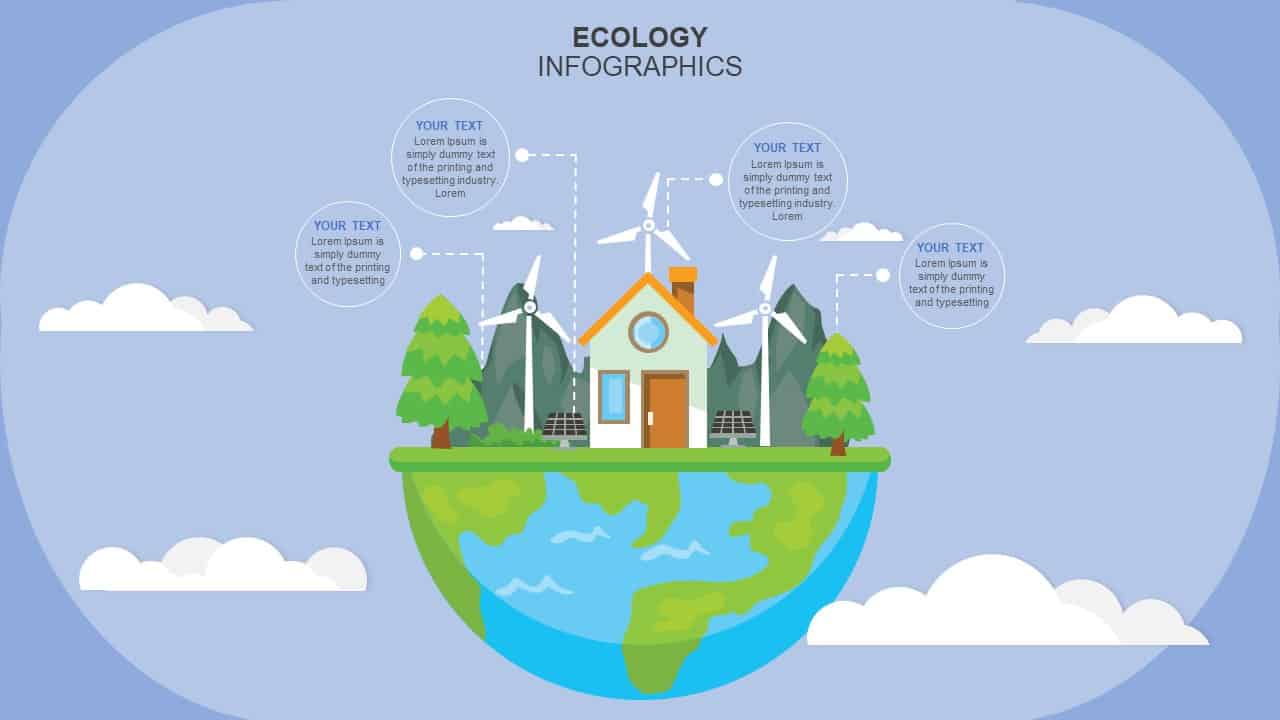
Ecology Infographics Overview template for PowerPoint & Google Slides
Business Proposal
Four Section Diagram Infographics template for PowerPoint & Google Slides
Process
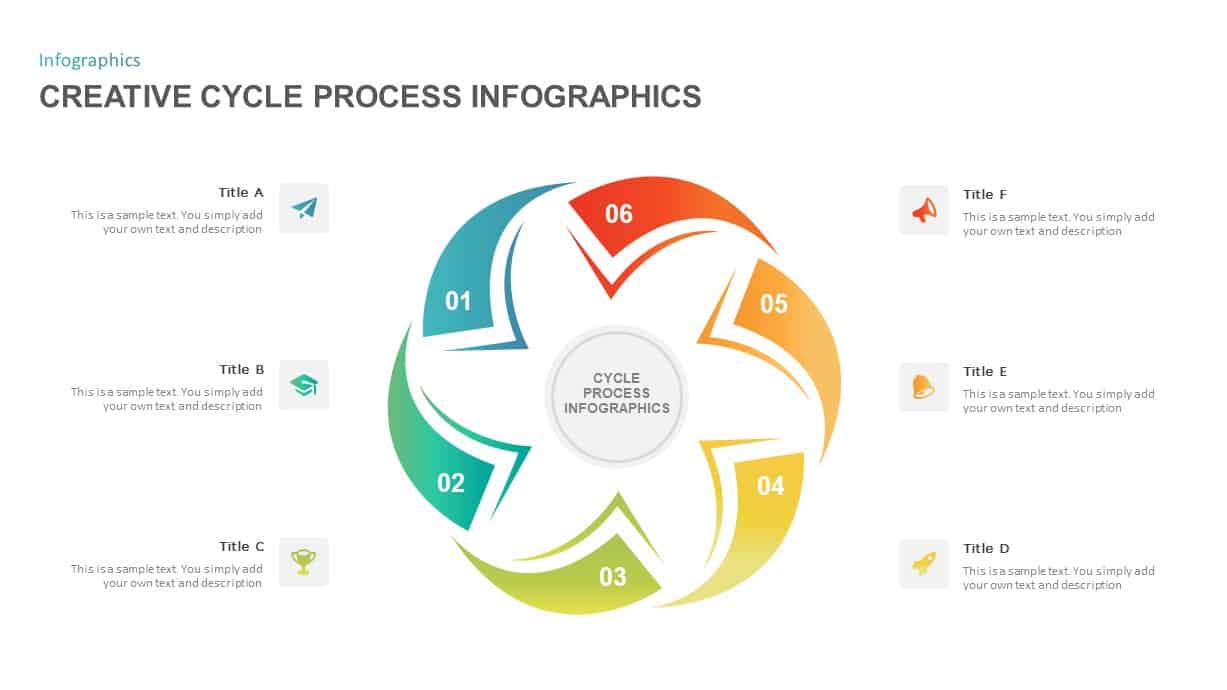
Creative Cycle Process Infographics Template for PowerPoint & Google Slides
Process
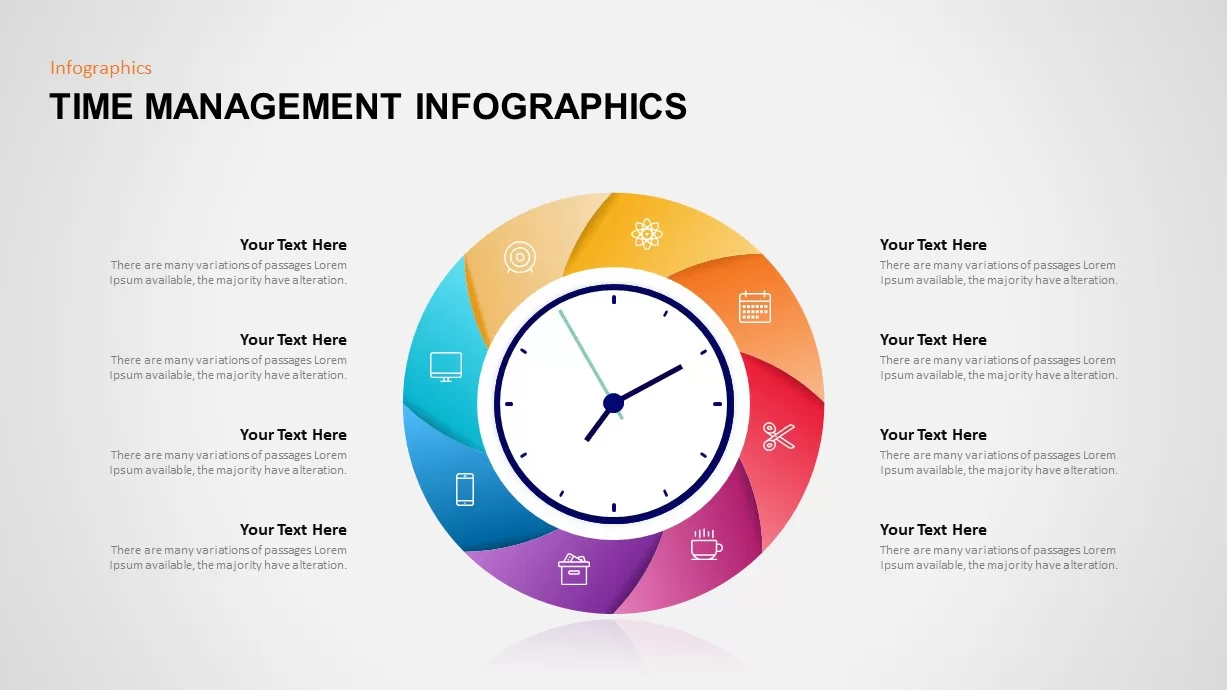
Time Management Infographics Template for PowerPoint & Google Slides
Process
Modern 5-Step Flow Infographics Template for PowerPoint & Google Slides
Process
Rainbow Cloud Infographics Diagram Template for PowerPoint & Google Slides
Process
Medical Infographics Data Visualization Template for PowerPoint & Google Slides
Health
Market Segmentation & STP Infographics Pack Template for PowerPoint & Google Slides
Marketing
Business Growth Plant Infographics Pack Template for PowerPoint & Google Slides
Process
Road Timeline Infographics Template for PowerPoint & Google Slides
Timeline
Isometric 3D Cube Shapes Infographics Template for PowerPoint & Google Slides
Infographics
Six-Step Circular Diagram Infographics Template for PowerPoint & Google Slides
Circular
Dynamic Gear Diagram Infographics Template for PowerPoint & Google Slides
Process
Versatile Creative Diagram Infographics Template for PowerPoint & Google Slides
Process
Versatile 3D Modular Shape Infographics Template for PowerPoint & Google Slides
Infographics
3, 4, and 5 Step Gear Infographics Template for PowerPoint & Google Slides
Process
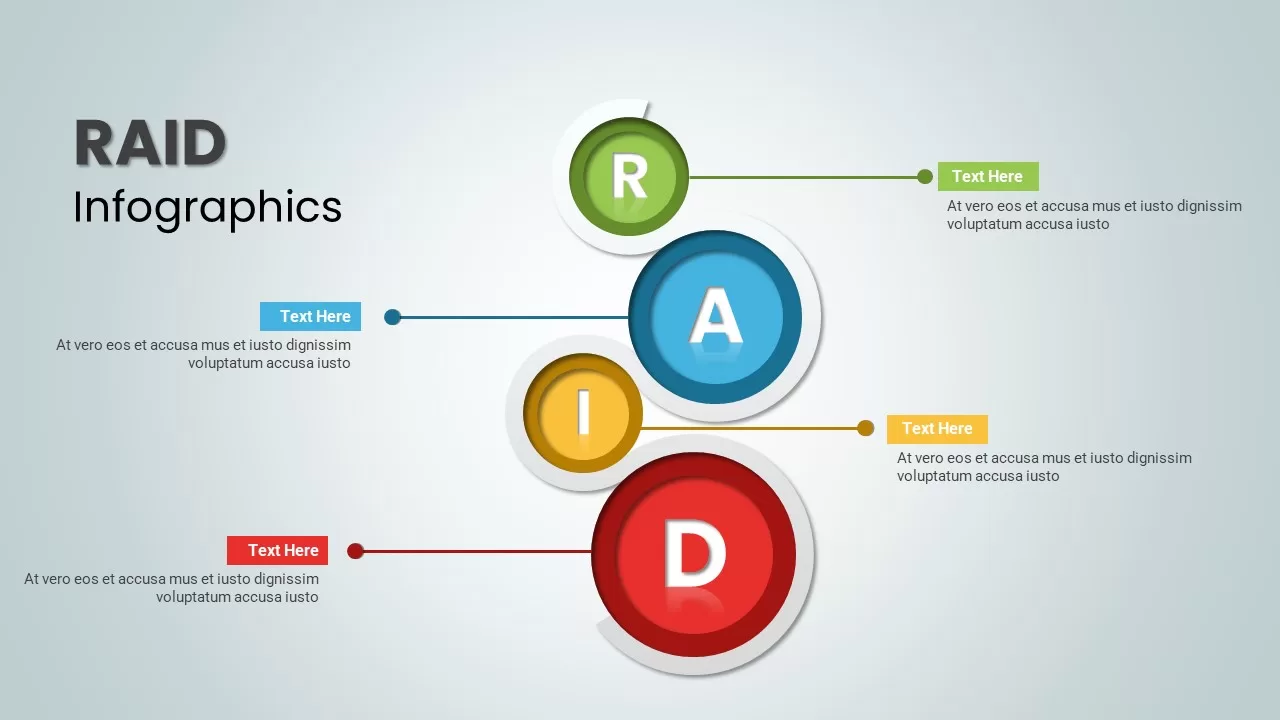
RAID Infographics template for PowerPoint & Google Slides
Business

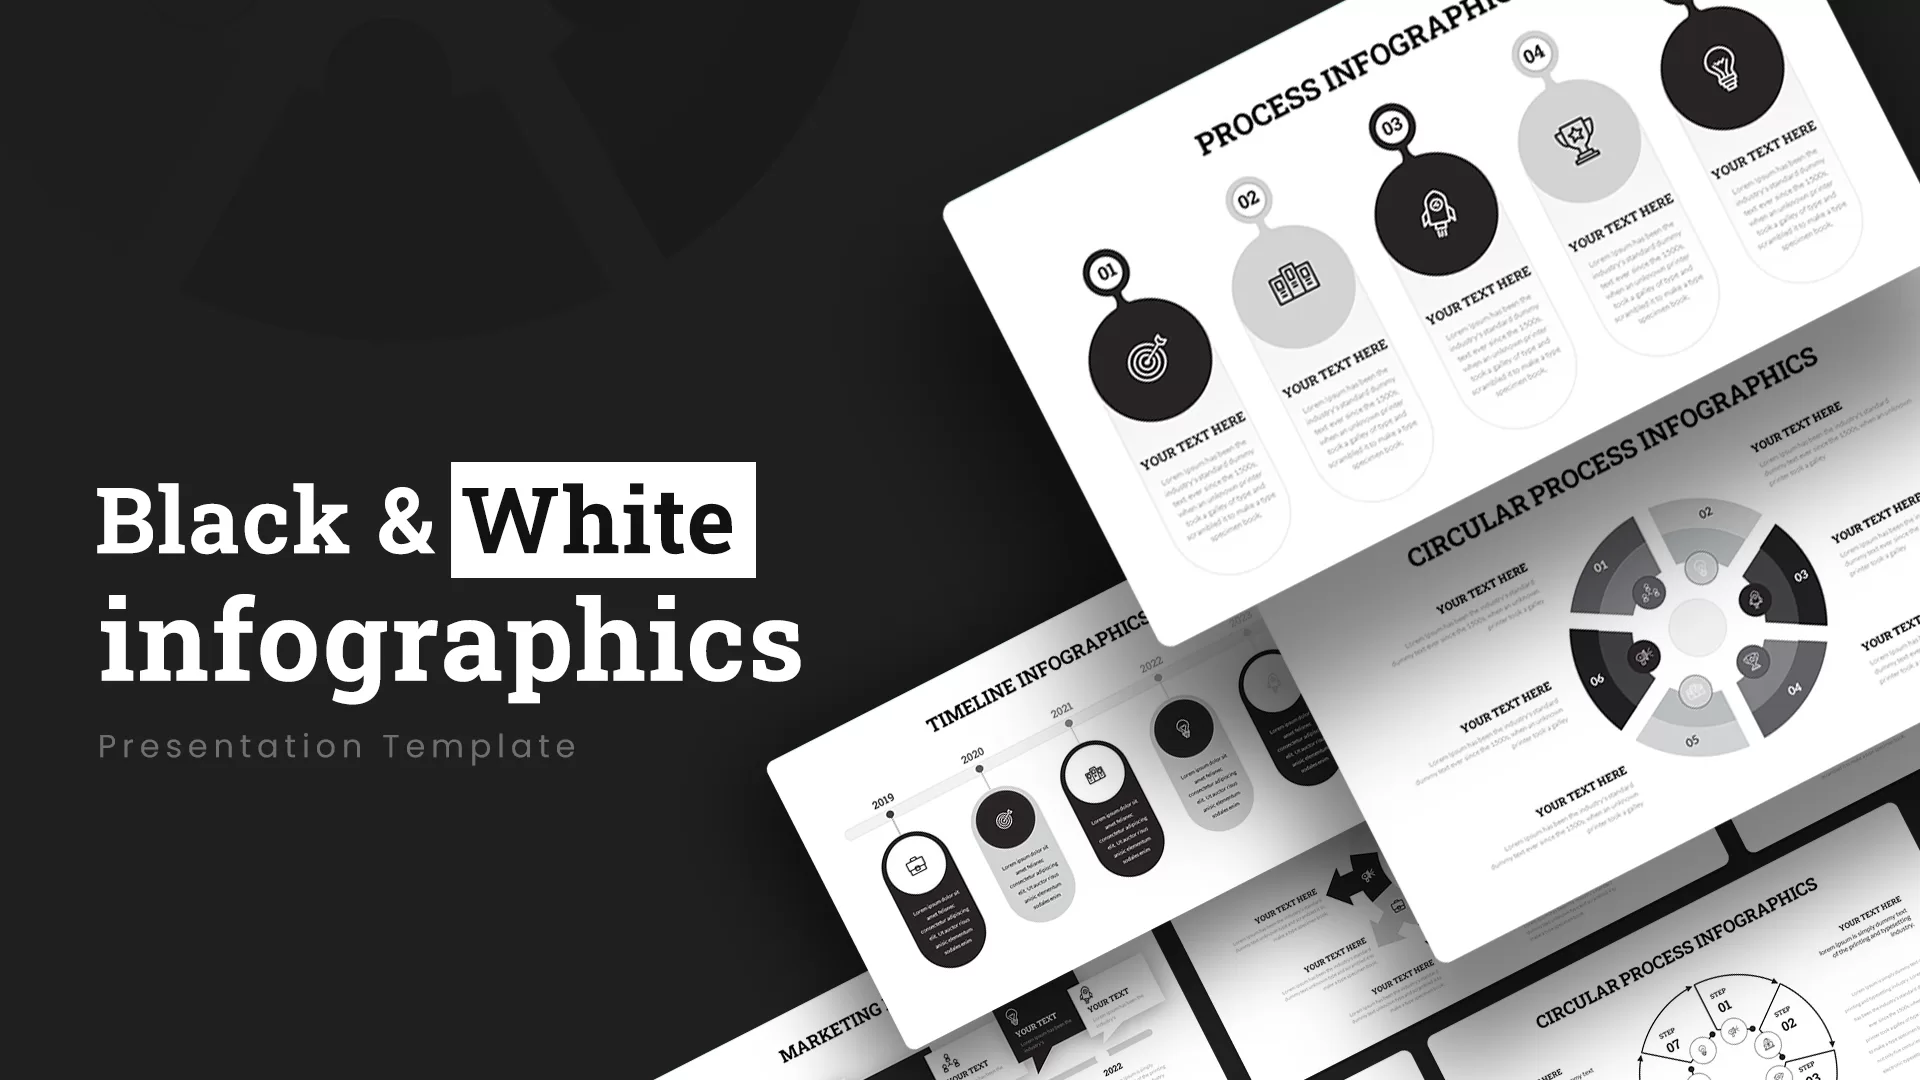
Black and White Infographics template for PowerPoint & Google Slides
Business
Free Colorful Process Flow Infographics Template for PowerPoint & Google Slides
Process
Free
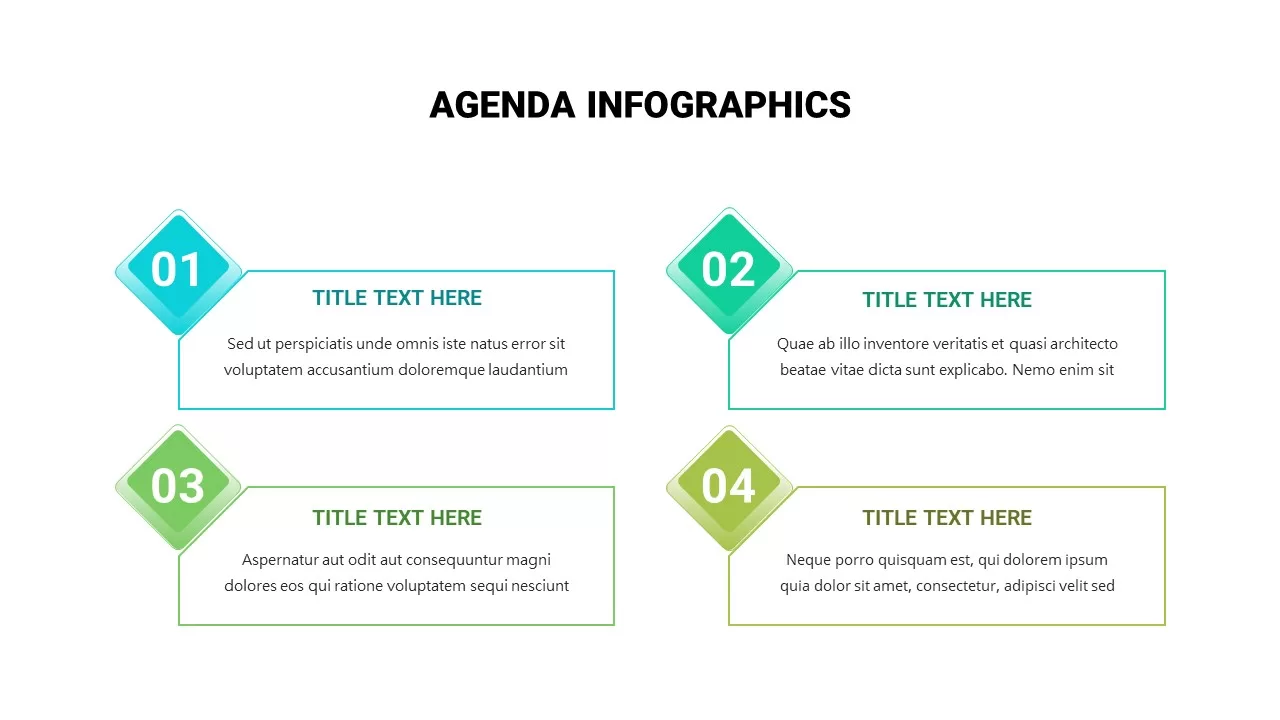
Agenda Infographics Diamond template for PowerPoint & Google Slides
Business Plan
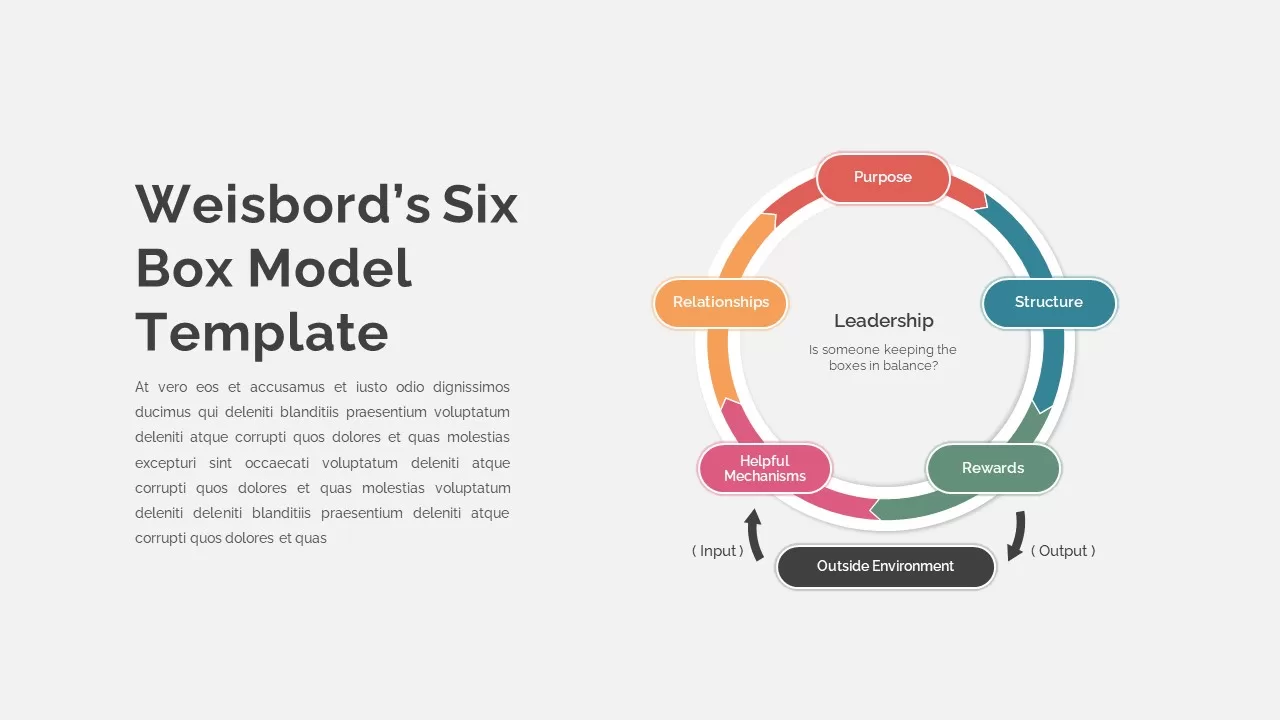
Weisbord’s Six Box Model Infographics Template for PowerPoint & Google Slides
Circular
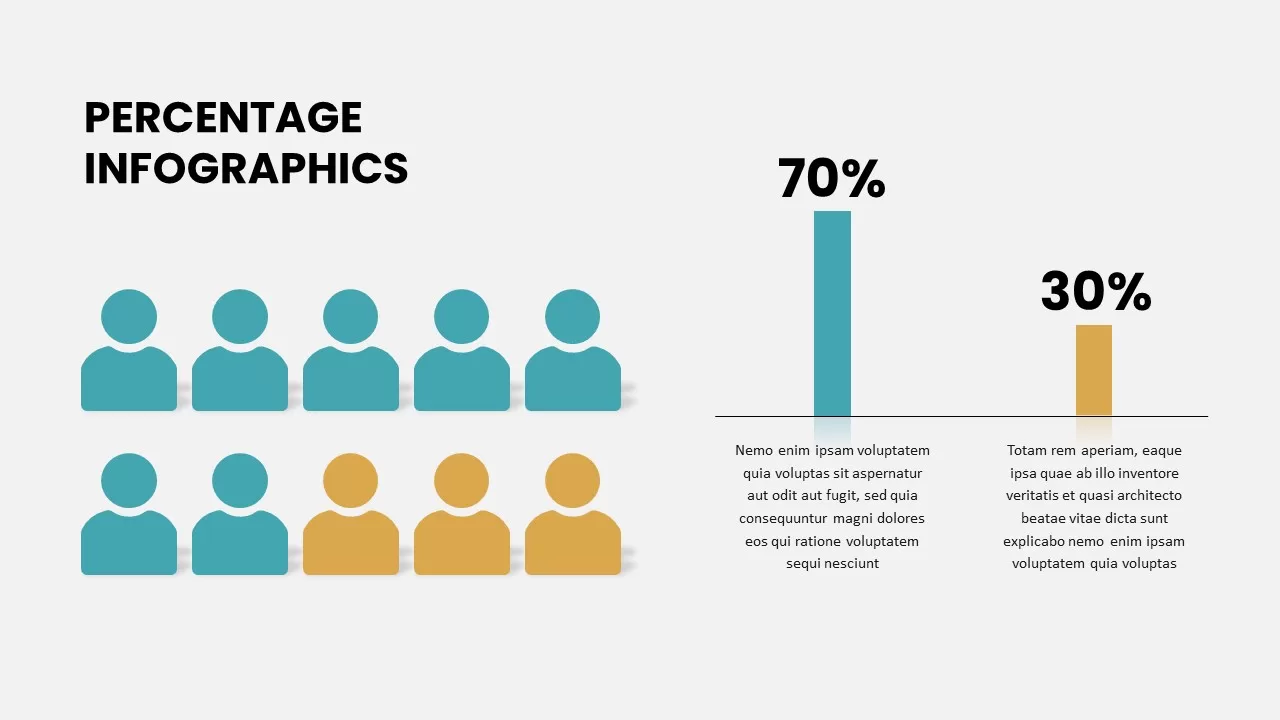
Free Percentage Infographics template for PowerPoint & Google Slides
Comparison
Free
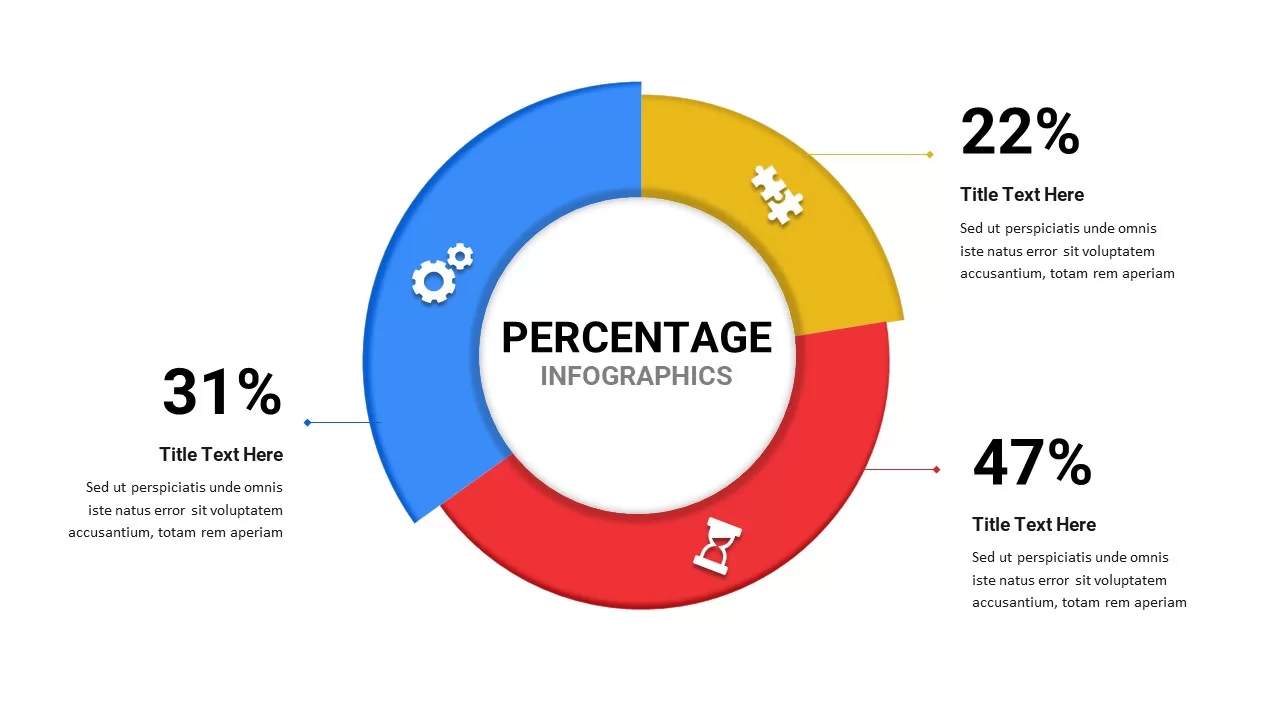
Percentage Infographics template for PowerPoint & Google Slides
Comparison
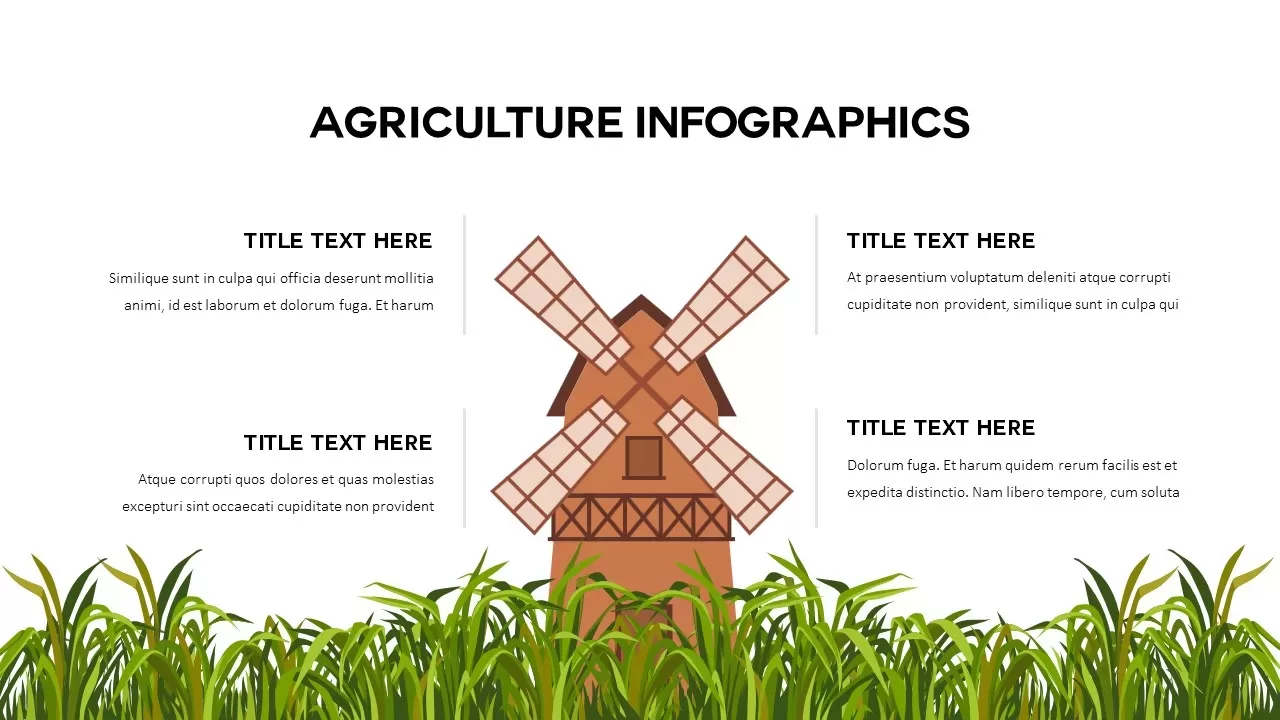
Agriculture Windmill Infographics Template for PowerPoint & Google Slides
Comparison
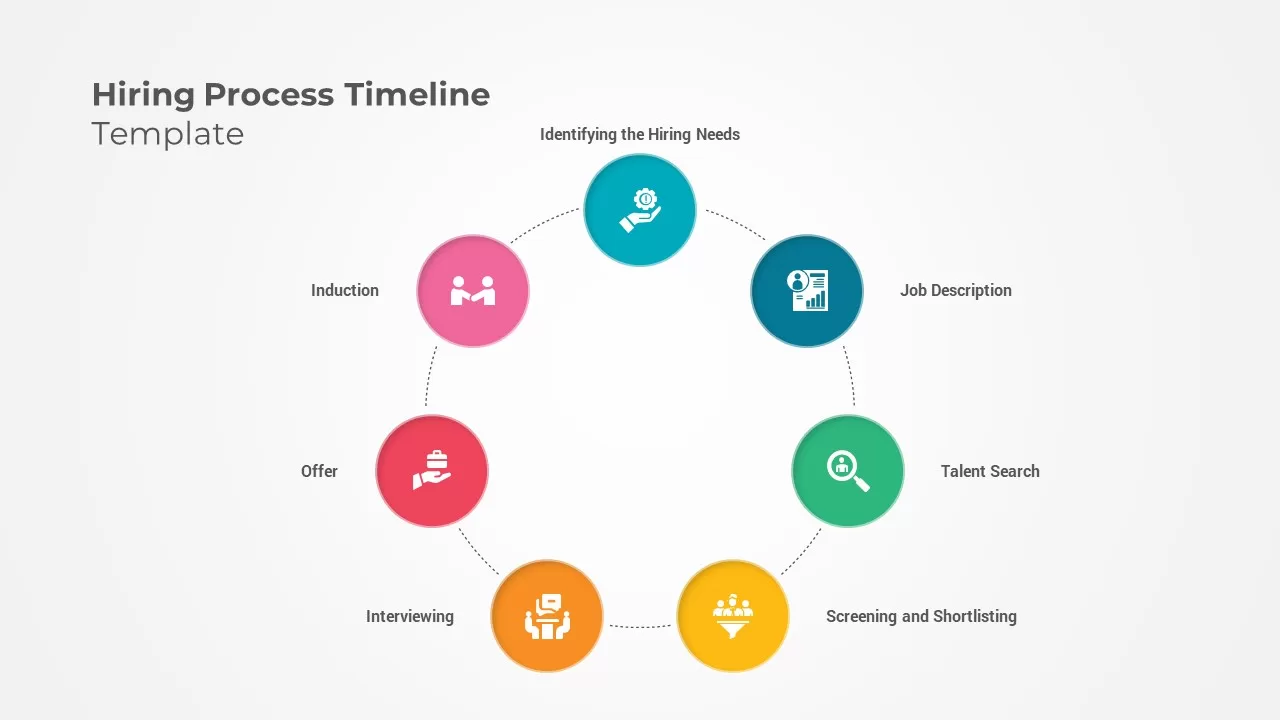
Hiring Process Timeline Infographics Template for PowerPoint & Google Slides
Recruitment
Sprint Review Process Infographics Pack Template for PowerPoint & Google Slides
Infographics
Flywheel Infographics template for PowerPoint & Google Slides
Business Strategy
Modern Social Media Infographics Template for PowerPoint & Google Slides
Digital Marketing
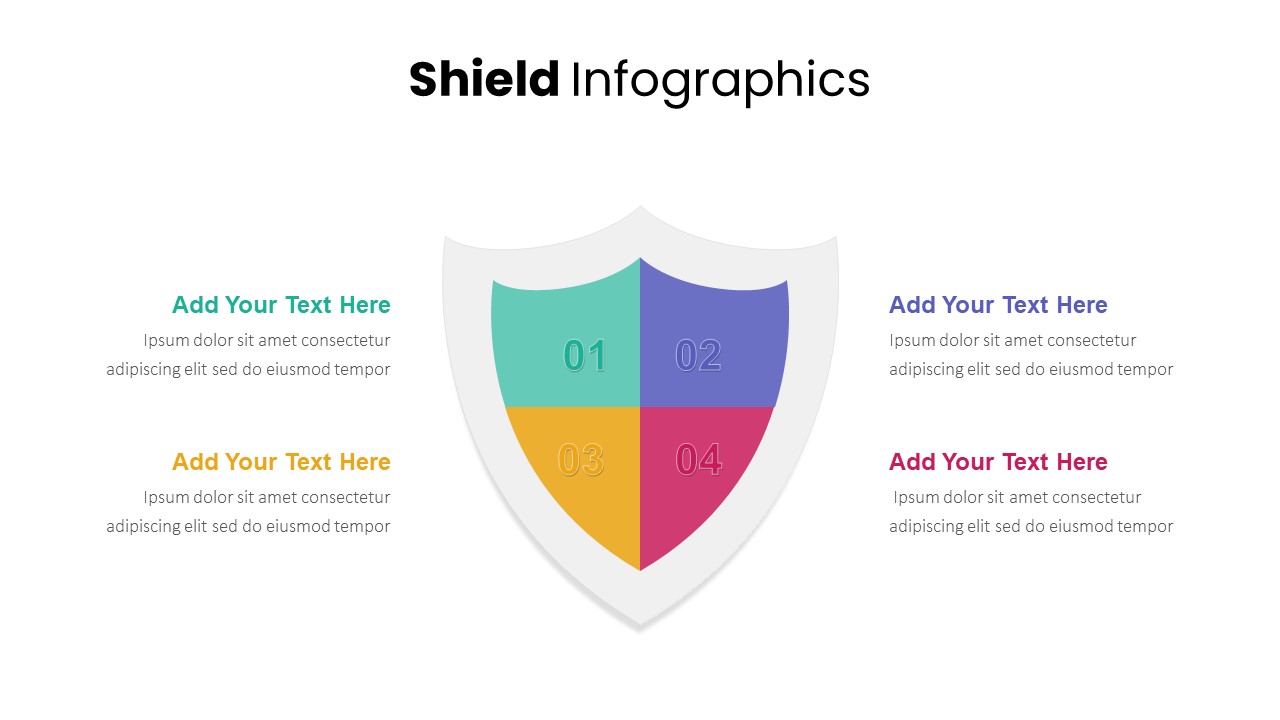
Shield Infographics Four-Part Framework Template for PowerPoint & Google Slides
Process
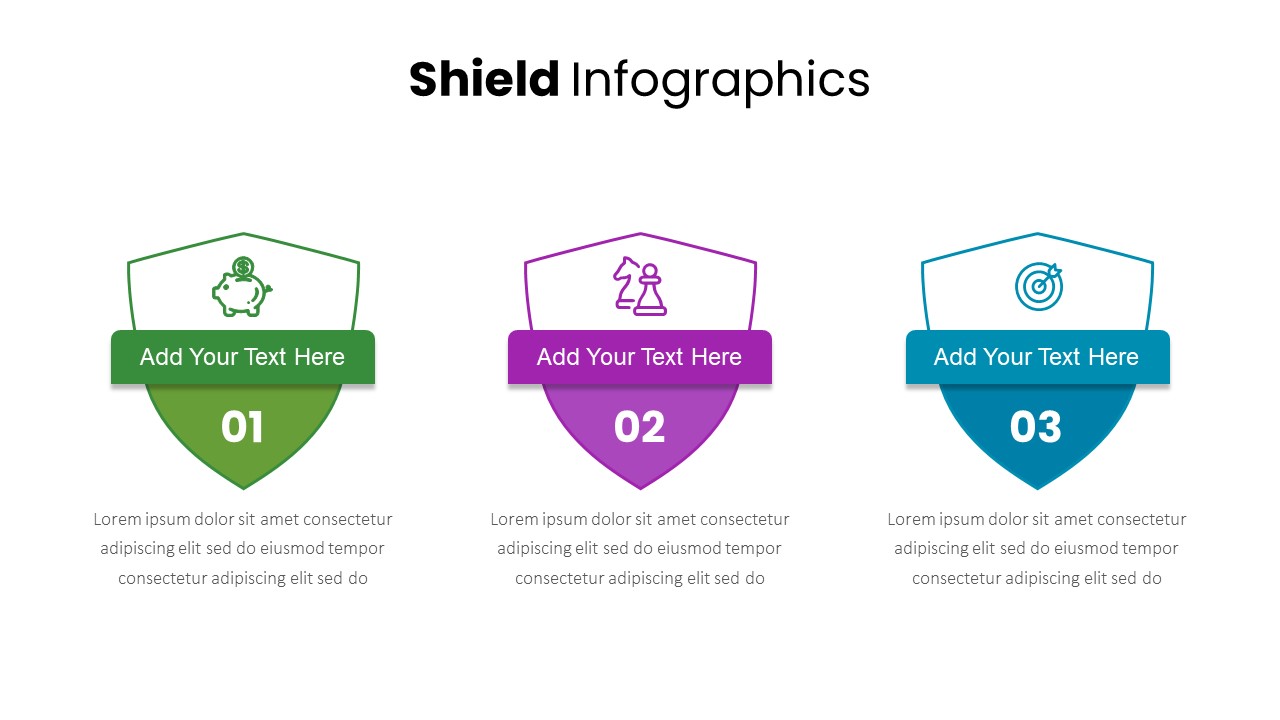
Three-Part Shield Infographics Template for PowerPoint & Google Slides
Comparison
Steps Infographics Template for PowerPoint & Google Slides
Decks
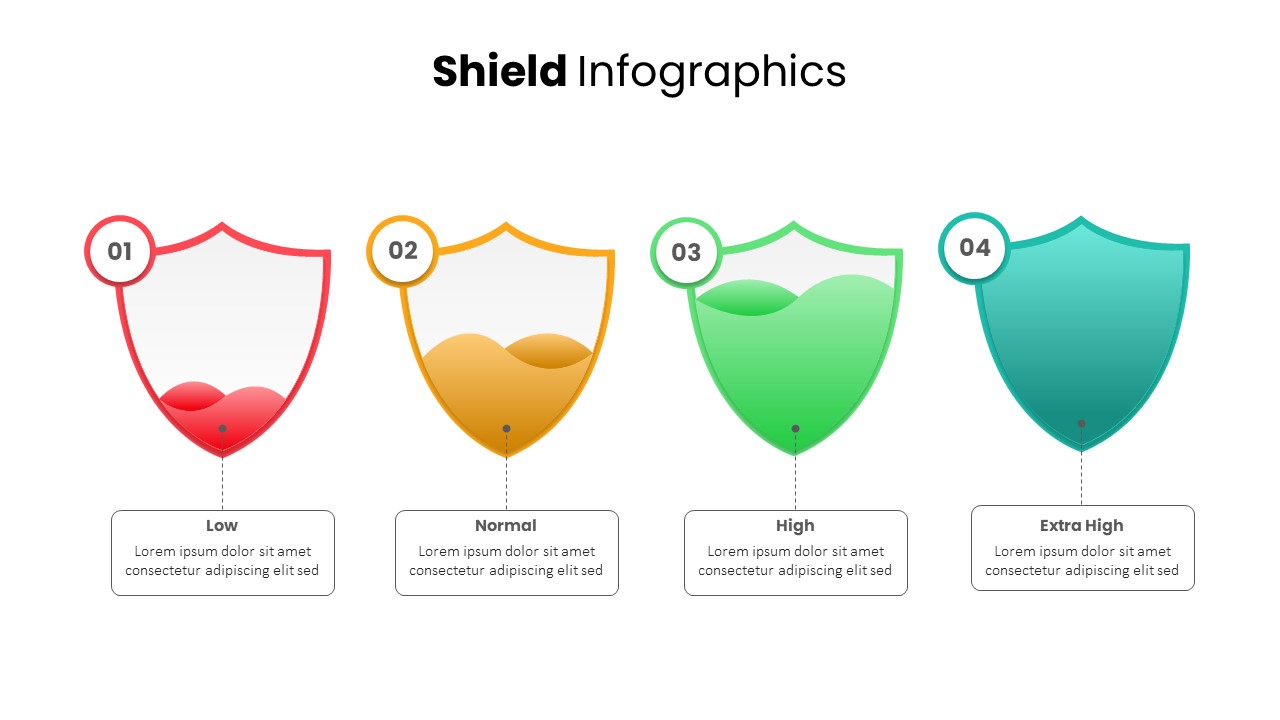
Shield Infographics Risk Indicators Template for PowerPoint & Google Slides
Infographics
DevOps Infographics & Process Flow Template for PowerPoint & Google Slides
Information Technology
Surgery Infographics Comparison Template for PowerPoint & Google Slides
Health
Free Roadmap Infographics Pack Template for PowerPoint & Google Slides
Pitch Deck
Free
Free Colorful Timeline Infographics Template for PowerPoint & Google Slides
Timeline
Free
Banking Service & Finance Infographics Template for PowerPoint & Google Slides
Finance
Free
5 Styles Key Outcomes Infographics Pack Template for PowerPoint & Google Slides
Infographics
Looking Ahead 3-Slide Infographics Pack Template for PowerPoint & Google Slides
Business
Technology Tree Infographics Template for PowerPoint & Google Slides
AI
Mental Health Infographics Template for PowerPoint & Google Slides
Health