Timeline Infographic Steps template for PowerPoint & Google Slides


Description
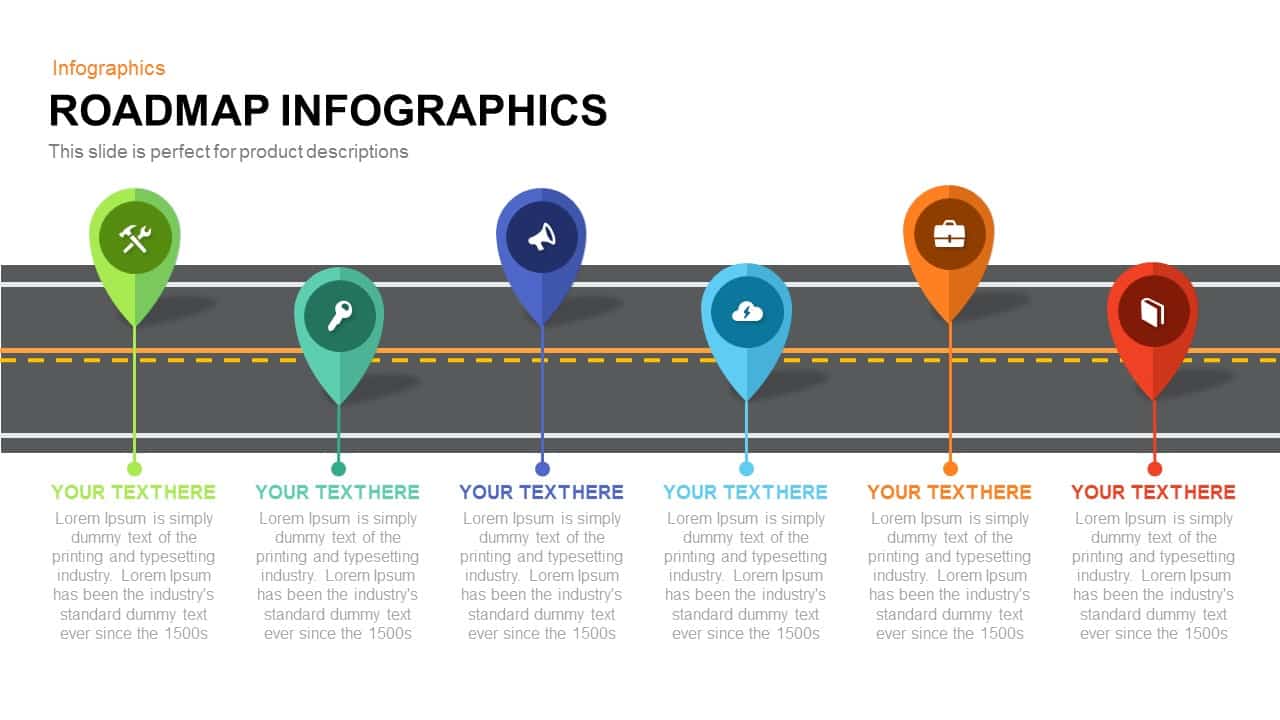
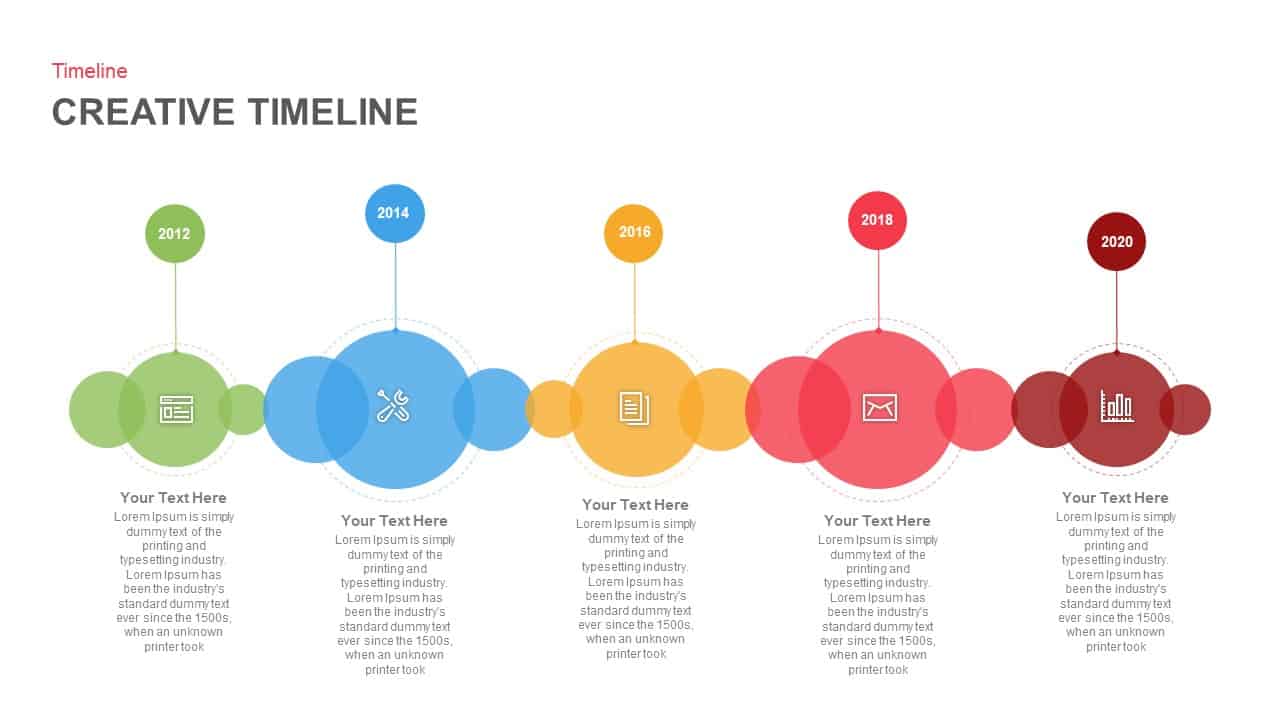
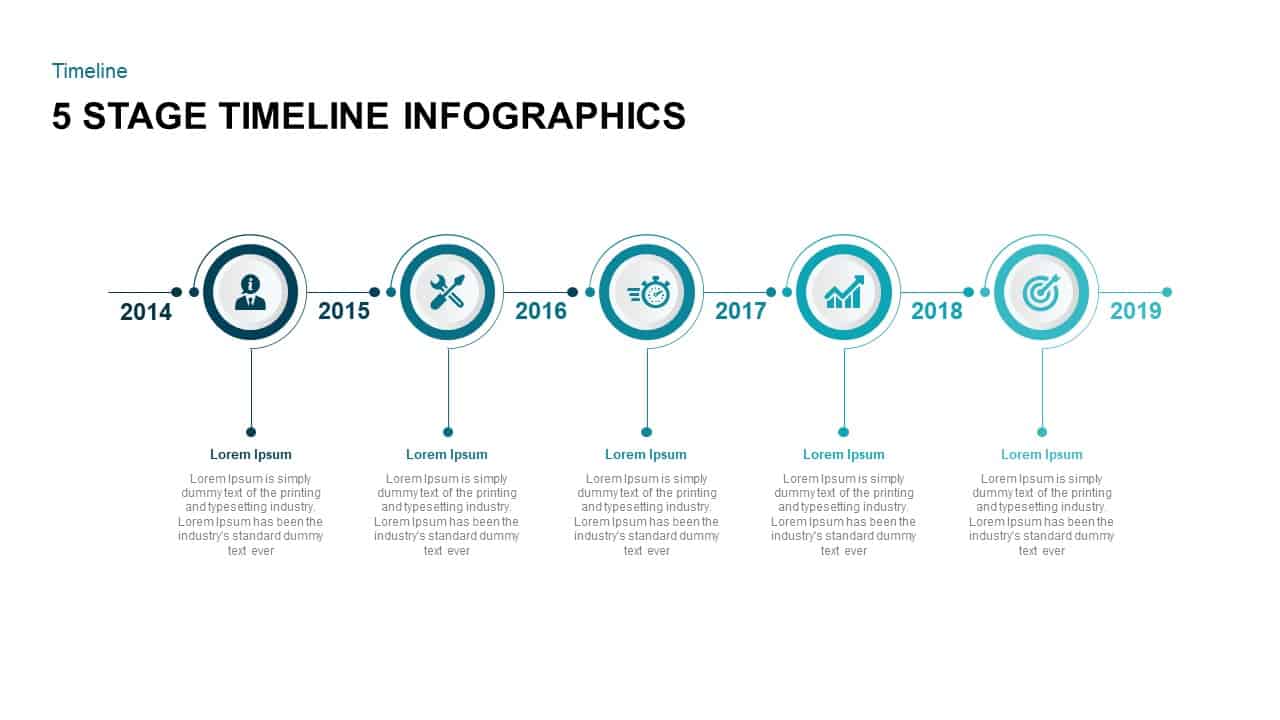
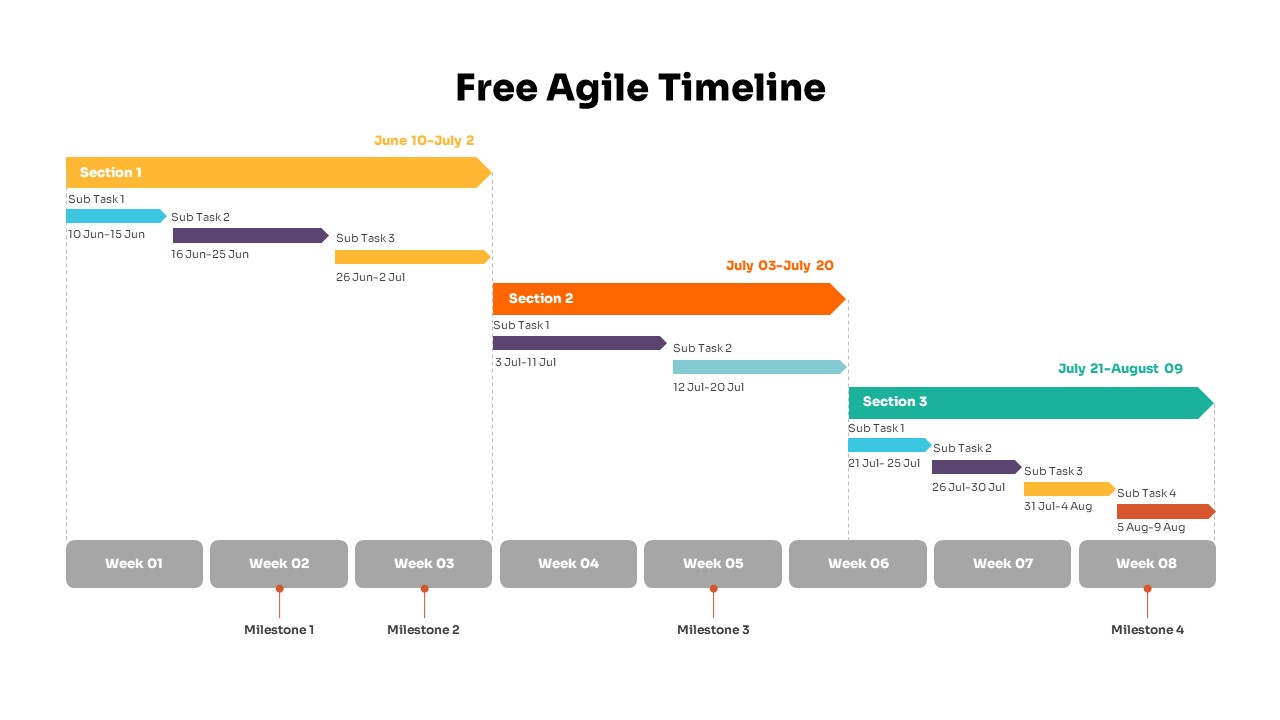
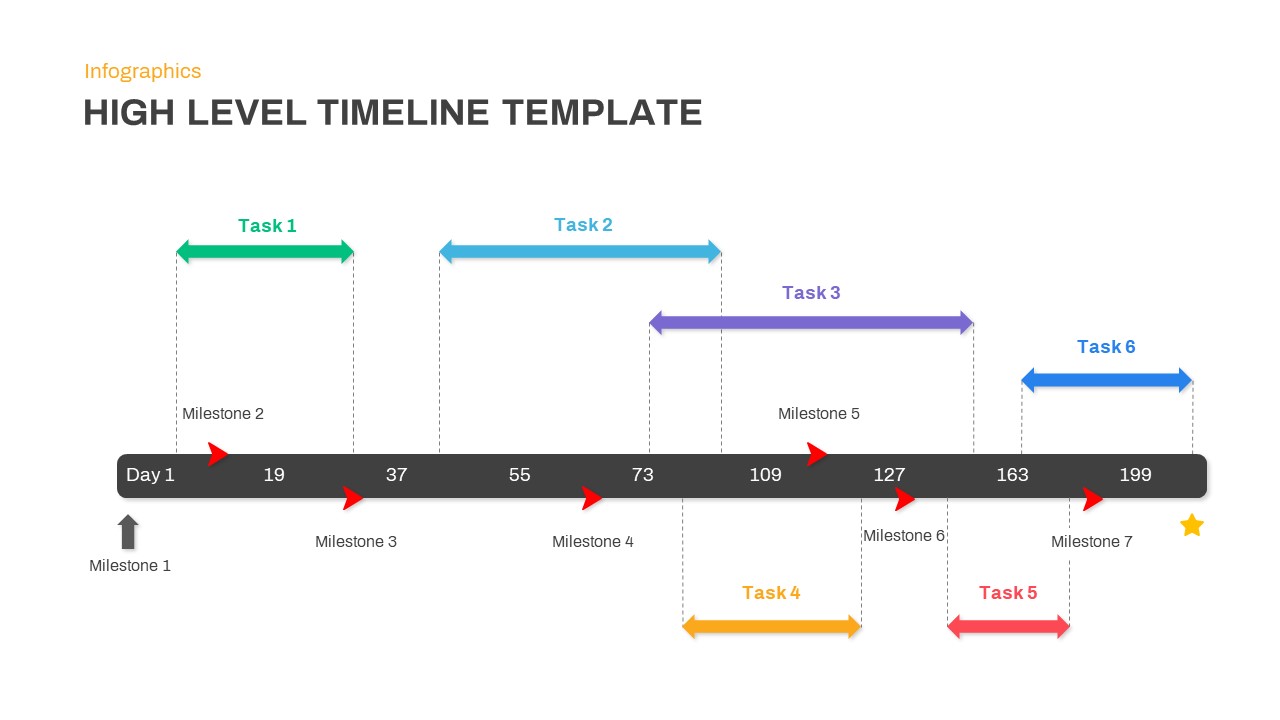
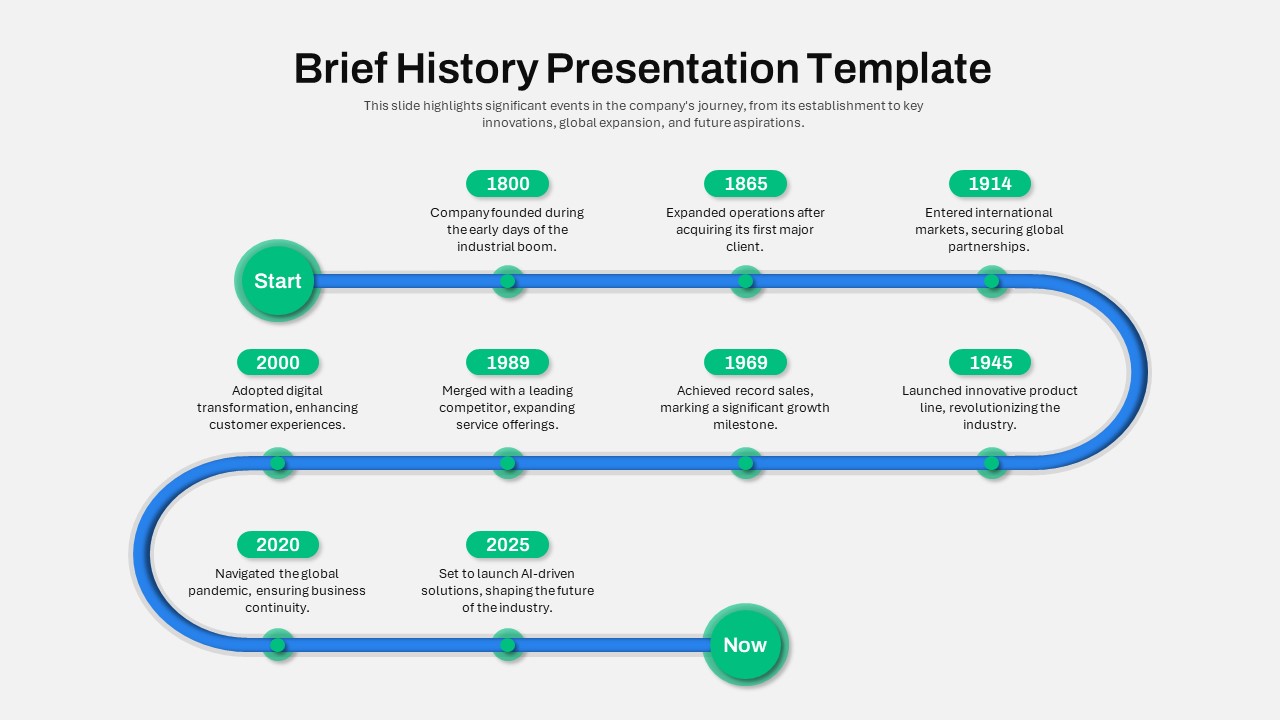
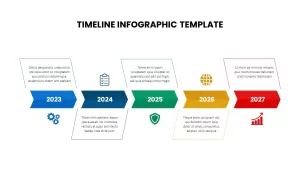
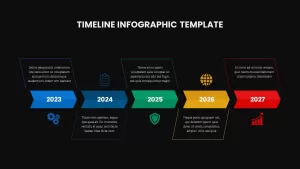
This Timeline Infographic slide offers a visually engaging way to present key milestones and events over a period of time. The design divides the timeline into distinct sections for each year, spanning from 2023 to 2027, with color-coded arrows (blue, green, yellow, and red) to guide the viewer’s attention along the timeline. Each year is paired with an icon representing a specific milestone—gears for 2023, checklist for 2024, shield for 2025, globe for 2026, and growth chart for 2027—making the timeline not only functional but visually appealing.
The clean, modern design allows for easy customization of text, making it perfect for showcasing project plans, business strategies, or company milestones. Whether you’re planning a product launch, tracking progress toward a goal, or outlining future initiatives, this slide is designed to convey information clearly and effectively. The icons, along with the vibrant colors, help to visually differentiate each year, making it easier for your audience to follow the progression of events.
This template is optimized for both PowerPoint and Google Slides, ensuring a seamless experience across devices without any formatting issues. The design is fully editable, so you can easily adjust the text and colors to match your branding or presentation style.
Who is it for
Project managers, business leaders, marketing teams, and strategic planners can use this timeline infographic to present a clear progression of events or milestones. It’s also perfect for educators, consultants, and anyone needing to visualize a sequence of important dates or goals.
Other Uses
This slide can be adapted to represent product development timelines, business growth plans, project roadmaps, or even educational curriculums. It can also be used to showcase historical events, trends, or any other linear progression of key data points.
Login to download this file

Item ID
SB02564
Related Templates

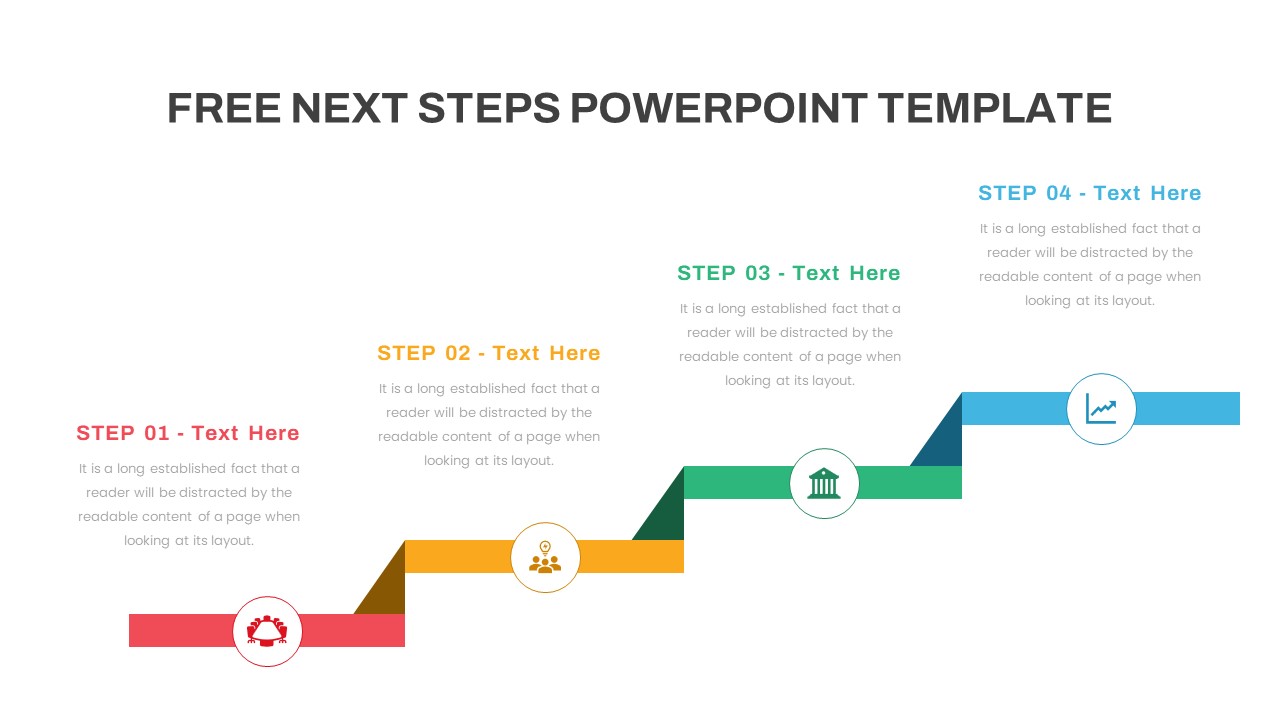
Free Next Steps Process Timeline Template for PowerPoint & Google Slides
Project
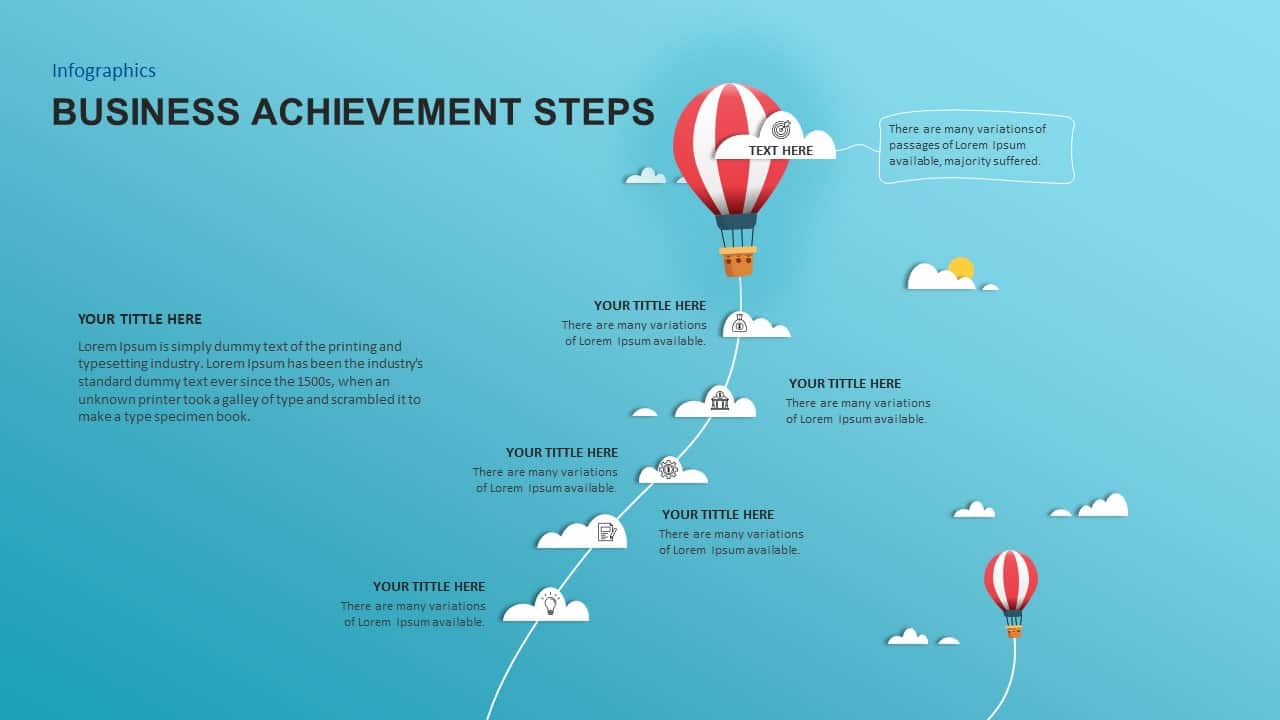
Business Achievement Steps Infographic template for PowerPoint & Google Slides
Process
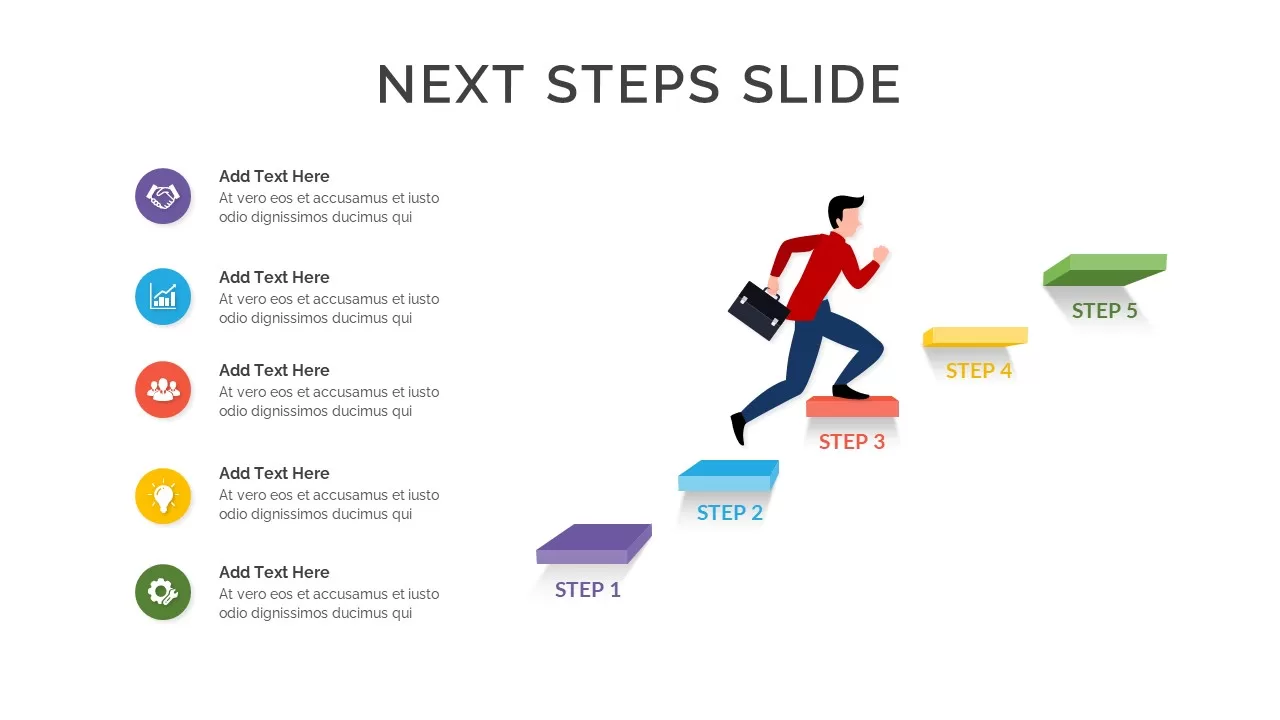
Next Steps Infographic template for PowerPoint & Google Slides
Infographics
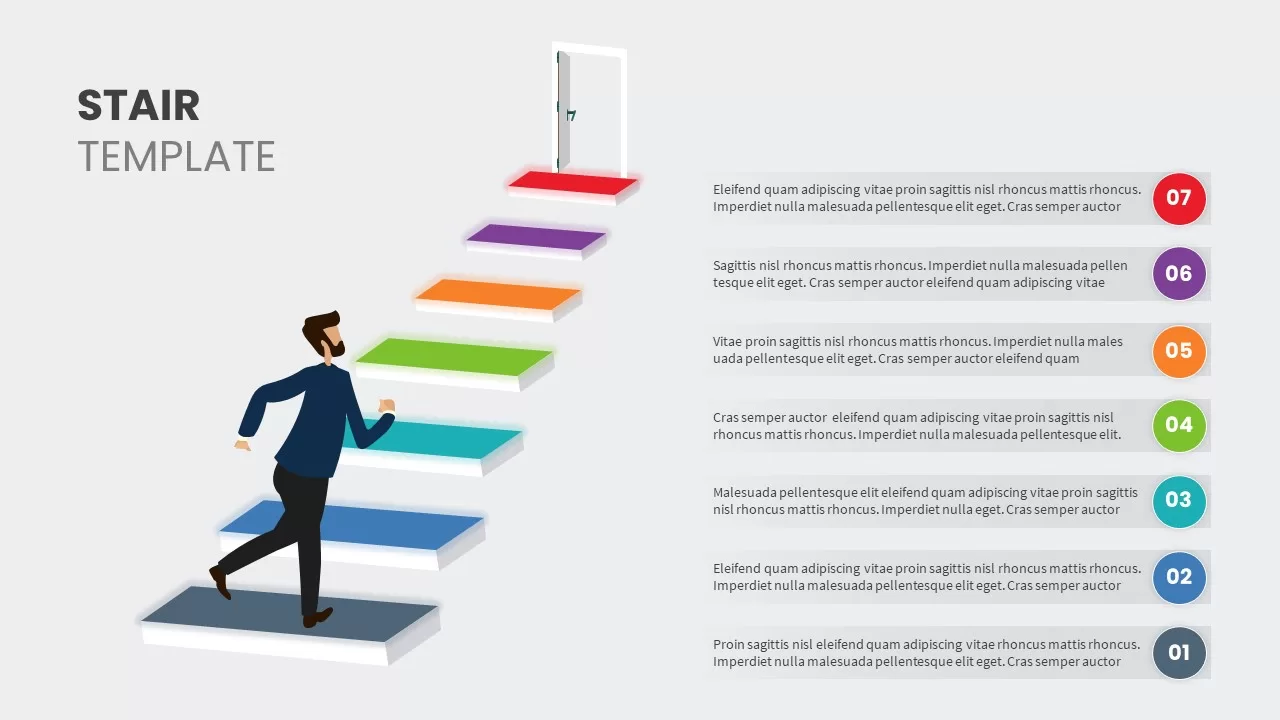
Stair and Steps Infographic Template for PowerPoint & Google Slides
Process
Isometric Block Infographic Steps Template for PowerPoint & Google Slides
Process
Isometric Block Steps Infographic Template for PowerPoint & Google Slides
Process
Modern Shield Infographic Steps Template for PowerPoint & Google Slides
Process
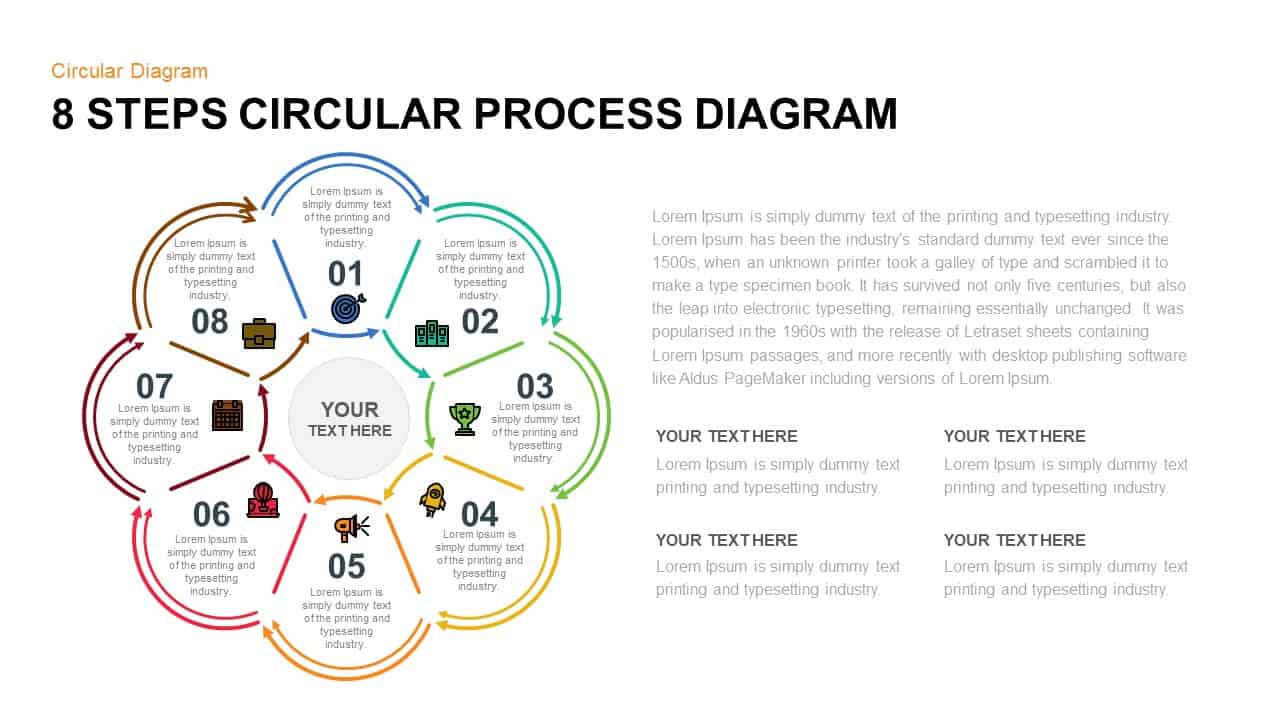
8 Steps Circular Process Diagram Template for PowerPoint & Google Slides
Process
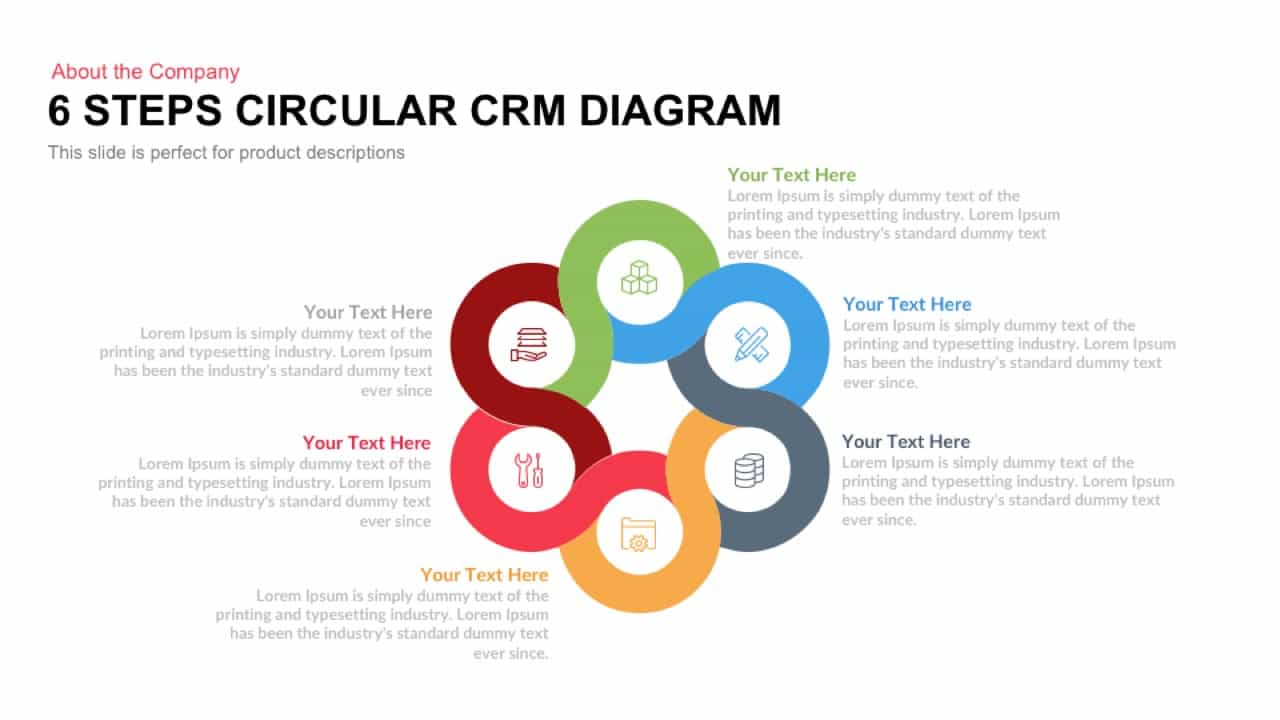
Six Steps Circular CRM Diagram Template for PowerPoint & Google Slides
Customer Journey
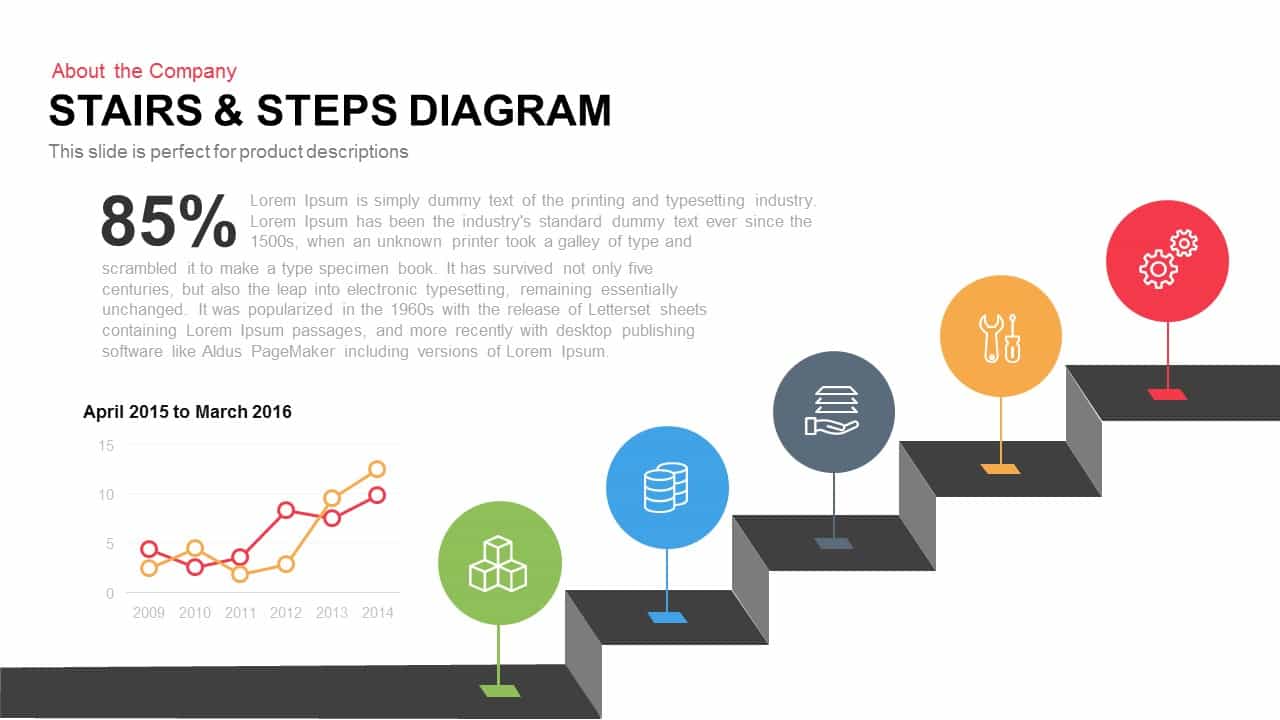
Stairs & Steps Process Diagram template for PowerPoint & Google Slides
Process

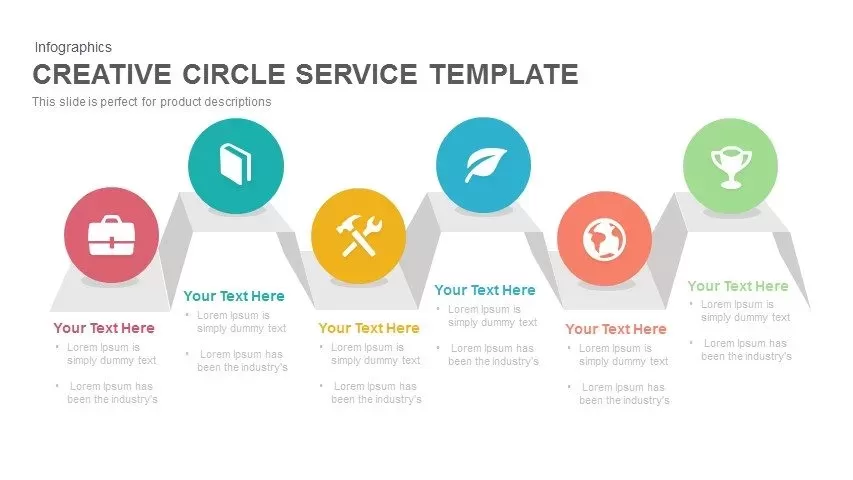
Creative Zigzag Circle Service Steps Template for PowerPoint & Google Slides
Process

8 Steps Arrow Process Diagram template for PowerPoint & Google Slides
Process
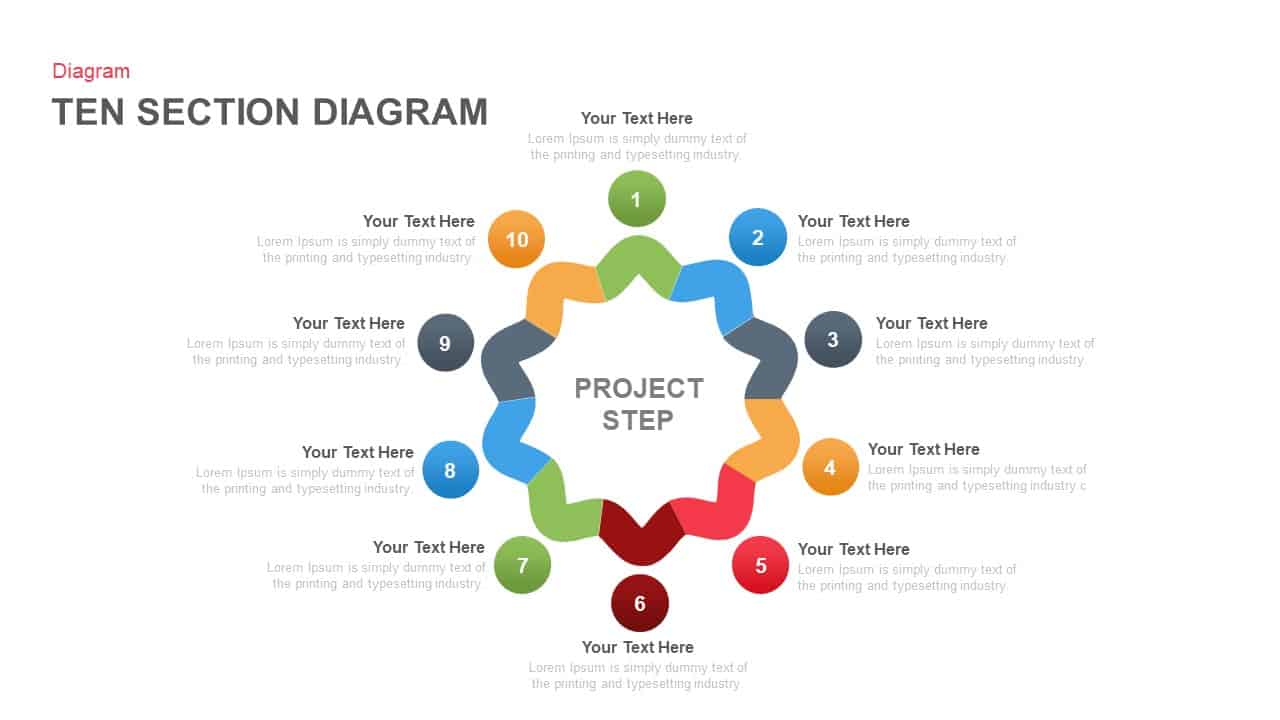
Ten-Section Project Steps Diagram Template for PowerPoint & Google Slides
Process
8 Steps Circular Process Diagram Template for PowerPoint & Google Slides
Circular
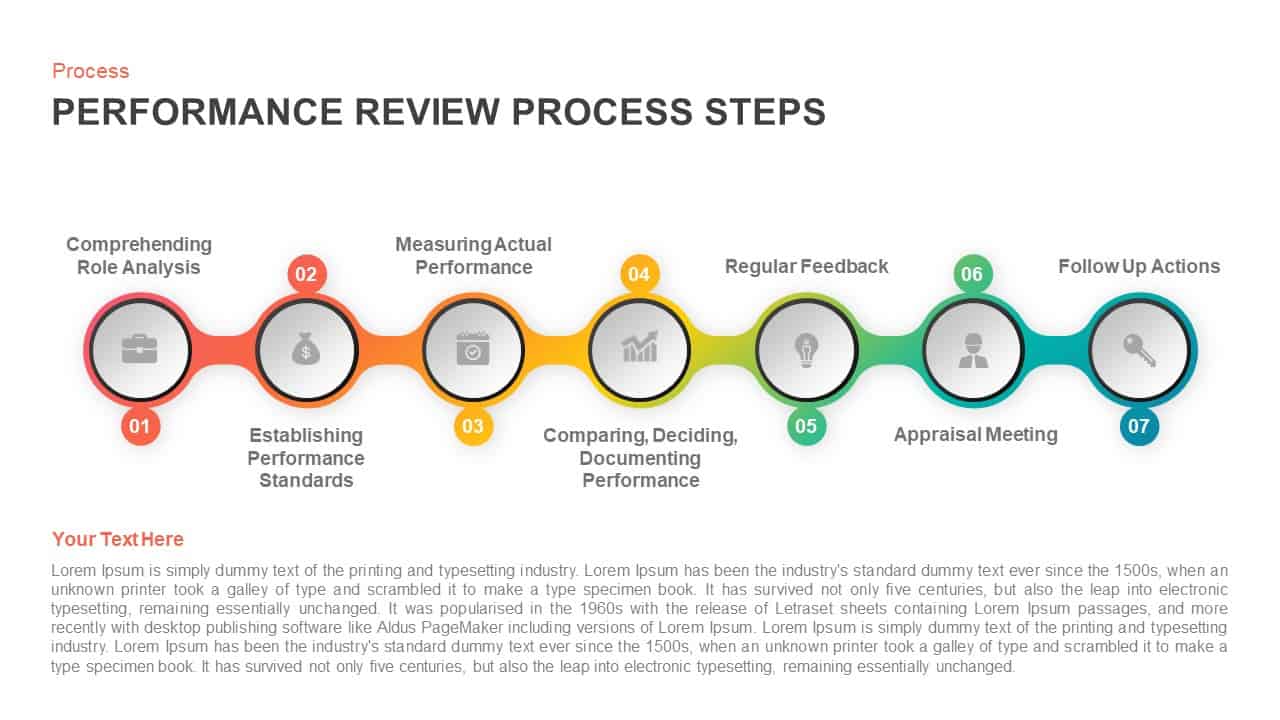
Performance Review Process Steps Template for PowerPoint & Google Slides
Employee Performance
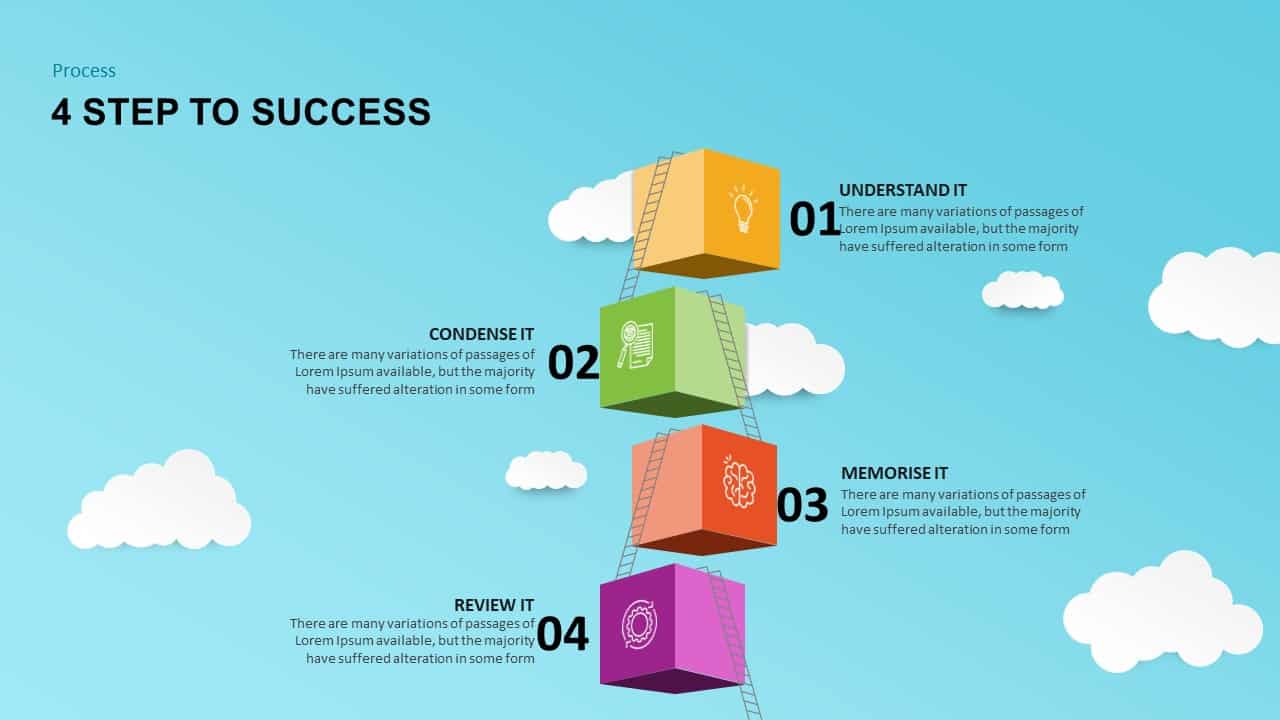
4 Steps to Success Process template for PowerPoint & Google Slides
Process
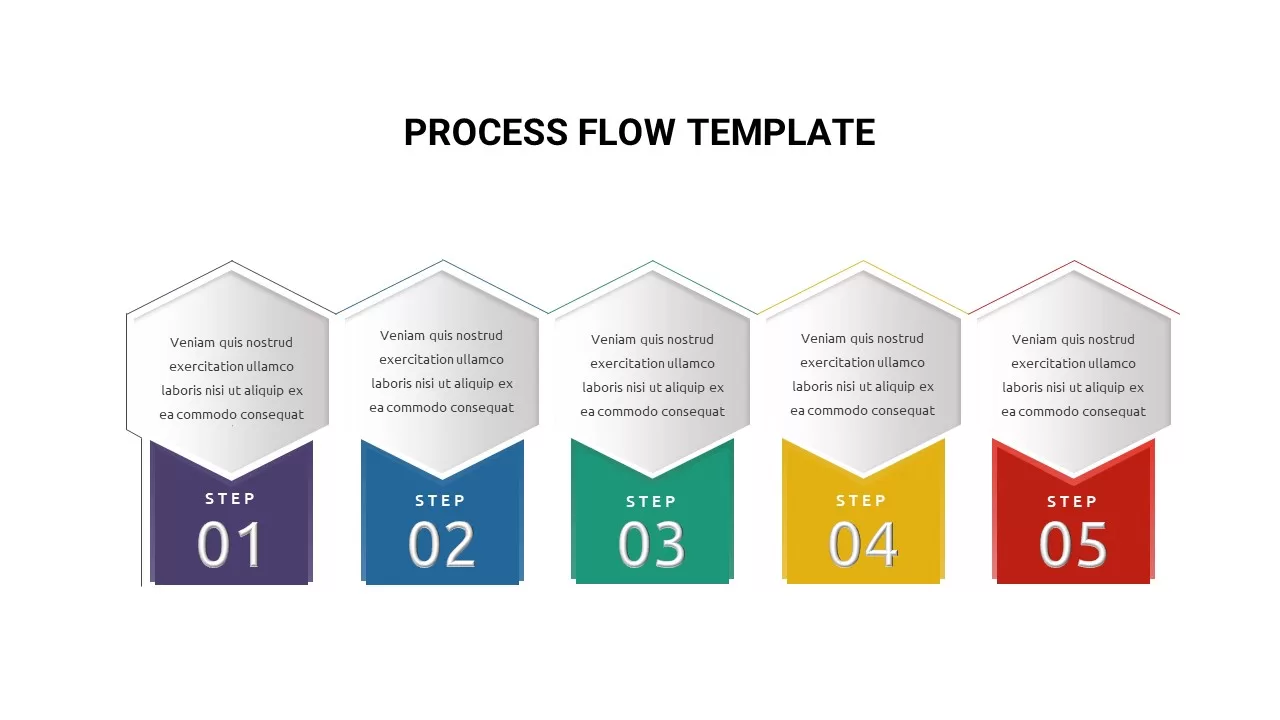
Process Flow Steps template for PowerPoint & Google Slides
Business Plan
Colorful Arrow Methodology Steps Template for PowerPoint & Google Slides
Process
Sales Playbook Process Steps Diagram Template for PowerPoint & Google Slides
Marketing

Steps Infographics Template for PowerPoint & Google Slides
Decks
Road Flowchart Process with Four Steps Template for PowerPoint & Google Slides
Flow Charts
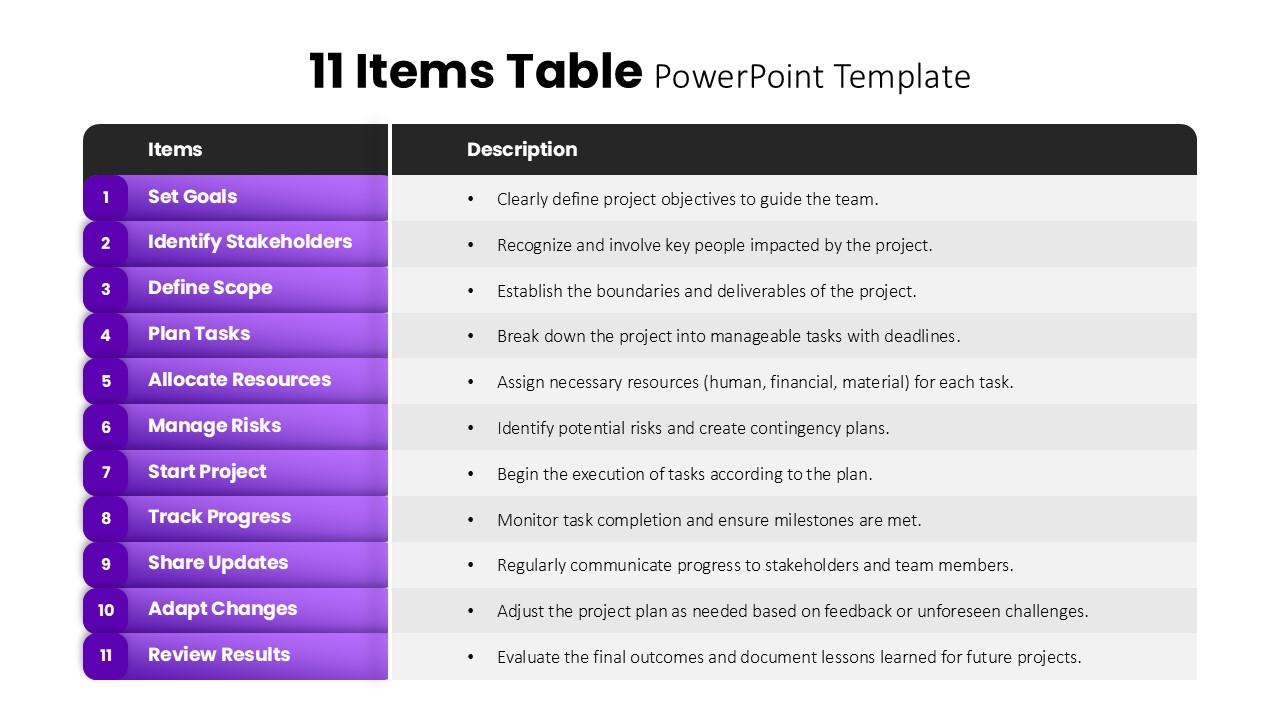
11 Items Table Project Planning Steps template for PowerPoint & Google Slides
Business
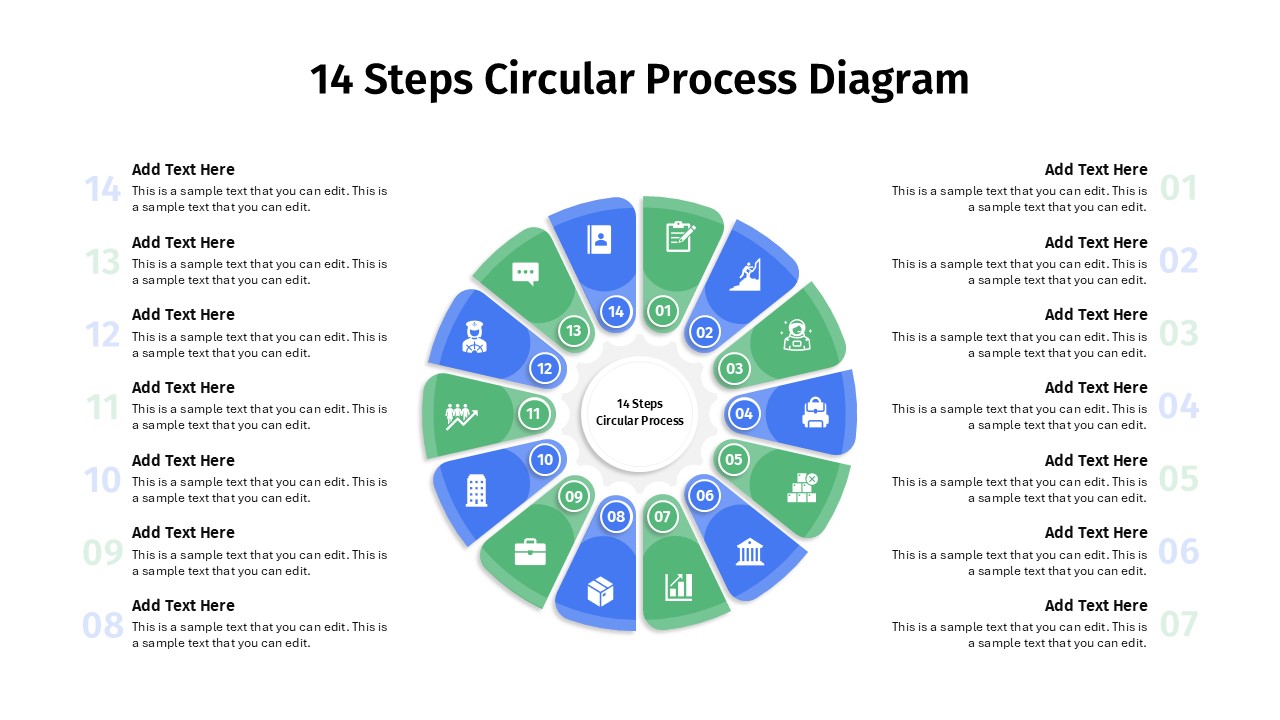
14 Steps Circular Process Diagram Template for PowerPoint & Google Slides
Circular
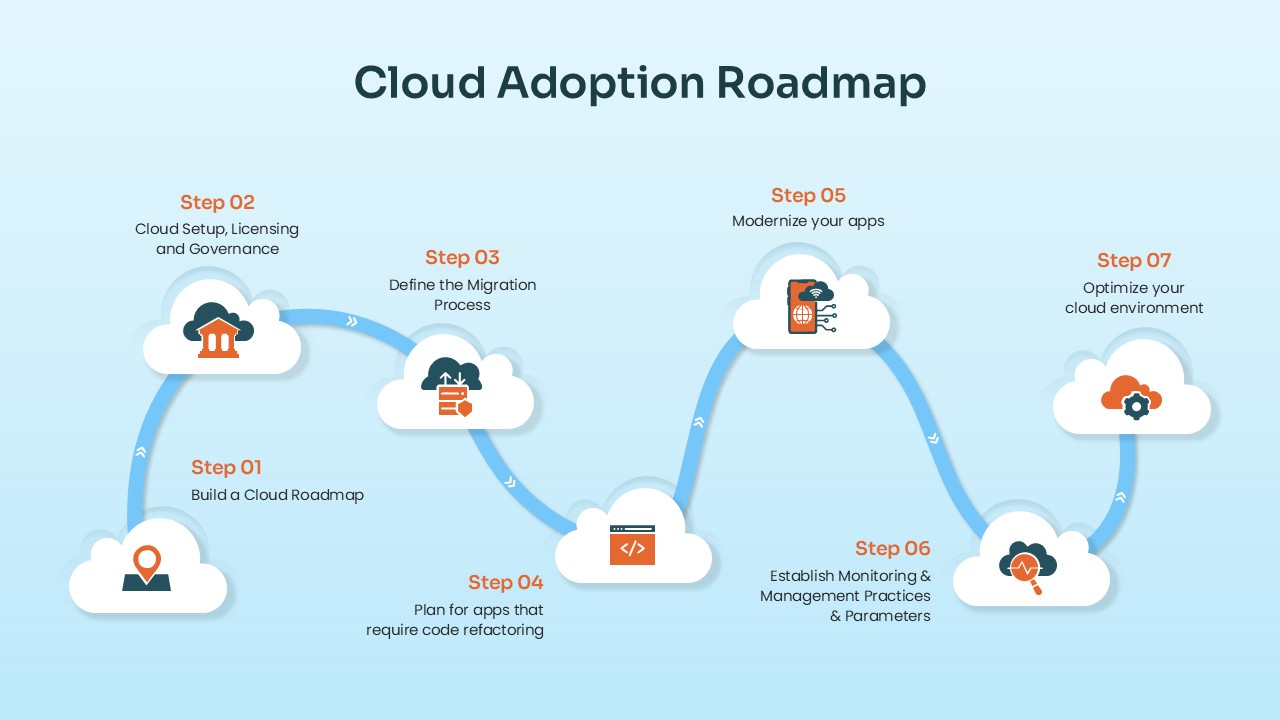
Cloud Adoption Roadmap Steps template for PowerPoint & Google Slides
Cloud Computing
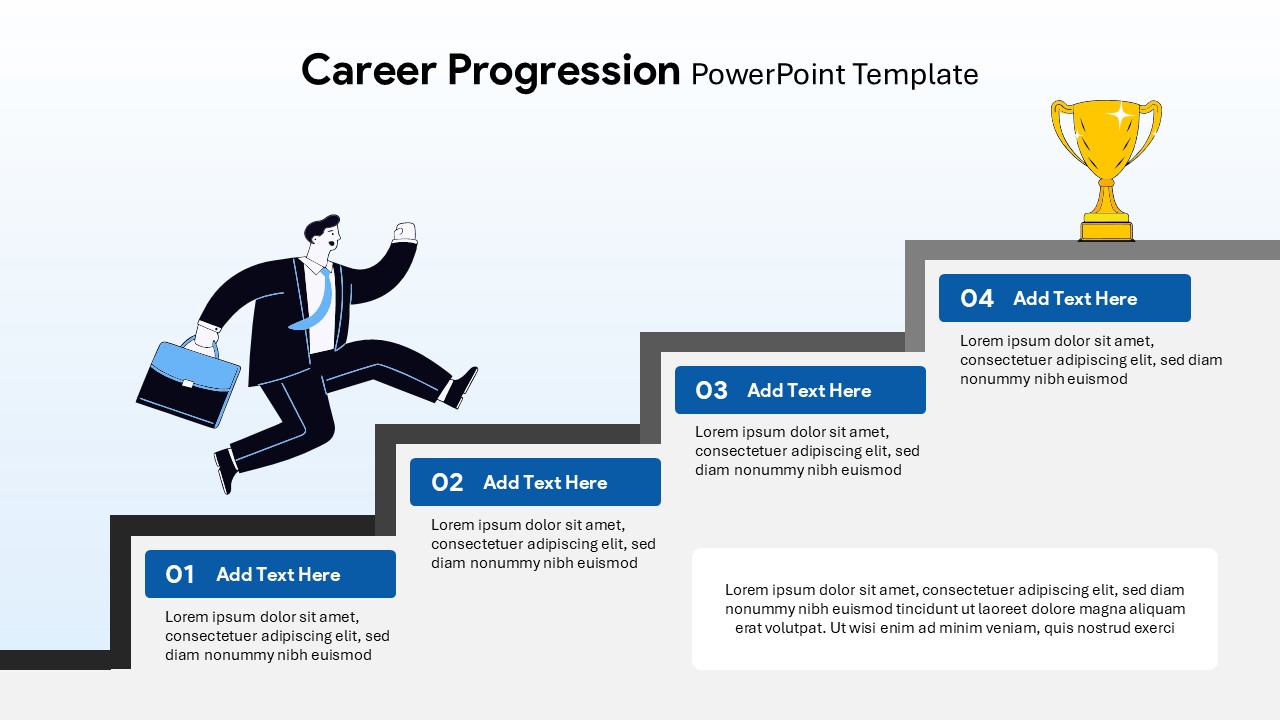
Career Progression Steps Template for PowerPoint & Google Slides
Employee Performance
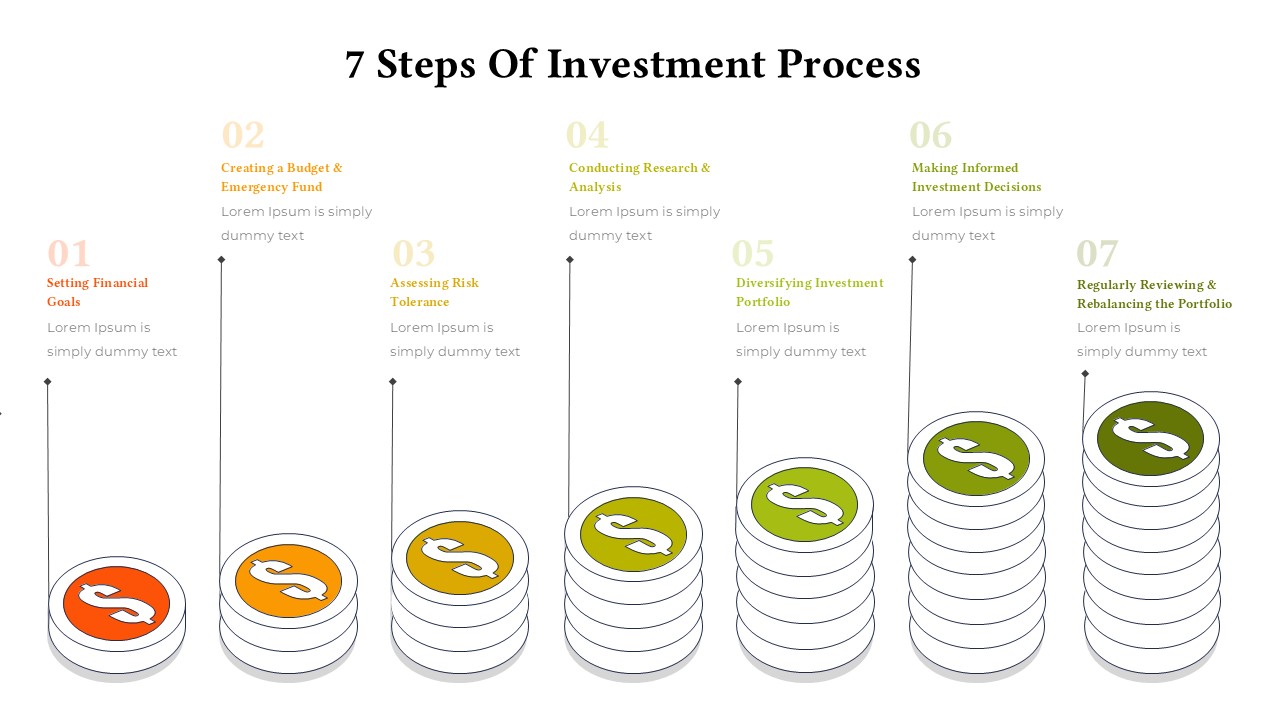
7 Steps of Investment Process Template for PowerPoint & Google Slides
Finance
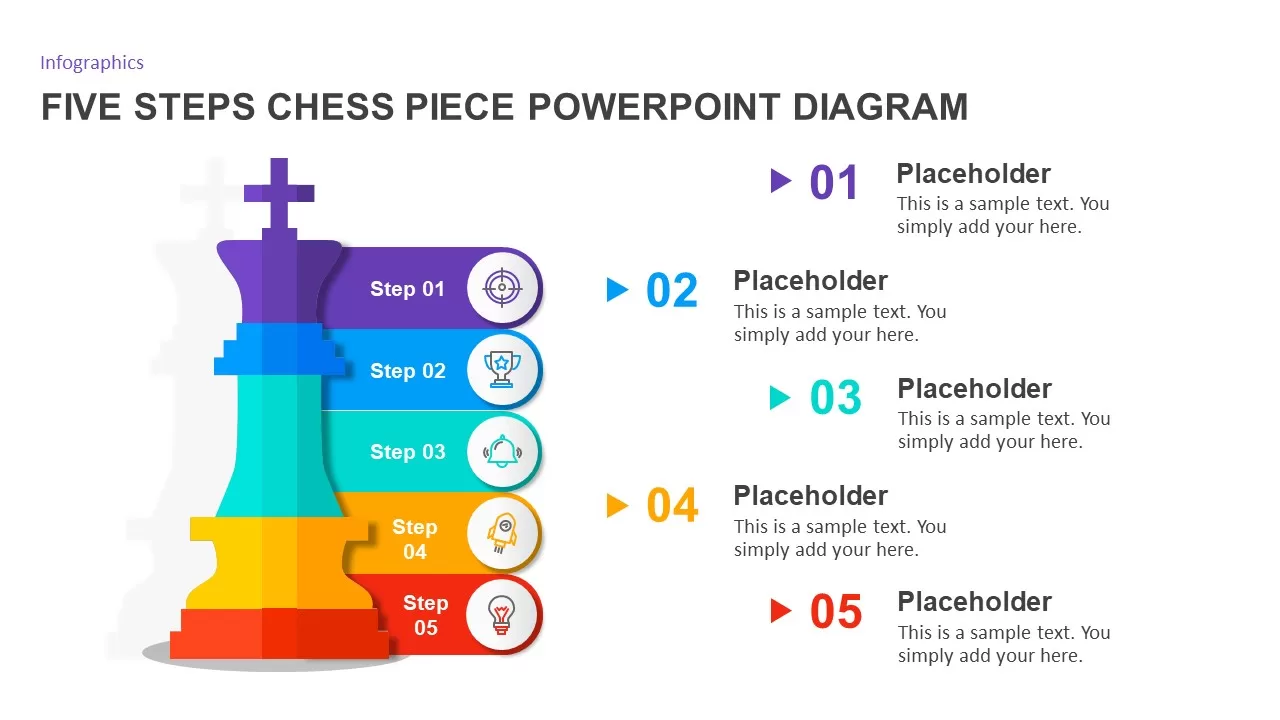
Five Steps Chess Piece Diagram for PowerPoint & Google Slides
Process
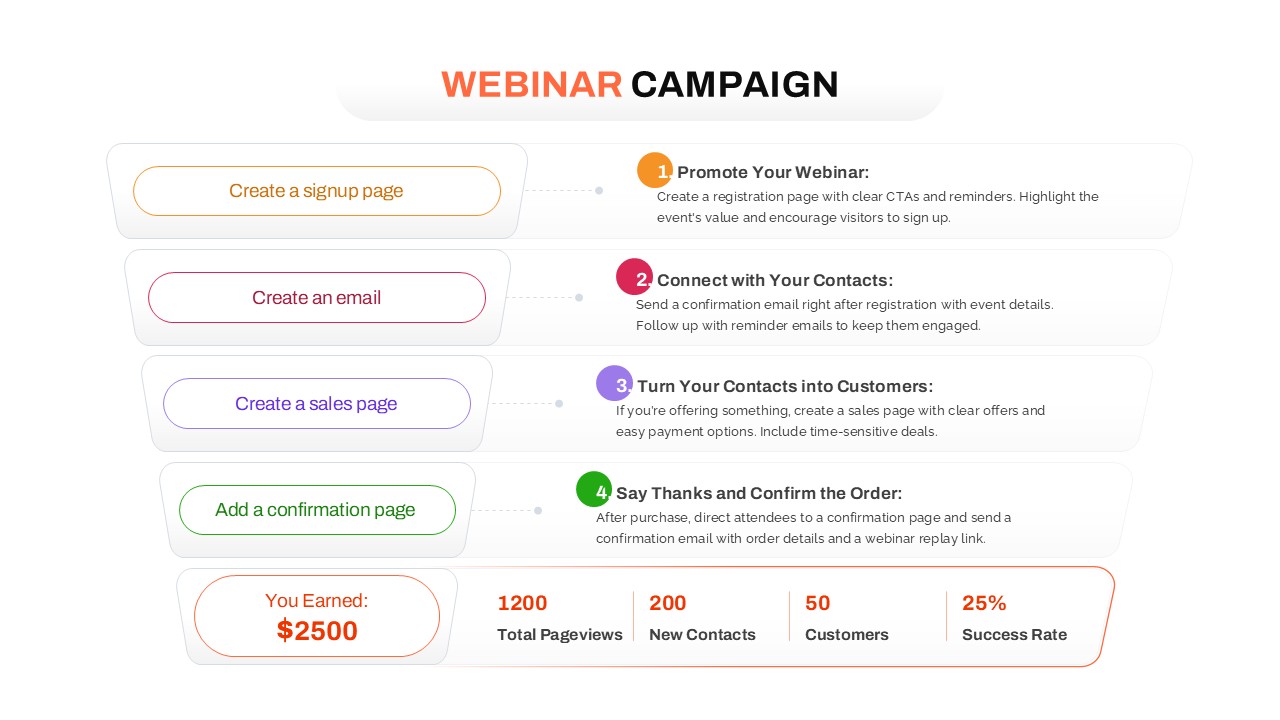
Webinar Campaign Steps and Performance for PowerPoint & Google Slides
Advertising
7-Stage Colorful Timeline Infographic Template for PowerPoint & Google Slides
Timeline
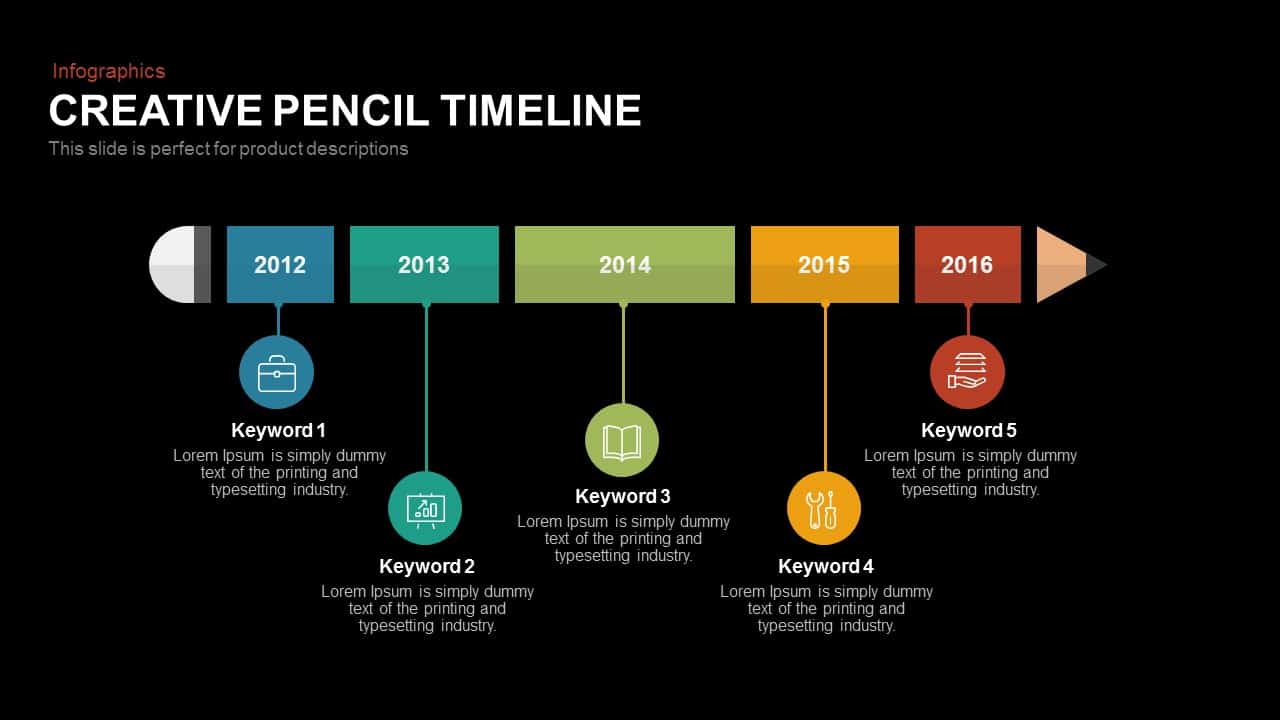
Creative Pencil Timeline Infographic Template for PowerPoint & Google Slides
Timeline
Three Four Five Stage Timeline Infographic Template for PowerPoint & Google Slides
Timeline
Curved Five-Section Timeline Infographic template for PowerPoint & Google Slides
Timeline
Curved Road Map Timeline Infographic Template for PowerPoint & Google Slides
Roadmap
Roadmap Infographic Timeline Slide Template for PowerPoint & Google Slides
Roadmap
Horizontal Timeline Infographic Template for PowerPoint & Google Slides
Timeline
Professional Linear Timeline Infographic Template for PowerPoint & Google Slides
Timeline
Six-Stage Hexagon Timeline Infographic Template for PowerPoint & Google Slides
Timeline
Medical Stethoscope Timeline Infographic Template for PowerPoint & Google Slides
Timeline
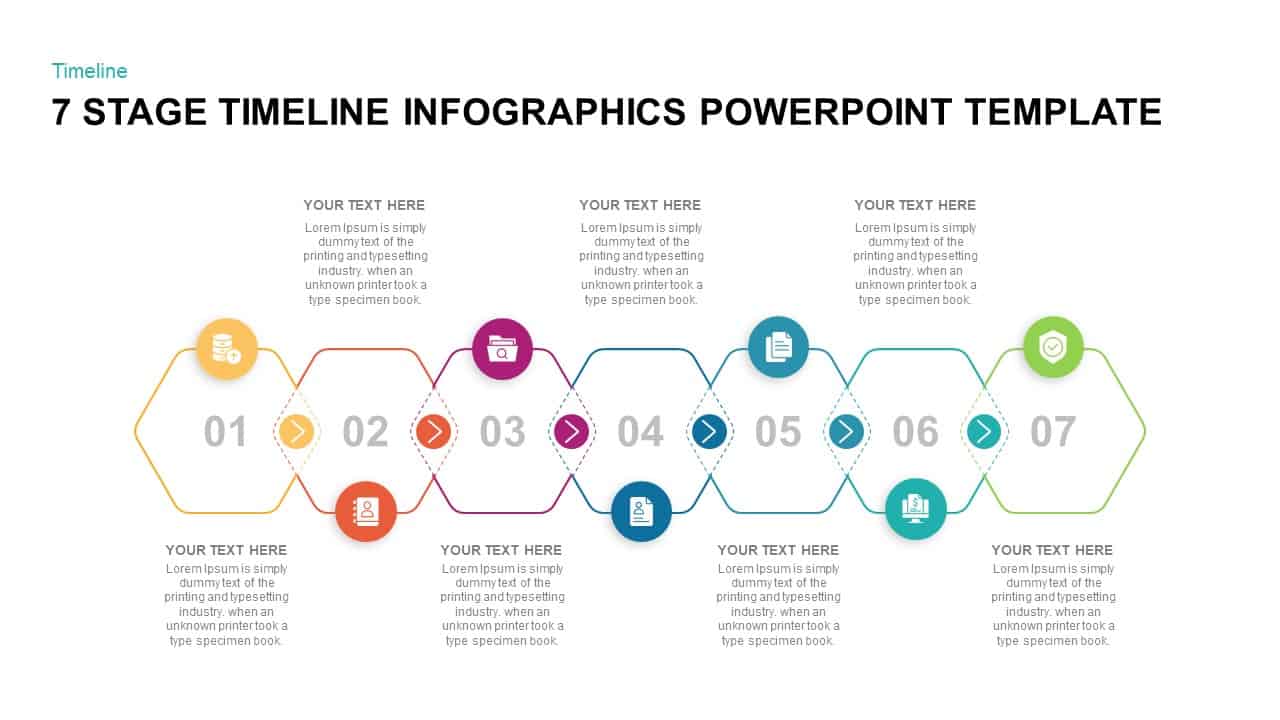
Timeline Infographic Design Seven Stage template for PowerPoint & Google Slides
Timeline

Timeline Roadmap Milestones Infographic Template for PowerPoint & Google Slides
Roadmap
Modern Bubble Timeline Infographic Template for PowerPoint & Google Slides
Timeline
Creative Bubble Timeline Infographic Template for PowerPoint & Google Slides
Timeline
Multi-Year Timeline Infographic Template for PowerPoint & Google Slides
Timeline
Arrow Timeline Infographic Slide Template for PowerPoint & Google Slides
Timeline
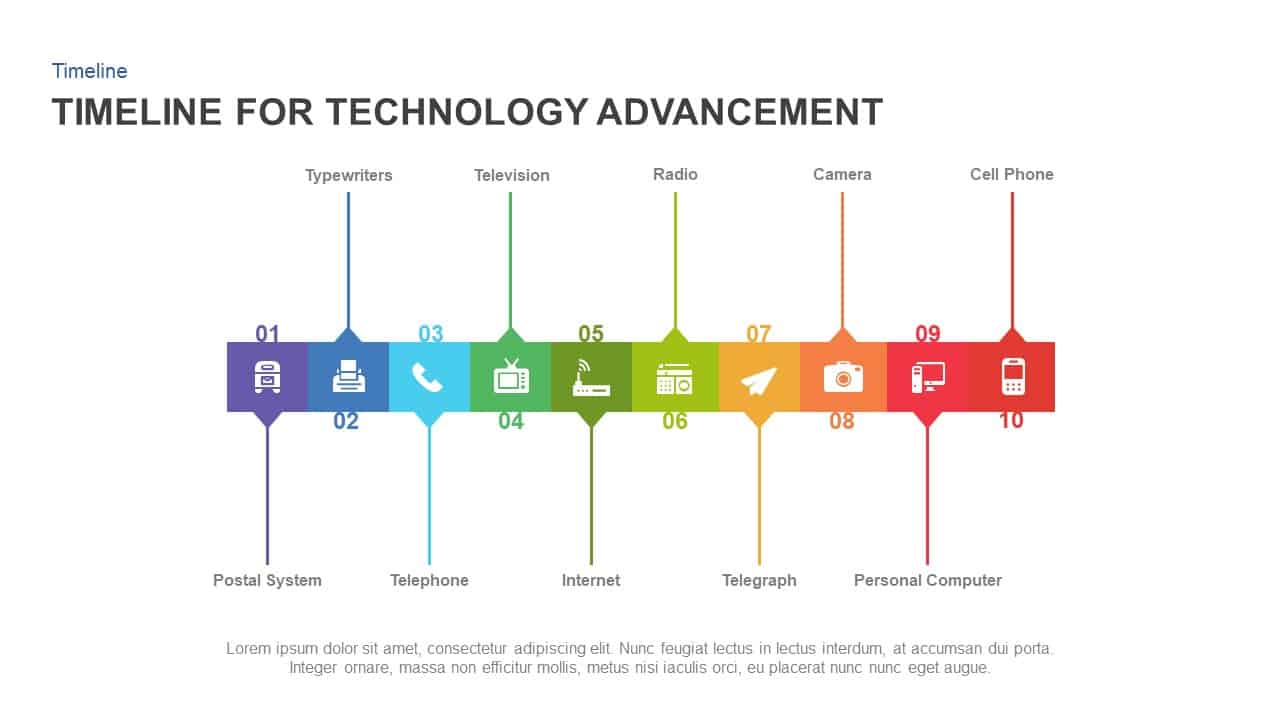
Technology Advancement Timeline Infographic Template for PowerPoint & Google Slides
Information Technology
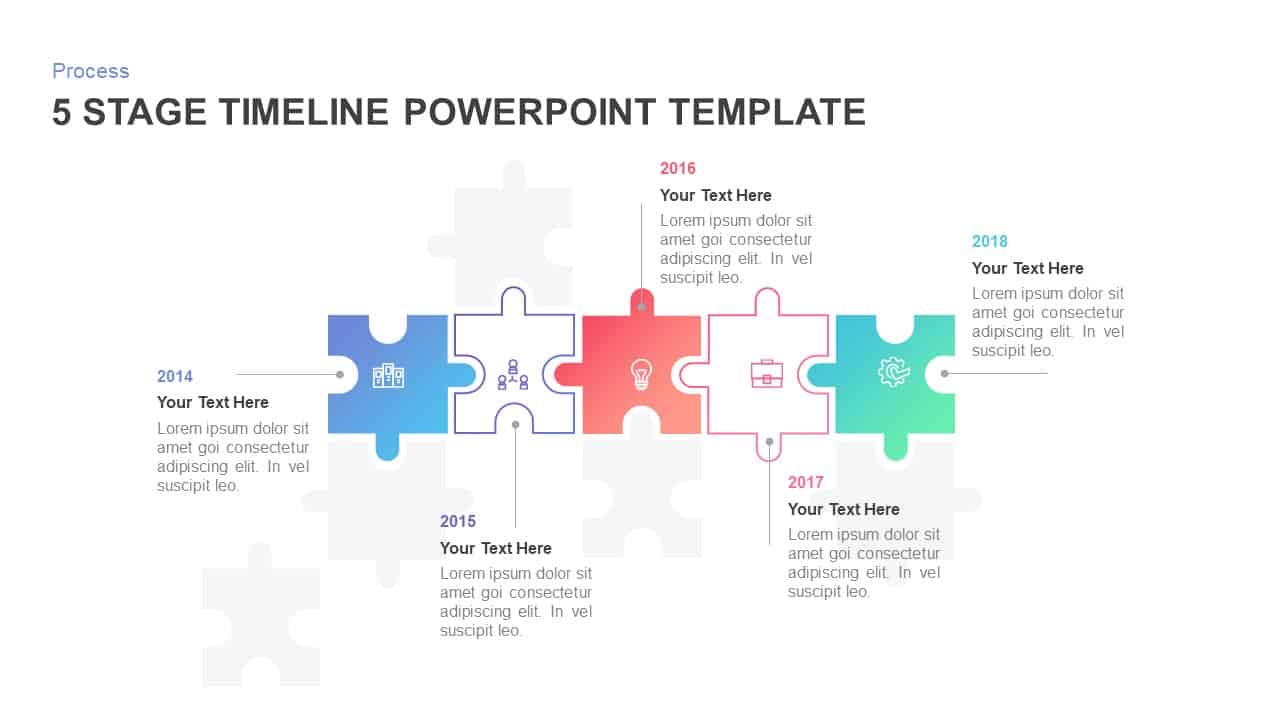
Animated 5-Stage Puzzle Timeline Infographic Template for PowerPoint & Google Slides
Timeline
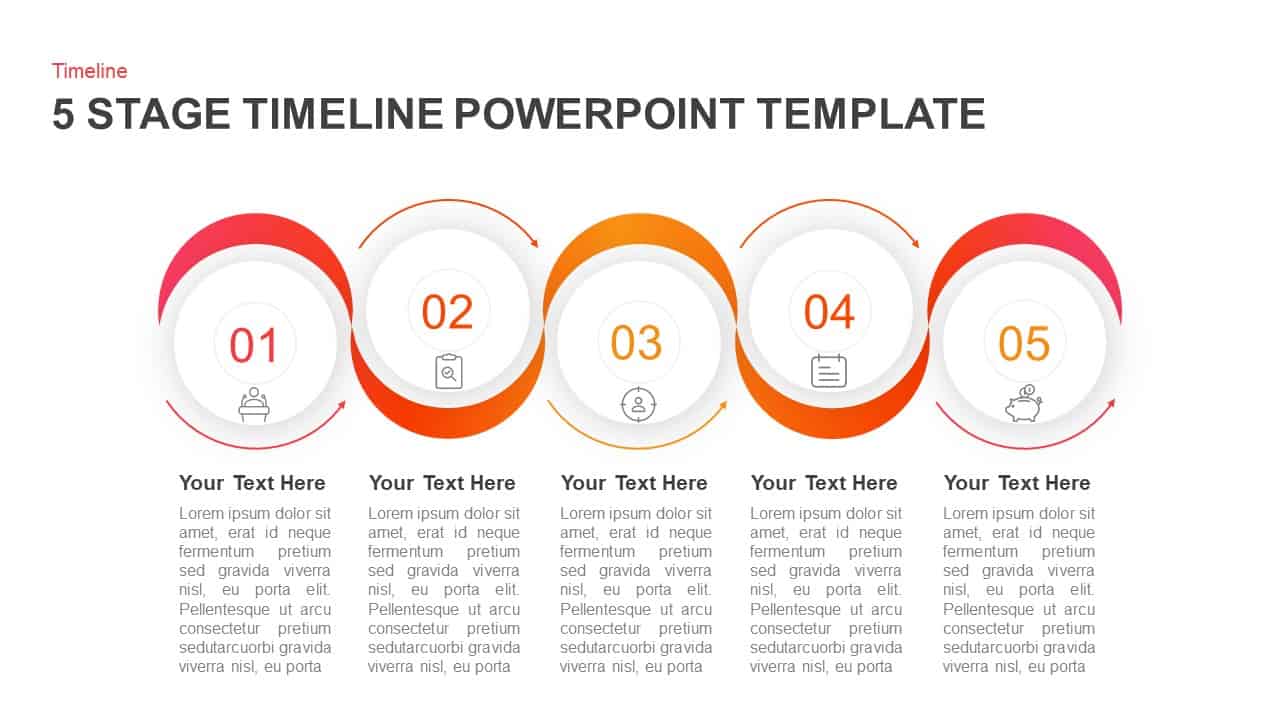
5 Stage Circular Timeline Infographic Template for PowerPoint & Google Slides
Timeline
Six-Stage Timeline Infographic Template for PowerPoint & Google Slides
Timeline
5 Stage Timeline Infographic Slide Template for PowerPoint & Google Slides
Timeline
Five-Year Gradient Timeline Infographic Template for PowerPoint & Google Slides
Timeline
Five-Step Growth Timeline Infographic Template for PowerPoint & Google Slides
Timeline
Business Timeline Envelope Infographic Template for PowerPoint & Google Slides
Timeline
5-Stage Timeline Infographic Slide Template for PowerPoint & Google Slides
Timeline
Seven-Stage Hexagon Timeline Infographic Template for PowerPoint & Google Slides
Timeline
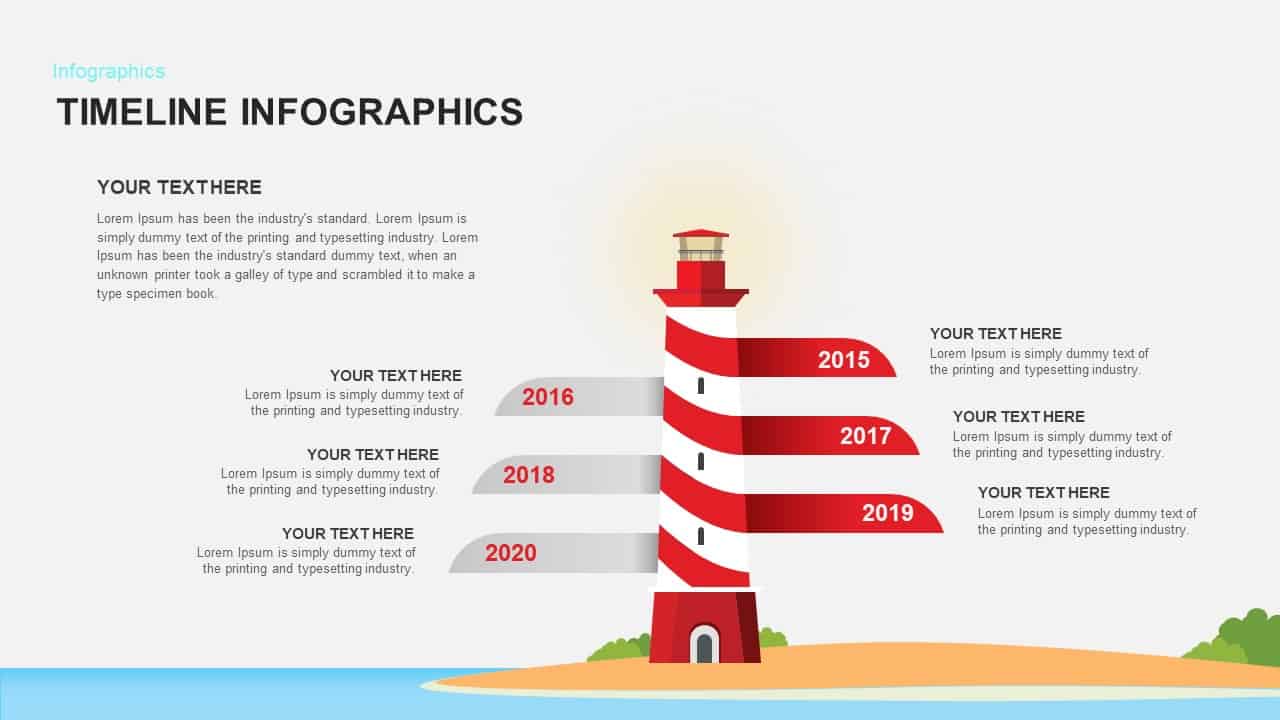
Lighthouse Timeline Infographic Template for PowerPoint & Google Slides
Timeline
Six-Stage Road Map Infographic Timeline Template for PowerPoint & Google Slides
Roadmap
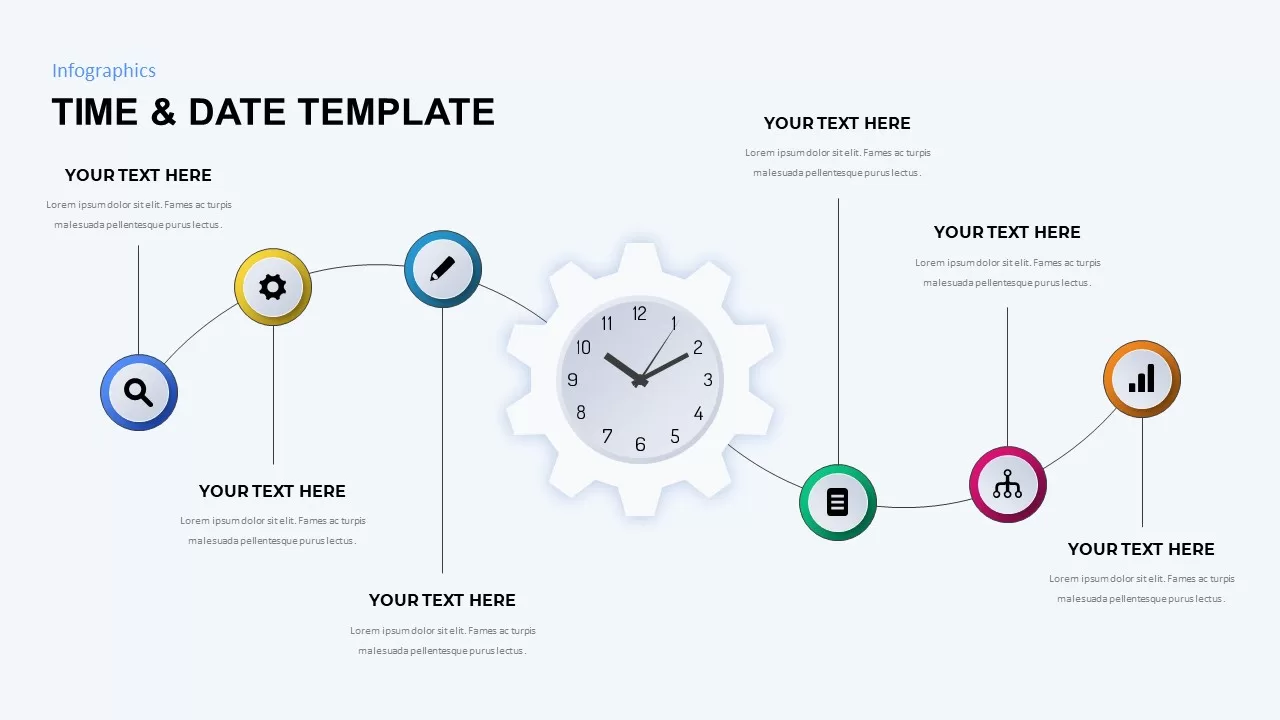
Time & Date Infographic Timeline Template for PowerPoint & Google Slides
Decks
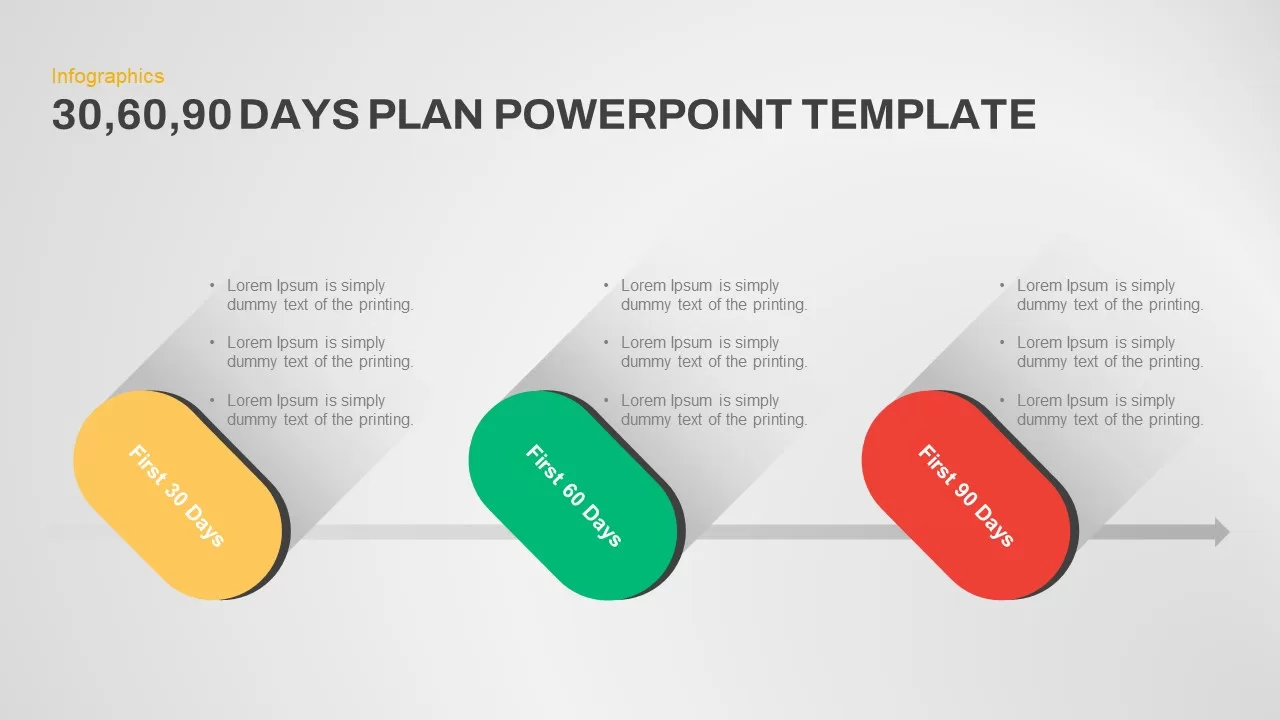
Pill-Style 30-60-90 Timeline Infographic Template for PowerPoint & Google Slides
Timeline
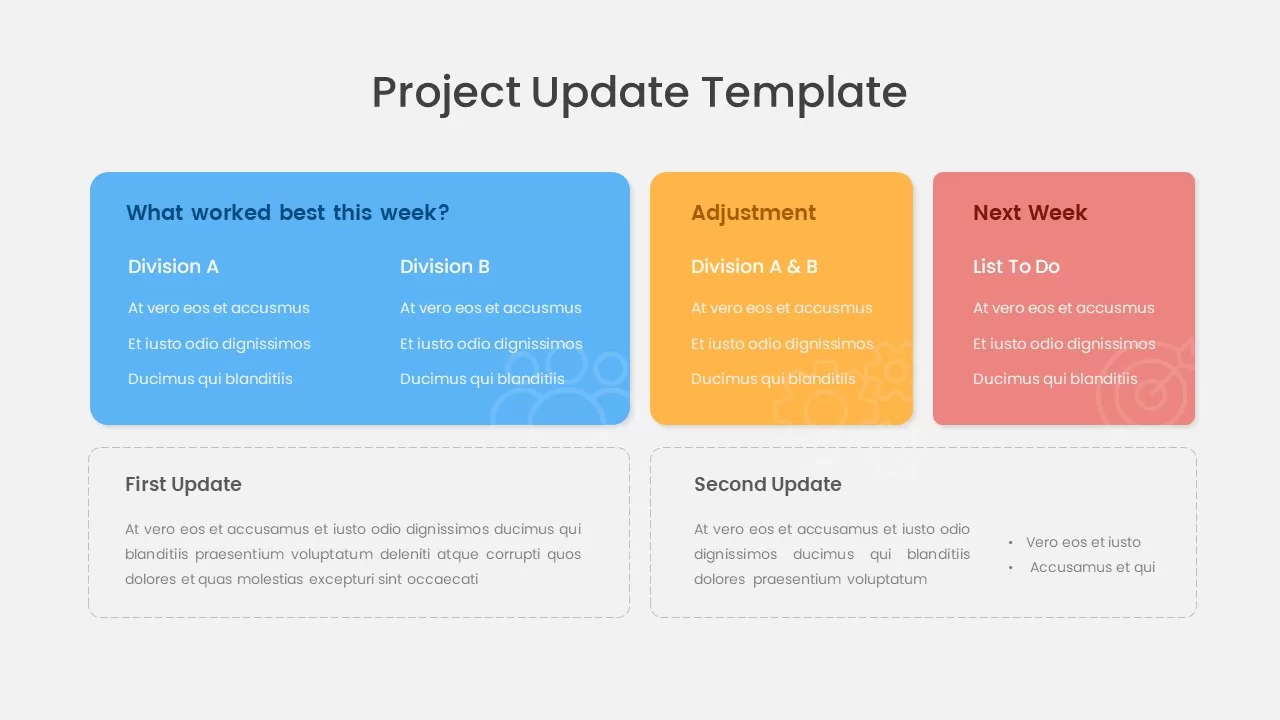
Project Update & Timeline Infographic Template for PowerPoint & Google Slides
Business
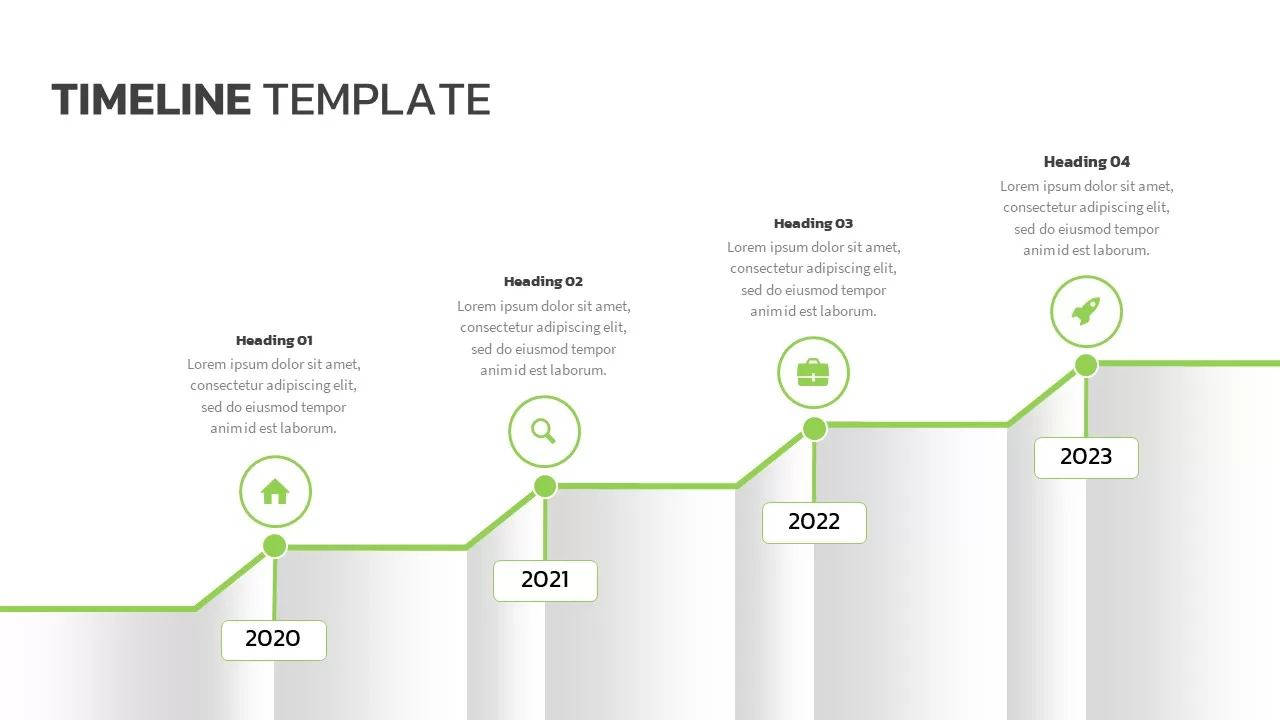
Modern Green Timeline Infographic Template for PowerPoint & Google Slides
Timeline
Free Multi-Year Arrow Timeline Infographic Template for PowerPoint & Google Slides
Timeline
Free
Free Five-Step Circular Timeline Infographic Template for PowerPoint & Google Slides
Timeline
Free
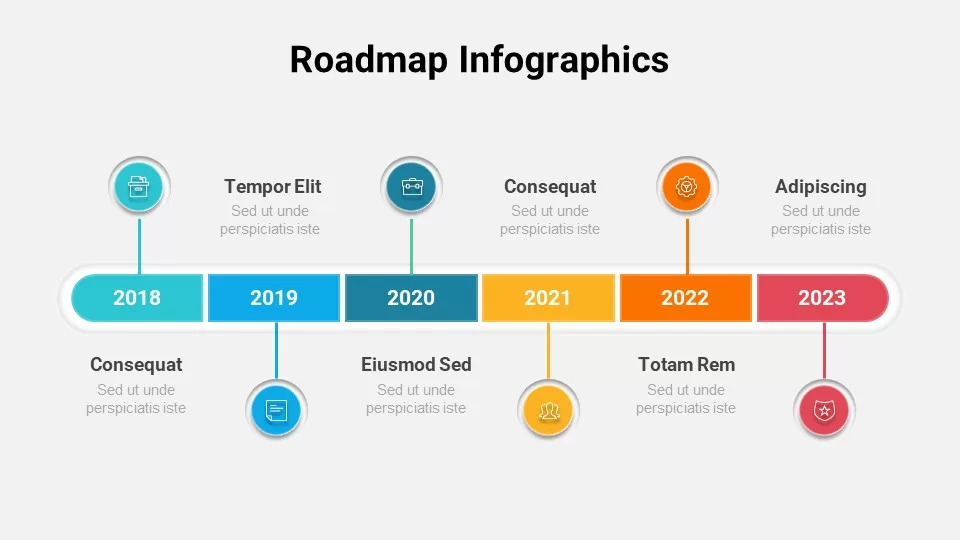
Free Colorful Roadmap Timeline Infographic Template for PowerPoint & Google Slides
Roadmap
Free
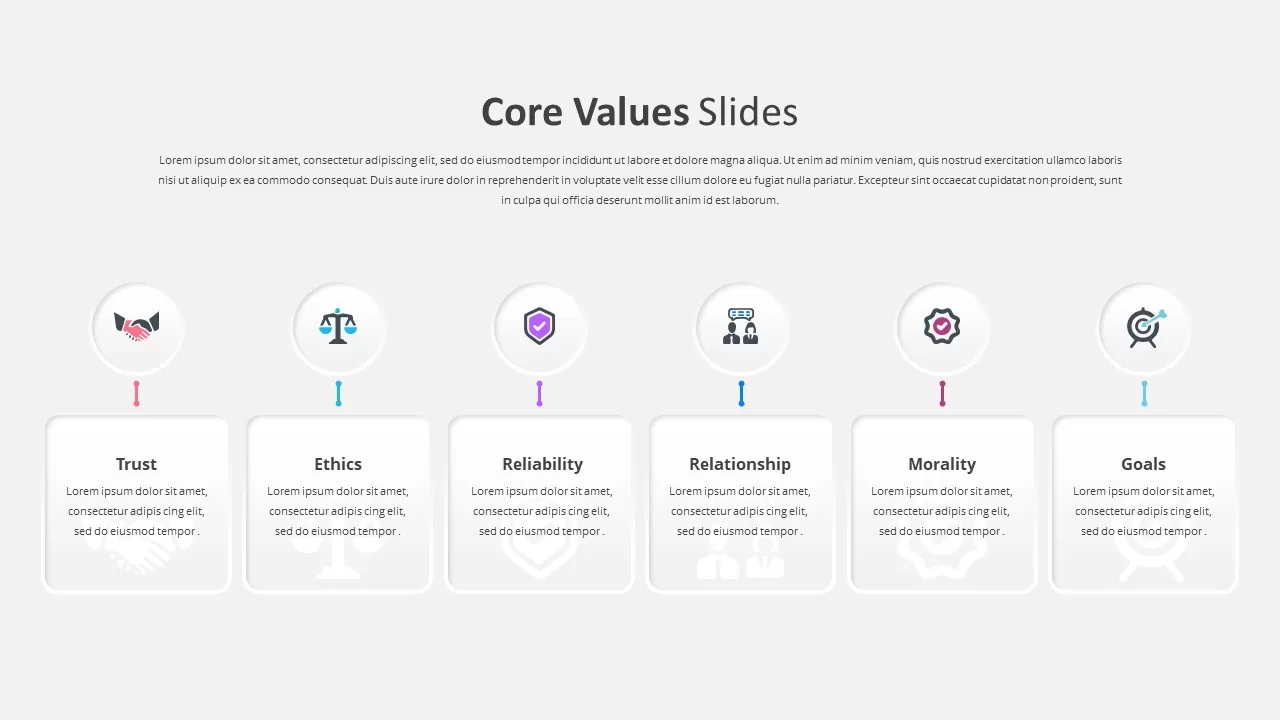
Six Core Values Infographic Timeline Template for PowerPoint & Google Slides
Comparison
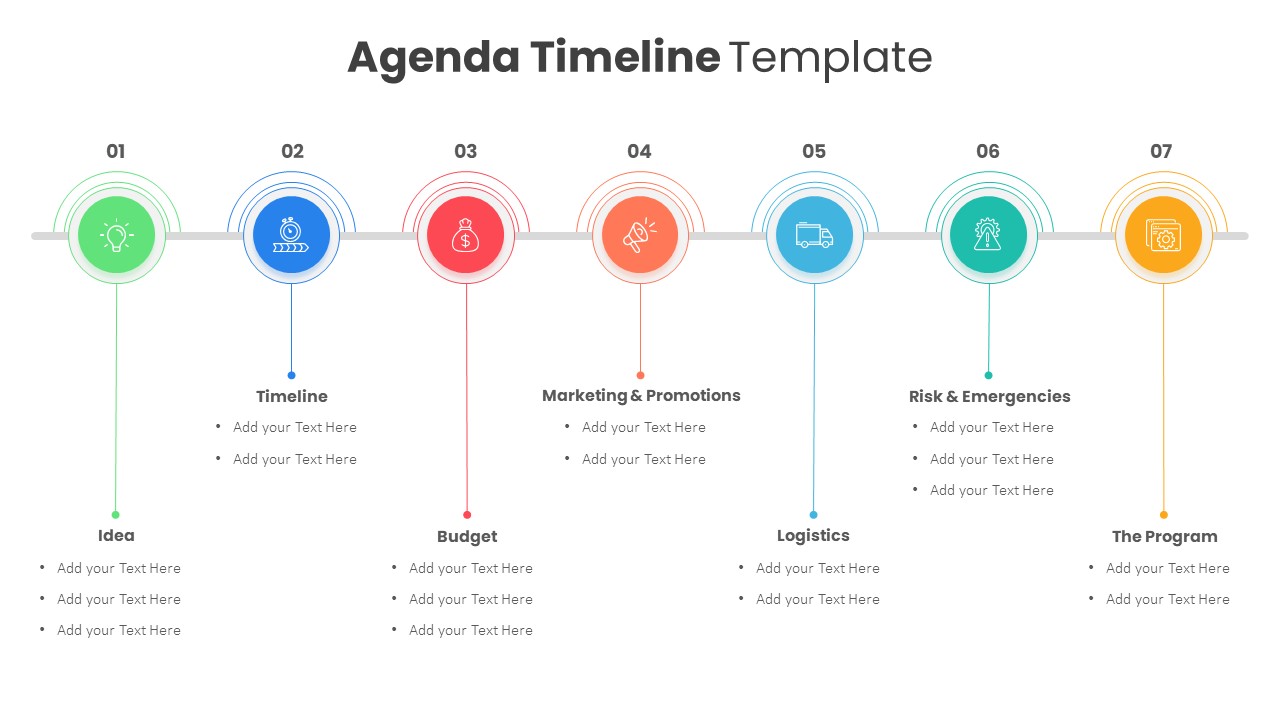
Colorful Agenda Timeline Infographic Template for PowerPoint & Google Slides
Agenda
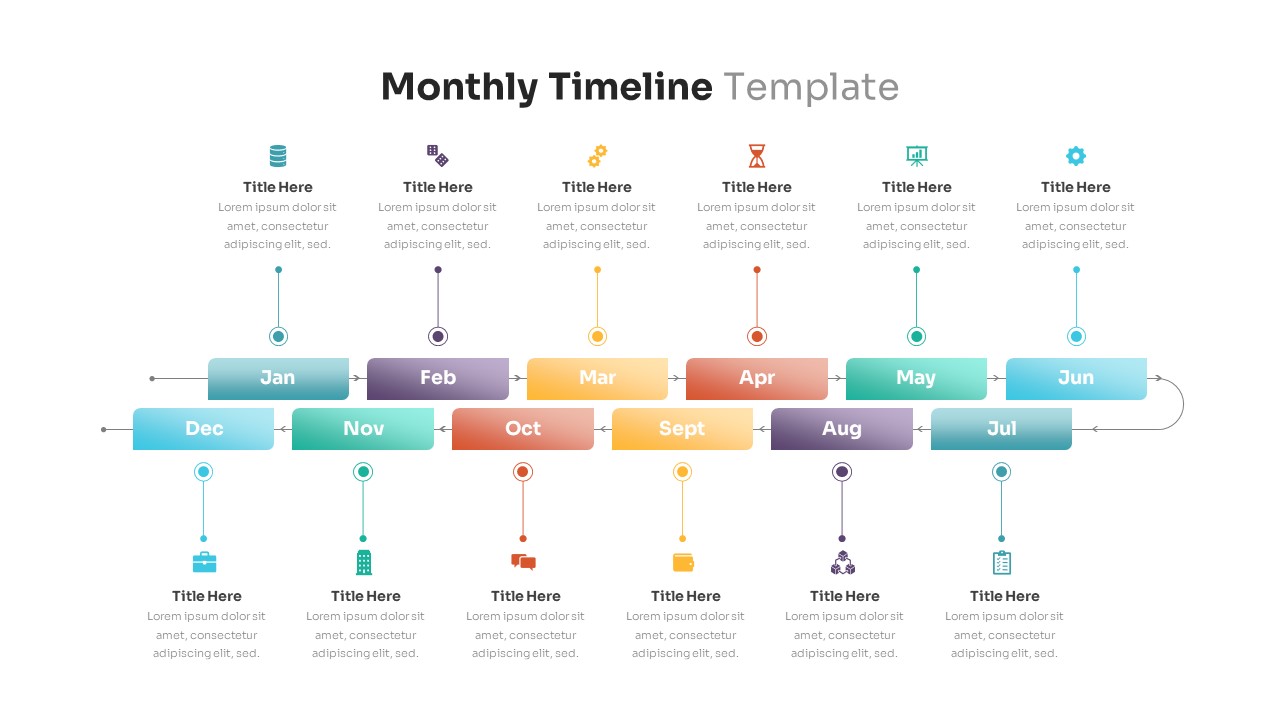
Editable Monthly Timeline Infographic Template for PowerPoint & Google Slides
Timeline
Quarterly Roadmap Timeline Infographic Template for PowerPoint & Google Slides
Timeline
Colorful Agile Timeline Infographic Template for PowerPoint & Google Slides
Timeline
Free
Dynamic Chevron Timeline Infographic Template for PowerPoint & Google Slides
Timeline
Circular Timeline Infographic Template for PowerPoint & Google Slides
Timeline
Quarterly Timeline Infographic Template for PowerPoint & Google Slides
Timeline
Minimalist Timeline Infographic Template for PowerPoint & Google Slides
Timeline
High-Level Timeline Infographic Template for PowerPoint & Google Slides
Timeline
Modern Six-Point Timeline Infographic Template for PowerPoint & Google Slides
Timeline
Vertical Crime Timeline Infographic Template for PowerPoint & Google Slides
Timeline
Fishbone Timeline Infographic Series Template for PowerPoint & Google Slides
Manufacturing
Personal Timeline Infographic Template for PowerPoint & Google Slides
Timeline
Brief History Timeline Infographic Template for PowerPoint & Google Slides
Timeline
Project Milestone Timeline Infographic Template for PowerPoint & Google Slides
Timeline
Curved Road Timeline Infographic Template for PowerPoint & Google Slides
Timeline
Dark Horizontal Timeline Infographic Template for PowerPoint & Google Slides
Timeline
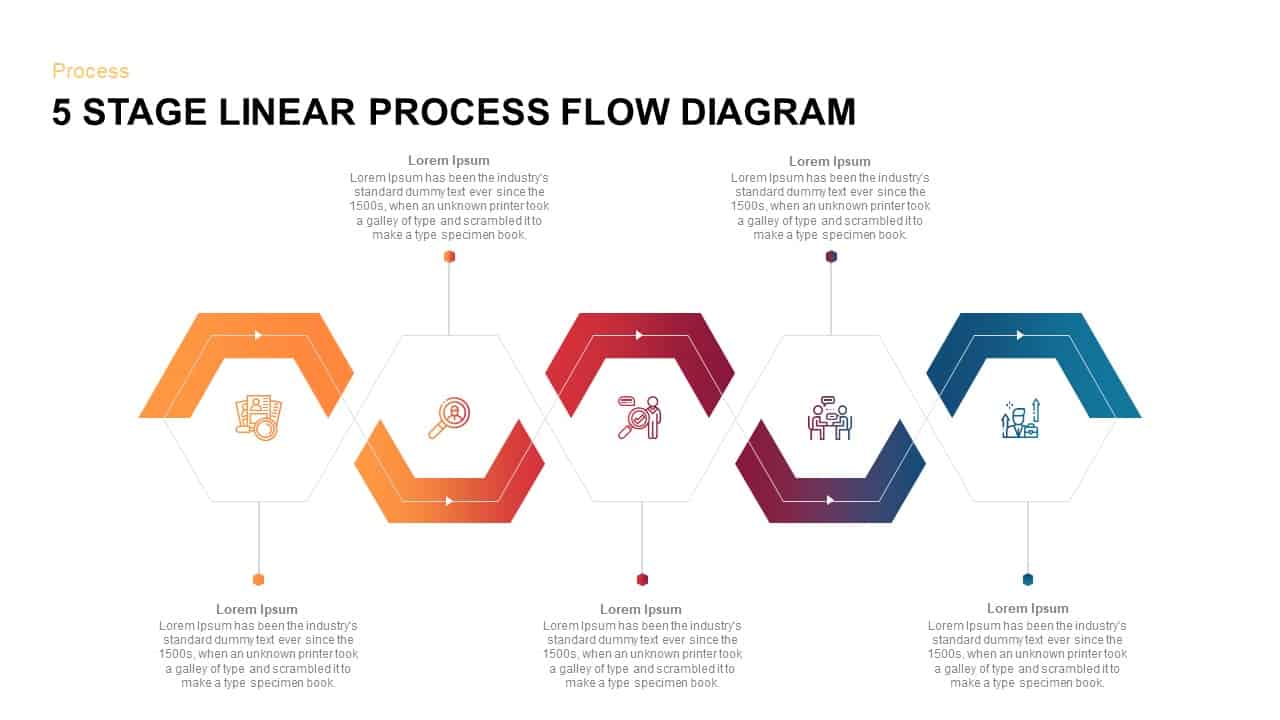
5 Steps Linear Process Flow Diagram template
Process
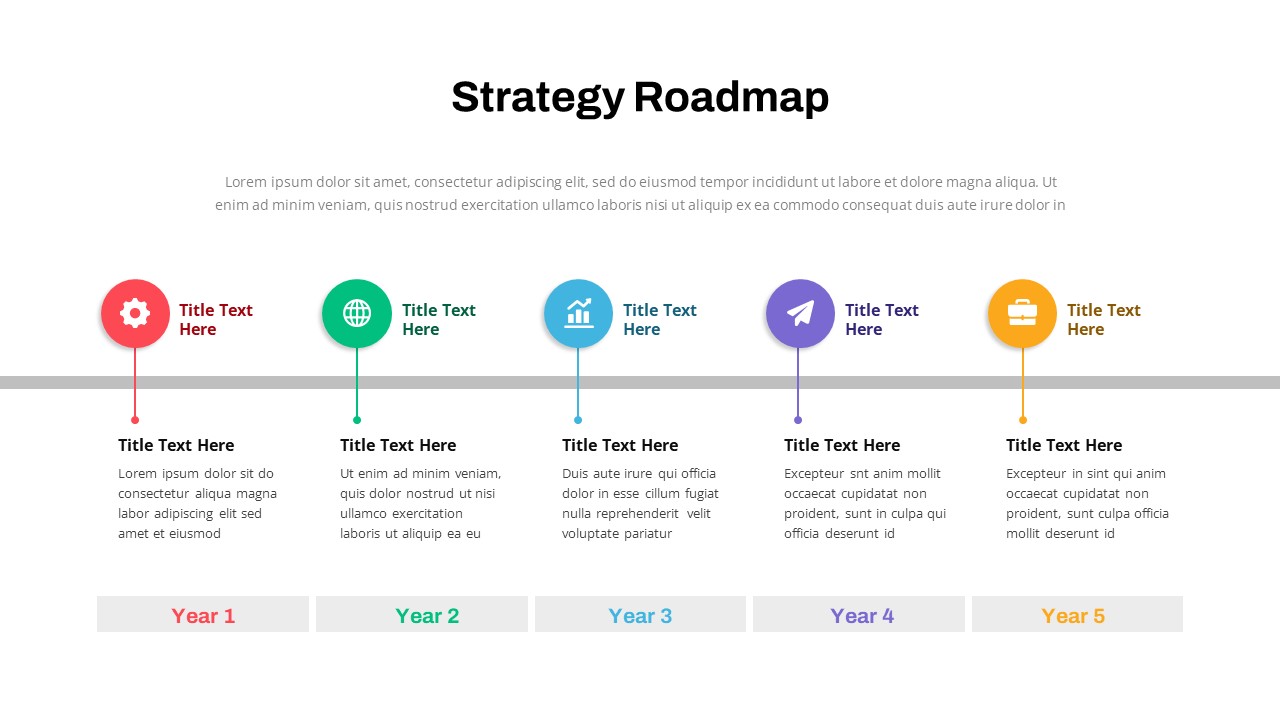
Strategy Roadmap Timeline Slides Template for PowerPoint & Google Slides
Roadmap
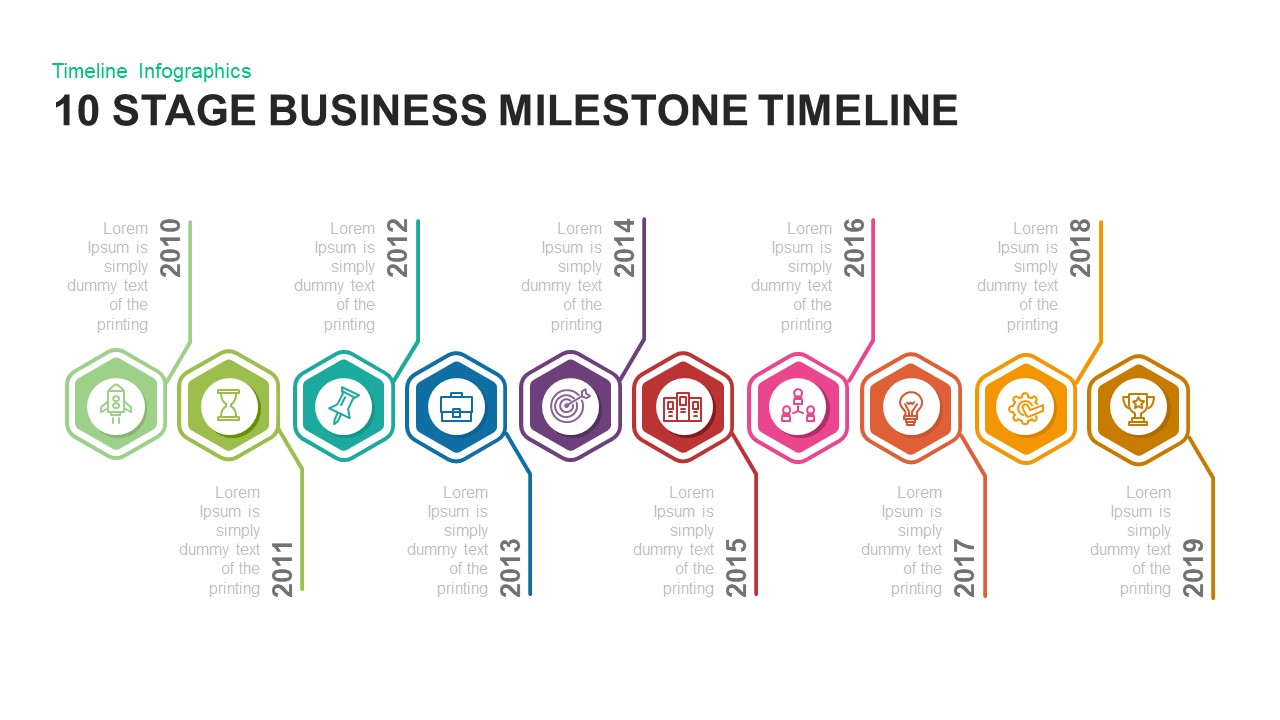
10 Stage Business Milestone Timeline PowerPoint Template for PowerPoint & Google Slides
Timeline
Google Ads Optimization & Performance Infographic Template for PowerPoint & Google Slides
Digital Marketing
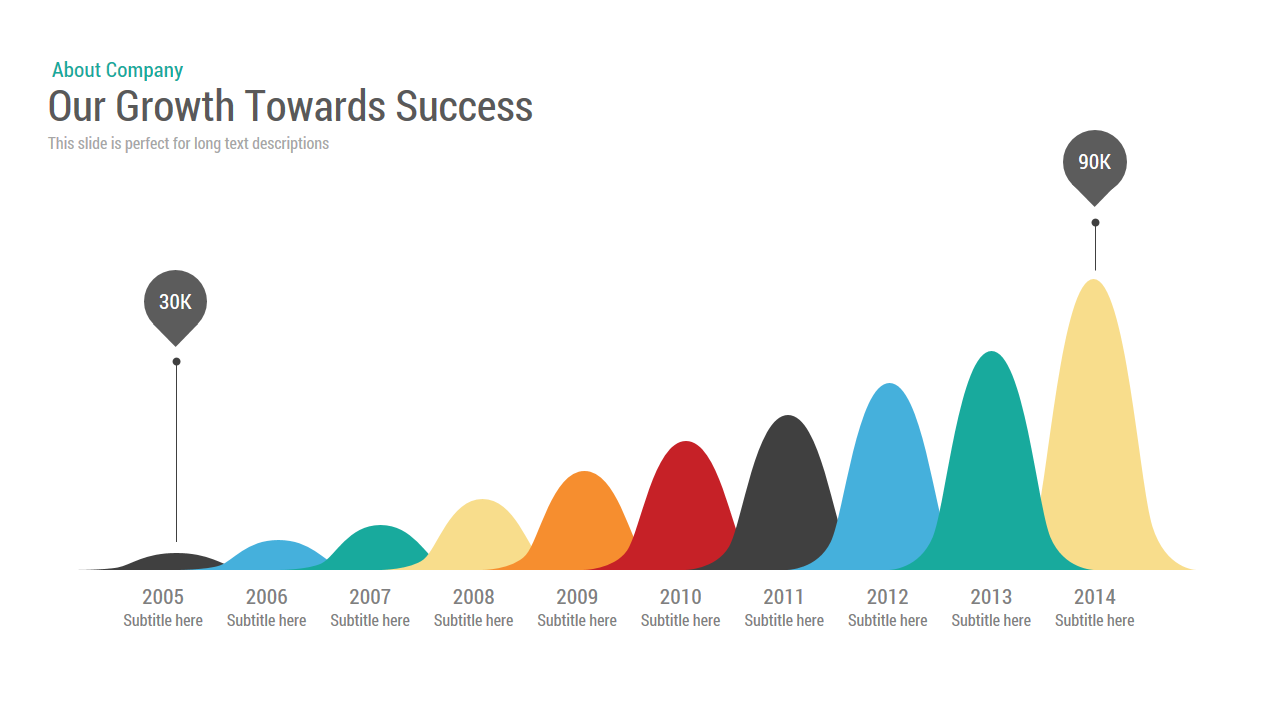
Growth Timeline template for PowerPoint & Google Slides
Timeline
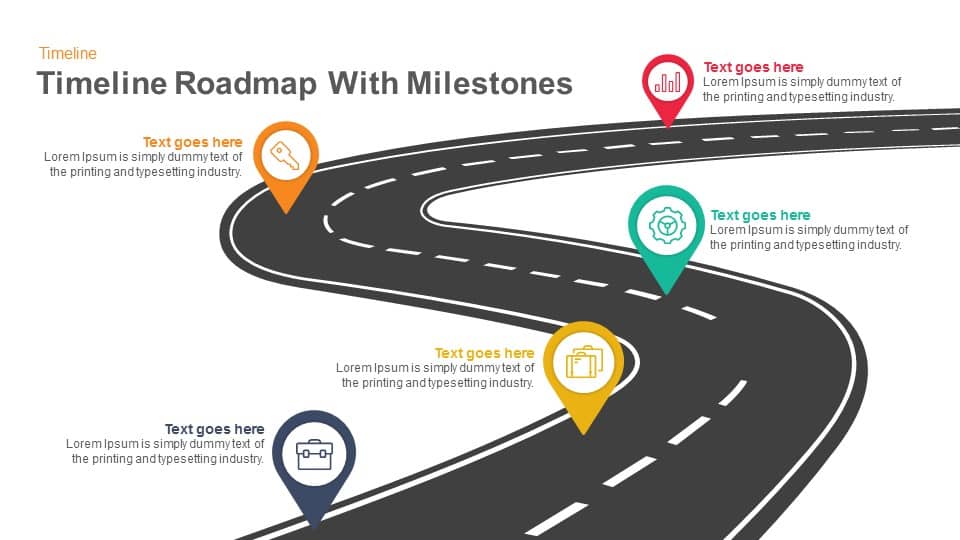
Timeline Roadmap with Milestones template for PowerPoint & Google Slides
Roadmap
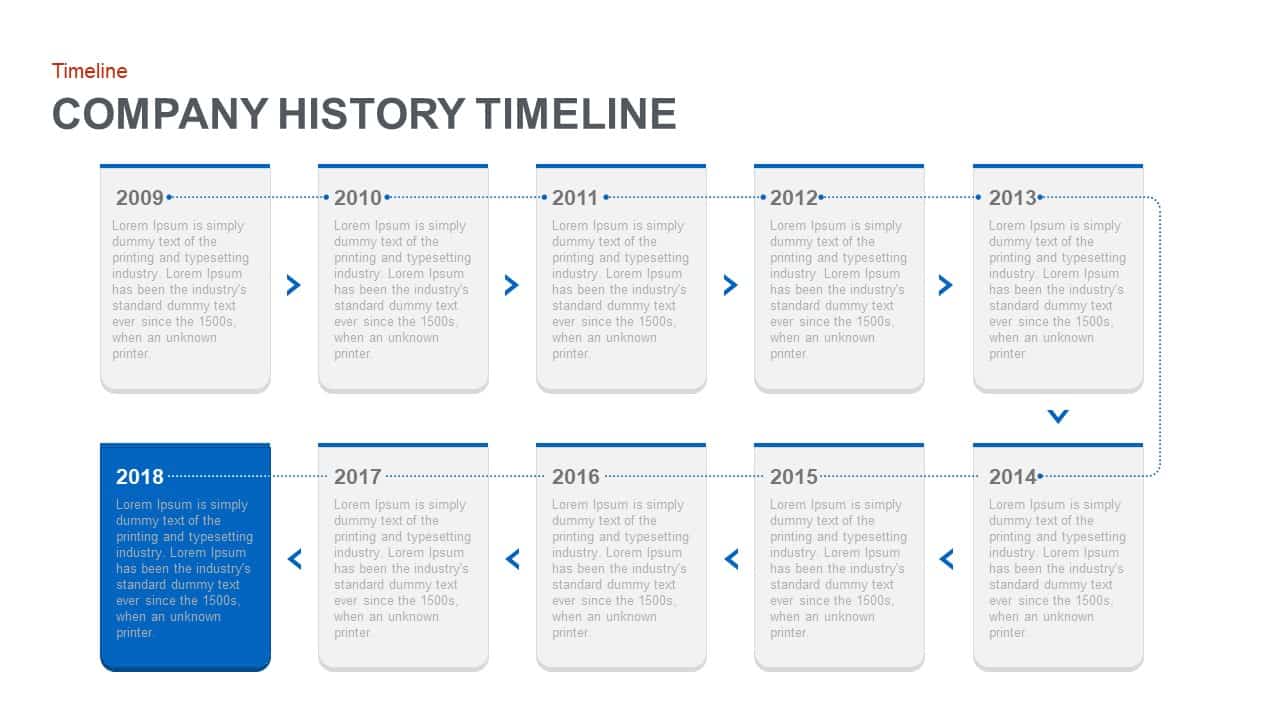
Company History Timeline Roadmap Template for PowerPoint & Google Slides
Timeline
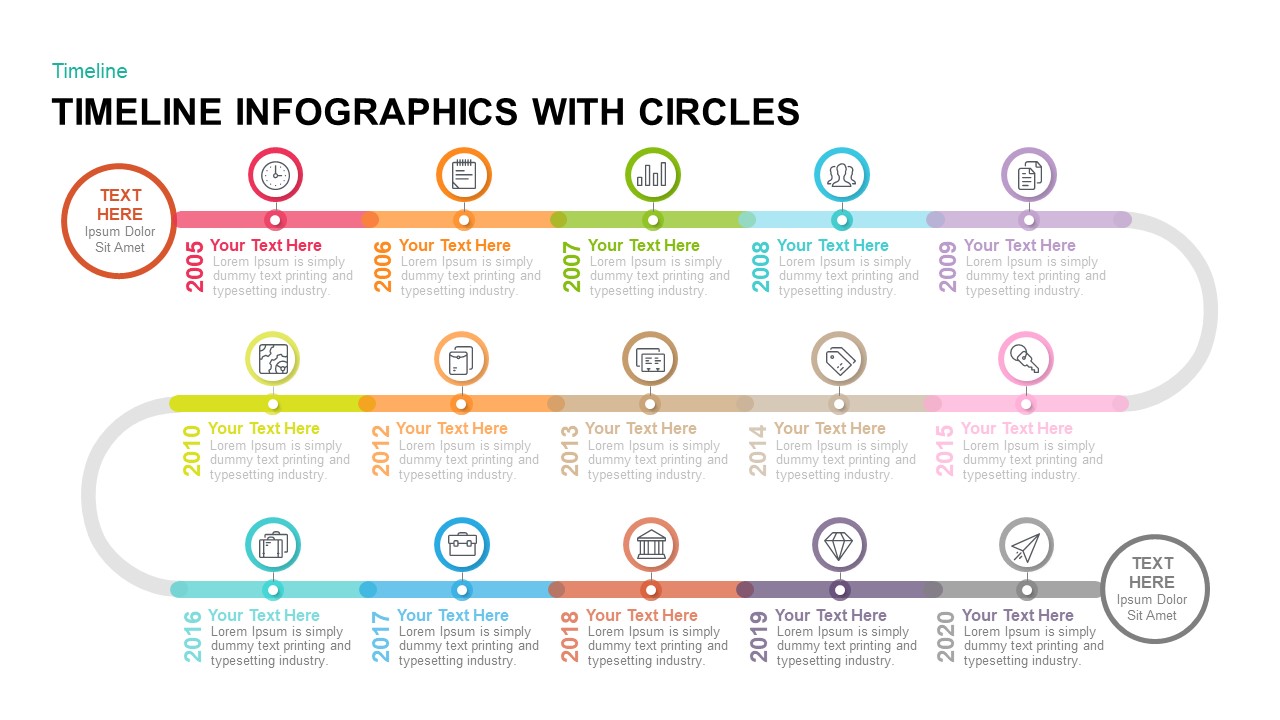
Circular Timeline Infographics Template for PowerPoint & Google Slides
Timeline

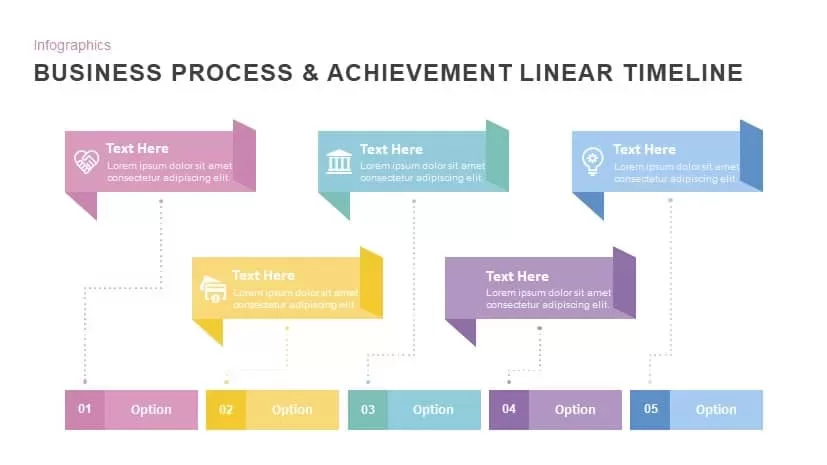
Business Process & Achievement Linear Timeline template for PowerPoint & Google Slides
Timeline
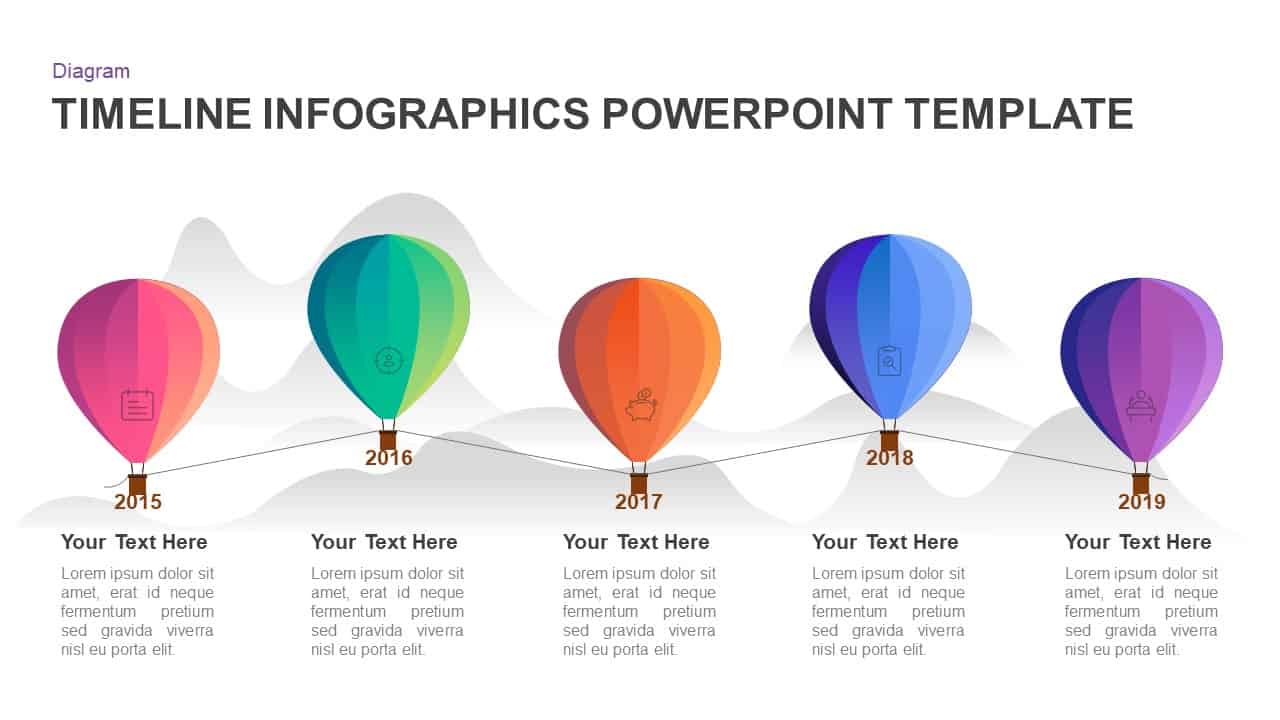
5-Stage Hot-Air Balloon Timeline Template for PowerPoint & Google Slides
Timeline
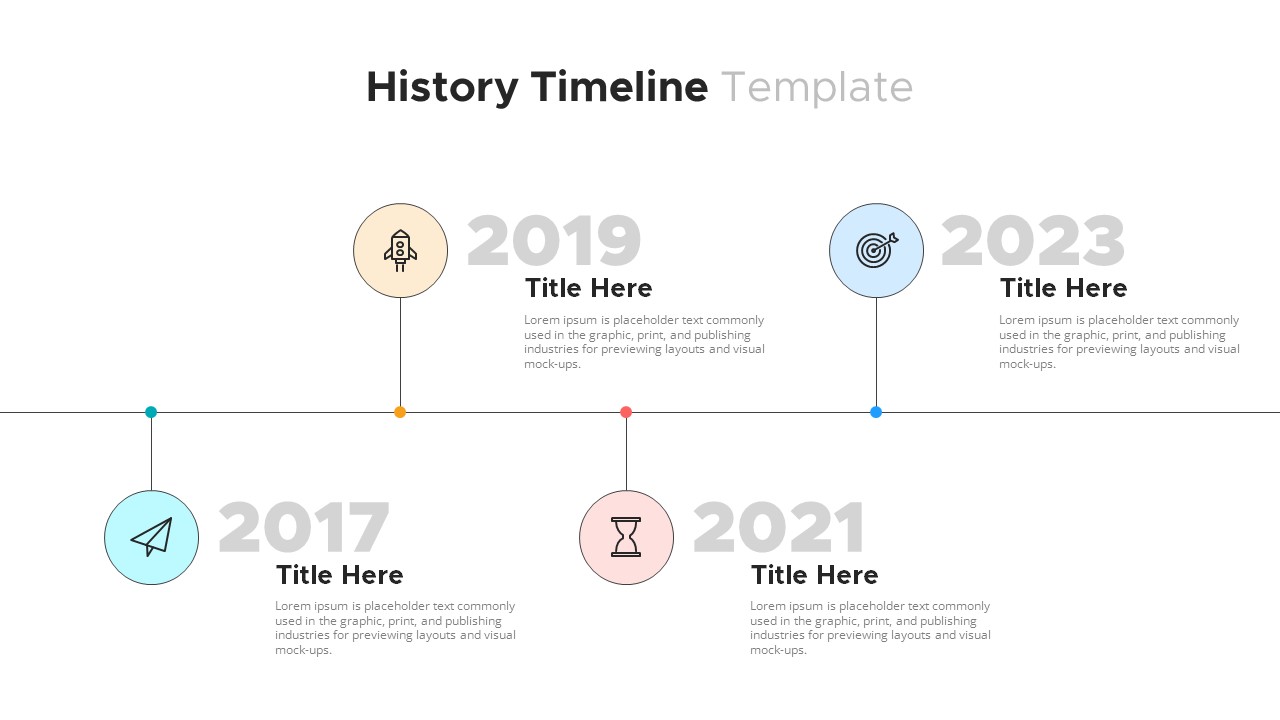
Modern Horizontal History Timeline Template for PowerPoint & Google Slides
Timeline
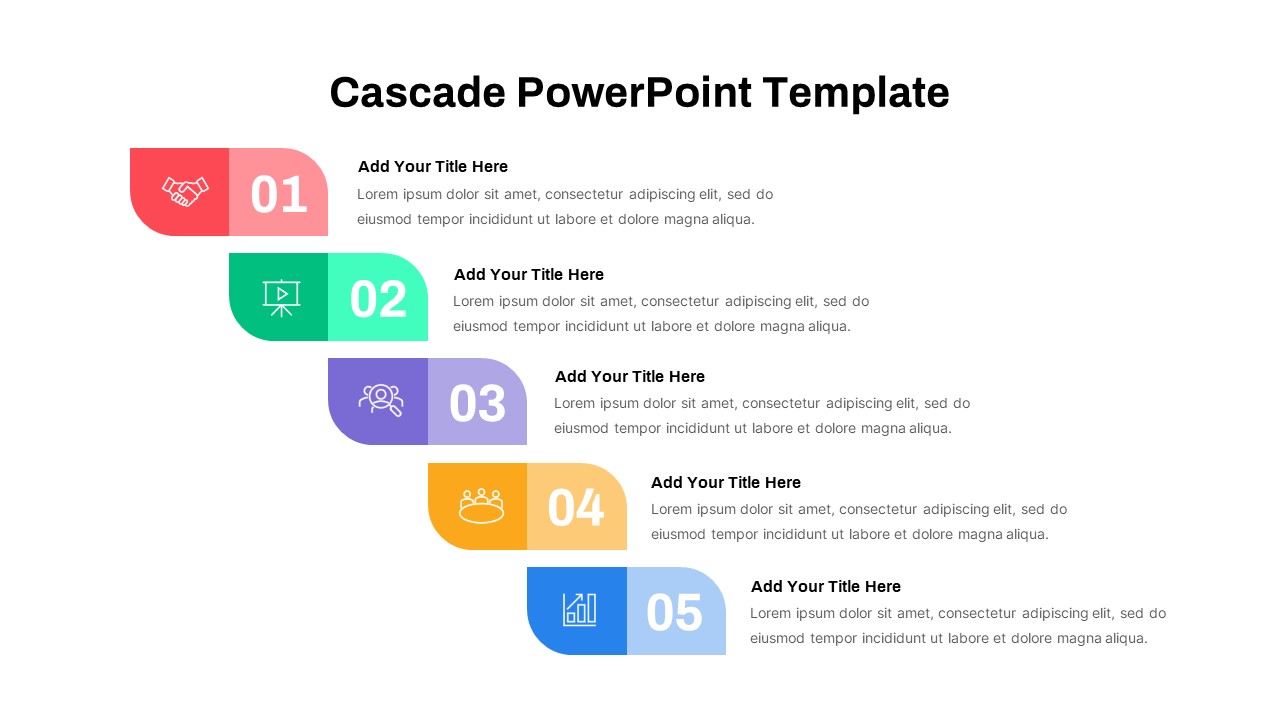
Five-Step Cascade Diagram & Timeline Template for PowerPoint & Google Slides
Process
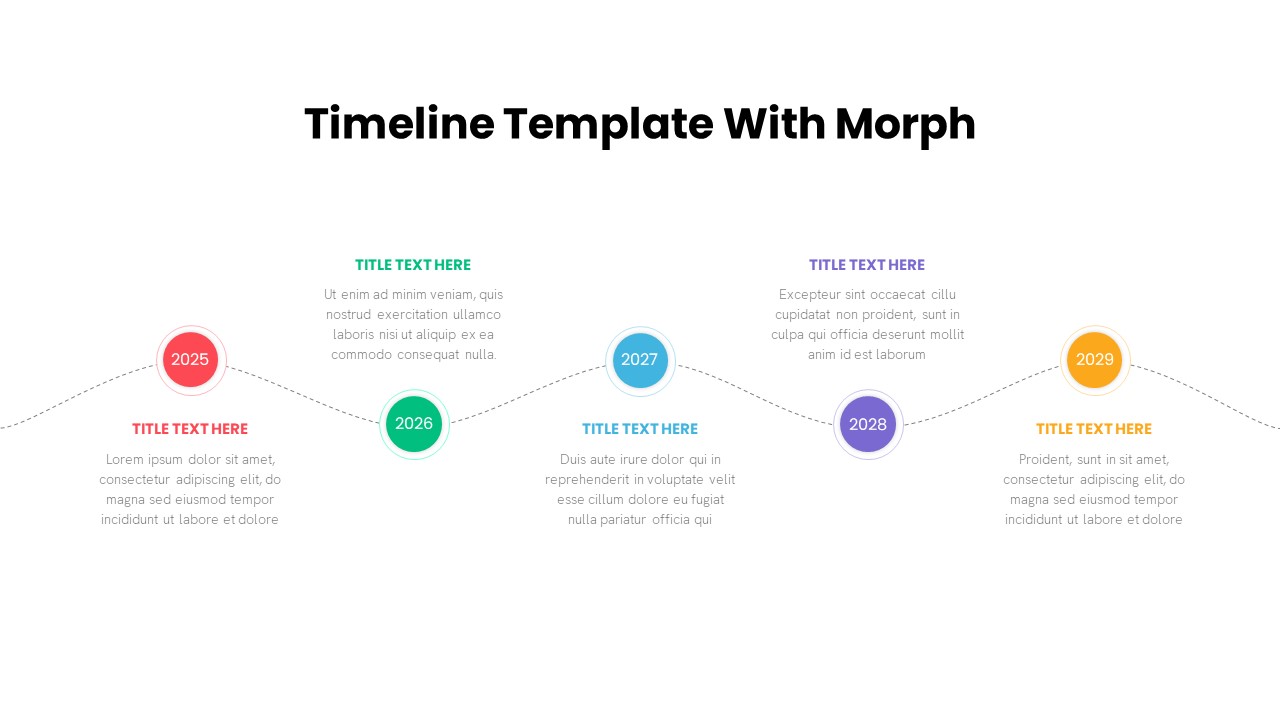
Five-Step Timeline with Morph Animation Template for PowerPoint & Google Slides
Timeline
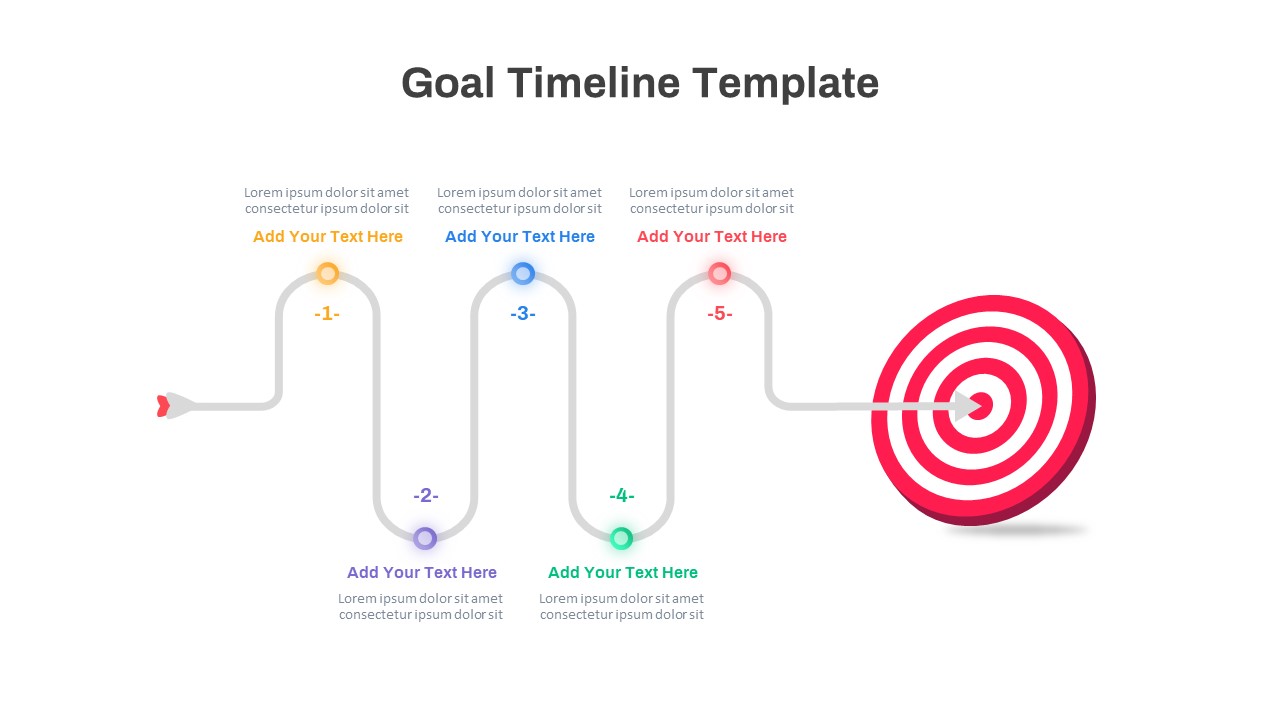
Colorful Five-Step Goal Timeline Template for PowerPoint & Google Slides
Timeline
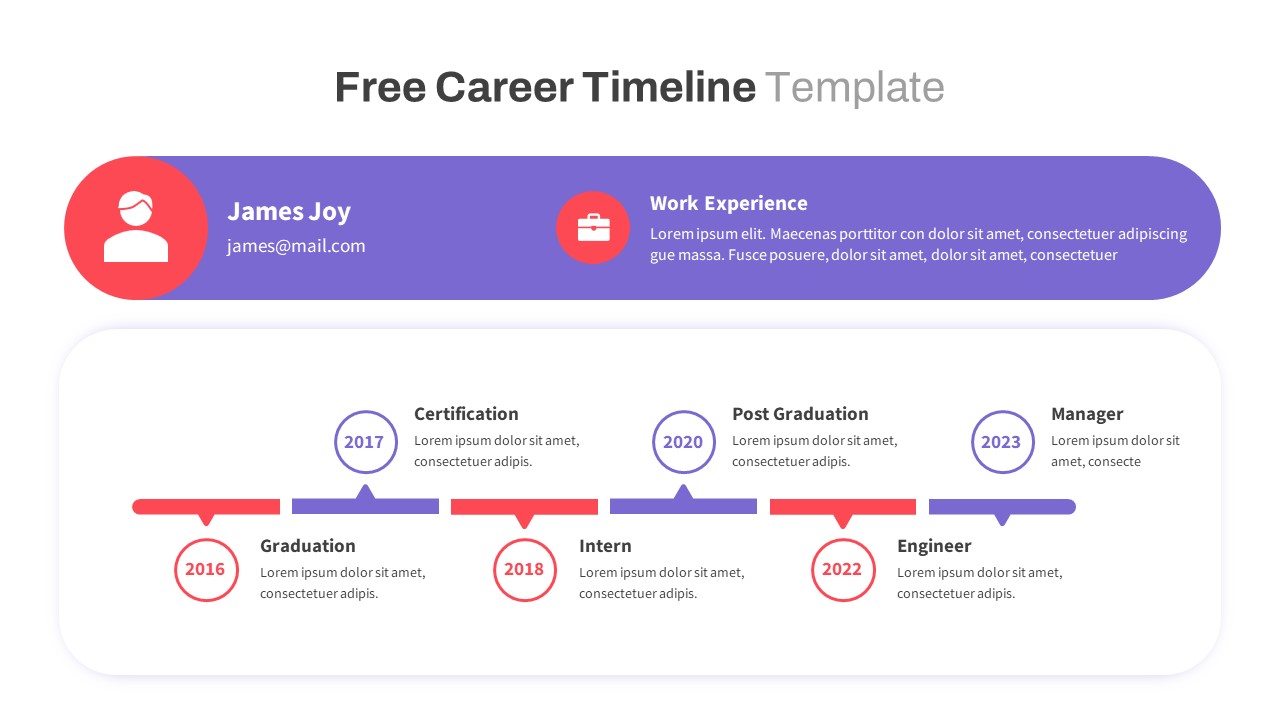
Free Colorful Career Timeline Resume Slide Template for PowerPoint & Google Slides
Timeline
Free
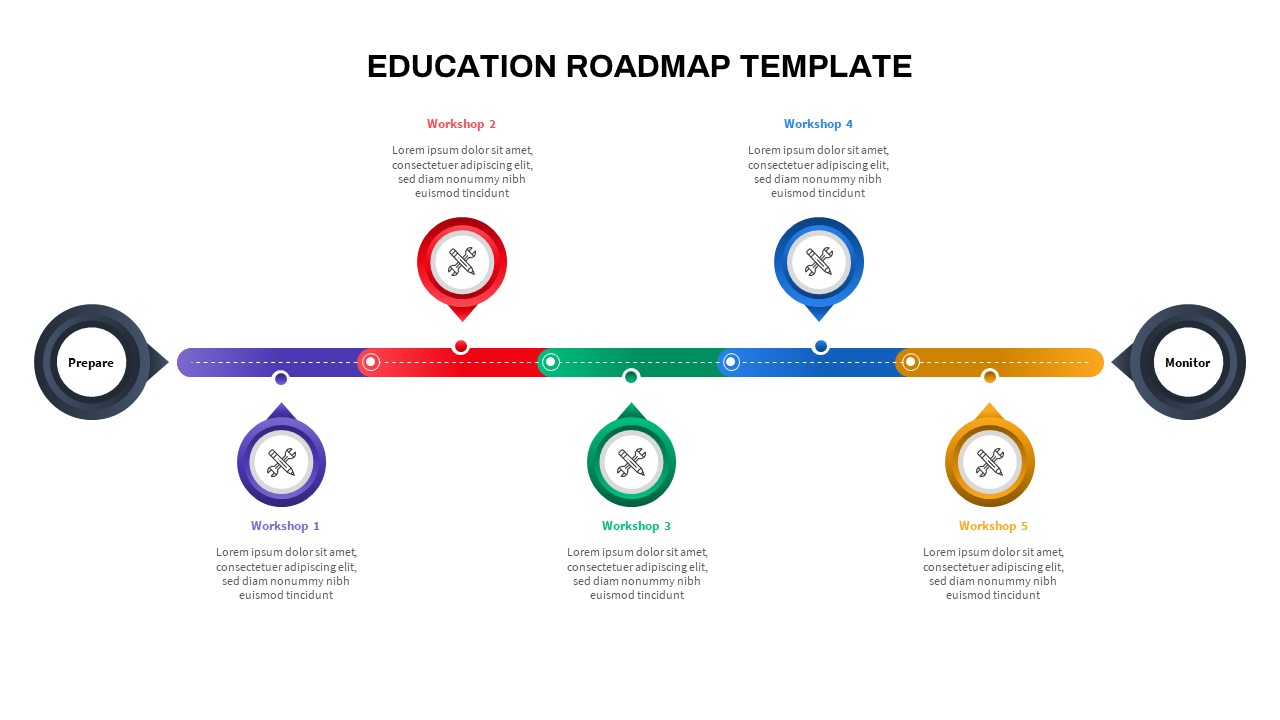
Colorful Education Roadmap Workshop Timeline Template for PowerPoint & Google Slides
Roadmap
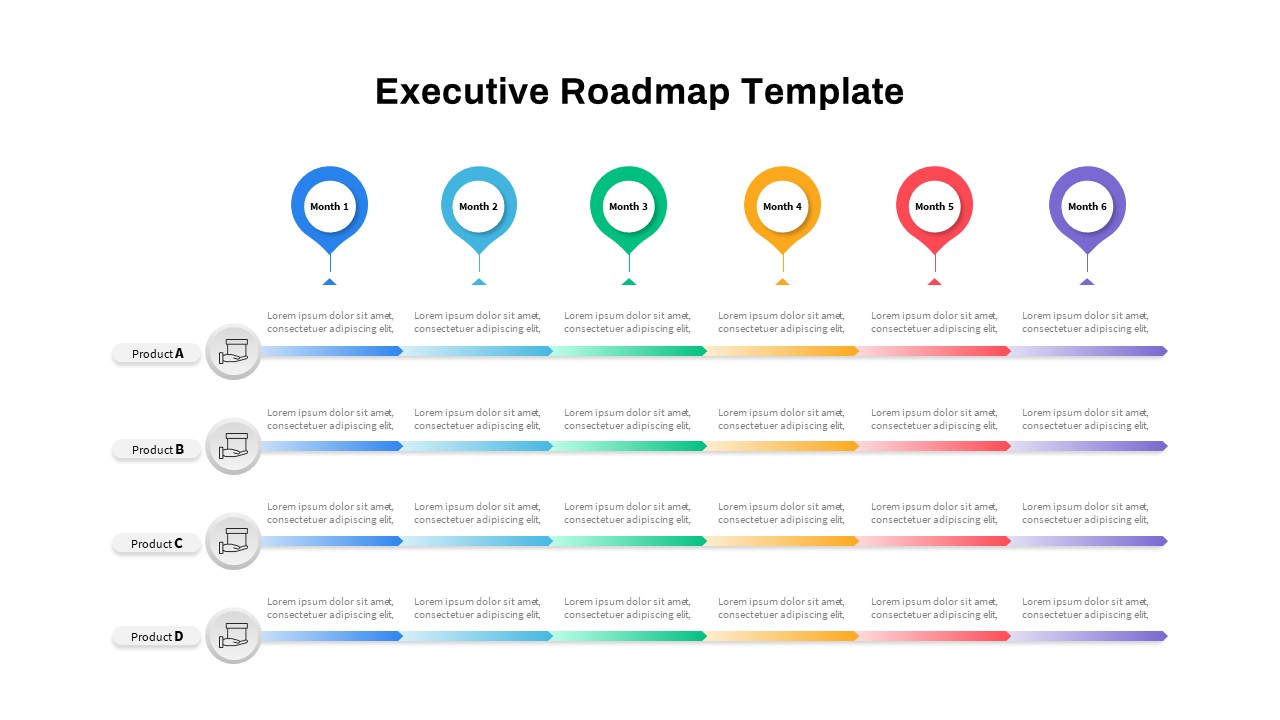
Executive Roadmap Six-Month Timeline Template for PowerPoint & Google Slides
Roadmap
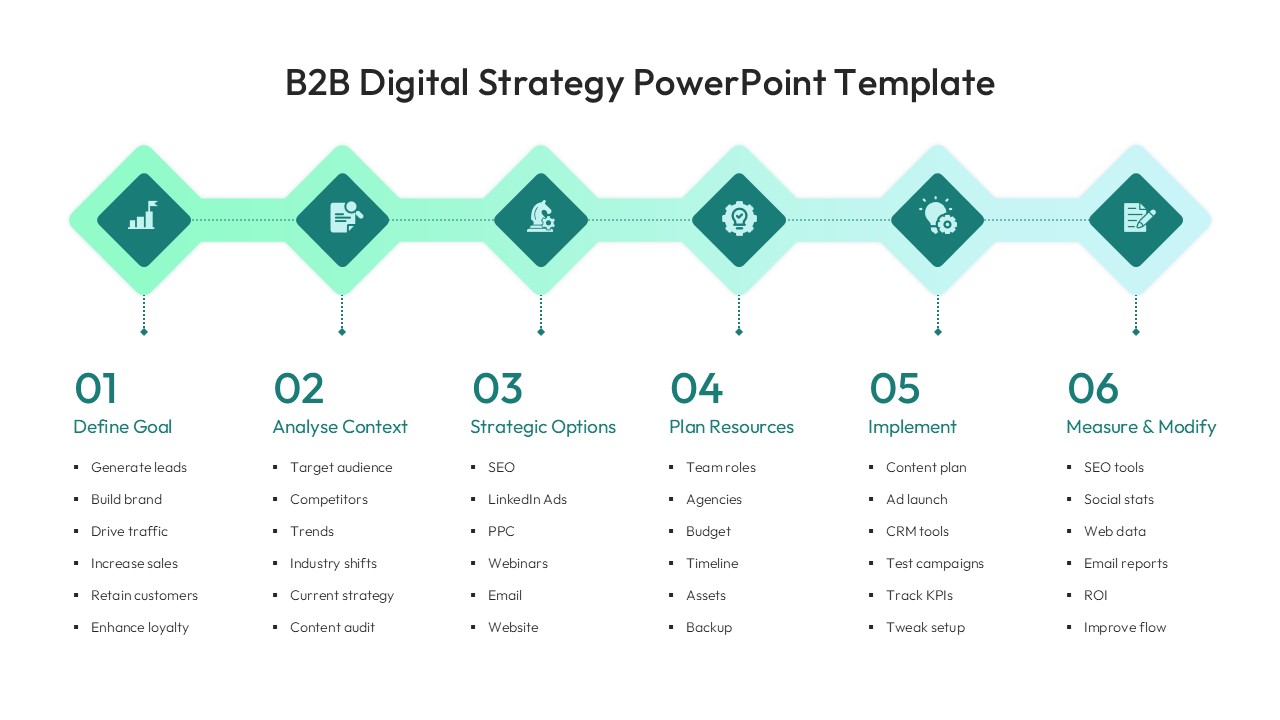
Elegant B2B Digital Strategy Timeline Template for PowerPoint & Google Slides
Digital Marketing
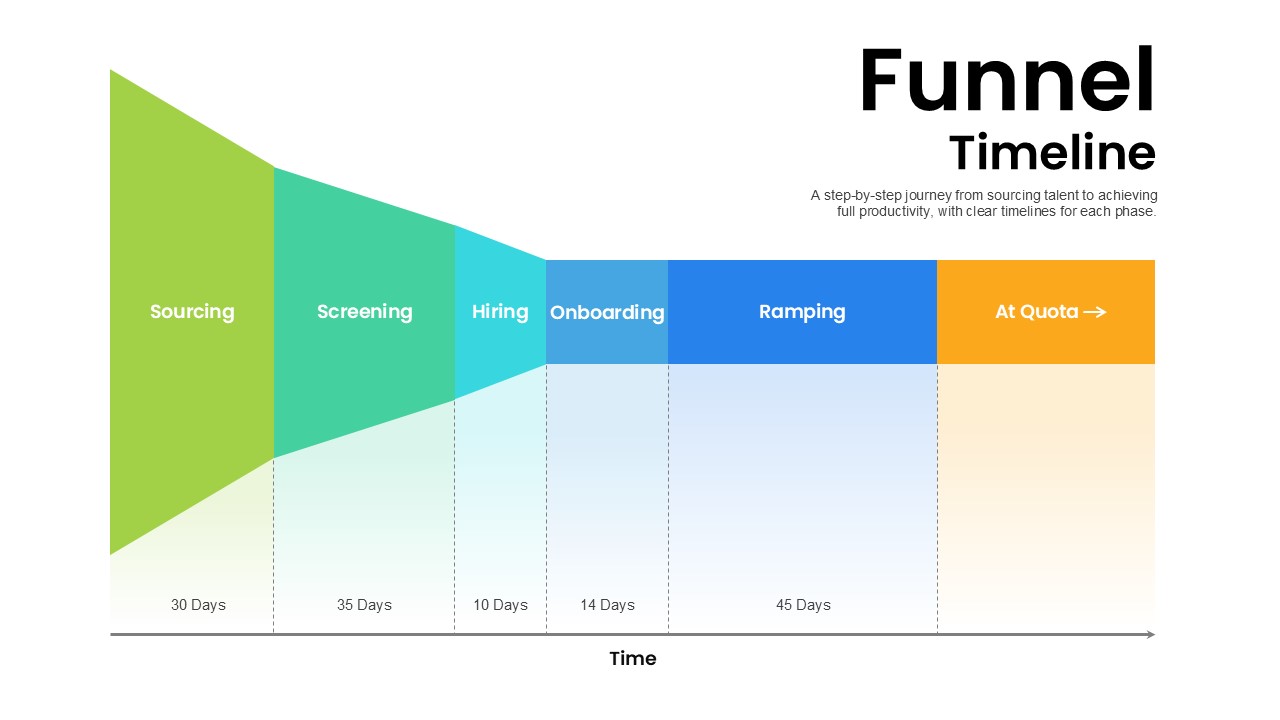
Hiring Funnel Timeline with Six Phases Template for PowerPoint & Google Slides
Recruitment