Thermometer Measurement Timeline Diagram Template for PowerPoint & Google Slides
Description
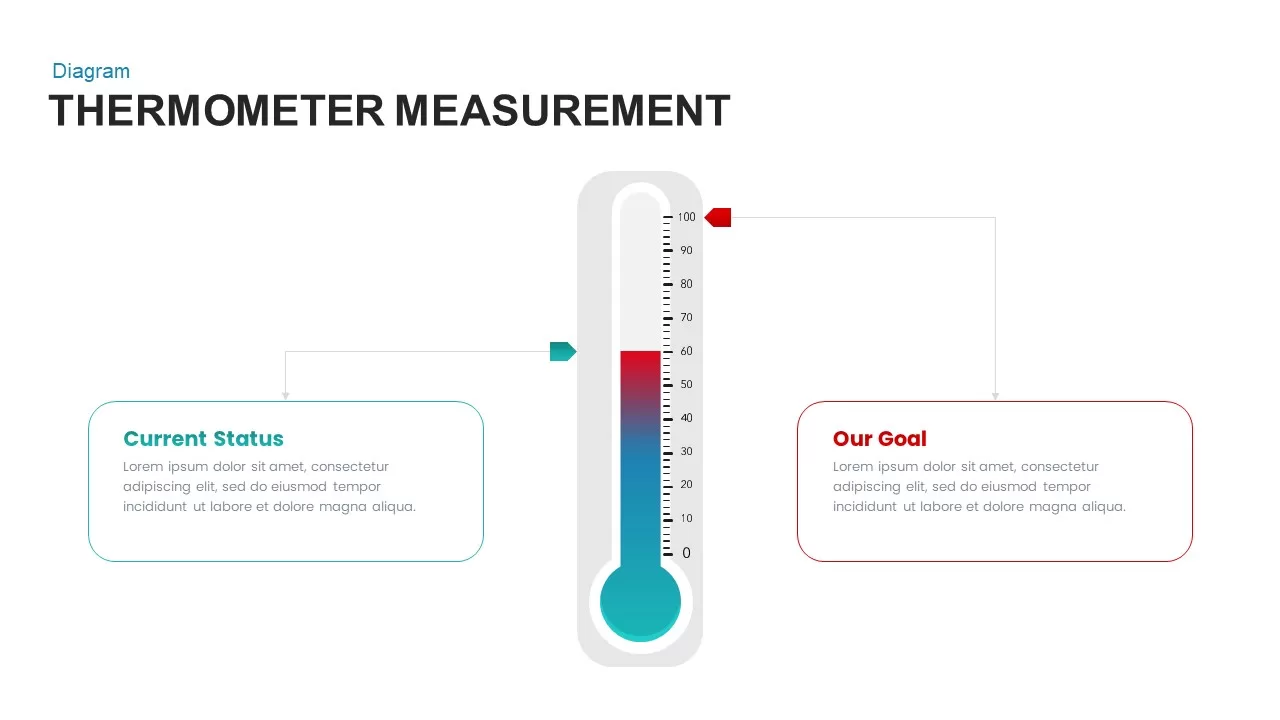
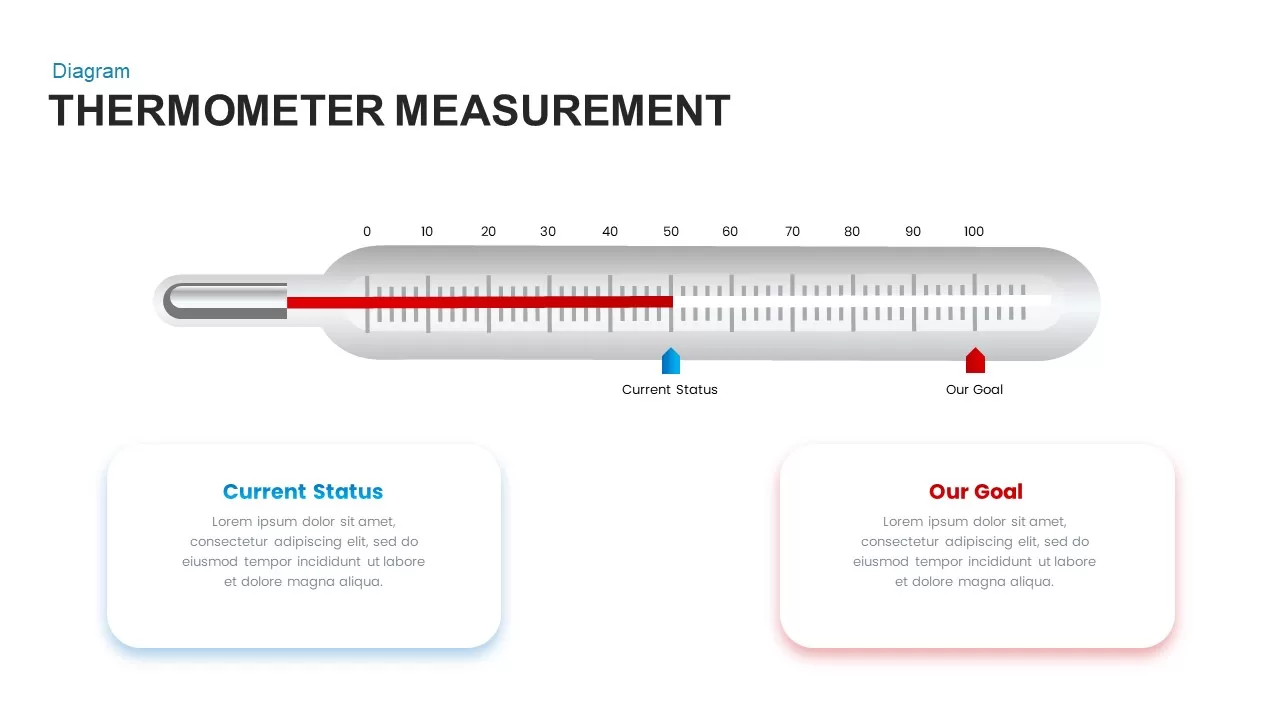
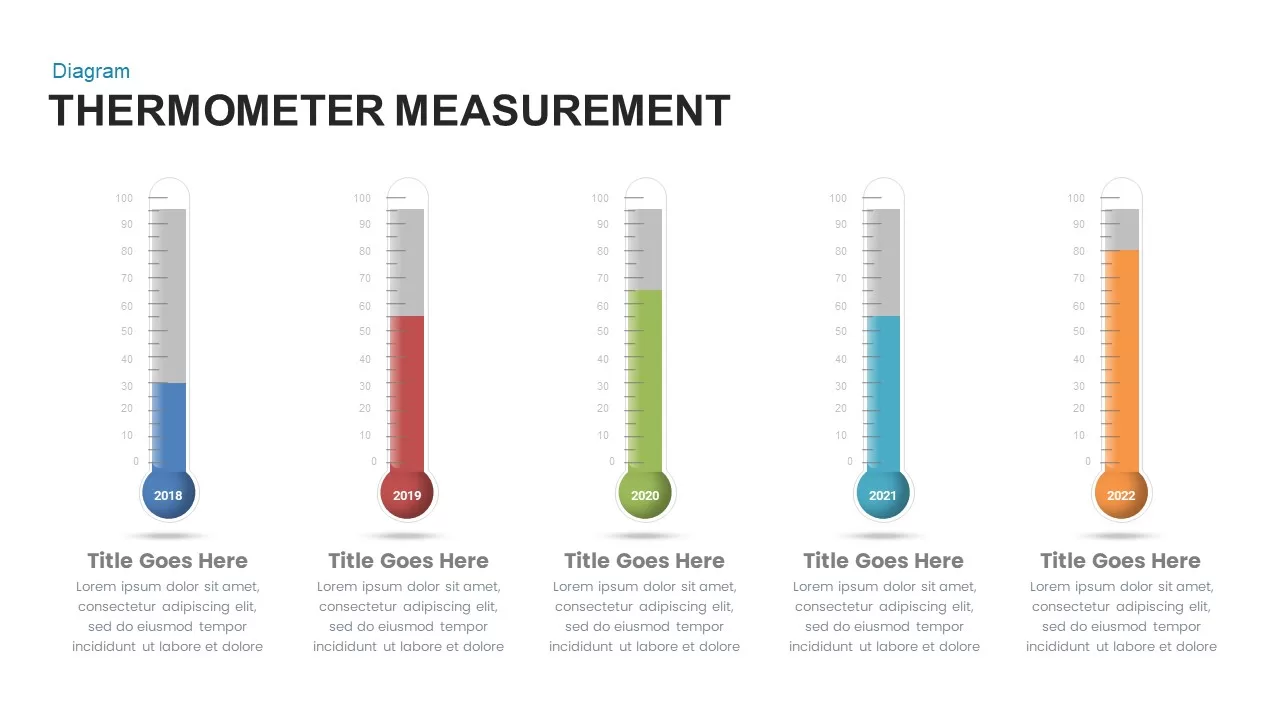
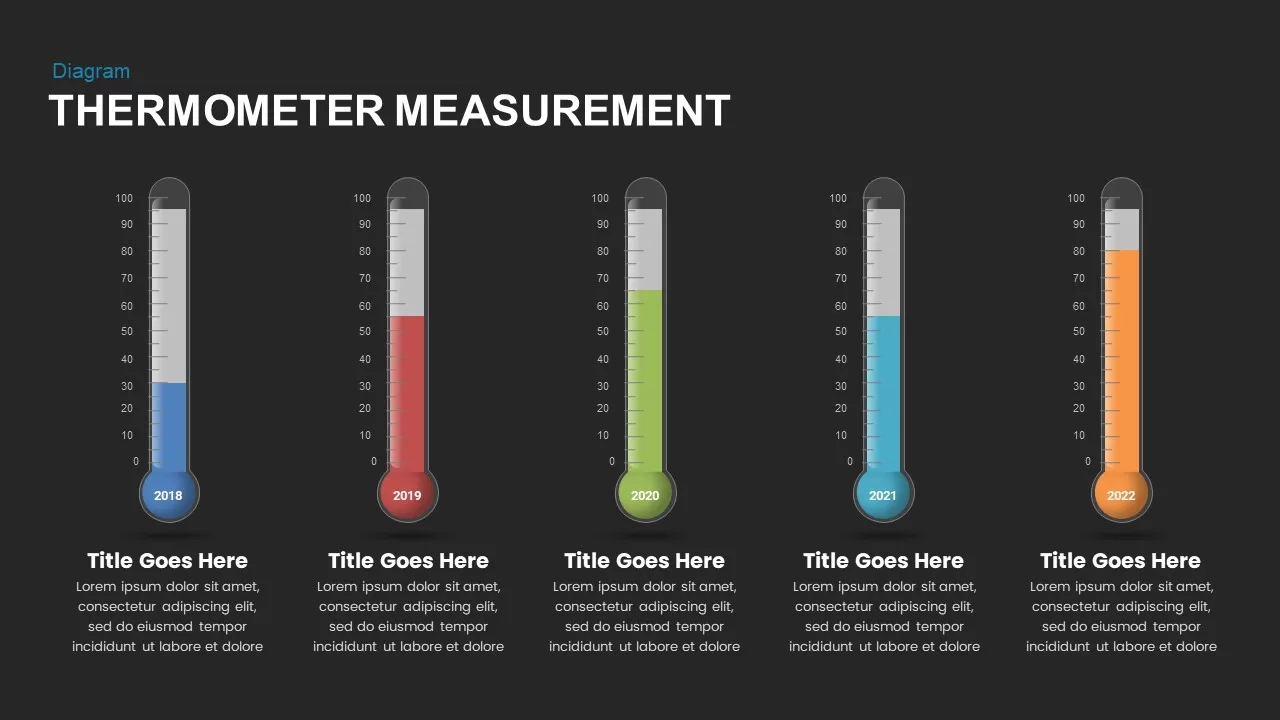
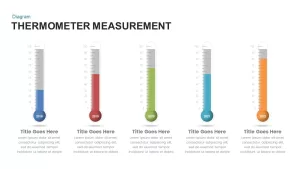
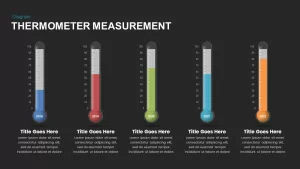
Leverage this visually engaging Thermometer Measurement Timeline slide to illustrate annual metrics from 2018 to 2022 with clear, color-coded thermometers. Each thermometer graphic features a vertical scale from 0 to 100, accented by a prominent bulb-shaped marker displaying the corresponding year. The fill levels—rendered in blue, red, green, teal, and orange—provide an immediate, at-a-glance comparison of key performance indicators or progress measurements over a five-year span. Subtle gray backgrounds and calibrated tick marks ensure precise data reading, while placeholder headings and body text areas offer flexible customization for titles, descriptions, and numerical values.
Designed for maximum versatility, this slide harnesses PowerPoint and Google Slides master layouts to deliver seamless editing and brand consistency. Users can adjust color schemes, update labels, and modify chart scales in seconds, thanks to intuitive placeholders and linked content controls. The modern flat design aesthetic, combined with soft drop shadows and crisp typography, delivers a professional look that suits executive presentations, board meetings, and internal reports. Whether you need to highlight sales targets, fundraising goals, budget utilization, or project milestones, this template transforms complex data into an accessible, visually compelling format.
Optimize your storytelling by aligning stakeholder discussions around clear, color-driven visuals. This Thermometer Measurement Timeline slide ensures your audience can quickly identify trends, track year-over-year changes, and focus on critical data points without distraction. With full resolution clarity across devices and platforms, you can present confidently from desktop, tablet, or projector without formatting issues. Instantly swap icons, modify text placeholders, or adjust fill thresholds to match evolving requirements and maintain visual coherence.
Who is it for
Marketing managers, sales directors, data analysts, and project coordinators can leverage this slide to present performance metrics and progress updates with clarity and impact. Business consultants, financial planners, and executive teams will find the intuitive visual format ideal for boardroom reviews and stakeholder briefings.
Other Uses
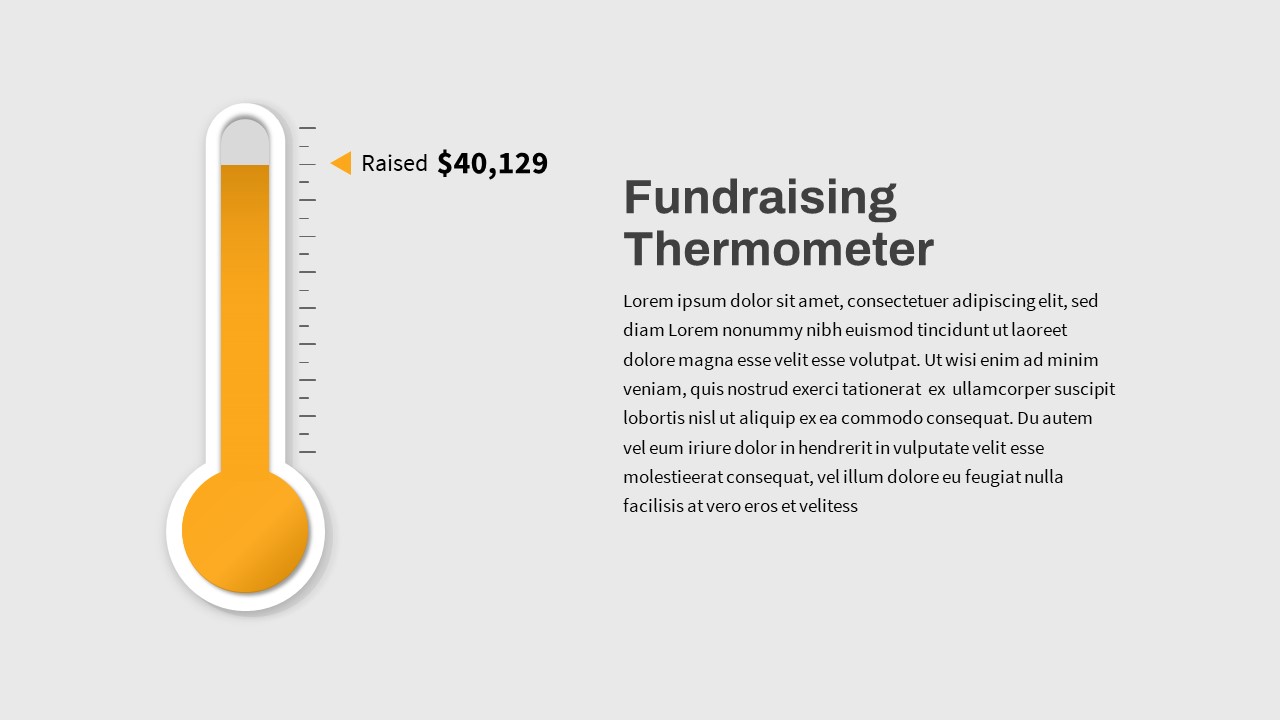
For additional use, repurpose the thermometer graphics to track fundraising campaigns, budget allocations, operational KPIs, or customer satisfaction scores. You can also adapt the timeline layout for project milestone tracking, risk assessments, or environmental temperature trend analysis across any selected period.
Login to download this file

Item ID
SB02699
Related Templates

Thermometer Measurement Diagram for PowerPoint & Google Slides
Business
Thermometer Gauge Progress Measurement Template for PowerPoint & Google Slides
Comparison
Multi-Variation Thermometer Chart Template for PowerPoint & Google Slides
Bar/Column
Dynamic Fundraising Thermometer Slide Template for PowerPoint & Google Slides
Revenue
Alternating Circle Timeline Diagram Template for PowerPoint & Google Slides
Timeline
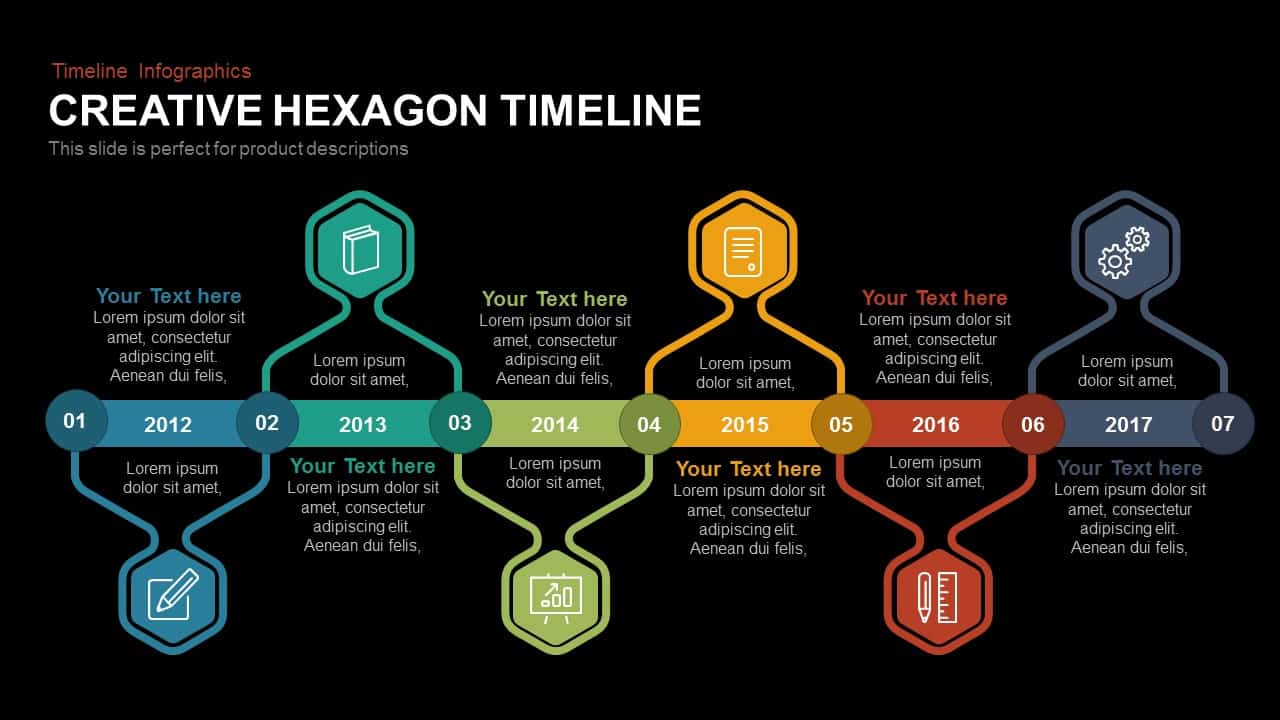
Annual Creative Hexagon Timeline Diagram Template for PowerPoint & Google Slides
Timeline
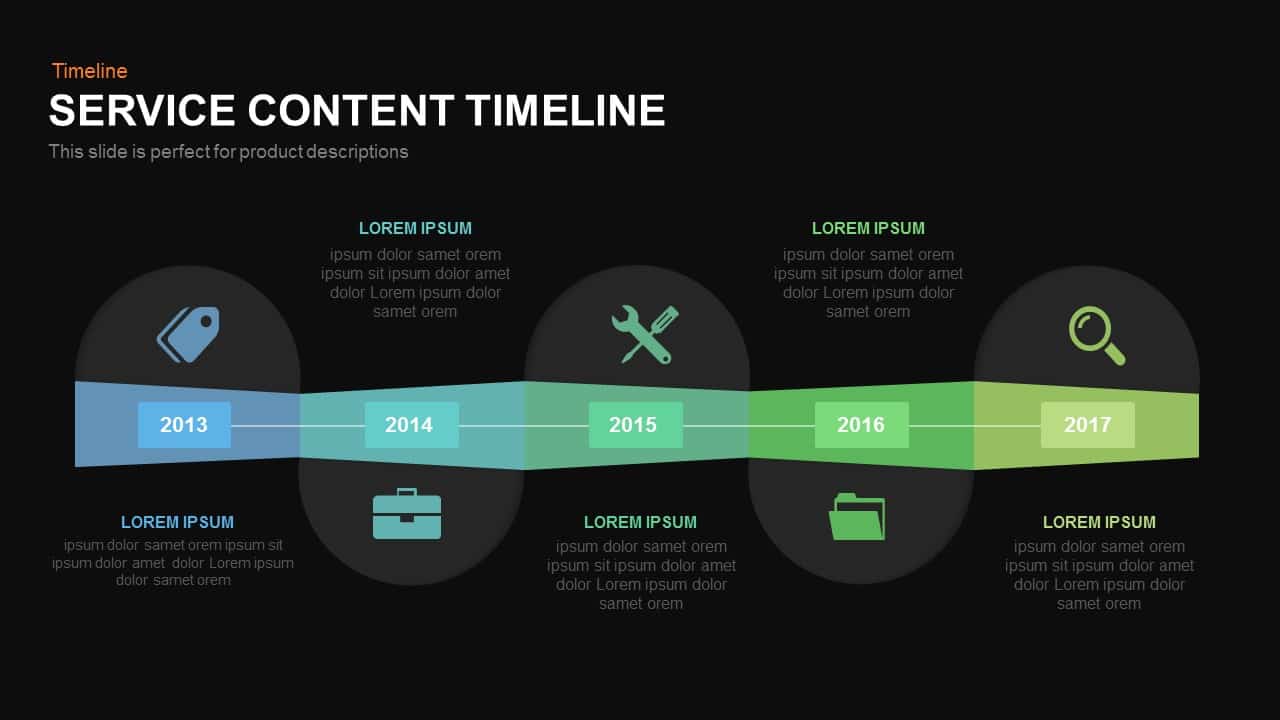
Service Content Timeline Diagram Template for PowerPoint & Google Slides
Timeline
Timeline Arrow Infographics Diagram Template for PowerPoint & Google Slides
Timeline
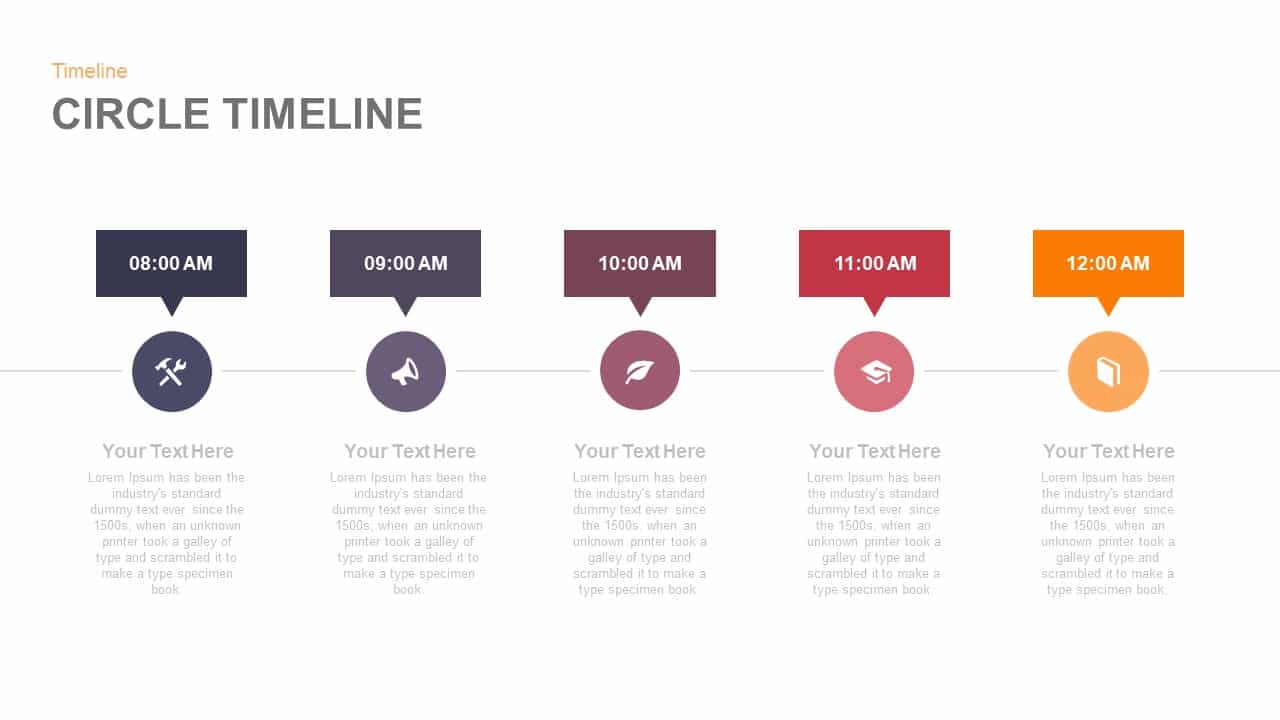
Five-Point Circle Timeline Diagram Template for PowerPoint & Google Slides
Timeline
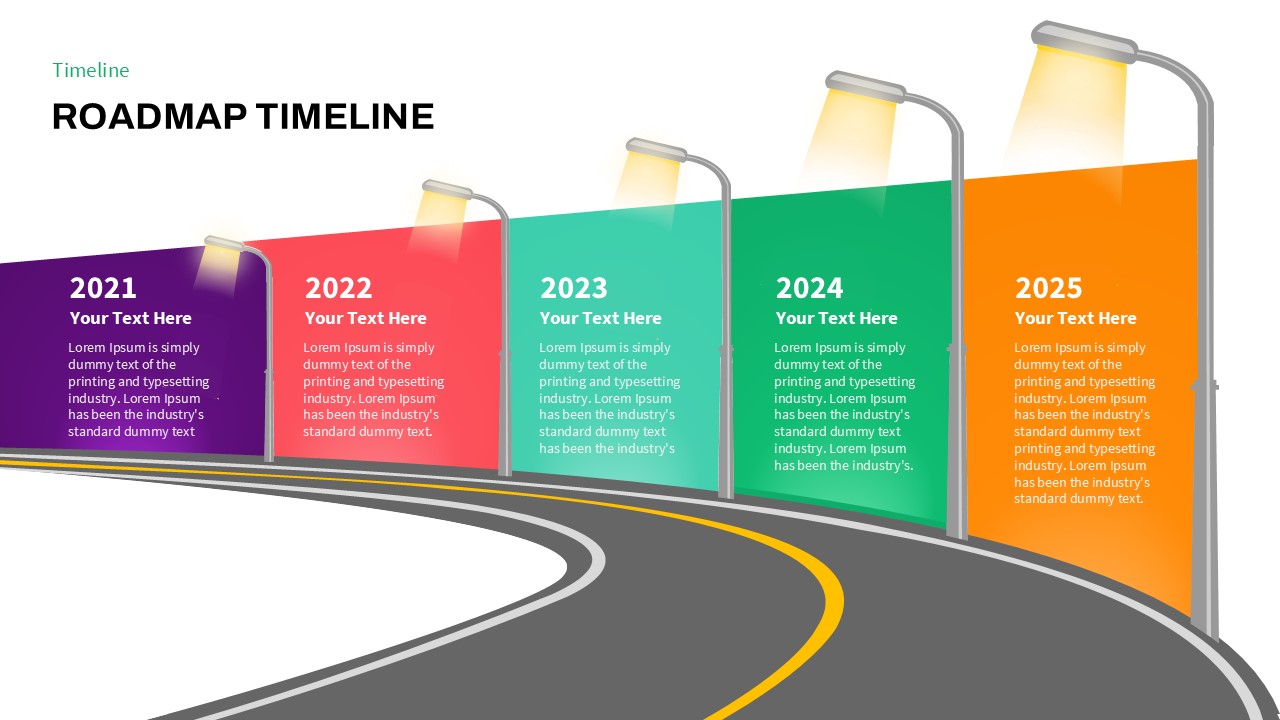
Curved Road Roadmap Timeline Diagram Template for PowerPoint & Google Slides
Roadmap
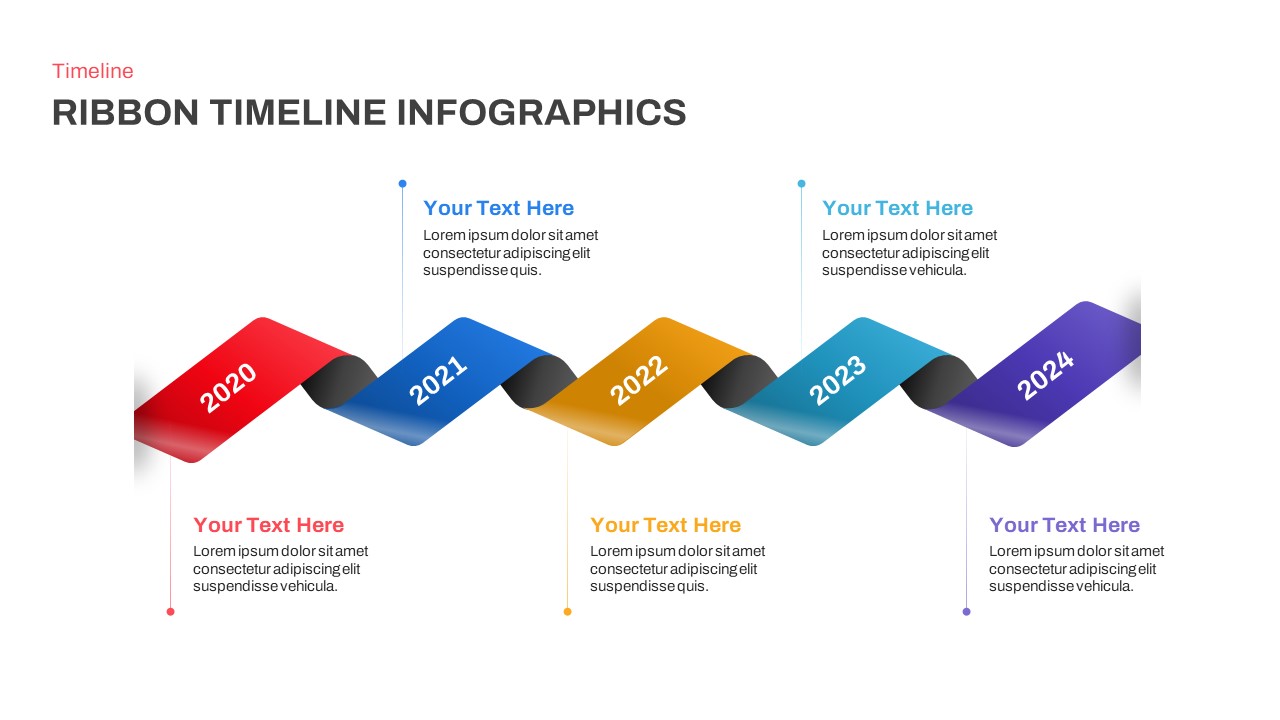
Five-Year Ribbon Timeline Diagram Template for PowerPoint & Google Slides
Timeline
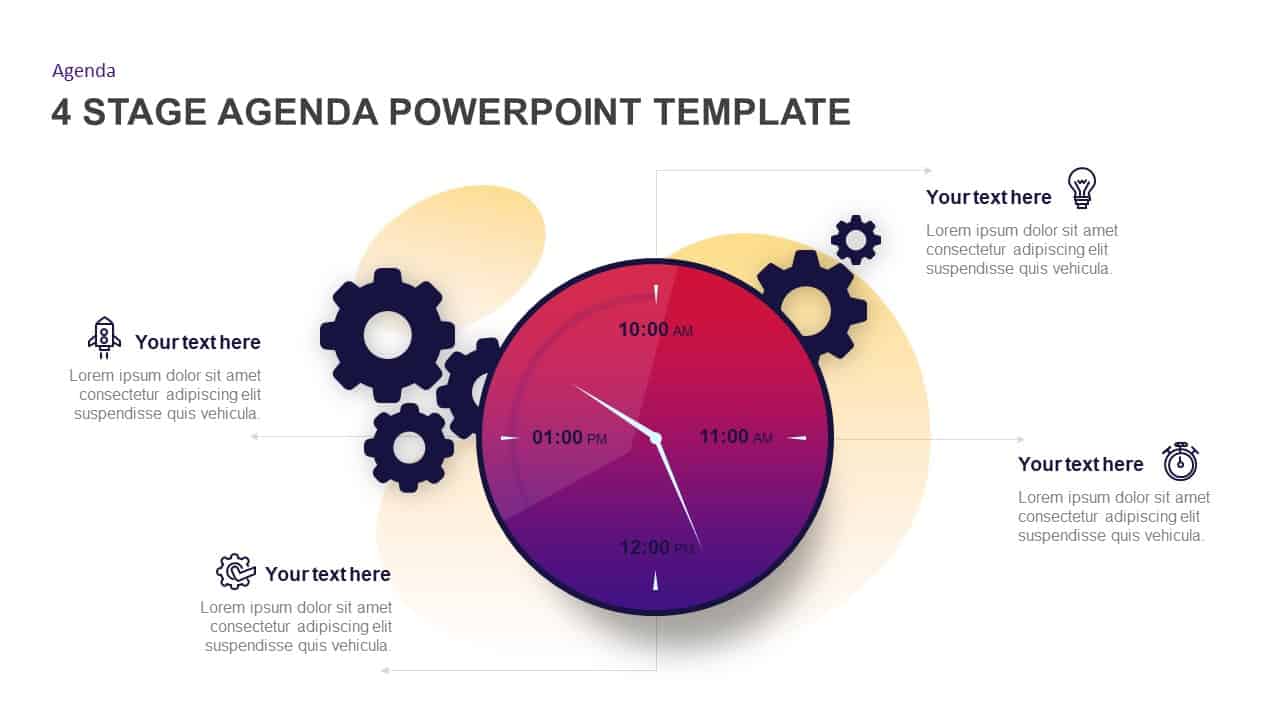
Gradient Clock Agenda Timeline Diagram Template for PowerPoint & Google Slides
Agenda
Six-Stage Arrow Timeline Diagram Template for PowerPoint & Google Slides
Timeline
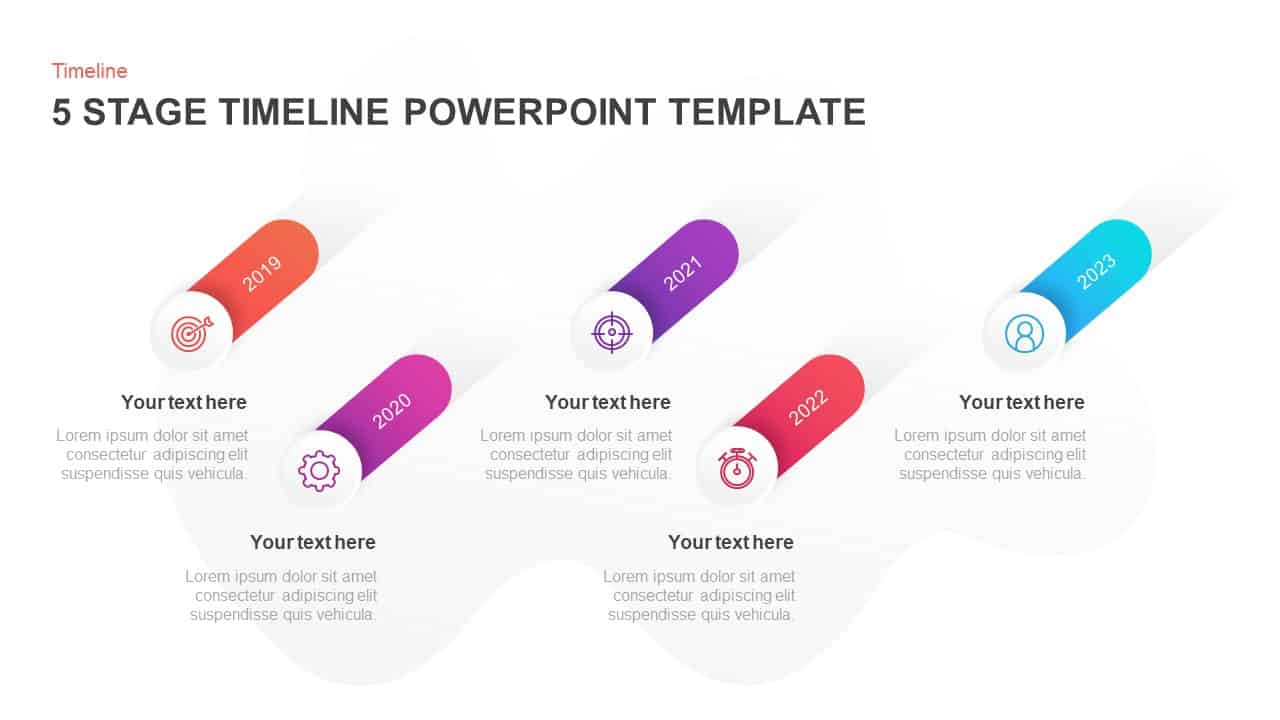
Five-Stage Slanted Timeline Diagram Template for PowerPoint & Google Slides
Timeline
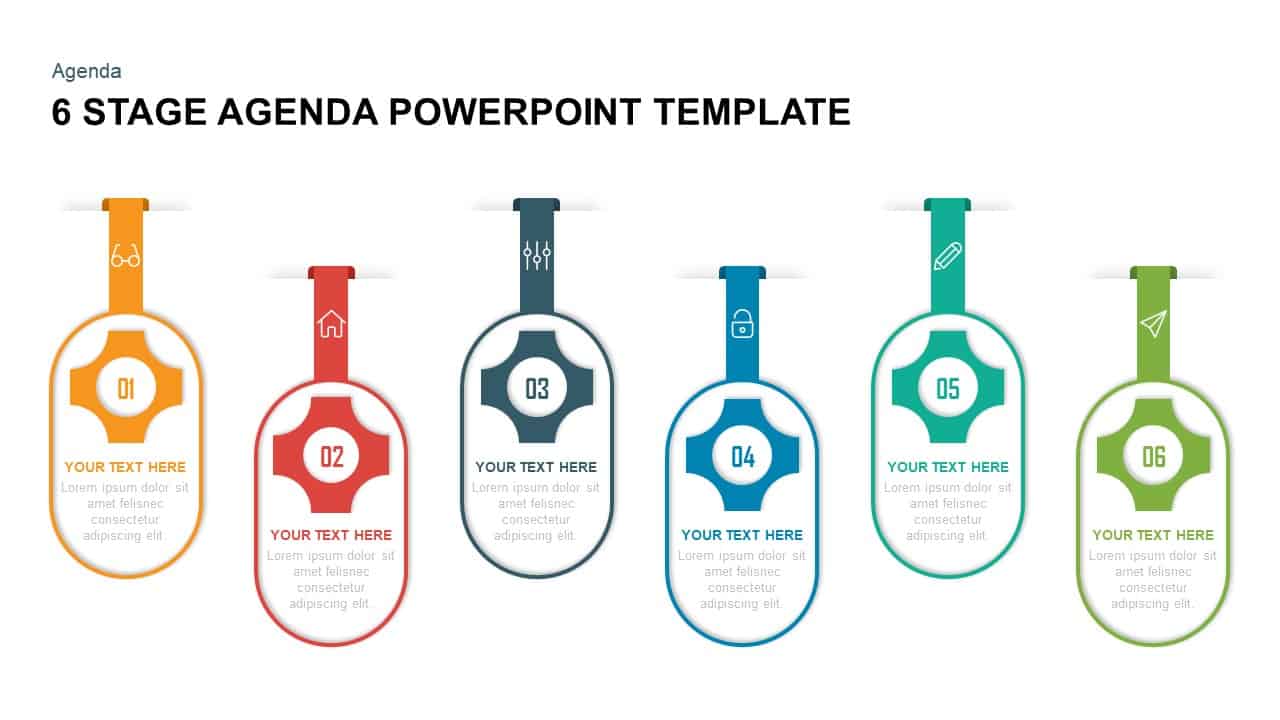
Six Stage Agenda Timeline Diagram template for PowerPoint & Google Slides
Agenda
Evolution of Bicycle Timeline Diagram Template for PowerPoint & Google Slides
Timeline
Overlapping Timeline Gantt Chart Diagram Template for PowerPoint & Google Slides
Timeline
Five-Step Cascade Diagram & Timeline Template for PowerPoint & Google Slides
Process
12-Month Timeline Diagram Template for PowerPoint & Google Slides
Timeline
Performance Appraisal Timeline Diagram Template for PowerPoint & Google Slides
Timeline
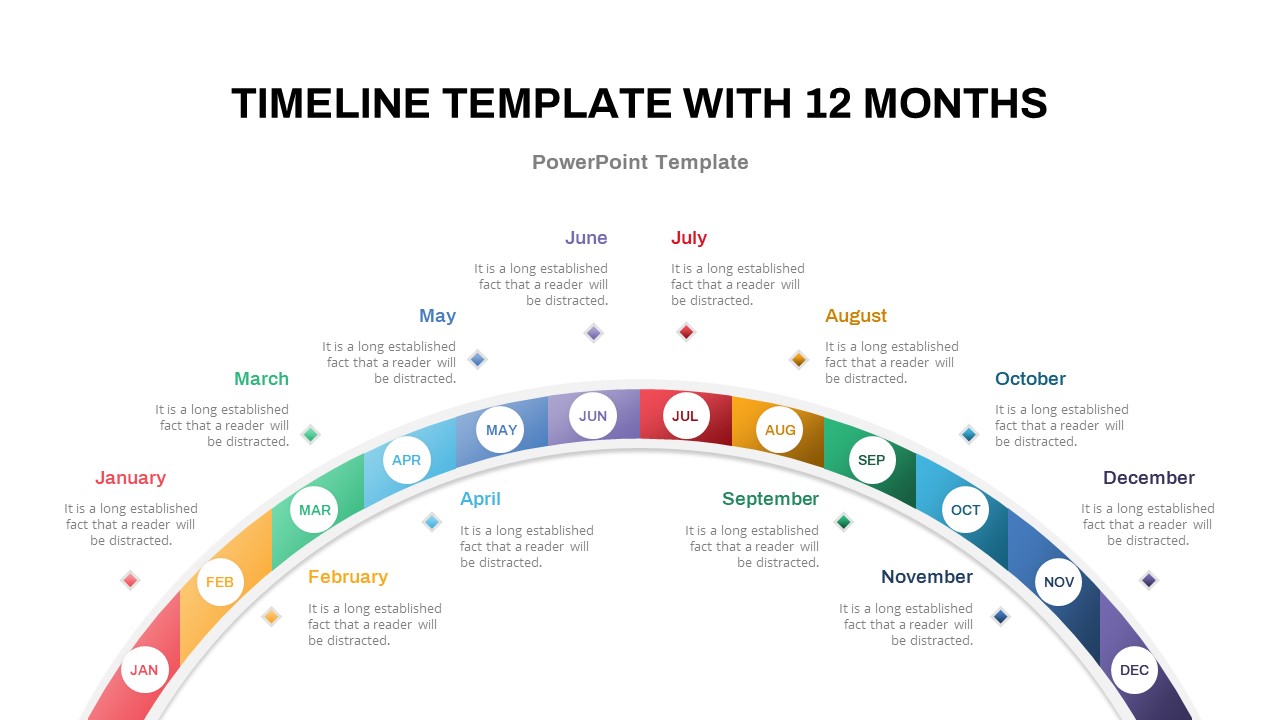
12-Month Semi-Circular Timeline Diagram Template for PowerPoint & Google Slides
Timeline
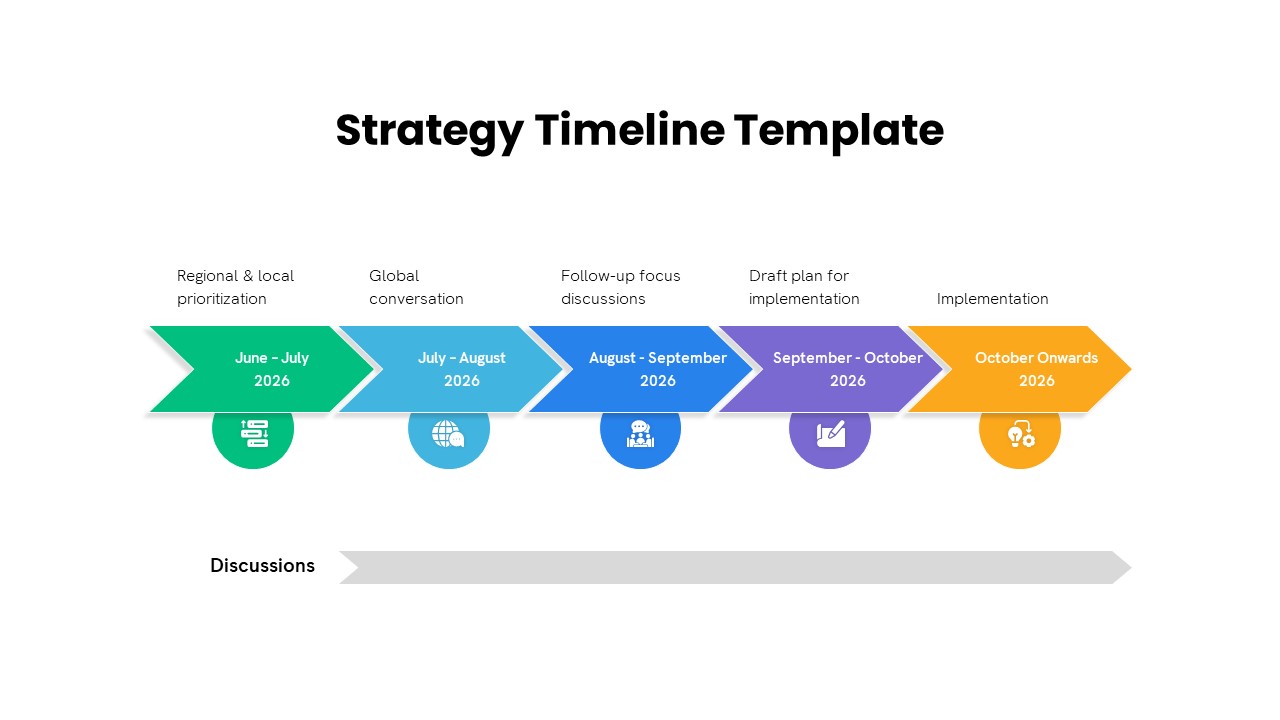
Five-Phase Strategy Timeline Diagram Template for PowerPoint & Google Slides
Timeline
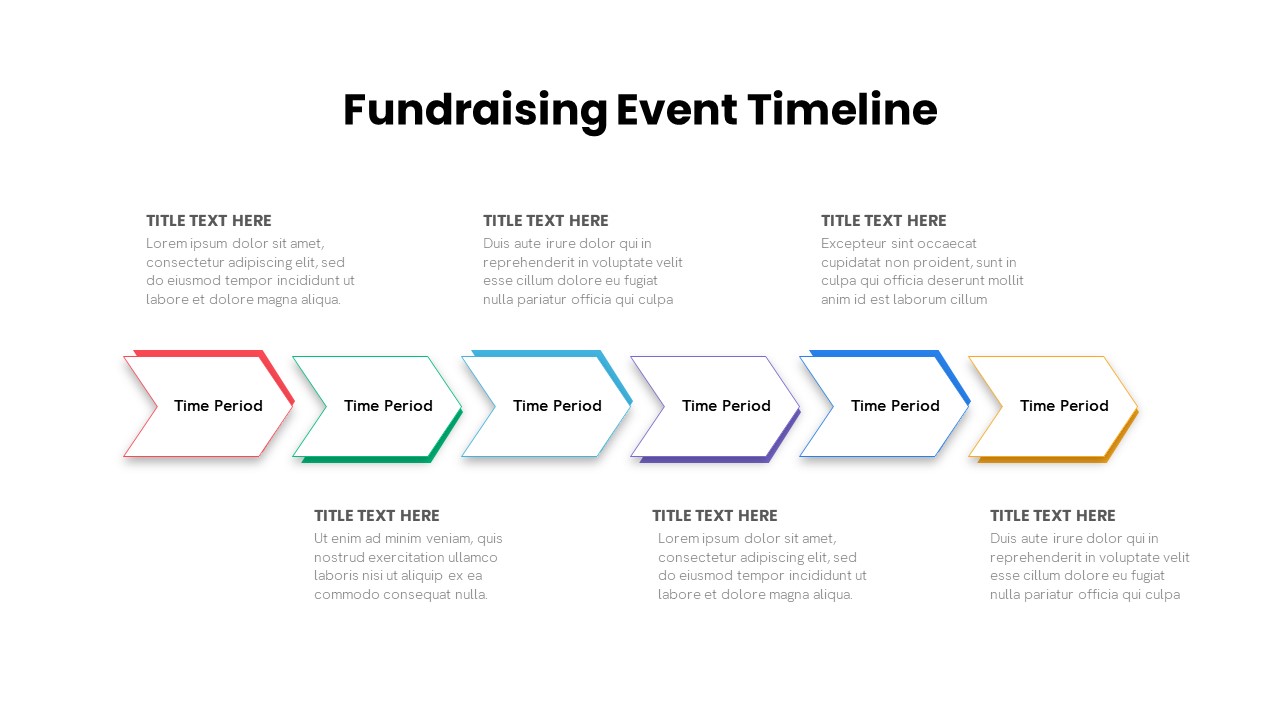
Fundraising Event Timeline Diagram Template for PowerPoint & Google Slides
Timeline
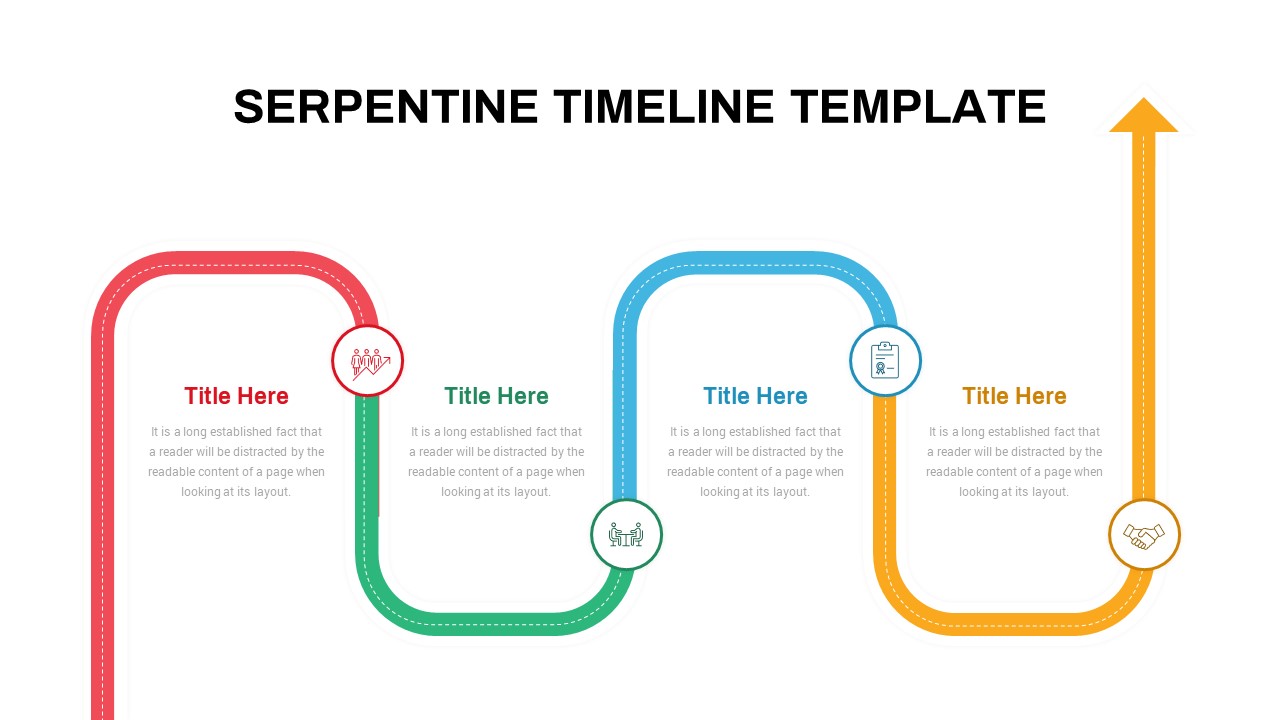
Interactive Serpentine Timeline Diagram Template for PowerPoint & Google Slides
Timeline
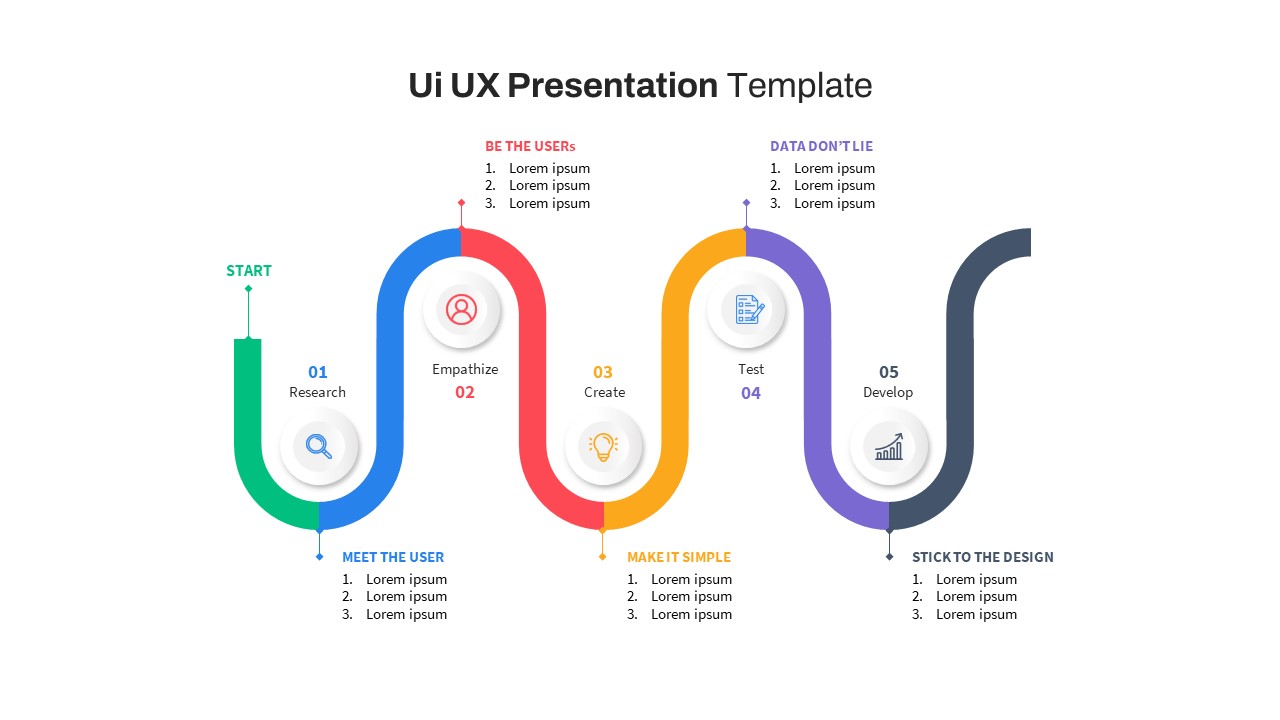
Free UI/UX Process Timeline Diagram Template for PowerPoint & Google Slides
Process
Free
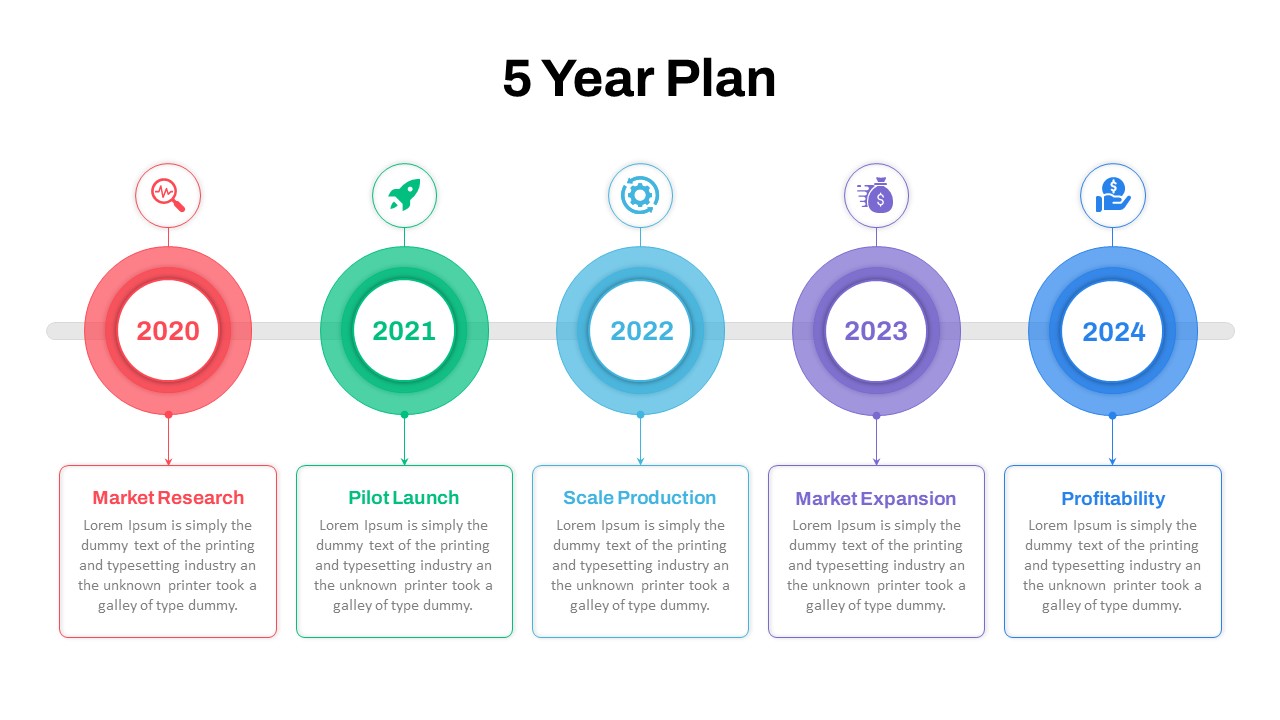
Five-Year Plan Timeline Diagram Template for PowerPoint & Google Slides
Timeline
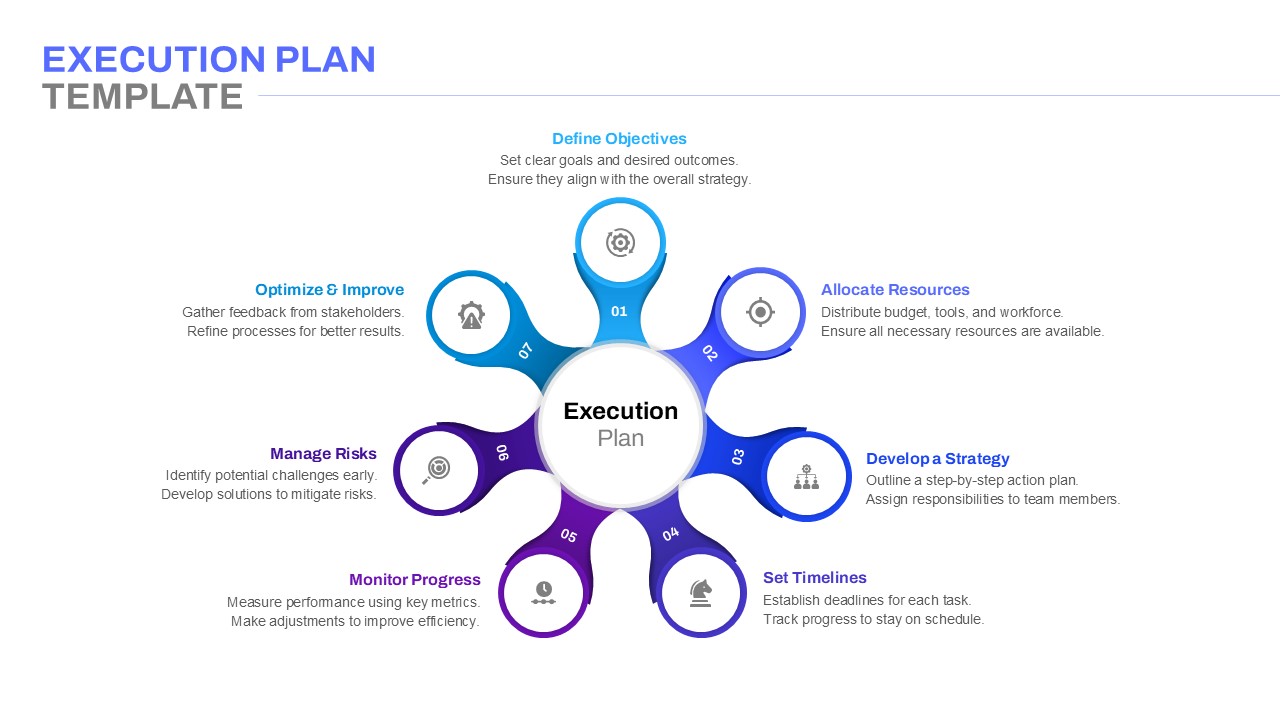
Execution Plan Timeline Diagram Template for PowerPoint & Google Slides
Timeline
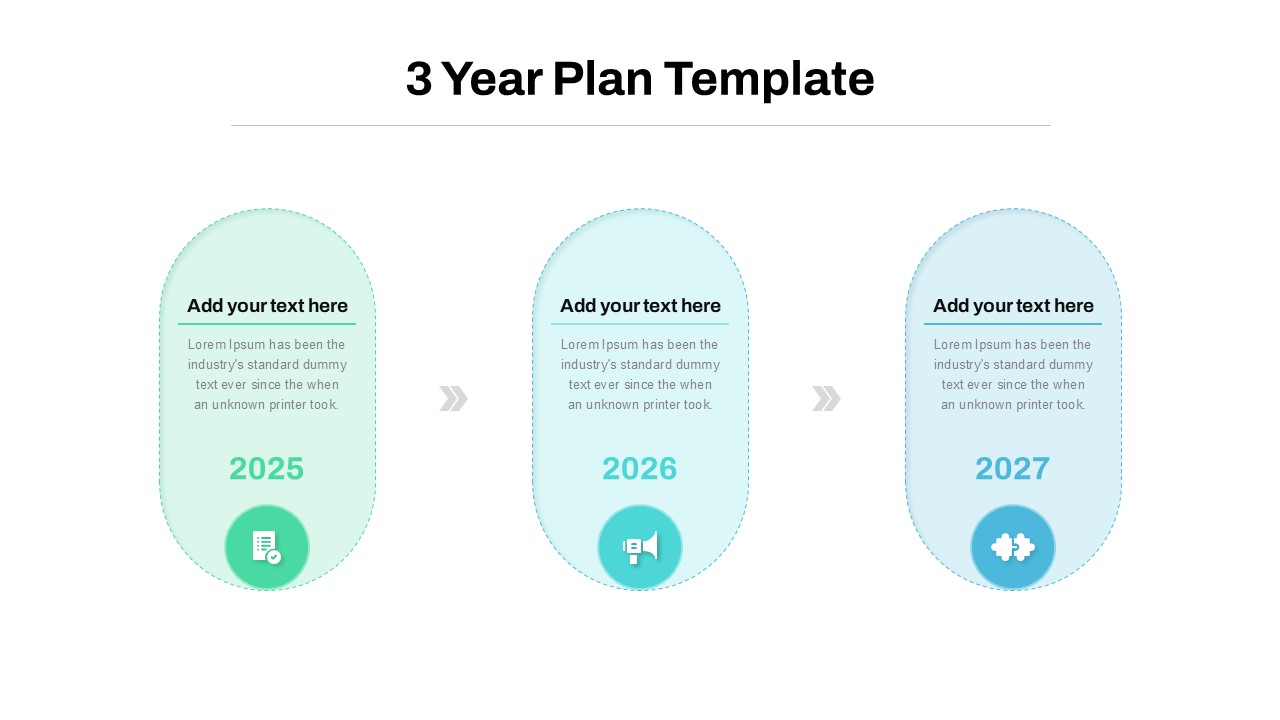
Three-Year Plan Timeline Diagram Template for PowerPoint & Google Slides
Timeline
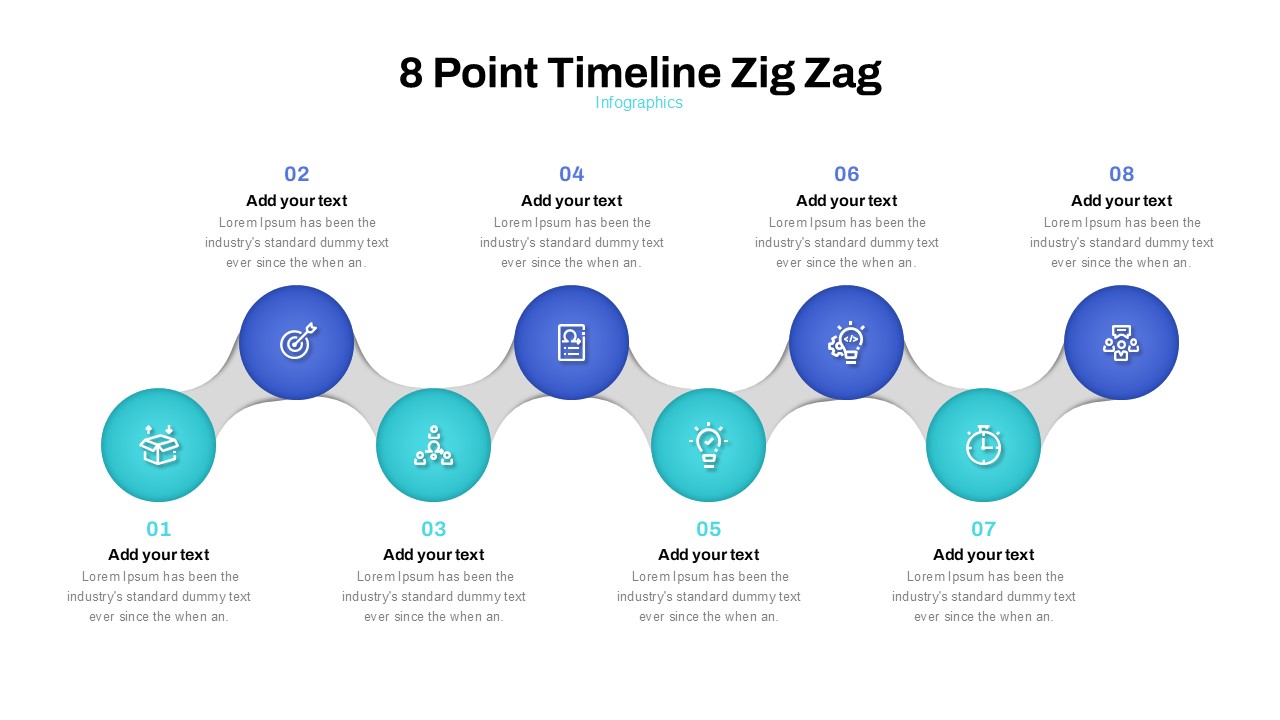
Zig Zag Eight-Point Timeline Diagram Template for PowerPoint & Google Slides
Timeline
Six Stage Timeline Diagram for PowerPoint & Google Slides
Timeline
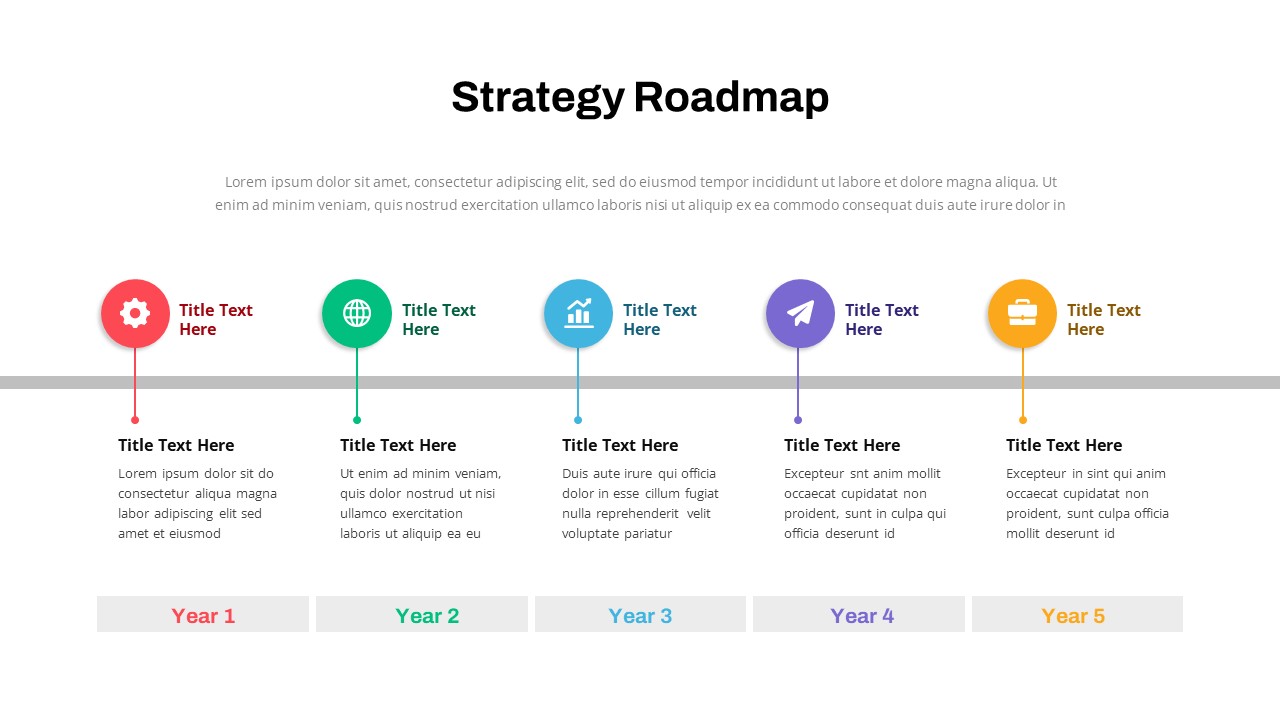
Strategy Roadmap Timeline Slides Template for PowerPoint & Google Slides
Roadmap
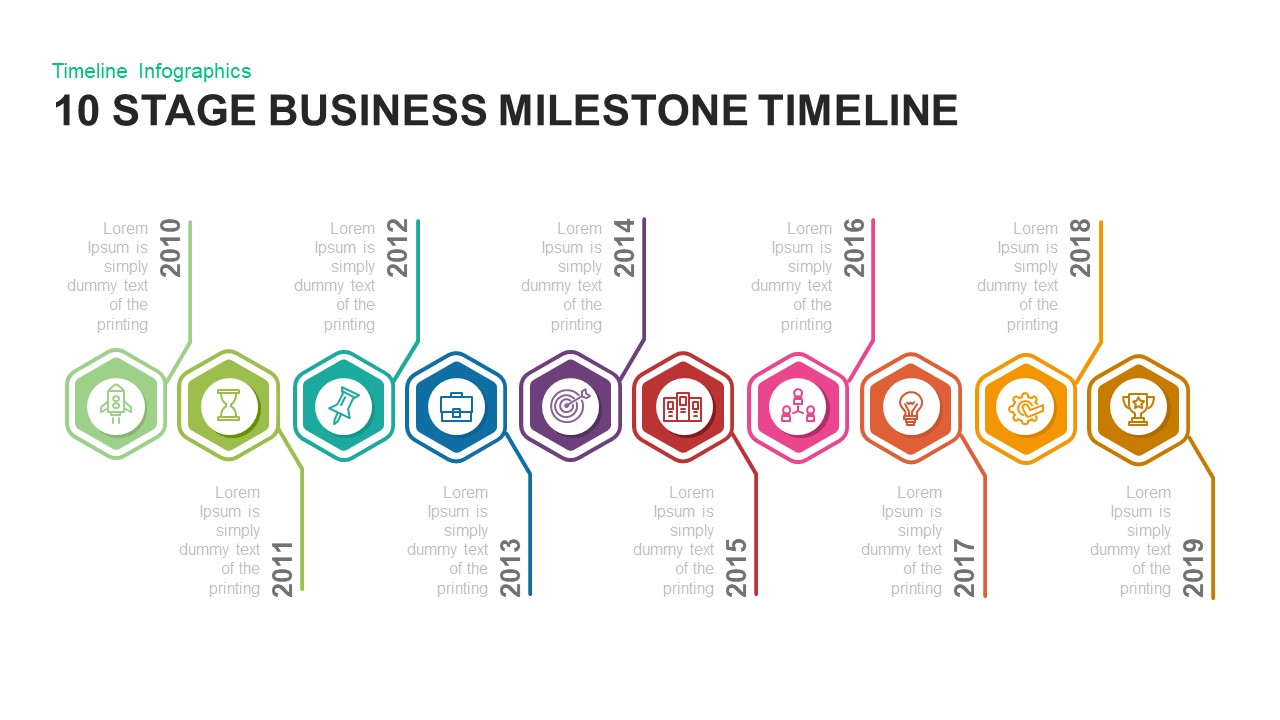
10 Stage Business Milestone Timeline PowerPoint Template for PowerPoint & Google Slides
Timeline
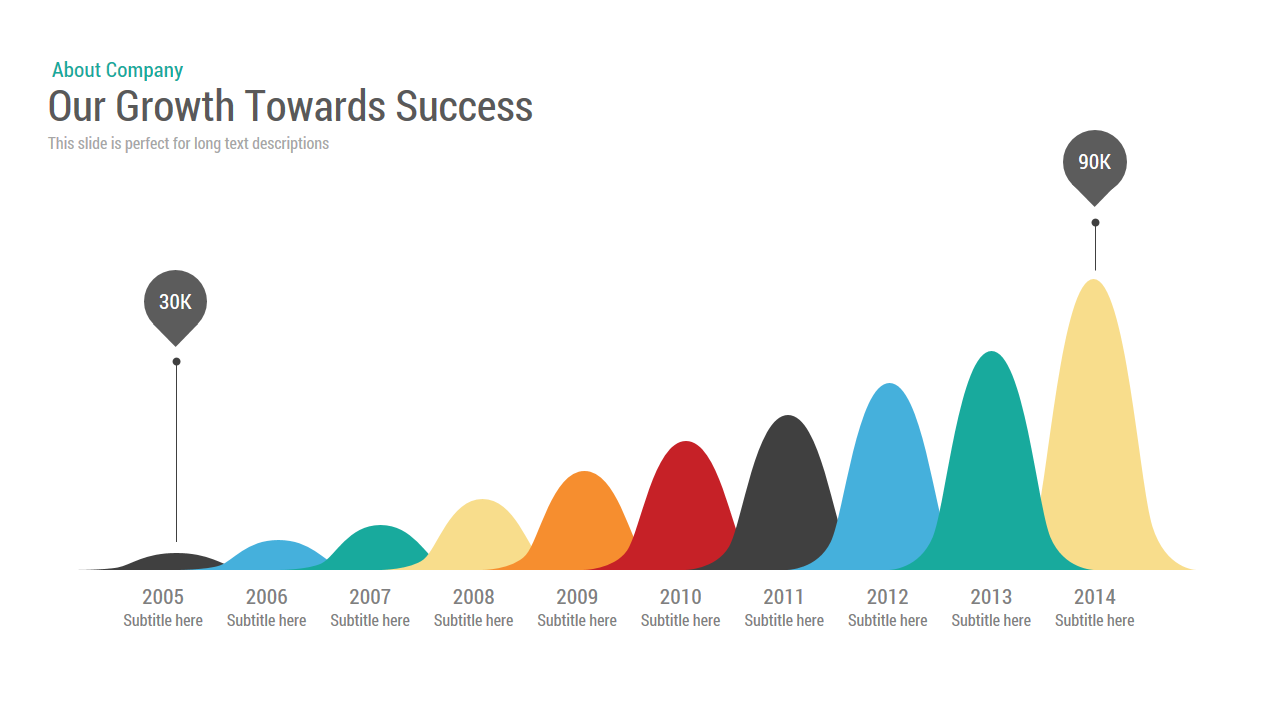
Growth Timeline template for PowerPoint & Google Slides
Timeline
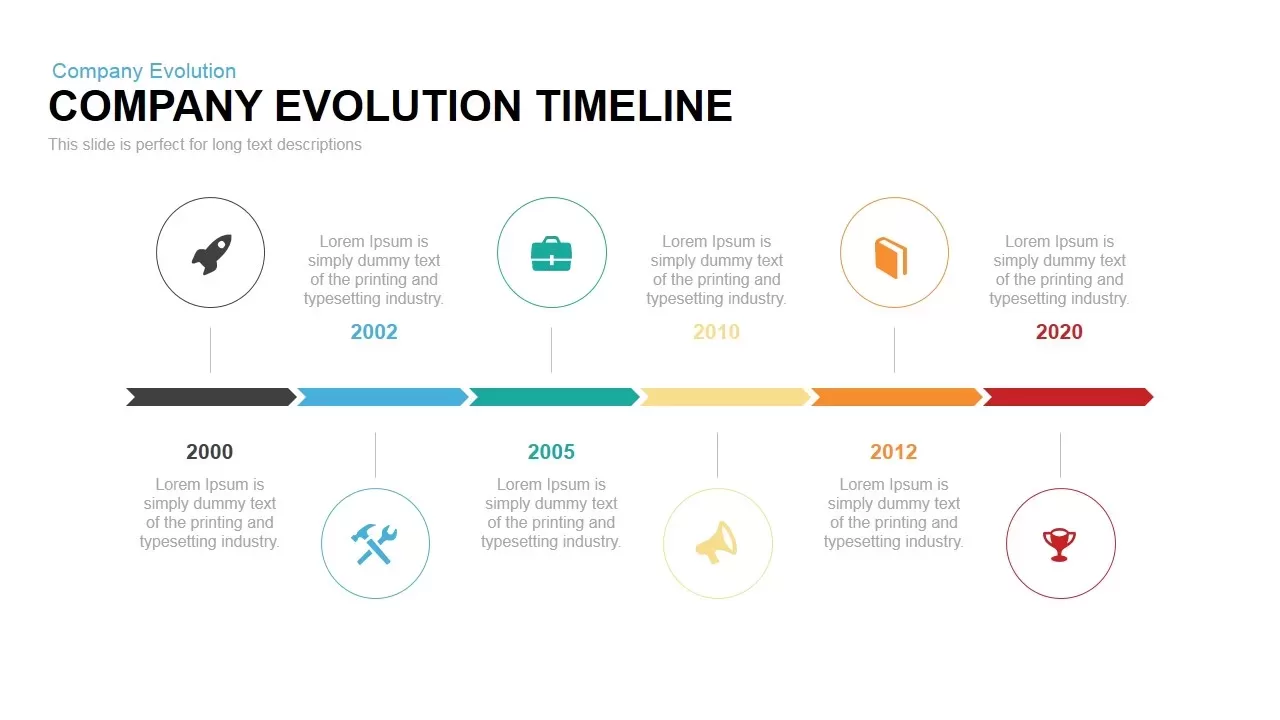
Evolution Timeline template for PowerPoint & Google Slides
Timeline
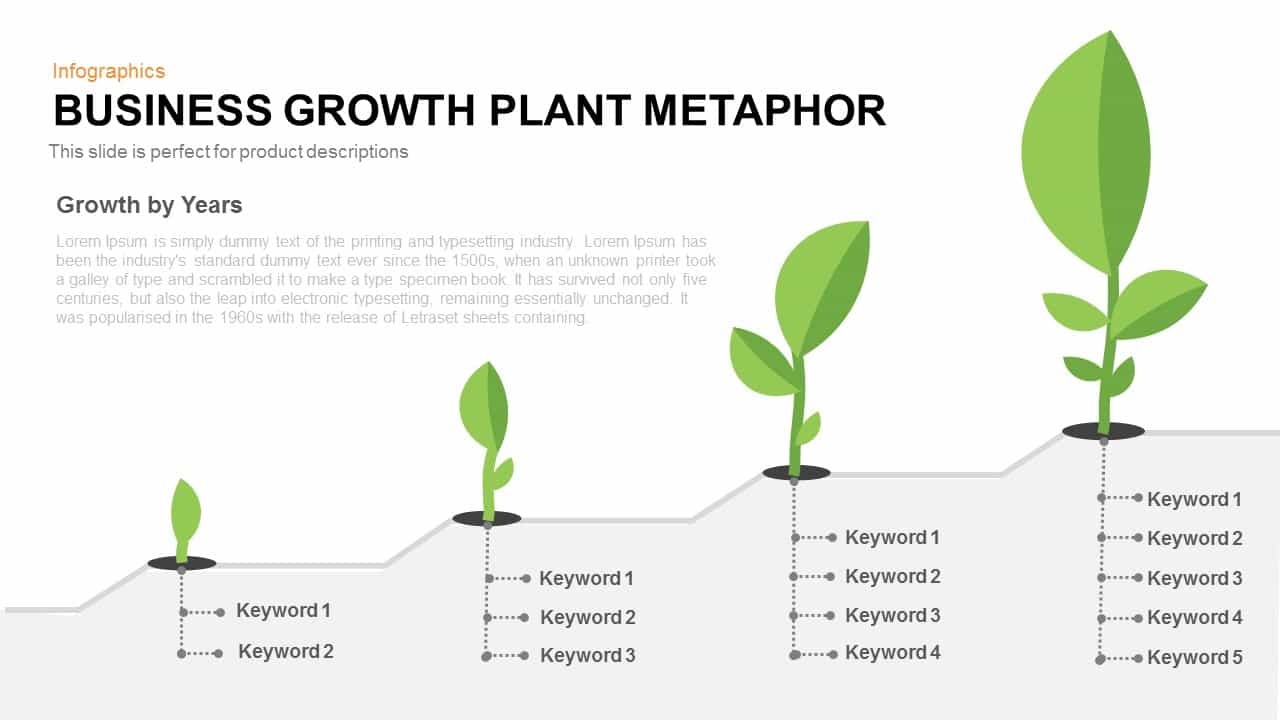
Business Growth Plant Metaphor Timeline Template for PowerPoint & Google Slides
Business Strategy
Curved Five-Section Timeline Infographic template for PowerPoint & Google Slides
Timeline

Deadline Metaphor Timeline & Hourglass Template for PowerPoint & Google Slides
Project
Five-Stage Arrow Infographics Timeline Template for PowerPoint & Google Slides
Arrow
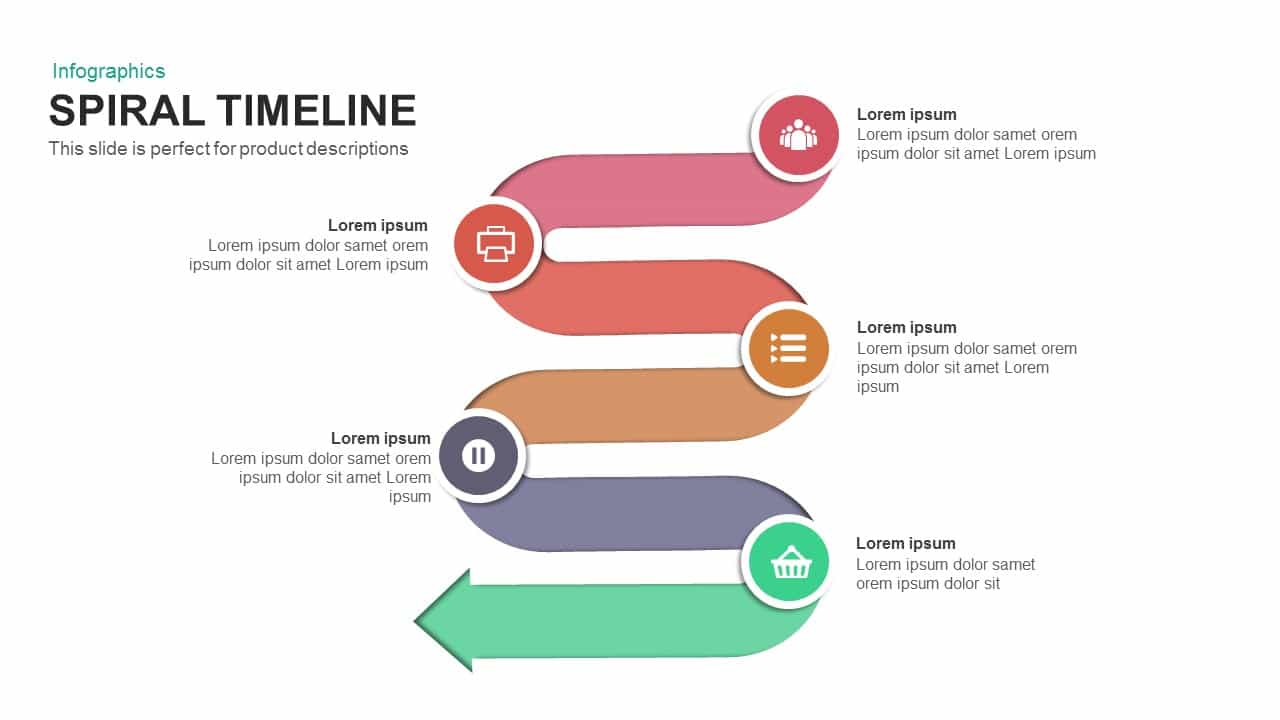
Six-Stage Colorful Spiral Timeline Template for PowerPoint & Google Slides
Timeline
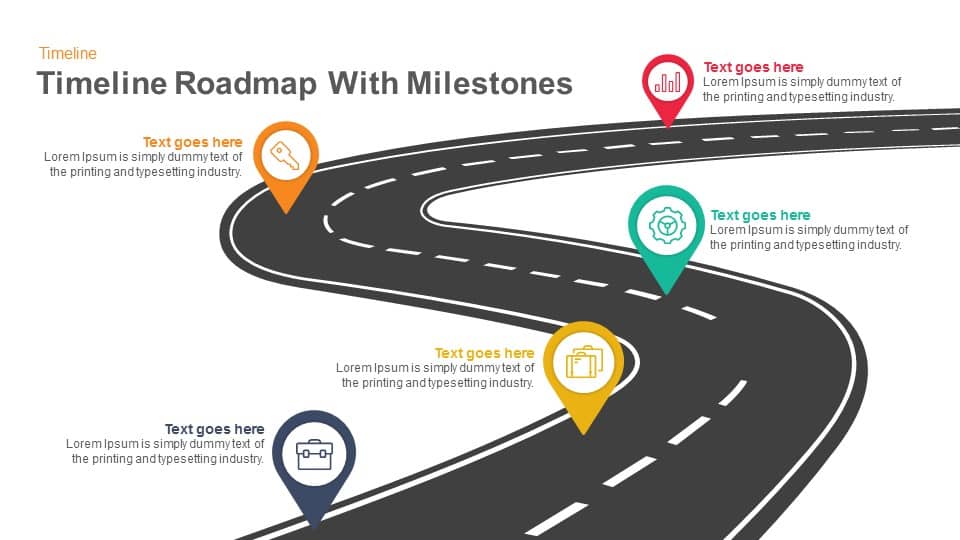
Timeline Roadmap with Milestones template for PowerPoint & Google Slides
Roadmap

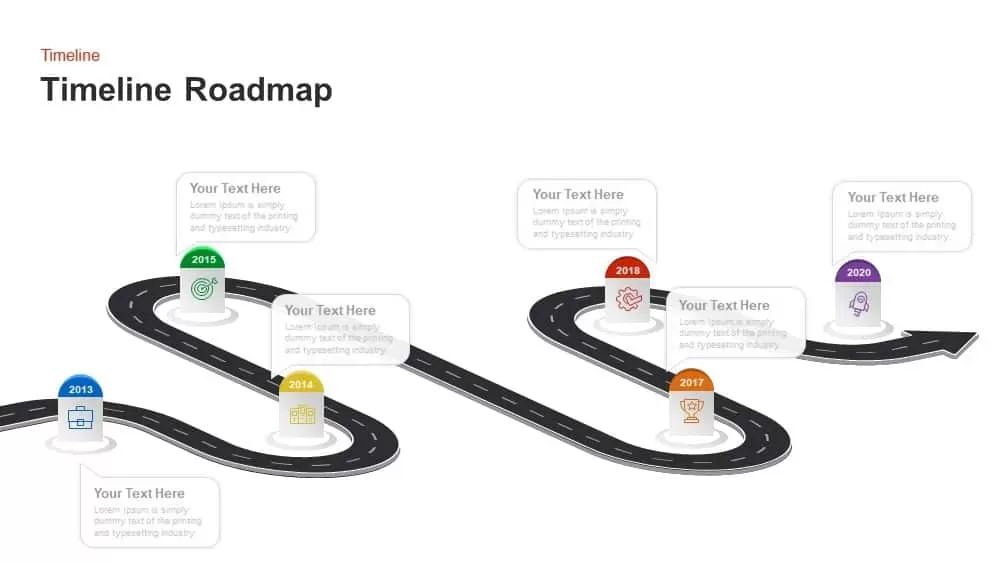
Timeline Roadmap Milestones Infographic Template for PowerPoint & Google Slides
Roadmap
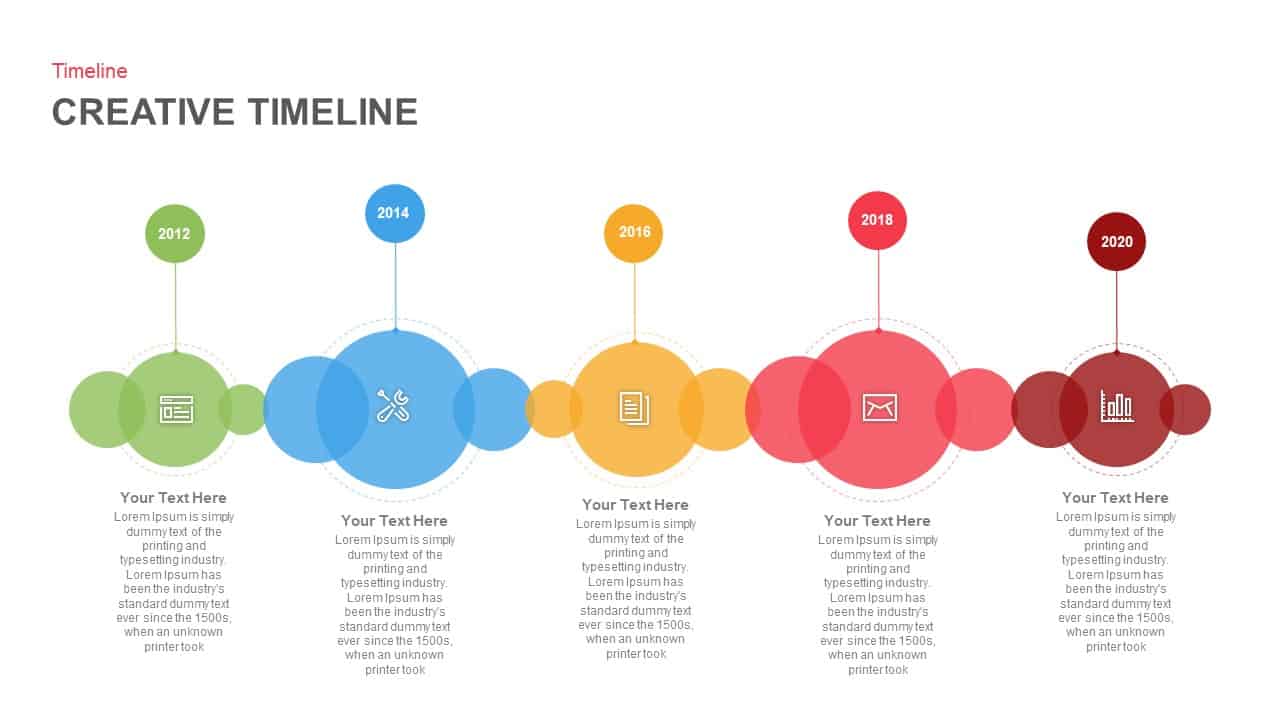
Creative Bubble Timeline Infographic Template for PowerPoint & Google Slides
Timeline
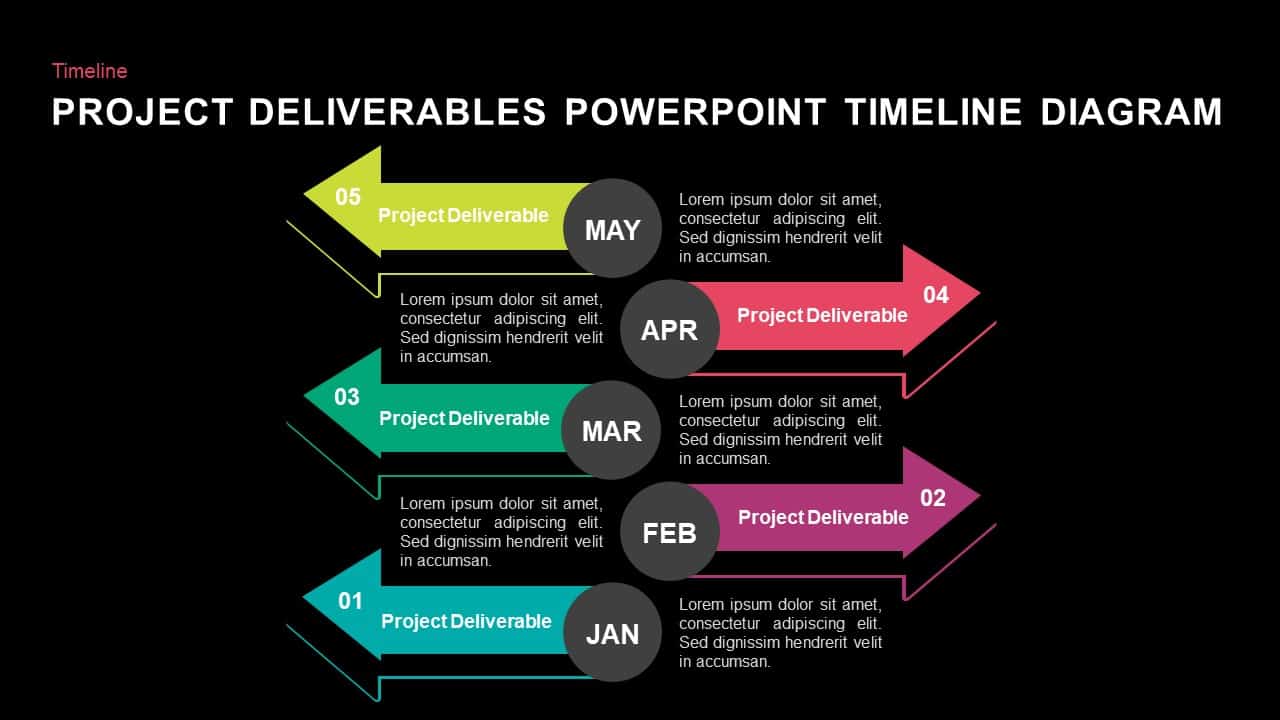
Project Deliverables Timeline Template for PowerPoint & Google Slides
Timeline
Wavy Ribbon Timeline Infographics Template for PowerPoint & Google Slides
Timeline
Five-Step Gradient Agenda Timeline Template for PowerPoint & Google Slides
Agenda
Animated 5-Stage Puzzle Timeline Infographic Template for PowerPoint & Google Slides
Timeline
Five-Year Gradient Timeline Infographic Template for PowerPoint & Google Slides
Timeline
Product Development Plan Timeline Template for PowerPoint & Google Slides
Timeline
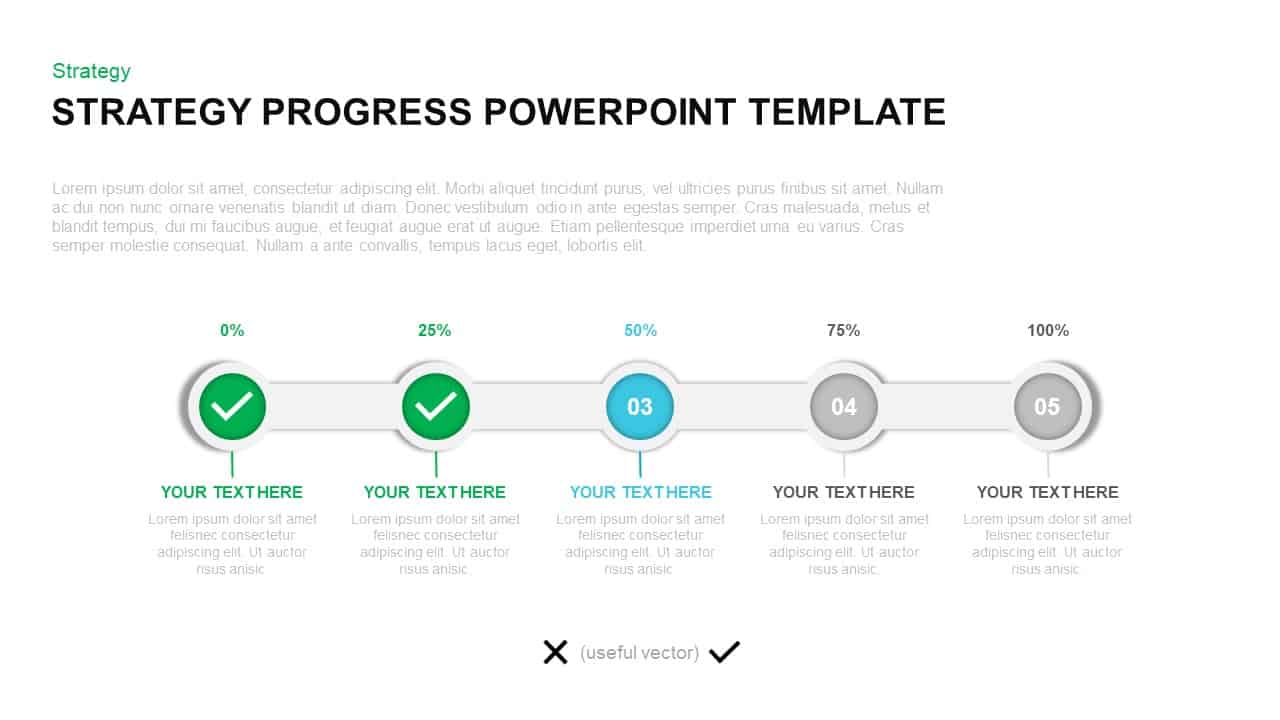
Strategy Progress Timeline Template for PowerPoint & Google Slides
Process
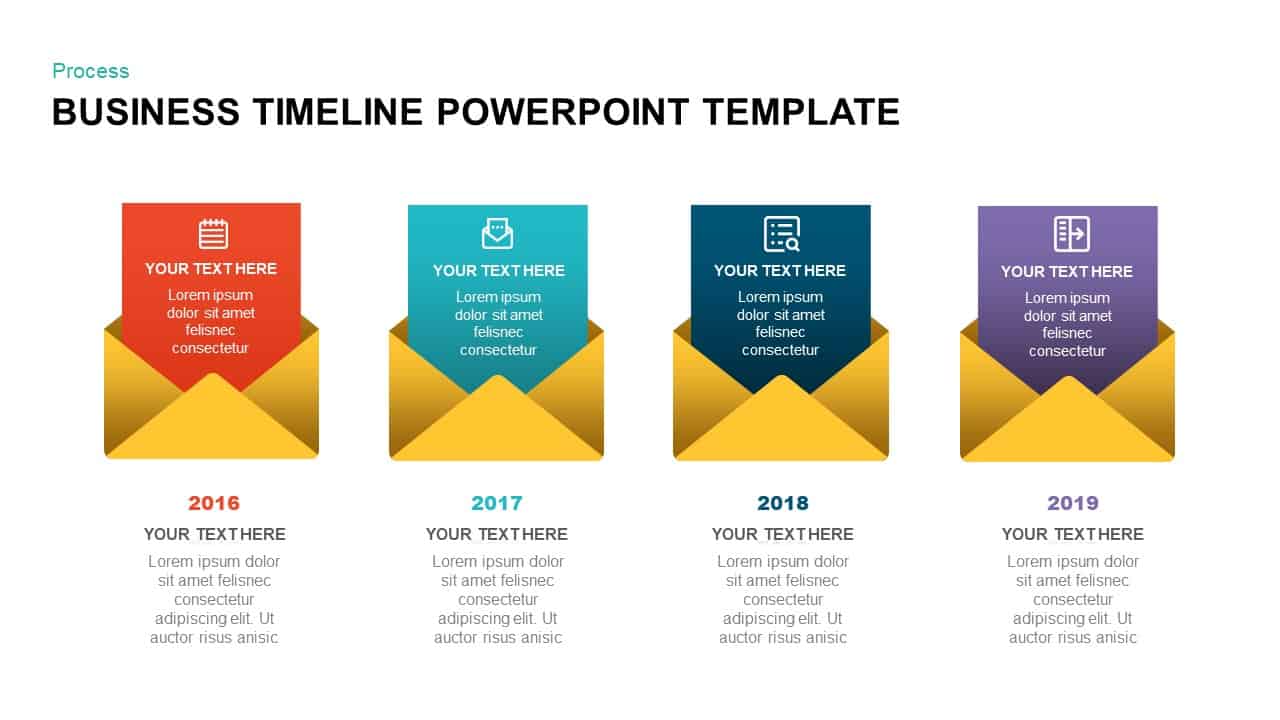
Business Timeline Envelope Infographic Template for PowerPoint & Google Slides
Timeline
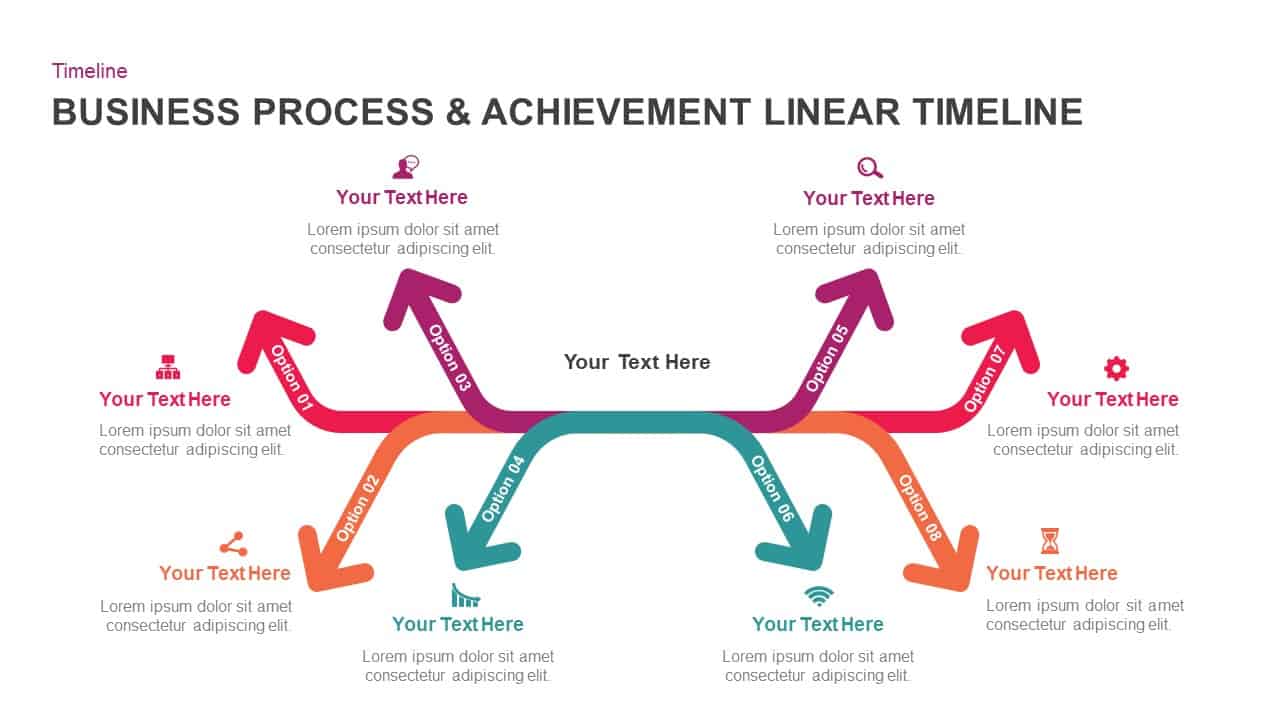
Business Process Achievement Timeline Template for PowerPoint & Google Slides
Timeline
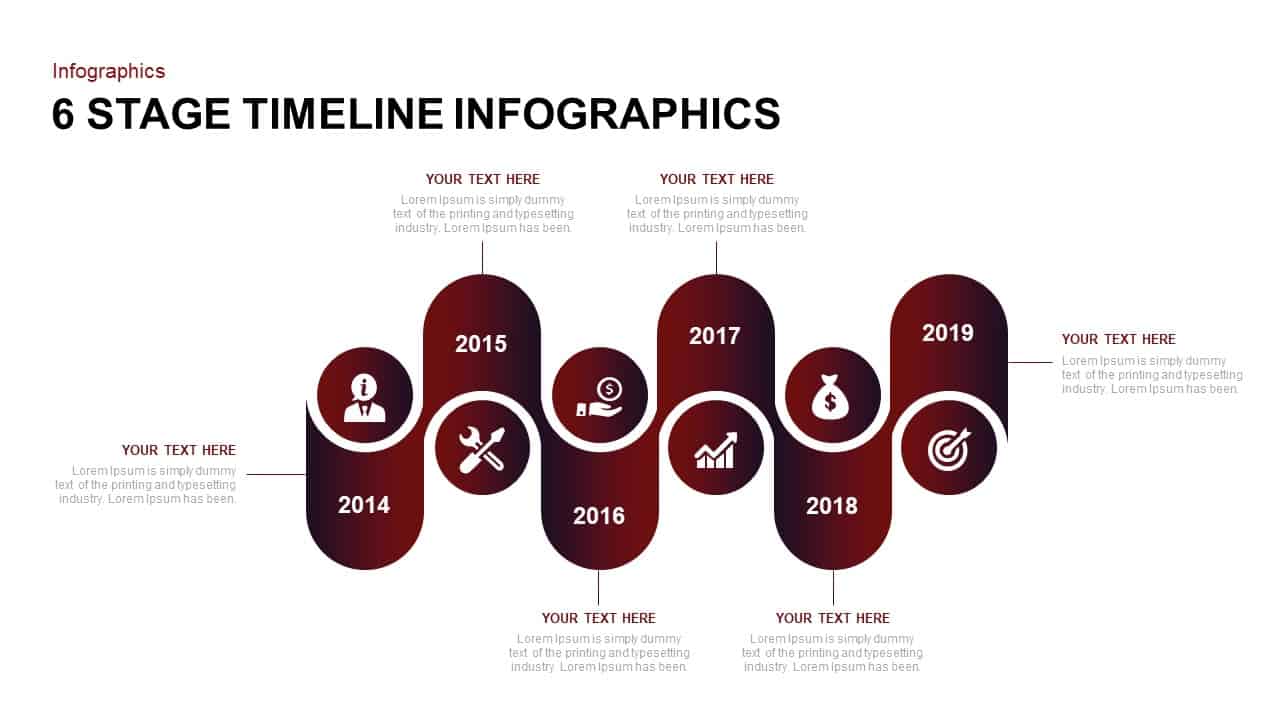
Six-Stage Timeline Infographics Slide Template for PowerPoint & Google Slides
Timeline
Six-Stage Road Map Infographic Timeline Template for PowerPoint & Google Slides
Roadmap
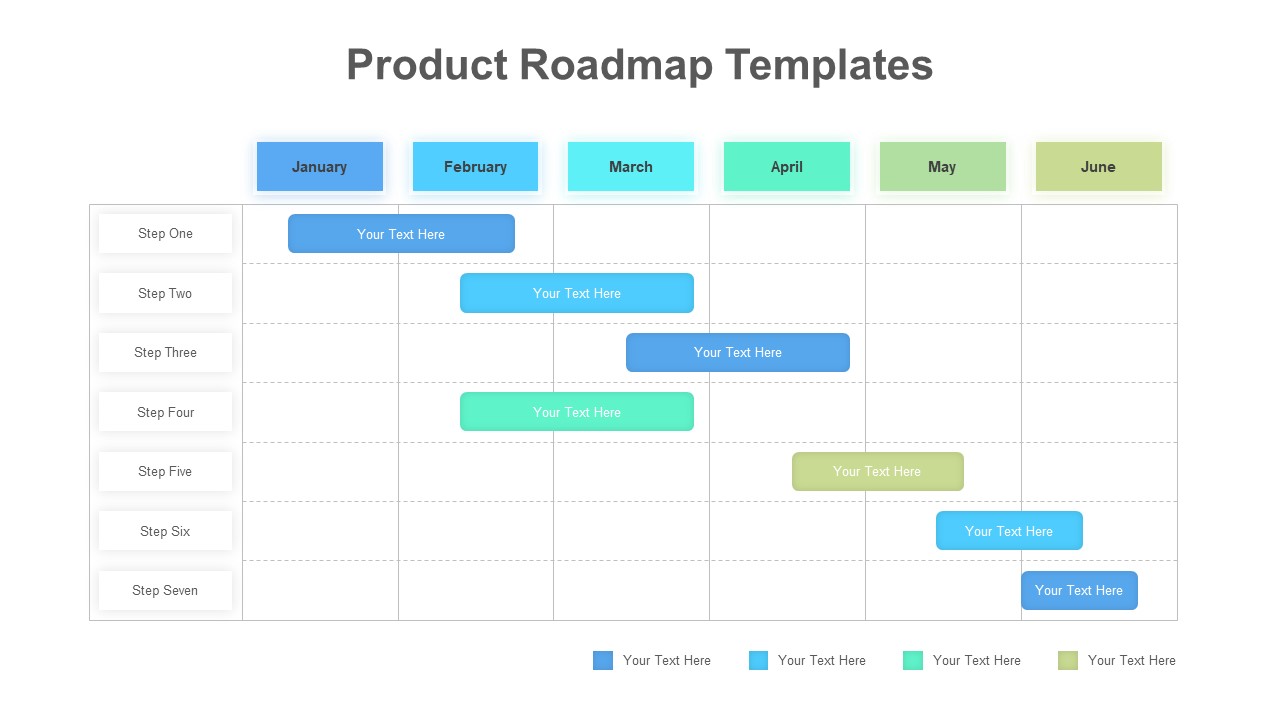
Product Roadmap Timeline template for PowerPoint & Google Slides
Project Status
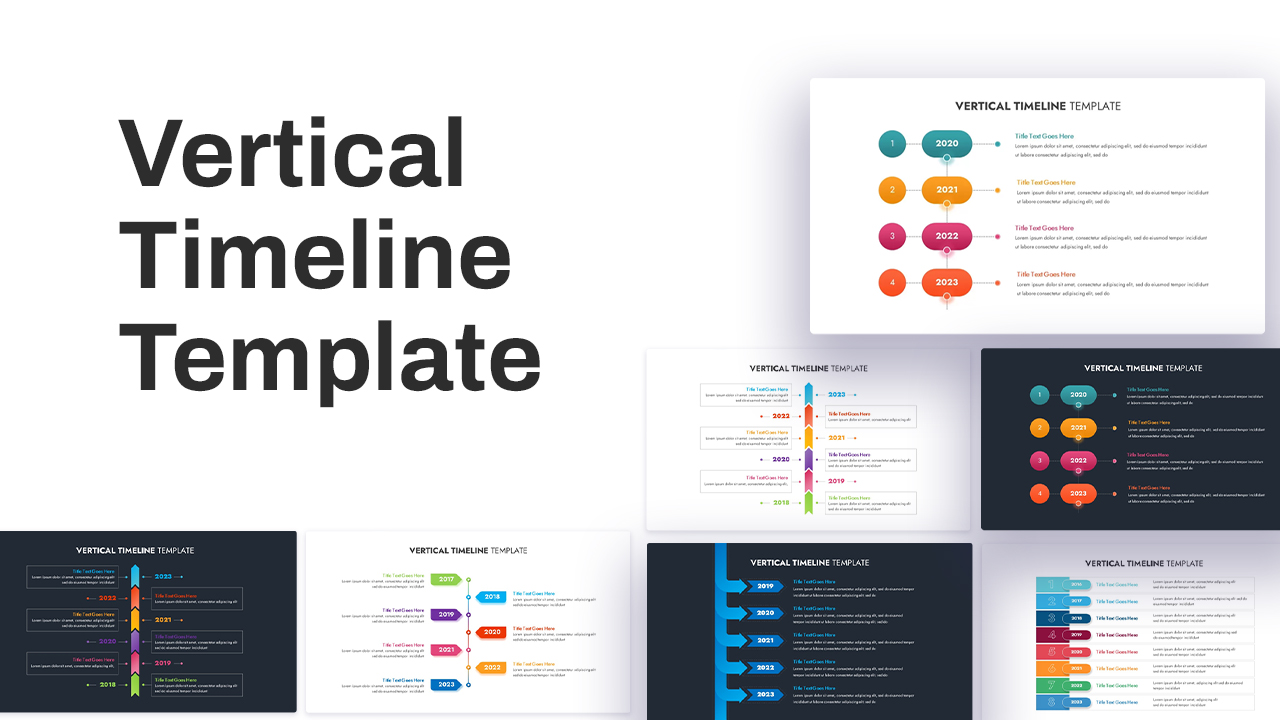
Animated Vertical Timeline Template for PowerPoint & Google Slides
Timeline
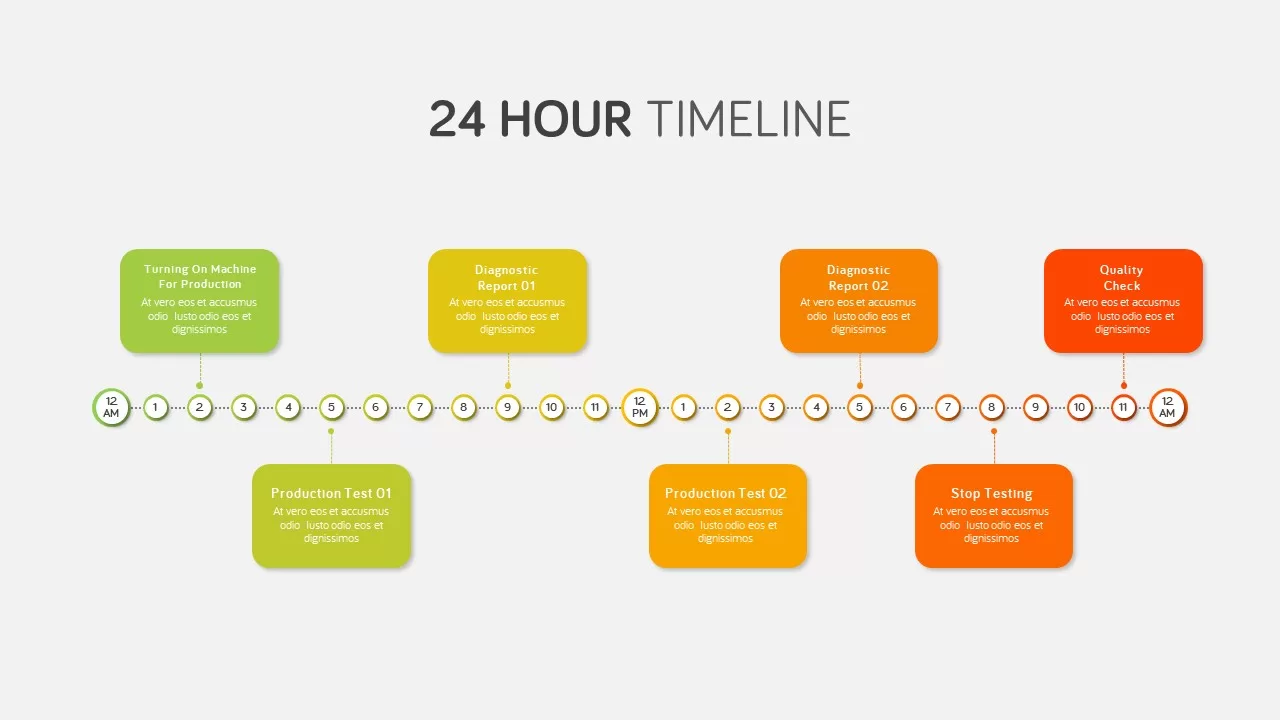
24 Hour Timeline Template for PowerPoint & Google Slides
Timeline
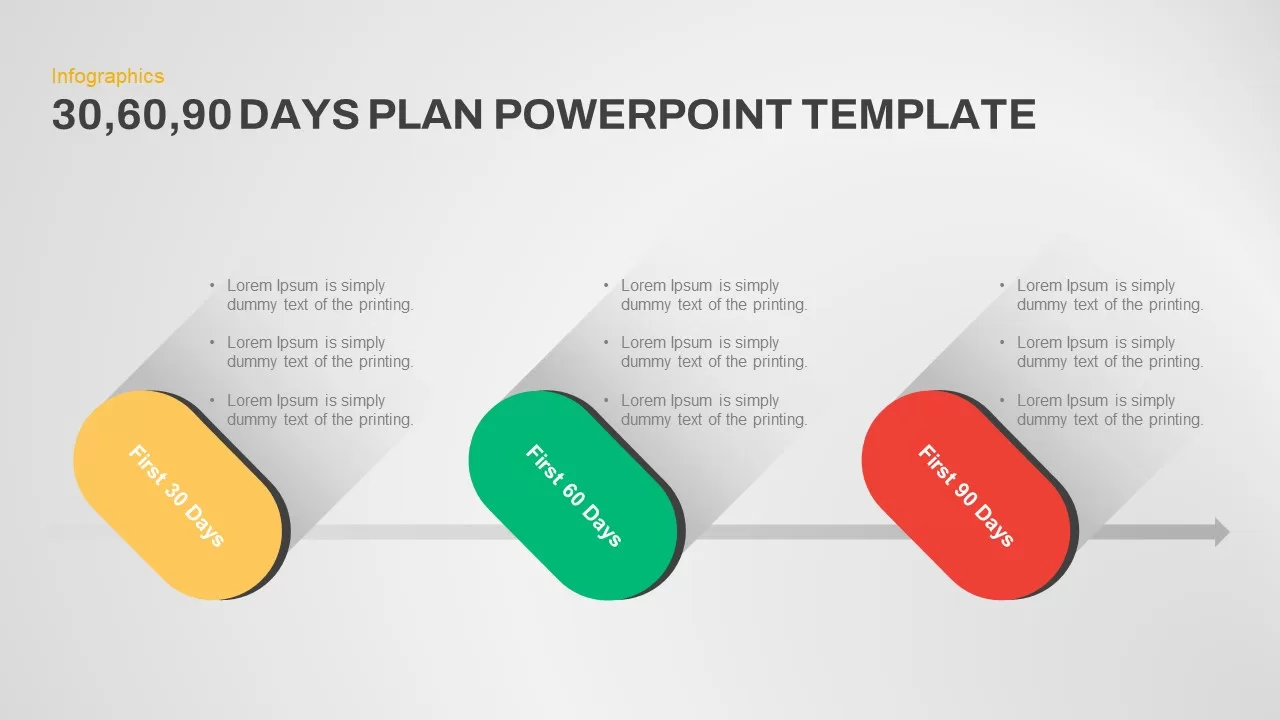
Pill-Style 30-60-90 Timeline Infographic Template for PowerPoint & Google Slides
Timeline
Project Update & Timeline Infographic Template for PowerPoint & Google Slides
Business
Modern 30-60-90 Sales Plan Timeline Template for PowerPoint & Google Slides
Timeline
Free Multi-Year Arrow Timeline Infographic Template for PowerPoint & Google Slides
Timeline
Free
Free Five-Step Circular Timeline Infographic Template for PowerPoint & Google Slides
Timeline
Free
Timeline Infographic Steps template for PowerPoint & Google Slides
Business Plan
Interactive Project Gantt Chart Timeline Template for PowerPoint & Google Slides
Gantt Chart
Animated Implementation Timeline Chart Template for PowerPoint & Google Slides
Timeline
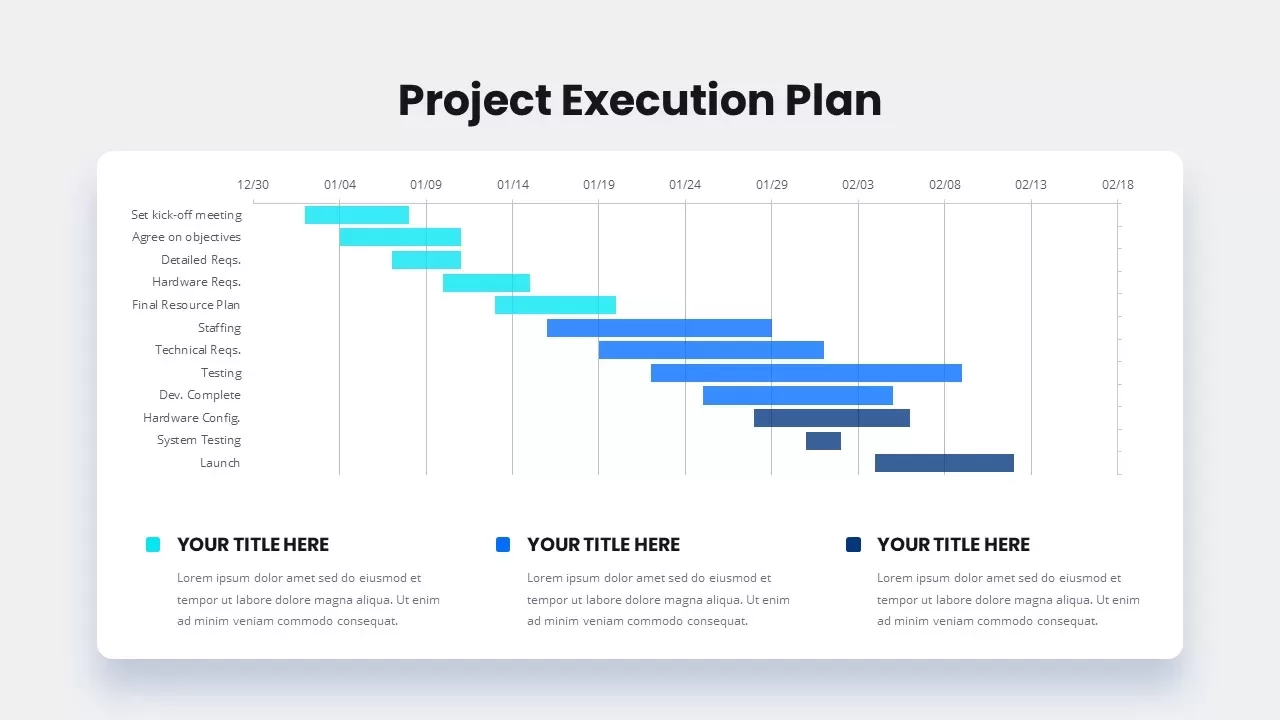
Project Execution Gantt Timeline Template for PowerPoint & Google Slides
Gantt Chart
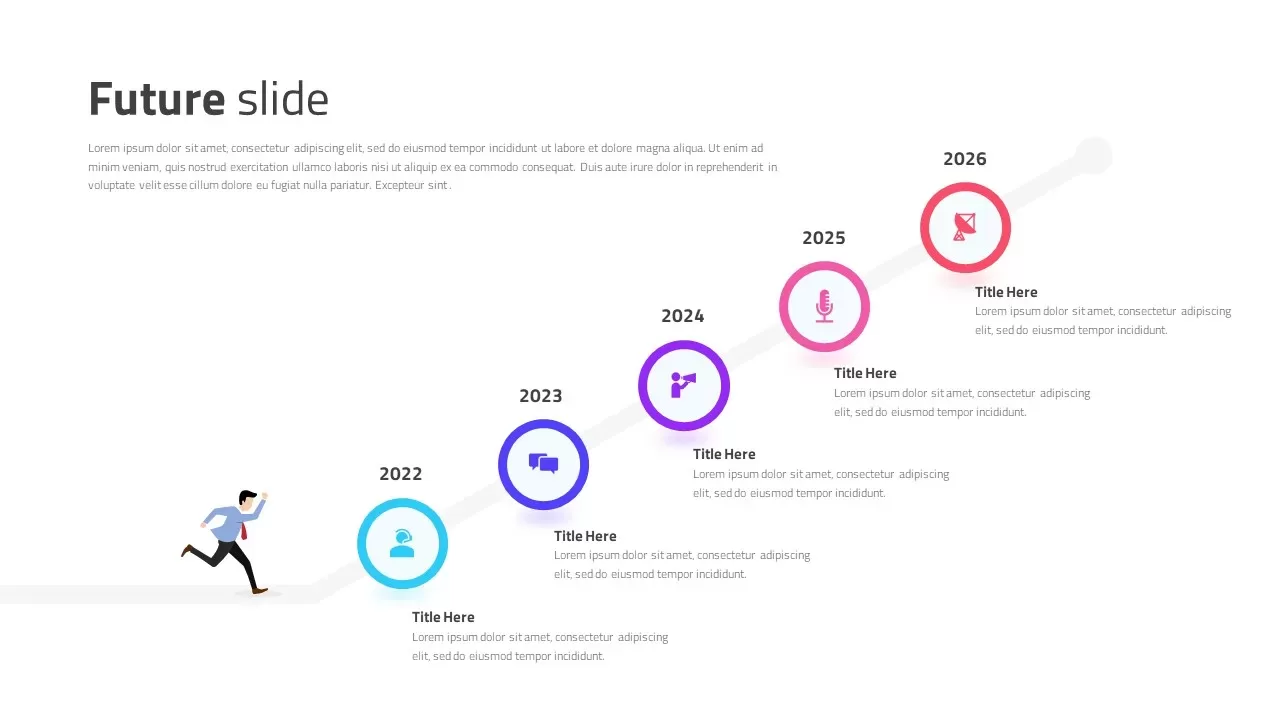
Diagonal Future Timeline Template for PowerPoint & Google Slides
Timeline
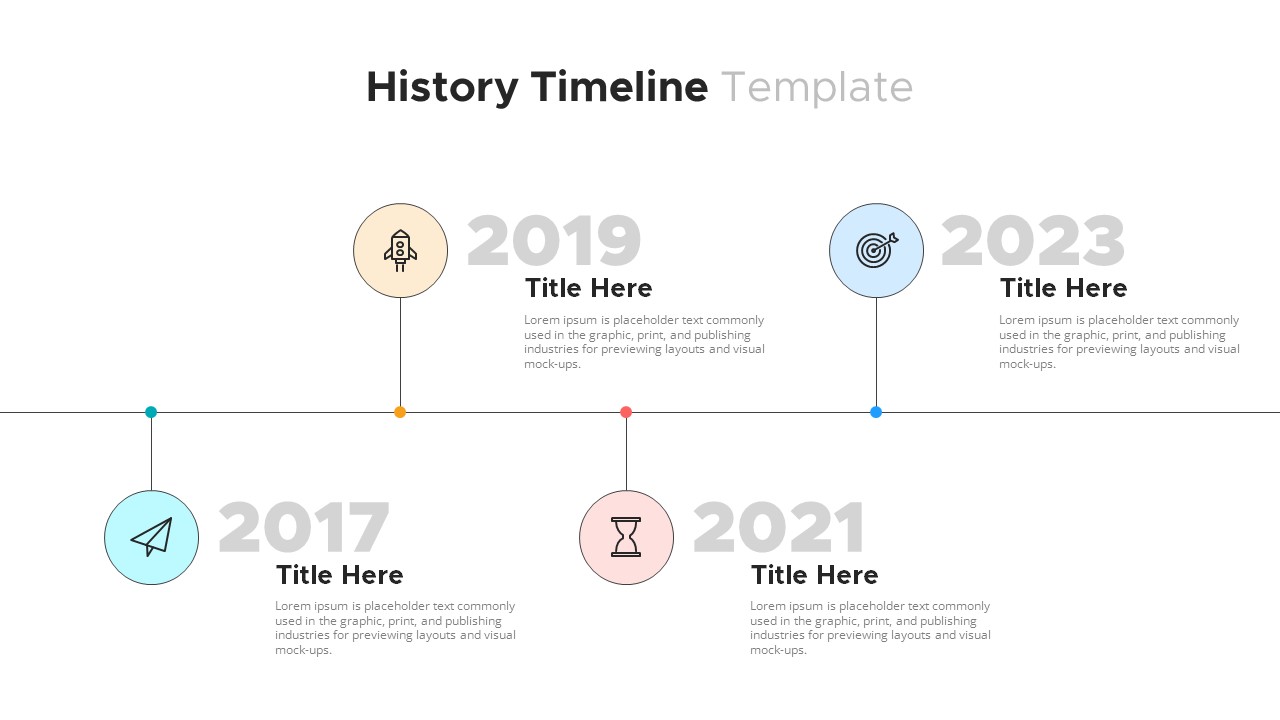
Modern Horizontal History Timeline Template for PowerPoint & Google Slides
Timeline
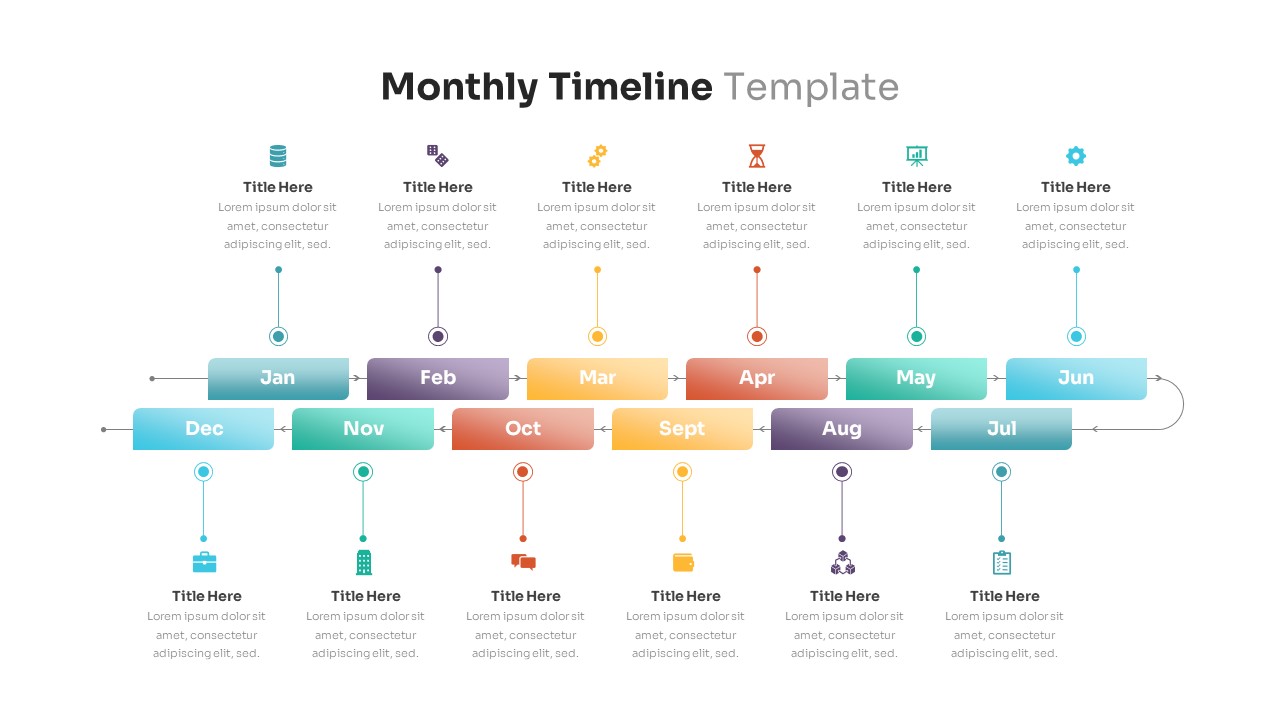
Editable Monthly Timeline Infographic Template for PowerPoint & Google Slides
Timeline
Quarterly Roadmap Timeline Infographic Template for PowerPoint & Google Slides
Timeline
Colorful Agile Timeline Infographic Template for PowerPoint & Google Slides
Timeline
Free
Six-Month Innovation Roadmap Timeline Template for PowerPoint & Google Slides
Roadmap
Timeline Roadmap with Progress Bar Template for PowerPoint & Google Slides
Timeline
Quarterly Timeline Infographic Template for PowerPoint & Google Slides
Timeline
Business Timeline Comparison Bar Chart Template for PowerPoint & Google Slides
Comparison Chart
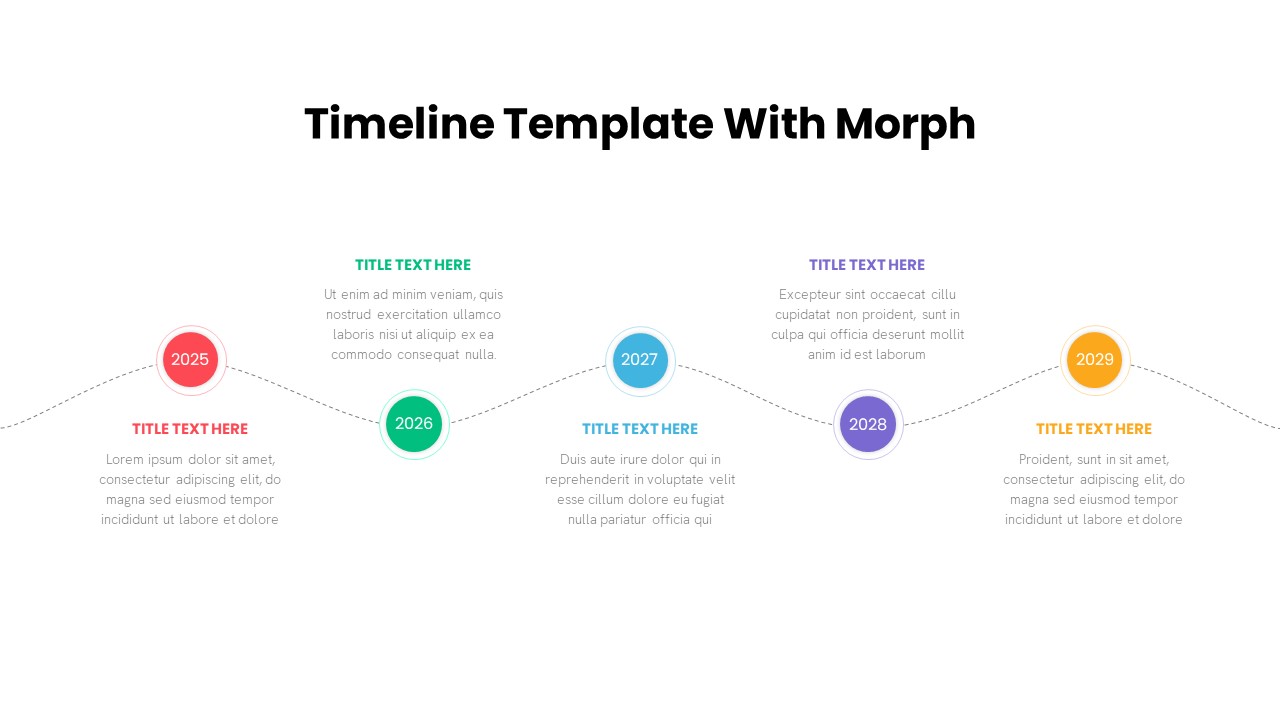
Five-Step Timeline with Morph Animation Template for PowerPoint & Google Slides
Timeline
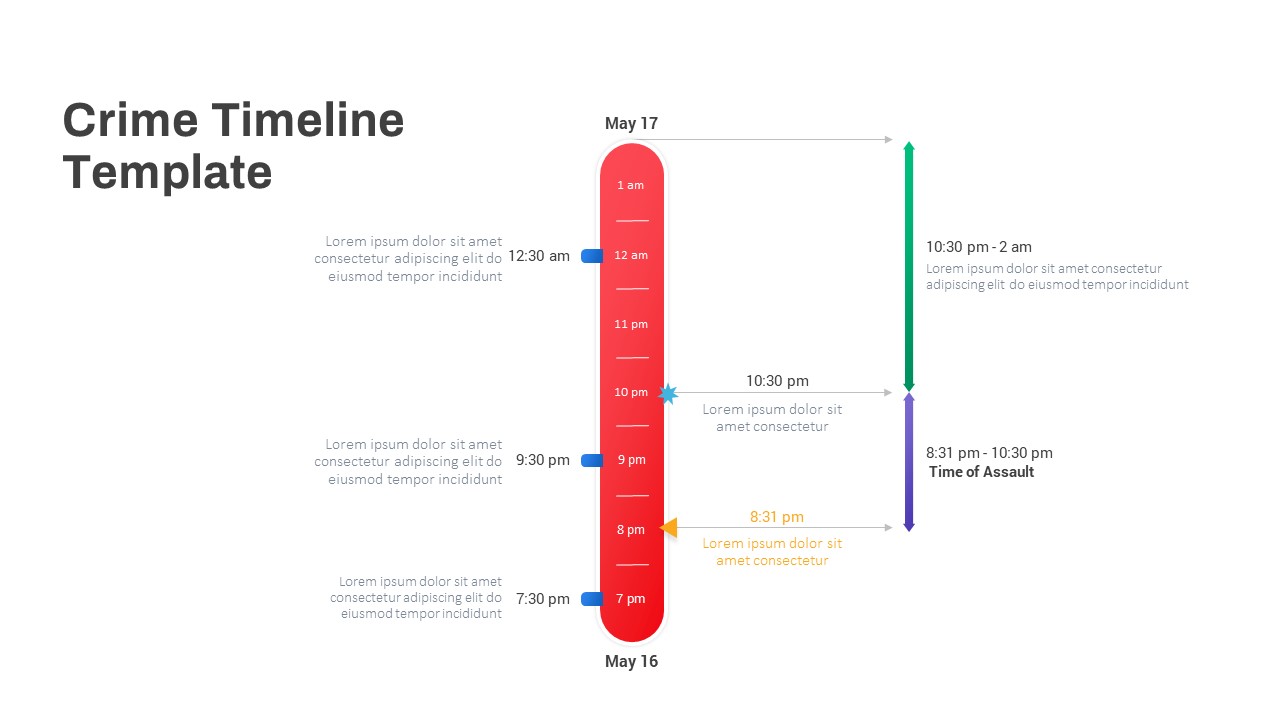
Vertical Crime Timeline Infographic Template for PowerPoint & Google Slides
Timeline
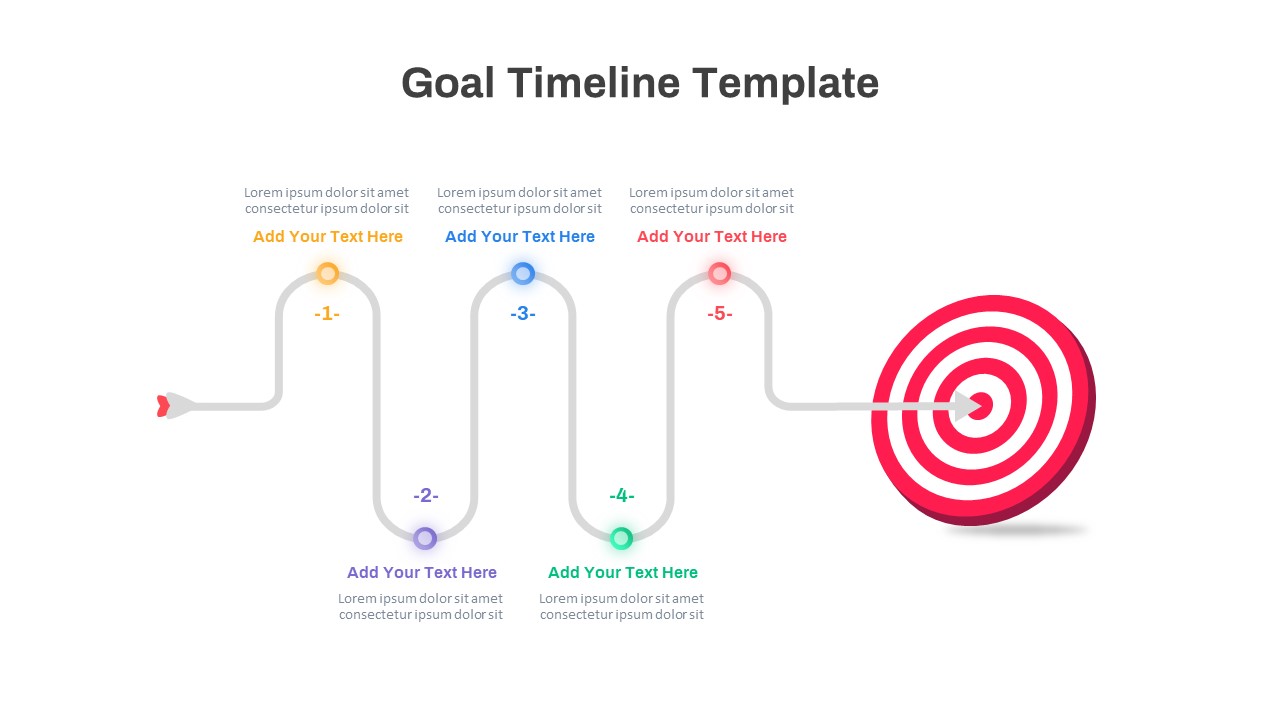
Colorful Five-Step Goal Timeline Template for PowerPoint & Google Slides
Timeline
Fishbone Timeline Infographic Series Template for PowerPoint & Google Slides
Manufacturing
Excel-Driven Gradient Timeline Chart Template for PowerPoint & Google Slides
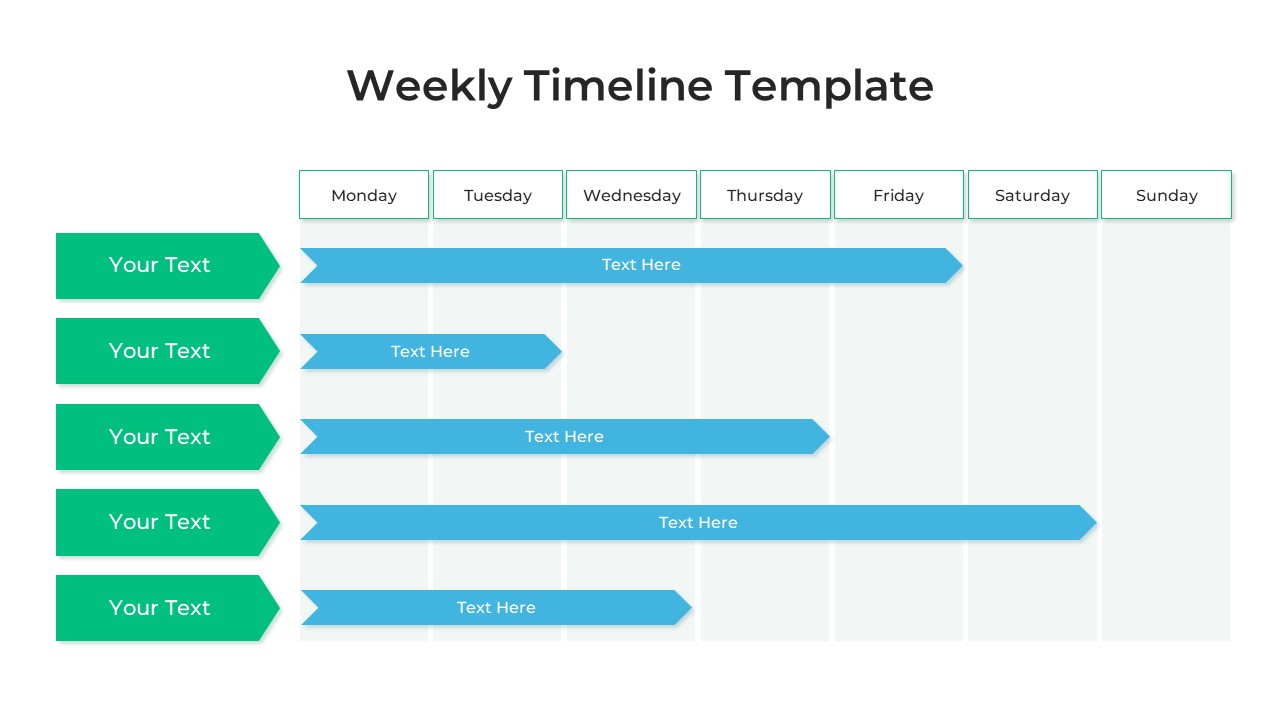
Weekly Planner Five-Row Timeline Template for PowerPoint & Google Slides
Timeline
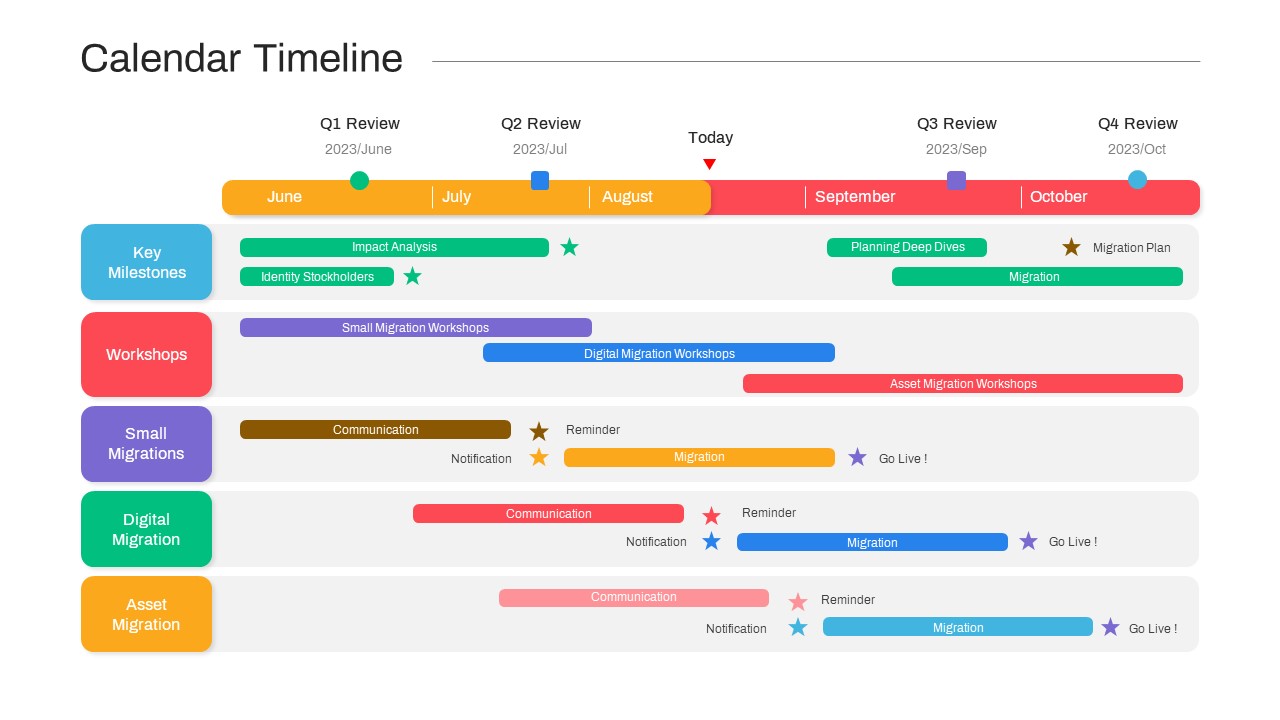
Calendar Migration Project Timeline Template for PowerPoint & Google Slides
Timeline
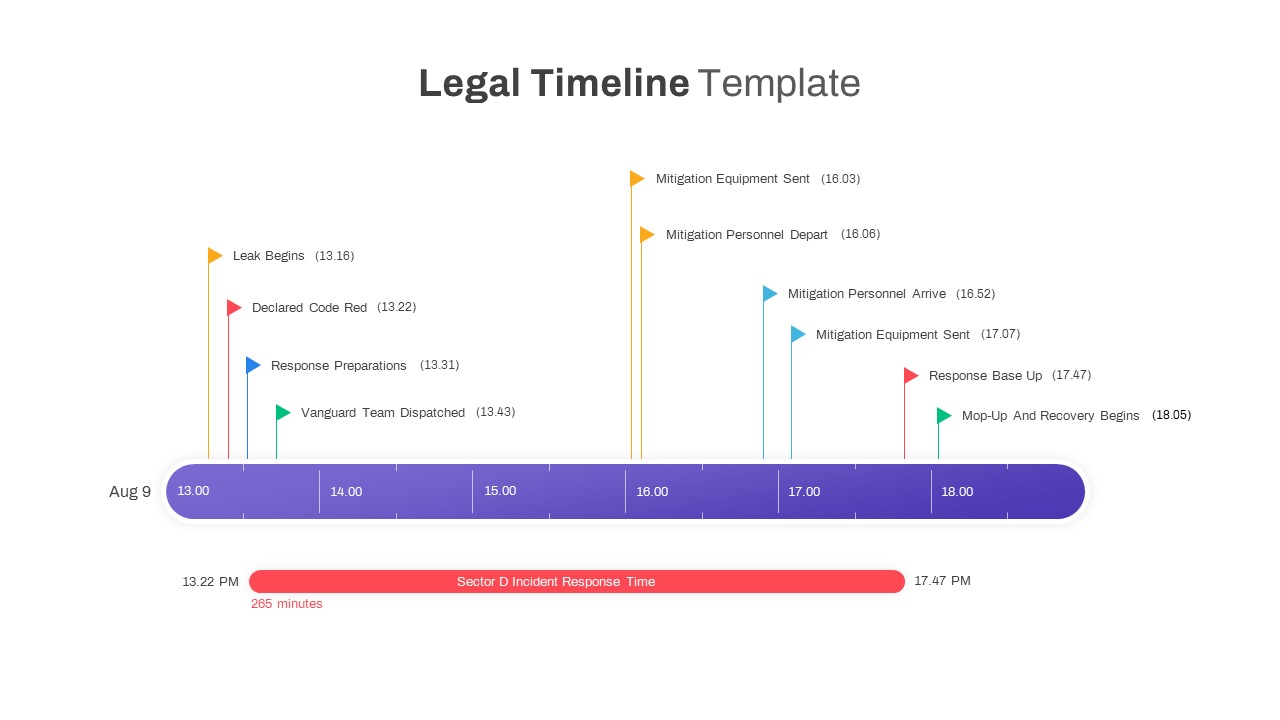
Legal Incident Response Timeline Template for PowerPoint & Google Slides
Timeline
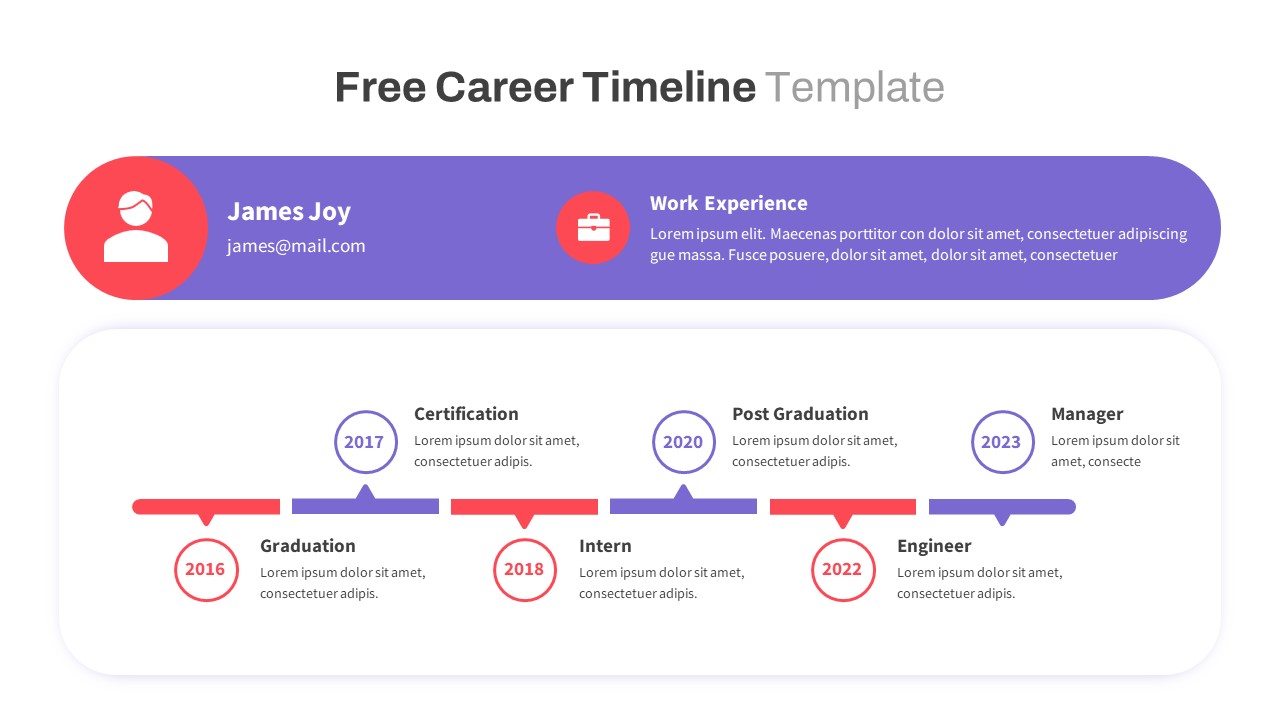
Free Colorful Career Timeline Resume Slide Template for PowerPoint & Google Slides
Timeline
Free
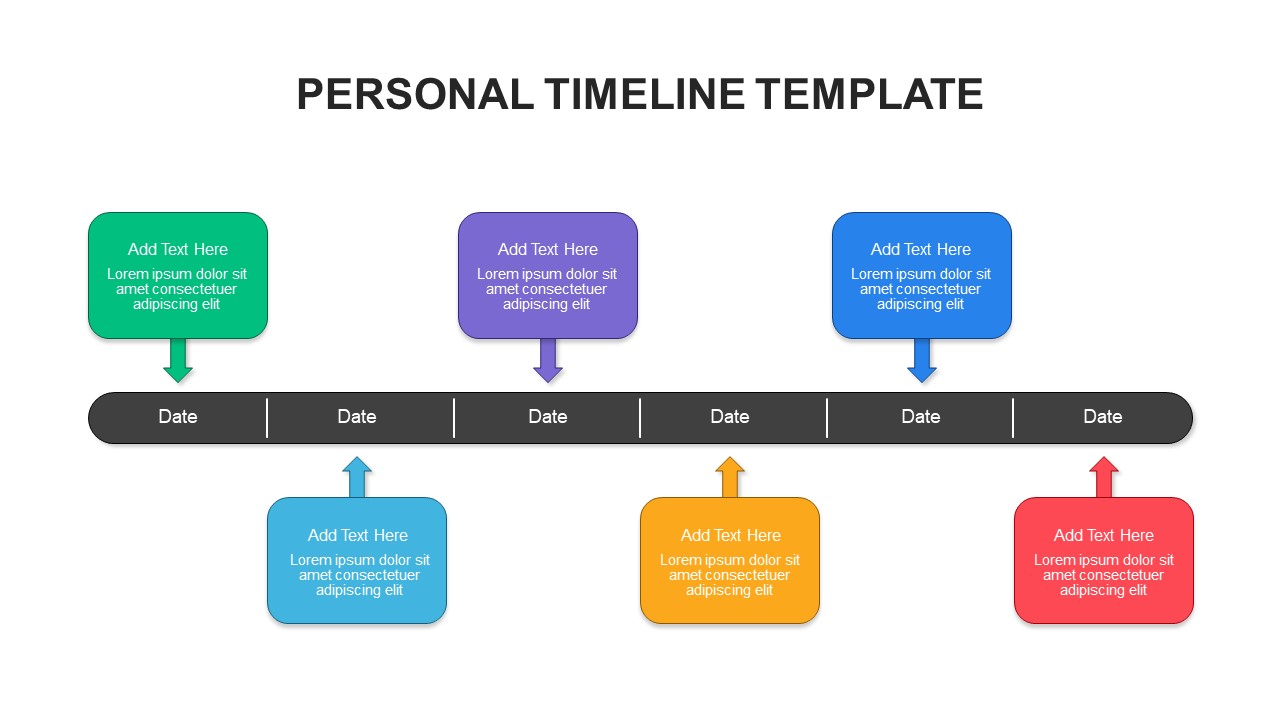
Personal Timeline Infographic Template for PowerPoint & Google Slides
Timeline
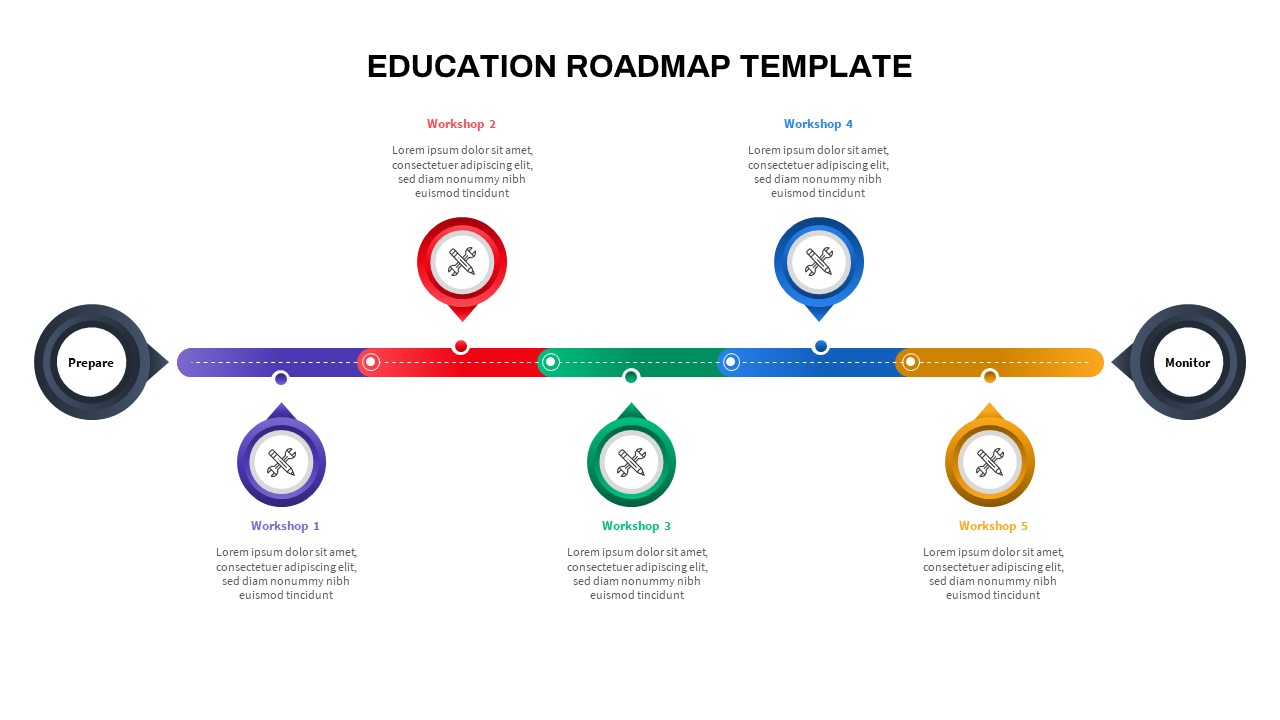
Colorful Education Roadmap Workshop Timeline Template for PowerPoint & Google Slides
Roadmap
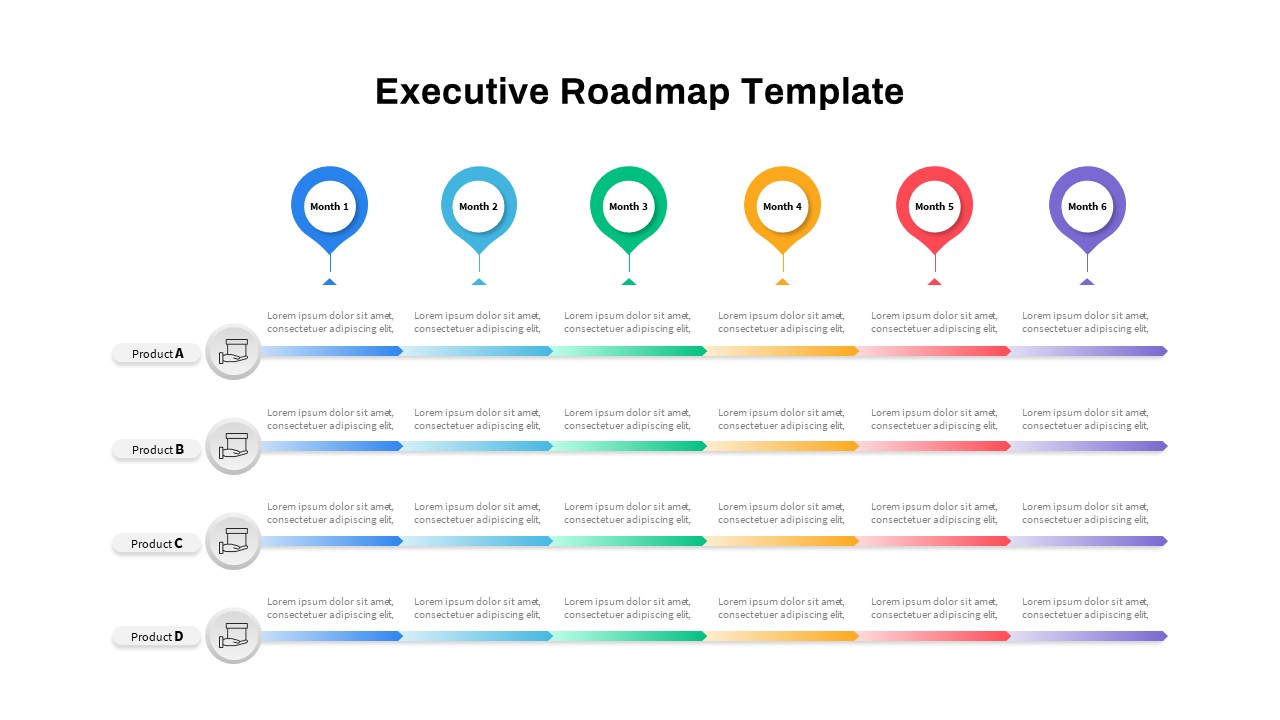
Executive Roadmap Six-Month Timeline Template for PowerPoint & Google Slides
Roadmap
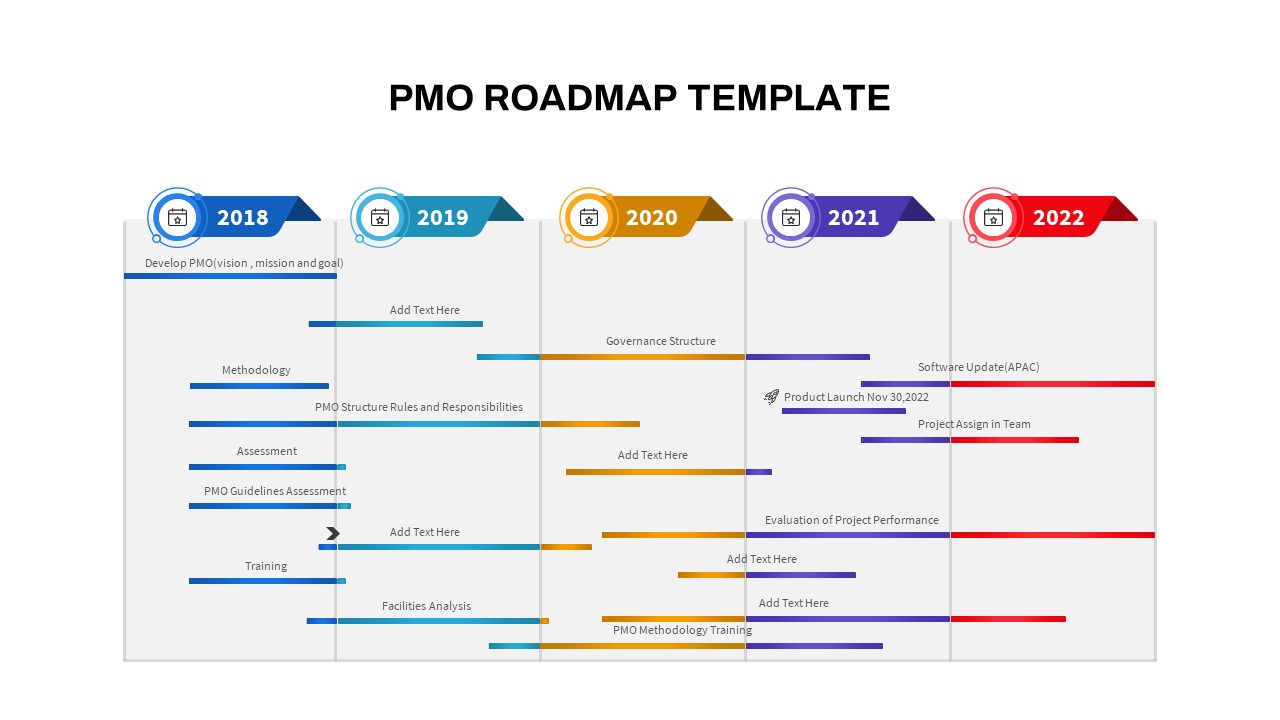
Comprehensive PMO Roadmap Timeline Template for PowerPoint & Google Slides
Roadmap
Multi-color Curved Timeline Roadmap Template for PowerPoint & Google Slides
Timeline
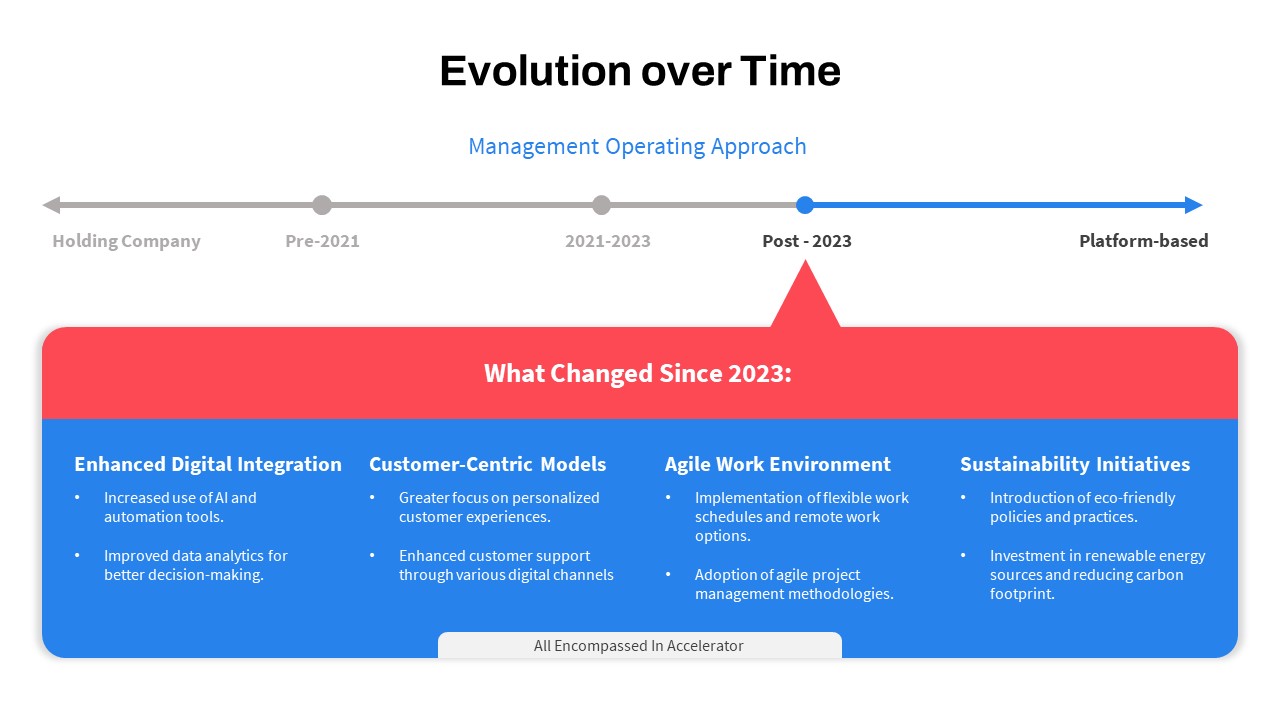
Operating Approach Evolution Timeline Template for PowerPoint & Google Slides
Timeline
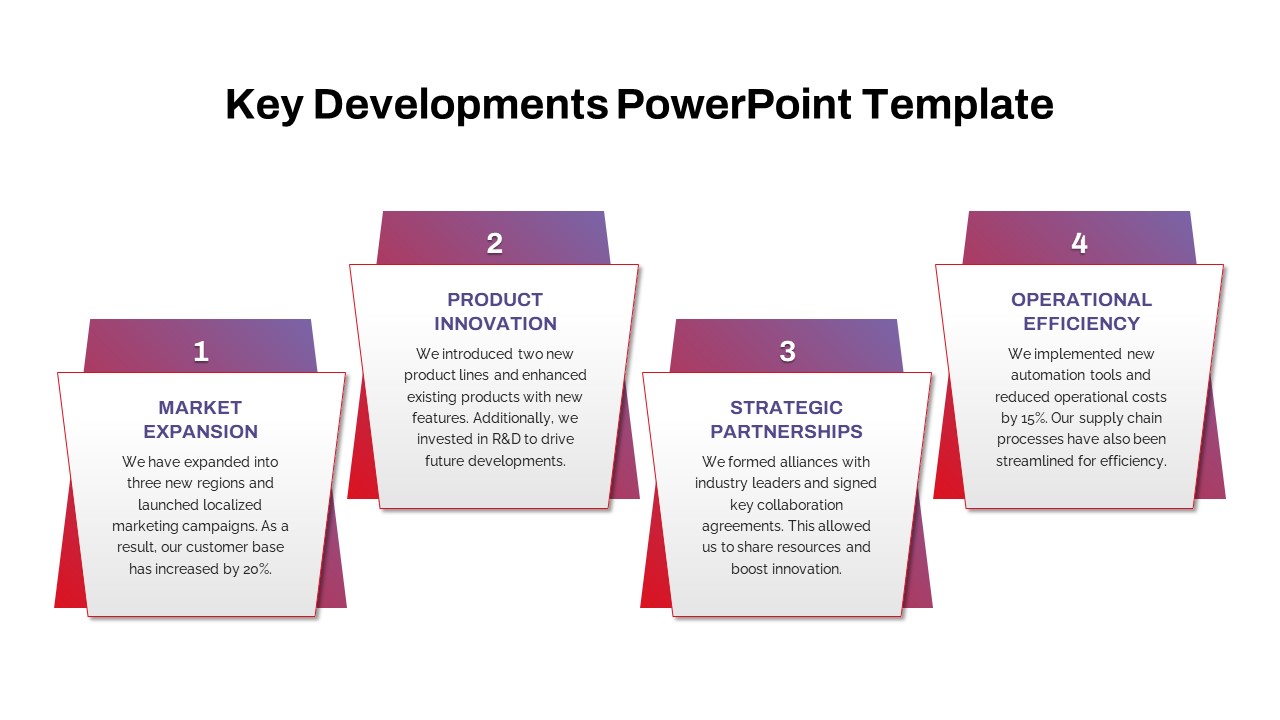
Key Developments Roadmap Timeline Template for PowerPoint & Google Slides
Timeline
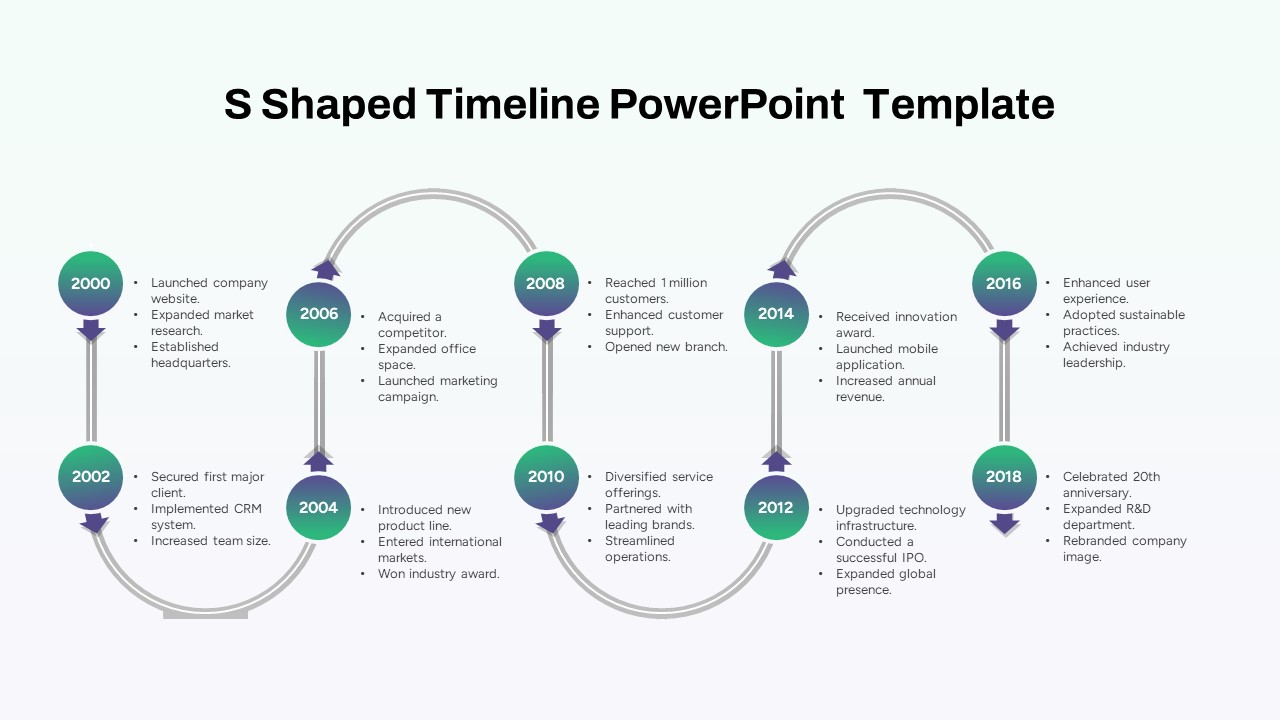
Multi-Year S-Shaped Roadmap Timeline Template for PowerPoint & Google Slides
Timeline
Project Comparison Timeline Roadmap Template for PowerPoint & Google Slides
Comparison
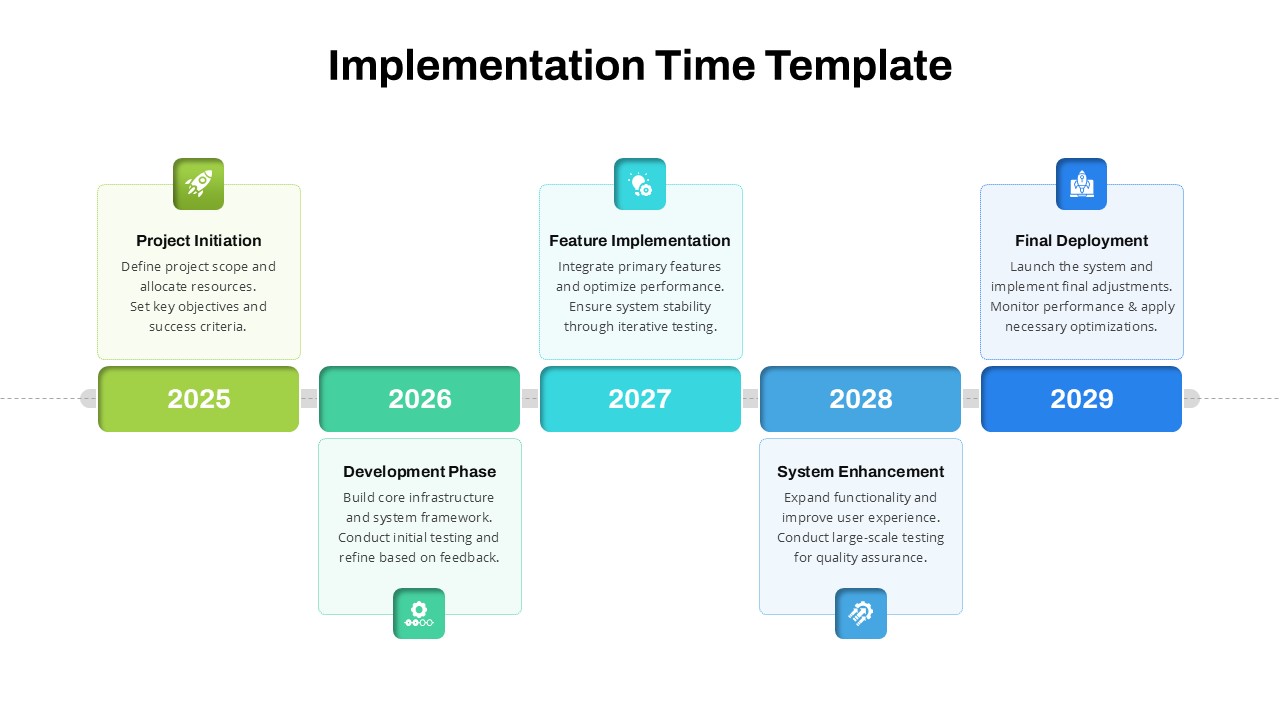
Strategic Implementation Time Timeline Template for PowerPoint & Google Slides
Timeline
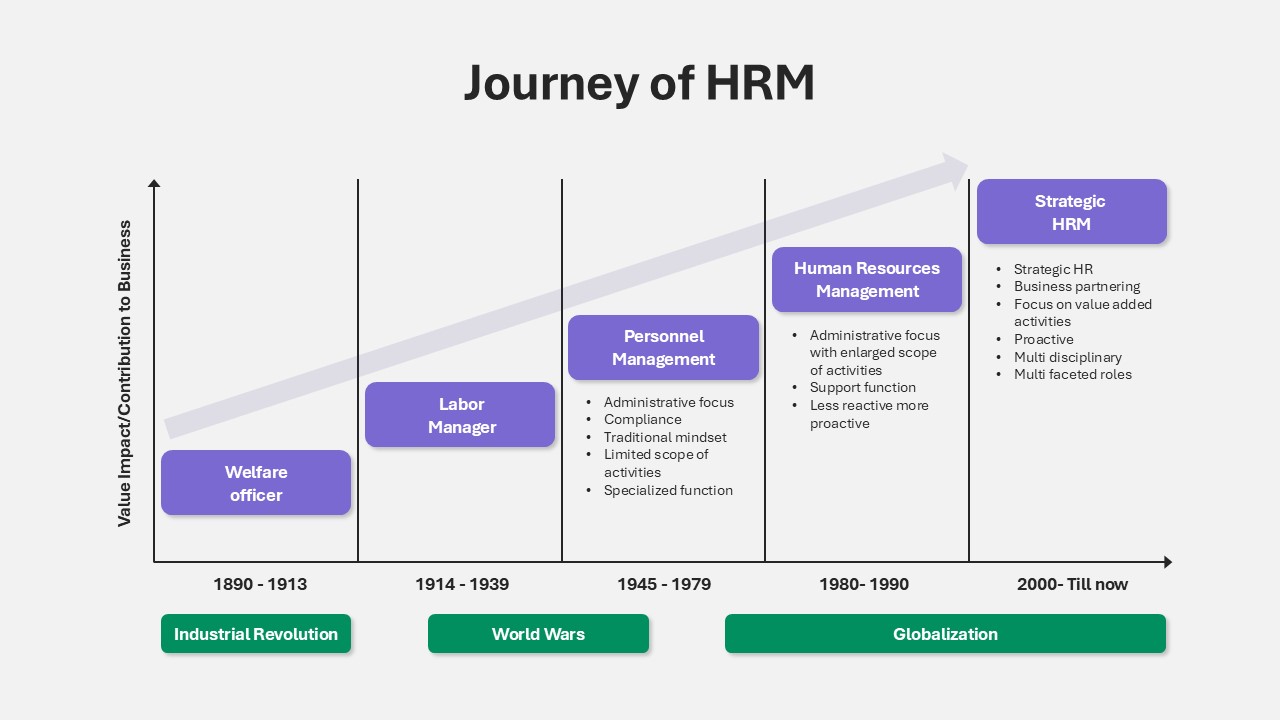
Journey of HRM Timeline Evolution Template for PowerPoint & Google Slides
HR
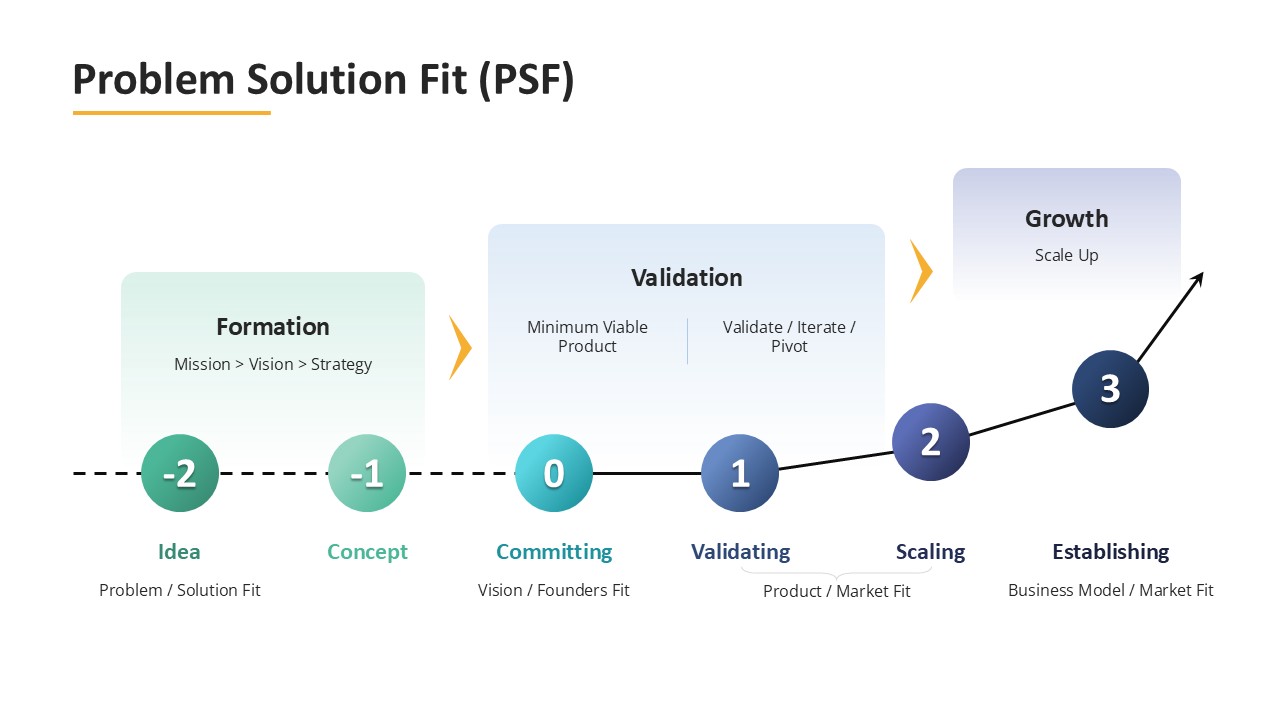
Problem Solution Fit (PSF) Timeline Template for PowerPoint & Google Slides
Timeline
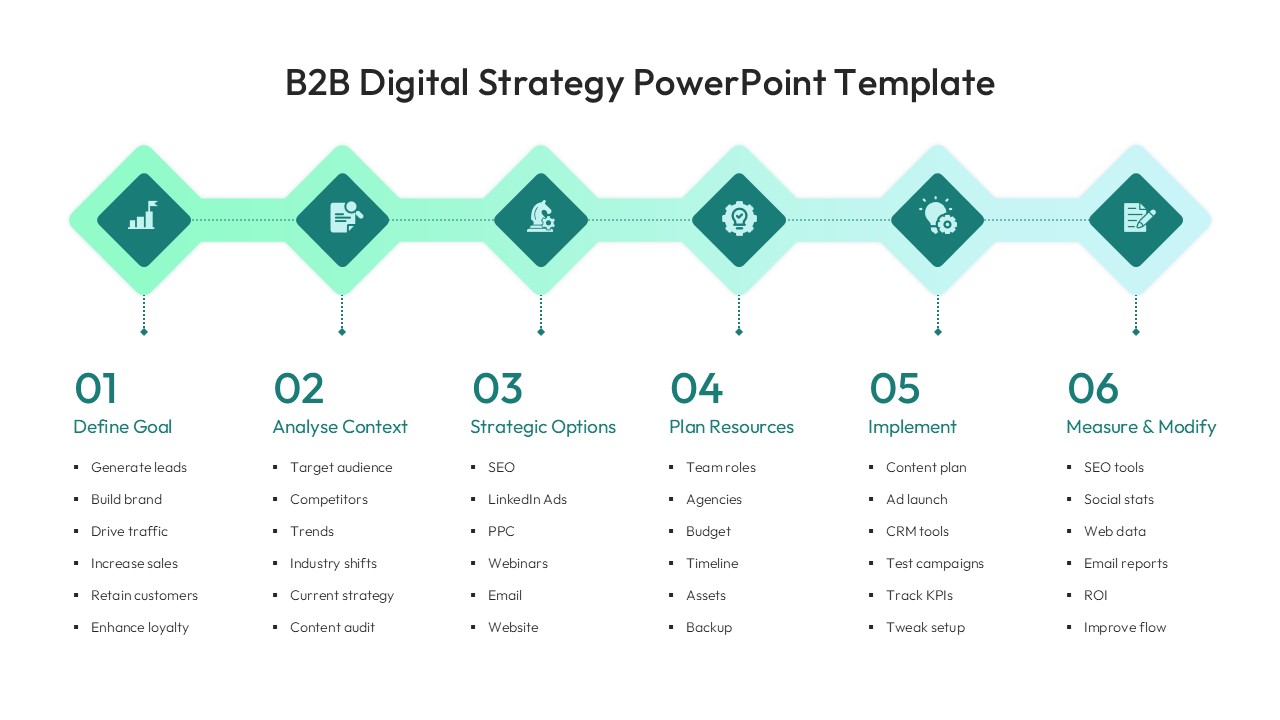
Elegant B2B Digital Strategy Timeline Template for PowerPoint & Google Slides
Digital Marketing
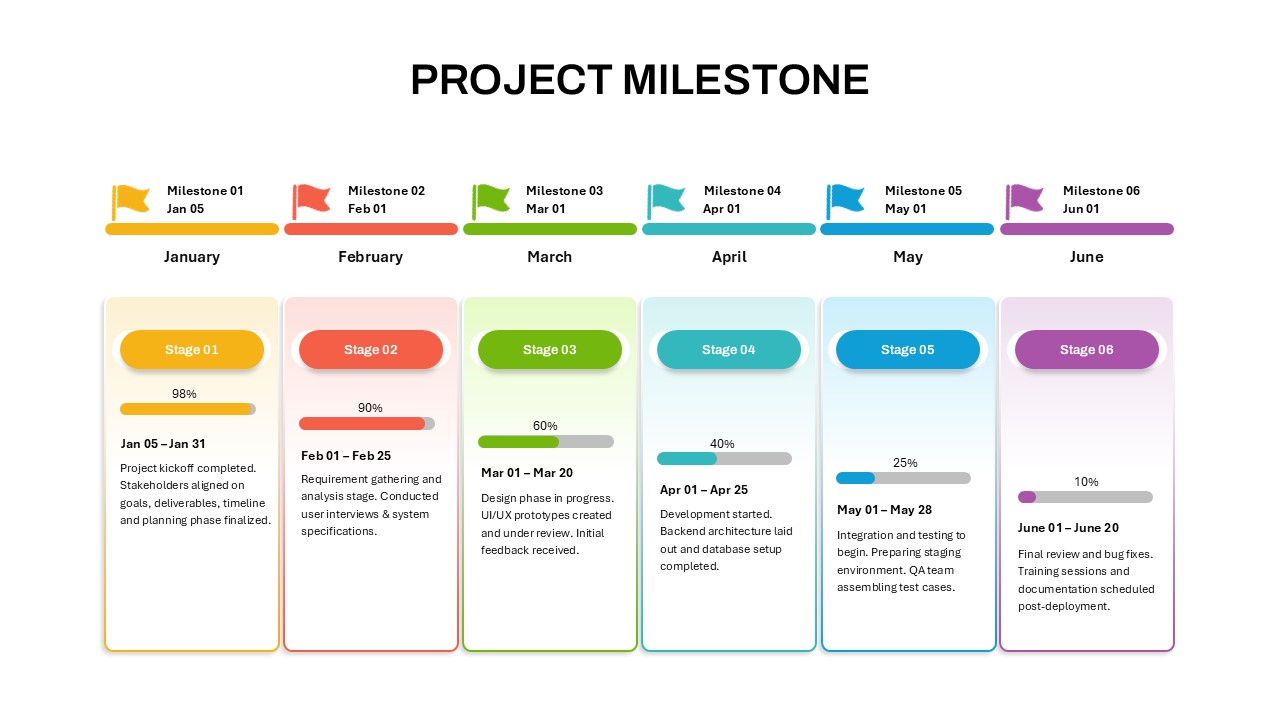
Project Milestone Timeline Infographic Template for PowerPoint & Google Slides
Timeline
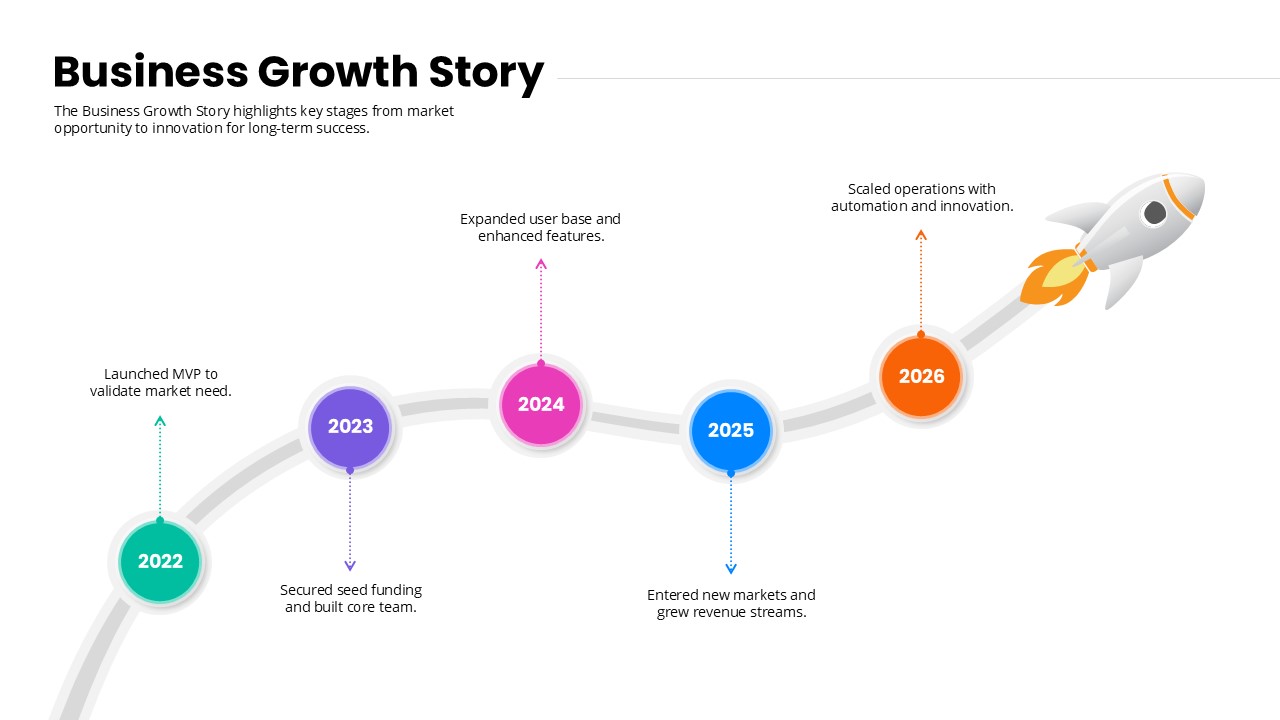
Business Growth Story timeline template for PowerPoint & Google Slides
Timeline
Code Blue Response Timeline Template for PowerPoint & Google Slides
Timeline
5-Year Business Timeline Template for PowerPoint & Google Slides
Timeline