Strategic Brand Equity Pyramid Diagram Template for PowerPoint & Google Slides


Description
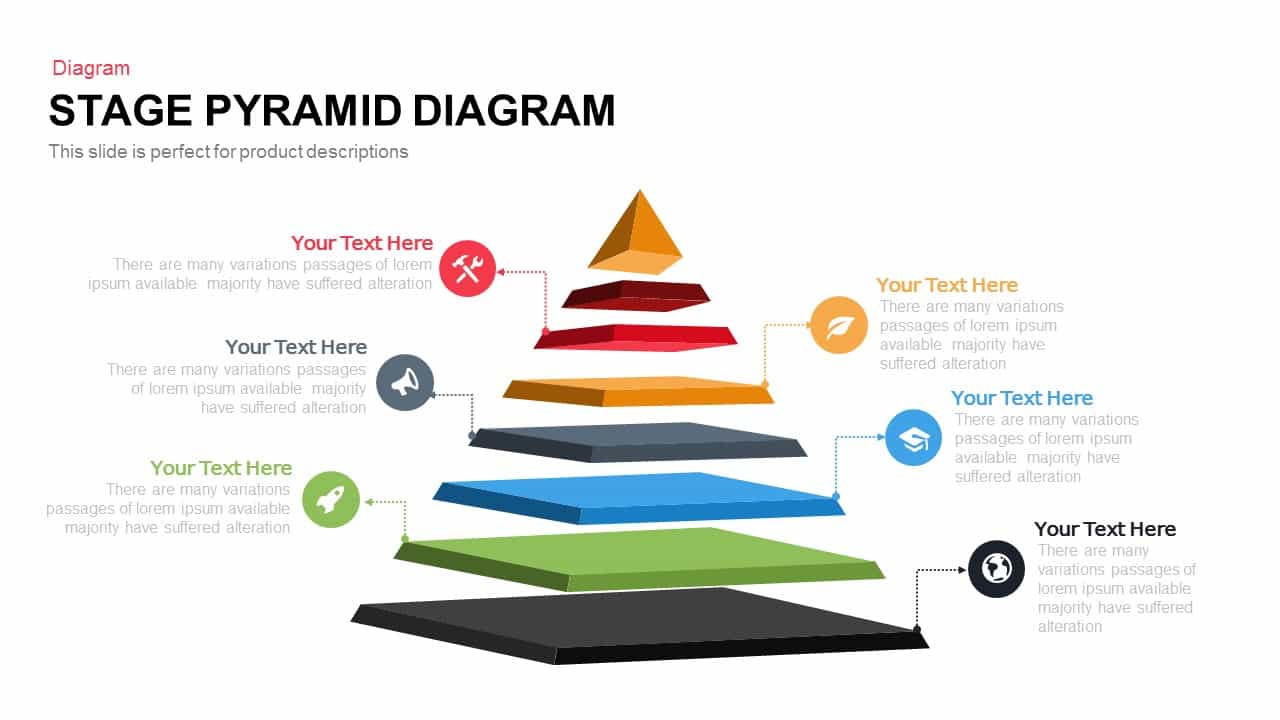
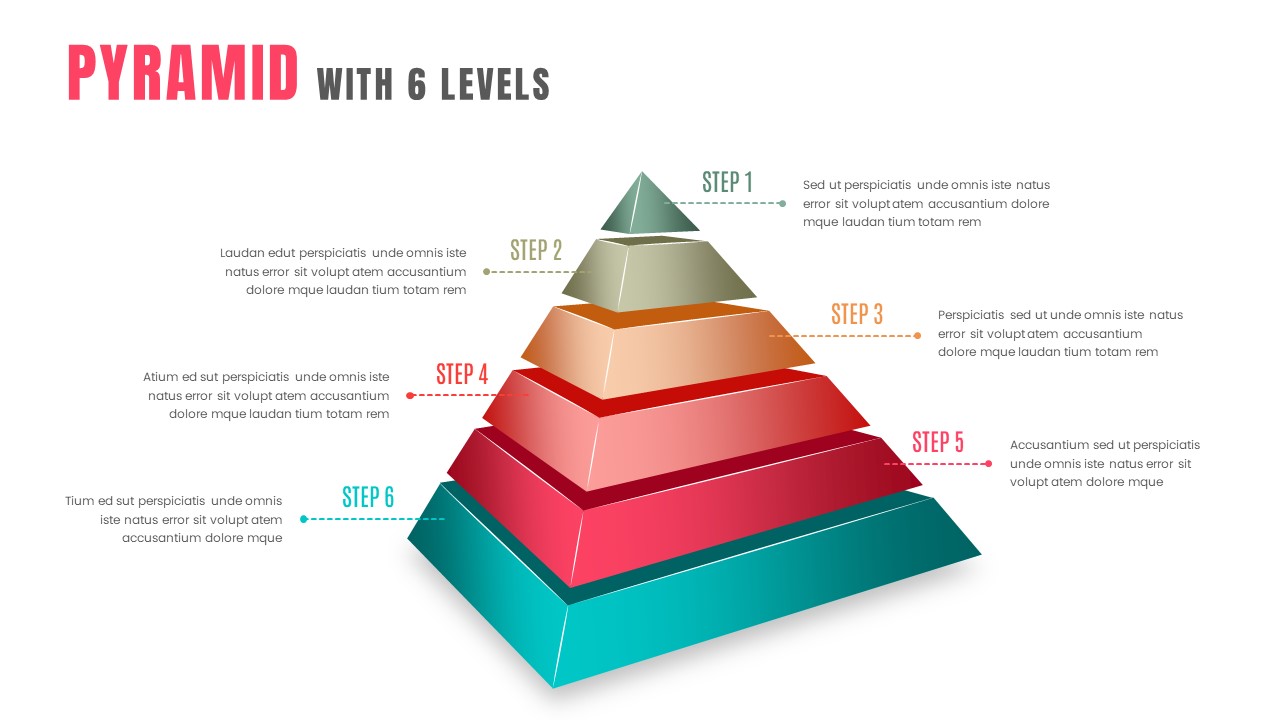
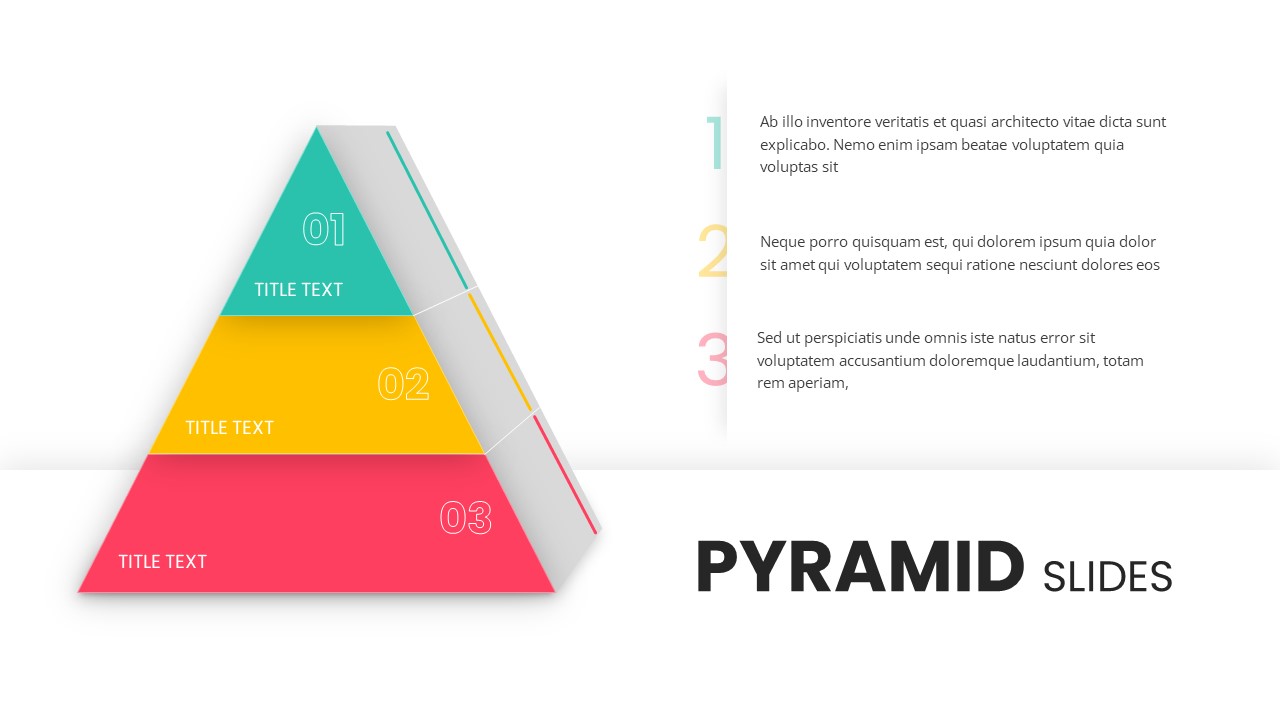
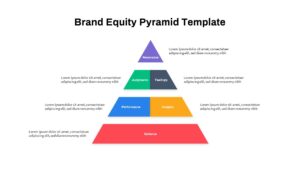
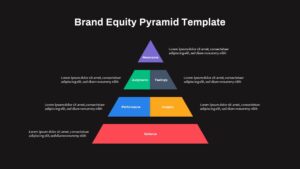
Leverage this strategic Brand Equity Pyramid slide to visually map the progressive stages of brand building, from foundational salience to ultimate resonance. The pyramid is structured into four tiers: a broad base for salience (in red), a second level split for performance (blue) and imagery (orange), a third level divided for judgments (green) and feelings (dark gray), and a pointed apex highlighting resonance (purple). Each segment includes a customizable text box for concise definitions, KPIs, or brand metrics, alongside intuitive icon placeholders. It features pre-built vector shapes and drag-and-drop icons that streamline editing, supports brand color scheme customization, and includes slide notes for user guidance. The slide’s clean, flat design features consistent typography, ample white space, and master-layout flexibility, enabling you to adjust colors, reorder tiers, or swap icons with ease. Whether optimizing for a minimalist corporate look or applying subtle gradients for depth, the responsive design ensures effortless resizing and maintains alignment across devices. Optimized for both PowerPoint and Google Slides, this asset maintains clarity at any resolution and supports seamless collaboration, ensuring brand workshops, strategy reviews, investor pitch decks, and training sessions remain visually engaging and on message.
Who is it for
Brand managers, marketing strategists, and C-suite executives will find this pyramid invaluable for aligning teams around brand objectives. Consultants, agency directors, graphic designers, and MBA students can leverage the diagram to educate stakeholders on brand equity fundamentals or to pitch brand-building roadmaps. Digital marketing teams and brand consultants can also adopt the slide to benchmark brand health and drive strategic decisions across channels.
Other Uses
Beyond classic brand strategy presentations, repurpose this slide to illustrate customer journey stages, product maturity models, loyalty frameworks, corporate training structures, or organizational hierarchies. The modular segments can also represent risk assessment matrices, performance dashboards, process workflows, or value proposition layers. Customize each tier to map strategic priorities, project milestones, or scalability plans across diverse business functions.
Login to download this file

Item ID
SB03821
Related Templates

Keller’s Brand Equity PowerPoint Template for PowerPoint & Google Slides
Business Strategy
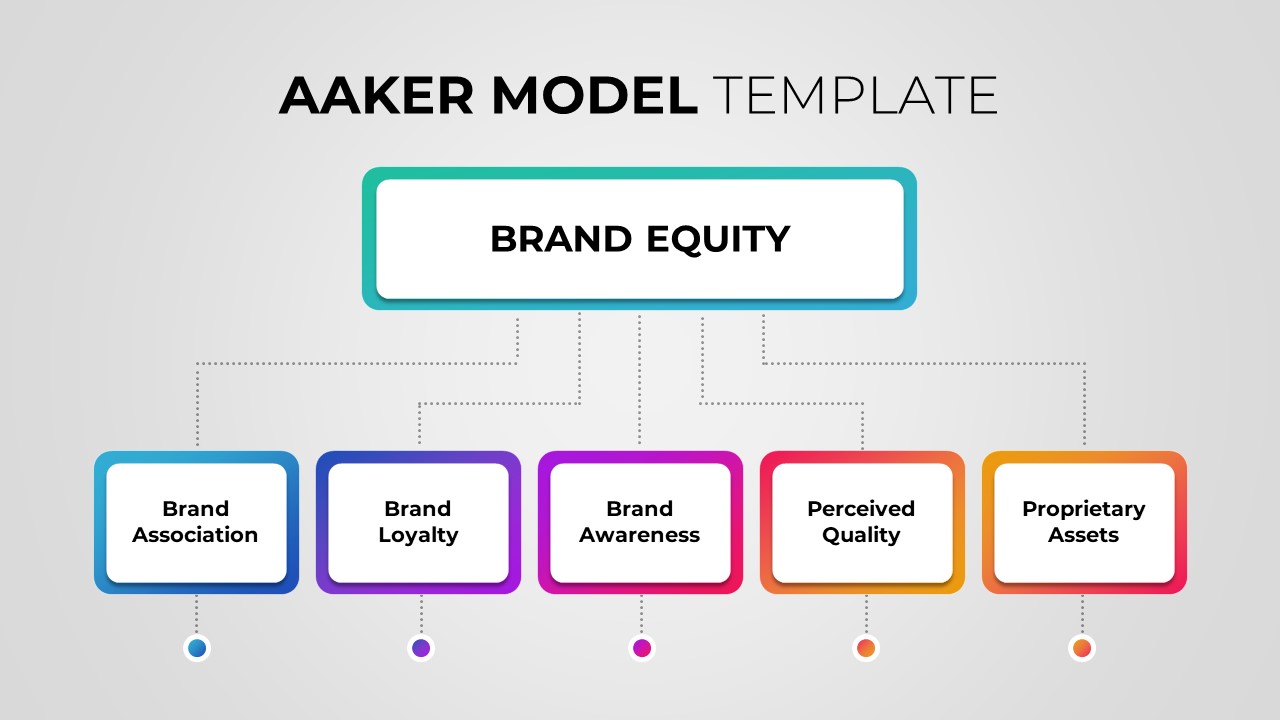
AAKER brand equity model template for PowerPoint & Google Slides
Business Strategy
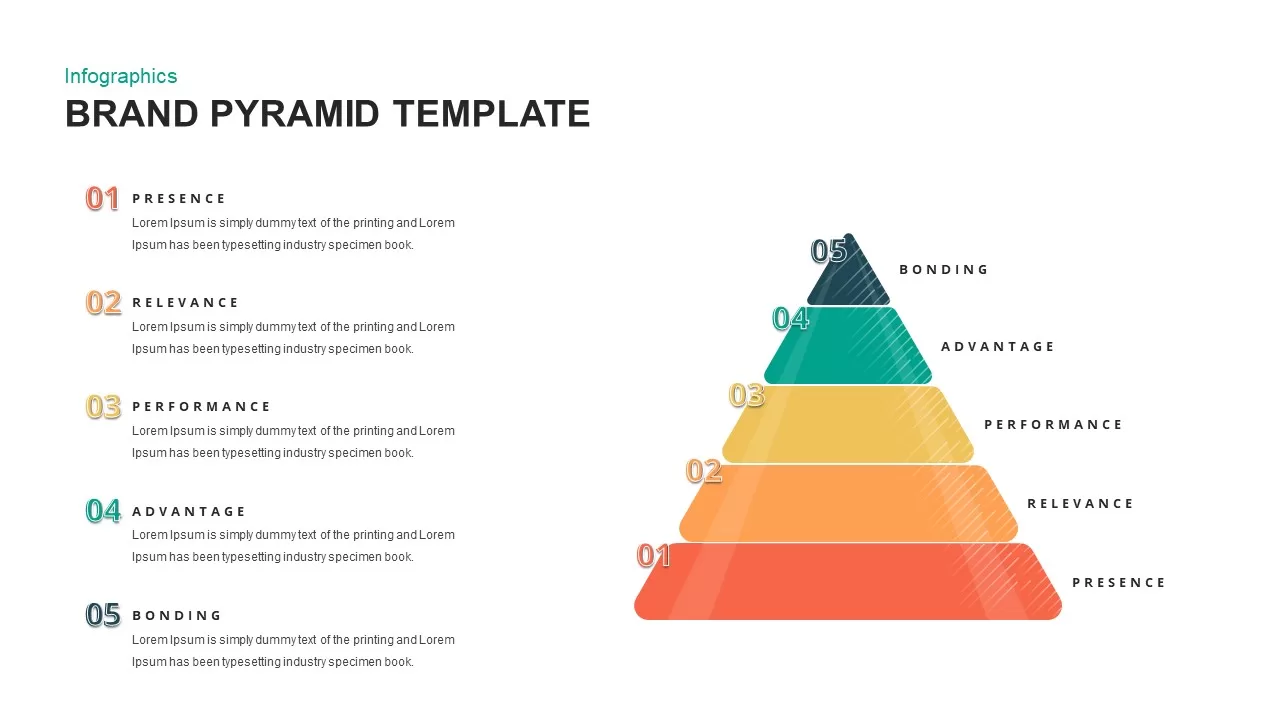
Brand Pyramid Framework template for PowerPoint & Google Slides
Pyramid
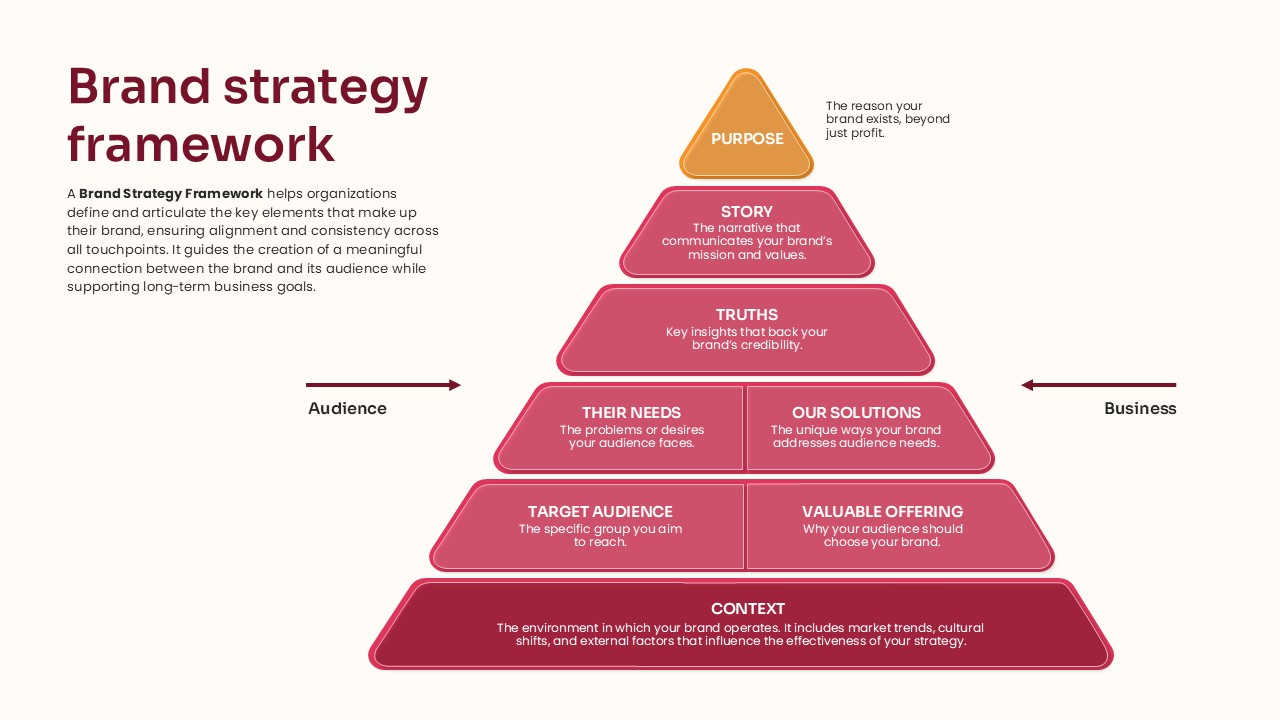
Pyramid Brand Strategy Framework Template for PowerPoint & Google Slides
Business Strategy
Adam’s Equity Theory Scale Comparison Template for PowerPoint & Google Slides
Comparison
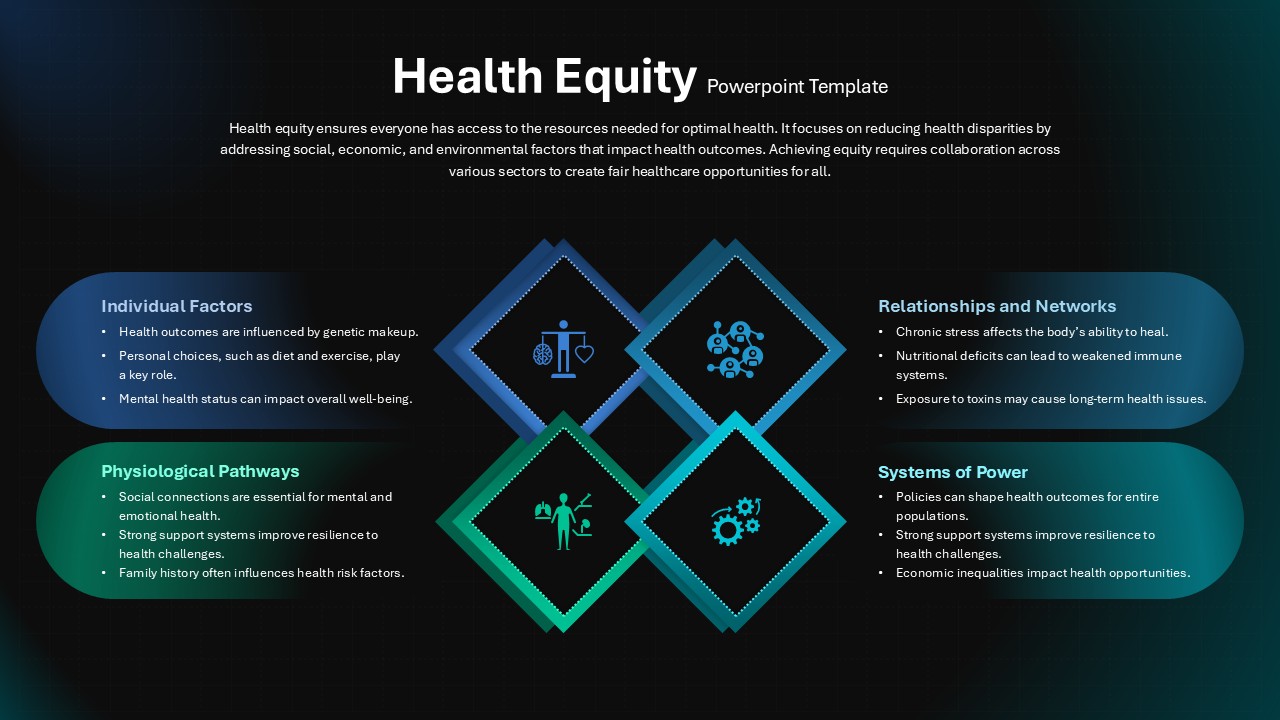
Health Equity Pillars Infographic Template for PowerPoint & Google Slides
Comparison
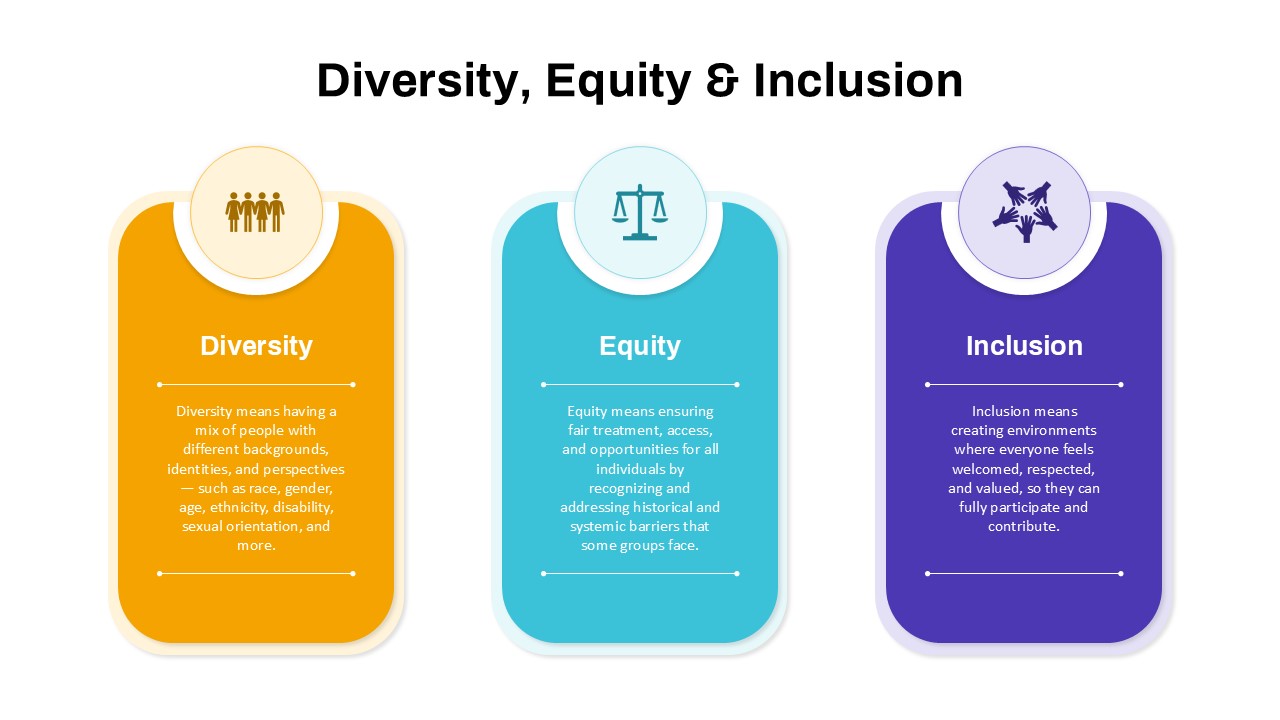
Diversity, Equity & Inclusion Overview template for PowerPoint & Google Slides
Employee Performance
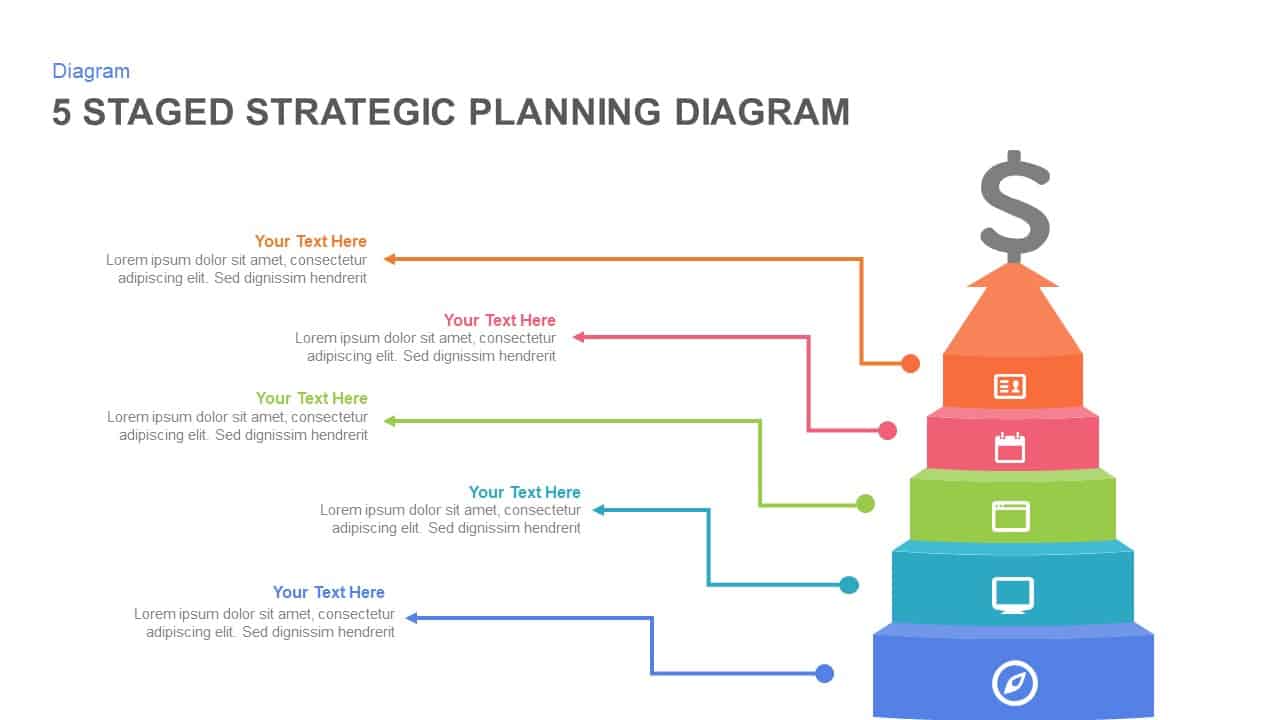
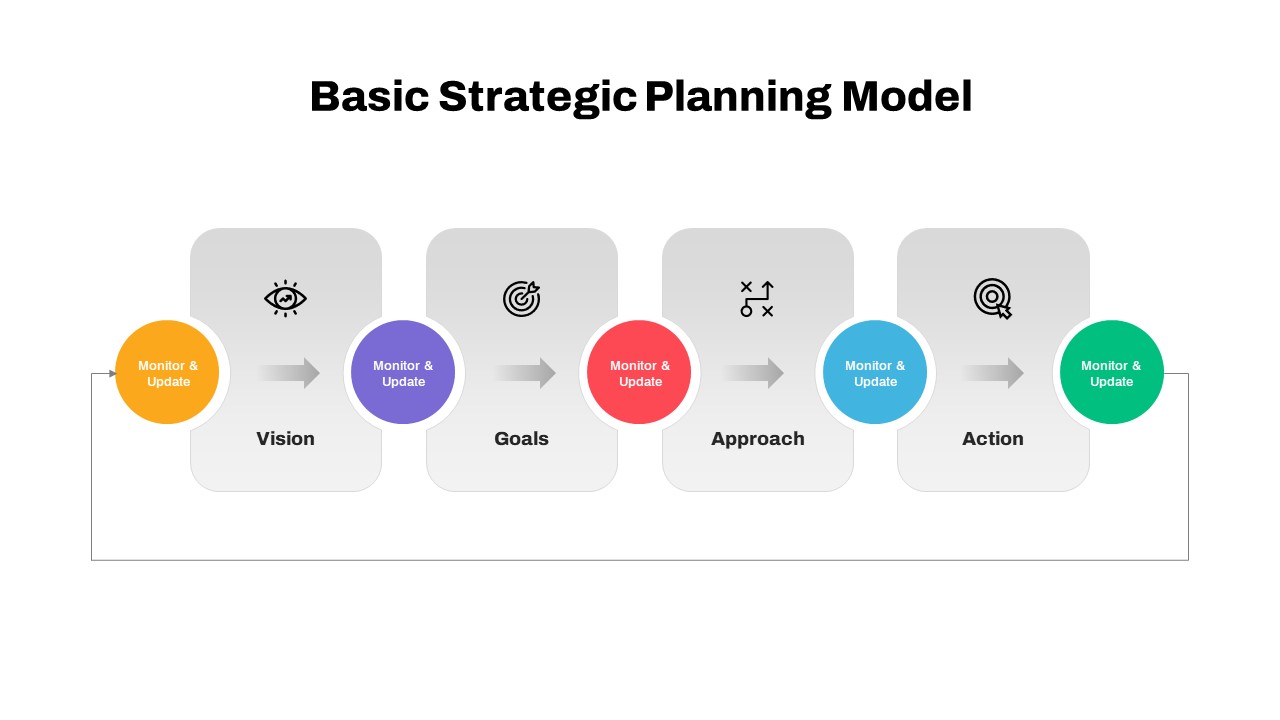
5-Stage Strategic Planning Pyramid Template for PowerPoint & Google Slides
Business Strategy
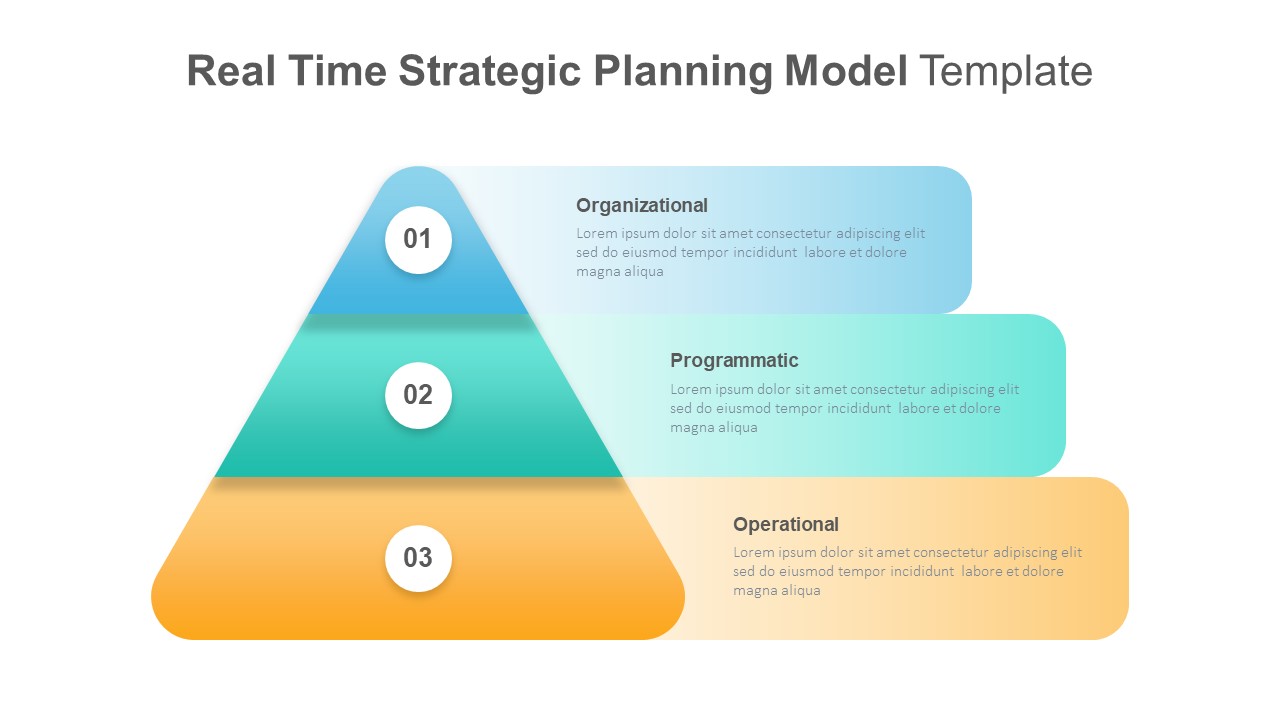
Real-Time Strategic Planning Pyramid Slide for PowerPoint & Google Slides
Business Strategy
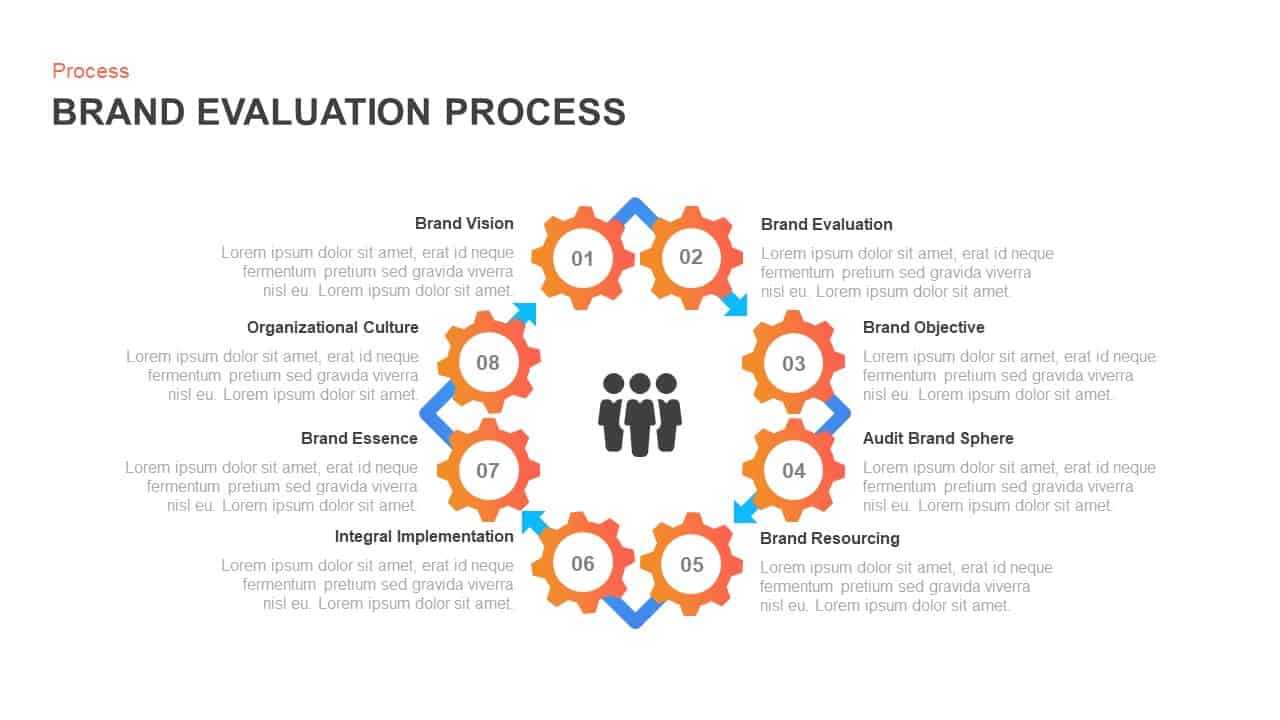
8-Stage Brand Evaluation Process Diagram Template for PowerPoint & Google Slides
Process

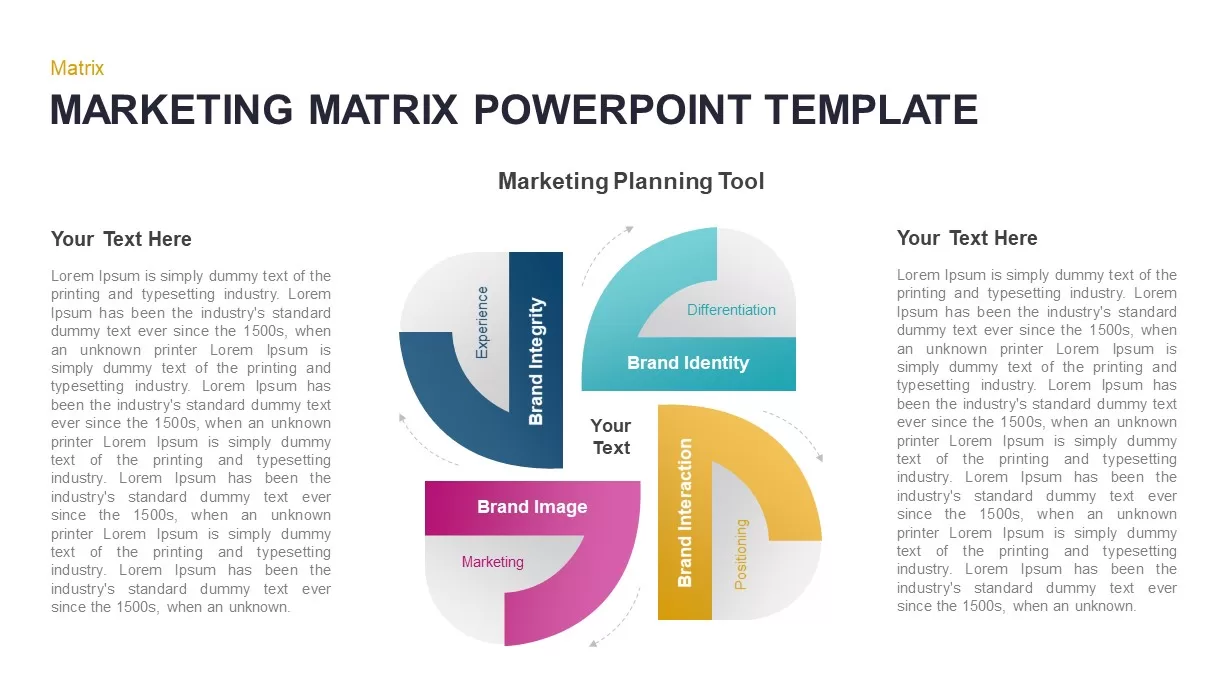
Marketing Matrix Brand Quadrant Diagram Template for PowerPoint & Google Slides
Process
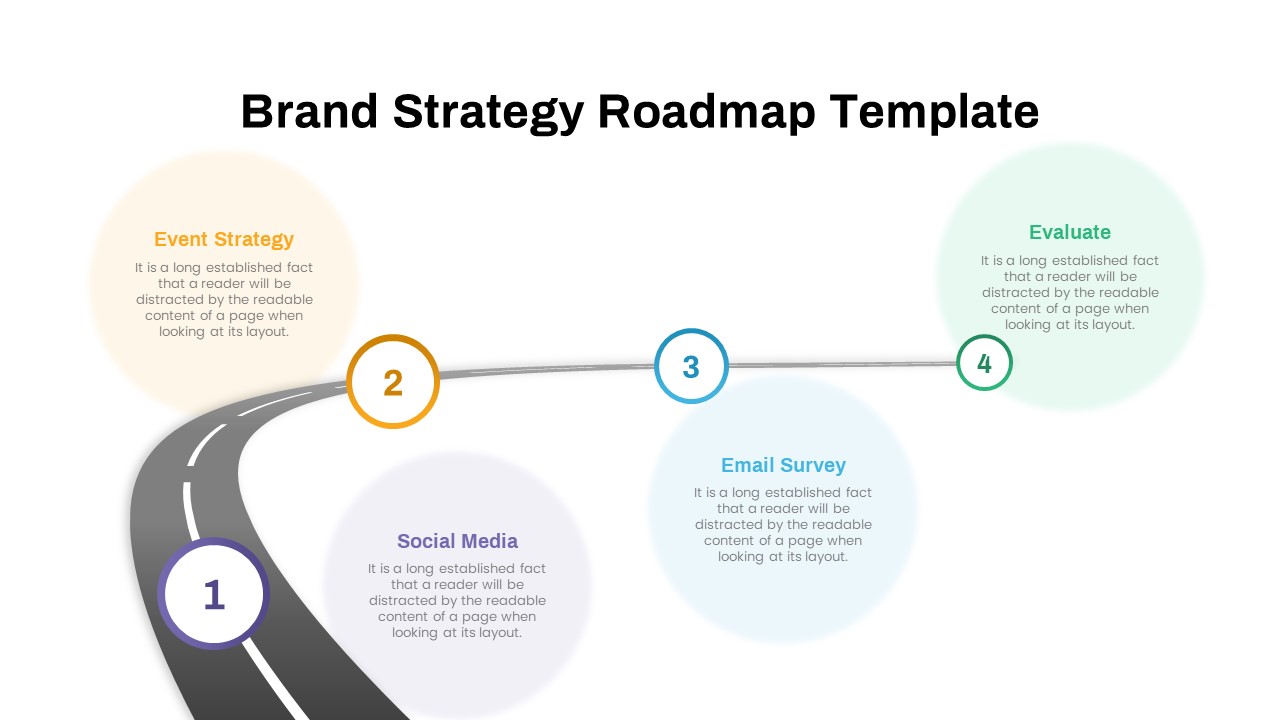
Brand Strategy Roadmap Diagram Template for PowerPoint & Google Slides
Roadmap
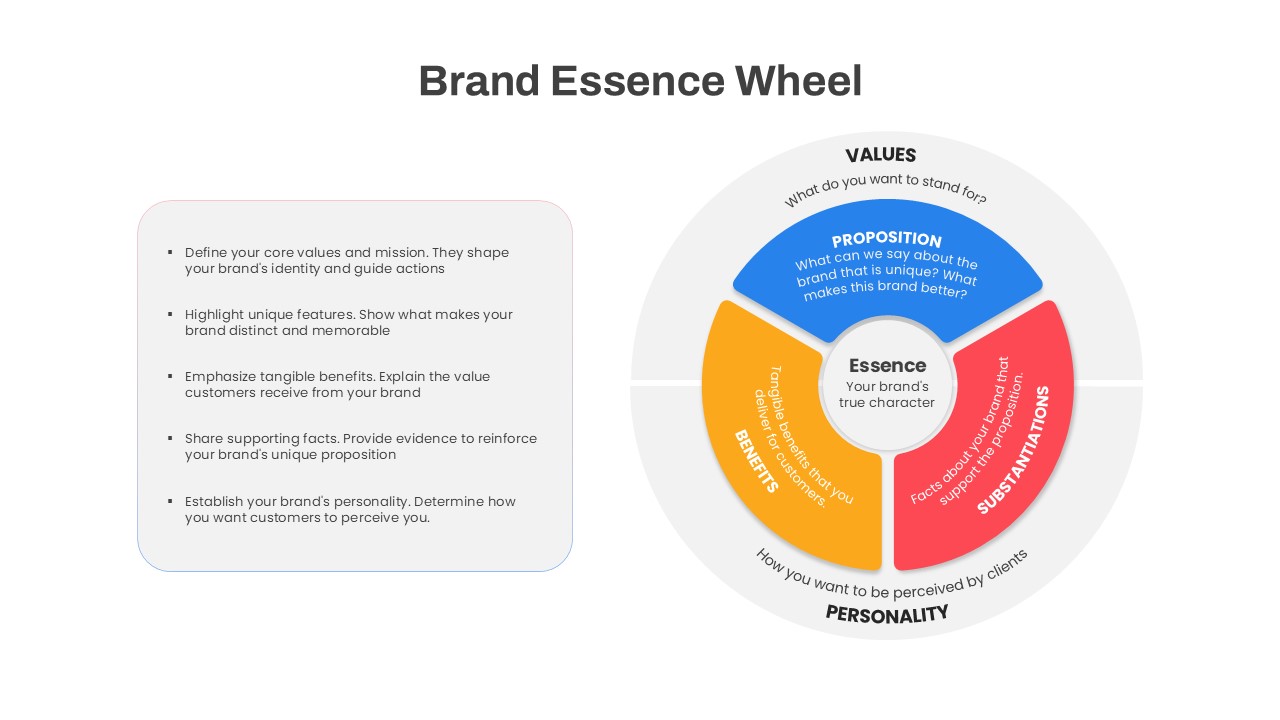
Brand Essence Wheel Strategy Diagram Template for PowerPoint & Google Slides
Circular
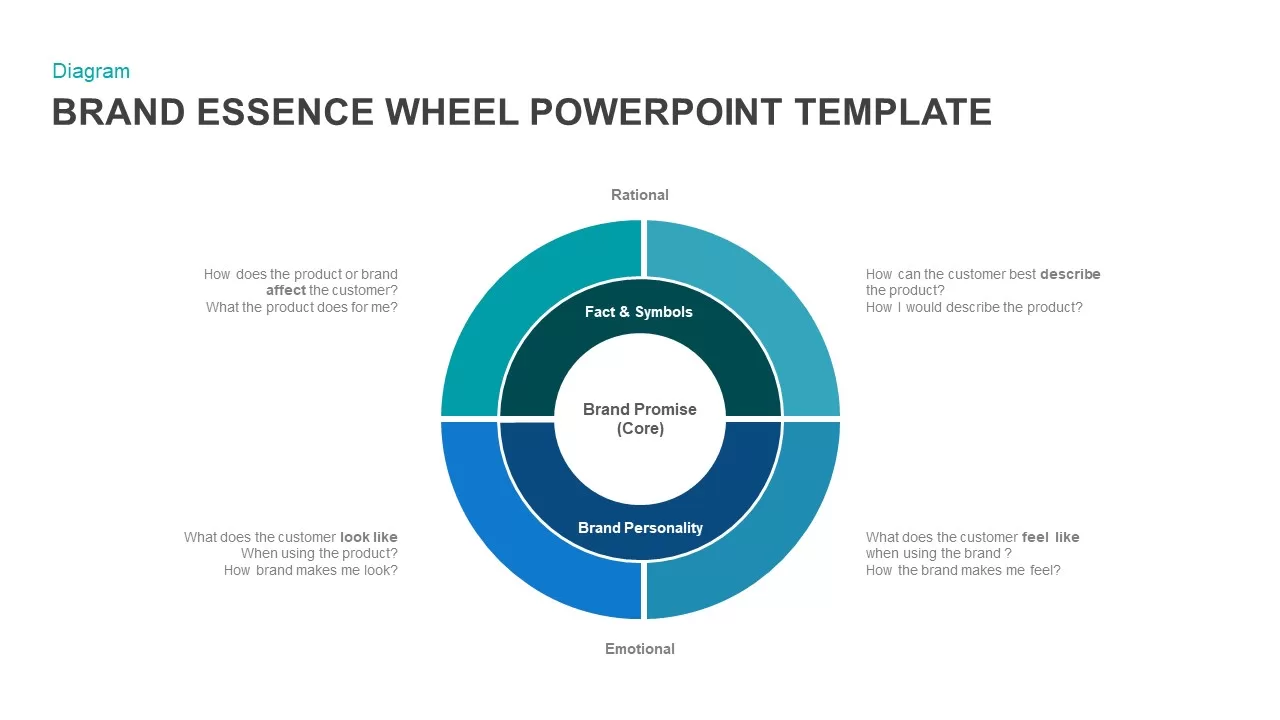
Brand Essence Wheel PowerPoint Template for PowerPoint & Google Slides
Marketing
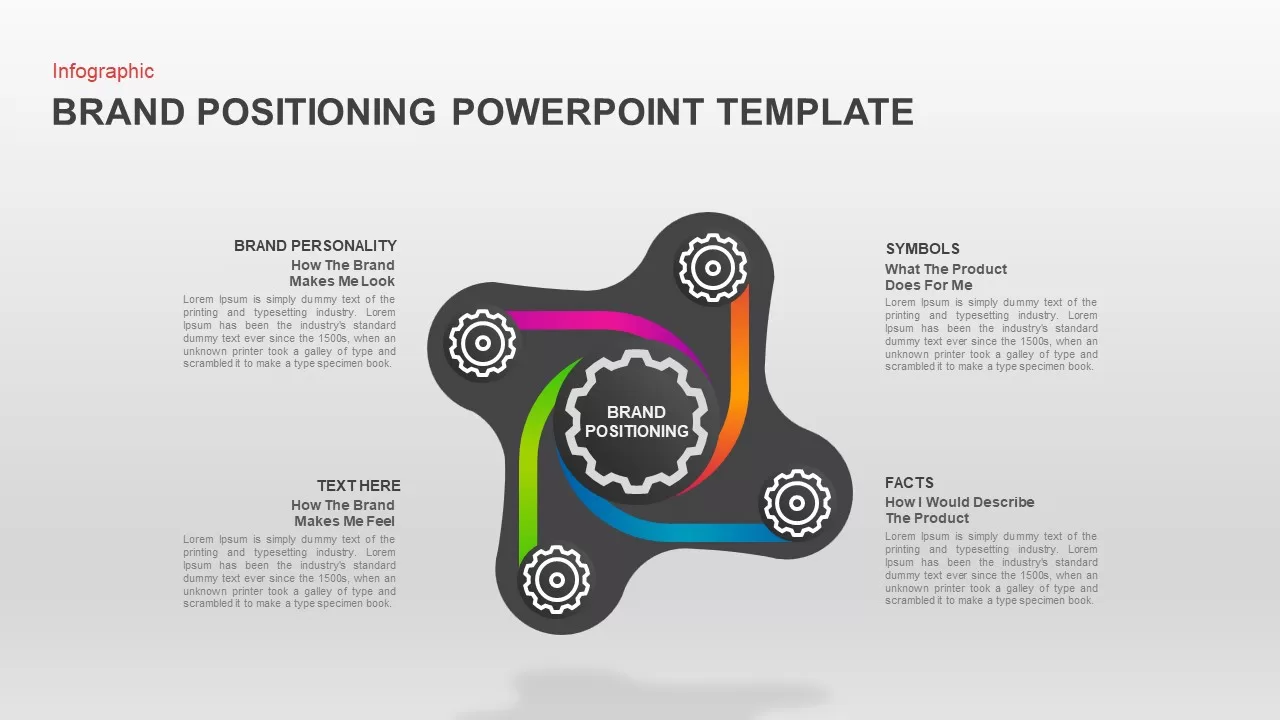
Brand Positioning Presentation Template for PowerPoint & Google Slides
Business
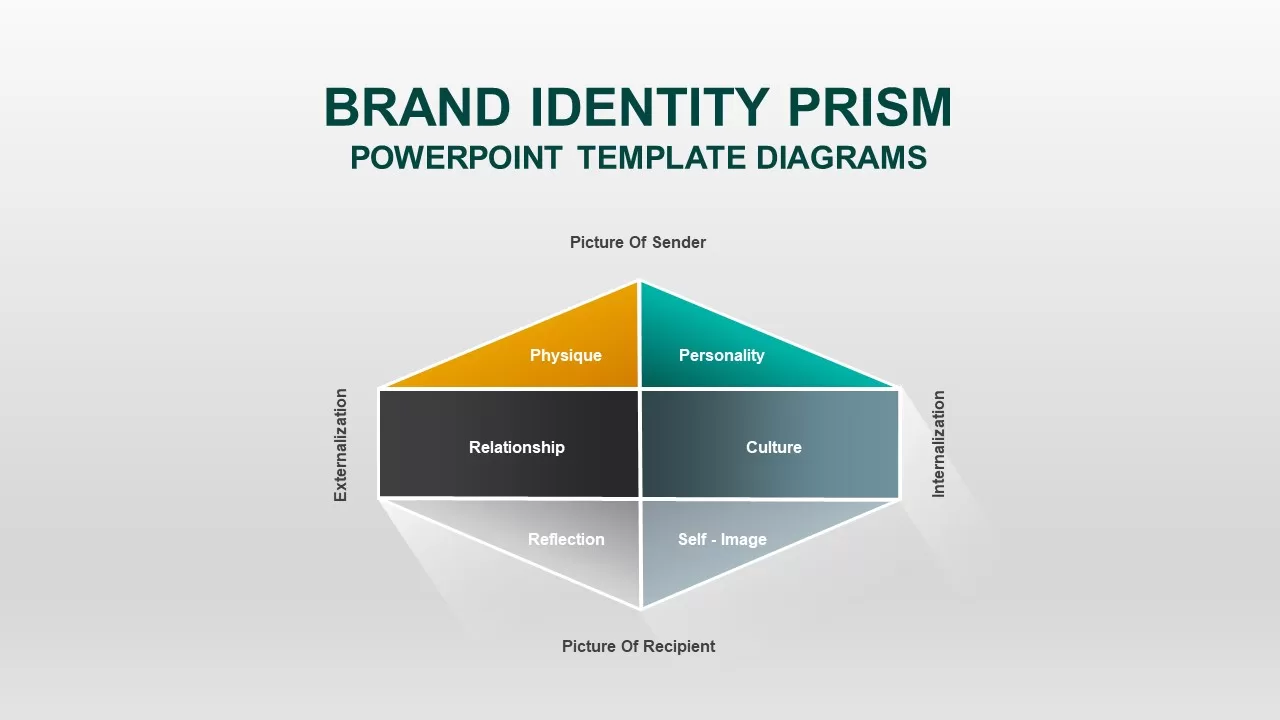
Brand Identity Prism Template for PowerPoint & Google Slides
Infographics

Free Luxury Brand Presentation and Pitch Deck Template for PowerPoint & Google Slides
Company Profile
Free
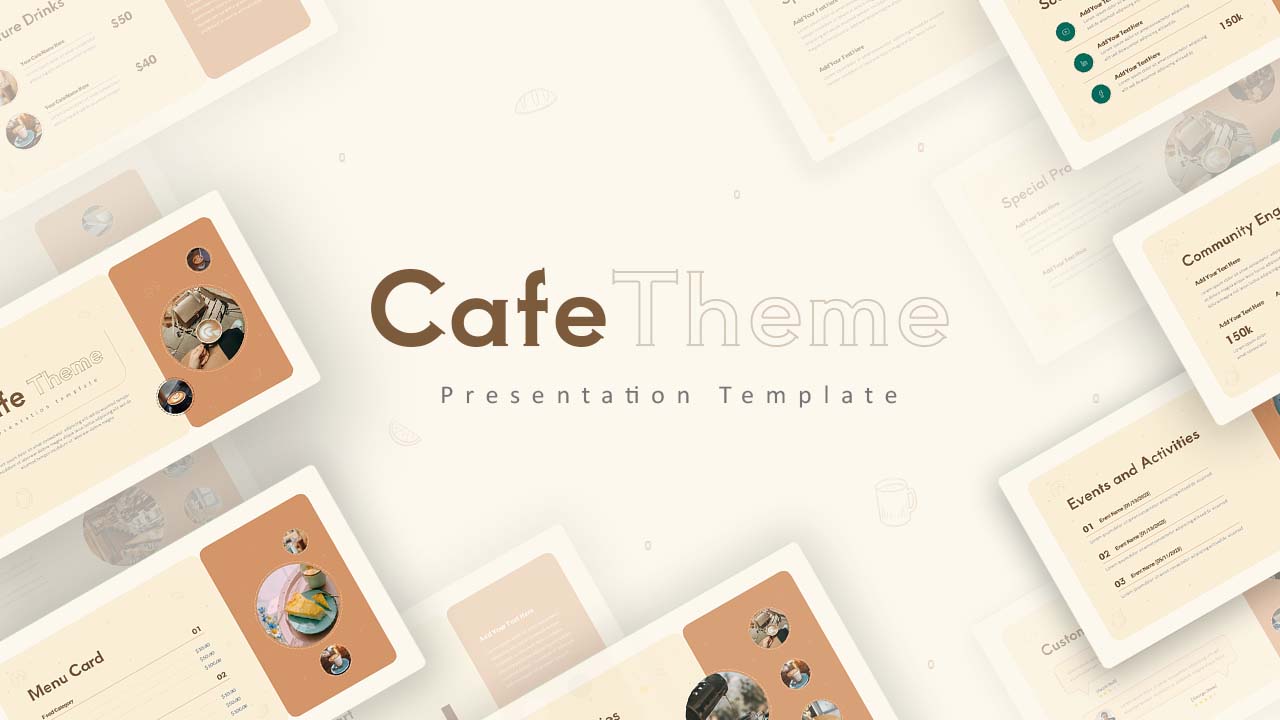
Cafe Brand & Menu Presentation Template for PowerPoint & Google Slides
Company Profile
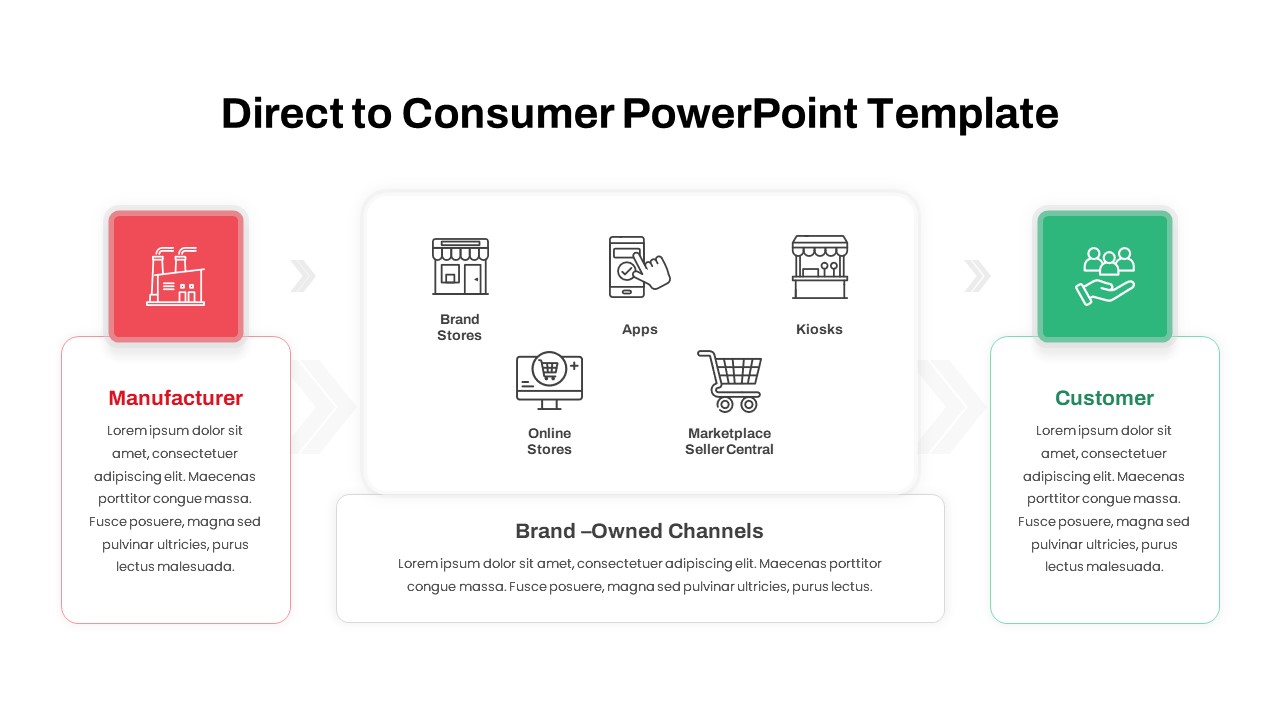
Direct to Consumer Brand Channels Flow Template for PowerPoint & Google Slides
Business Models
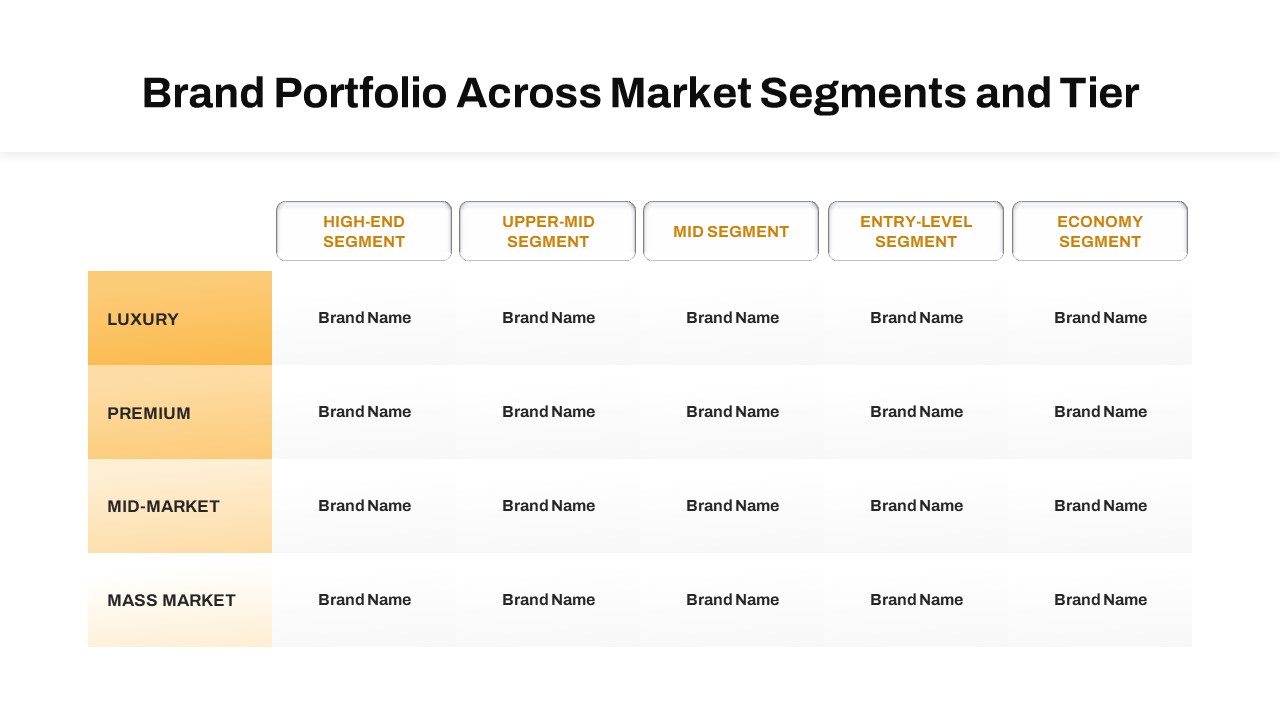
Brand Portfolio Matrix: Segments & Tiers Template for PowerPoint & Google Slides
Business Report
Strategic Business Diamond Diagram Template for PowerPoint & Google Slides
Business Strategy

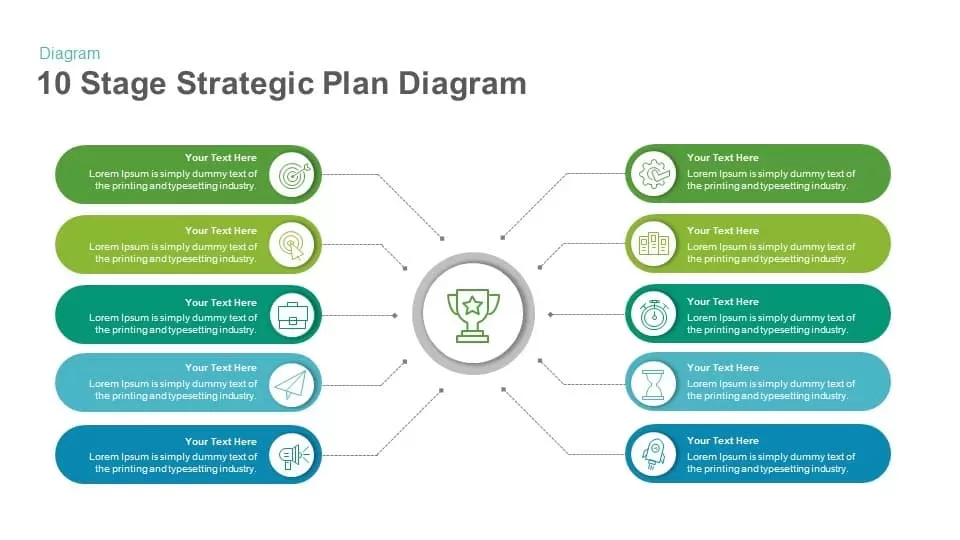
10 Stage Strategic Plan Diagram template for PowerPoint & Google Slides
Process
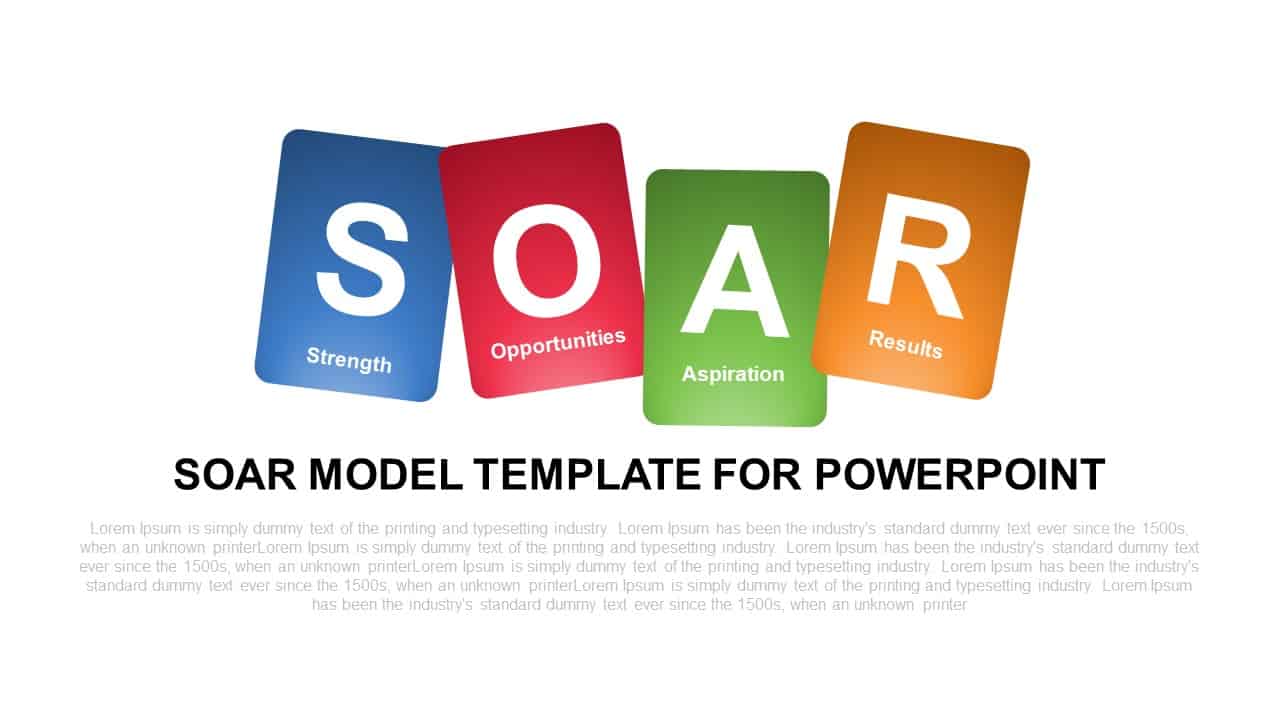
SOAR Strategic Model Card Diagram Template for PowerPoint & Google Slides
Process
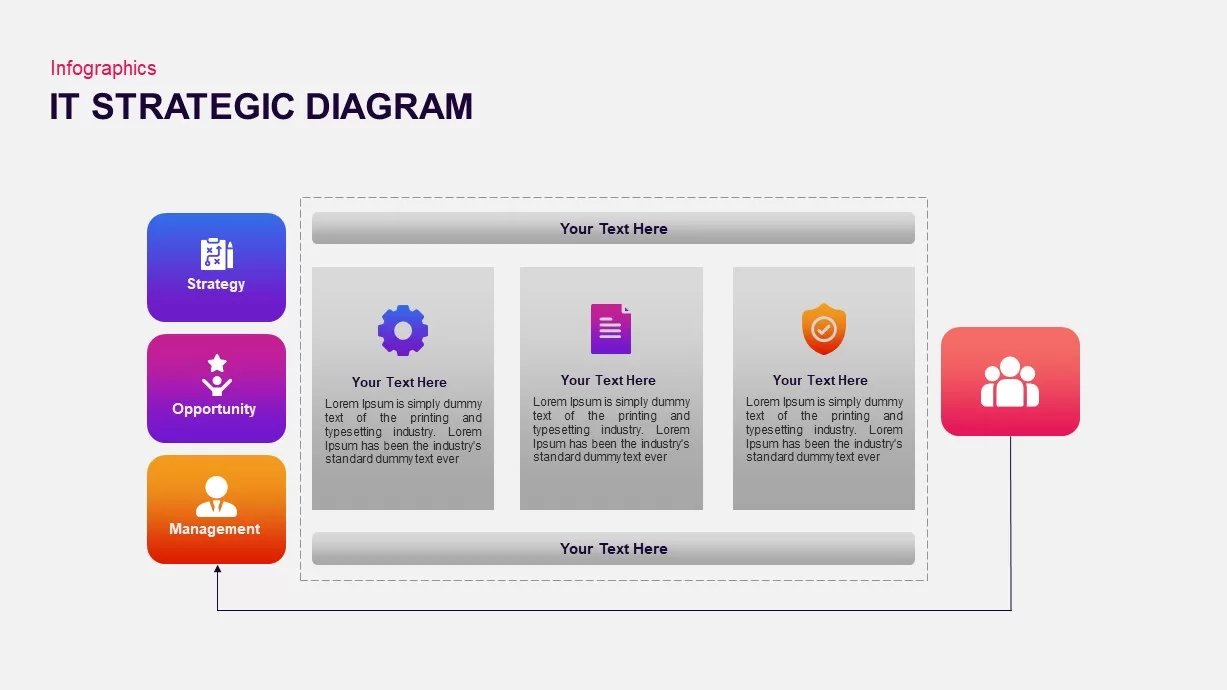
IT Strategic Diagram Infographic Pack Template for PowerPoint & Google Slides
Business Strategy
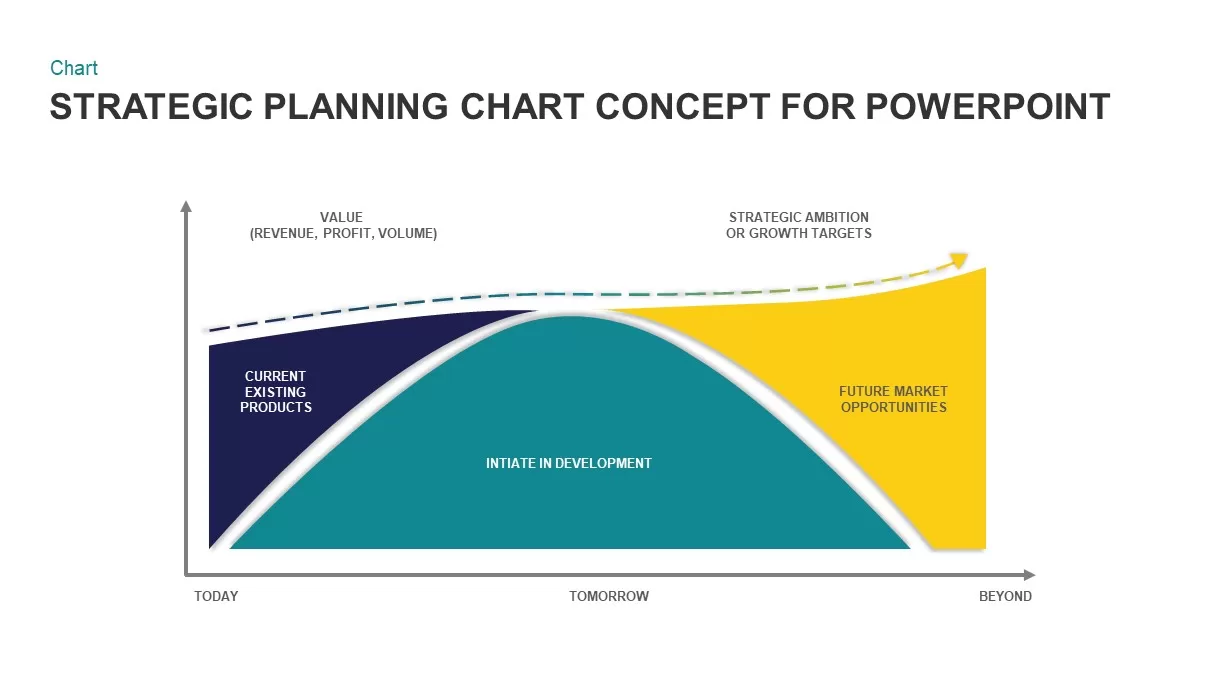
Strategic Planning Curve Diagram Template for PowerPoint & Google Slides
Charts
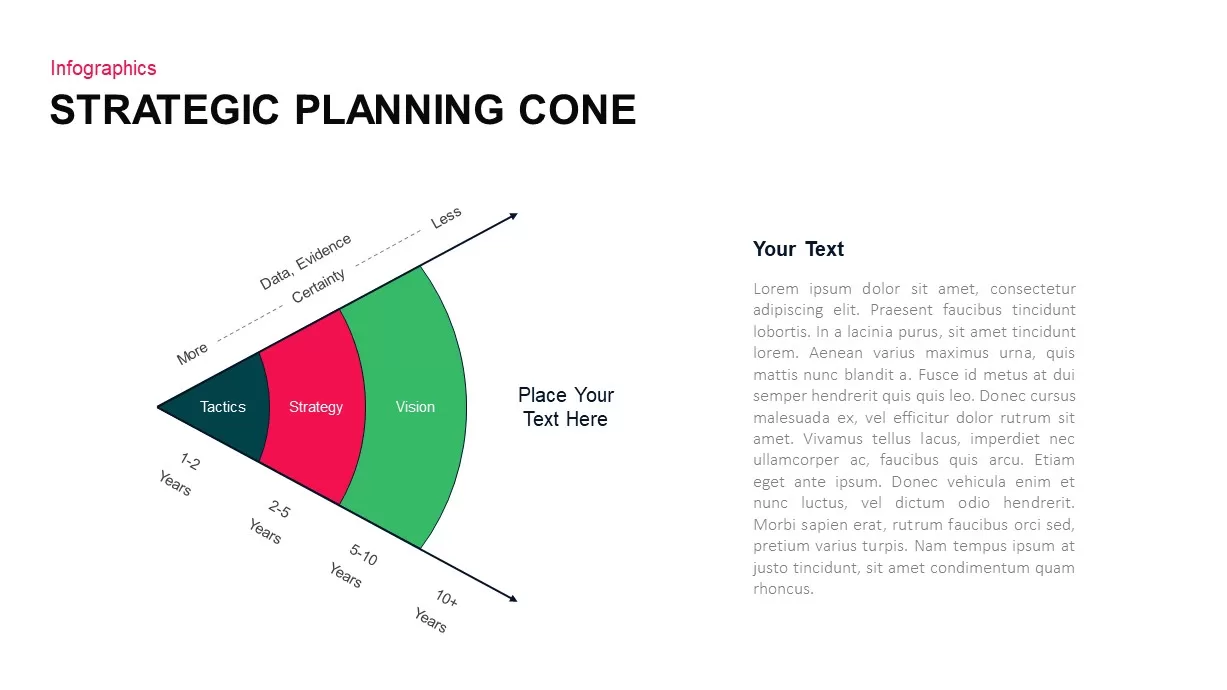
3-Part Strategic Planning Cone Diagram Template for PowerPoint & Google Slides
Process
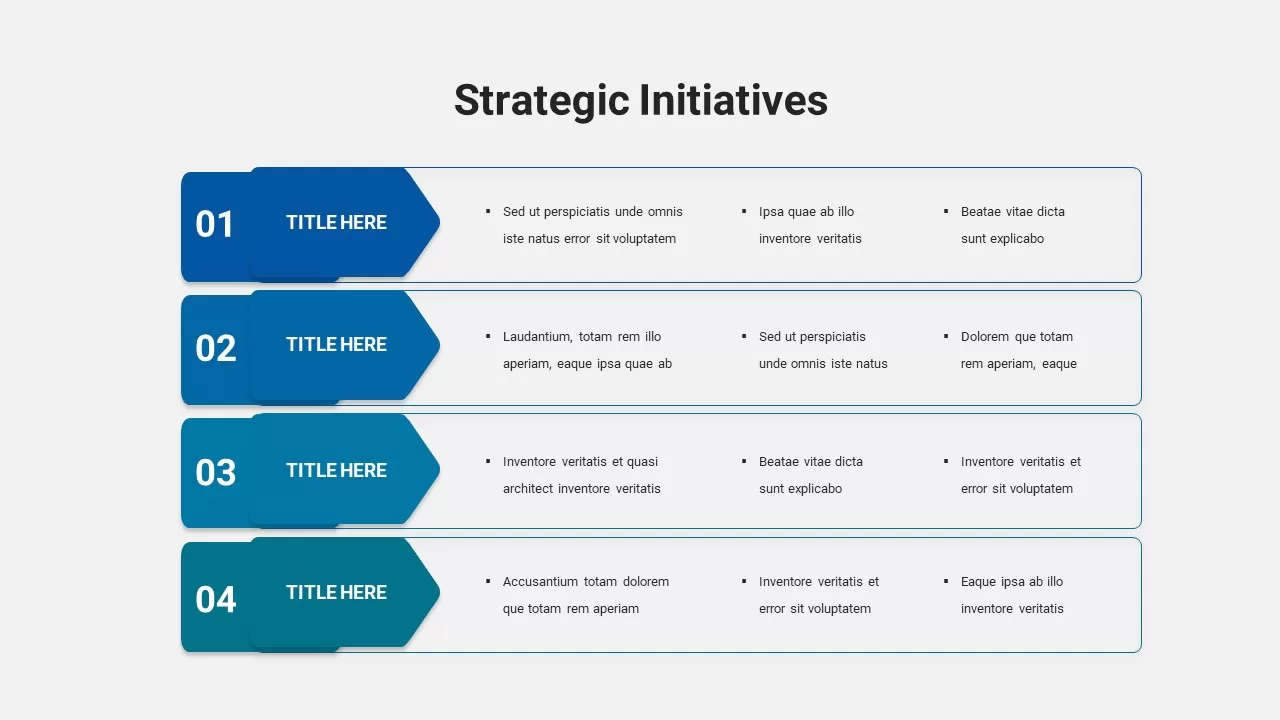
Arrowed Strategic Initiatives Diagram Template for PowerPoint & Google Slides
Process
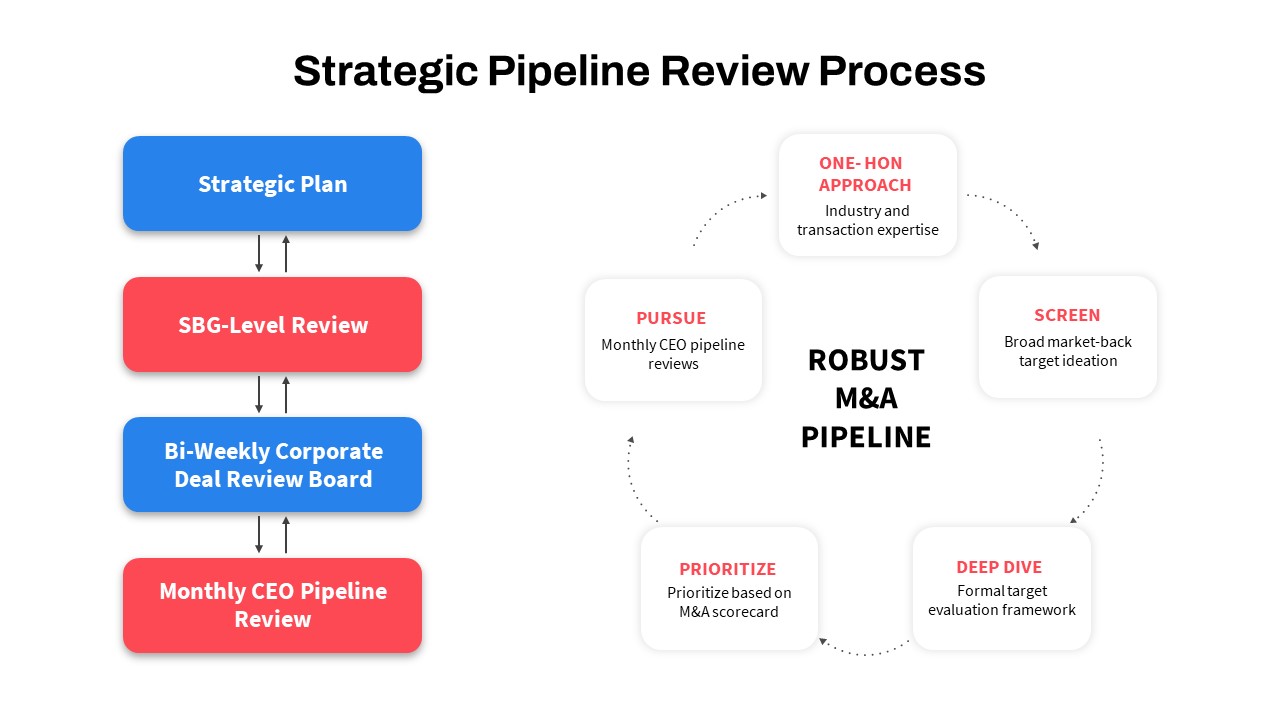
Strategic Pipeline Review Diagram Template for PowerPoint & Google Slides
Business Strategy
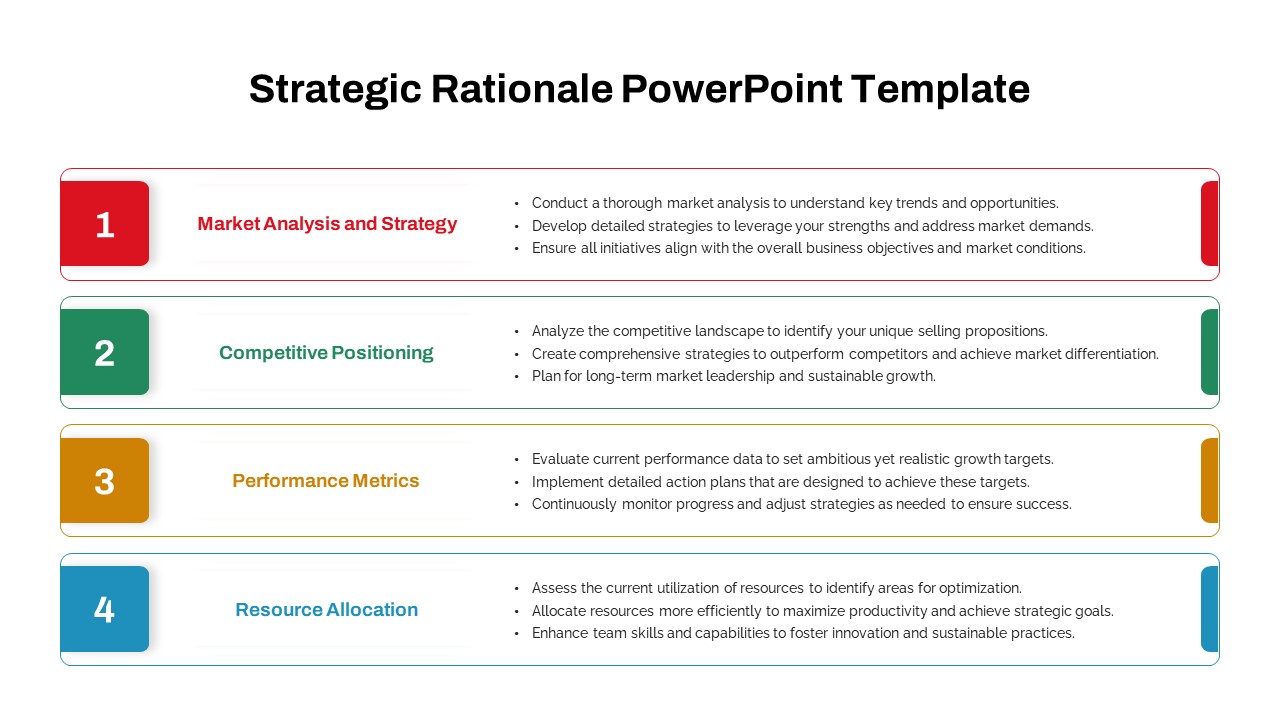
Strategic Rationale Framework Diagram Template for PowerPoint & Google Slides
Process
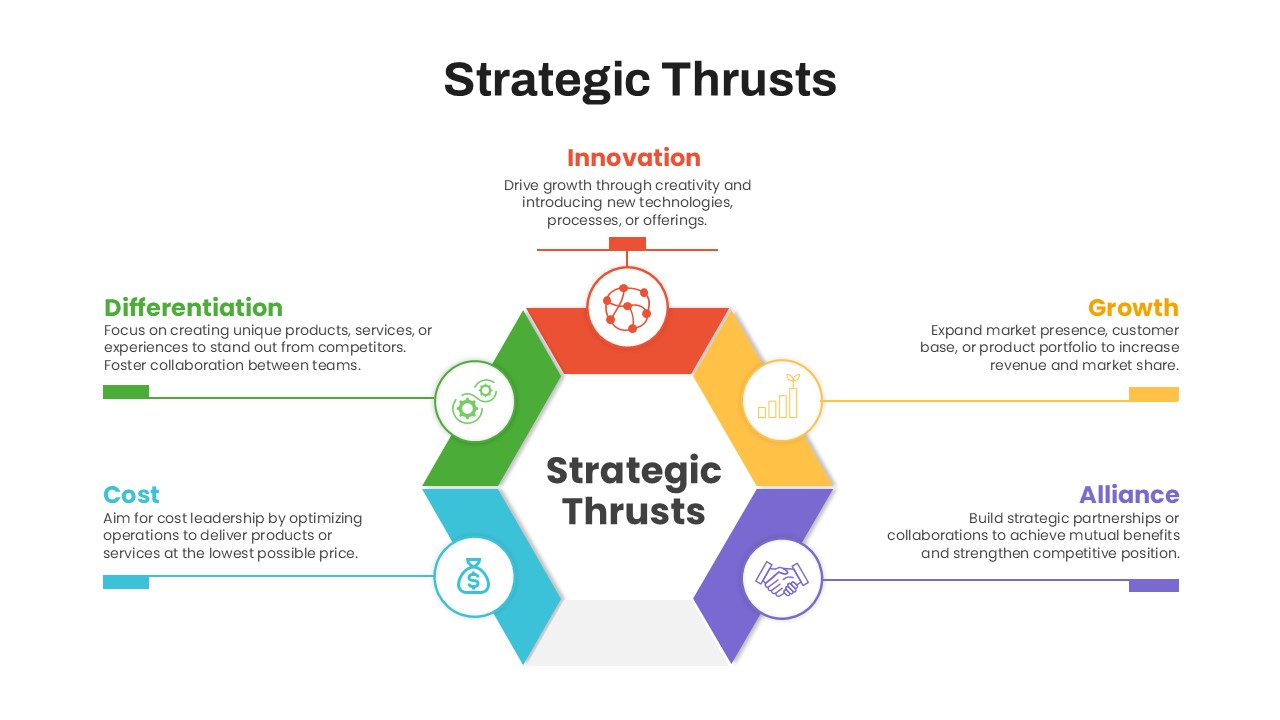
Six-Step Strategic Thrusts Diagram Slide Template for PowerPoint & Google Slides
Process
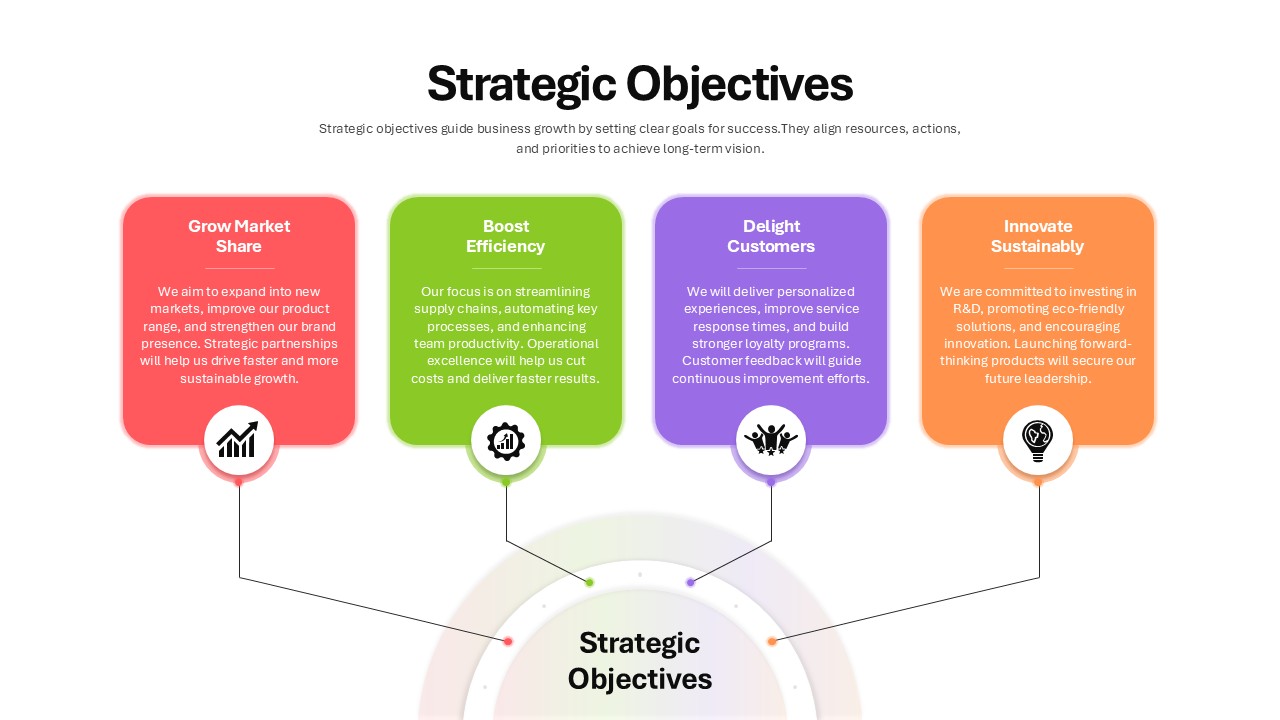
Four Strategic Objectives Radial Diagram Template for PowerPoint & Google Slides
Business Strategy
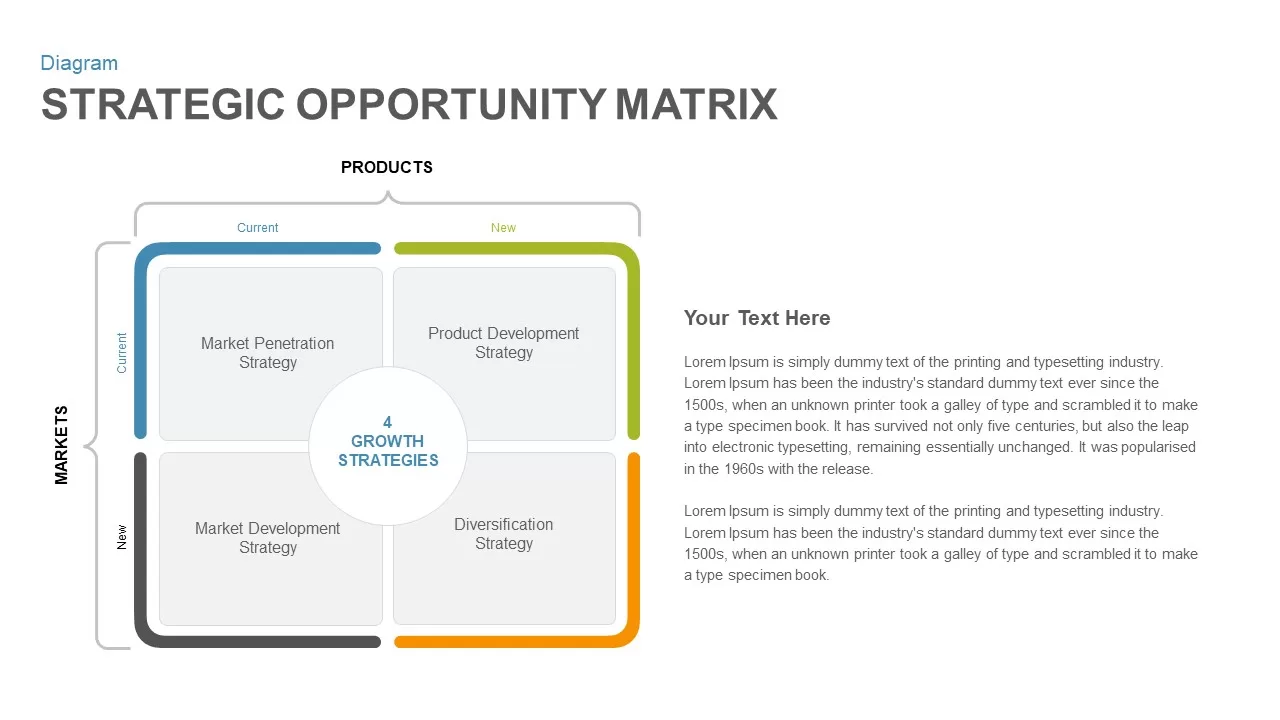
Strategic Opportunity Matrix Diagram for PowerPoint & Google Slides
Business Strategy
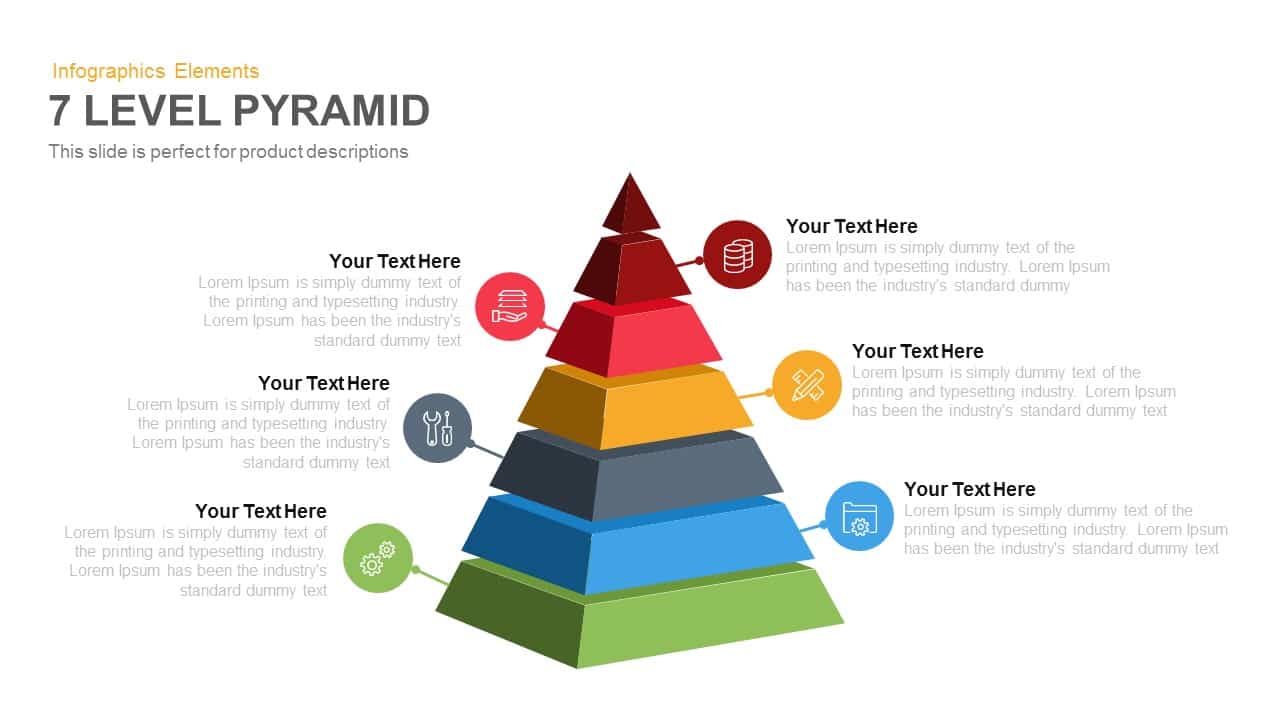
7-Level 3D Pyramid Infographic Diagram Template for PowerPoint & Google Slides
Pyramid
4-Step 3D Pyramid Diagram with Callouts template for PowerPoint & Google Slides
Pyramid
Professional 5-Stage Pyramid Diagram Template for PowerPoint & Google Slides
Pyramid
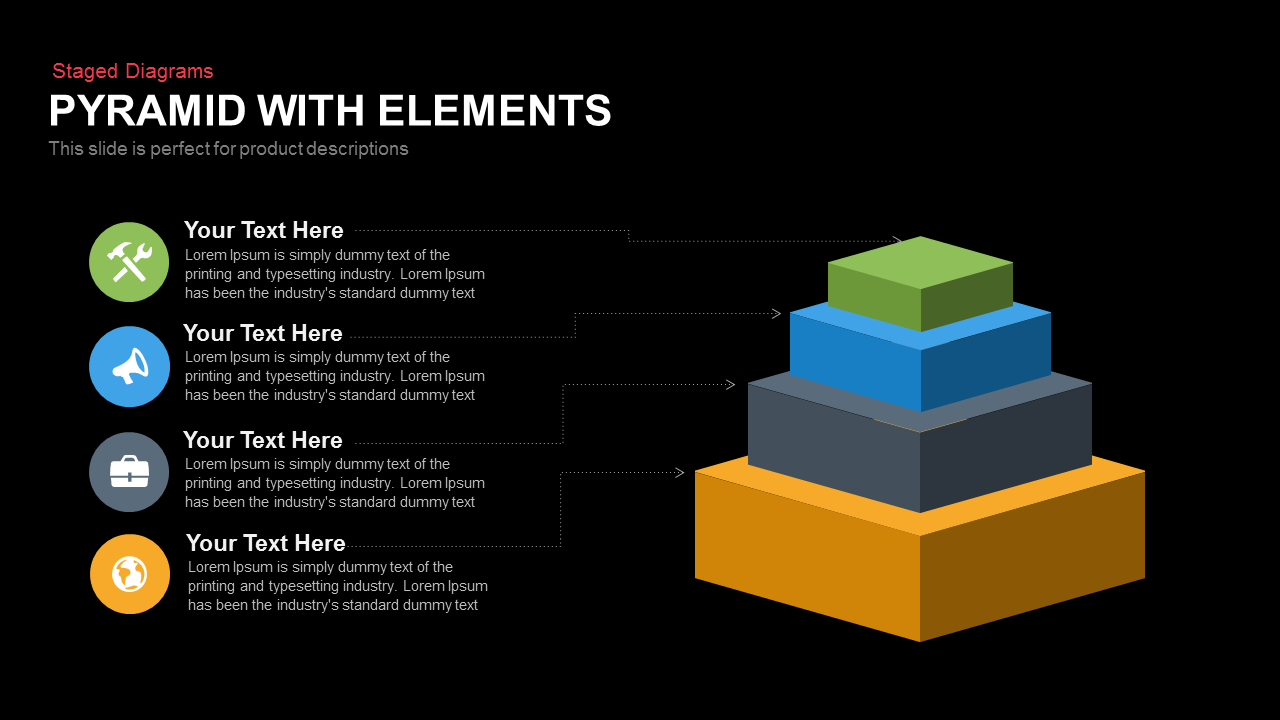
Professional 4-Piece 3D Pyramid Diagram Template for PowerPoint & Google Slides
Pyramid
Five-Stage Pyramid Infographics Diagram Template for PowerPoint & Google Slides
Pyramid
Segmented Pyramid Diagram Infographic Template for PowerPoint & Google Slides
Pyramid
Editable Six-Level 3D Pyramid Diagram Template for PowerPoint & Google Slides
Pyramid

Four-Level Business Pyramid Diagram Template for PowerPoint & Google Slides
Pyramid
Five-Level Staged Pyramid Diagram Template for PowerPoint & Google Slides
Pyramid
Five Stages Pyramid with Ribbons Diagram Template for PowerPoint & Google Slides
Pyramid
Stacked Cubes Pyramid Six-Option Diagram Template for PowerPoint & Google Slides
Pyramid
3D Four-Stage Pyramid Diagram Template for PowerPoint & Google Slides
Pyramid
Four-Level Colorful Pyramid Diagram Template for PowerPoint & Google Slides
Pyramid
3D Six-Level Pyramid Diagram Infographic Template for PowerPoint & Google Slides
Pyramid
3D Five-Stage Pyramid Diagram Slide Template for PowerPoint & Google Slides
Pyramid
Modern Four-Level Pyramid Diagram Template for PowerPoint & Google Slides
Pyramid
Five-Level Vision Pyramid Diagram Template for PowerPoint & Google Slides
Pyramid
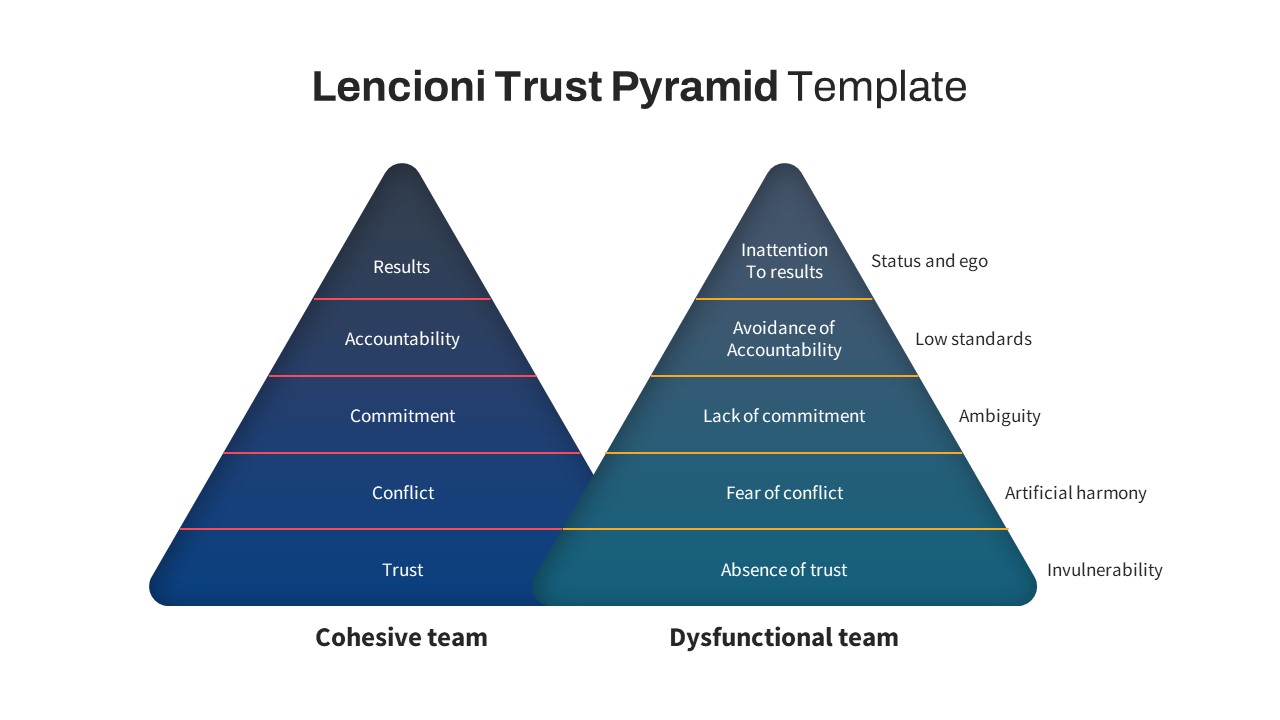
Lencioni Trust Pyramid Diagram Template for PowerPoint & Google Slides
Pyramid
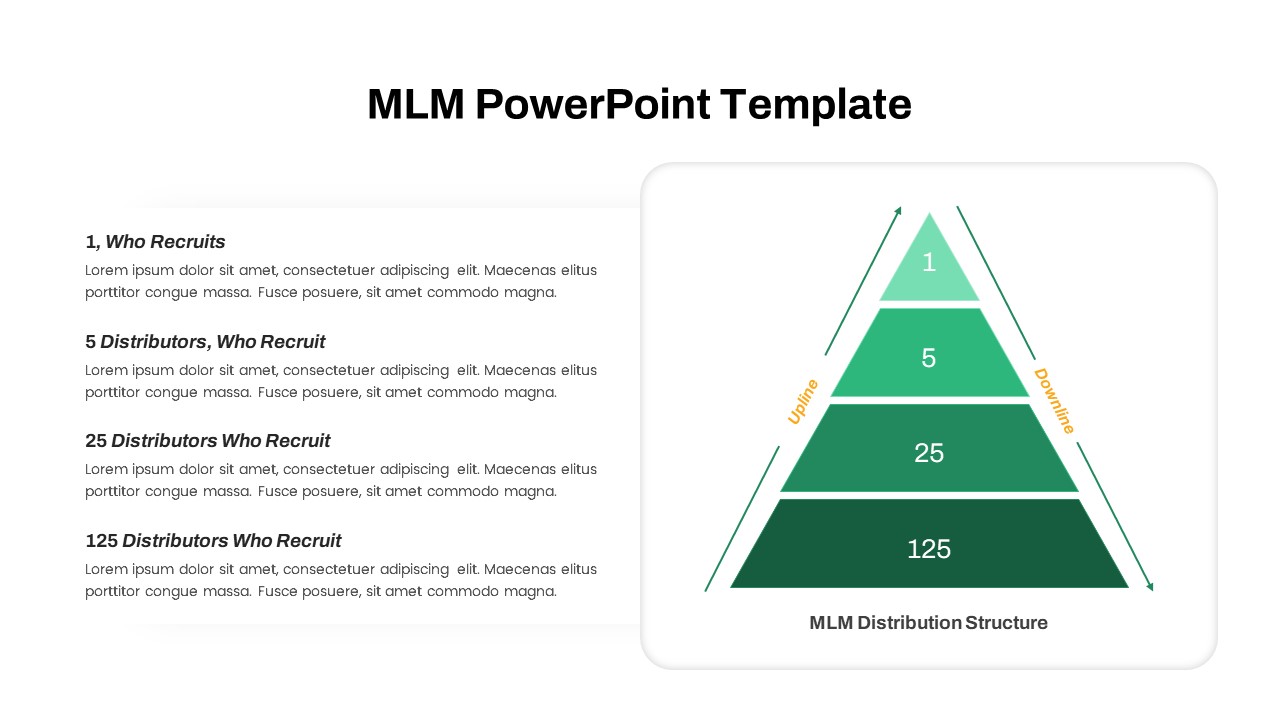
MLM Distribution Pyramid Diagram Template for PowerPoint & Google Slides
Business Models
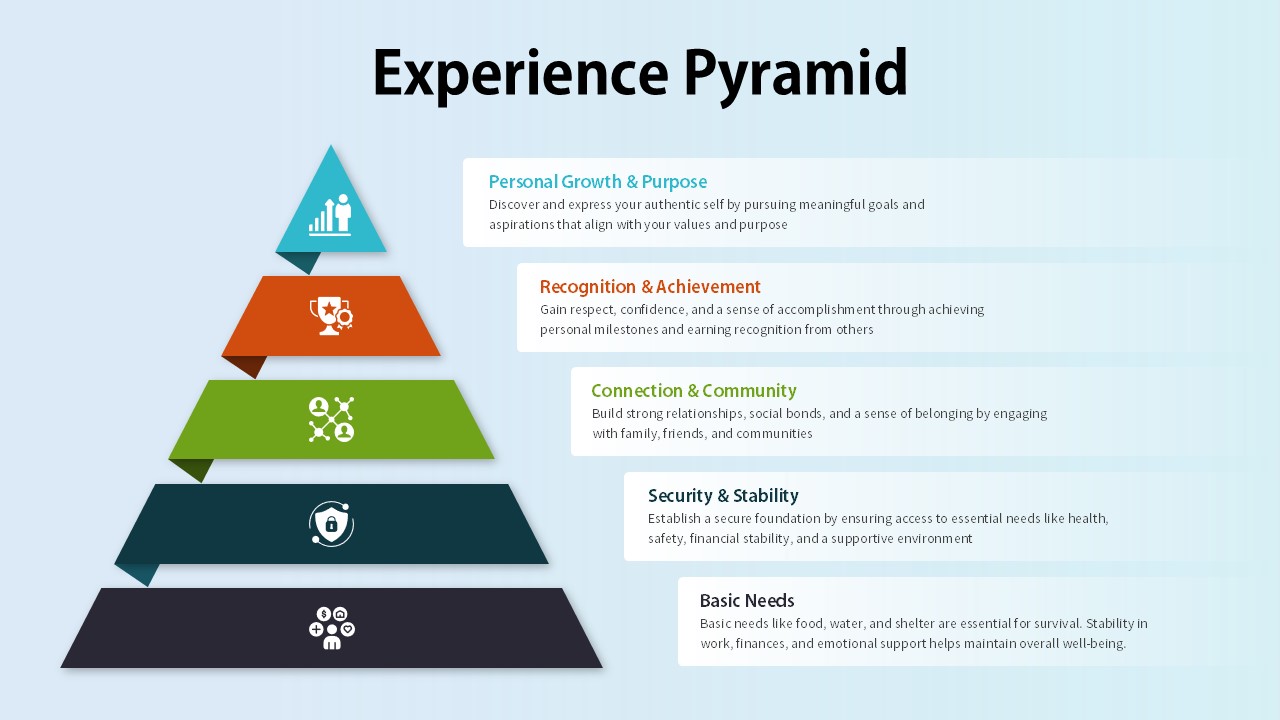
Experience Pyramid Hierarchy Diagram Template for PowerPoint & Google Slides
Pyramid
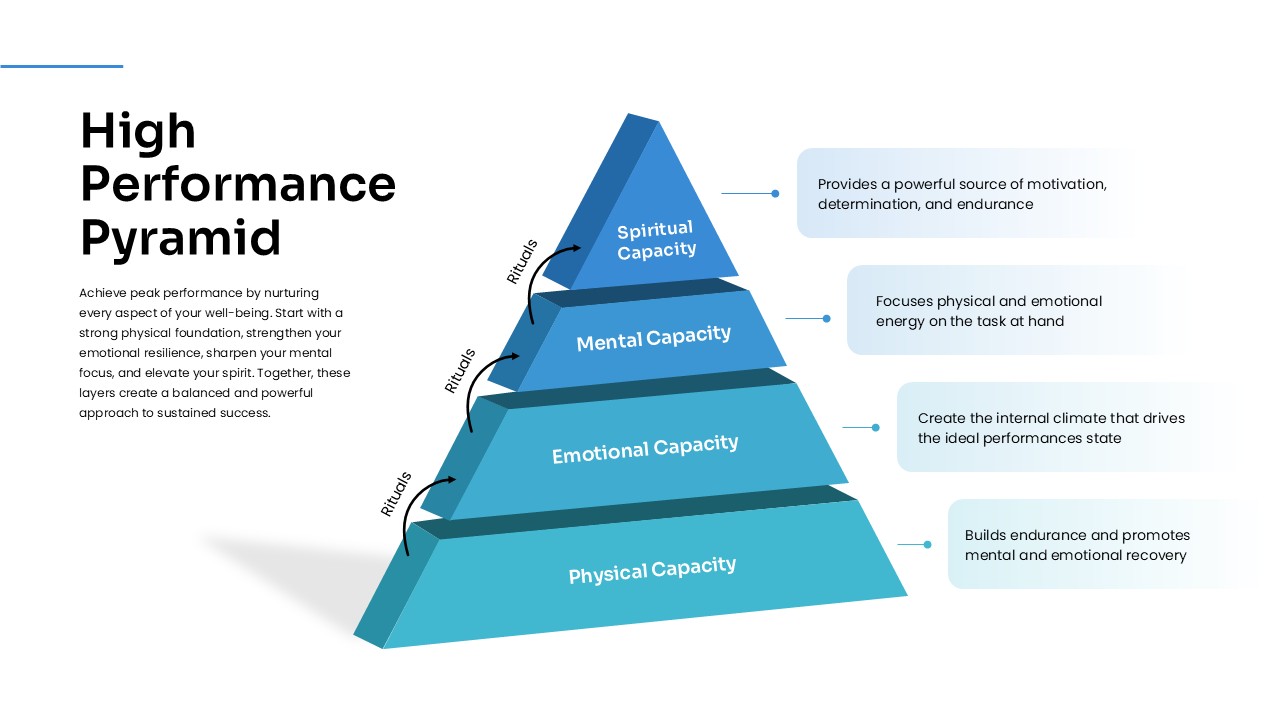
High Performance Pyramid Diagram Template for PowerPoint & Google Slides
Pyramid
Data Governance Roles Pyramid Diagram Template for PowerPoint & Google Slides
Pyramid
Four-Level Colorful Pyramid Diagram Template for PowerPoint & Google Slides
Pyramid
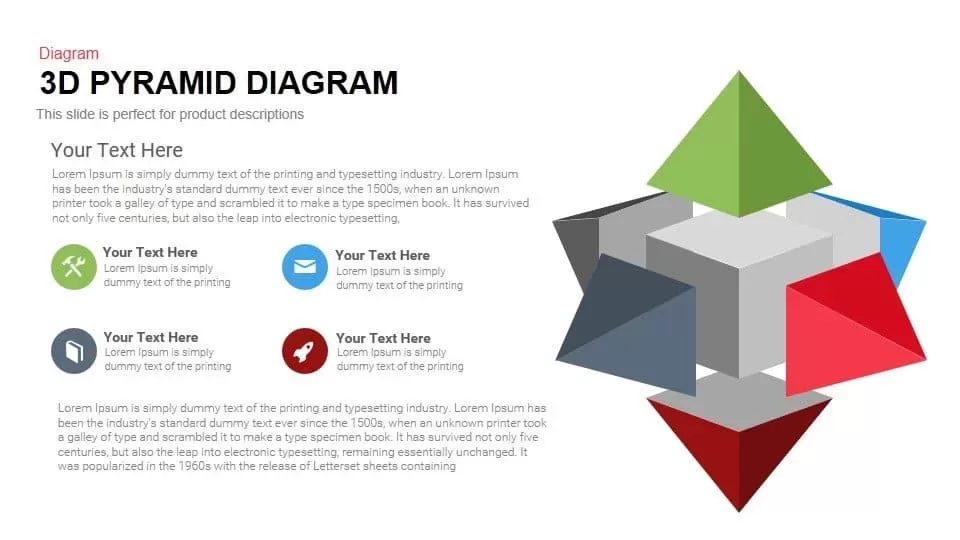
3D Pyramid Diagram for PowerPoint & Google Slides
Pyramid
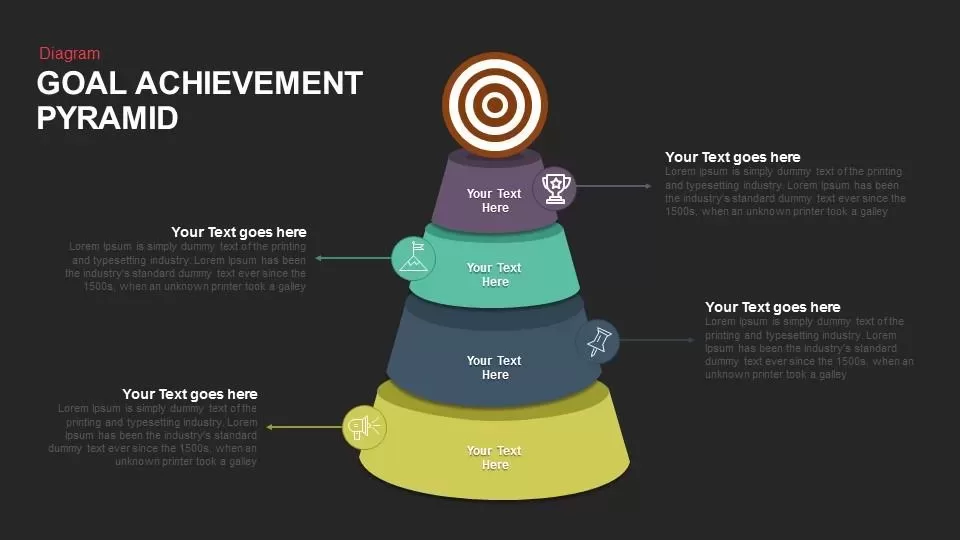
Goal Achievement Pyramid Diagram for PowerPoint & Google Slides
Pyramid
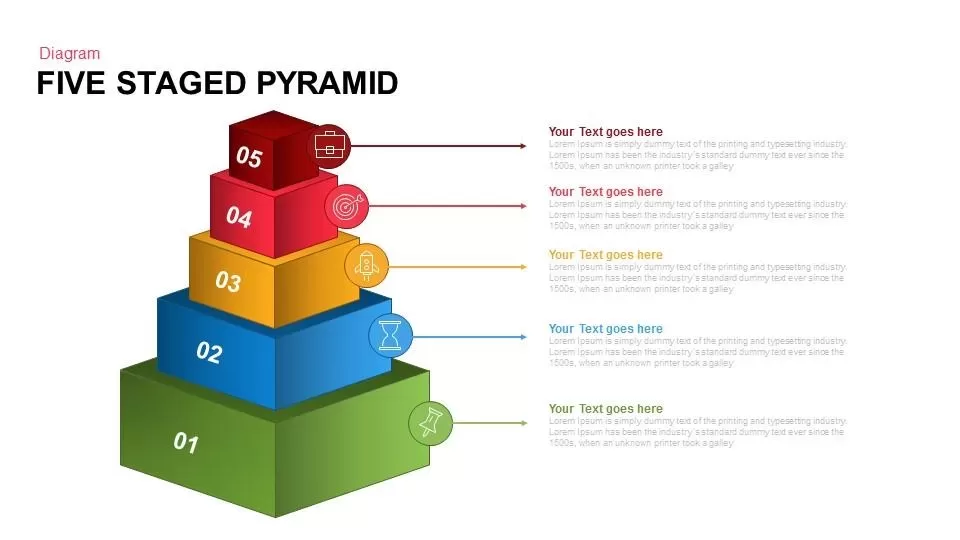
Five Staged Pyramid Diagram for PowerPoint & Google Slides
Pyramid
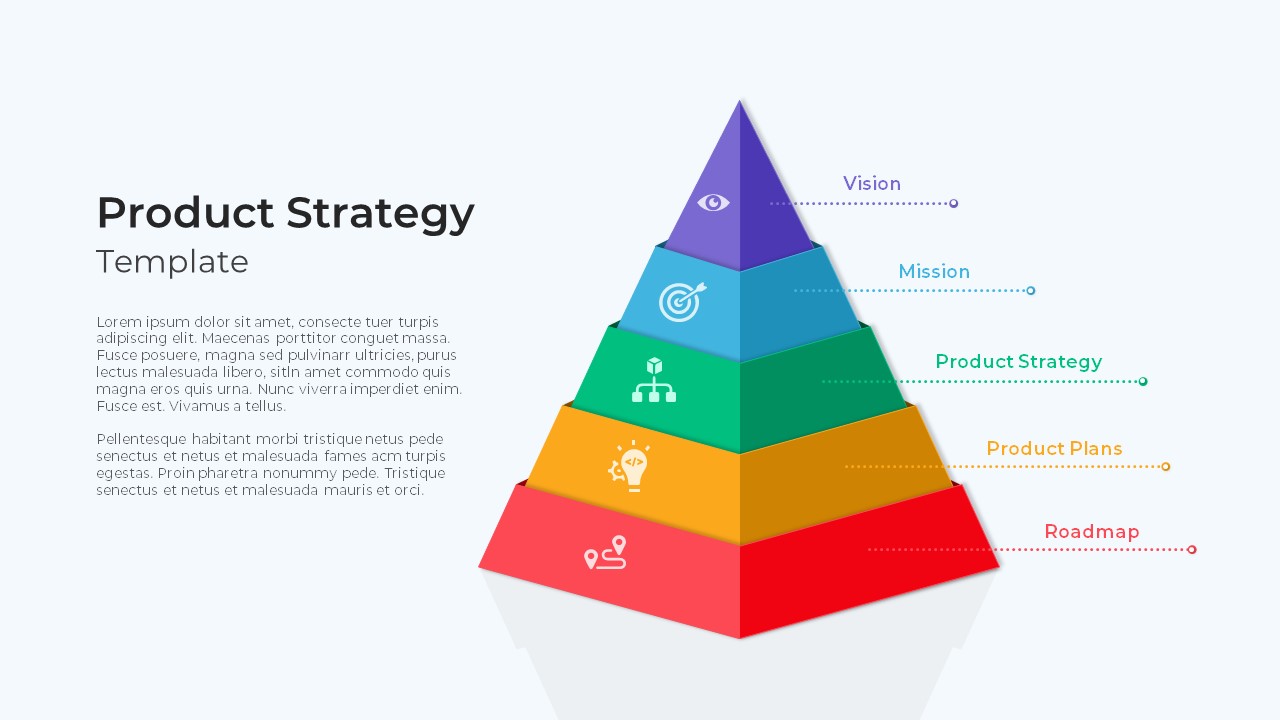
Product Strategy Pyramid Diagram for PowerPoint & Google Slides
Business Strategy
3 Stage Pyramid Slides for PowerPoint & Google Slides
Pyramid
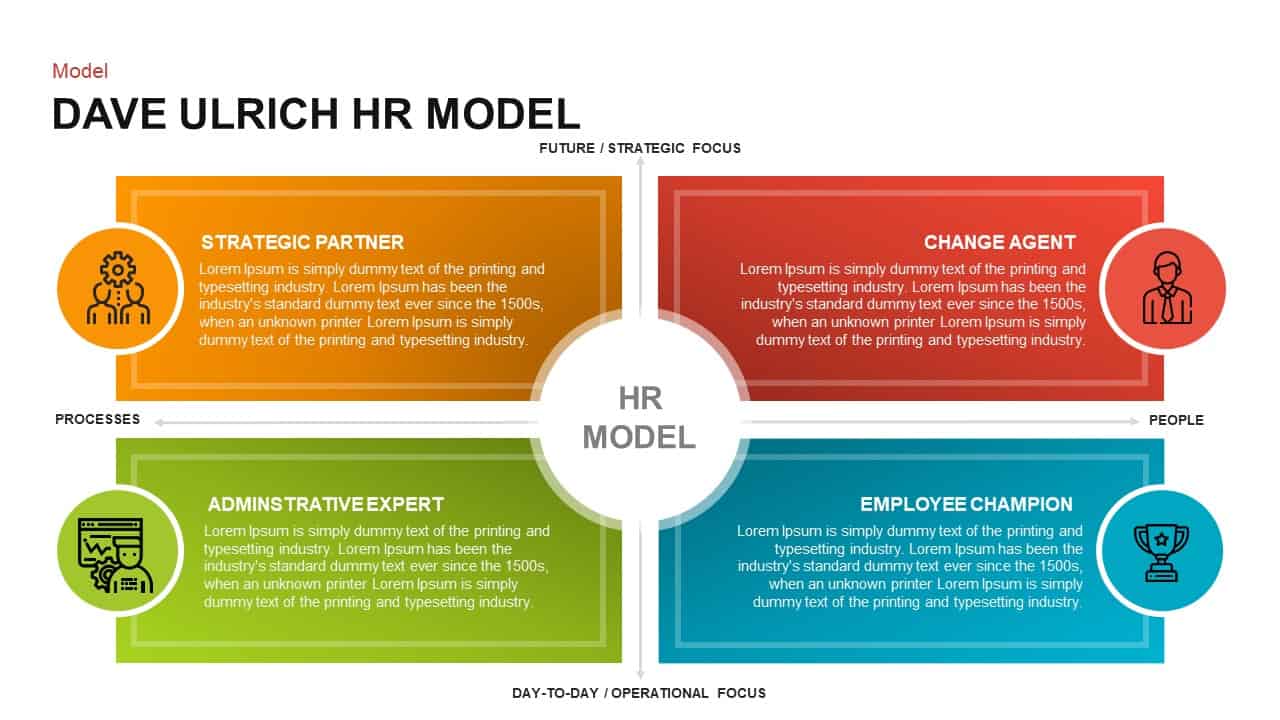
Dave Ulrich Strategic HR Model Quadrant Template for PowerPoint & Google Slides
Employee Performance
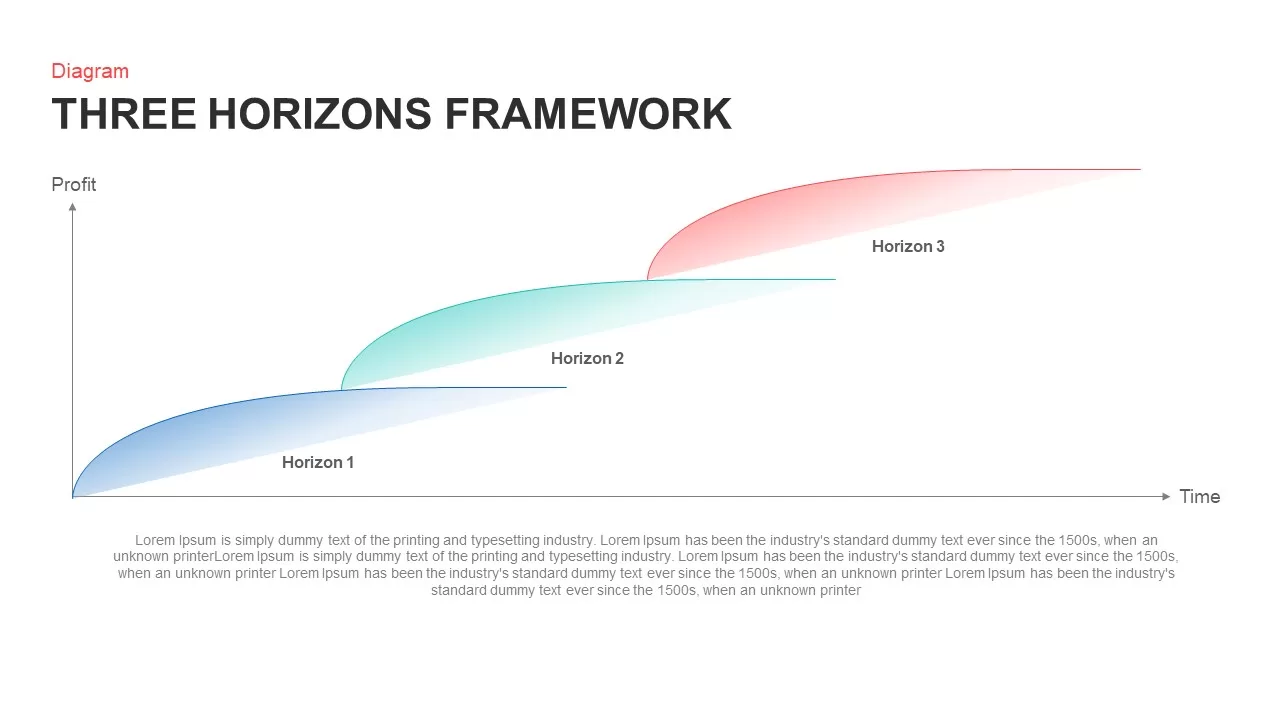
Strategic Three Horizons Framework Template for PowerPoint & Google Slides
Business Strategy
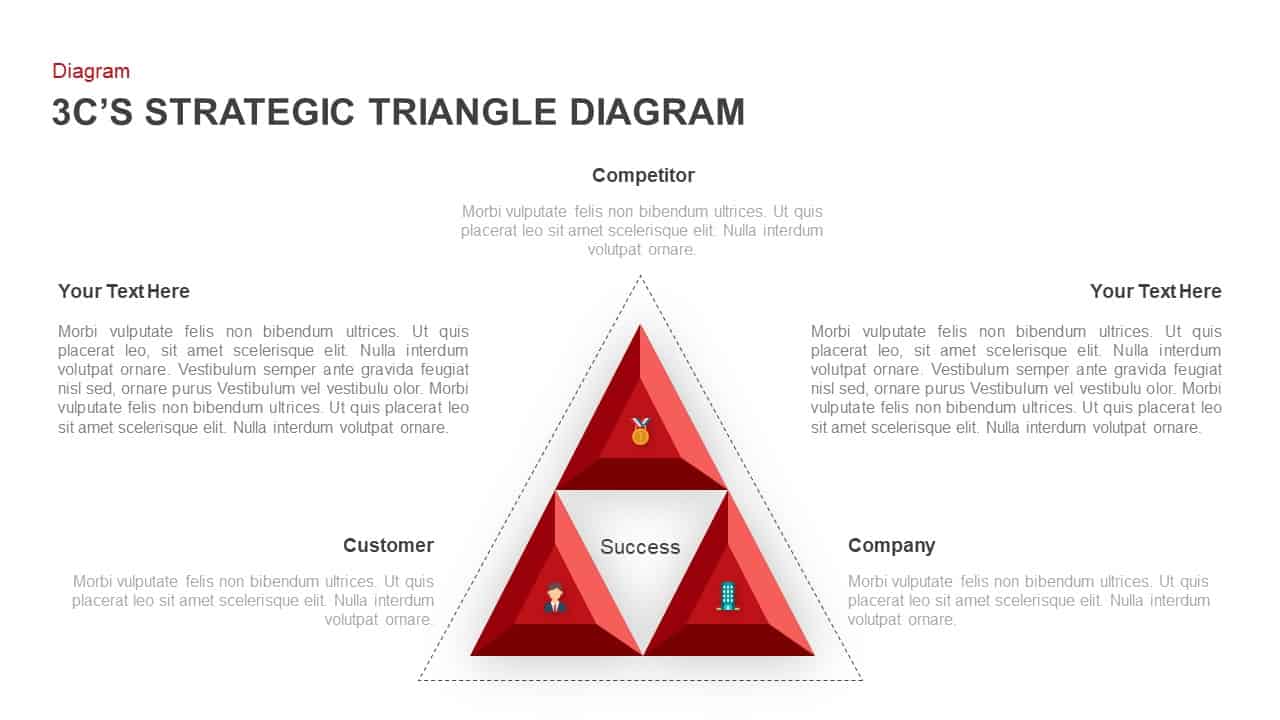
3C Strategic Triangle Analysis Template for PowerPoint & Google Slides
Competitor Analysis
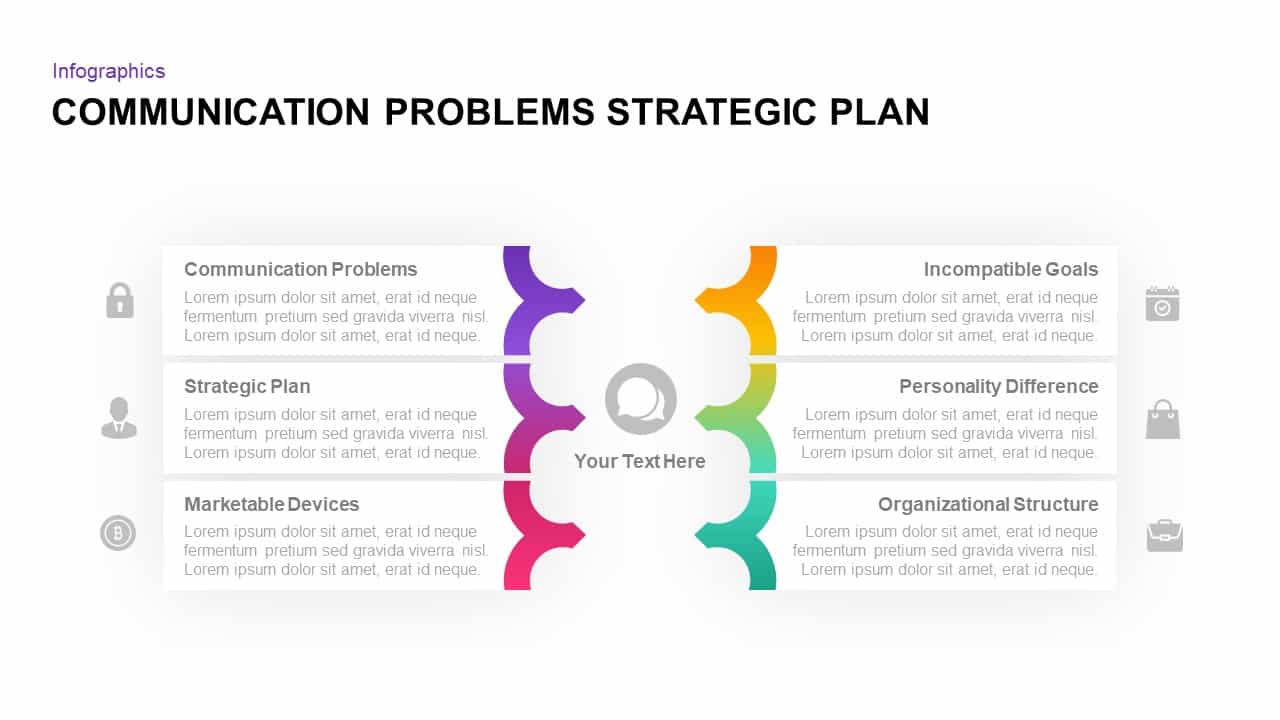
Communication Problems & Strategic Plan Template for PowerPoint & Google Slides
Process
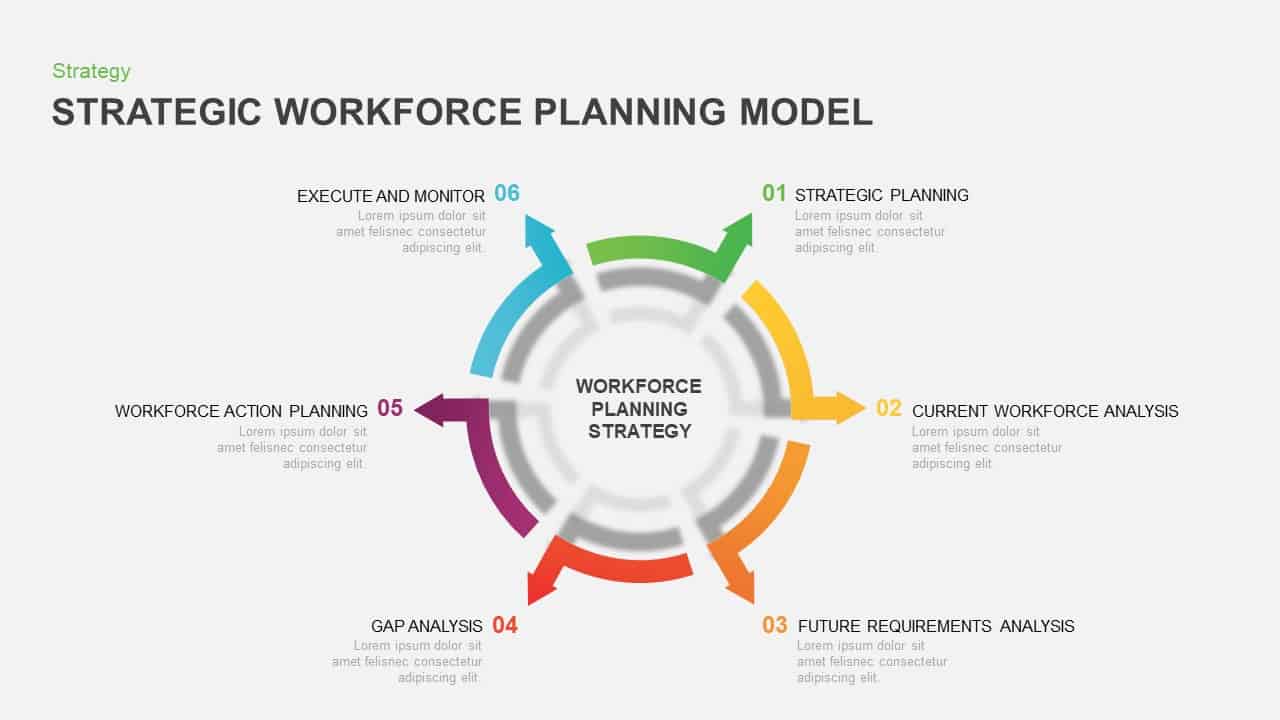
Strategic Workforce Planning Circular Template for PowerPoint & Google Slides
Circular
Three-Year Strategic Plan Matrix Template for PowerPoint & Google Slides
Timeline
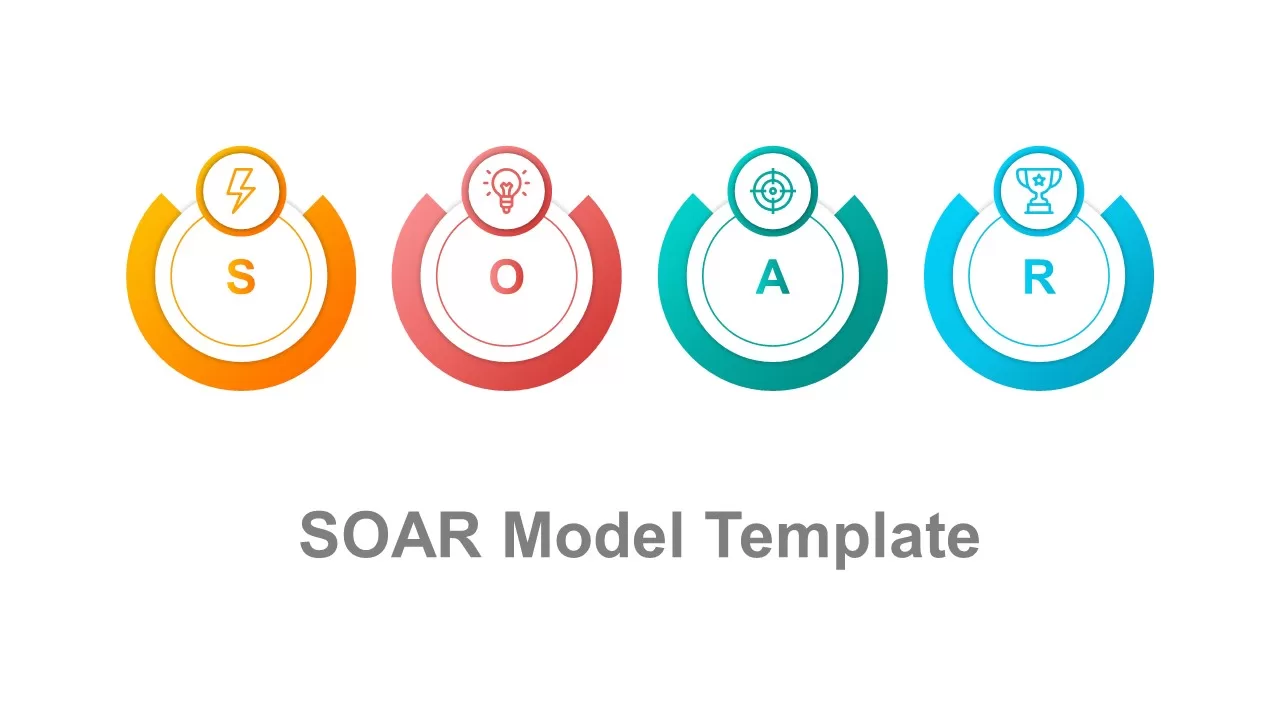
SOAR Strategic Planning Infographic Template for PowerPoint & Google Slides
Process
Strategic ADL Matrix by Industry Life Cycle & Position Template for PowerPoint & Google Slides
Business Strategy
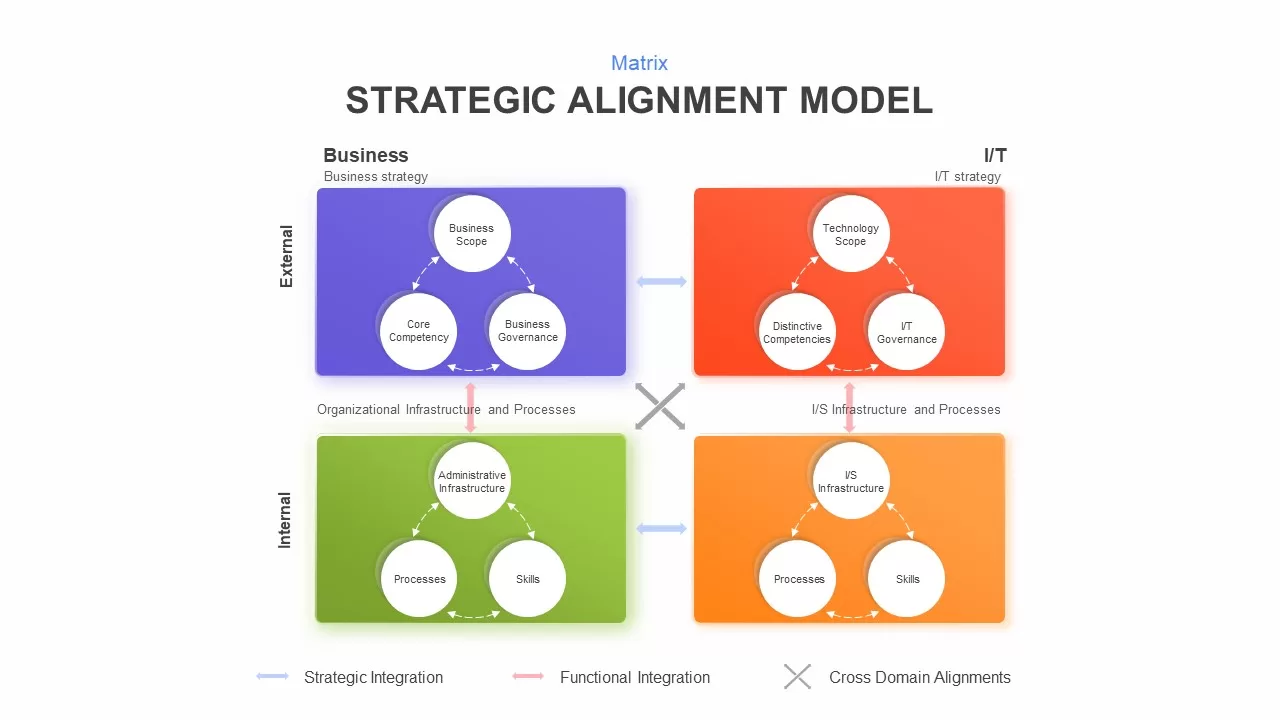
Strategic Alignment Matrix Model Template for PowerPoint & Google Slides
Project
Gap Analysis Strategic Planning Template for PowerPoint & Google Slides
Gap
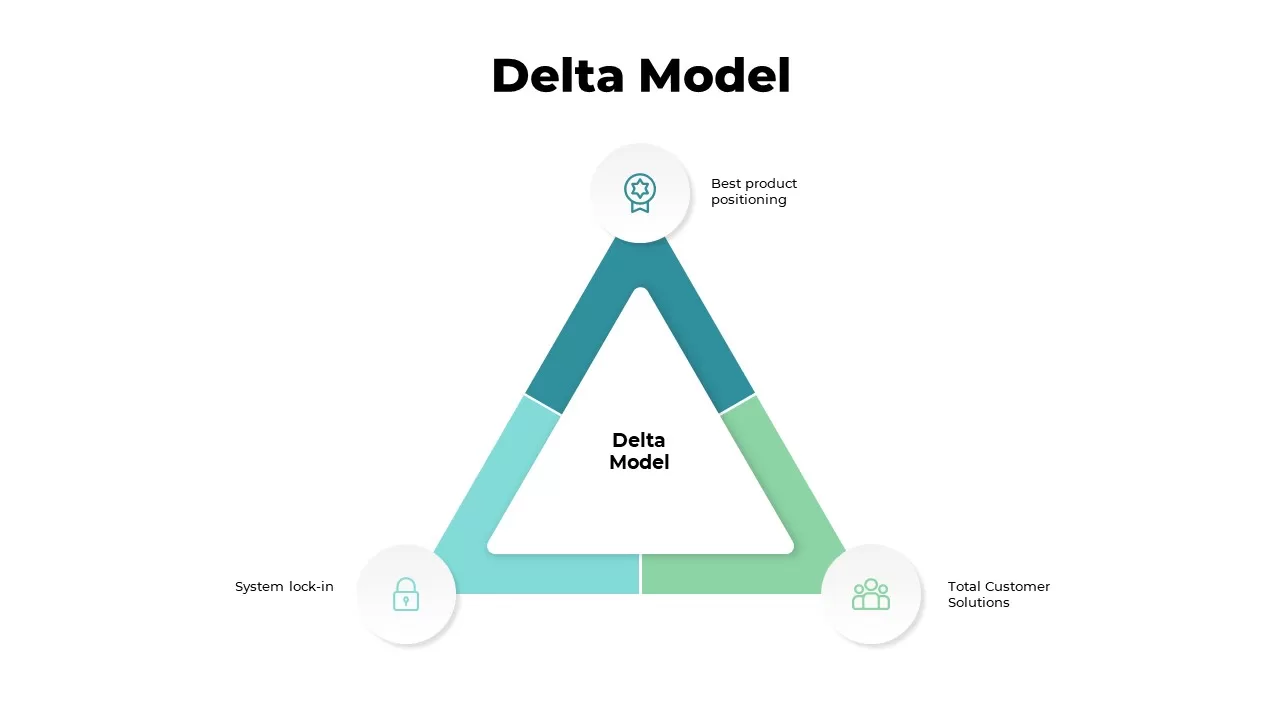
Delta Model Strategic Framework Template for PowerPoint & Google Slides
Business Strategy
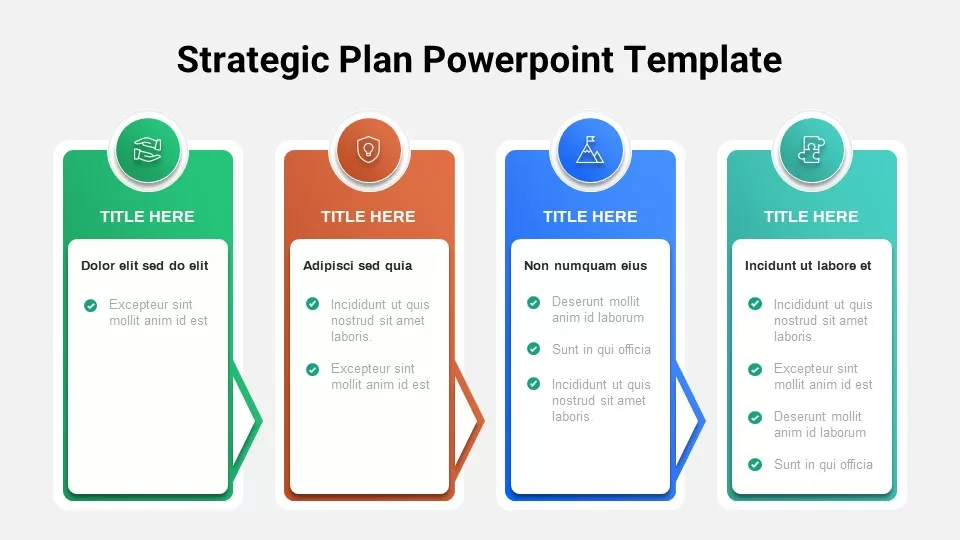
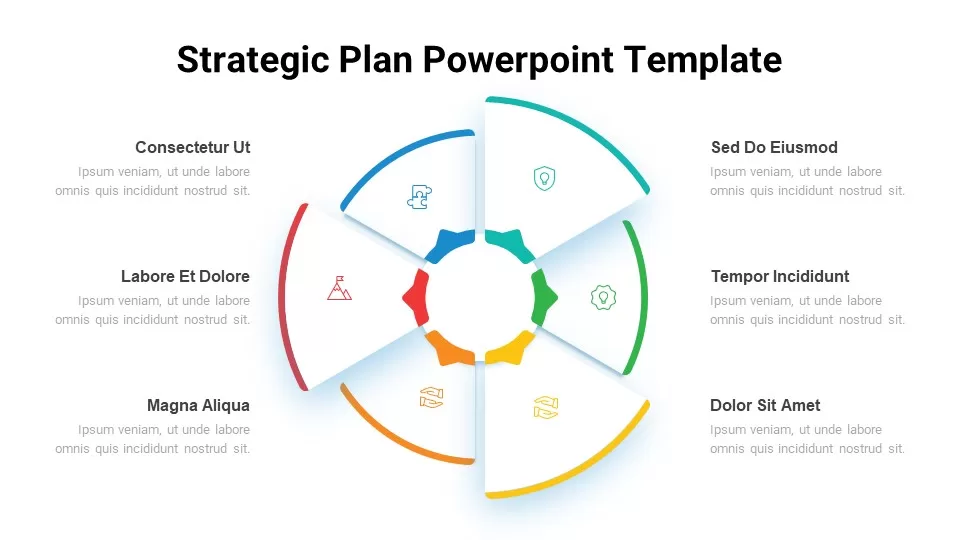
Free Strategic Plan Overview template for PowerPoint & Google Slides
Business Strategy
Free
Free Strategic Plan template for PowerPoint & Google Slides
Business Strategy
Free
Four-Step Strategic Table of Contents Template for PowerPoint & Google Slides
Agenda
Strategic Initiatives Overview template for PowerPoint & Google Slides
Business Strategy
4-Item Strategic Initiatives Slide Template for PowerPoint & Google Slides
Process
Strategic Initiatives Pill Shape Slide Template for PowerPoint & Google Slides
Pitch Deck
Four-Step Strategic Initiatives Card Template for PowerPoint & Google Slides
Process
Strategic Initiatives template for PowerPoint & Google Slides
Business
McKinsey 7S Model Strategic Alignment Template for PowerPoint & Google Slides
Circular
Hexagon 7S Strategic Alignment Model Template for PowerPoint & Google Slides
Business Strategy
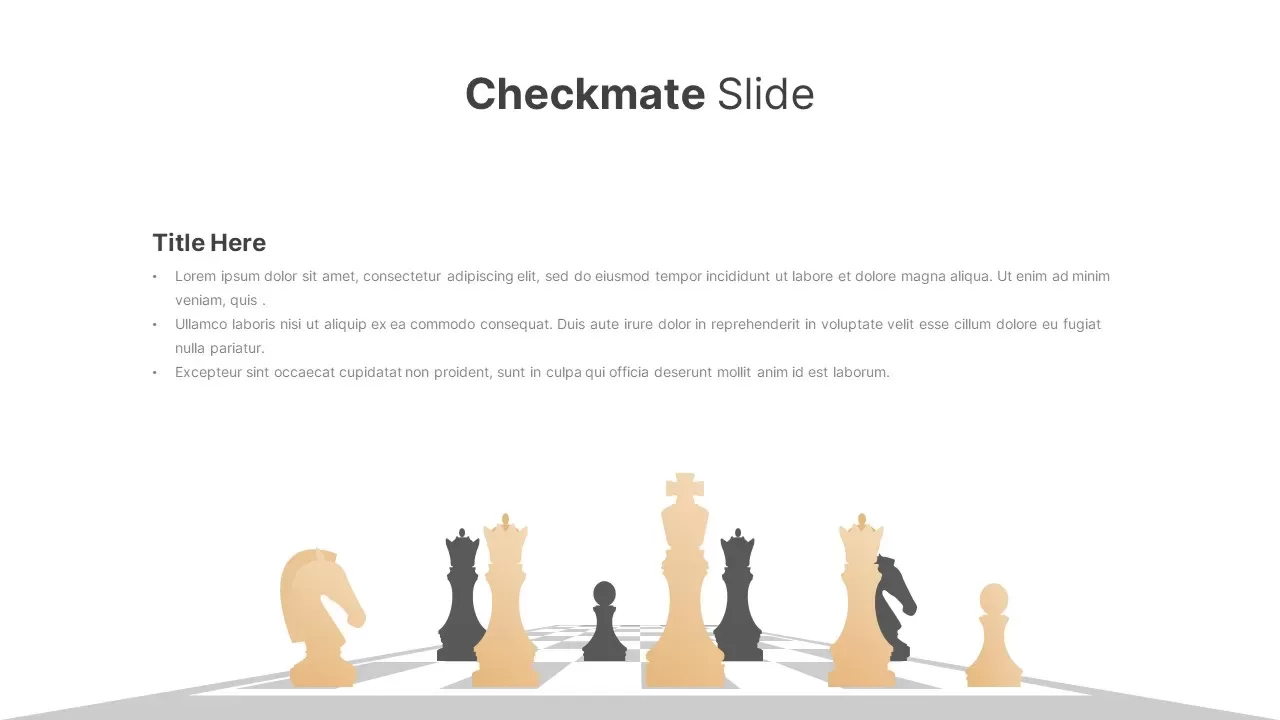
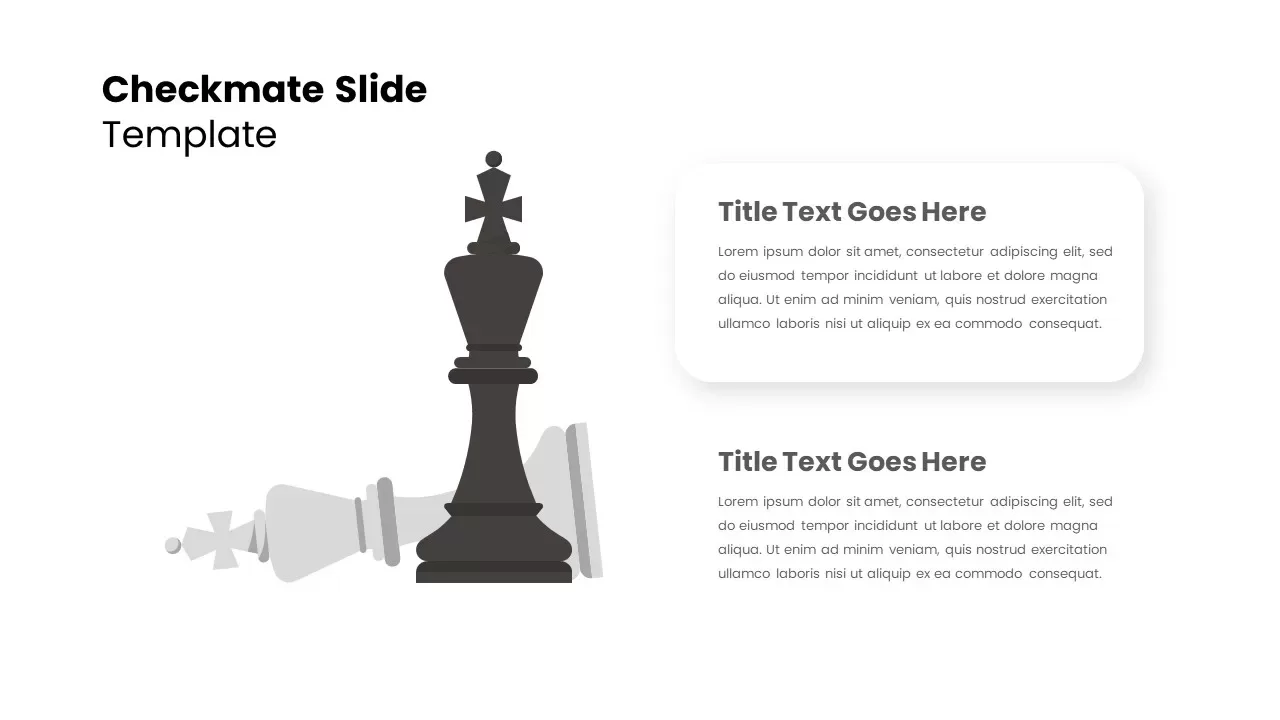
Strategic Checkmate Slide for Planning Template for PowerPoint & Google Slides
Business Report
Checkmate Slide for Strategic Insights Template for PowerPoint & Google Slides
Accomplishment
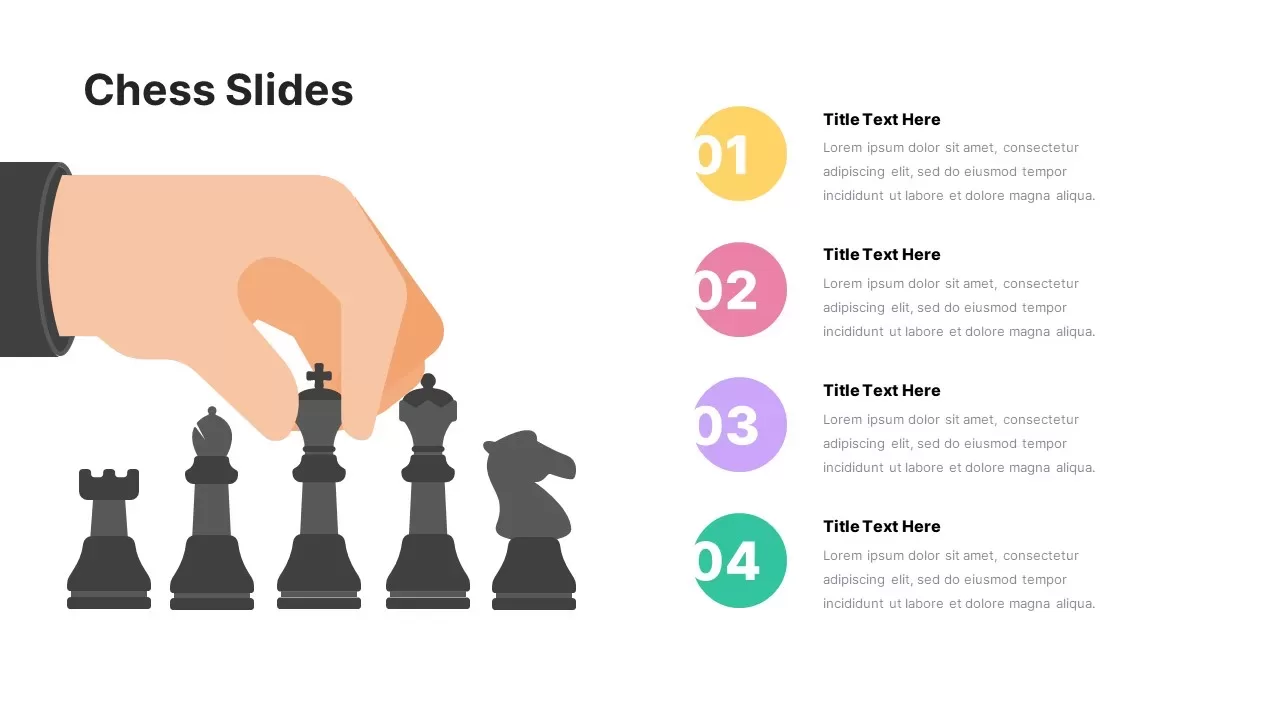
Strategic Chess Four Step Slide Template for PowerPoint & Google Slides
Process
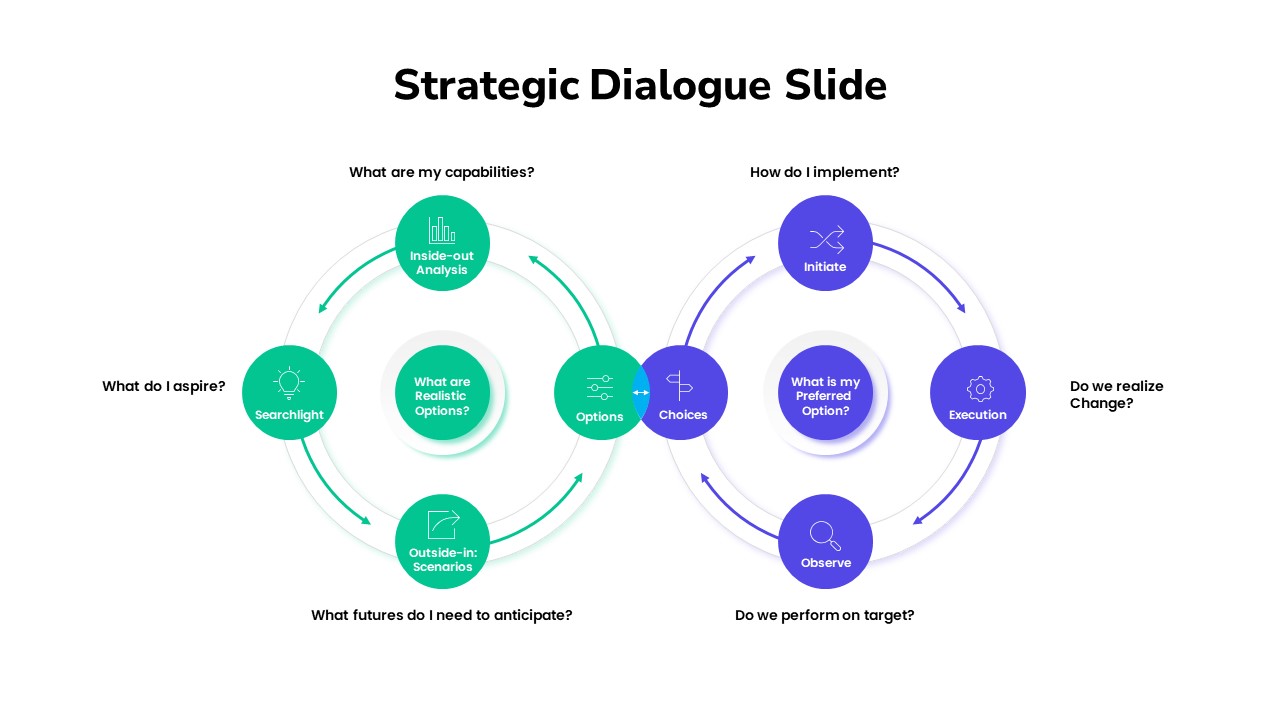
Strategic Dialogue Model Cycle Template for PowerPoint & Google Slides
Circular
Iterative Strategic Planning Cycle Template for PowerPoint & Google Slides
Business Strategy
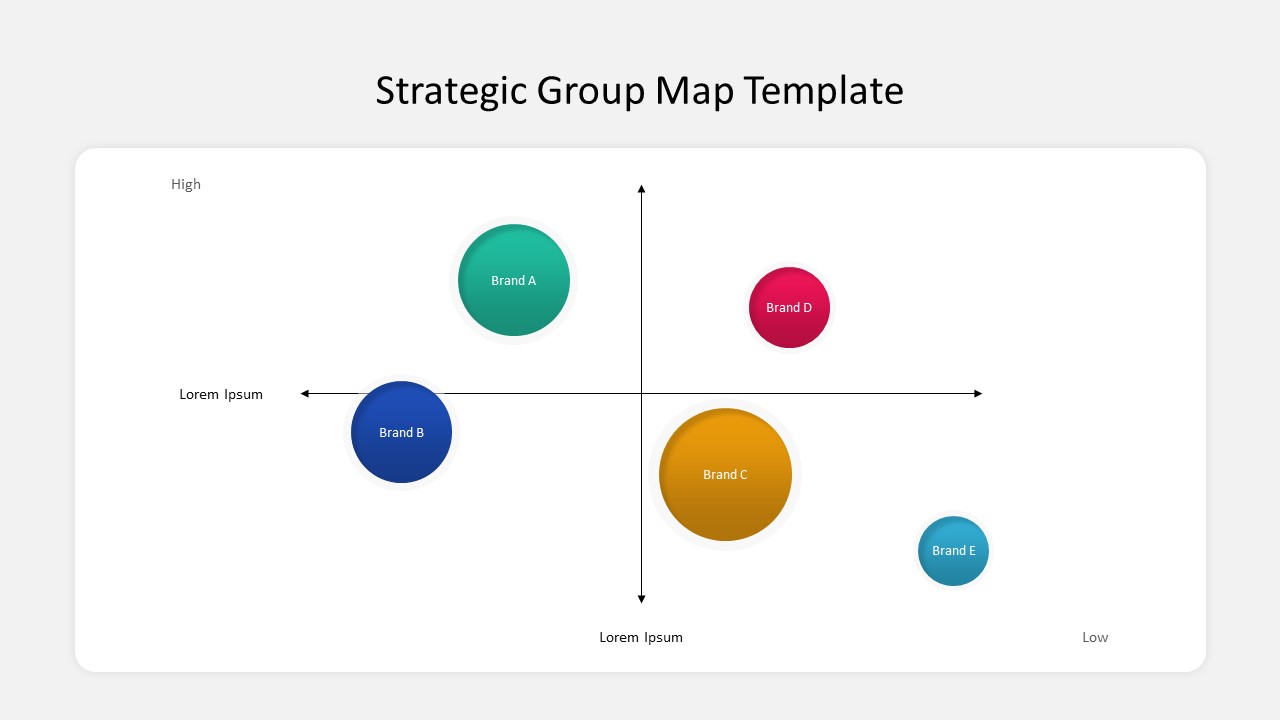
Business Strategic Group Map Analysis Template for PowerPoint & Google Slides
Competitor Analysis
Free
Six-Month Strategic SEO Roadmap Template for PowerPoint & Google Slides
Roadmap
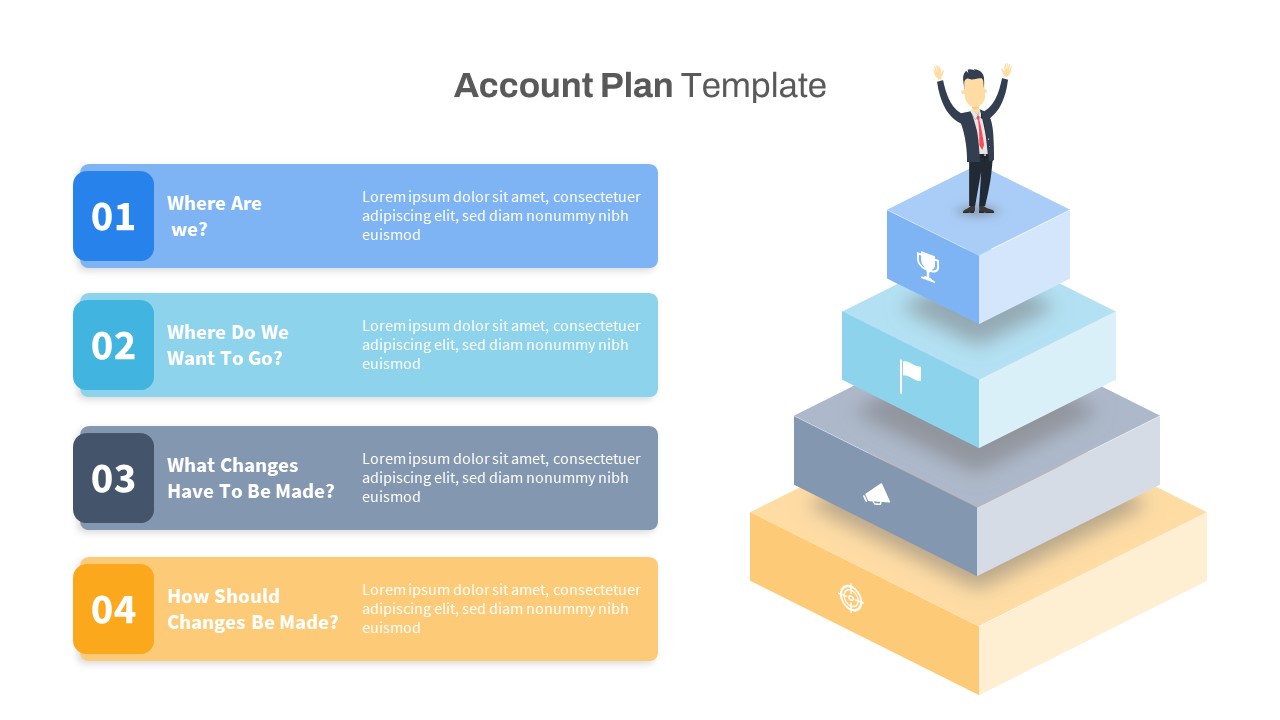
Strategic Account Plan Process Template for PowerPoint & Google Slides
Business Plan
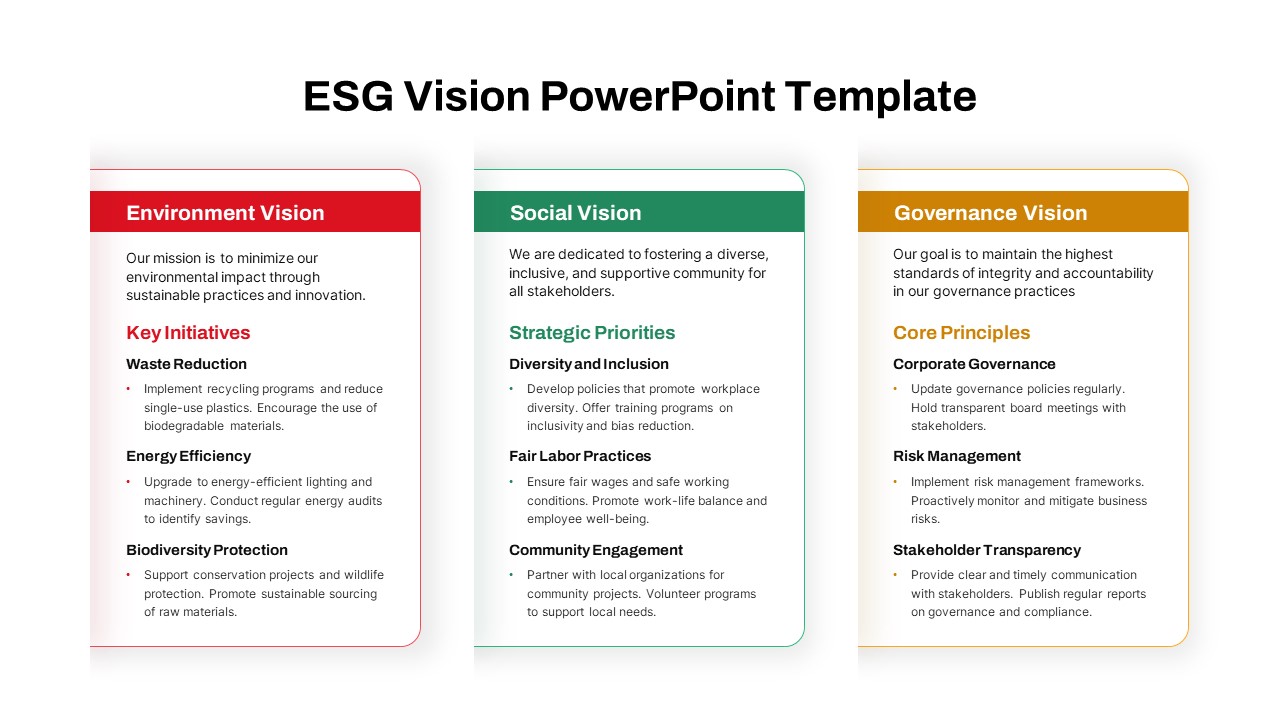
ESG Vision & Strategic Priorities Template for PowerPoint & Google Slides
Business Strategy
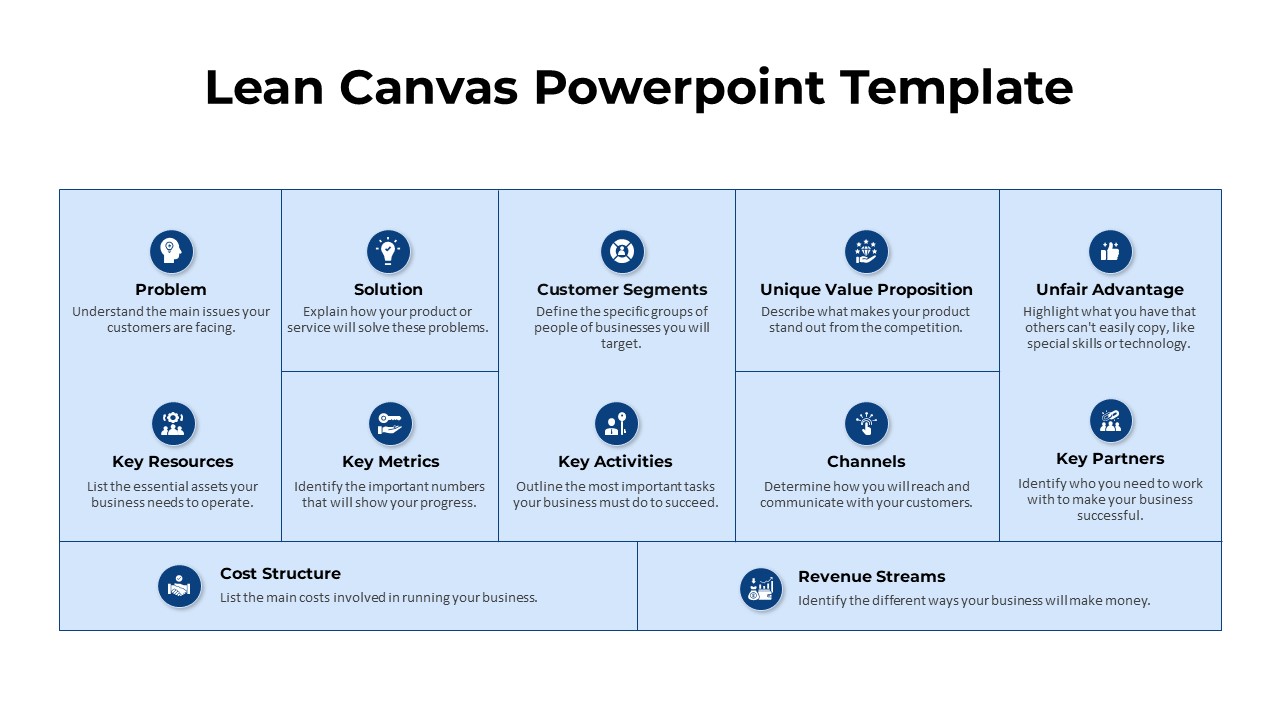
Strategic Lean Canvas Business Model Template for PowerPoint & Google Slides
Business Models
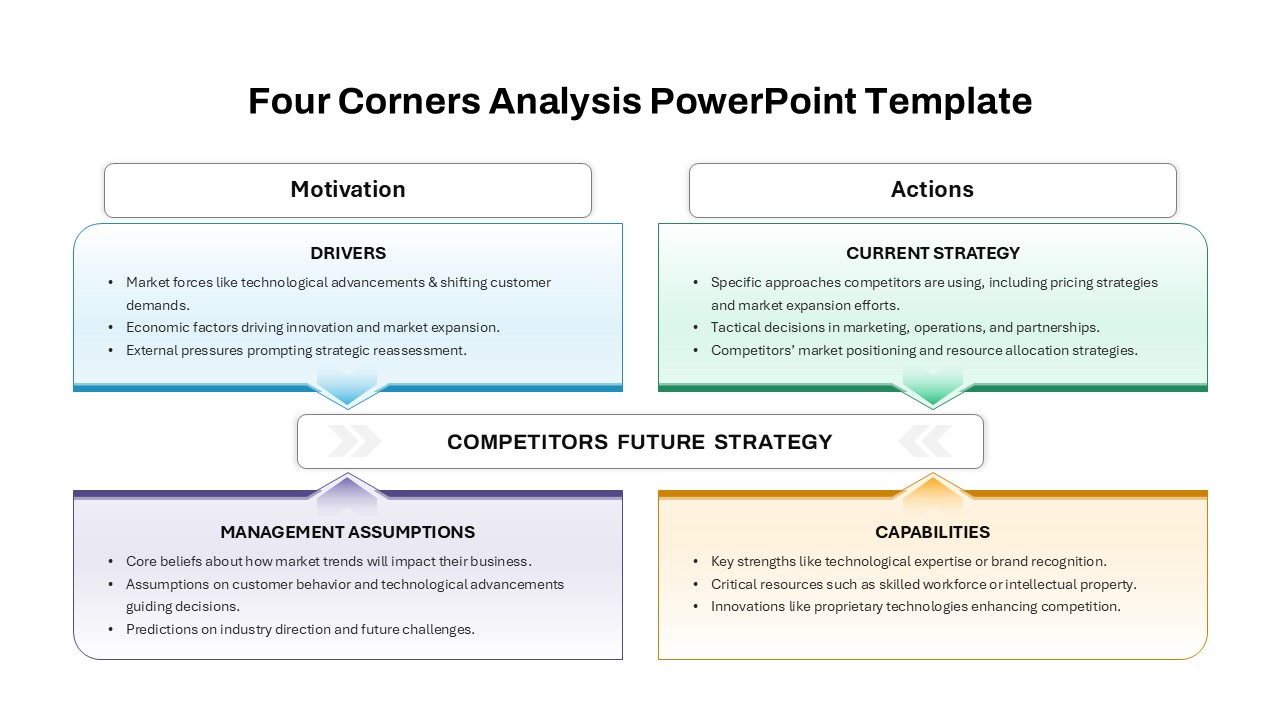
Four-Corners Strategic Analysis Quadrant Template for PowerPoint & Google Slides
SWOT
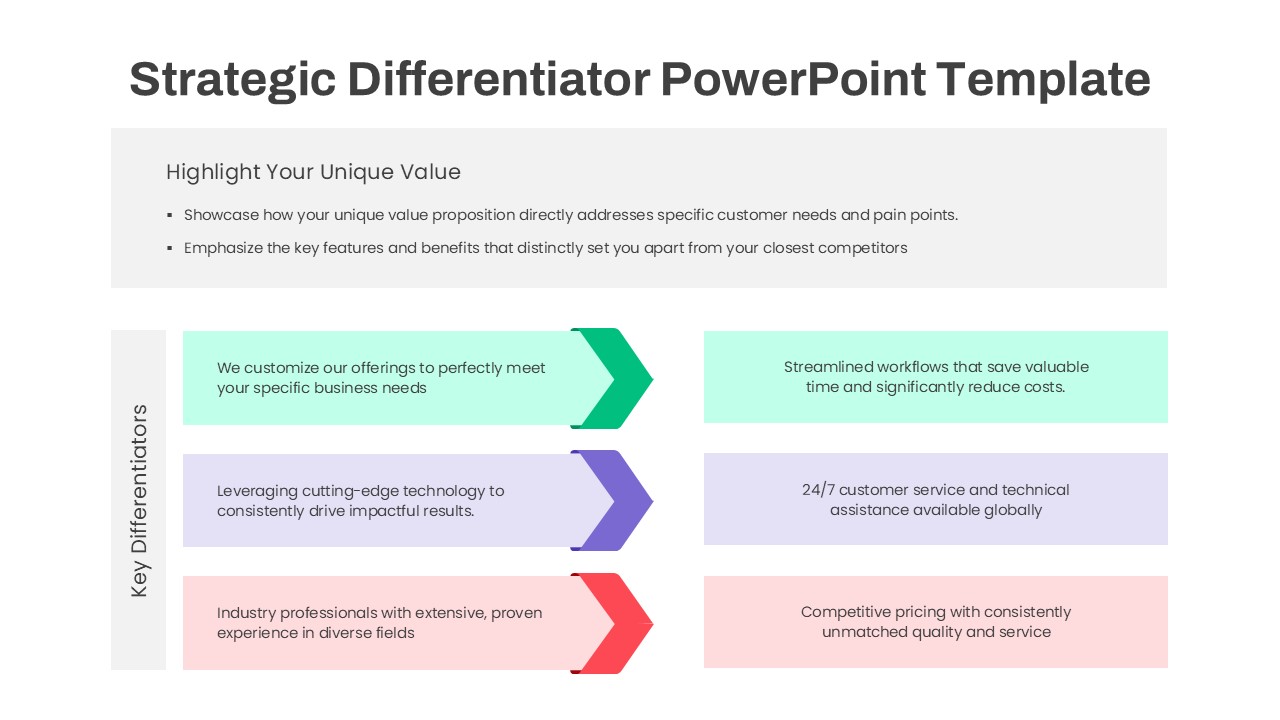
Three-Step Strategic Differentiator Template for PowerPoint & Google Slides
Competitor Analysis
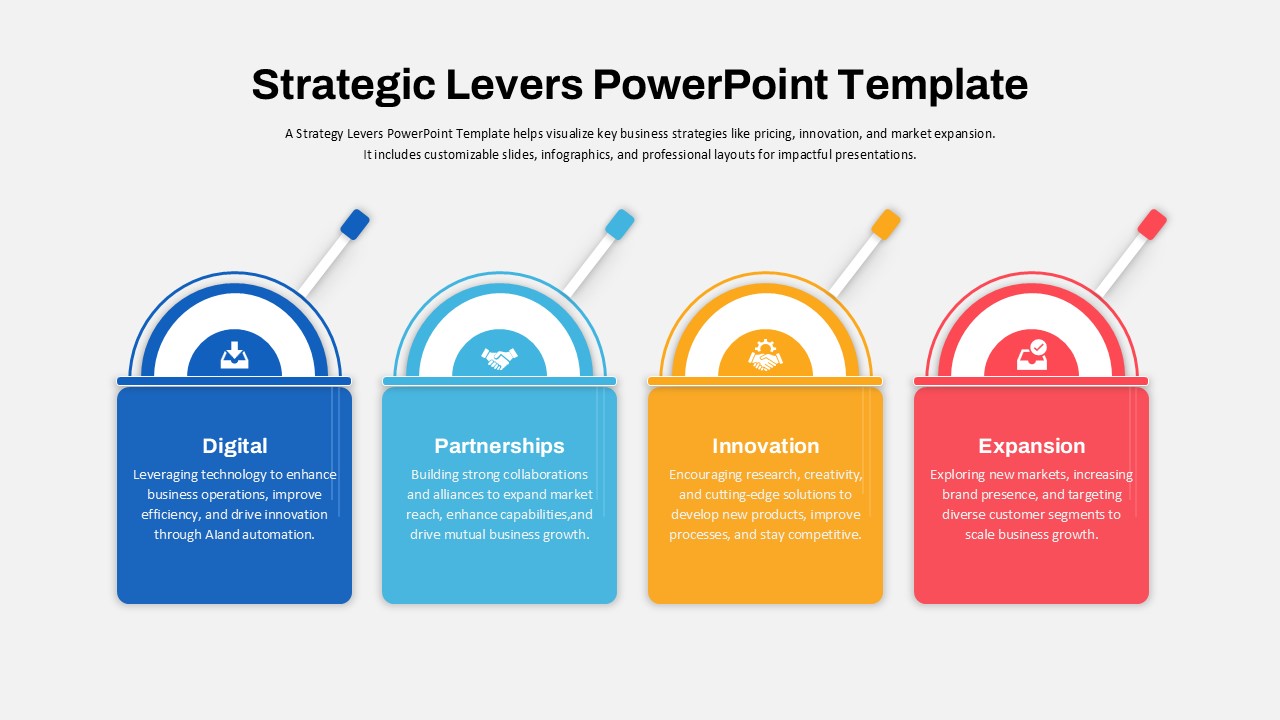
Strategic Levers Business Framework Template for PowerPoint & Google Slides
Business Strategy
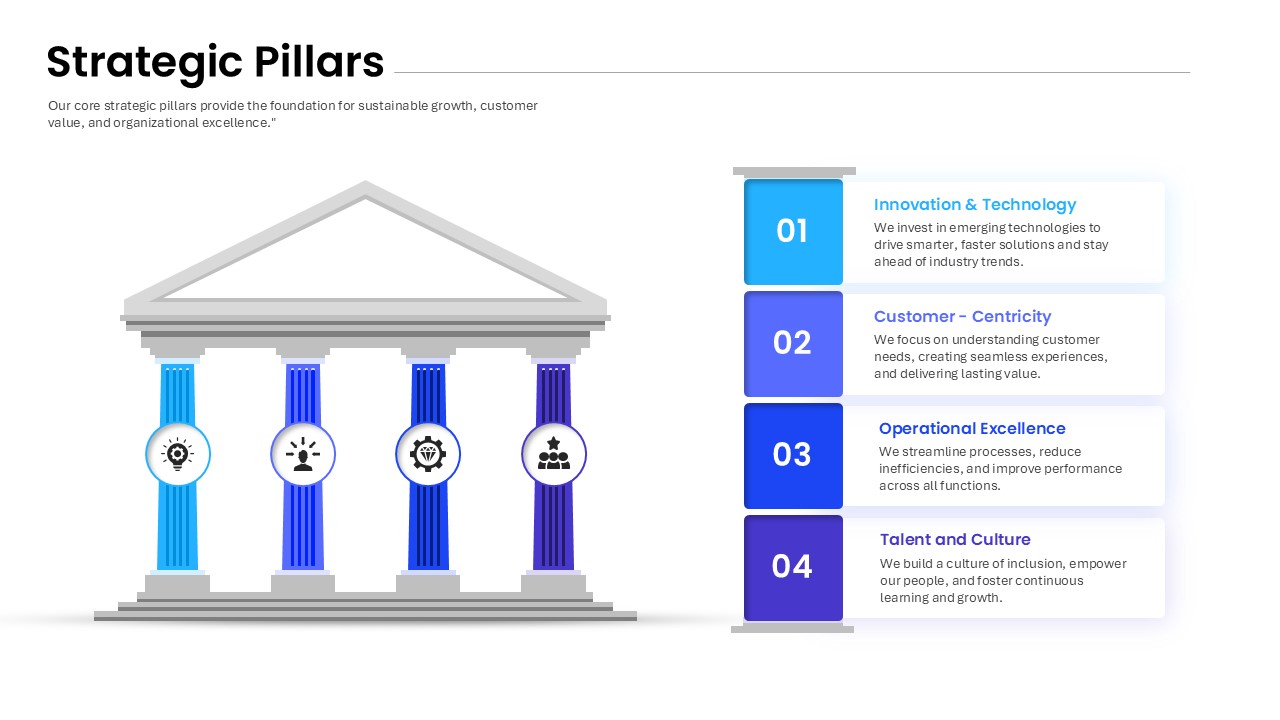
Strategic Pillars Foundation Framework Template for PowerPoint & Google Slides
Business Strategy
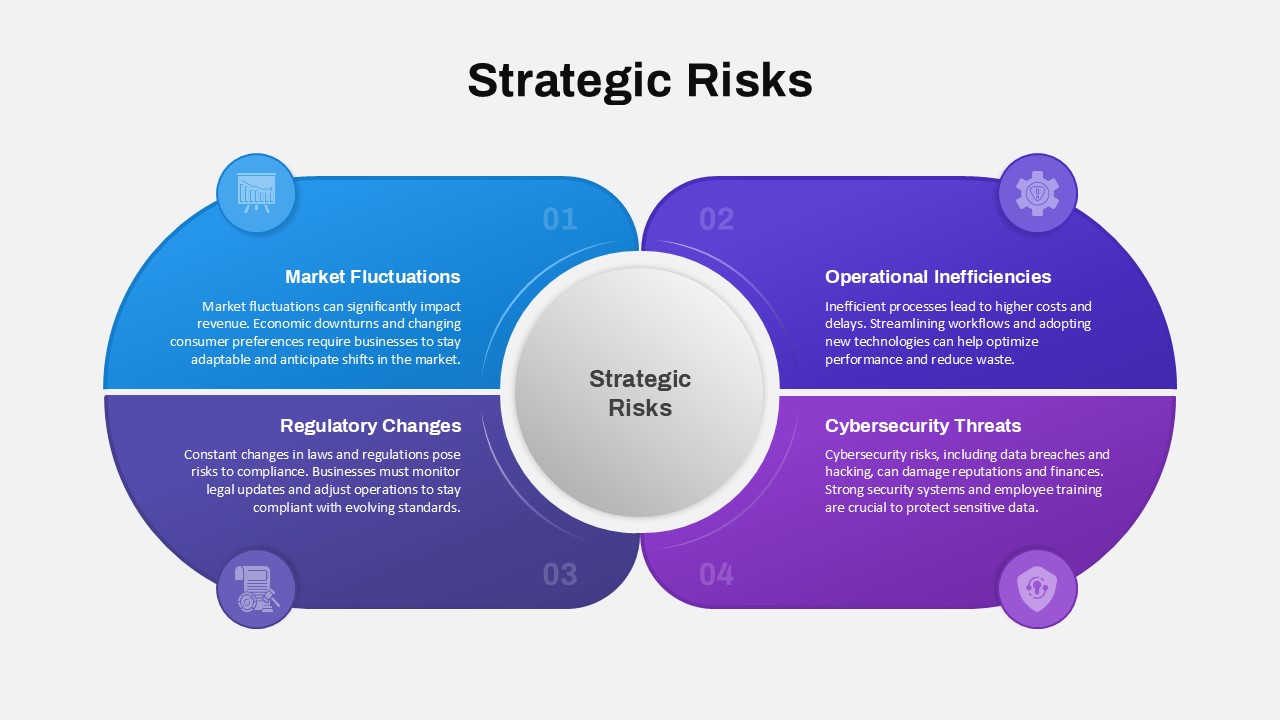
Strategic Risks Overview template for PowerPoint & Google Slides
Risk Management
Strategic Planning Consulting Template for PowerPoint & Google Slides
Business Strategy
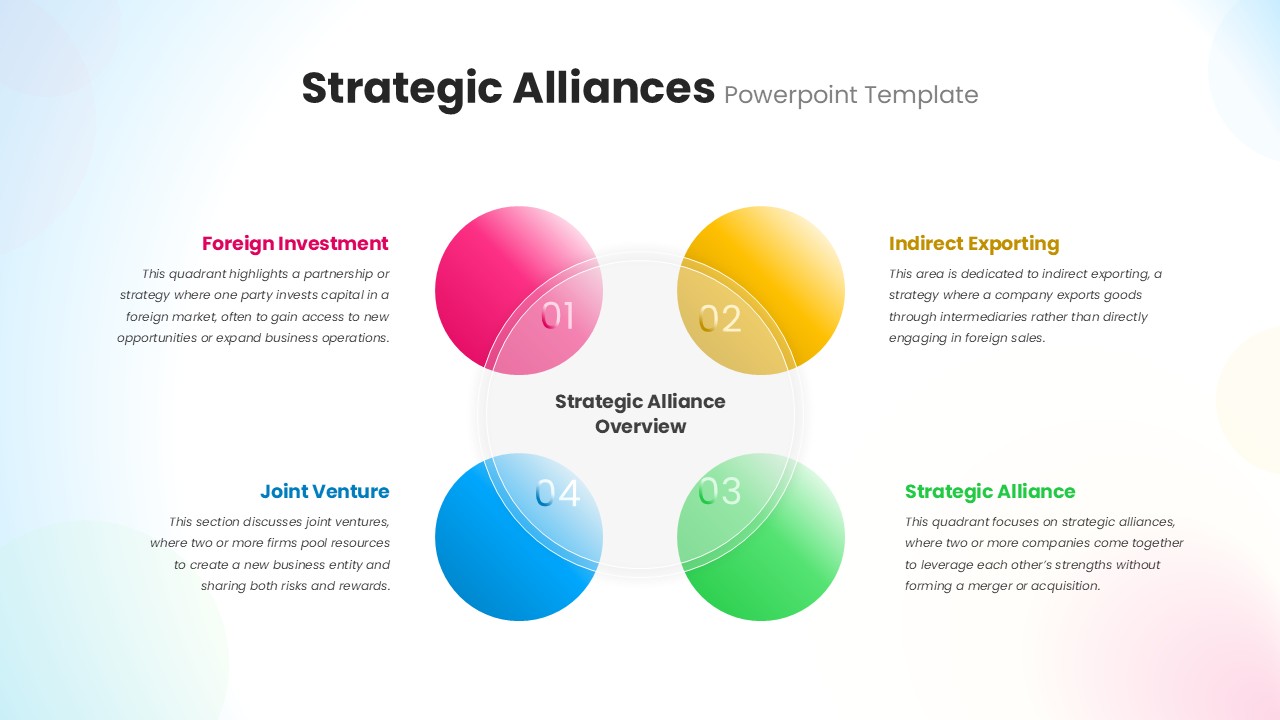
Strategic Alliances Template for PowerPoint & Google Slides
Business Strategy
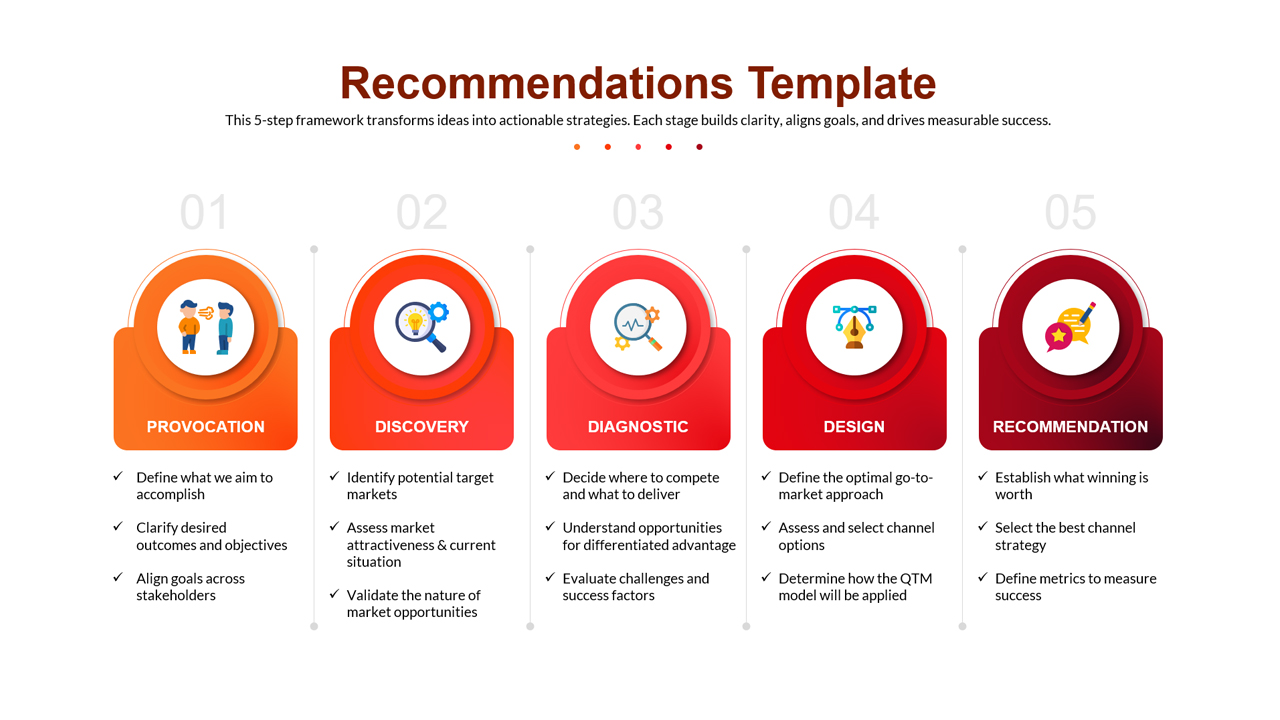
5-Step Strategic Recommendations Template for PowerPoint & Google Slides
Process
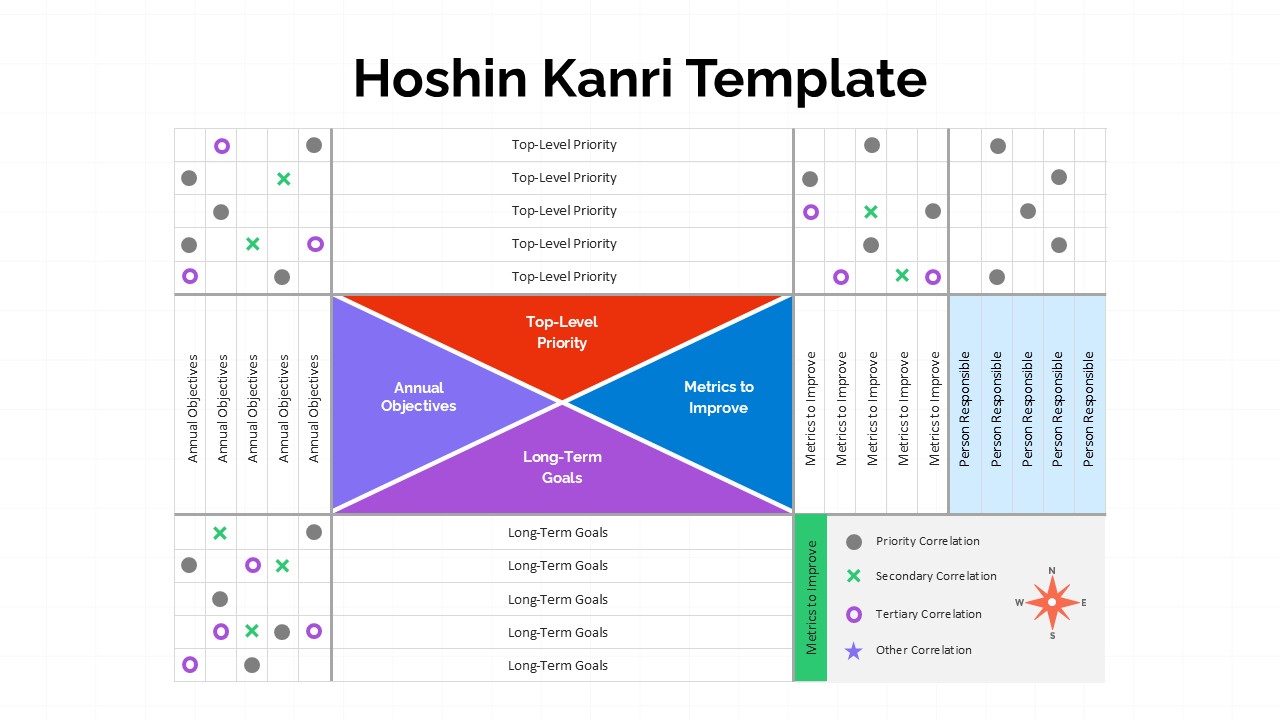
Hoshin Kanri Strategic Planning Matrix Template for PowerPoint & Google Slides
Business Strategy