Stairs & Steps Process Diagram template for PowerPoint & Google Slides
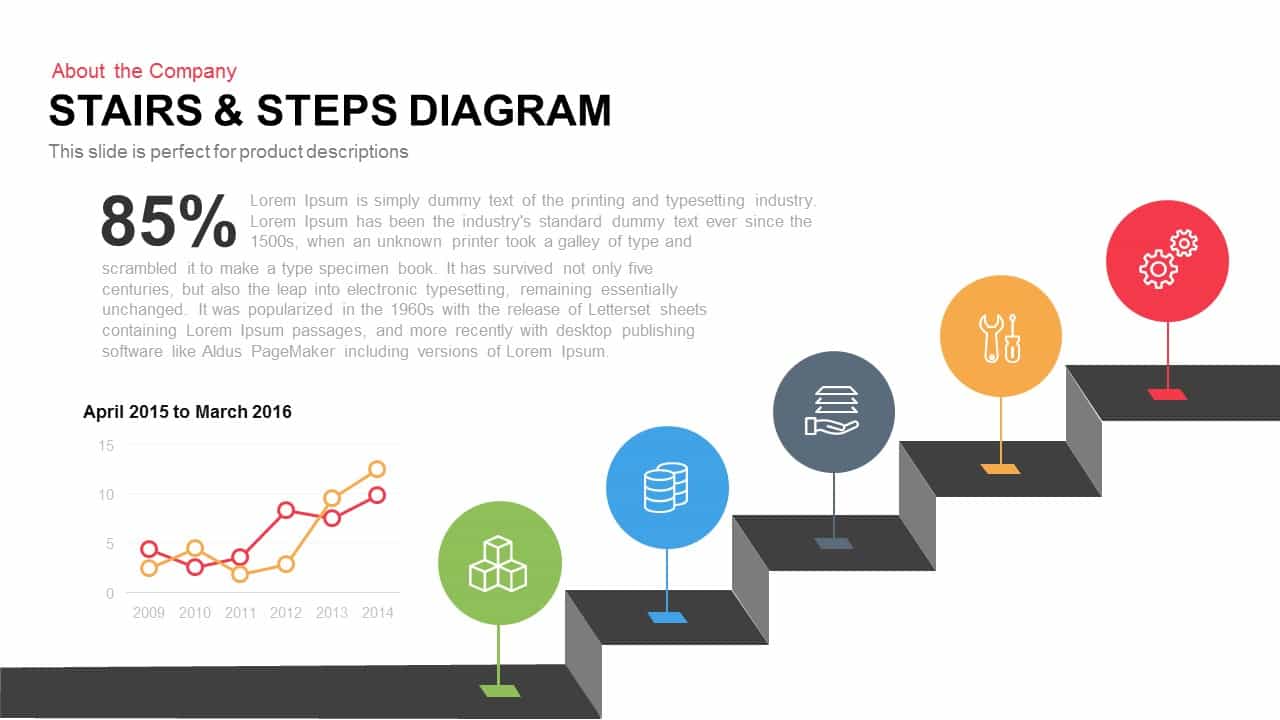
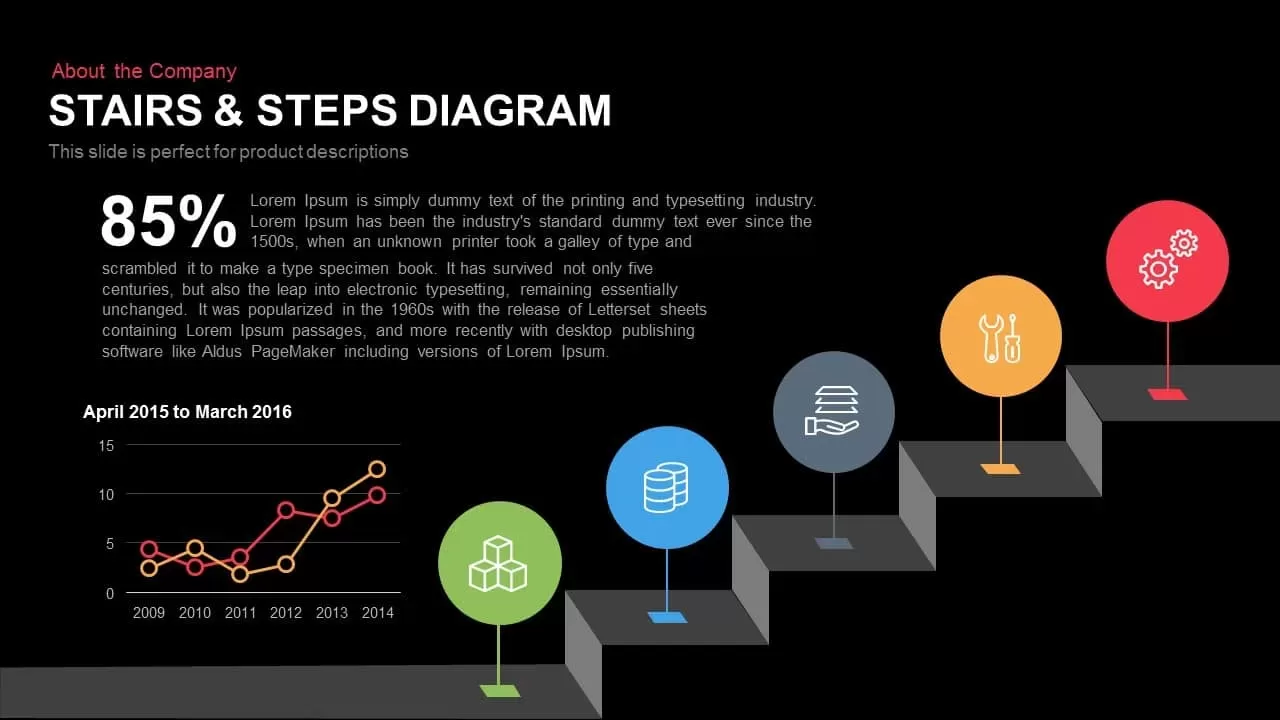

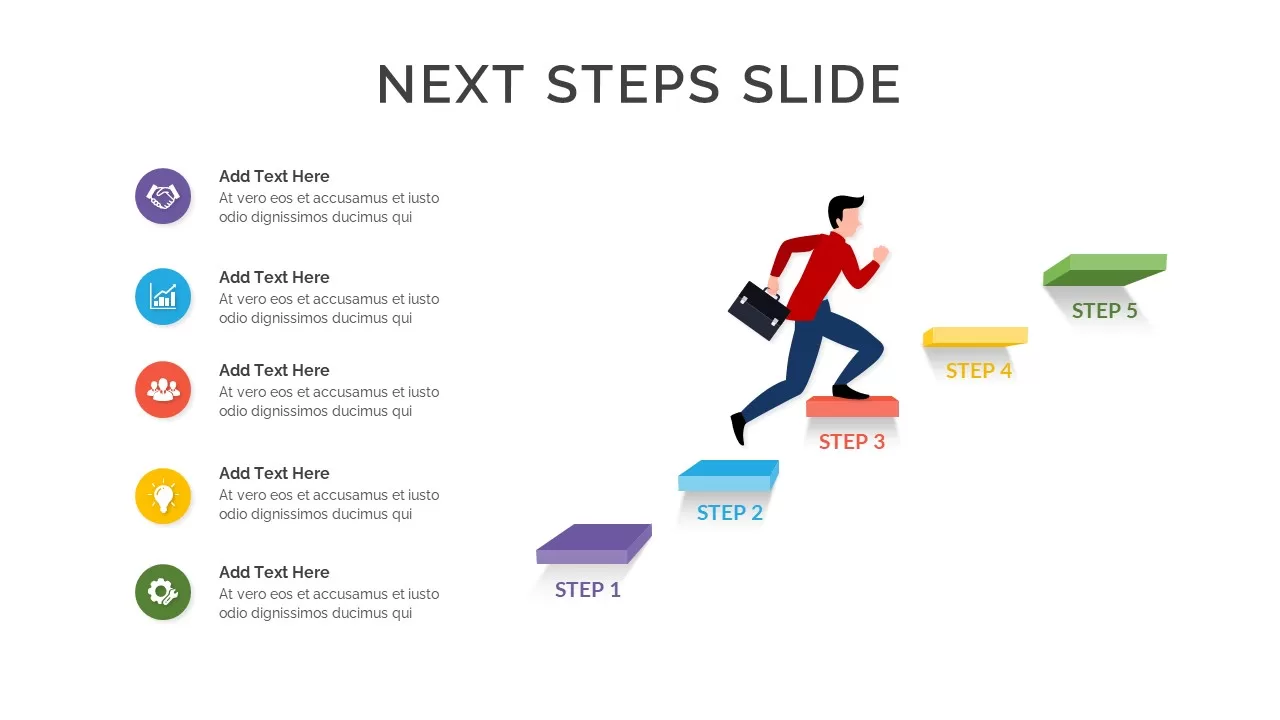
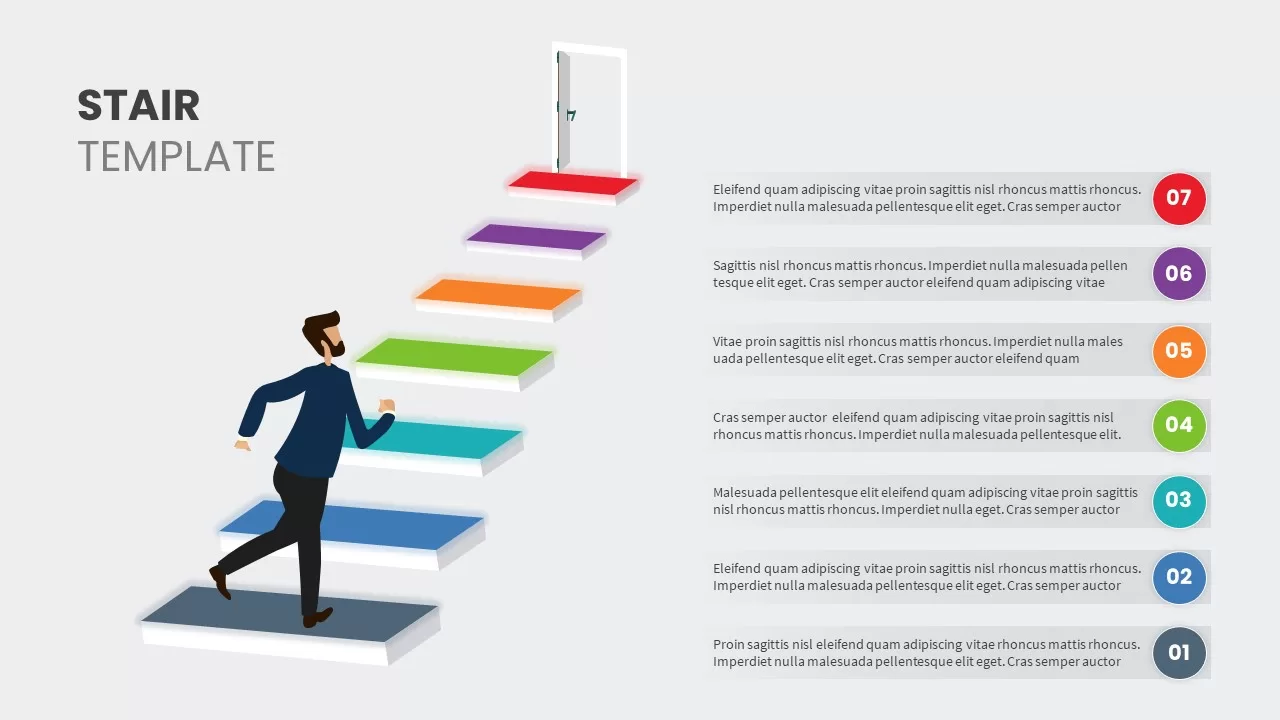
Leverage this striking stairs & steps diagram to present sequential phases with clarity and visual depth. The slide employs a five-tier 3D staircase in dark gray, topped by vibrant circular icons in green, blue, gray, orange, and red. Each step connects via slender lines to customizable callouts, enabling precise annotation of milestones, tasks, or KPIs alongside percentage highlights. A bold 85% statistic anchors the left side, complemented by a supporting text block and an embedded line chart to illustrate trend analysis from April 2015 to March 2016.
Designed for effortless customization, this template includes editable vector shapes, preconfigured master slides, and color themes that preserve consistent alignment and shadow effects. Swap icons, adjust text placeholders, or recolor each step to align with your brand identity in seconds. The modern flat design ensures readability on both light and dark backgrounds, while built-in slide layouts maintain pixel-perfect fidelity across PowerPoint and Google Slides. Leverage intuitive controls to resize platforms, reposition callouts, and update metrics without manual tweaking or reformatting.
Whether you’re outlining phased project plans, mapping operational workflows, or showcasing product launch timelines, this stairs and steps diagram delivers structured storytelling that keeps audiences engaged. Use it to highlight five key stages in strategy presentations, KPI reporting, customer journey mapping, or resource allocation analyses. Consultants and analysts can adapt circle icons to represent functional areas or performance metrics, while educators and trainers can leverage the step-based layout for lesson modules or workshop agendas. Duplicate and recolor diagrams to create comparative views, process roadmaps, or hierarchical breakdowns across departments and industries.
Who is it for
Easily communicate phased strategies and performance metrics with this slides template. Project managers, business analysts, and marketing teams will value its sequential layout for milestone tracking and KPI reporting. Consultants, startup founders, and instructional designers can leverage the design to present process flows, customer journeys, and workshop modules in an engaging, step-by-step format.
Other Uses
Beyond corporate briefings, this diagram excels in training sessions, onboarding presentations, and strategic reviews. Repurpose the staircase to depict product roadmaps, service tier breakdowns, organizational hierarchies, or financial forecasting stages. Adapt icons and colors to represent risk assessments, resource allocation, or change management processes. Duplicate slides to compare departments, timeline scenarios, or phased rollouts, making it a versatile asset across business, education, and consulting contexts.
Login to download this file

Item ID
SB00196
Related Templates

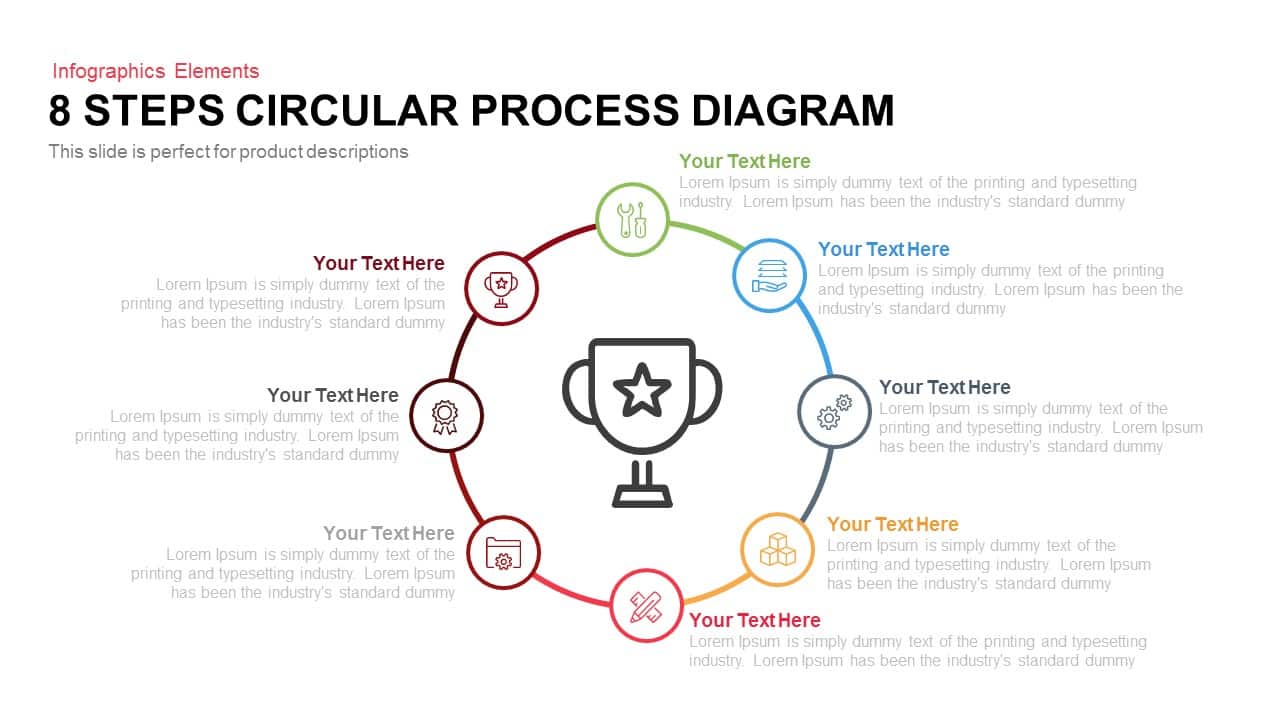
8 Steps Circular Process Diagram Template for PowerPoint & Google Slides
Process

8 Steps Arrow Process Diagram template for PowerPoint & Google Slides
Process
8 Steps Circular Process Diagram Template for PowerPoint & Google Slides
Circular
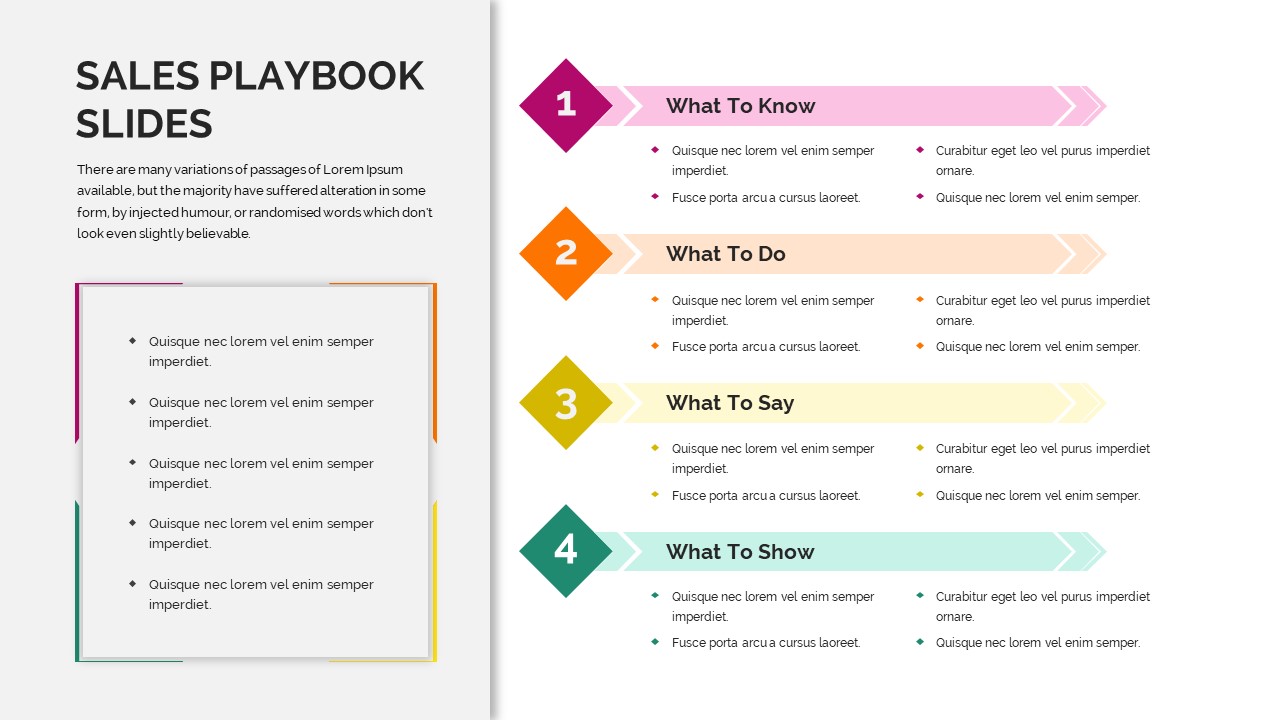
Sales Playbook Process Steps Diagram Template for PowerPoint & Google Slides
Marketing
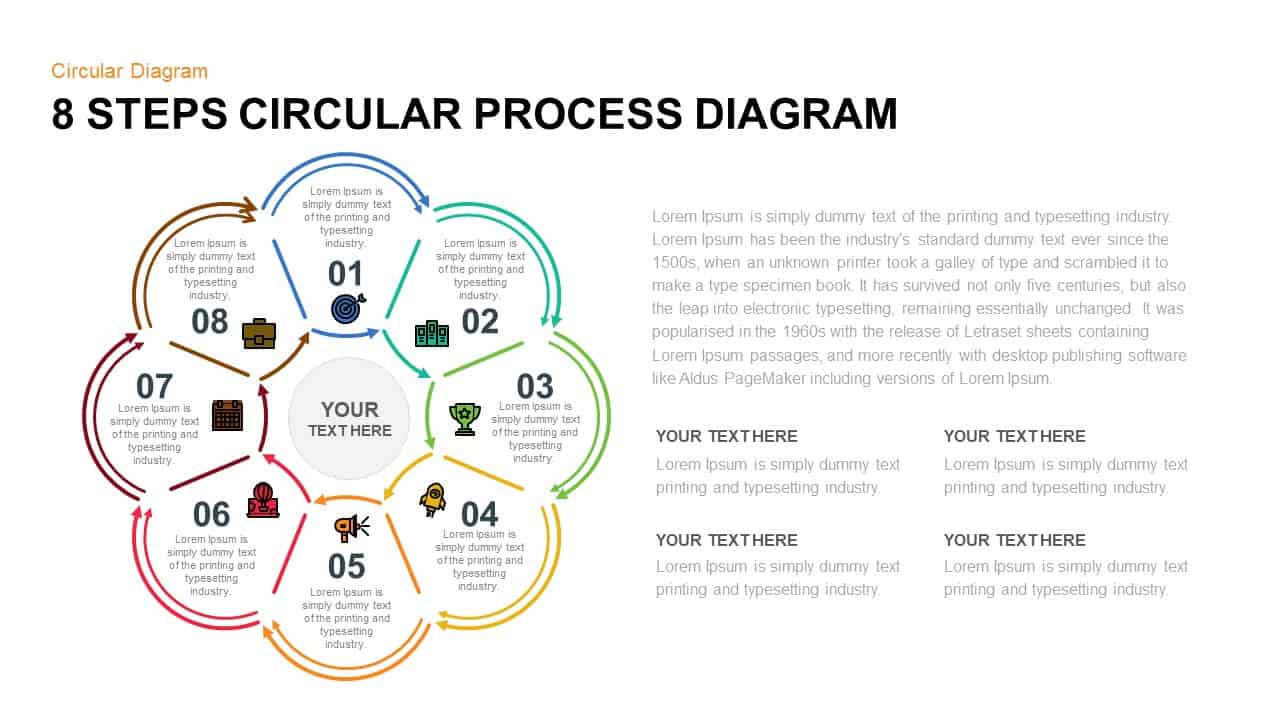
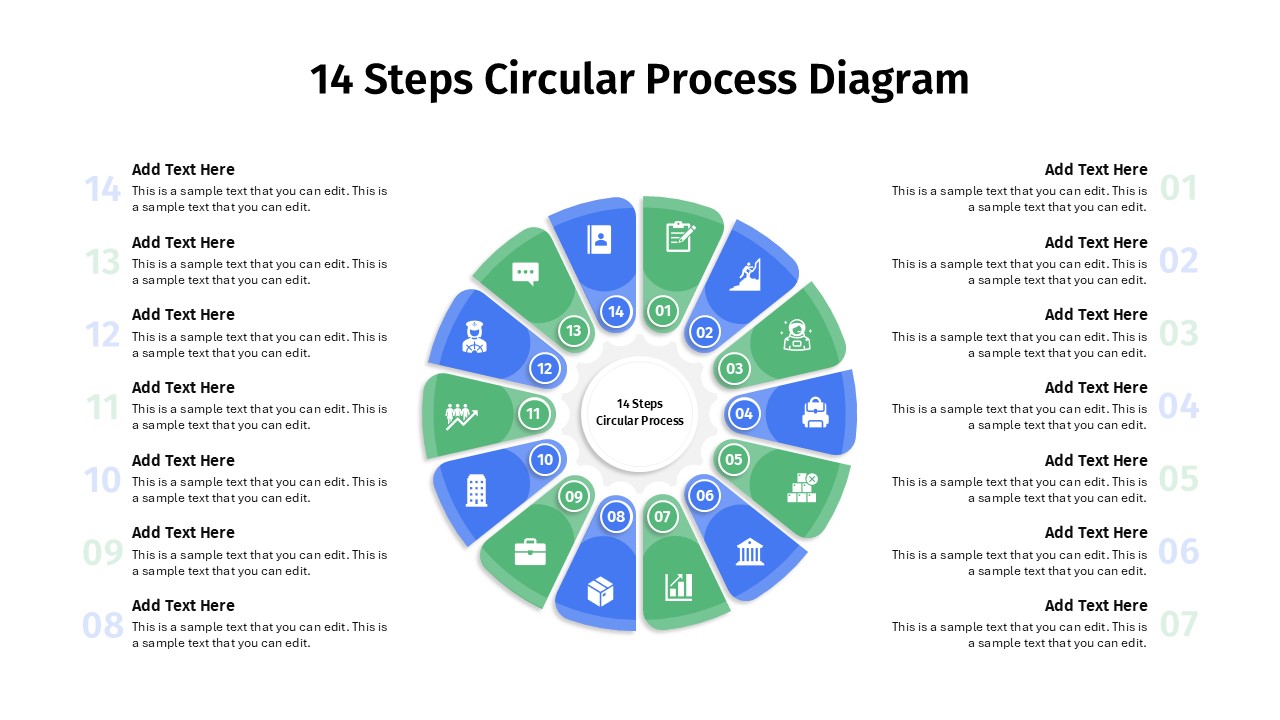
14 Steps Circular Process Diagram Template for PowerPoint & Google Slides
Circular
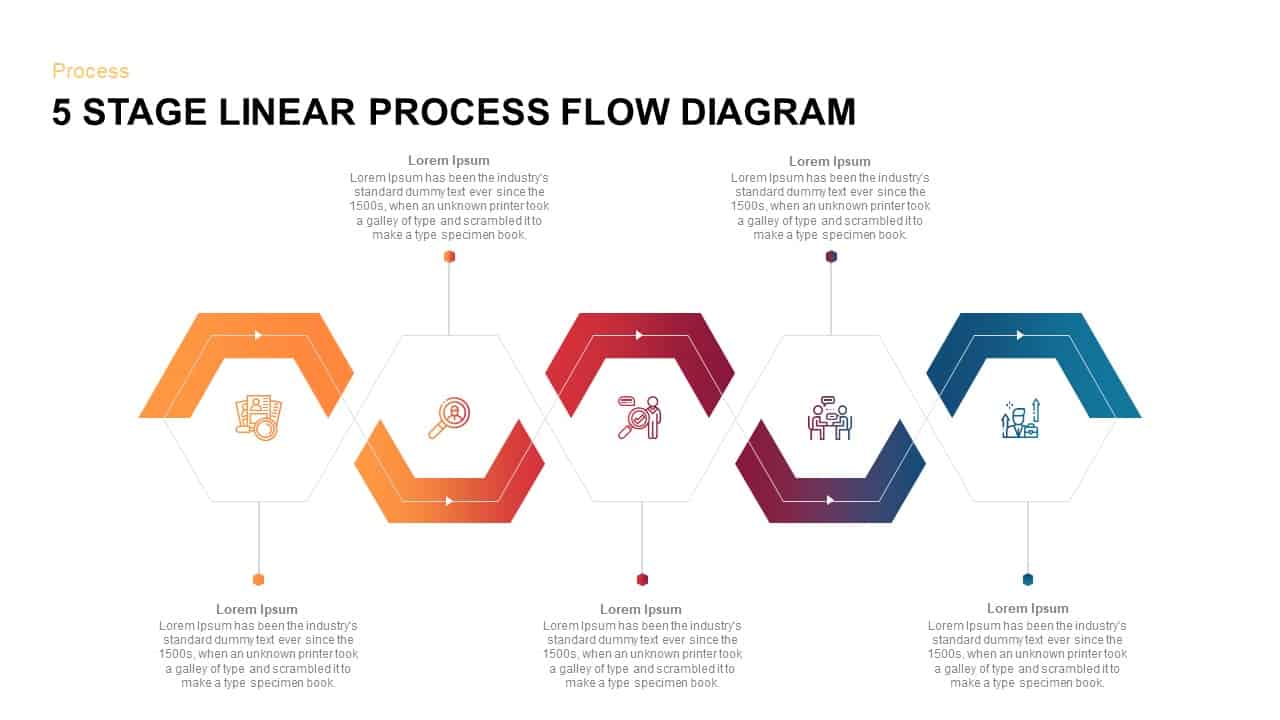
5 Steps Linear Process Flow Diagram template
Process
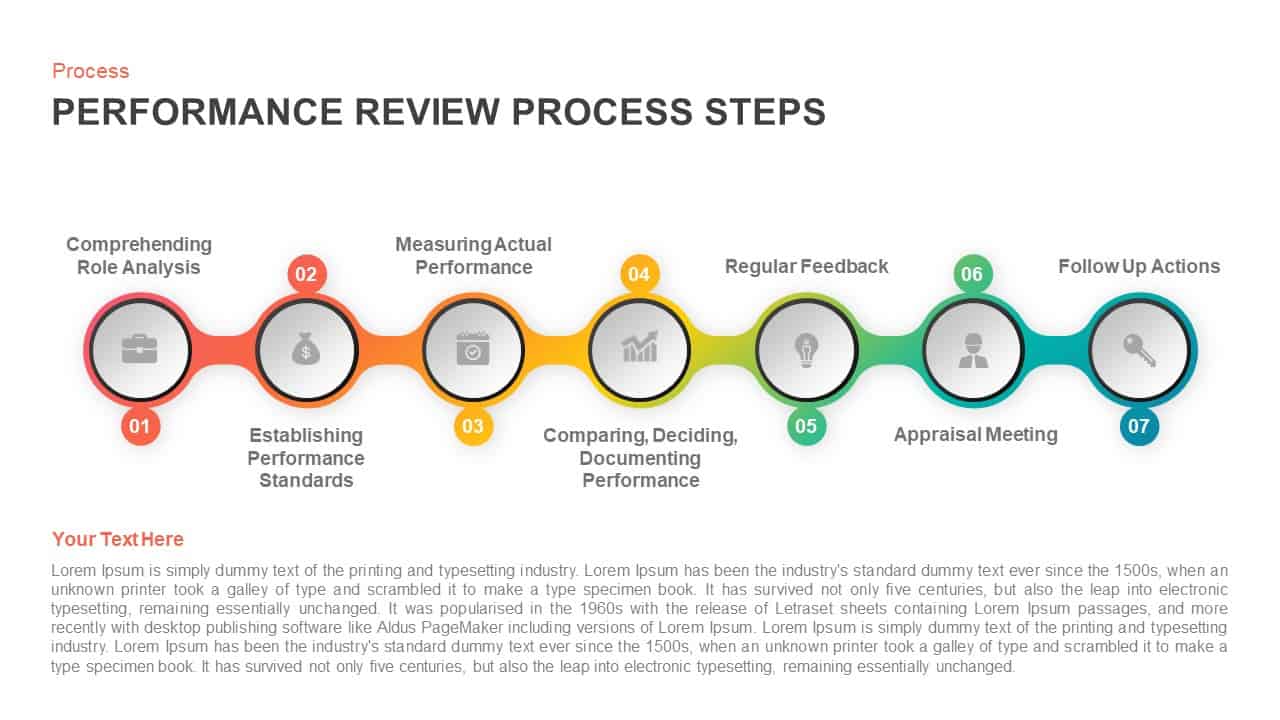
Performance Review Process Steps Template for PowerPoint & Google Slides
Employee Performance
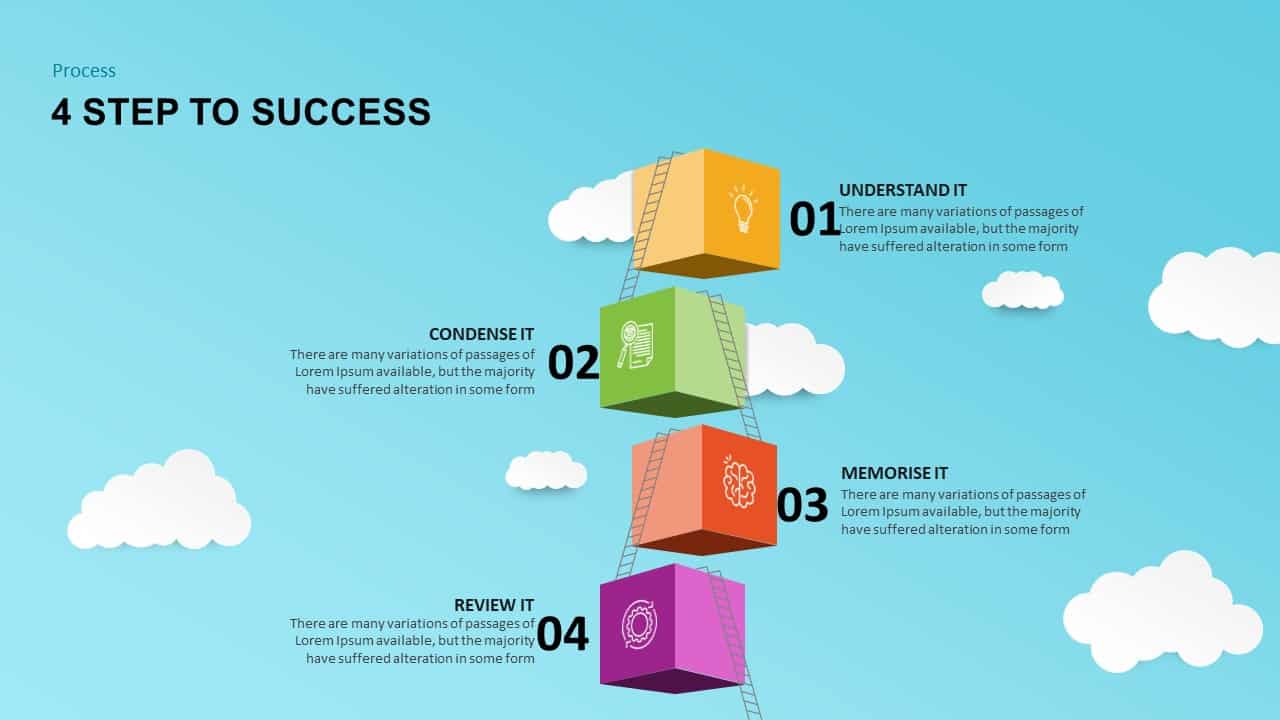
4 Steps to Success Process template for PowerPoint & Google Slides
Process
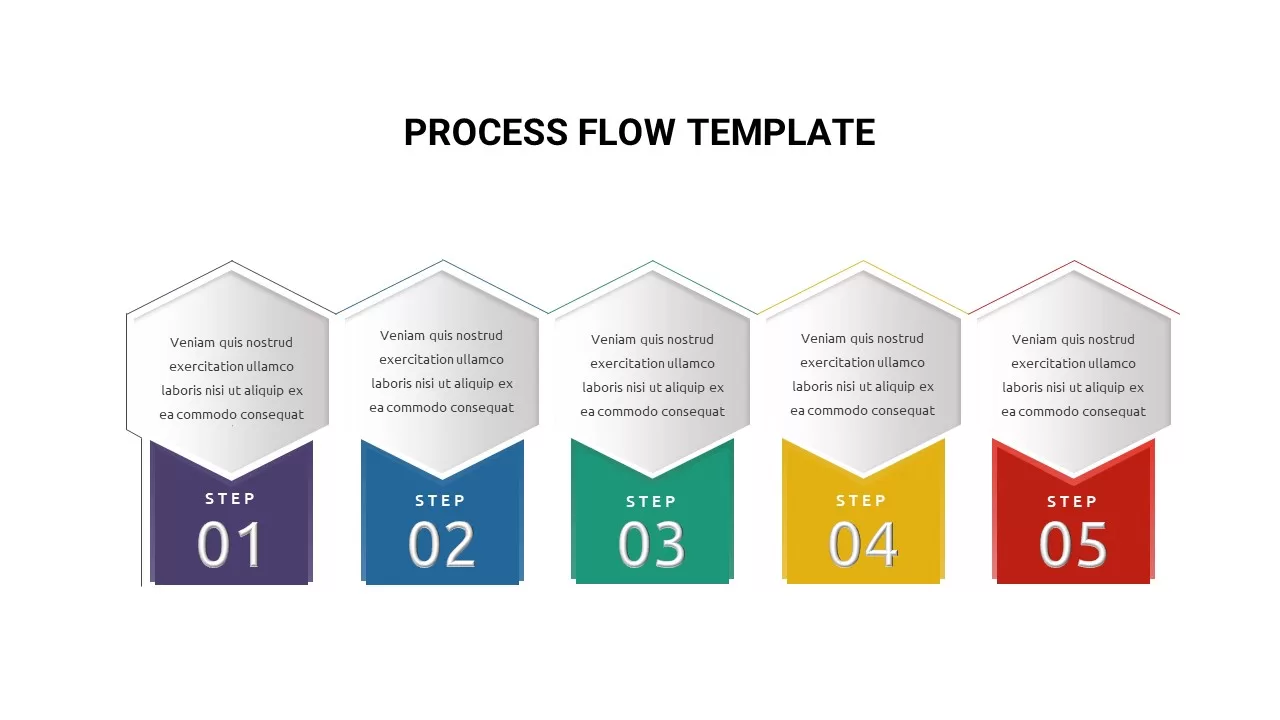
Process Flow Steps template for PowerPoint & Google Slides
Business Plan
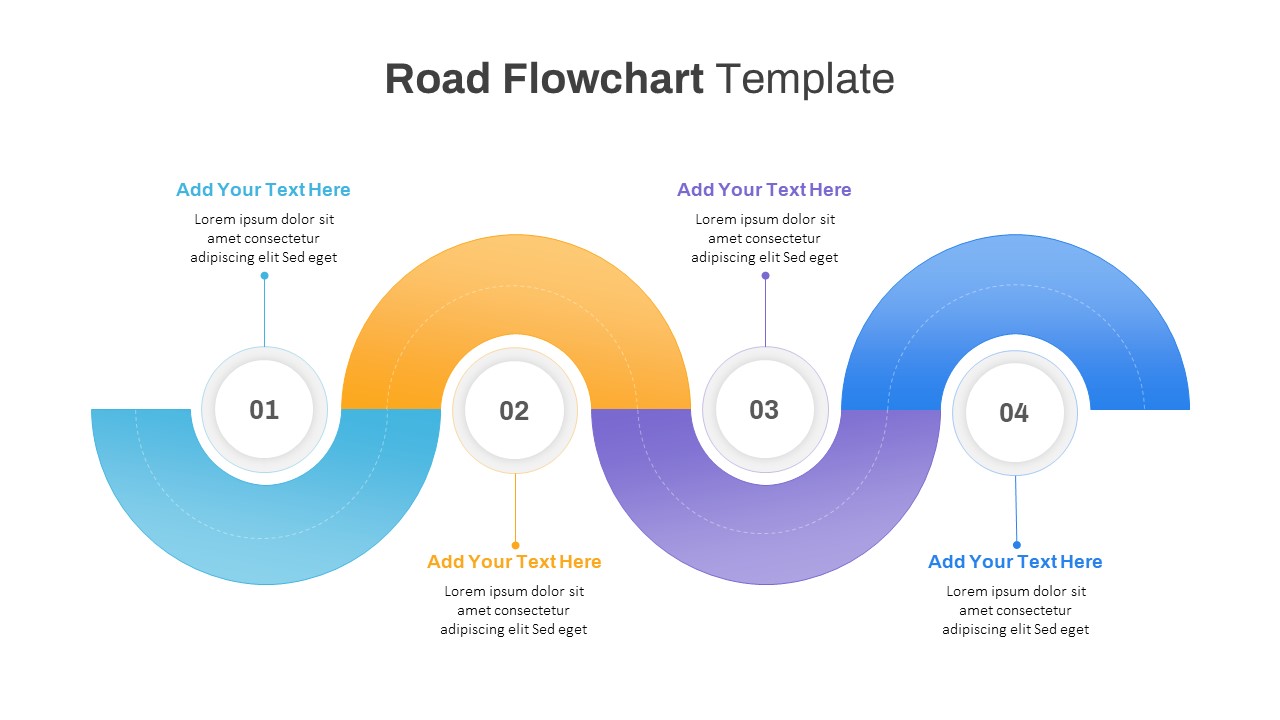
Road Flowchart Process with Four Steps Template for PowerPoint & Google Slides
Flow Charts
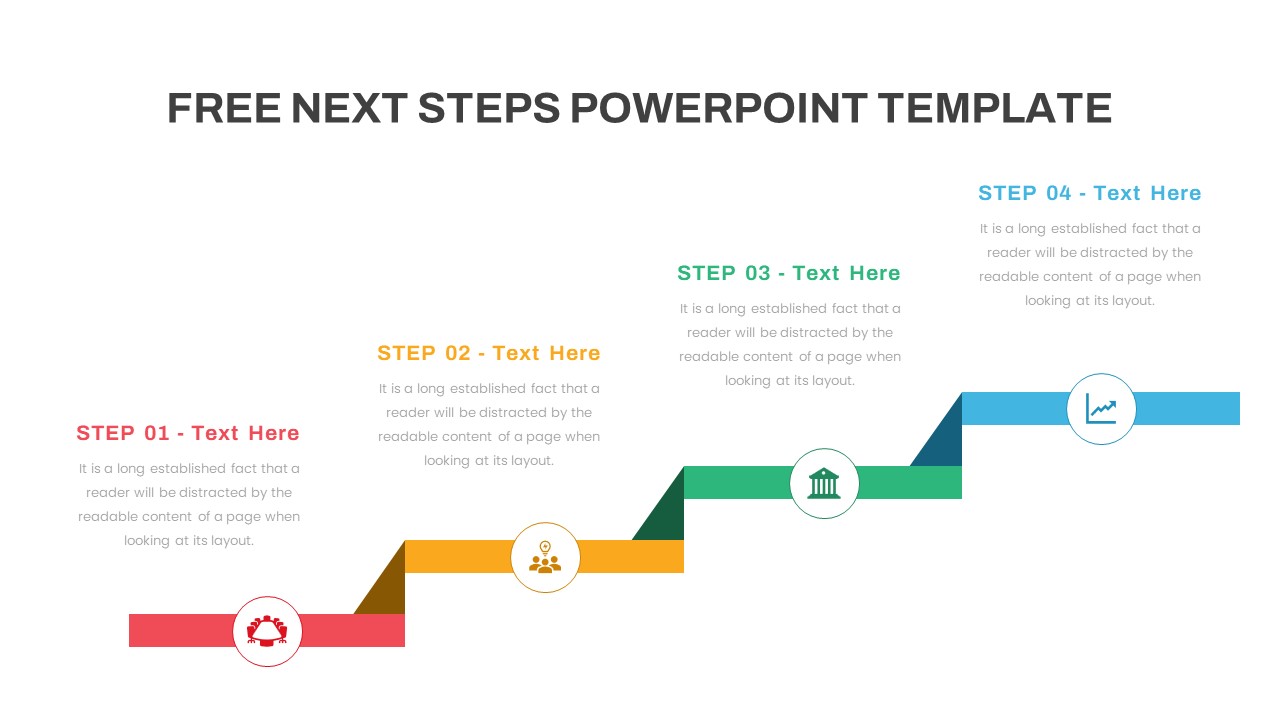
Free Next Steps Process Timeline Template for PowerPoint & Google Slides
Project
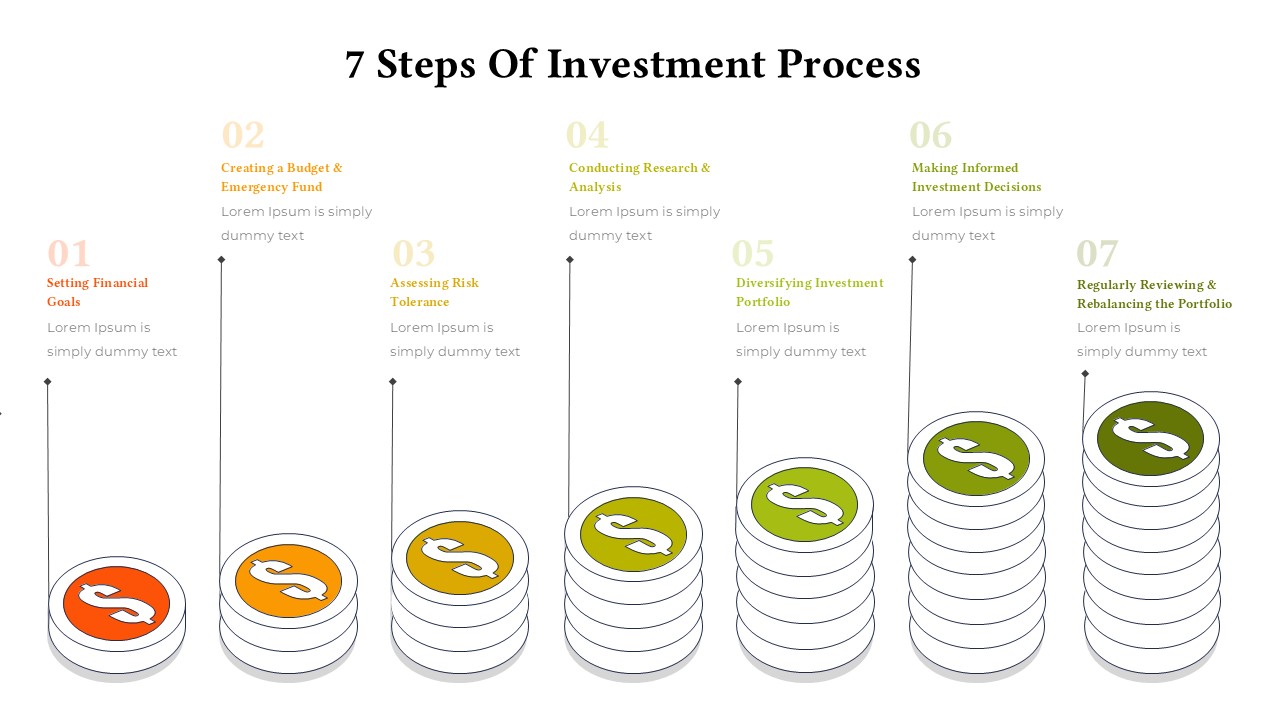
7 Steps of Investment Process Template for PowerPoint & Google Slides
Finance
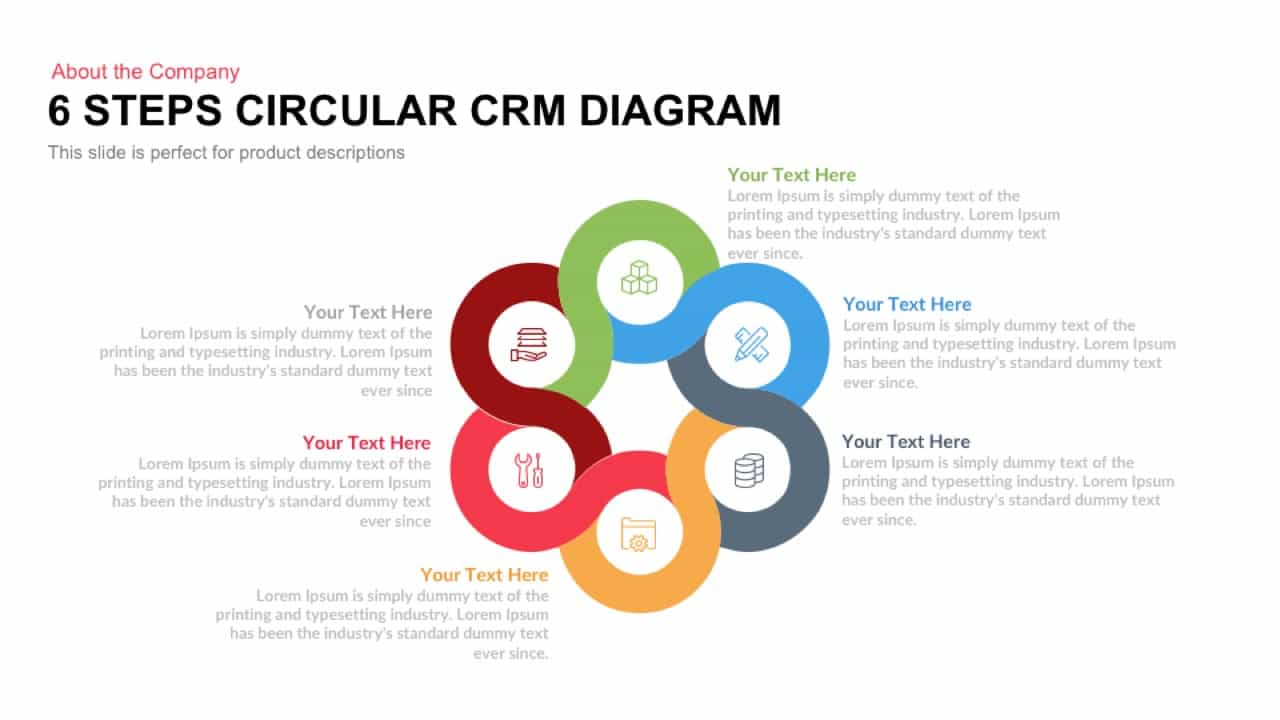
Six Steps Circular CRM Diagram Template for PowerPoint & Google Slides
Customer Journey
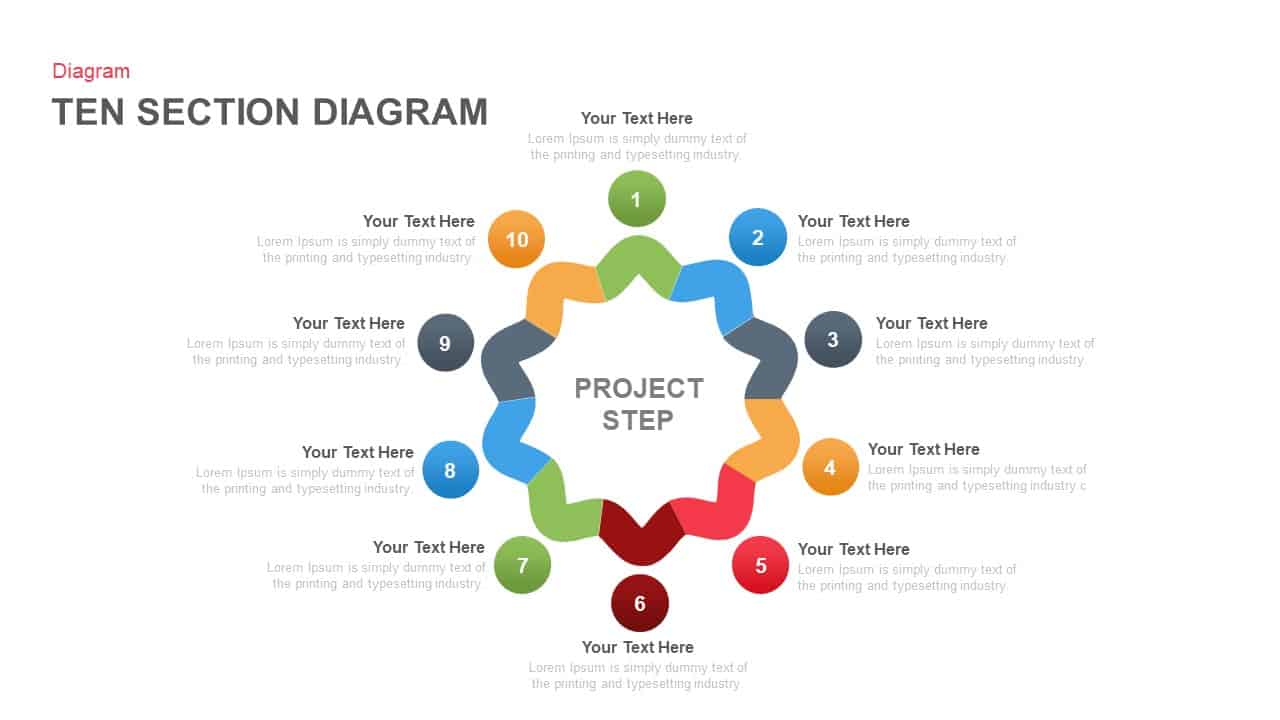
Ten-Section Project Steps Diagram Template for PowerPoint & Google Slides
Process
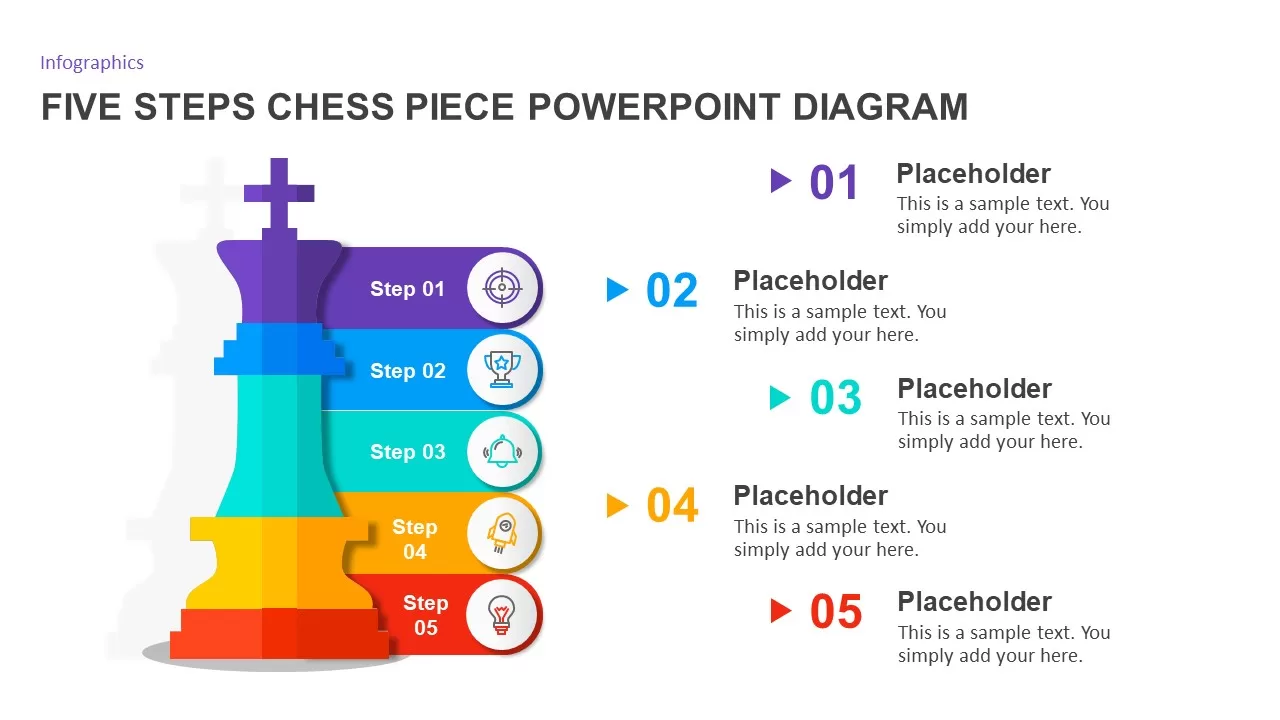
Five Steps Chess Piece Diagram for PowerPoint & Google Slides
Process

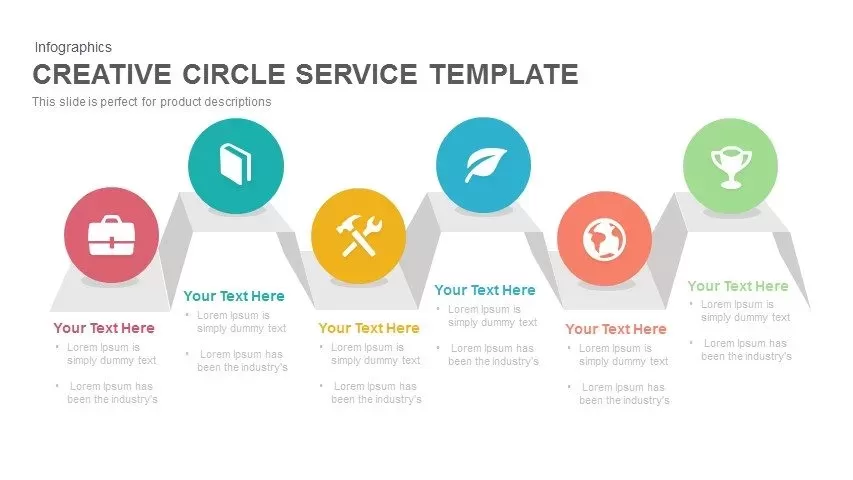
Creative Zigzag Circle Service Steps Template for PowerPoint & Google Slides
Process
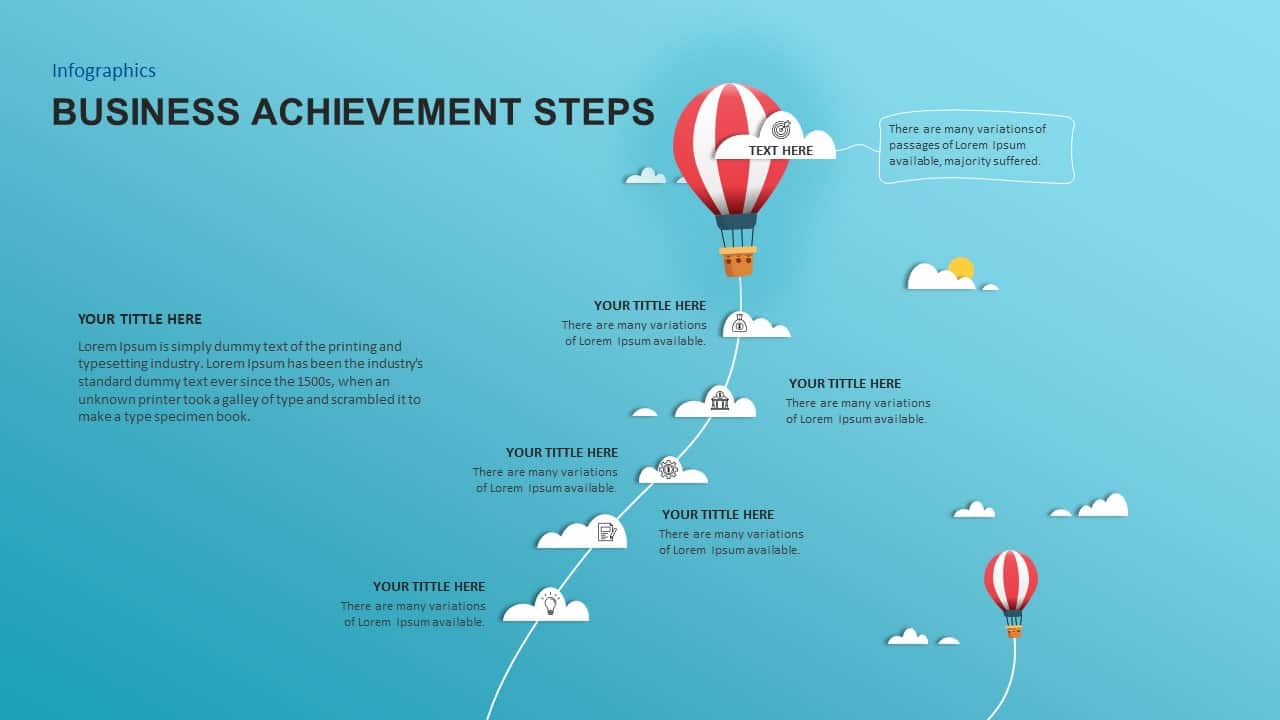
Business Achievement Steps Infographic template for PowerPoint & Google Slides
Process
Next Steps Infographic template for PowerPoint & Google Slides
Infographics
Timeline Infographic Steps template for PowerPoint & Google Slides
Business Plan
Stair and Steps Infographic Template for PowerPoint & Google Slides
Process
Isometric Block Infographic Steps Template for PowerPoint & Google Slides
Process
Isometric Block Steps Infographic Template for PowerPoint & Google Slides
Process
Colorful Arrow Methodology Steps Template for PowerPoint & Google Slides
Process
Modern Shield Infographic Steps Template for PowerPoint & Google Slides
Process

Steps Infographics Template for PowerPoint & Google Slides
Decks
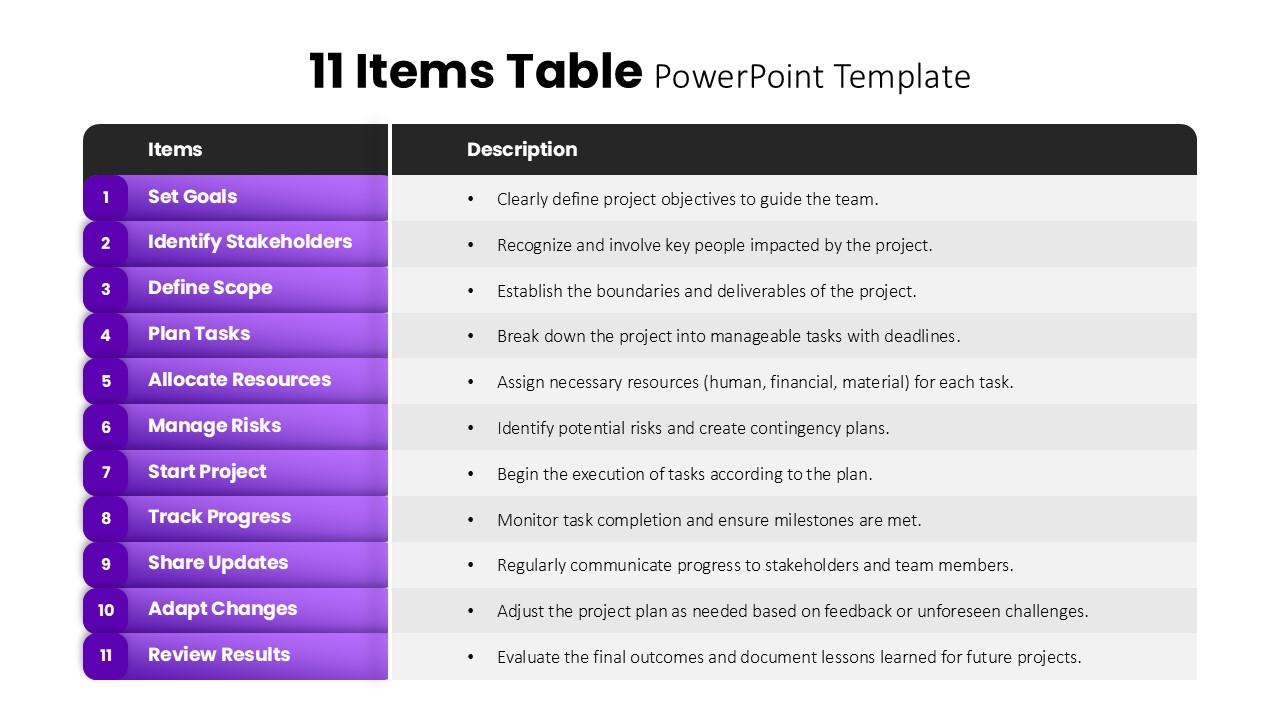
11 Items Table Project Planning Steps template for PowerPoint & Google Slides
Business
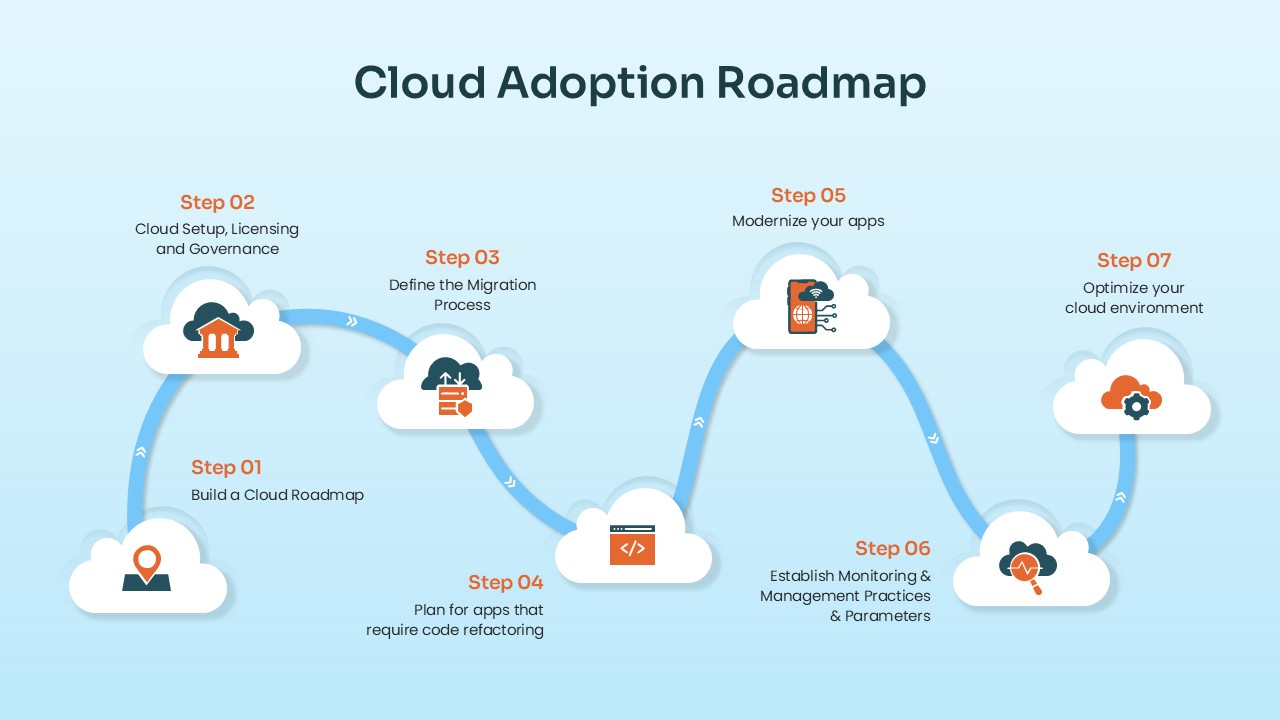
Cloud Adoption Roadmap Steps template for PowerPoint & Google Slides
Cloud Computing
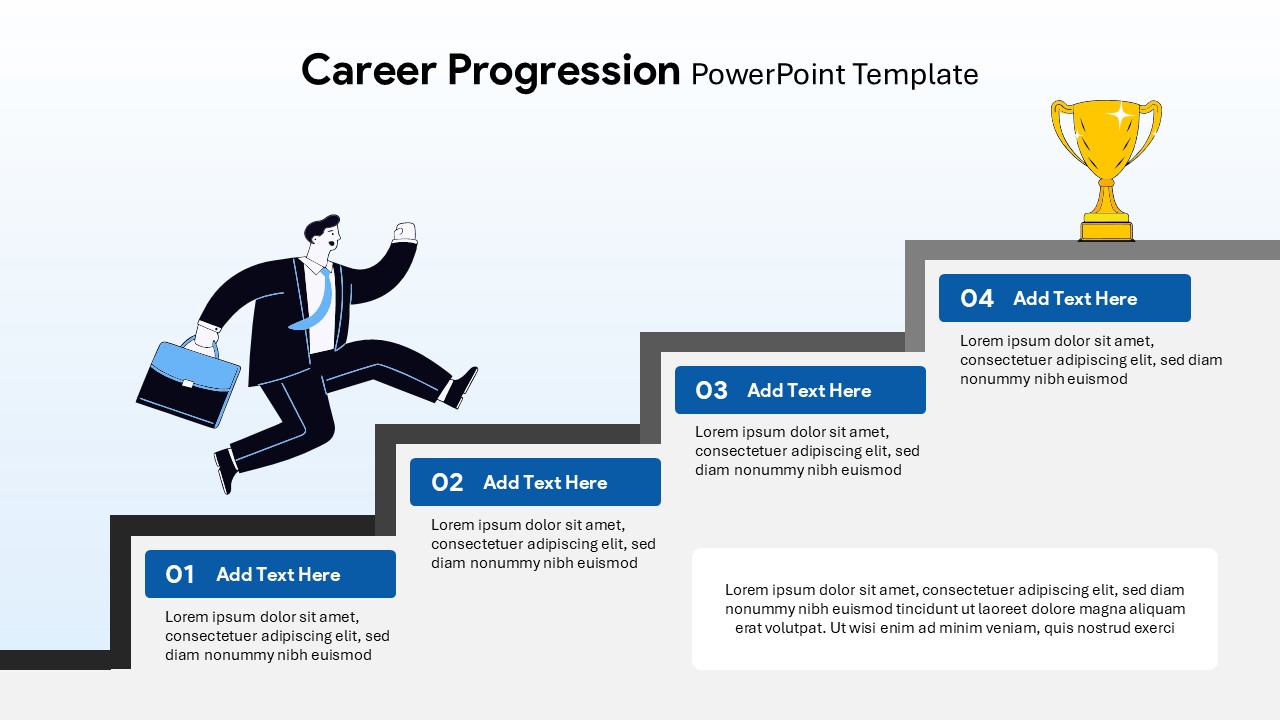
Career Progression Steps Template for PowerPoint & Google Slides
Employee Performance
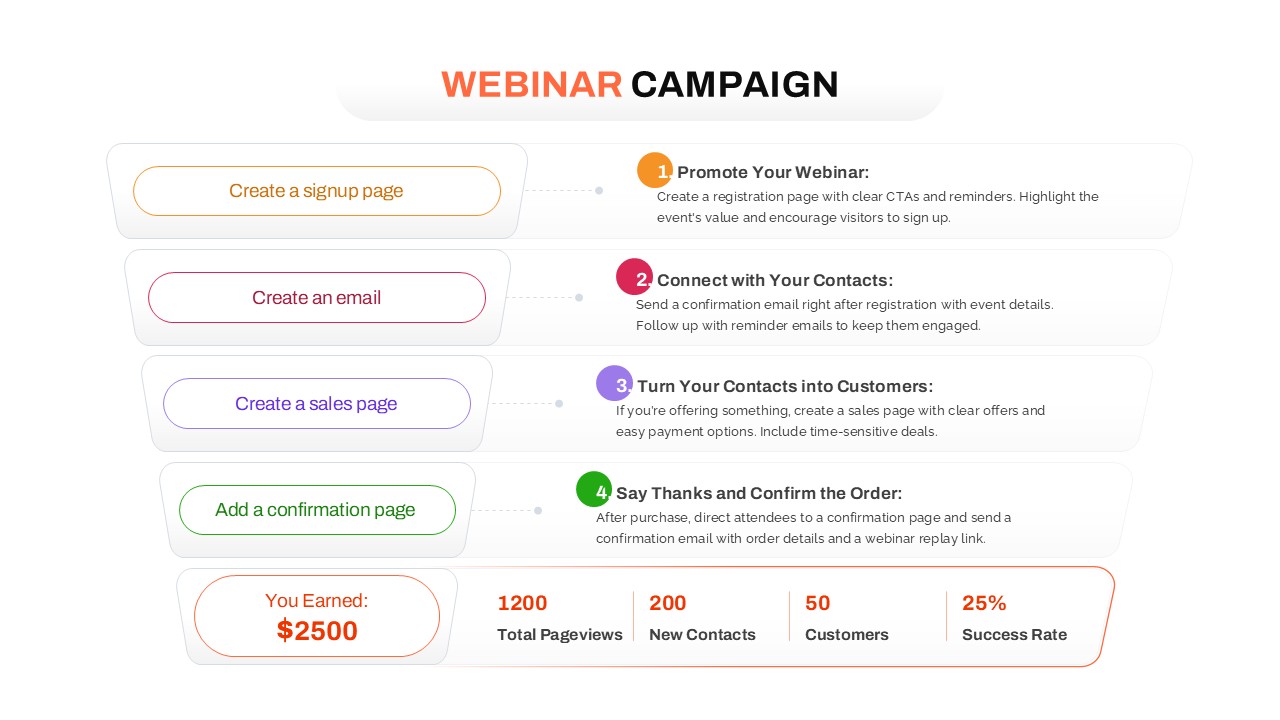
Webinar Campaign Steps and Performance for PowerPoint & Google Slides
Advertising
Gear Process Diagram PowerPoint Template for PowerPoint & Google Slides
Process
Sales Process Workflow Funnel Diagram PowerPoint Template for PowerPoint & Google Slides
Funnel
Business Process Diagram template for PowerPoint & Google Slides
Process
4 Step Creative Process Diagram Template for PowerPoint & Google Slides
Infographics
6 Stage Process Diagram Infographic Template for PowerPoint & Google Slides
Process
4 Section Pipe Diagram Process Flow Template for PowerPoint & Google Slides
Process
Dynamic Shield Process Flow Diagram template for PowerPoint & Google Slides
Process
Six Arrow Radial Process Diagram template for PowerPoint & Google Slides
Infographics
4 Step 3D Circular Process Diagram template for PowerPoint & Google Slides
Process
Three-Section Fishbone Process Diagram template for PowerPoint & Google Slides
Process
Six Stage Zigzag Process Diagram Template for PowerPoint & Google Slides
Process
Four Arrows Business Process Diagram template for PowerPoint & Google Slides
Process
15-Step Process Flow Diagram Template for PowerPoint & Google Slides
Process
Roadmap Six-Step Process Diagram Template for PowerPoint & Google Slides
Roadmap
3 Stage Section Process Diagram Template for PowerPoint & Google Slides
Process
Four-Circle Venn Process Diagram template for PowerPoint & Google Slides
Process
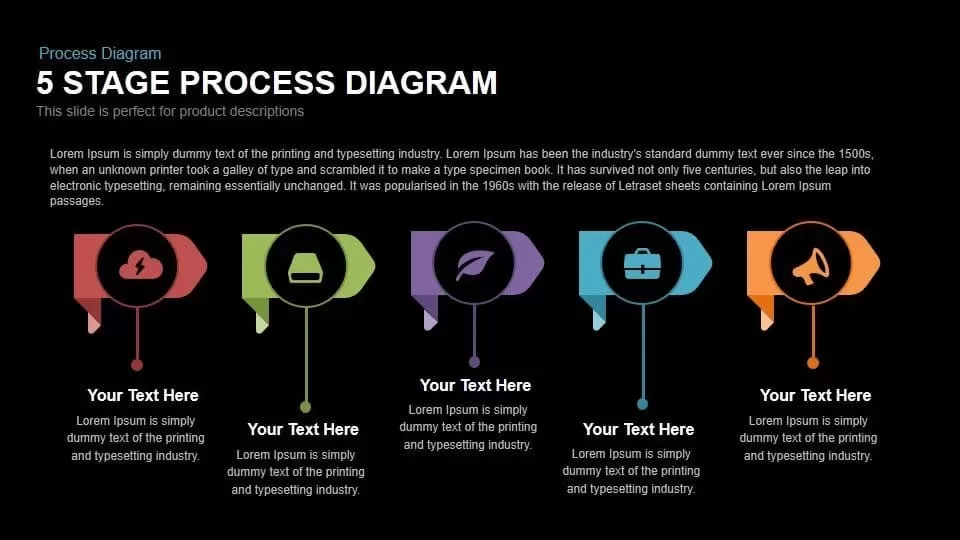
5 Stage Process Diagram Slide Overview Template for PowerPoint & Google Slides
Process

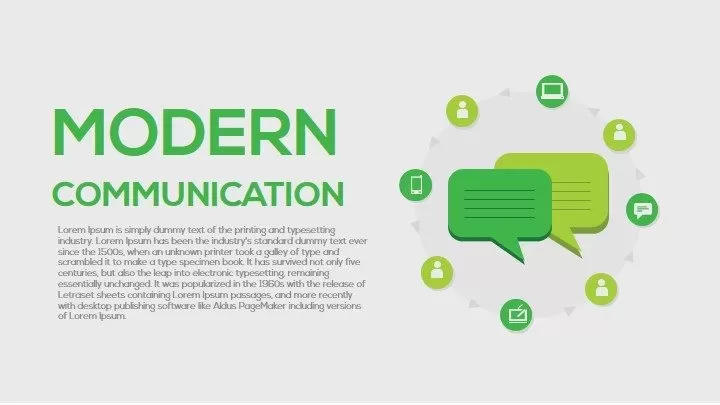
Modern Communication Process Diagram Template for PowerPoint & Google Slides
Process
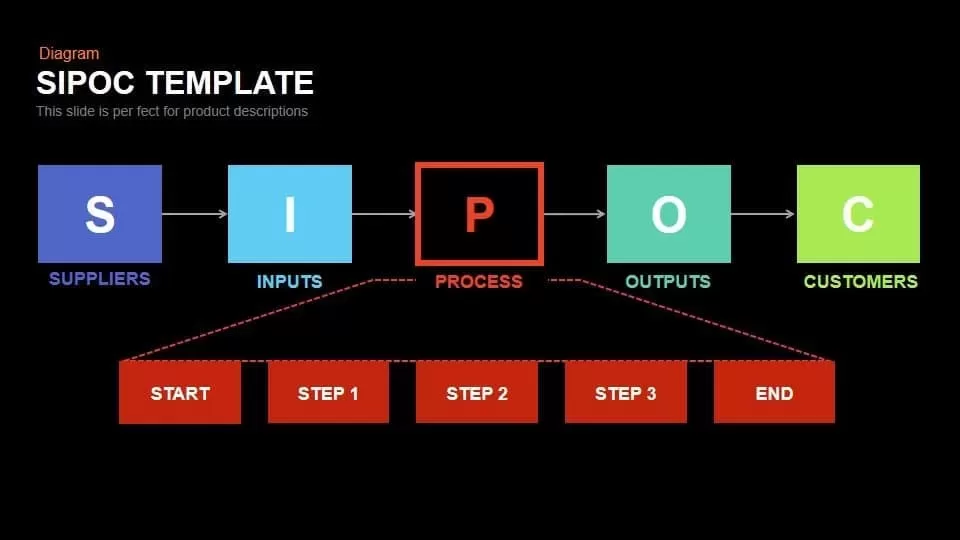
SIPOC Diagram with Process Breakdown Template for PowerPoint & Google Slides
Process
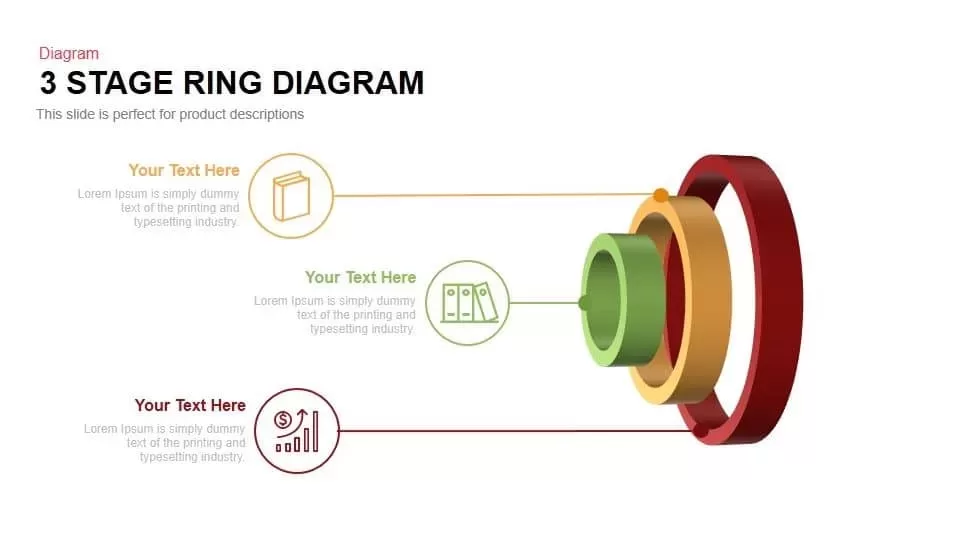
Three-Stage Ring Process Diagram Template for PowerPoint & Google Slides
Circular
Seven-Stage Arrow Process Diagram Template for PowerPoint & Google Slides
Process
Process Improvement Metaphor Diagram Template for PowerPoint & Google Slides
Process
Business Section Diamond Process Diagram Template for PowerPoint & Google Slides
Process
Engaging Five-Stage Process Diagram Template for PowerPoint & Google Slides
Process
Editable Six-Step Bubble Process Diagram Template for PowerPoint & Google Slides
Process

Five-Stage Cyclic Process Arrow Diagram Template for PowerPoint & Google Slides
Process
Ten-Stage Hub and Spoke Process Diagram Template for PowerPoint & Google Slides
Process
Six-Stage Circle Process Diagram Template for PowerPoint & Google Slides
Process
DevOps Infinity Loop Process Diagram Template for PowerPoint & Google Slides
Process
Five-Stage Process Diagram Template for PowerPoint & Google Slides
Process
Change Kaleidoscope Process Diagram Template for PowerPoint & Google Slides
Circular
Five-Stage Linear Process Flow Diagram Template for PowerPoint & Google Slides
Process
Four-Stage Cycle Process Diagram Template for PowerPoint & Google Slides
Process
Five-Stage Circular Process Flow Diagram Template for PowerPoint & Google Slides
Circular
3D 6-Step Infographics Process Diagram Template for PowerPoint & Google Slides
Infographics
Hand-Held Four-Step Process Diagram Template for PowerPoint & Google Slides
Process
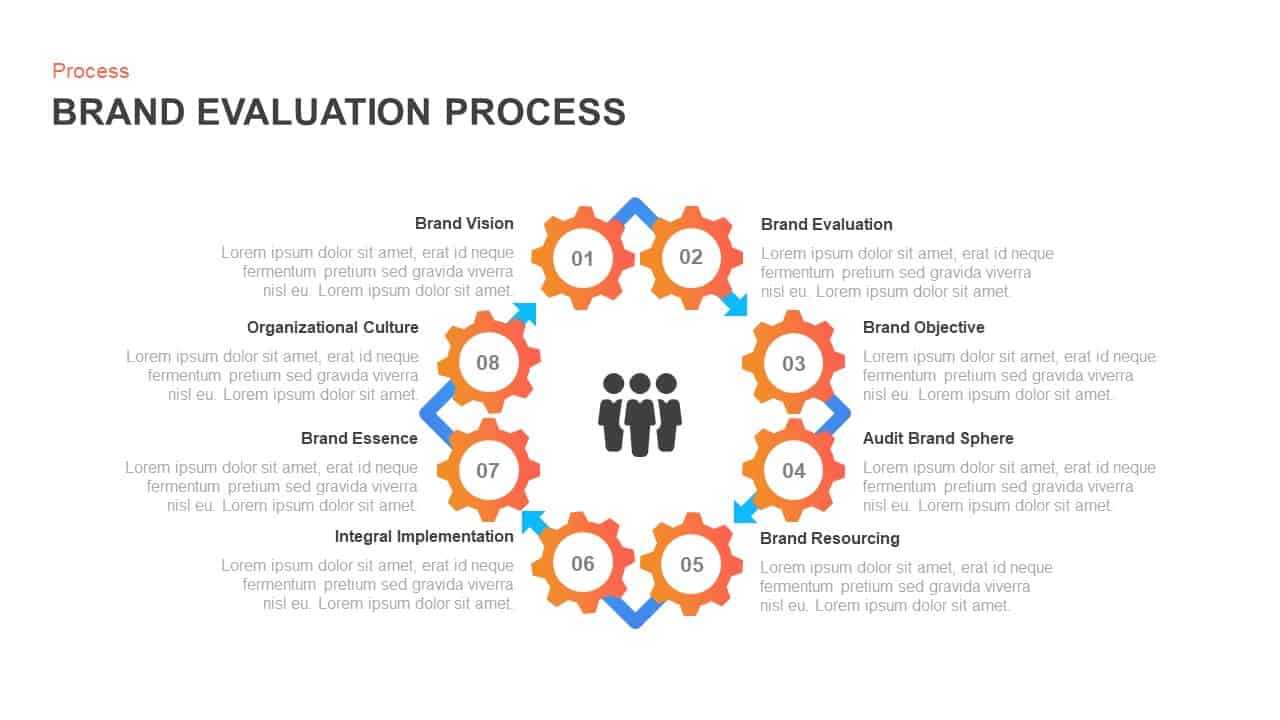
8-Stage Brand Evaluation Process Diagram Template for PowerPoint & Google Slides
Process
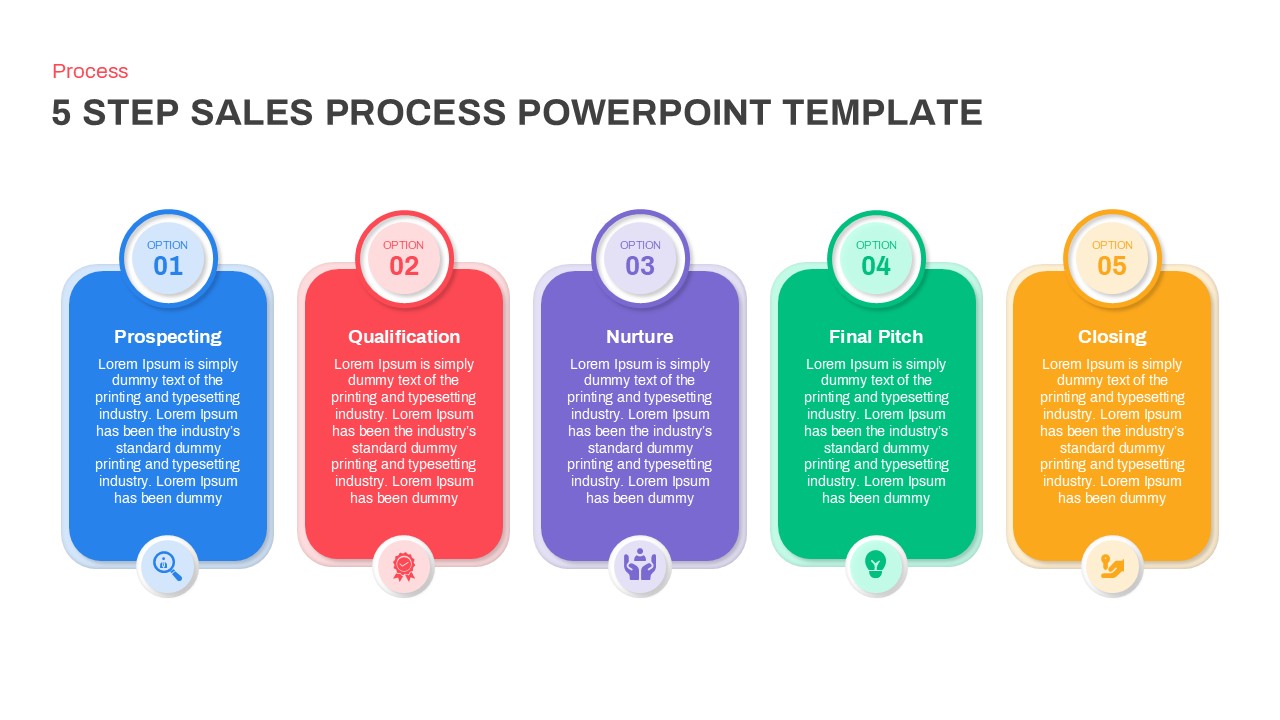
Modern 5-Step Sales Process Diagram Template for PowerPoint & Google Slides
Process
8 Step Circular Process Flow Diagram Template for PowerPoint & Google Slides
Process
6-Step Circular Process Flow Diagram Template for PowerPoint & Google Slides
Process
4-Stage Linear Process Flow Diagram Template for PowerPoint & Google Slides
Process
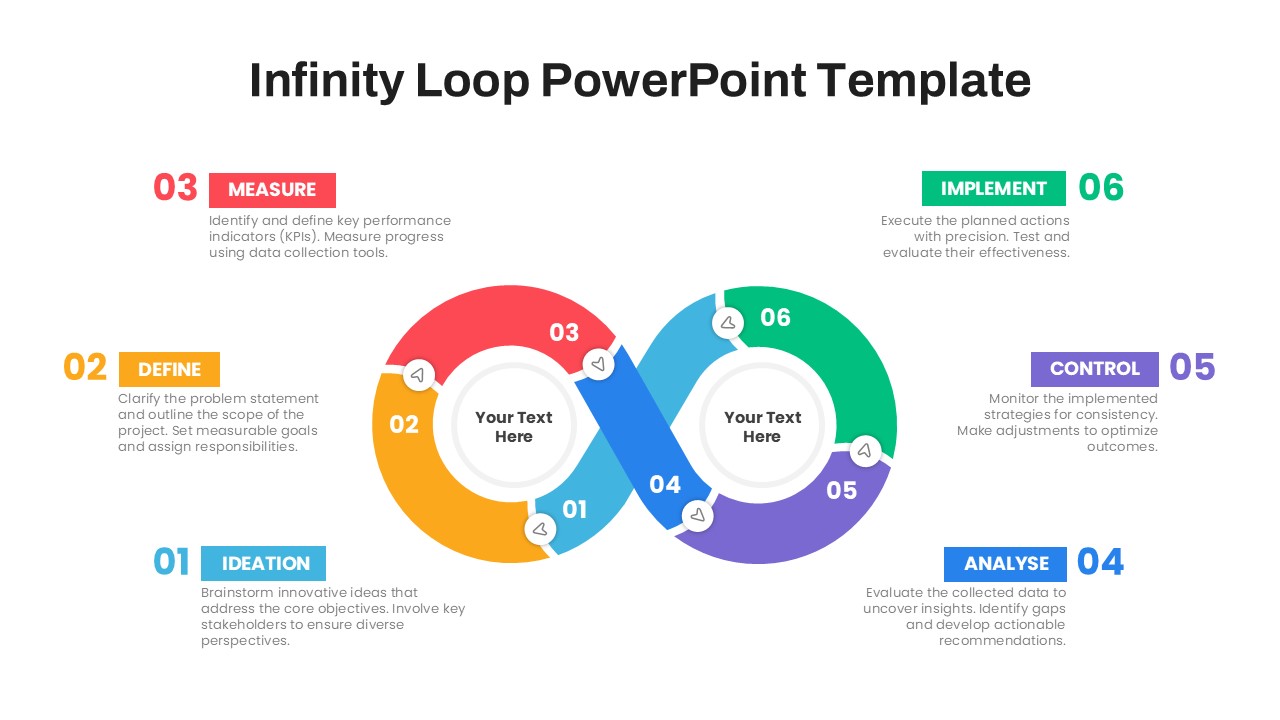
Six-Step Infinity Loop Process Diagram Template for PowerPoint & Google Slides
Process
Six-Circle Process Infographic Diagram Template for PowerPoint & Google Slides
Circular
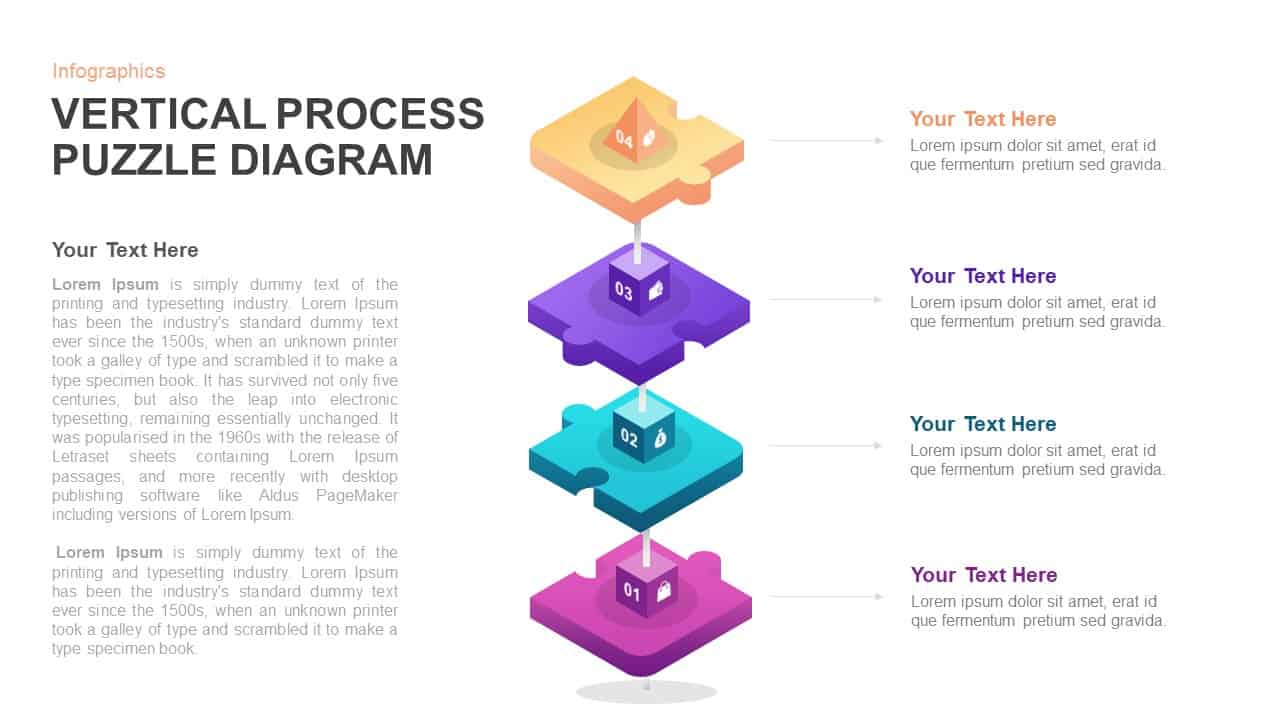
Vertical 4-Step Puzzle Process Diagram Template for PowerPoint & Google Slides
Process

Circular CRM Process Infographic Diagram Template for PowerPoint & Google Slides
Circular
Modern 4 Section Process Diagram Template for PowerPoint & Google Slides
Process
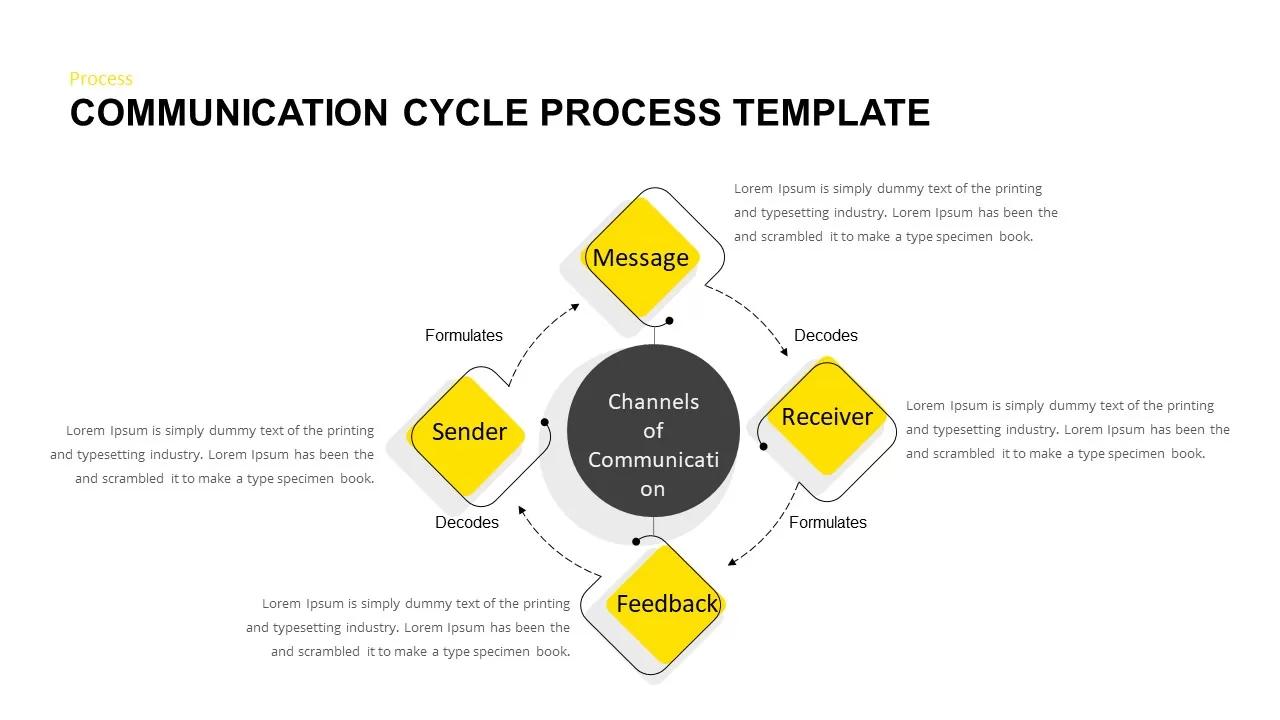
Communication Cycle Process Diagram template for PowerPoint & Google Slides
Business
Fishbone Process Diagram template for PowerPoint & Google Slides
Infographics
Snowball Effect Process Diagram Template for PowerPoint & Google Slides
Process
Three-Step Curved Arrow Process Diagram Template for PowerPoint & Google Slides
Arrow
Circular Arrow Process Diagram Template for PowerPoint & Google Slides
Circular
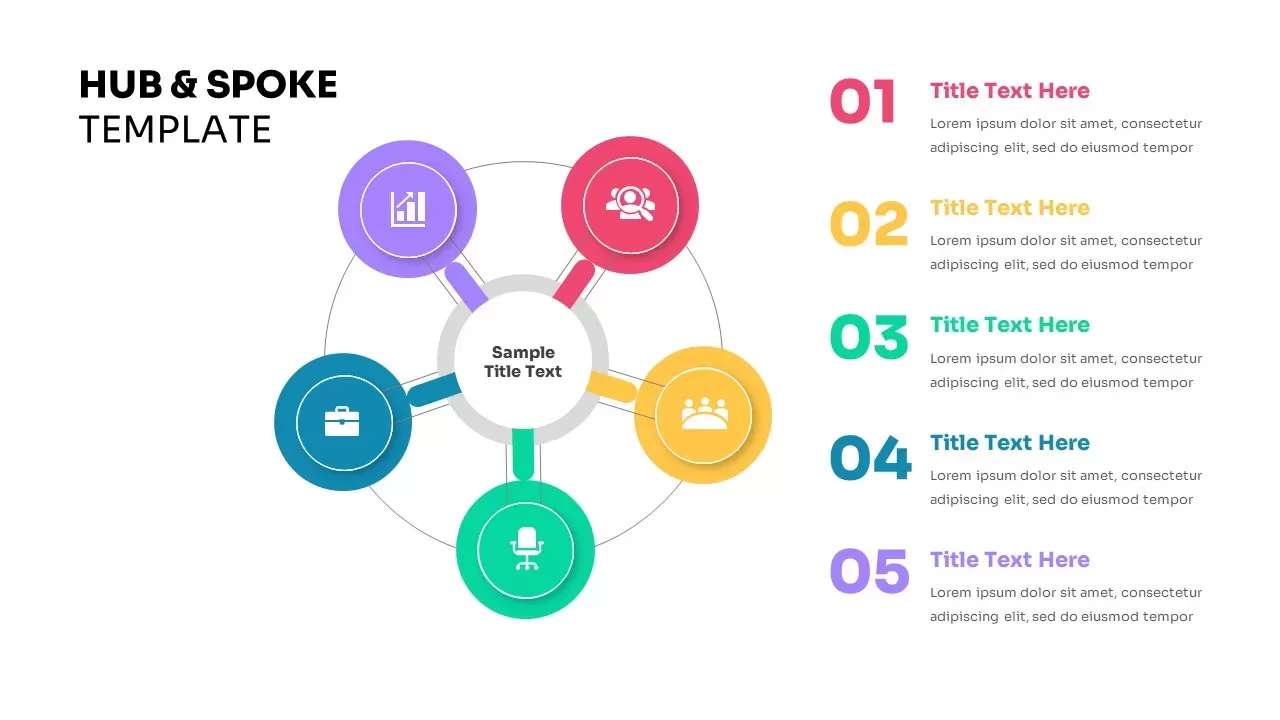
Five-Node Hub & Spoke Diagram Process Template for PowerPoint & Google Slides
Business Models
Chain Link Process Infographic Diagram Template for PowerPoint & Google Slides
Process
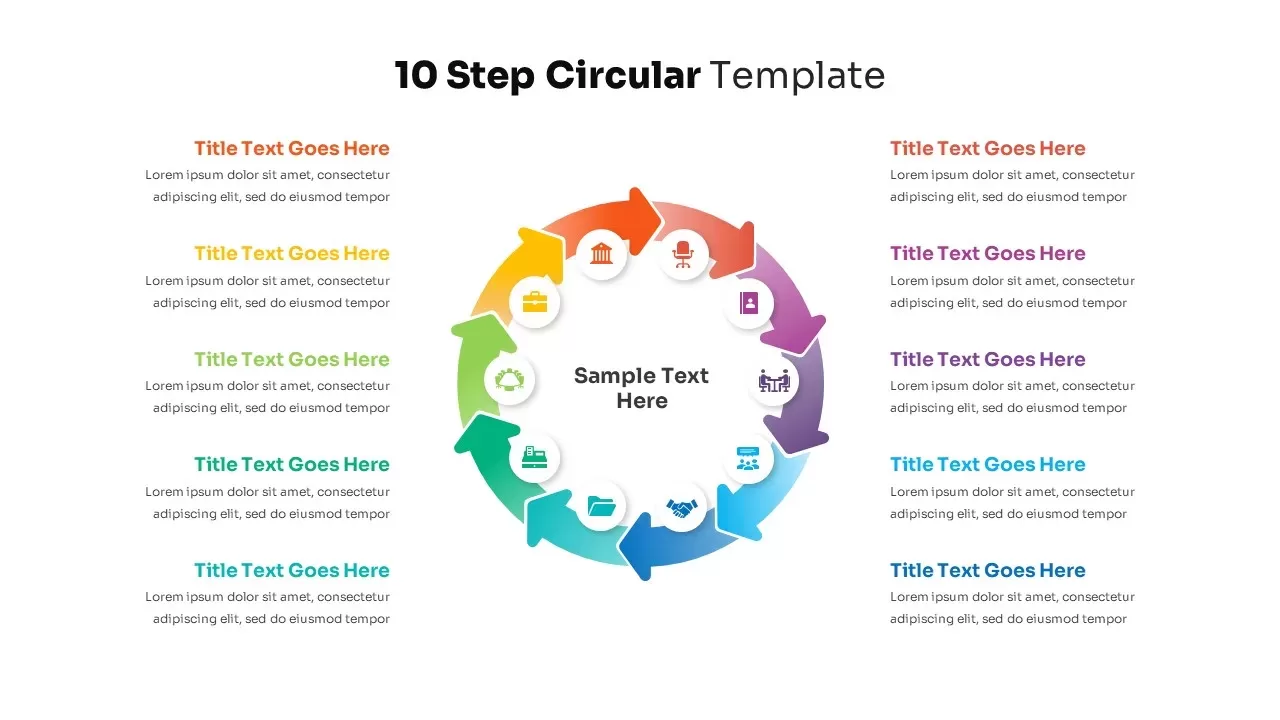
10-Step Circular Process Diagram Template for PowerPoint & Google Slides
Process
3D Conveyor Belt Process Flow Diagram Template for PowerPoint & Google Slides
Process
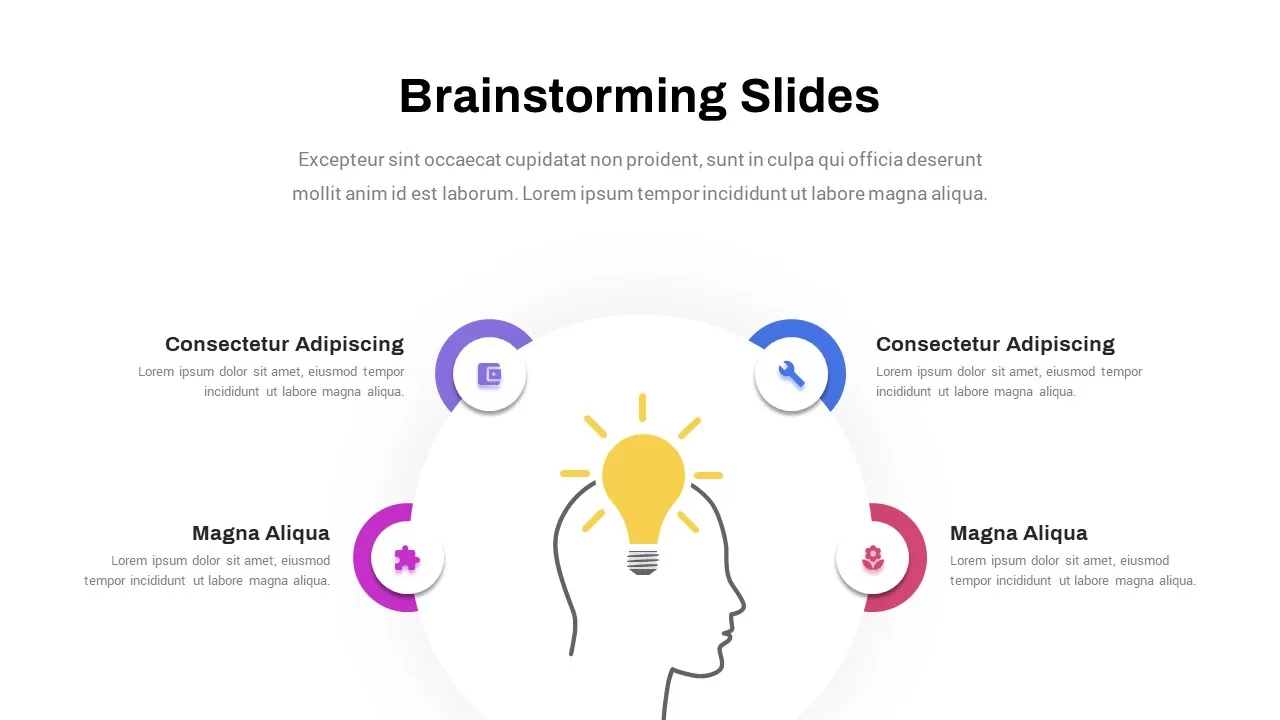
Creative Brainstorming Process Diagram Template for PowerPoint & Google Slides
Process
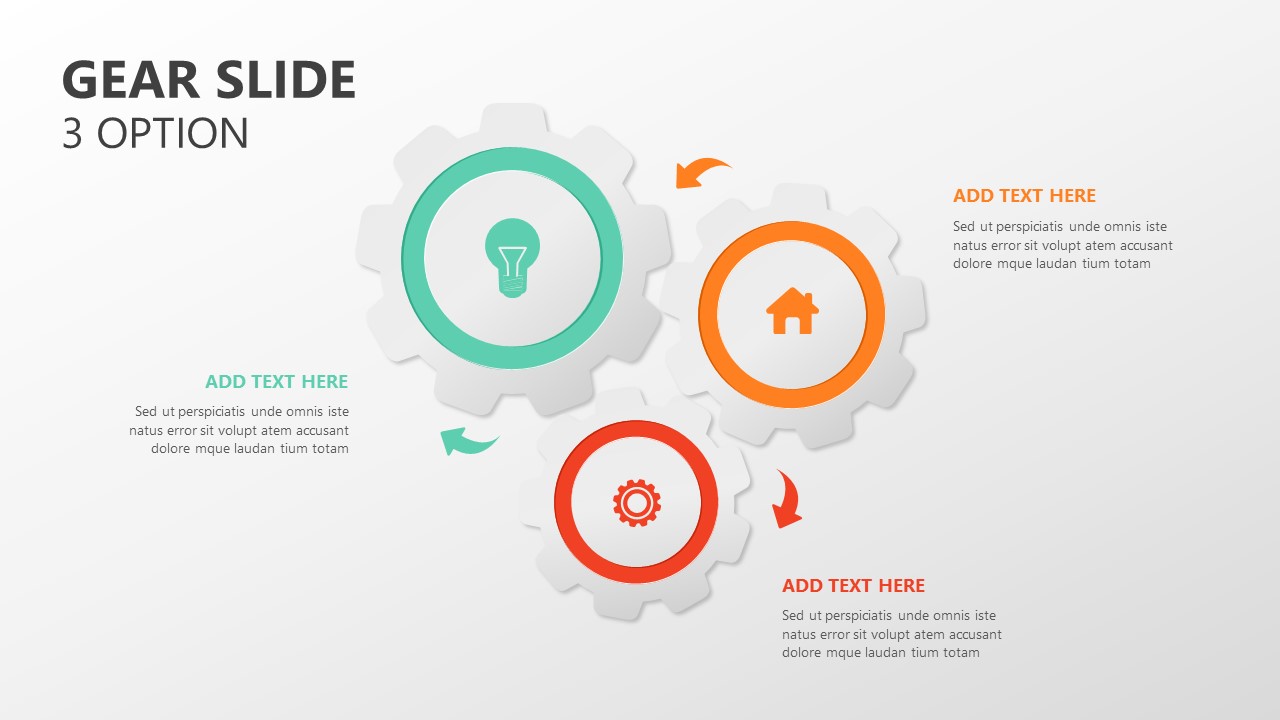
Gear Process Diagram Template for PowerPoint & Google Slides
Process
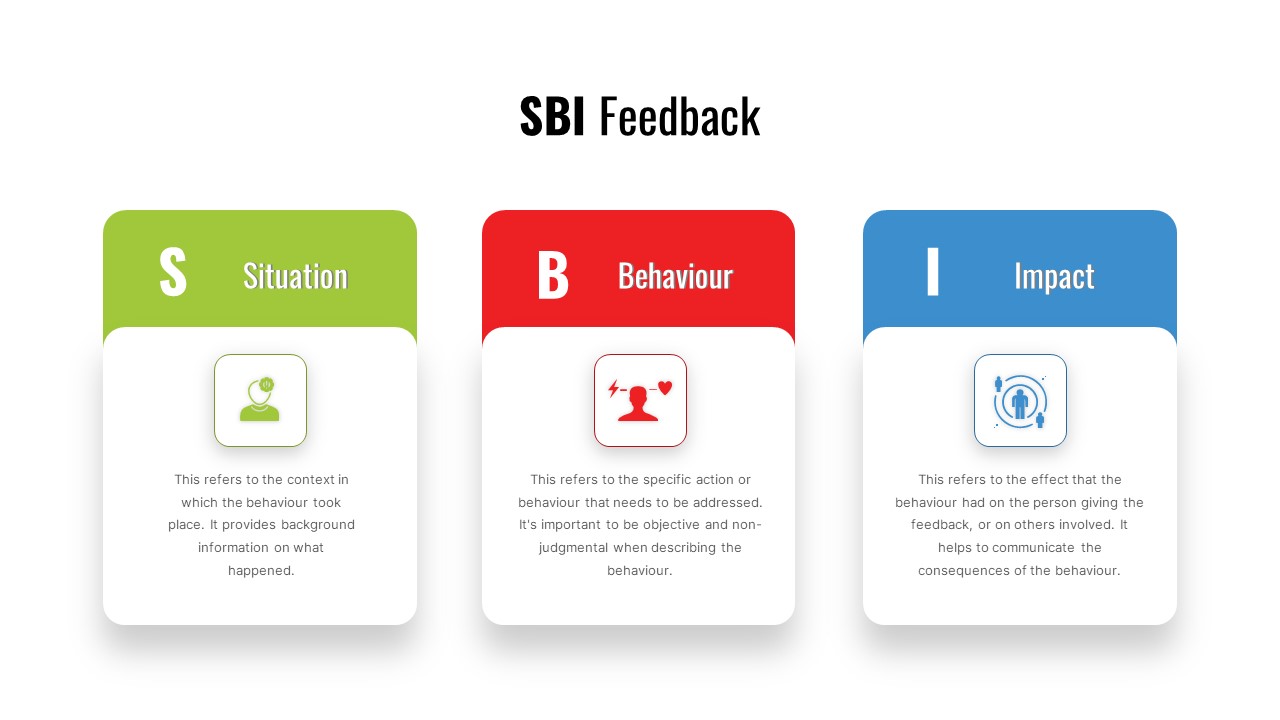
SBI Feedback Model Process Diagram Template for PowerPoint & Google Slides
Process
Simple Flowchart Process Diagram Template for PowerPoint & Google Slides
Flow Charts
Business Process Analysis Cycle Diagram Template for PowerPoint & Google Slides
Business Strategy
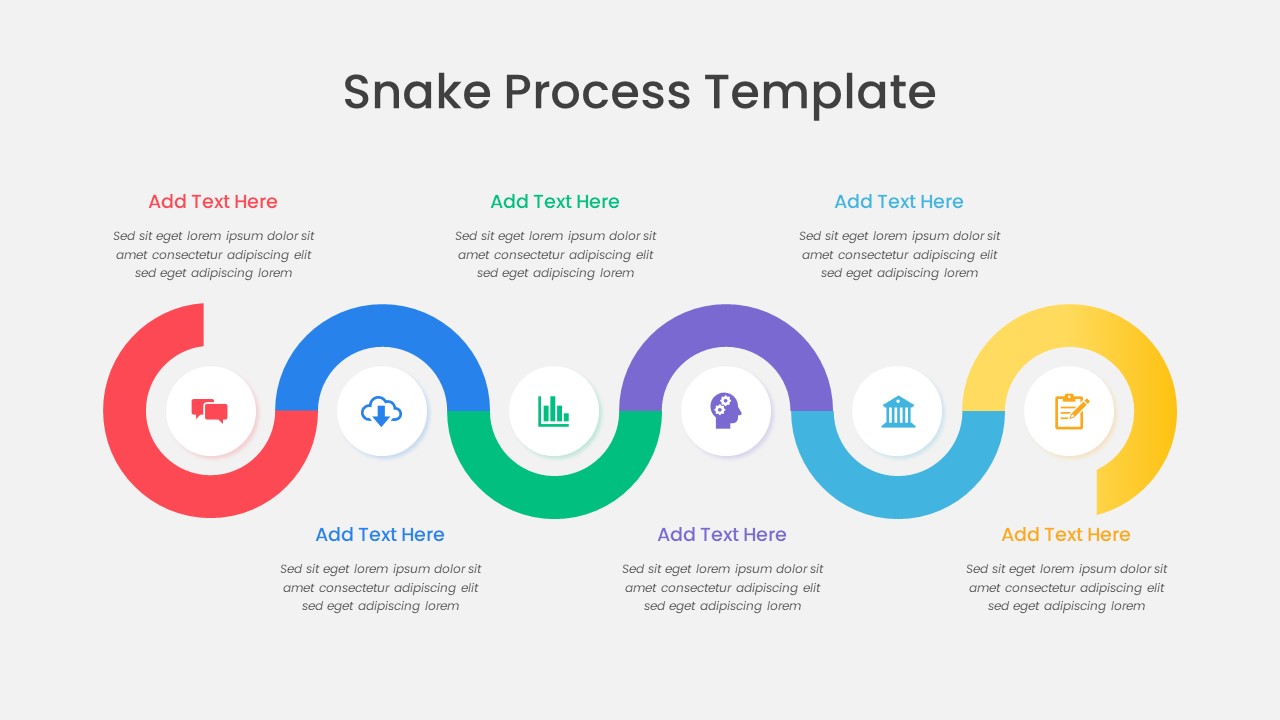
Colorful Snake Process Diagram Template for PowerPoint & Google Slides
Process
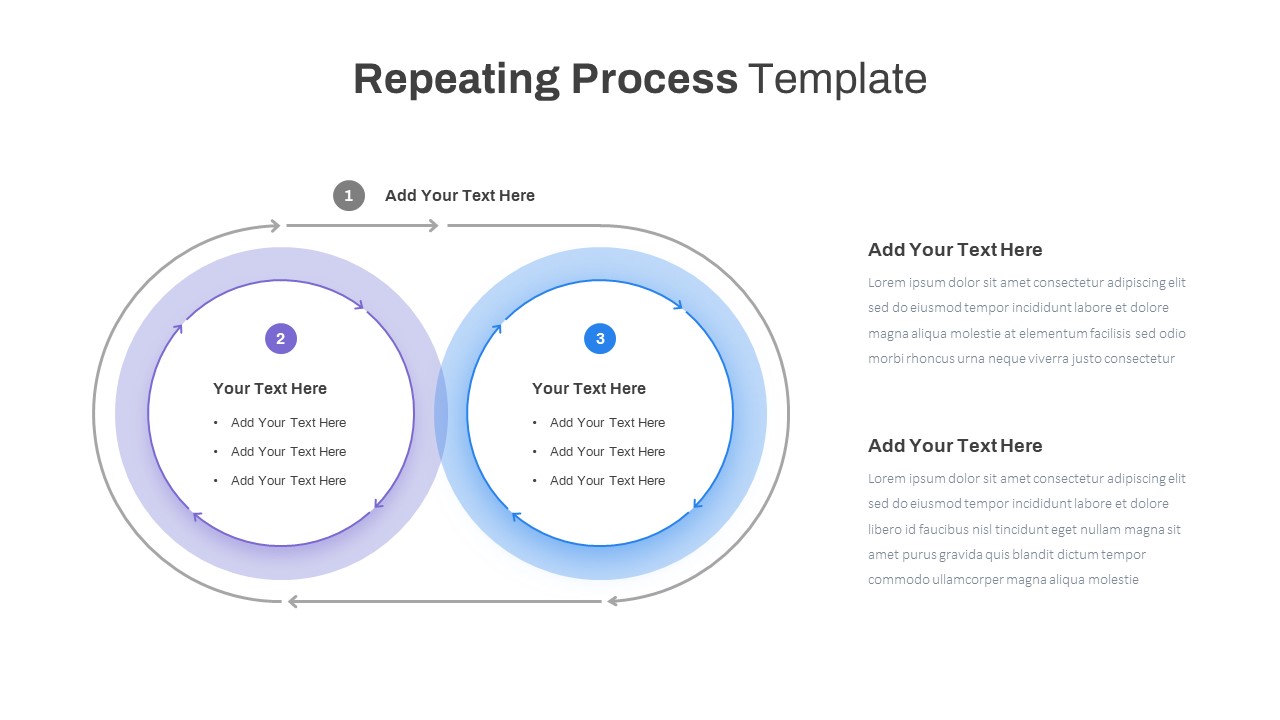
Repeating Overlapping Process Diagram Template for PowerPoint & Google Slides
Process
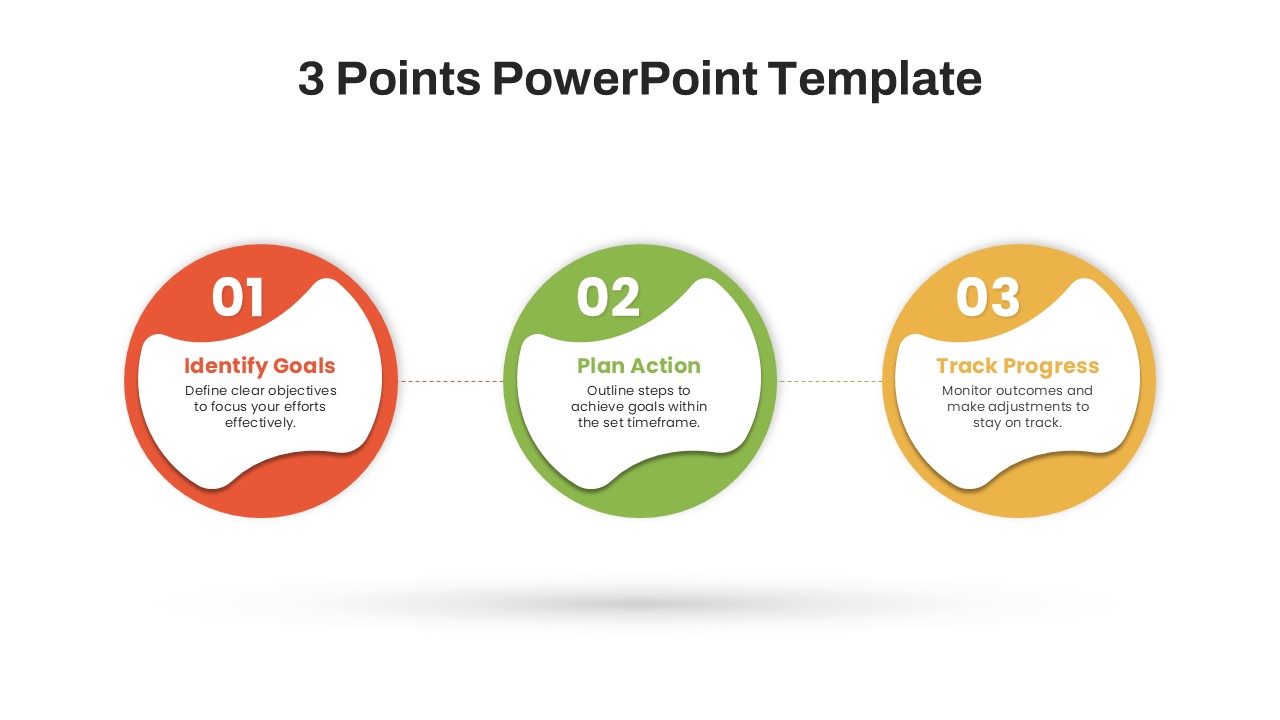
Modern Three-Point Process Diagram Template for PowerPoint & Google Slides
Process
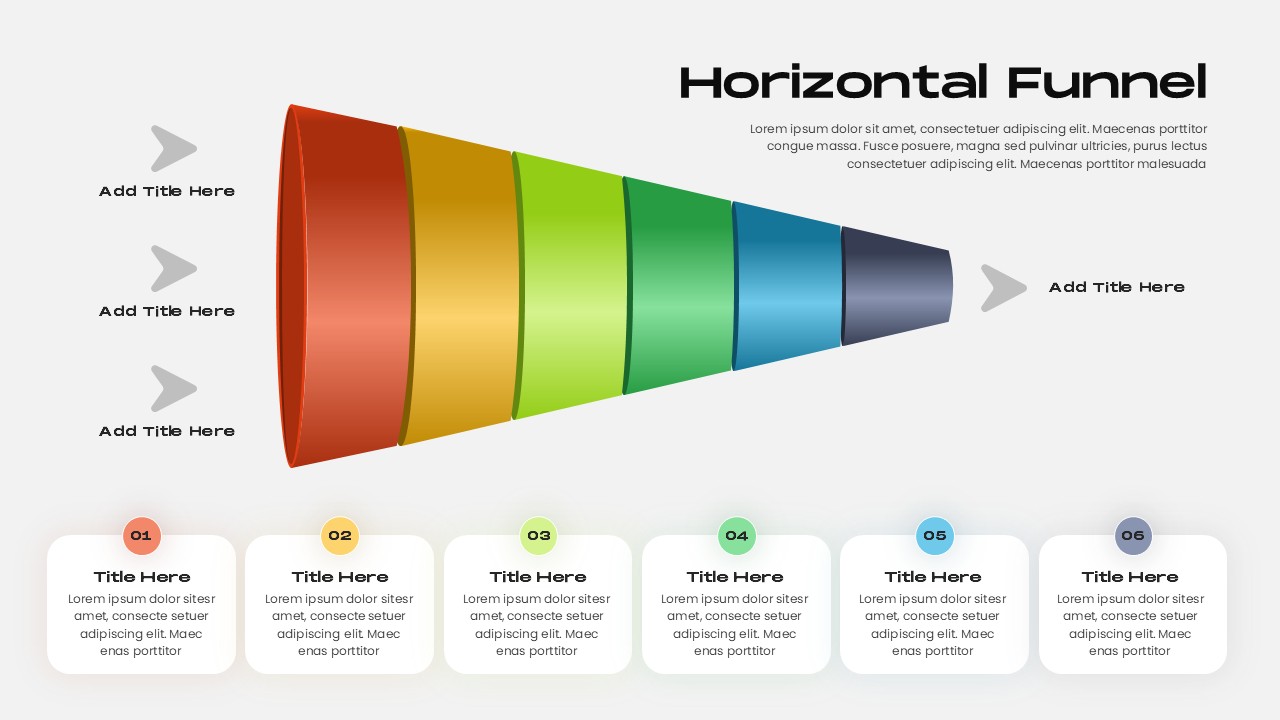
Horizontal Funnel Diagram Process Template for PowerPoint & Google Slides
Funnel
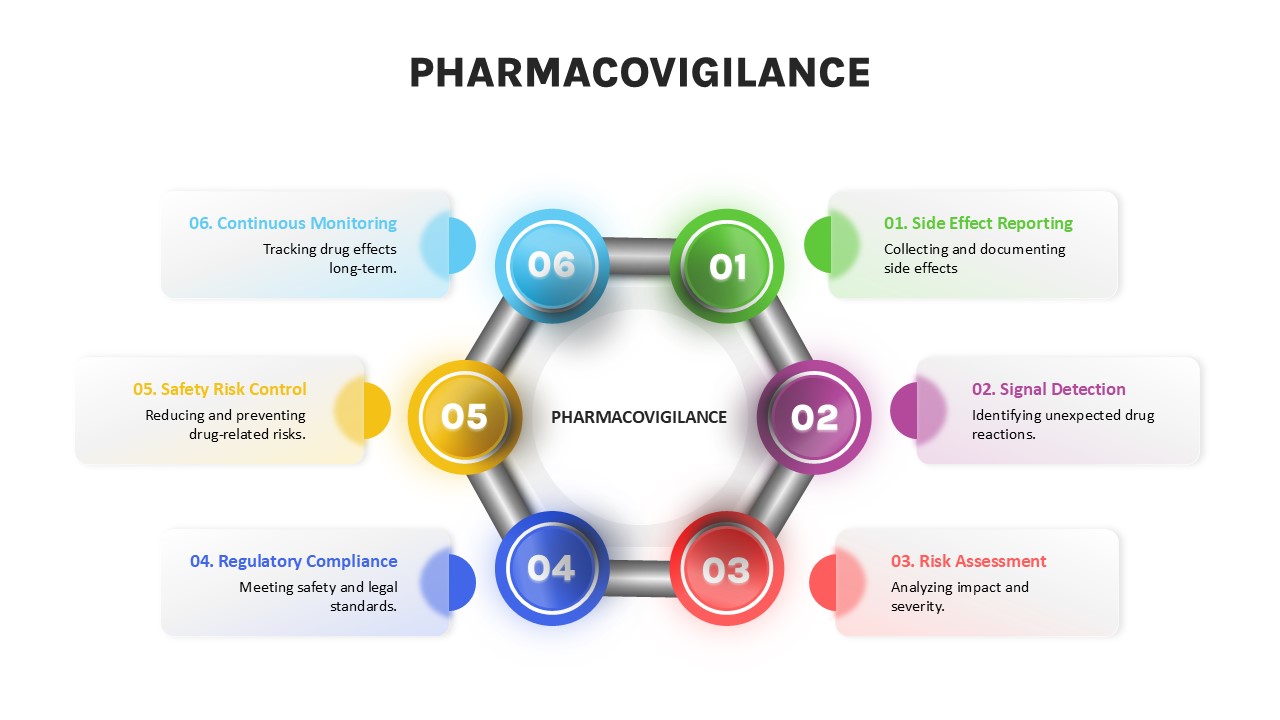
Pharmacovigilance Process Diagram Template for PowerPoint & Google Slides
Process
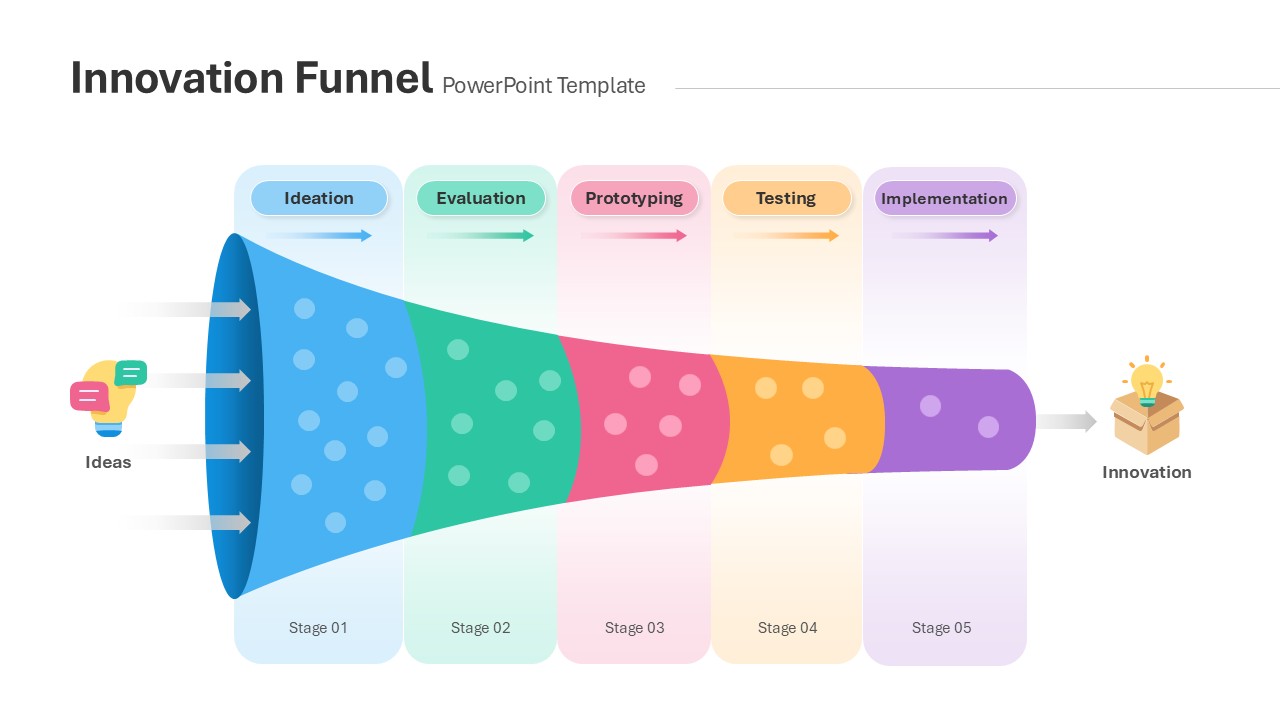
Innovation Funnel Process Diagram Template for PowerPoint & Google Slides
Funnel
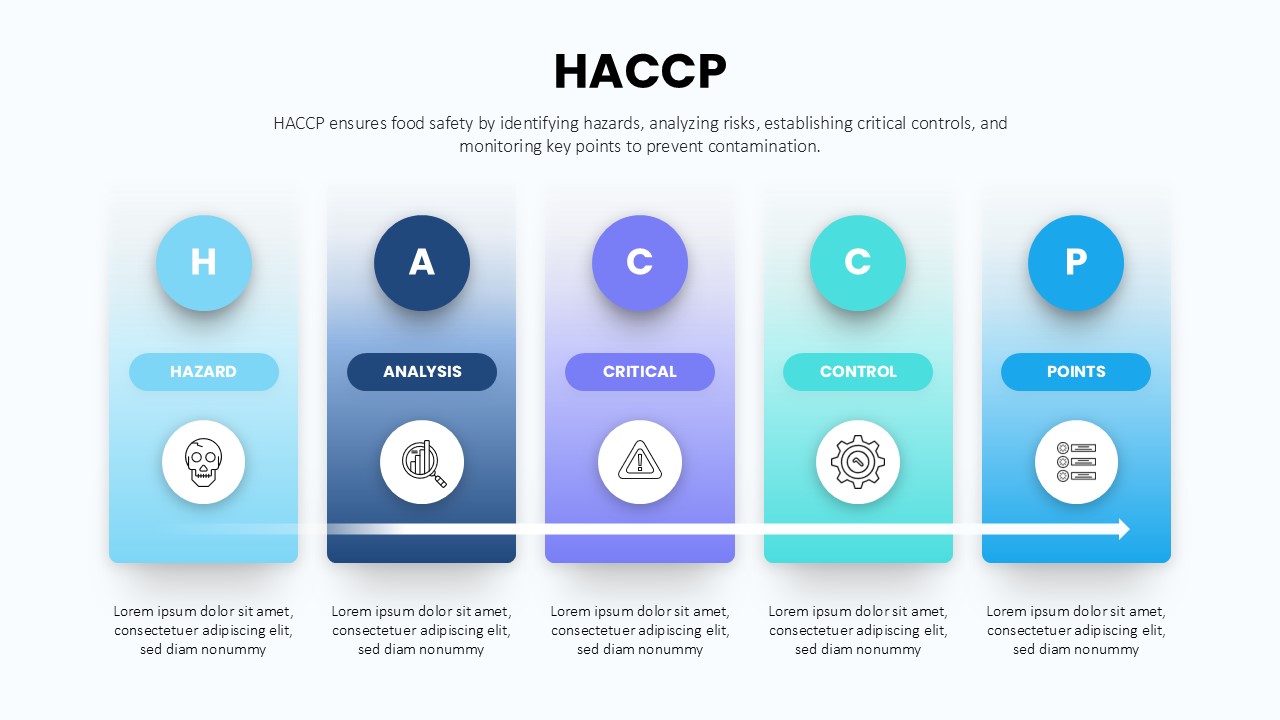
HACCP 5-Step Food Safety Process Diagram Template for PowerPoint & Google Slides
Process
Resume Screening Process Flow Diagram Template for PowerPoint & Google Slides
Process
Q-Learning Process Flow Diagram Template for PowerPoint & Google Slides
Process
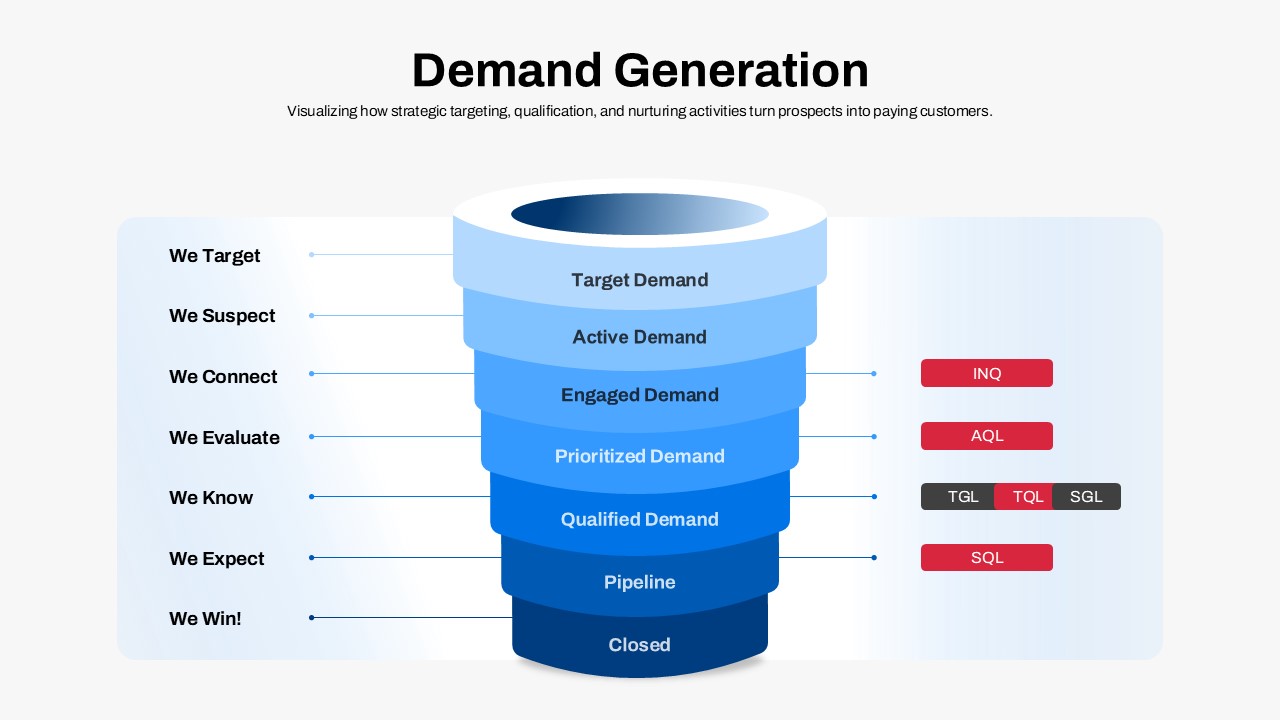
Demand Generation Funnel Process Diagram Template for PowerPoint & Google Slides
Funnel
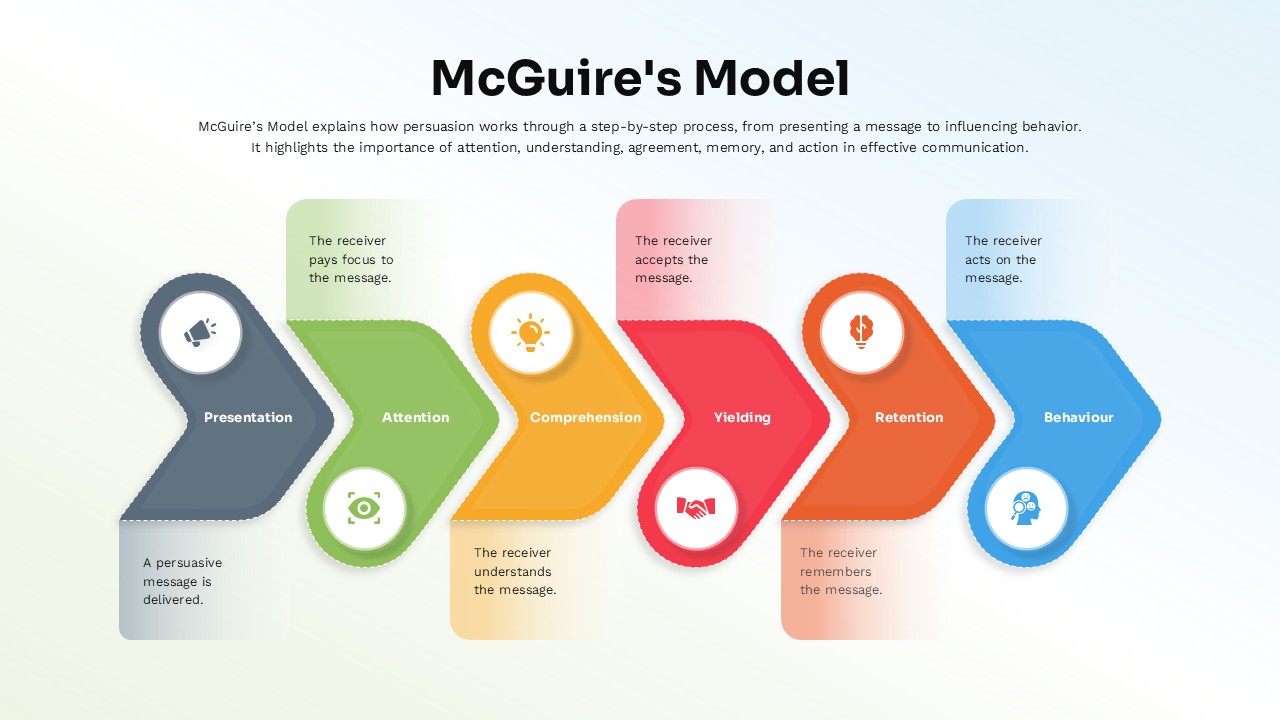
McGuire’s Persuasion Process Flow Diagram Template for PowerPoint & Google Slides
Marketing