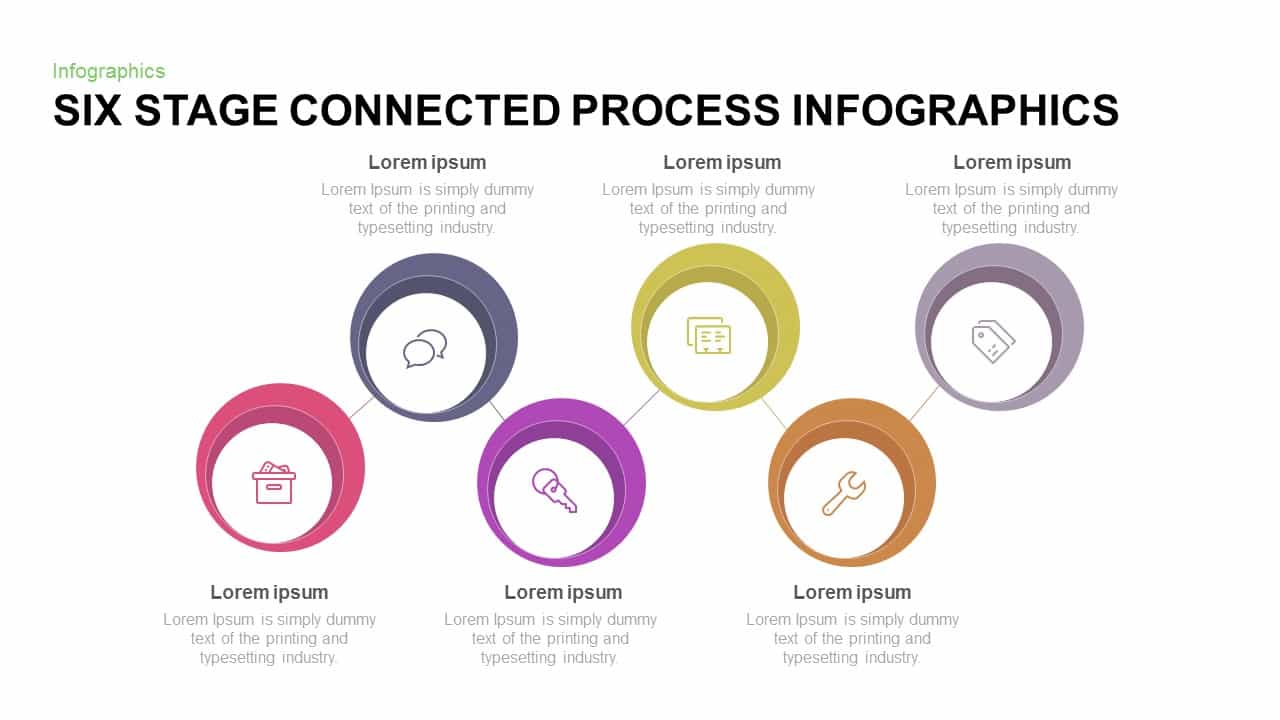
Six-Stage Connected Process Infographics Template for PowerPoint & Google Slides

Description
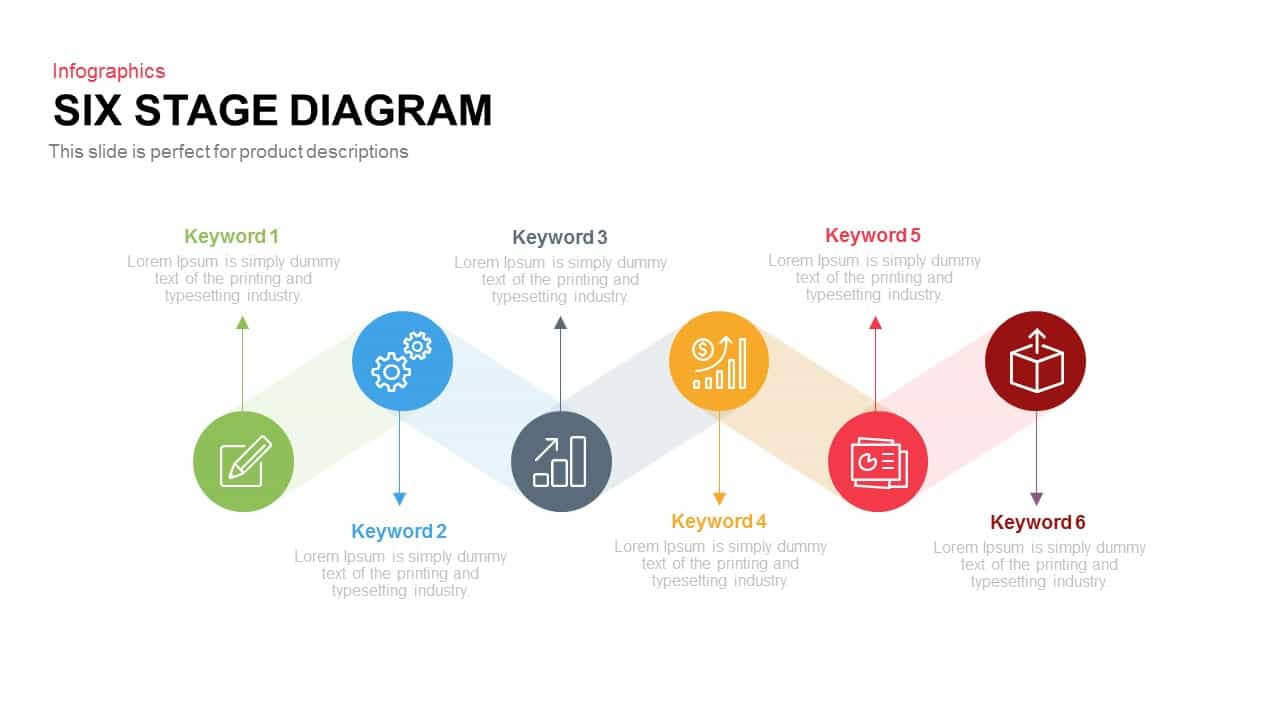
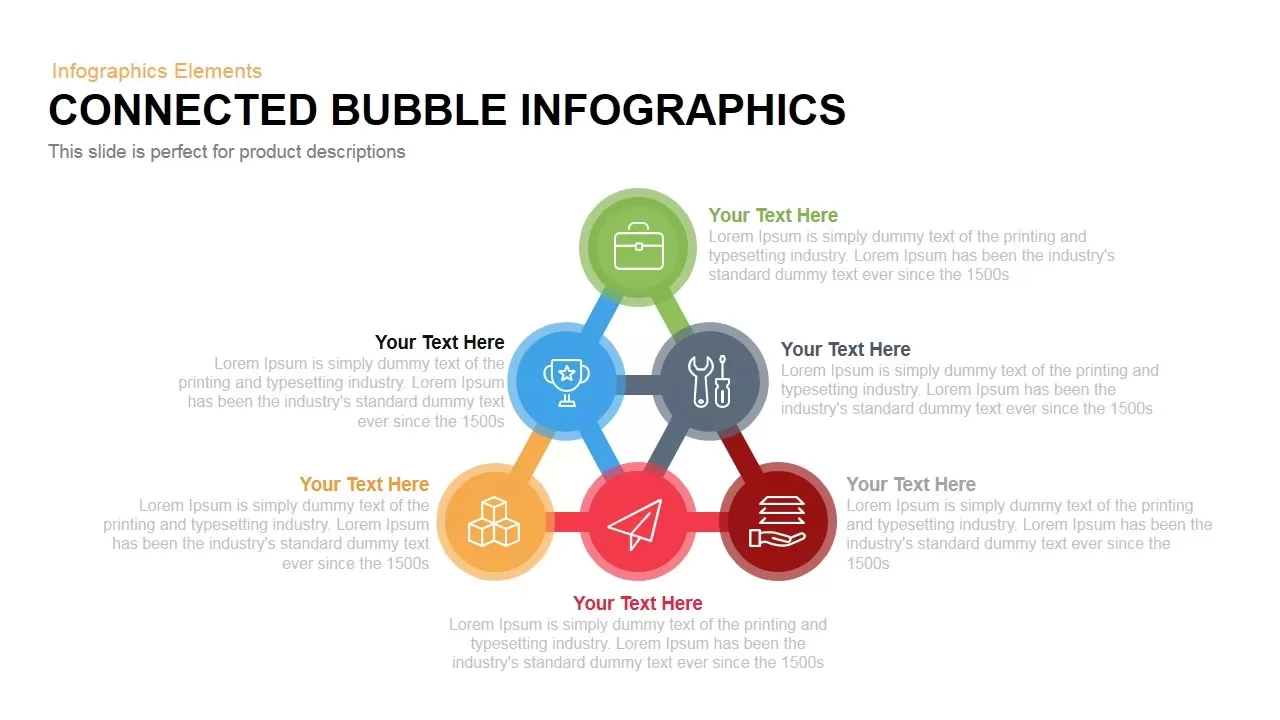
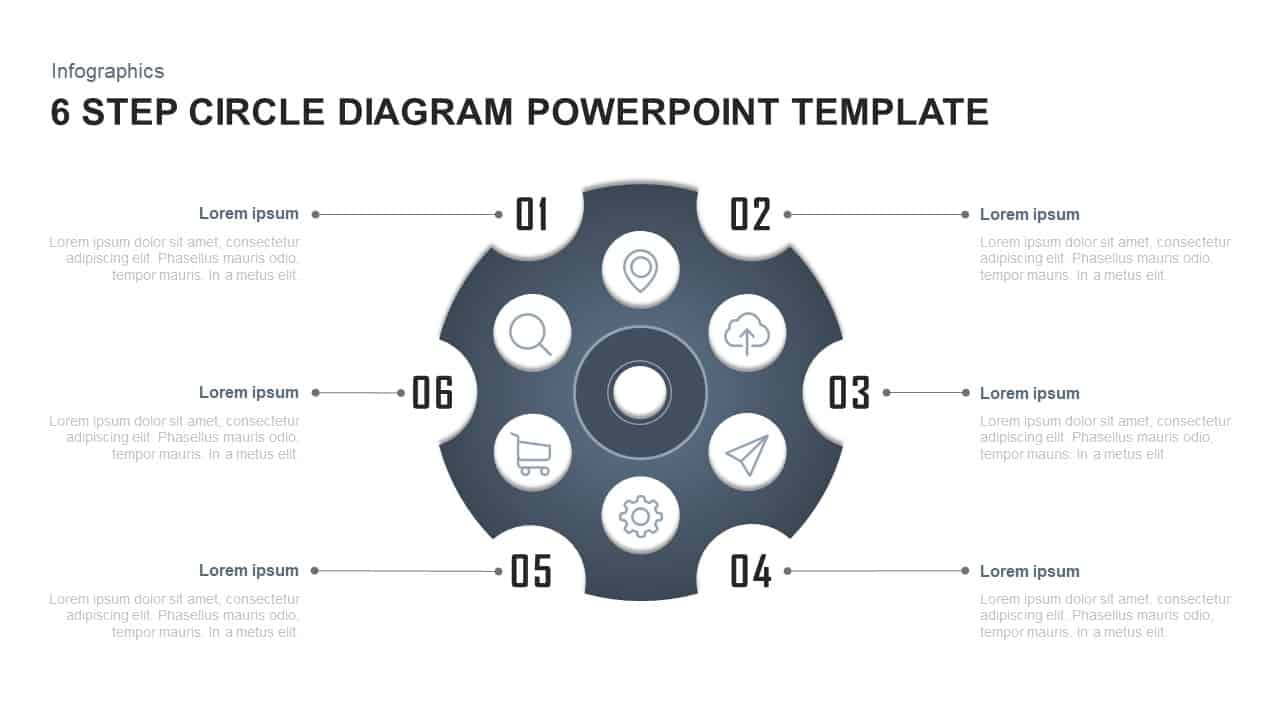
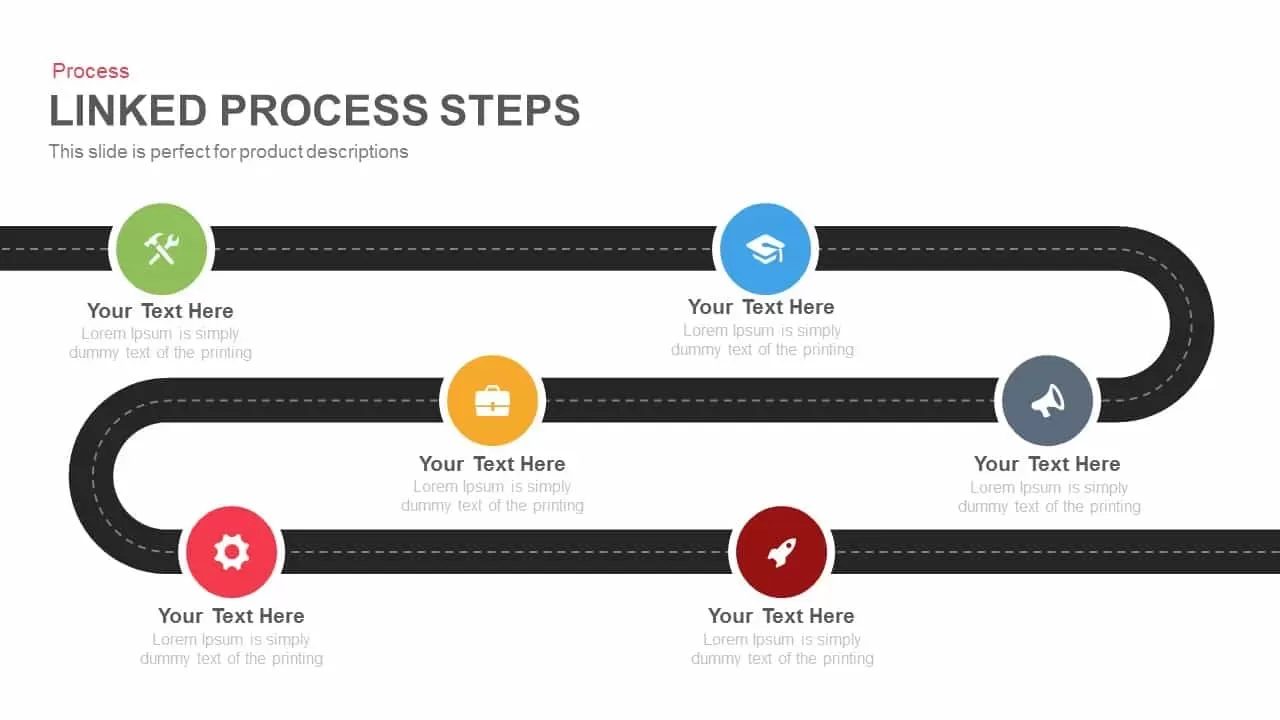
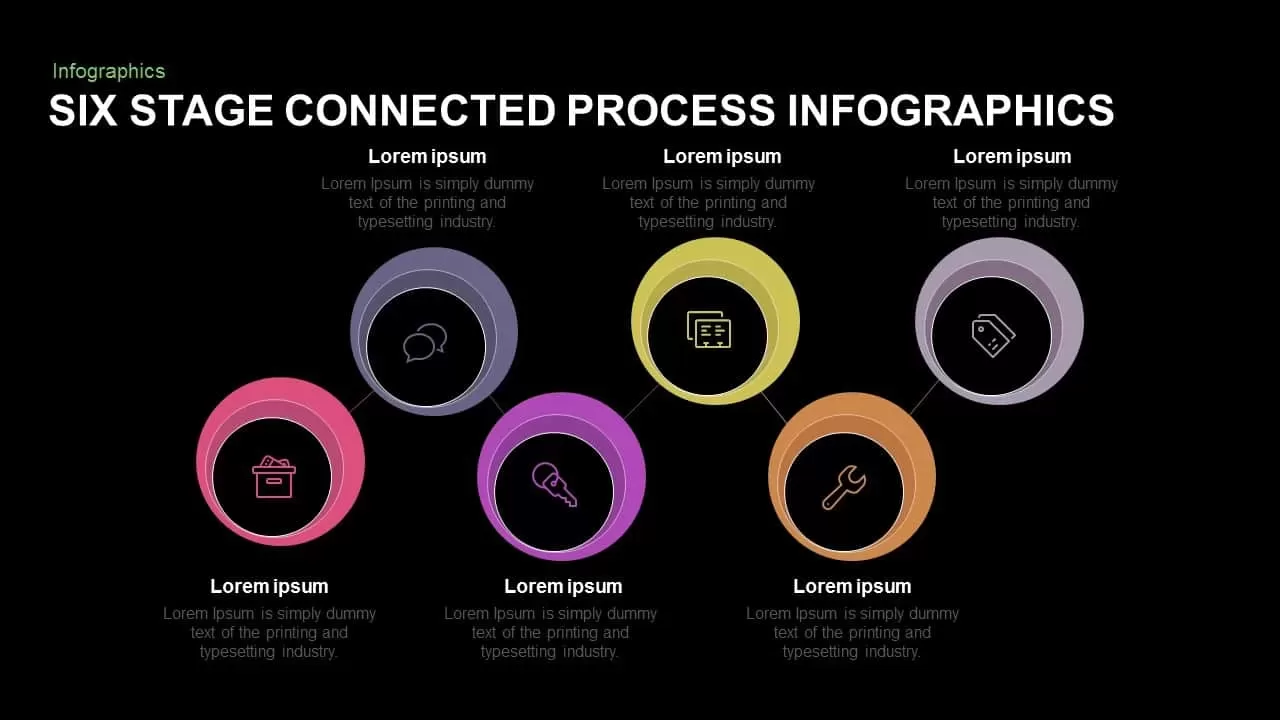
Leverage this versatile six-stage connected process infographic to visualize complex workflows, system architectures, or stakeholder interdependencies with clarity and impact. Six distinct, color-coded circular nodes are linked by sleek connector lines, guiding audiences through each step—01 through 06—in a cohesive horizontal layout. Each node features an editable vector icon placeholder above a bold headline and concise text block, enabling you to map phases such as planning, analysis, execution, monitoring, optimization, and review. Built entirely on master slides with scalable vector shapes, the template ensures seamless customization: adjust ring sizes, swap icons from the embedded 50+ symbol library, recolor segments to match your brand palette, or modify typography without compromising design integrity. Precision snap-to-grid alignment guides and optional drop shadows maintain visual hierarchy and balance, while generous white space preserves a modern, uncluttered aesthetic. Intuitive placeholders accelerate content updates, and locked layout guides support real-time collaboration in both PowerPoint and Google Slides.
Who is it for
Project managers, business analysts, process consultants, IT architects, and operations leads will benefit from this slide when illustrating multi-step workflows, system integrations, or cross-functional processes in executive briefings, client workshops, and stakeholder presentations.
Other Uses
Repurpose this connected process diagram for customer journey mapping, supply chain visualizations, risk-assessment frameworks, feature rollout plans, or performance-metric dashboards. Duplicate or remove nodes to adapt the flow for shorter or extended sequences, making it a versatile asset across industries.
Login to download this file

Item ID
SB00607
Related Templates

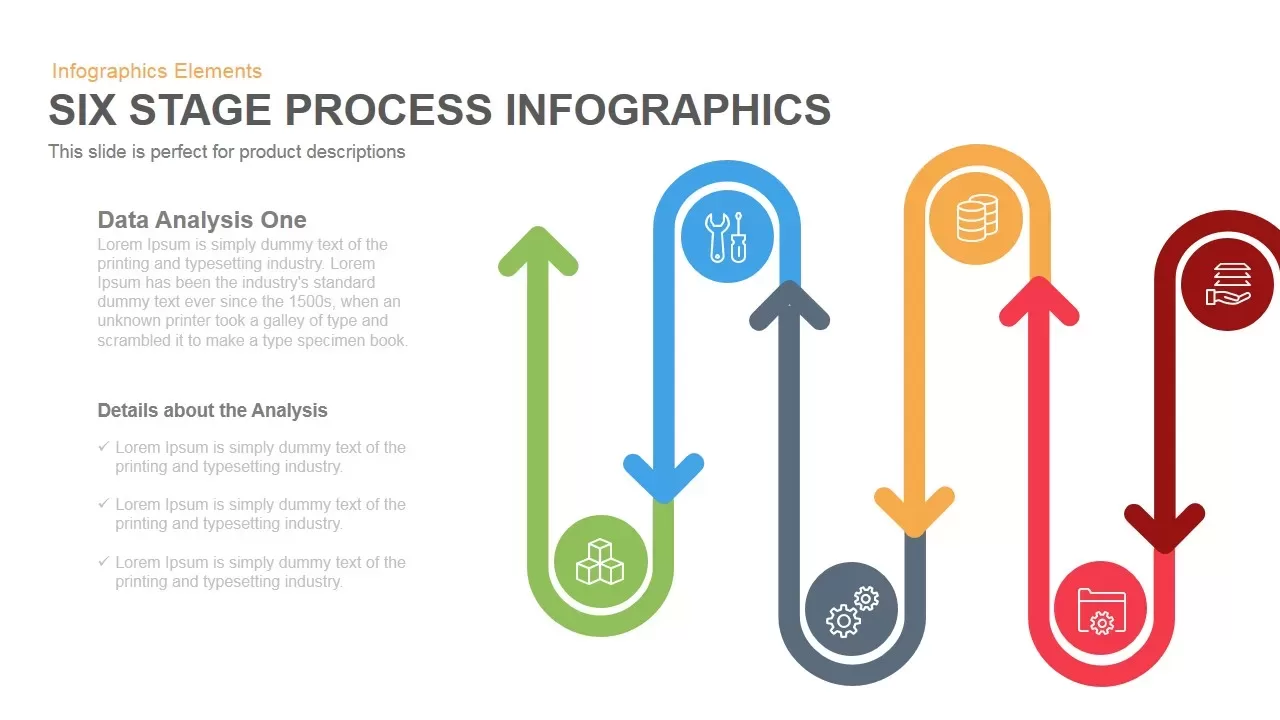
Six-Stage Process Infographics Template for PowerPoint & Google Slides
Process
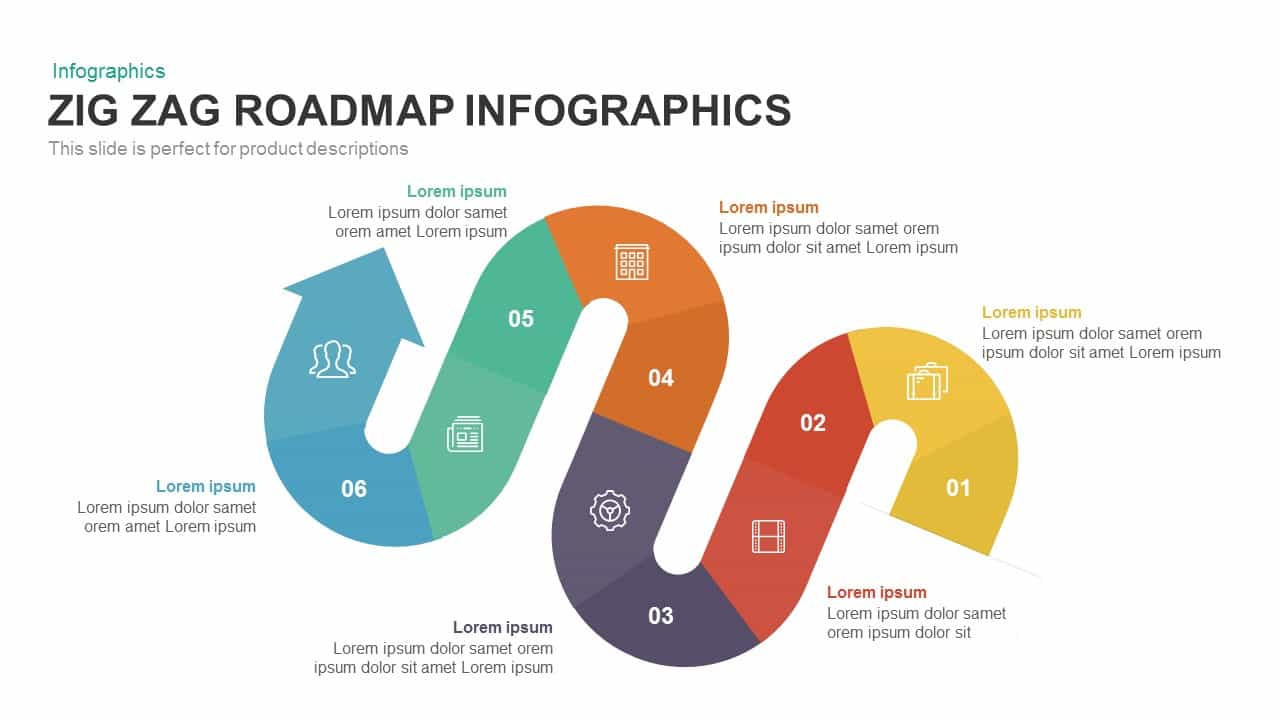
Six-Stage Zig-Zag Roadmap Infographics Template for PowerPoint & Google Slides
Roadmap
Six-Stage Time Arrow Infographics Template for PowerPoint & Google Slides
Arrow
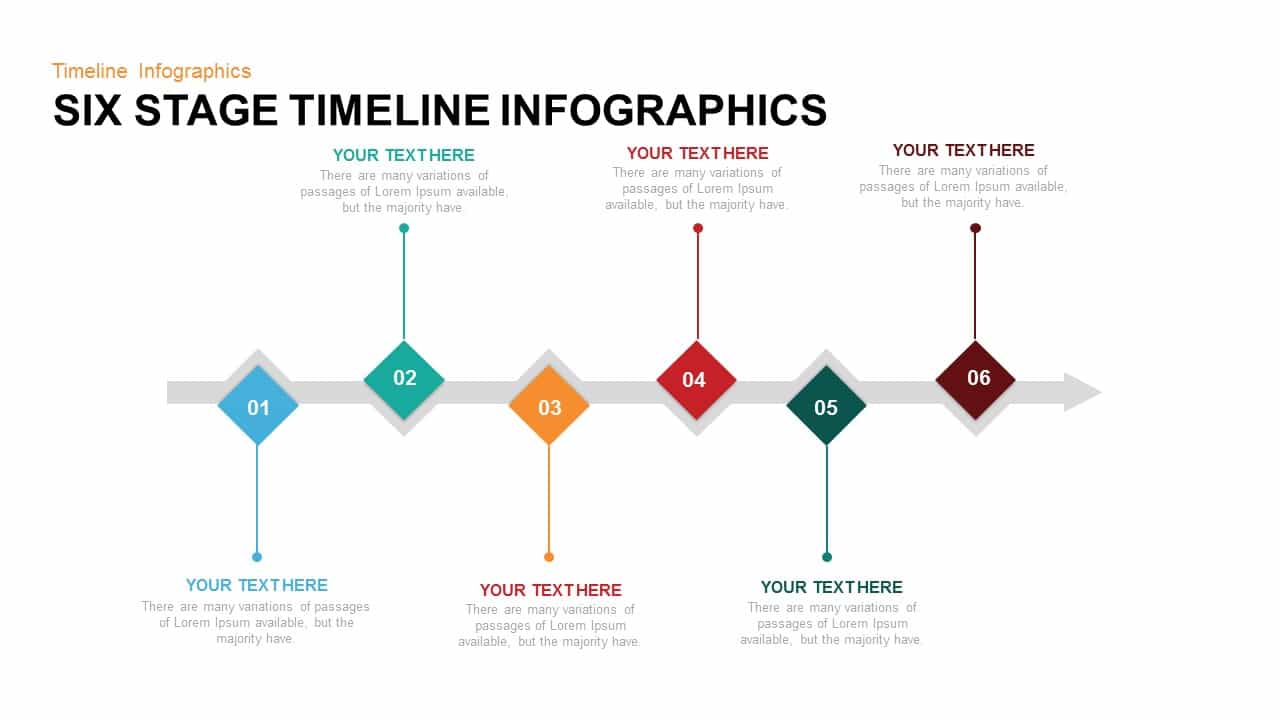
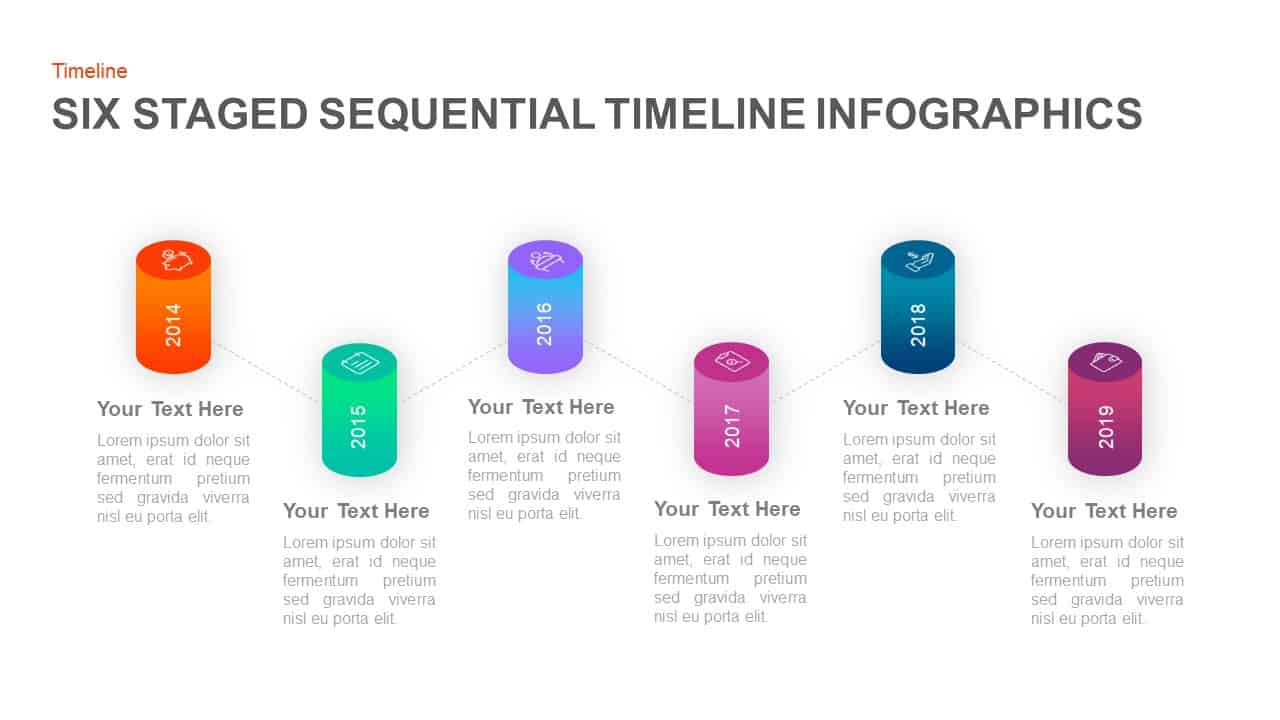
Six Stage Timeline Infographics Template for PowerPoint & Google Slides
Timeline
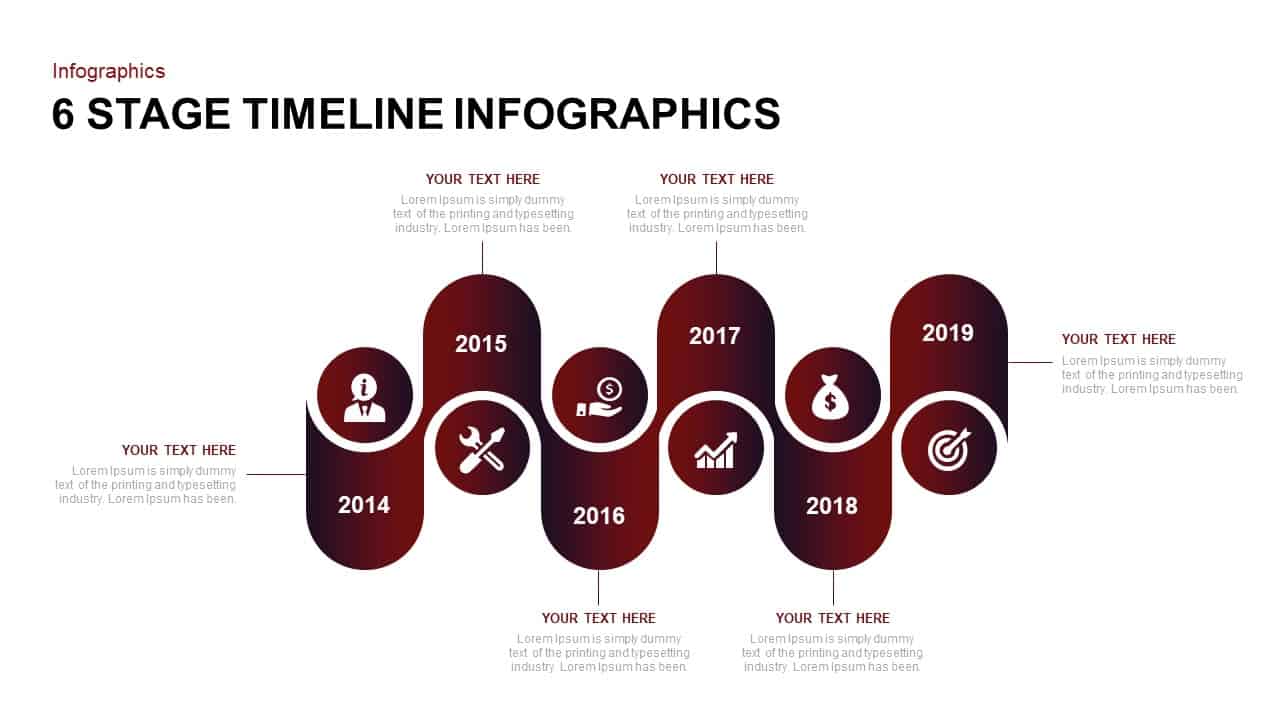
Six-Stage Timeline Infographics Slide Template for PowerPoint & Google Slides
Timeline
Six Stage Zigzag Process Diagram Template for PowerPoint & Google Slides
Process
Six-Stage Zig-Zag Process Flow Diagram Template for PowerPoint & Google Slides
Process
Free Six Stage Bubble Process Diagram template for PowerPoint & Google Slides
Process
Free

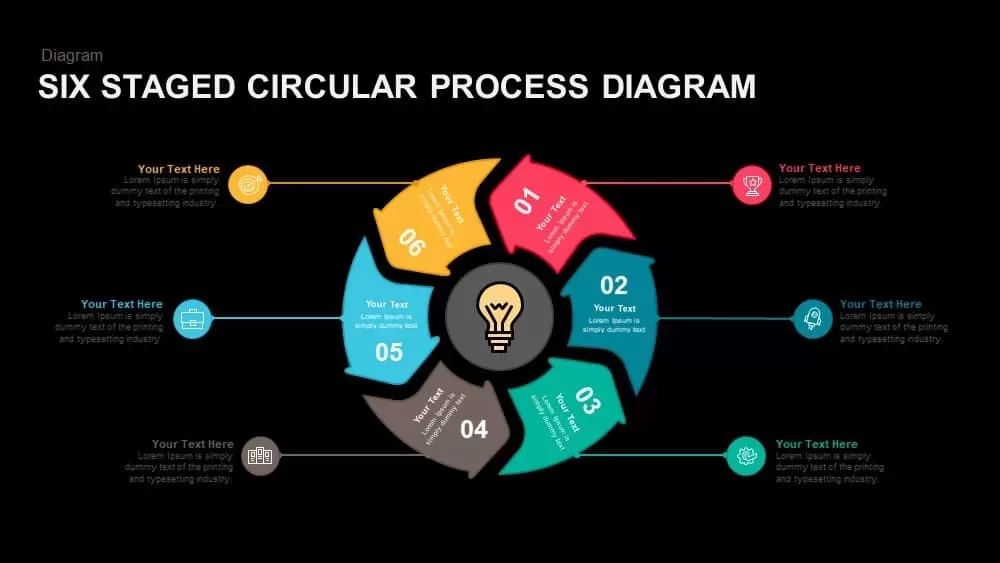
Six-Stage Circular Process Diagram Template for PowerPoint & Google Slides
Process
Six-Stage Circle Process Diagram Template for PowerPoint & Google Slides
Process
Free Six-Stage Arrow Process Diagram Template for PowerPoint & Google Slides
Process
Free
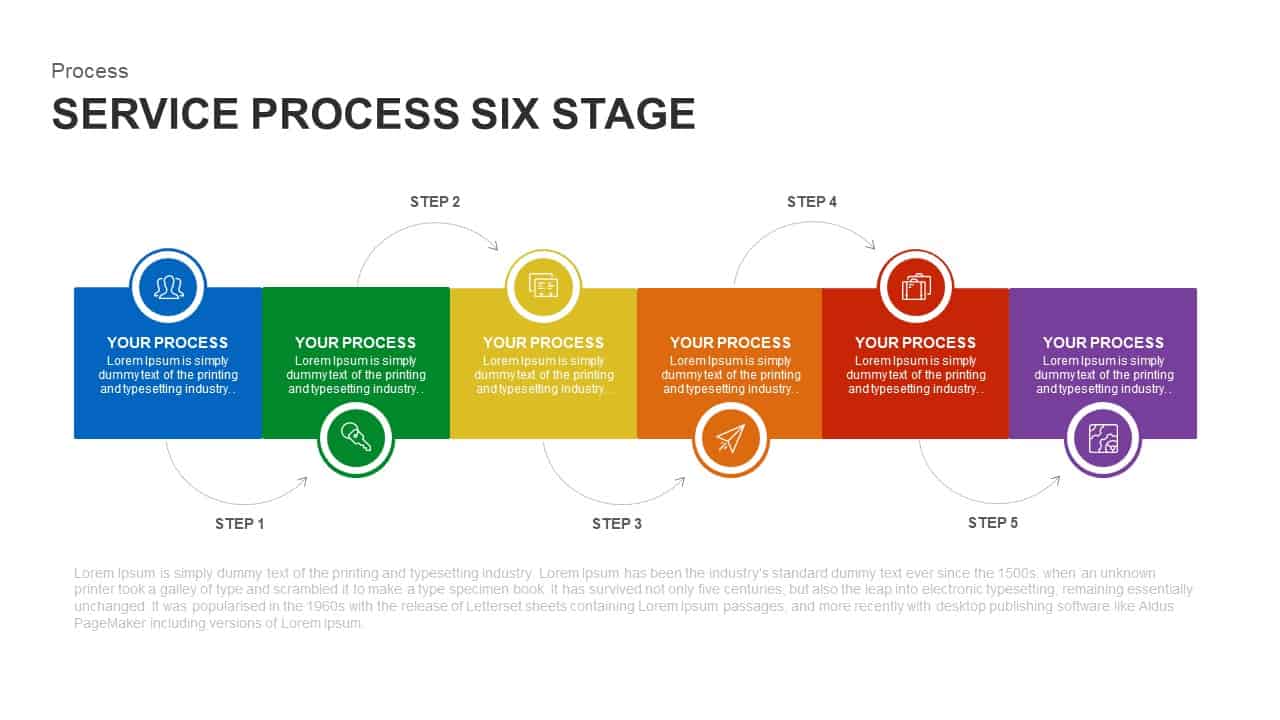
Six-Stage Service Process Workflow Template for PowerPoint & Google Slides
Process
Six-Stage Circular Diagram Process Template for PowerPoint & Google Slides
Circular
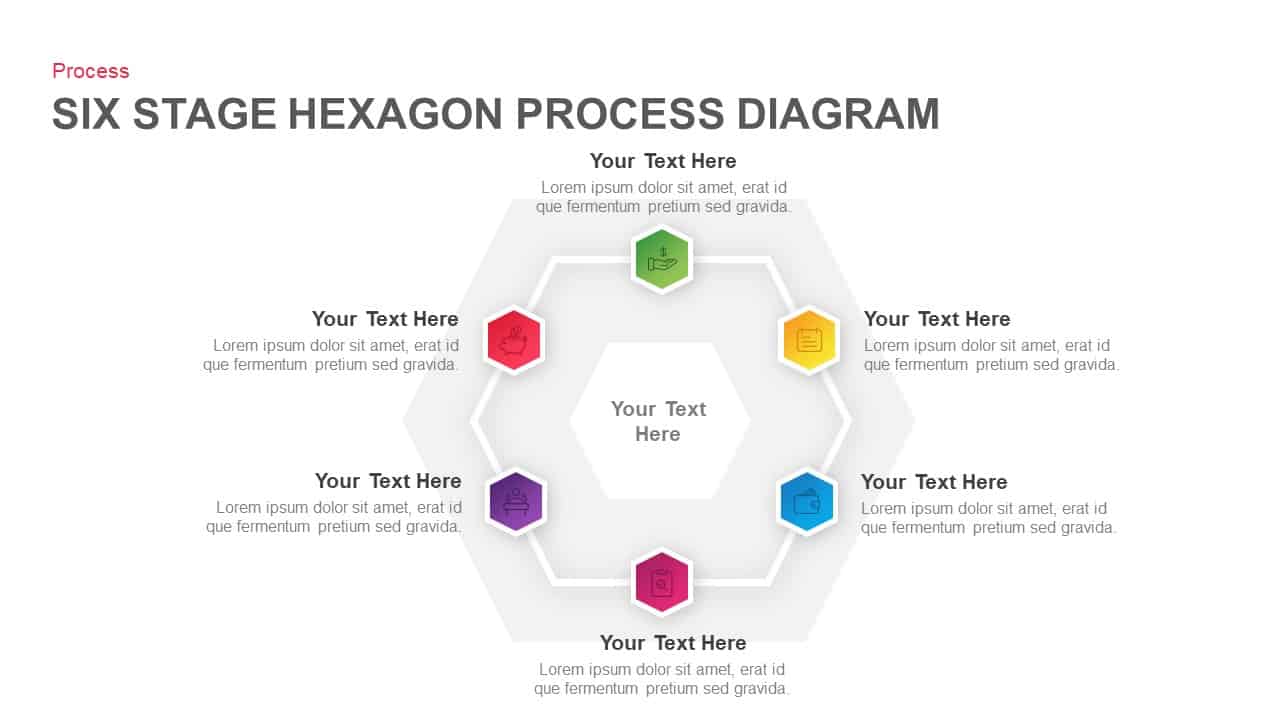
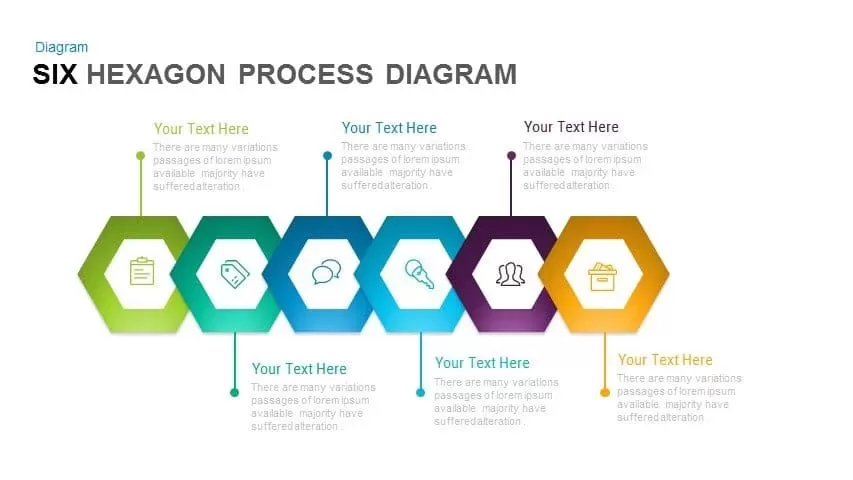
Six Stage Hexagon Process Diagram Template for PowerPoint & Google Slides
Process
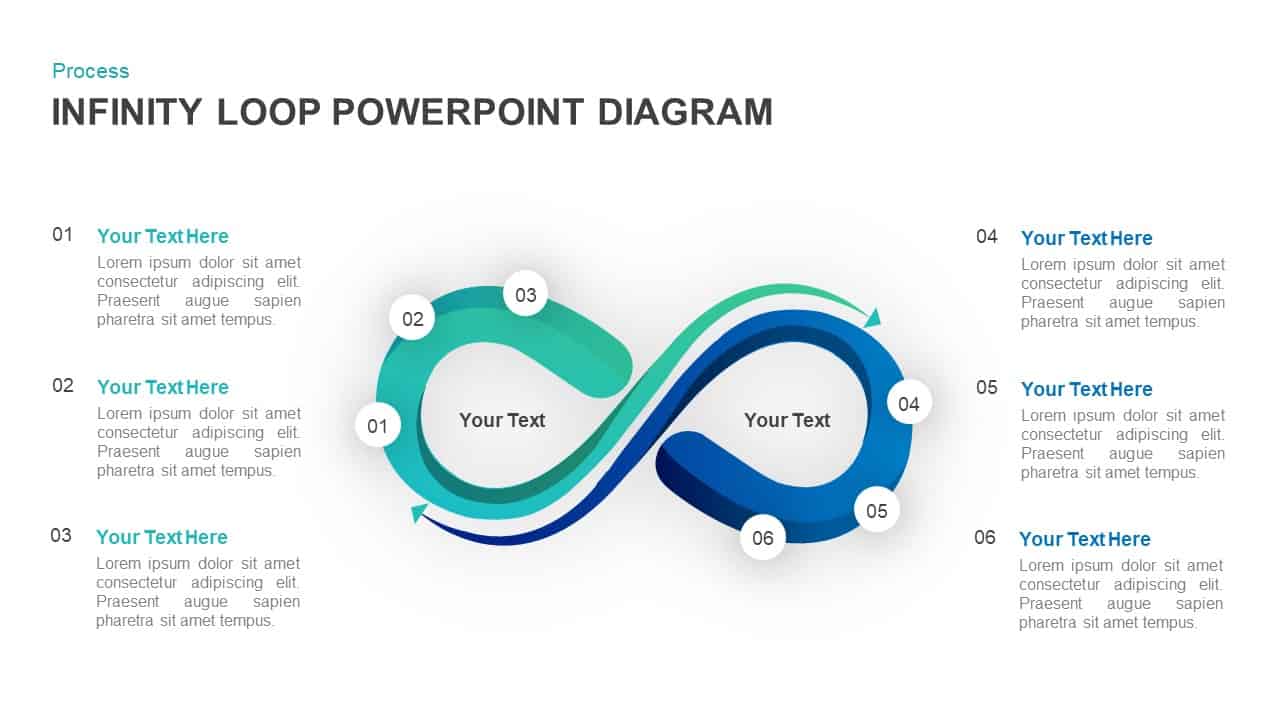
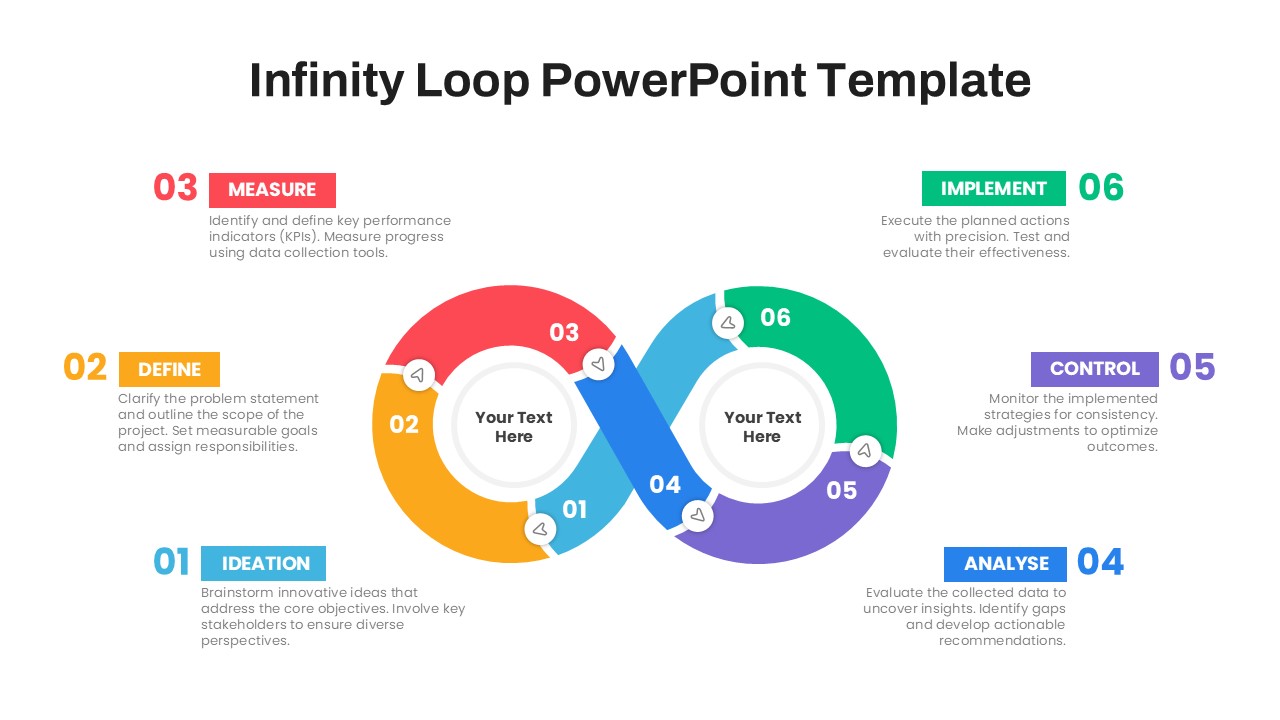
Six-Stage Infinity Loop Process Diagram Template for PowerPoint & Google Slides
Process
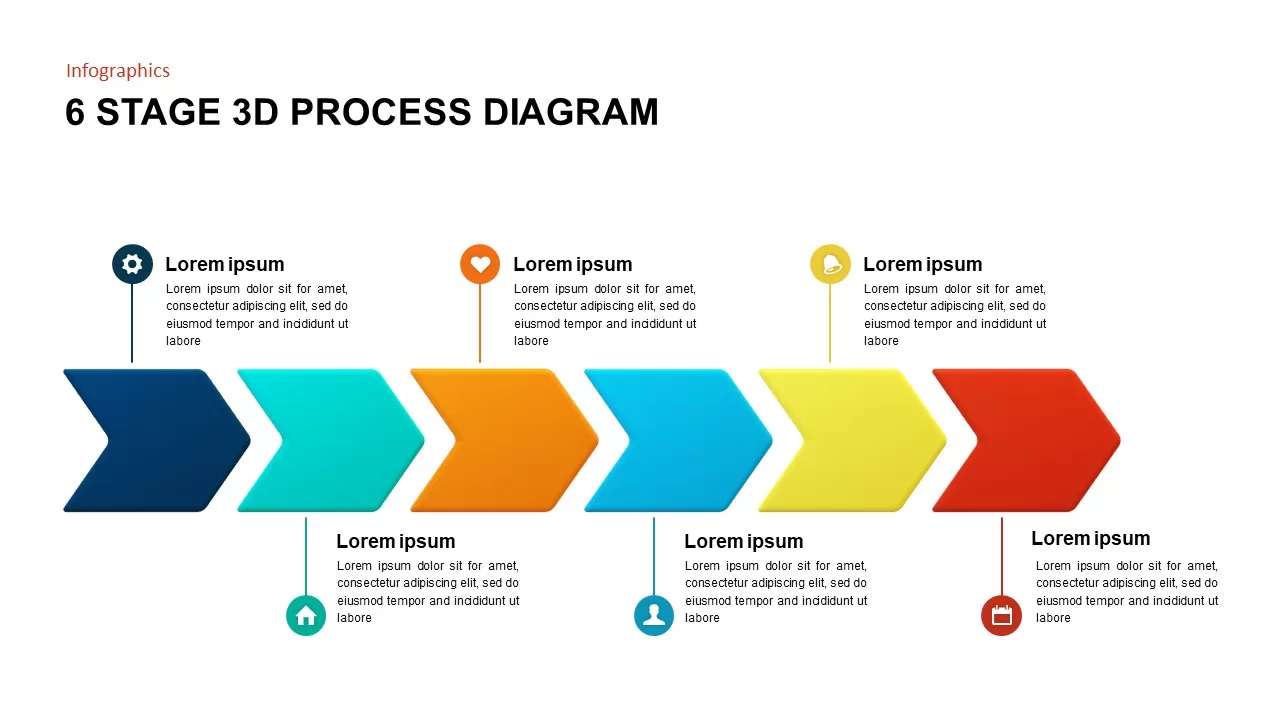
Animated Six-Stage 3D Process Diagram Template for PowerPoint & Google Slides
Arrow
Six-Stage Pyramid Process Slide Template for PowerPoint & Google Slides
Pyramid
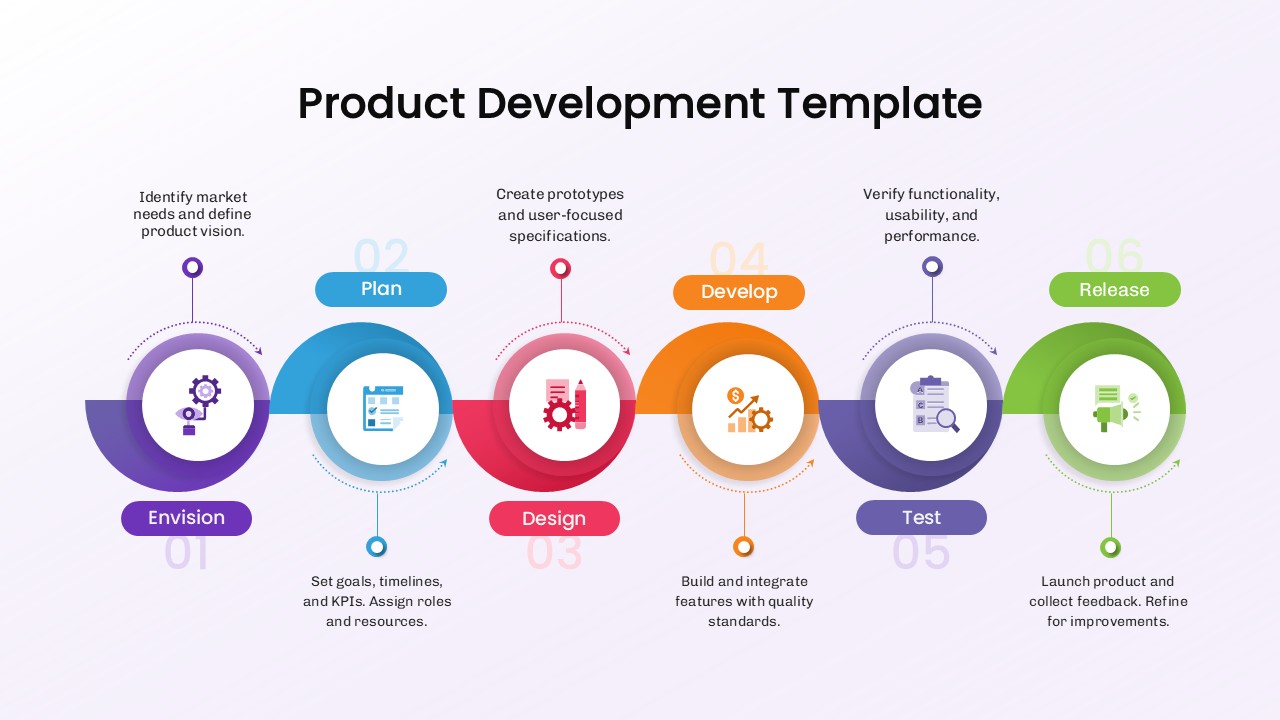
Six Stage Product Development Process Template for PowerPoint & Google Slides
Software Development
Connected Bubble Network Infographic Template for PowerPoint & Google Slides
Circular

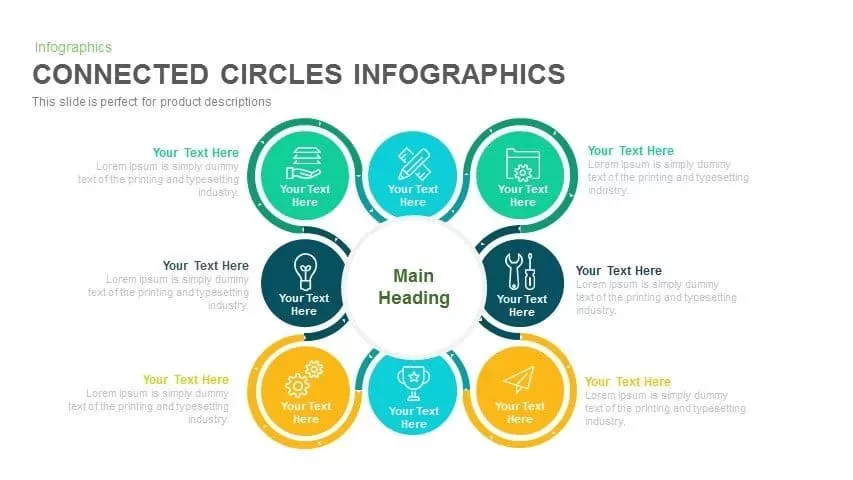
Radial Connected Circles Infographic Template for PowerPoint & Google Slides
Circular
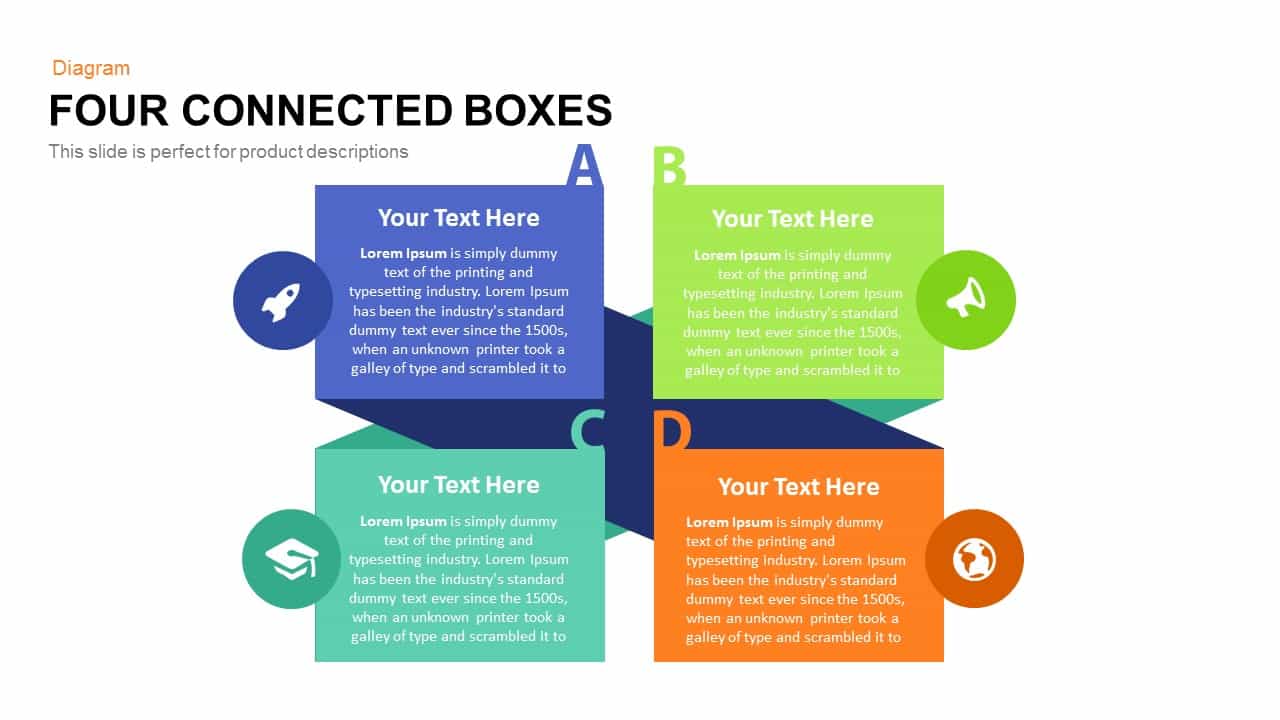
Simple Four Connected Boxes Diagram Template for PowerPoint & Google Slides
Business Models
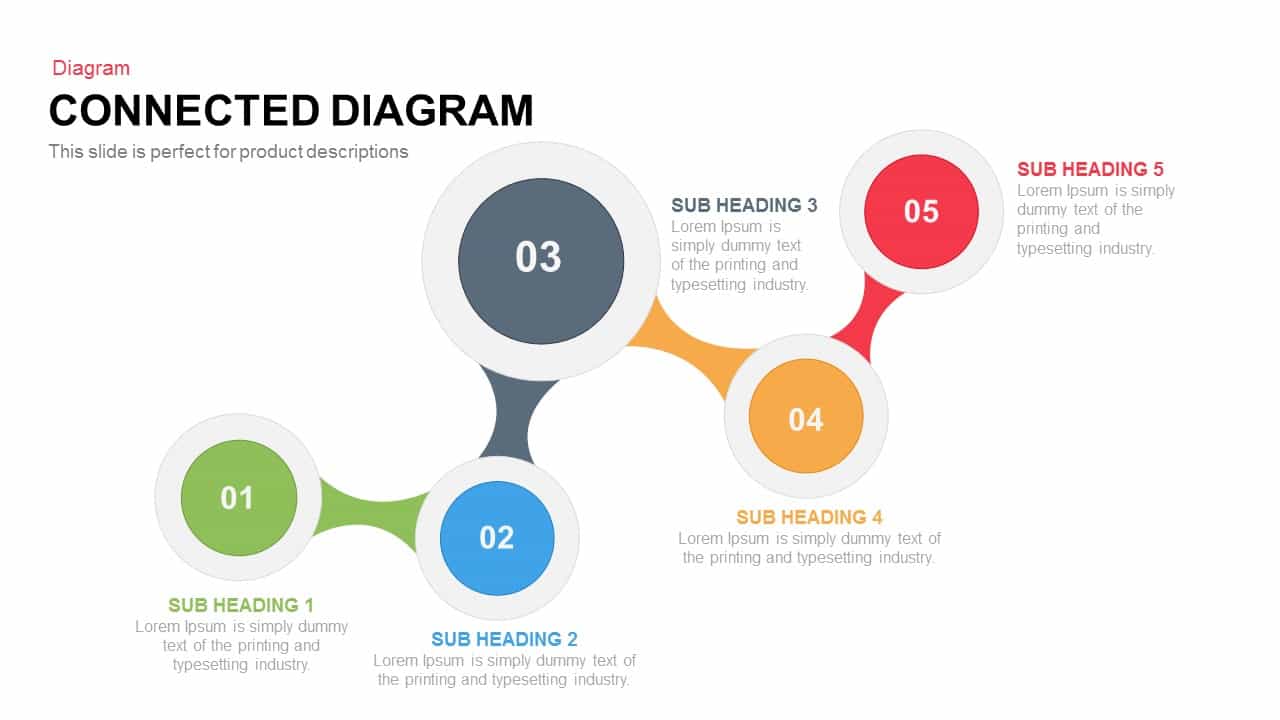
Interactive Connected Network Diagram Template for PowerPoint & Google Slides
Process
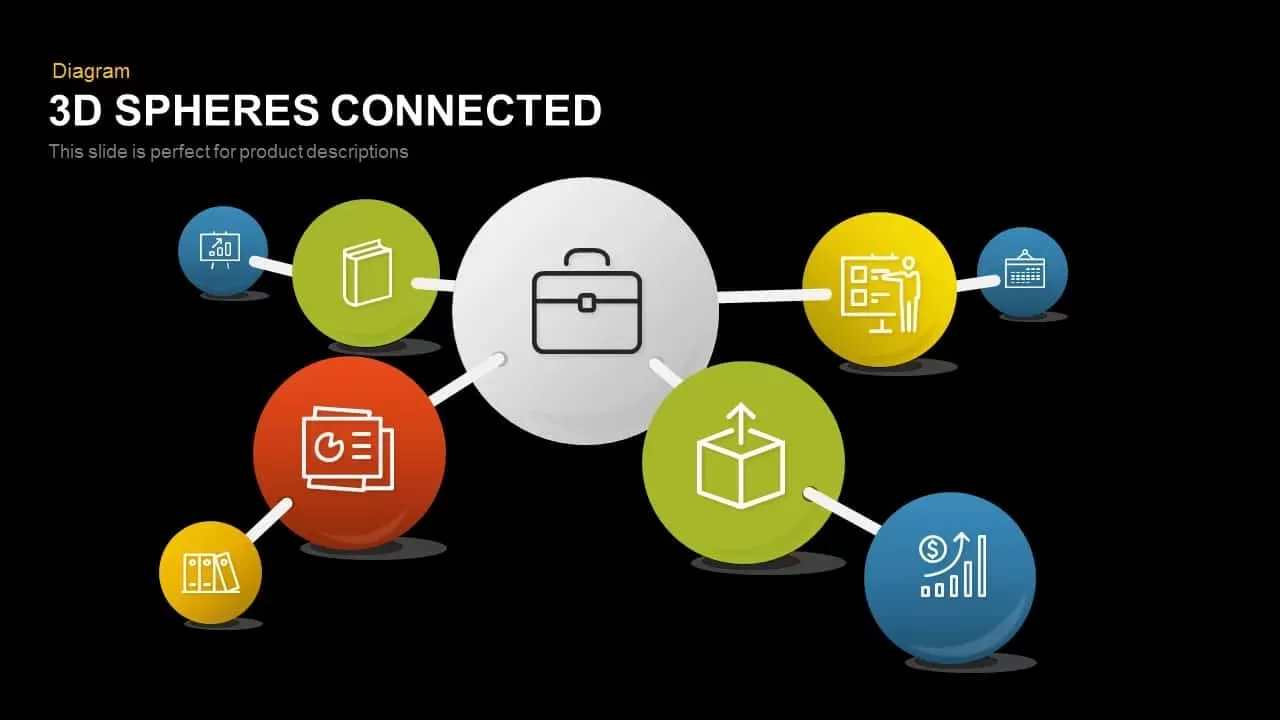
3D Spheres Connected Diagram for PowerPoint & Google Slides
Process
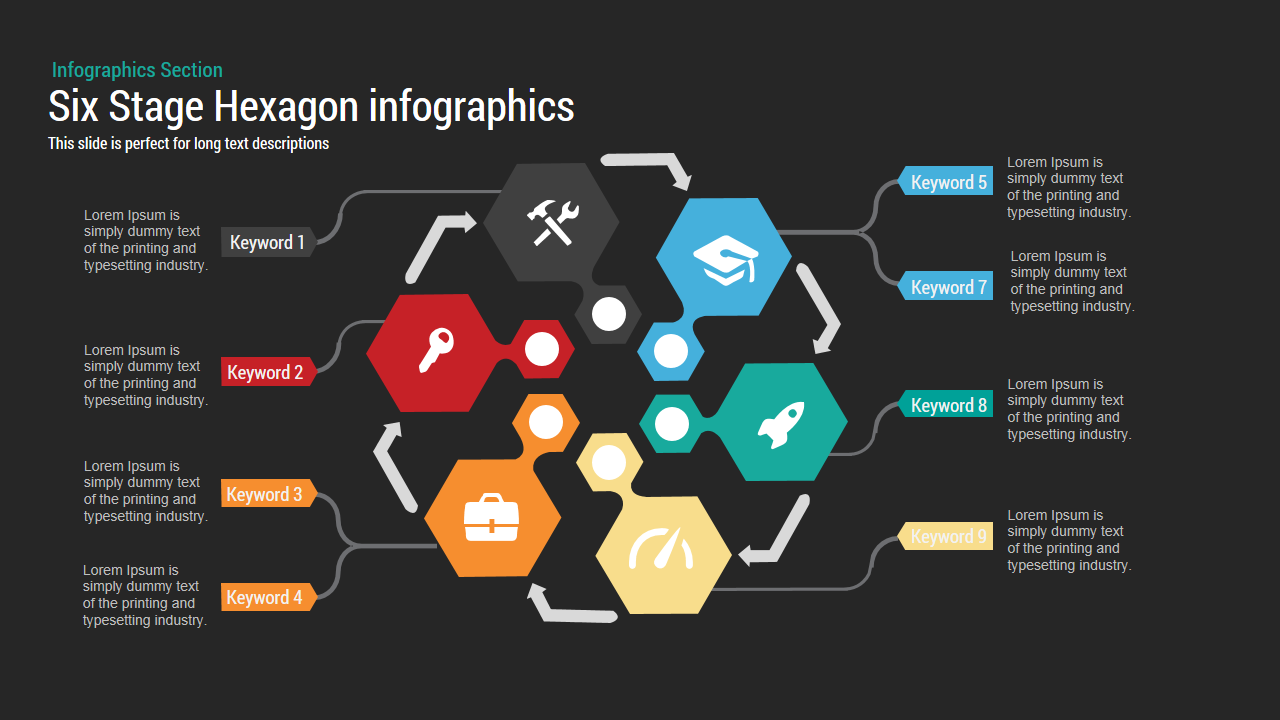
Six-Stage Hexagon template for PowerPoint & Google Slides
Process
Six-Stage Semi-Circle Diagram with Icons Template for PowerPoint & Google Slides
Circular
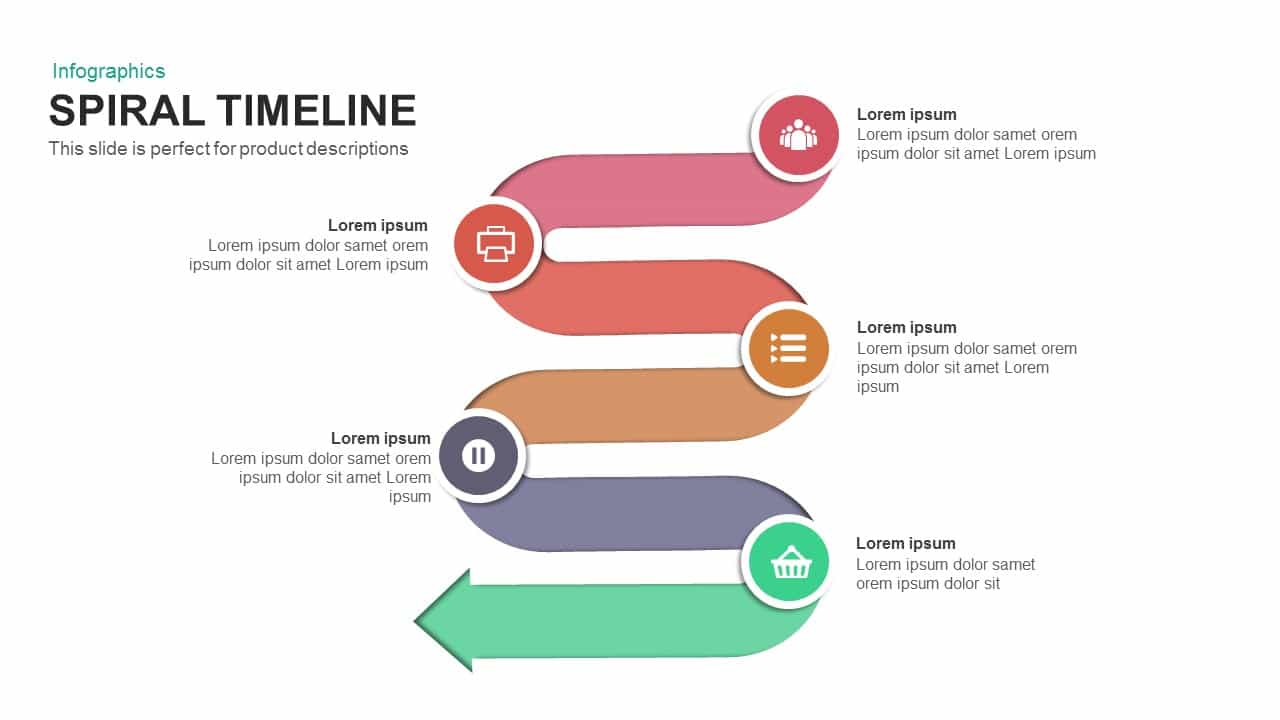
Six-Stage Colorful Spiral Timeline Template for PowerPoint & Google Slides
Timeline
Six-Stage Circular Cycle Diagram Template for PowerPoint & Google Slides
Process
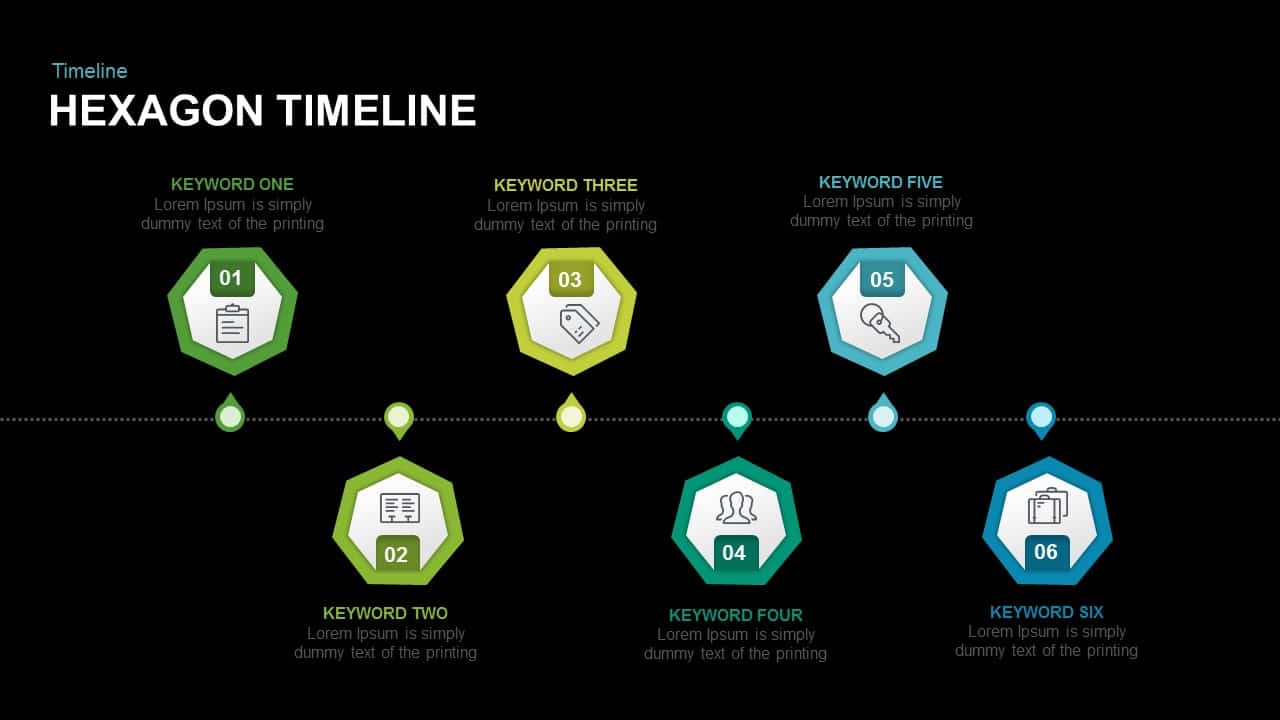
Six-Stage Hexagon Timeline Infographic Template for PowerPoint & Google Slides
Timeline
Six Stage Circular Diagram with Icons Template for PowerPoint & Google Slides
Circular
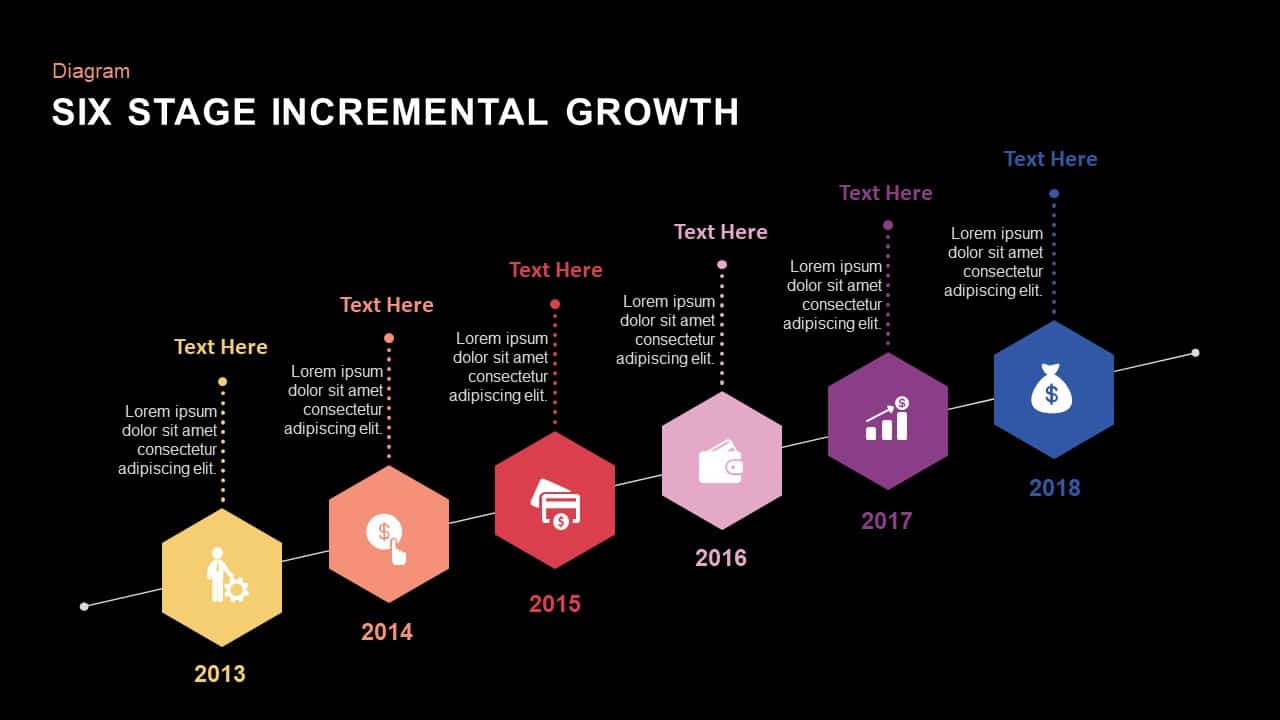
Six Stage Incremental Growth template for PowerPoint & Google Slides
Timeline
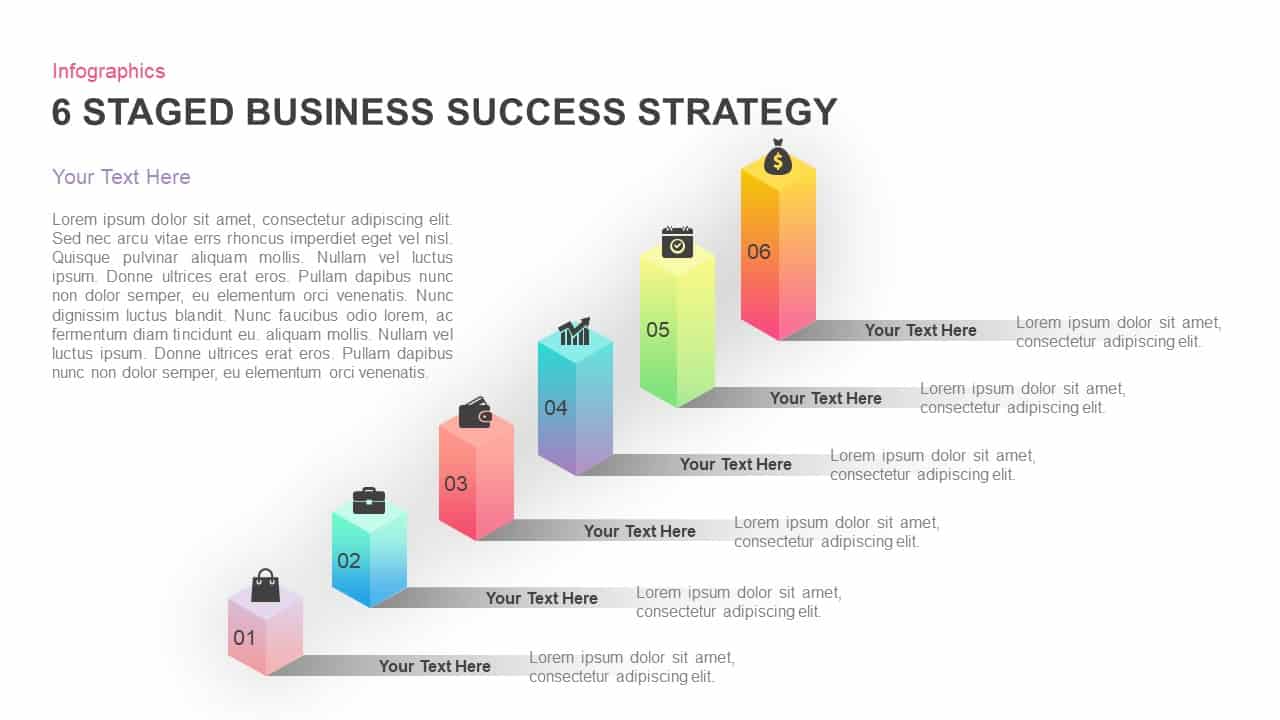
Six-Stage Business Success Strategy Template for PowerPoint & Google Slides
Business Strategy
Six-Stage Gear Wheel Diagram Template for PowerPoint & Google Slides
Circular
Six-Stage Arrow Timeline Diagram Template for PowerPoint & Google Slides
Timeline
Six-Stage Timeline Infographic Template for PowerPoint & Google Slides
Timeline
Six-Stage Clockwise Circular Diagram Template for PowerPoint & Google Slides
Circular
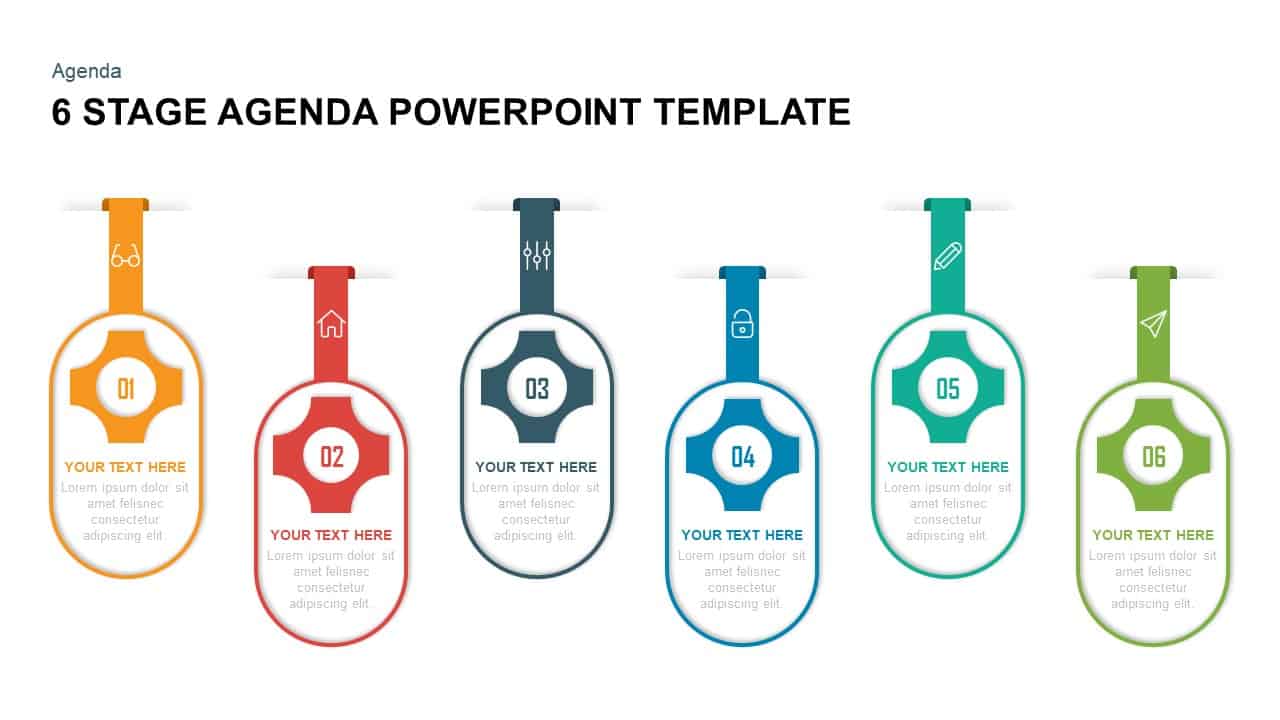
Six Stage Agenda Timeline Diagram template for PowerPoint & Google Slides
Agenda
Six-Stage Circular Flow Diagram Template for PowerPoint & Google Slides
Circular
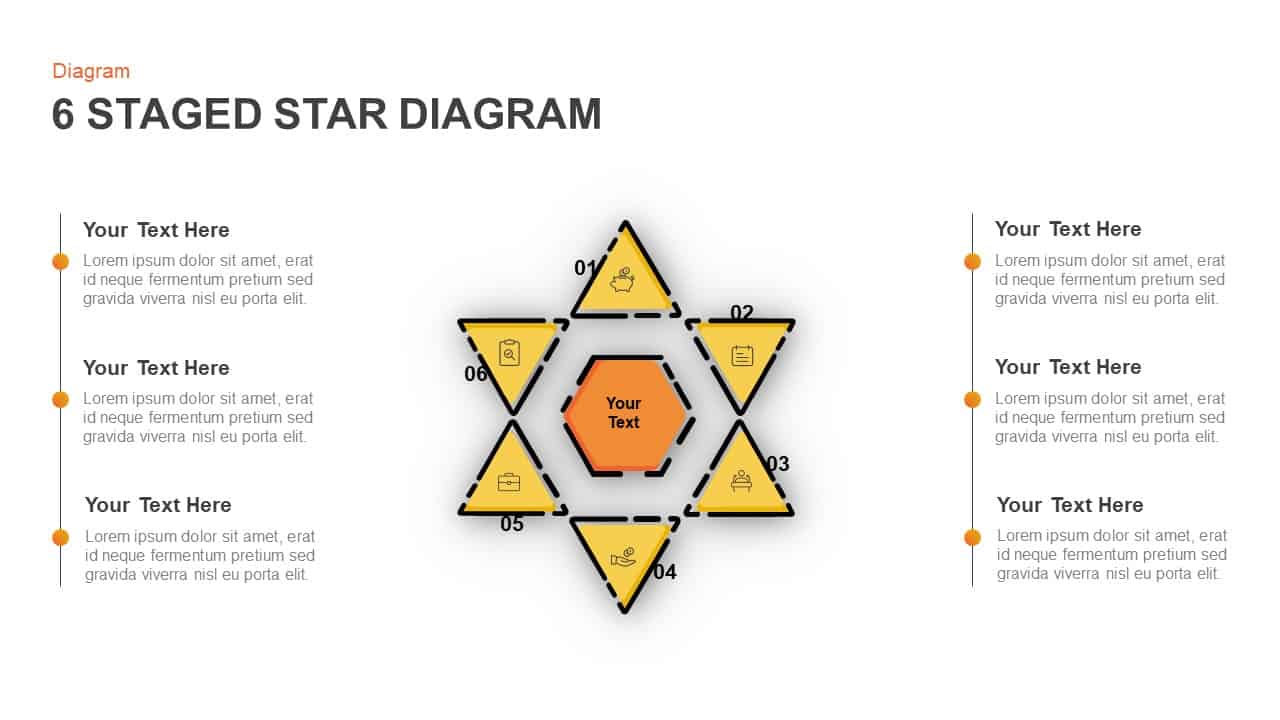
Six-Stage Star Diagram Infographic Template for PowerPoint & Google Slides
Process

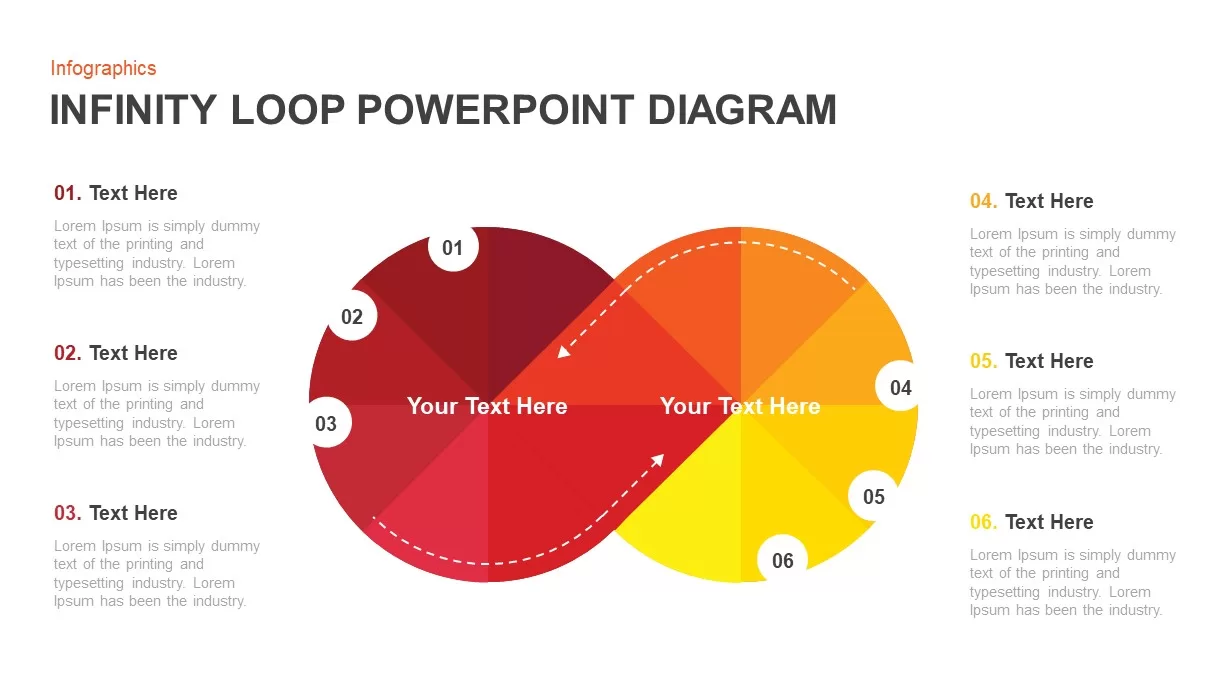
Six-Stage Infinity Loop Diagram Template for PowerPoint & Google Slides
Process
Six-Stage Road Map Infographic Timeline Template for PowerPoint & Google Slides
Roadmap
Six Stage Timeline Diagram for PowerPoint & Google Slides
Timeline
Five and Six Step Line Linear Stage Diagram for PowerPoint & Google Slides
Infographics
5-Stage Arrow Infographics Process Flow Template for PowerPoint & Google Slides
Arrow
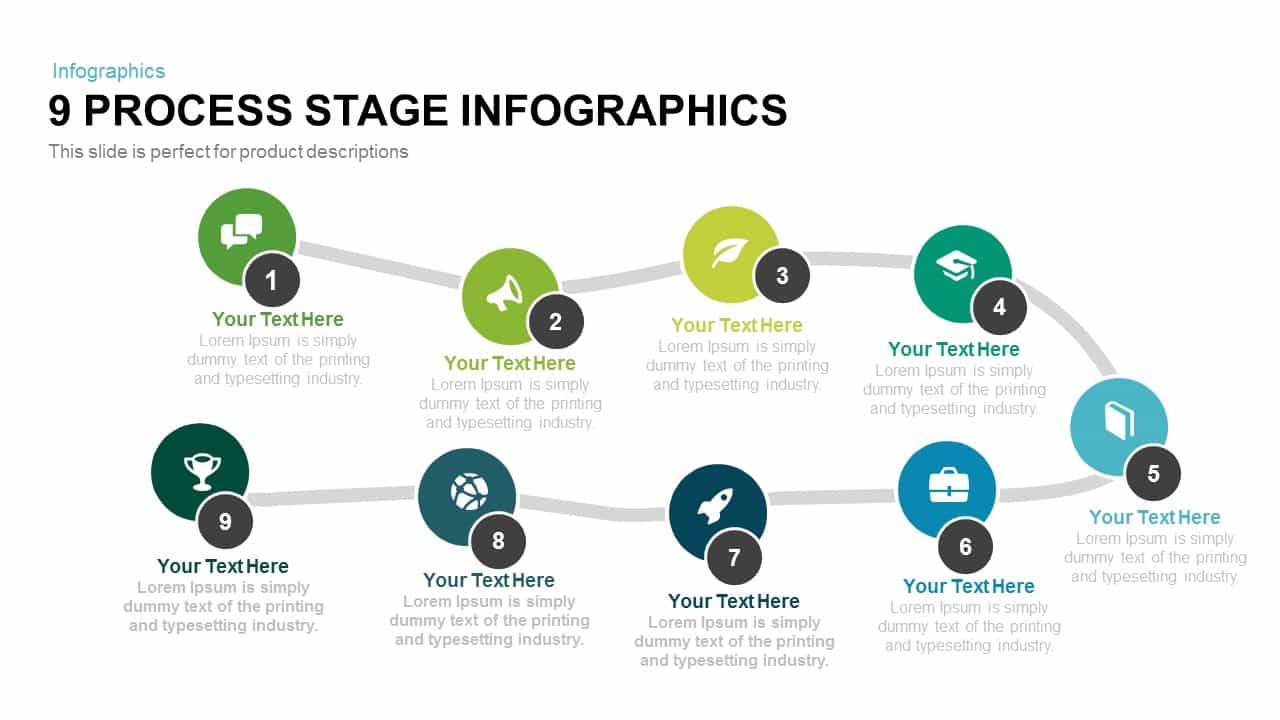
9 Process Stage Infographics template for PowerPoint & Google Slides
Process
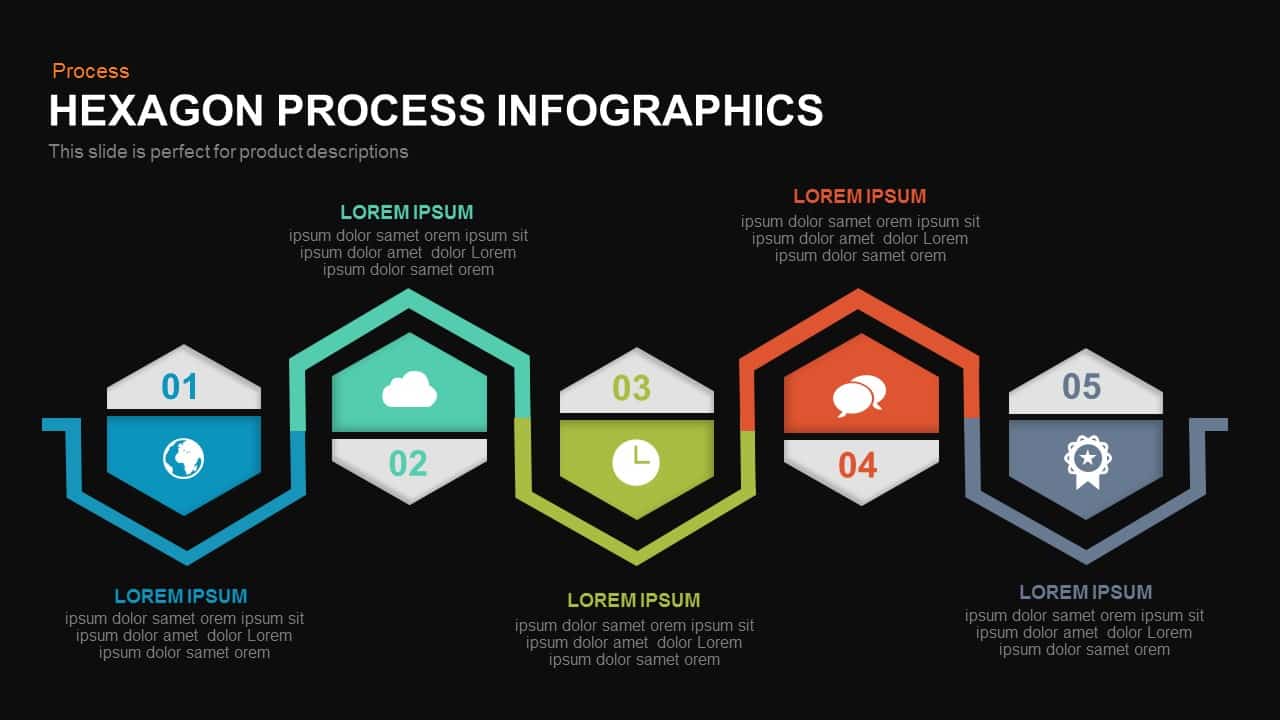
Five-Stage Hexagon Process Infographics template for PowerPoint & Google Slides
Process
Five-Stage Pyramid Infographics Process Template for PowerPoint & Google Slides
Pyramid
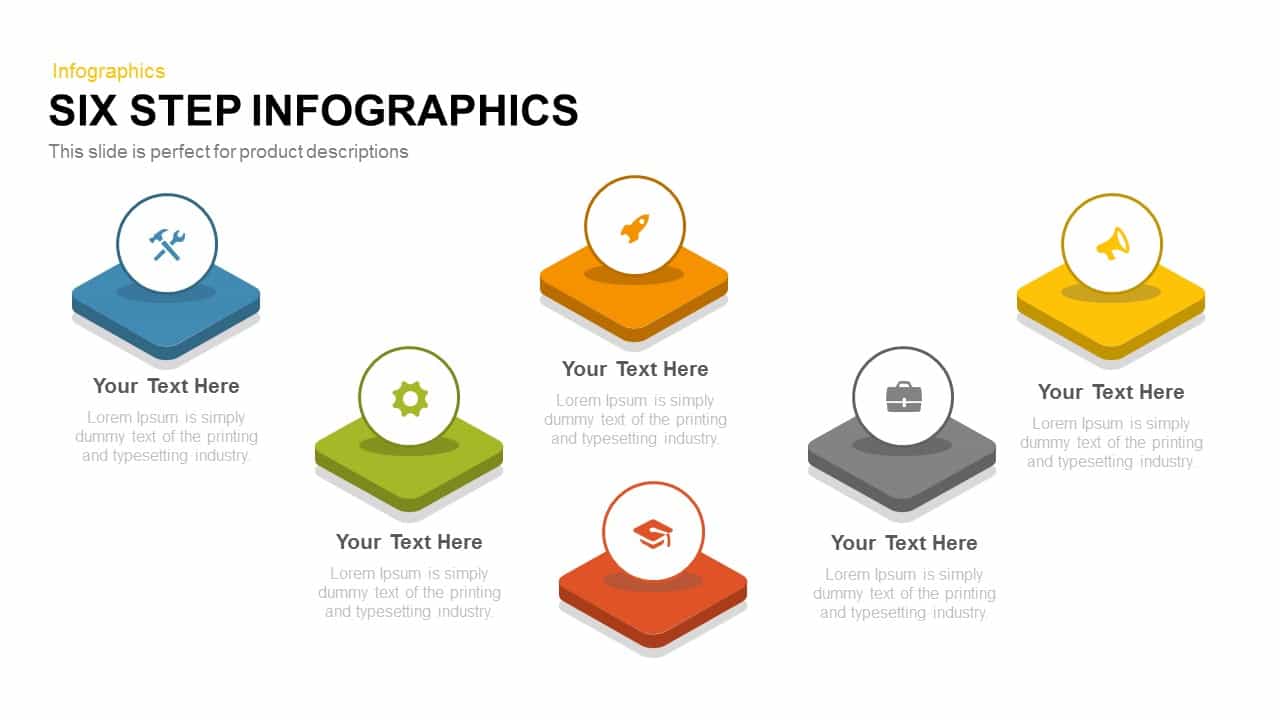
Six-Step Infographics Template for PowerPoint & Google Slides
Process
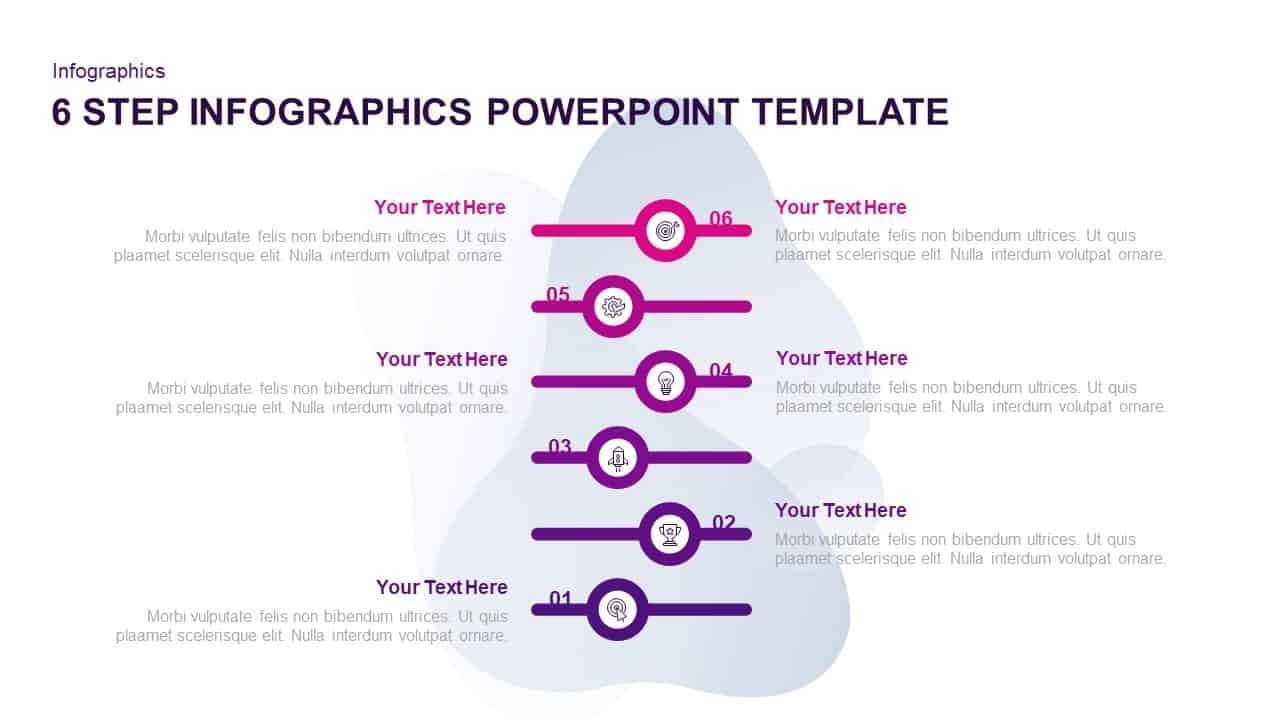
Six-Step Purple Gradient Infographics Template for PowerPoint & Google Slides
Process
Six-Step Circular Diagram Infographics Template for PowerPoint & Google Slides
Circular
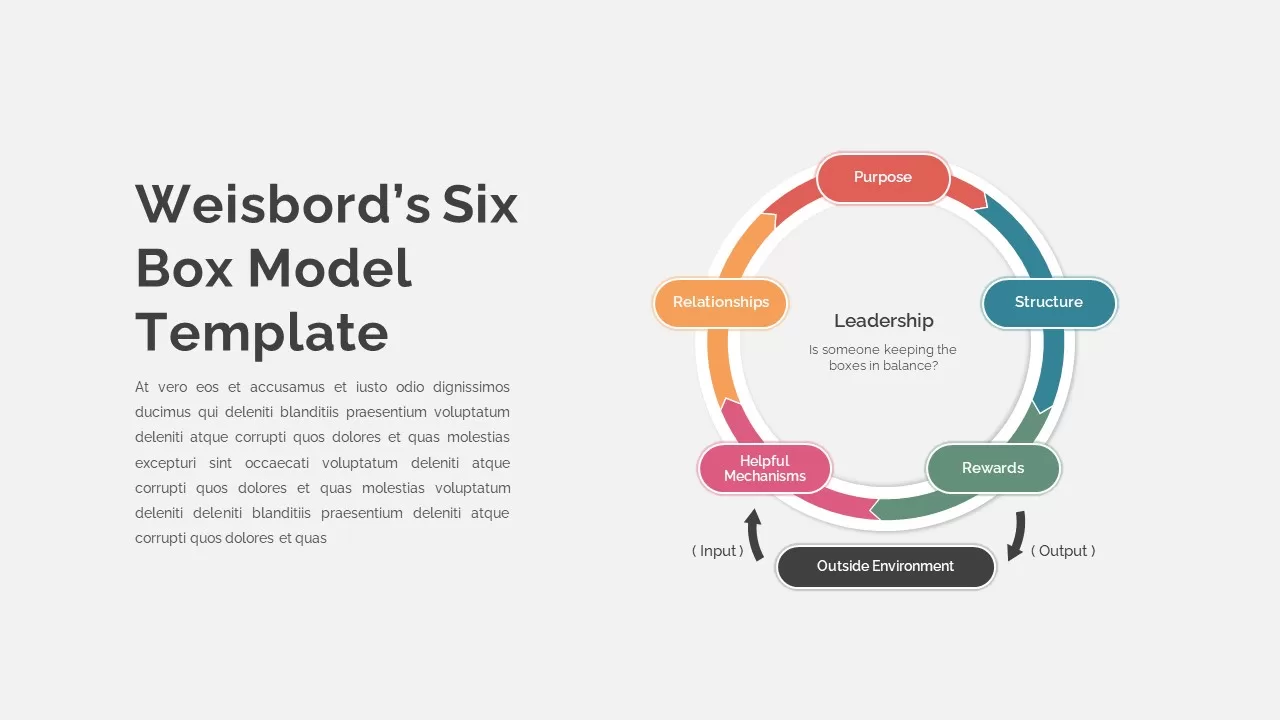
Weisbord’s Six Box Model Infographics Template for PowerPoint & Google Slides
Circular
Six Arrow Radial Process Diagram template for PowerPoint & Google Slides
Infographics
Six Hexagon Stages Process Flow Diagram Template for PowerPoint & Google Slides
Process
Roadmap Six-Step Process Diagram Template for PowerPoint & Google Slides
Roadmap
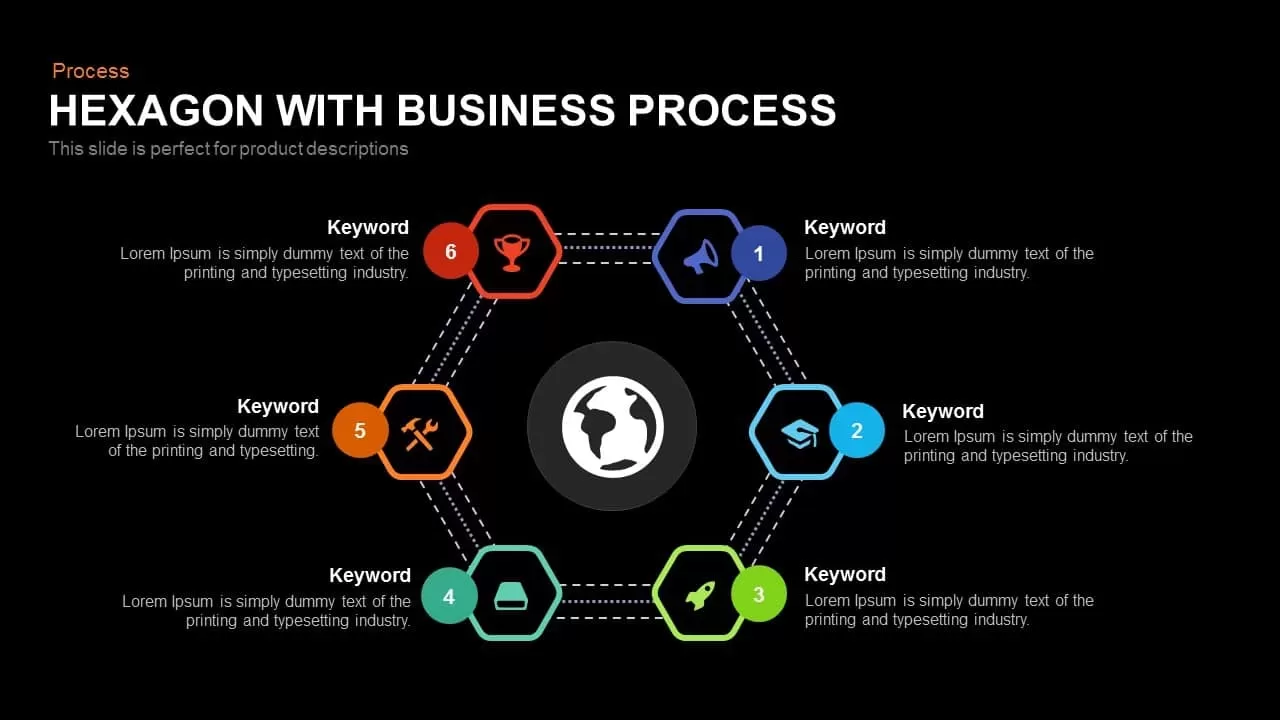
Global Hexagon Six-Step Business Process Template for PowerPoint & Google Slides
Process
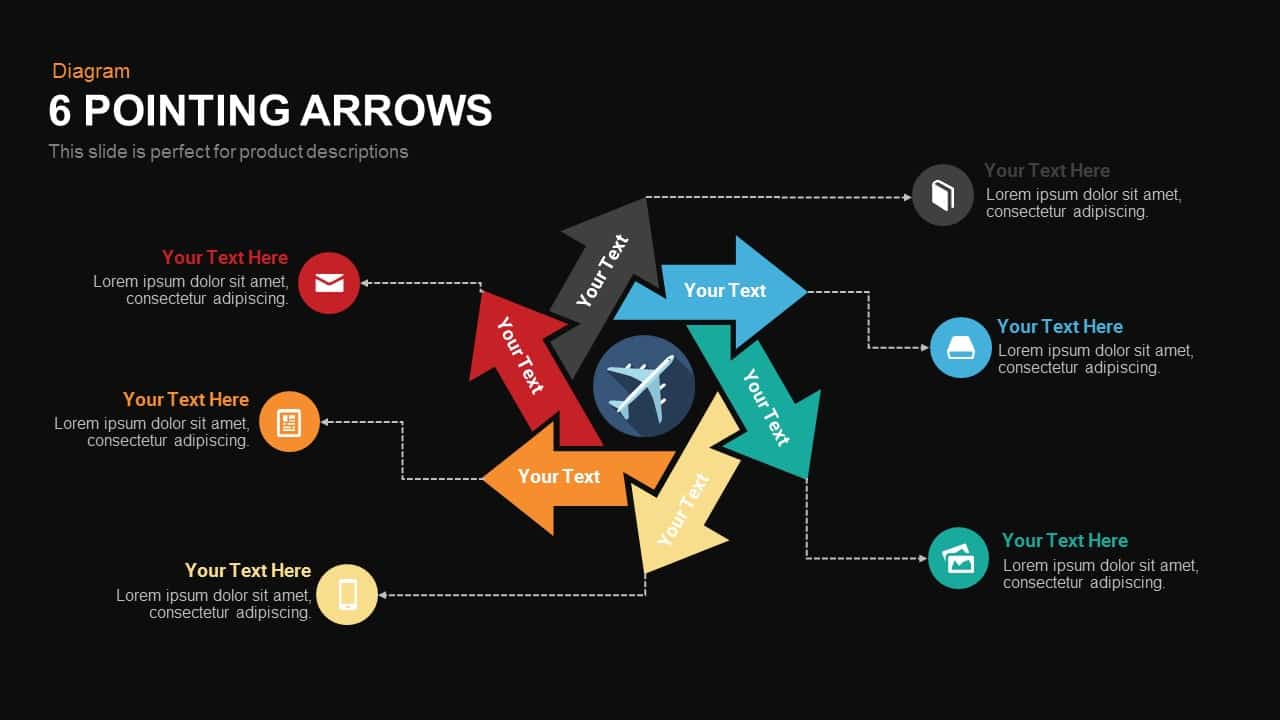
Six Pointing Arrow Process Diagram Template for PowerPoint & Google Slides
Arrow
Six-Sided Shutter Diagram Process Flow Template for PowerPoint & Google Slides
Process
Editable Six-Step Bubble Process Diagram Template for PowerPoint & Google Slides
Process
Six-Process Circular Arrow Diagram Template for PowerPoint & Google Slides
Circular
Six-Step Hexagon Process Diagram Template for PowerPoint & Google Slides
Process
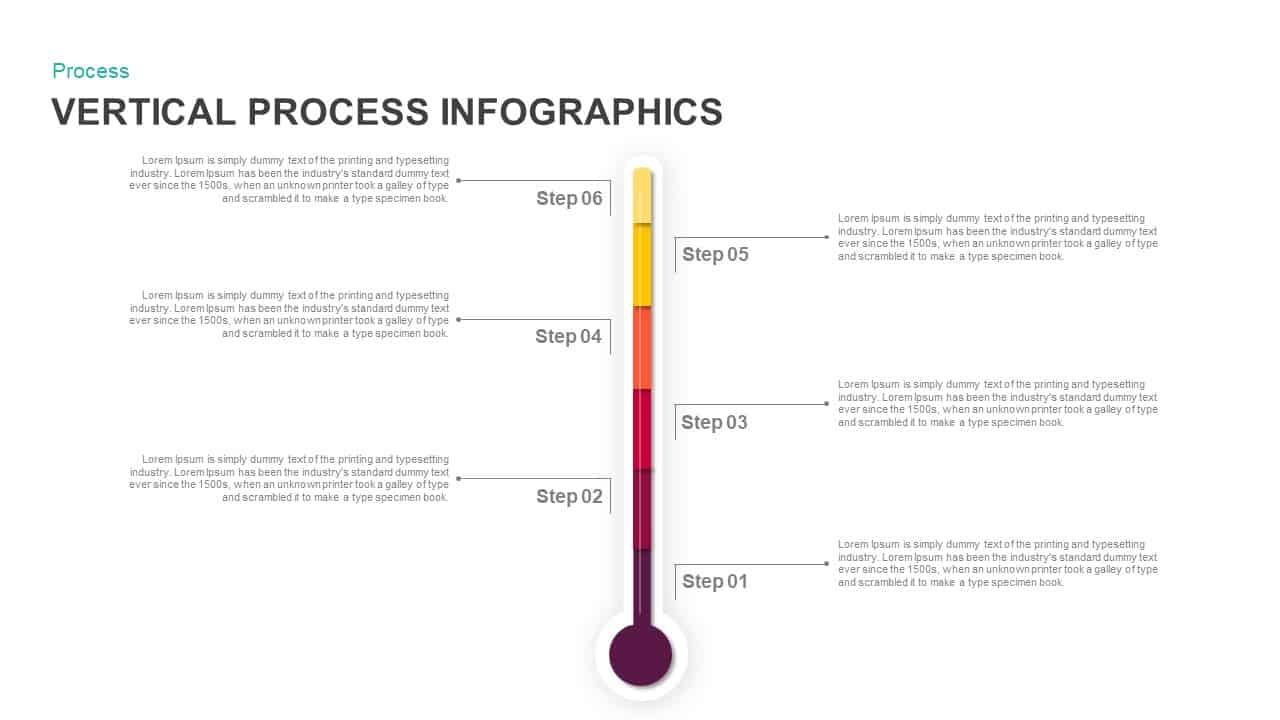
Six-Step Vertical Process Diagram Template for PowerPoint & Google Slides
Process
Six Sigma Gear Process Diagram Template for PowerPoint & Google Slides
Process
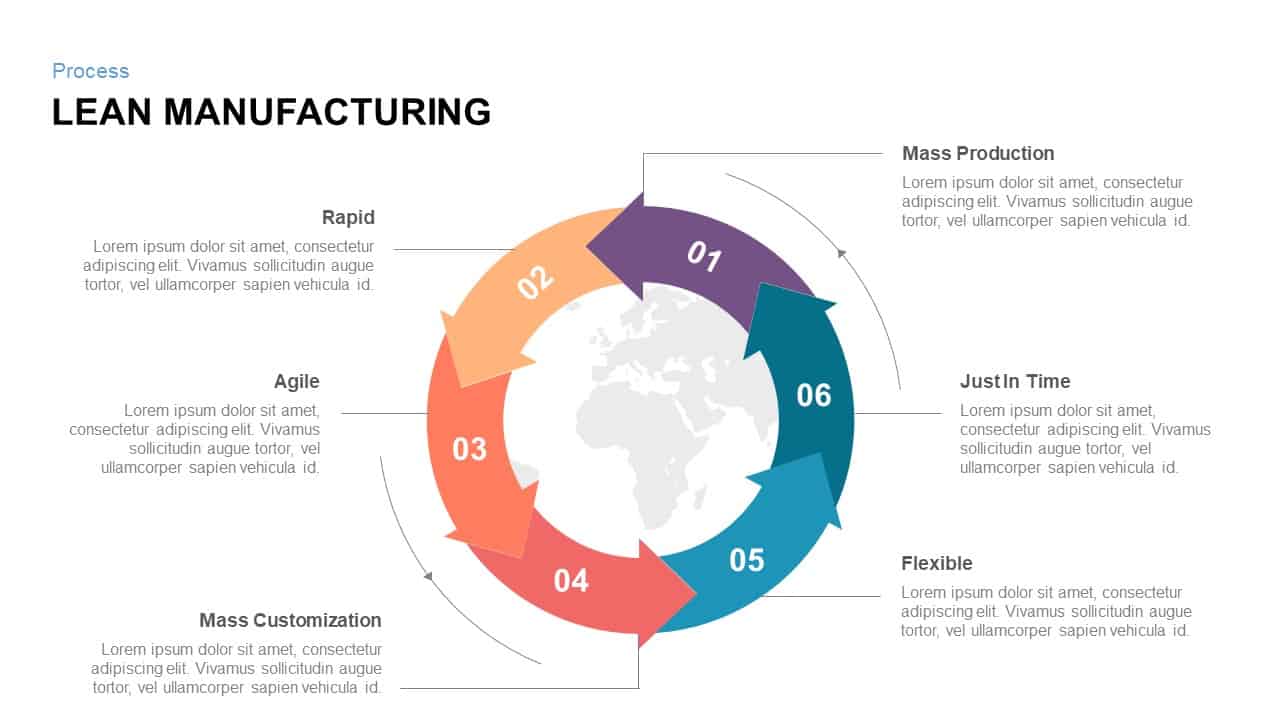
Six-Step Lean Manufacturing Process Template for PowerPoint & Google Slides
Process
Six-Step Linear Arrow Process Diagram Template for PowerPoint & Google Slides
Process
Six-Step Hexagon Process Flow Diagram Template for PowerPoint & Google Slides
Process
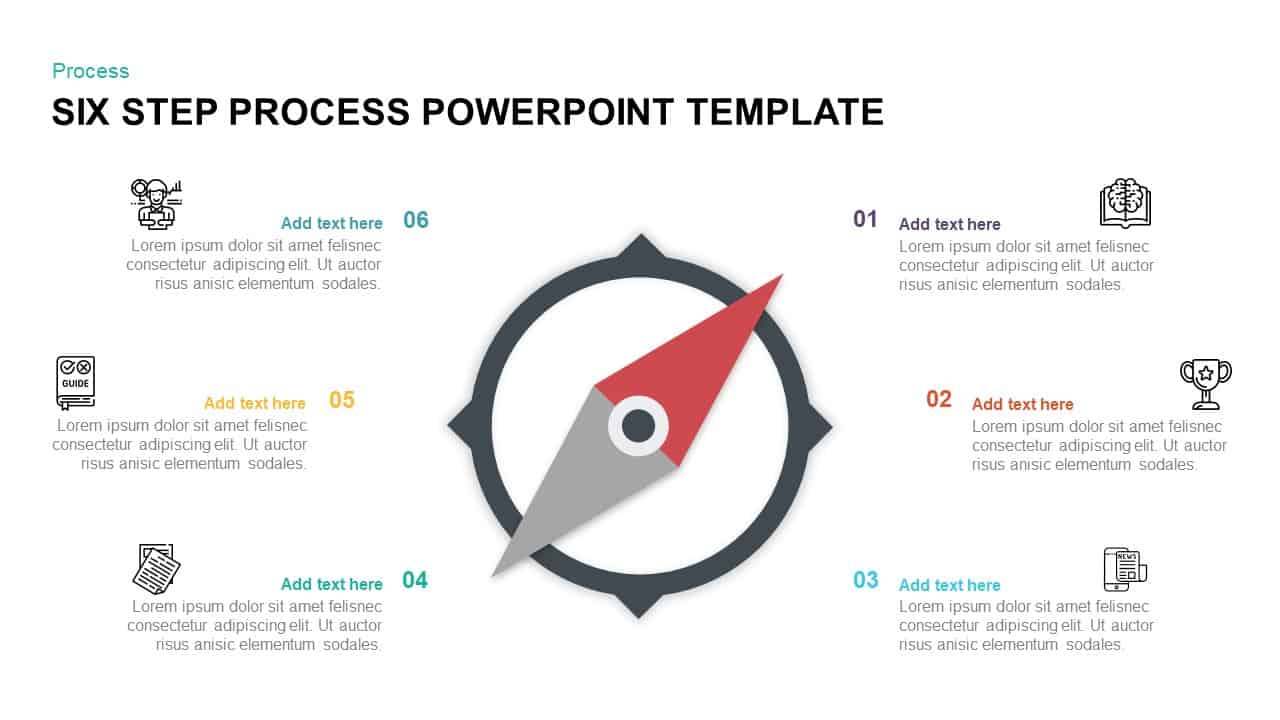
Compass-Themed Six-Step Process Diagram Template for PowerPoint & Google Slides
Process
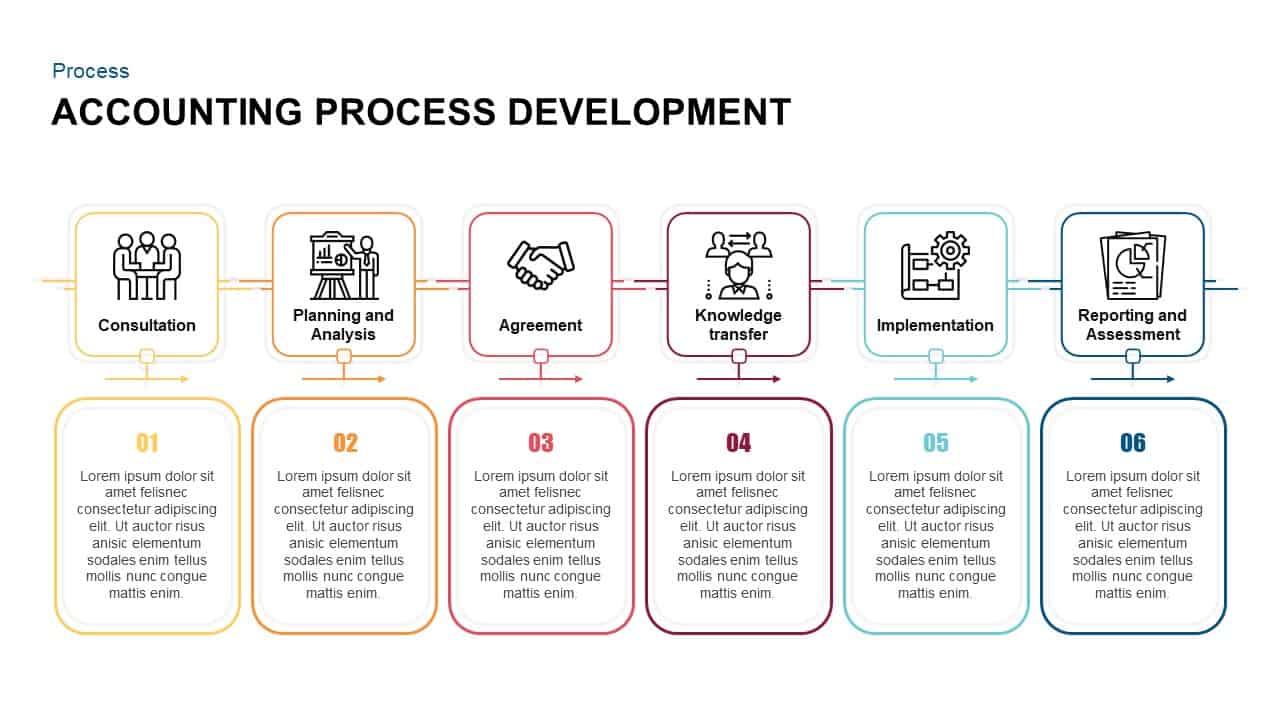
Six-Step Accounting Process Development Template for PowerPoint & Google Slides
Process
Six-Step Infinity Loop Process Diagram Template for PowerPoint & Google Slides
Process
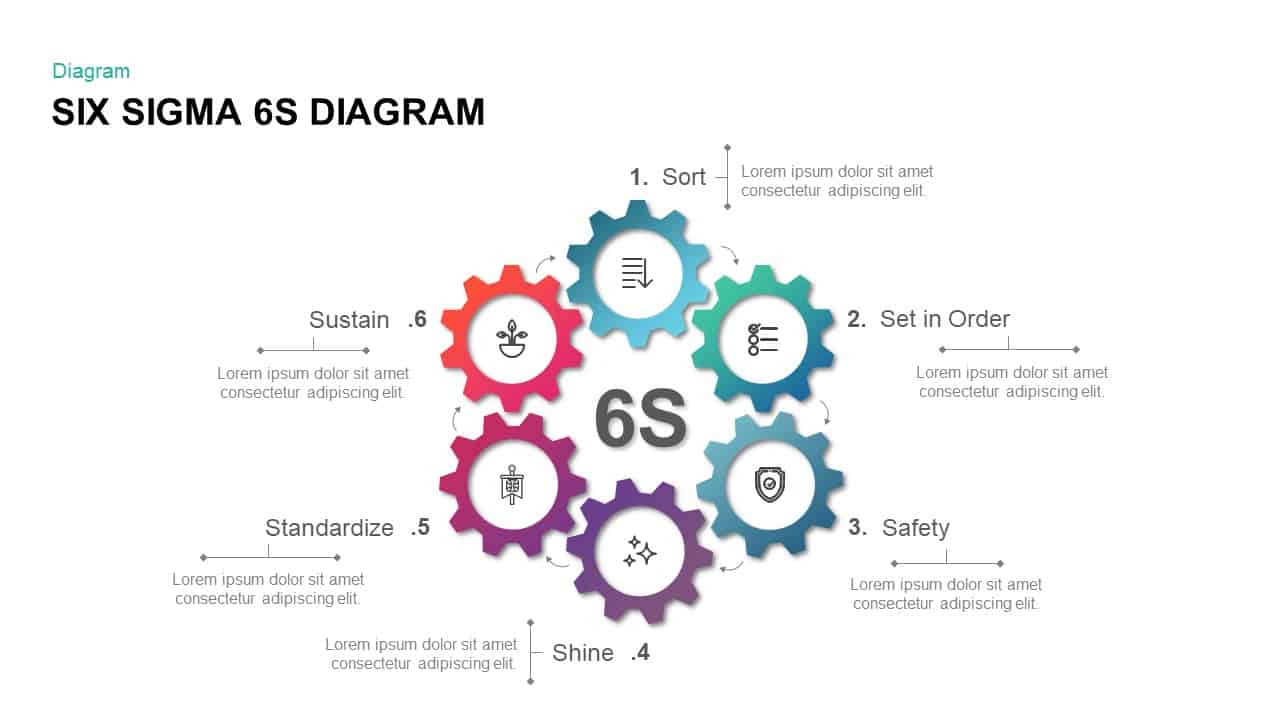
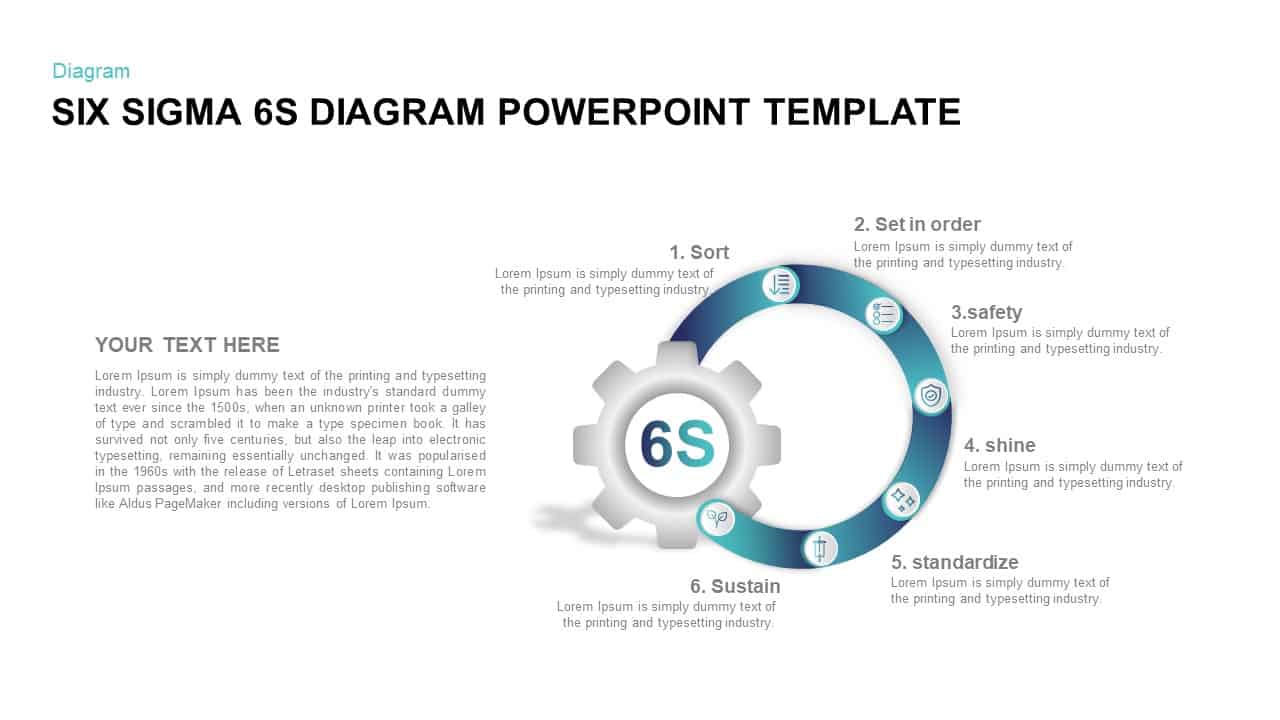
Six Sigma 6S Process Infographic Diagram Template for PowerPoint & Google Slides
Process
Six Sigma 6S Process Diagram Template for PowerPoint & Google Slides
Process
Six-Circle Process Infographic Diagram Template for PowerPoint & Google Slides
Circular
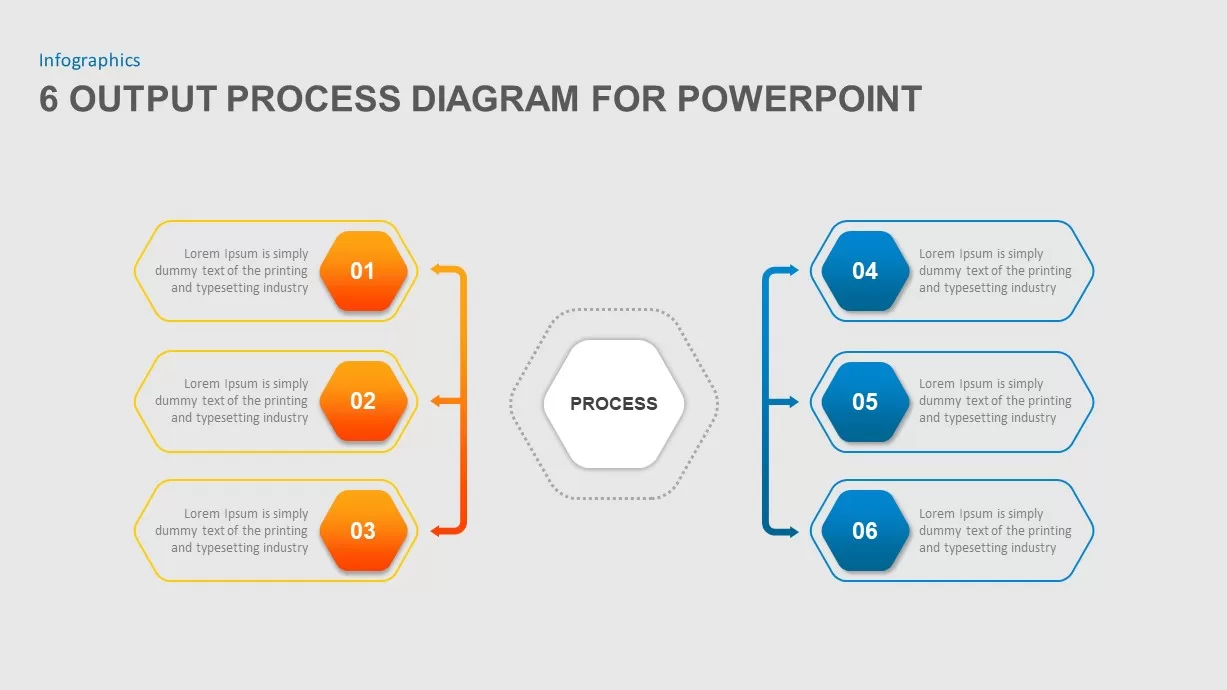
Six-Step Output Process Diagram Template for PowerPoint & Google Slides
Process
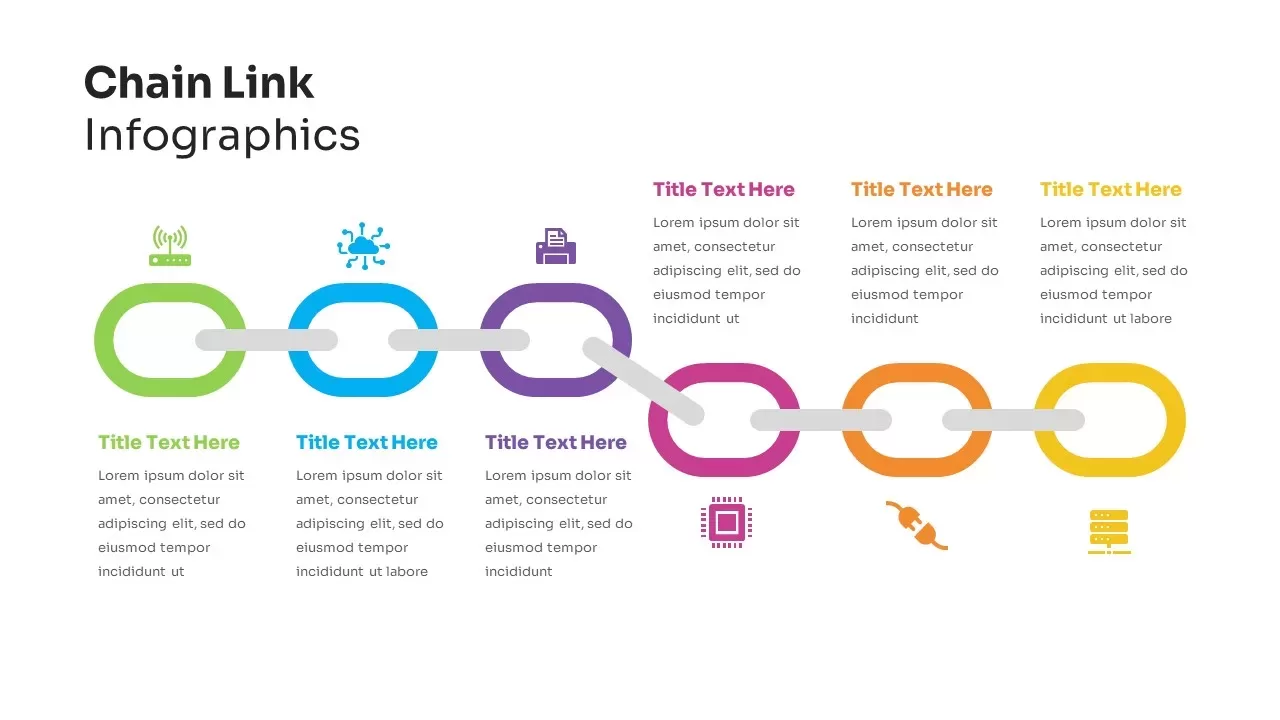
Six-Step Chain Link Technology Process Template for PowerPoint & Google Slides
Process
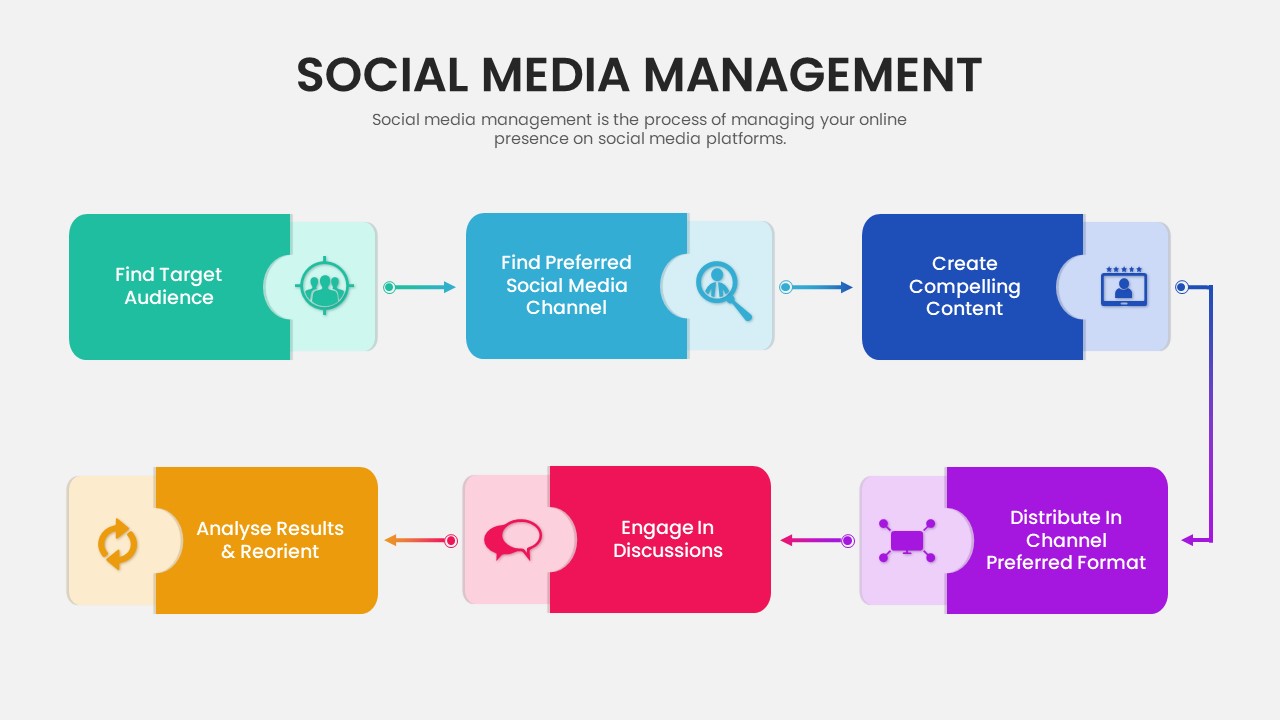
Six-Step Social Media Management Process Template for PowerPoint & Google Slides
Process
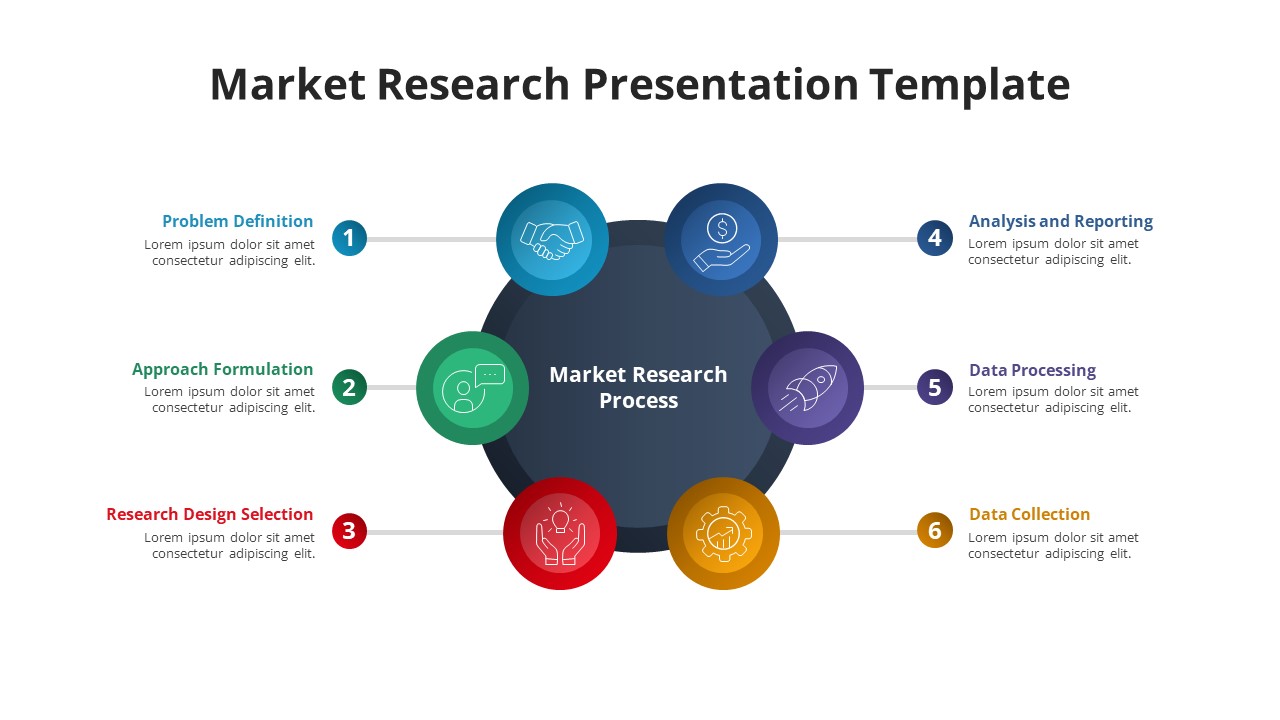
Free Six-Phase Market Research Process Template for PowerPoint & Google Slides
Process
Free
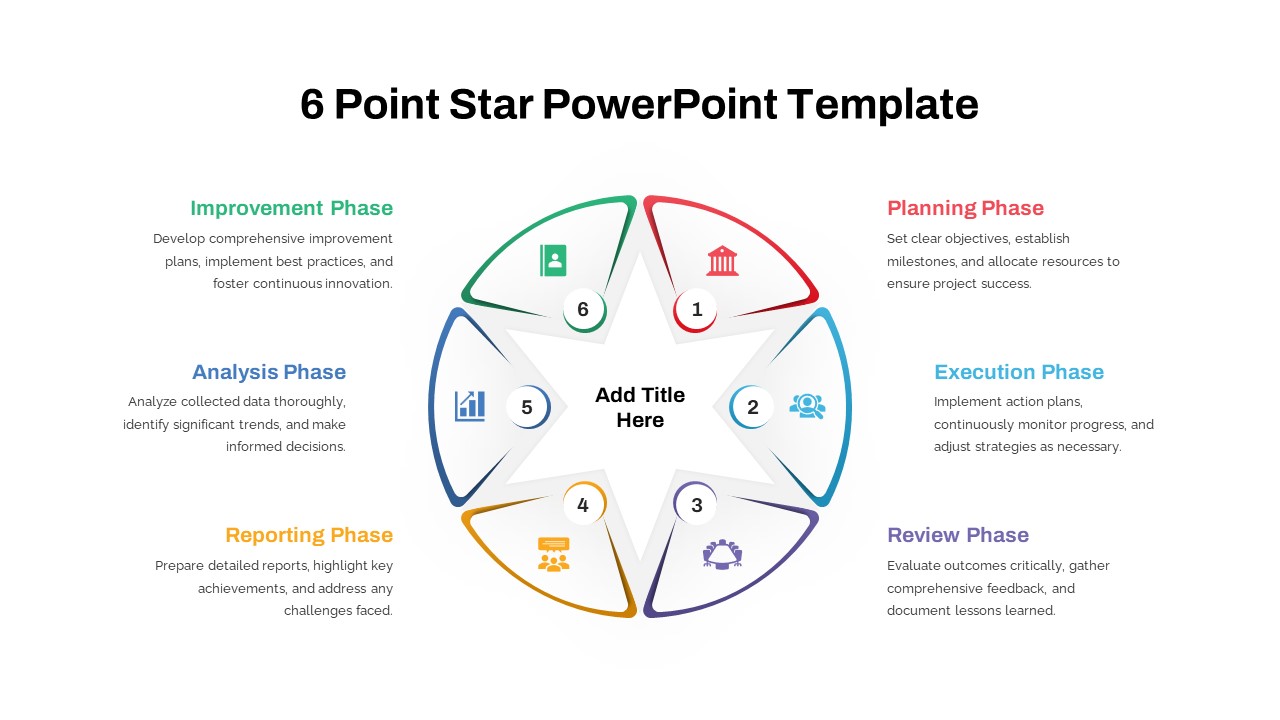
Six-Point Star Process Diagram Template for PowerPoint & Google Slides
Process
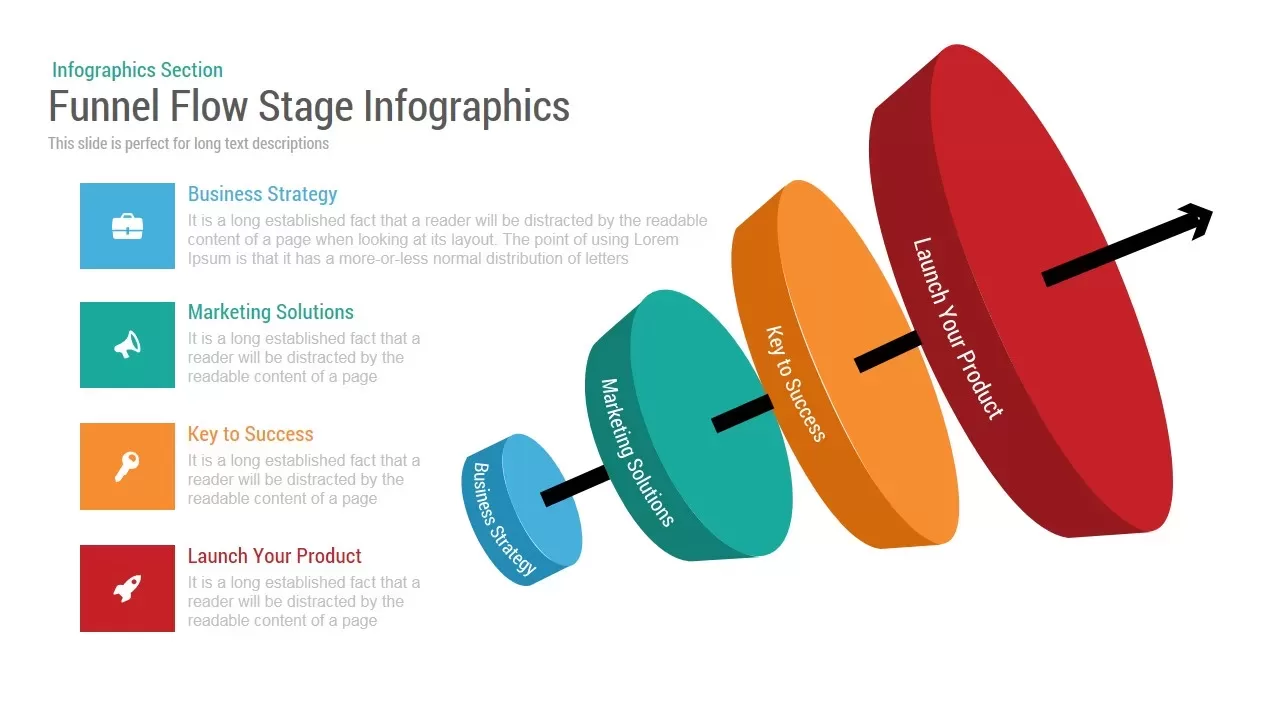
Funnel Flow Stage Infographics template for PowerPoint & Google Slides
Funnel
Multi-Stage Timeline Infographics Template for PowerPoint & Google Slides
Timeline
Five-Stage Arrow Infographics Timeline Template for PowerPoint & Google Slides
Arrow
Five-Stage Pyramid Infographics Diagram Template for PowerPoint & Google Slides
Pyramid
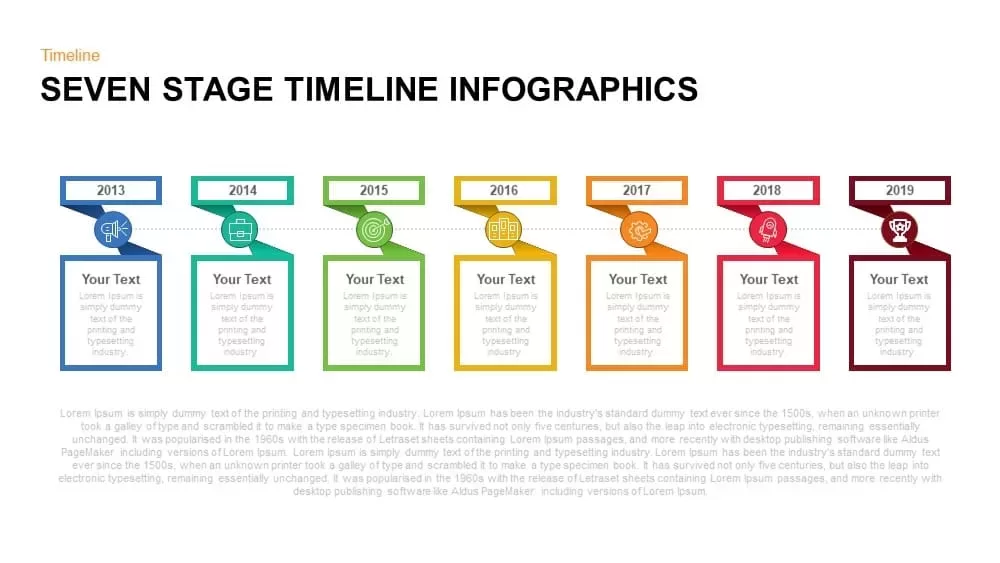
Seven-Stage Timeline Infographics Template for PowerPoint & Google Slides
Timeline
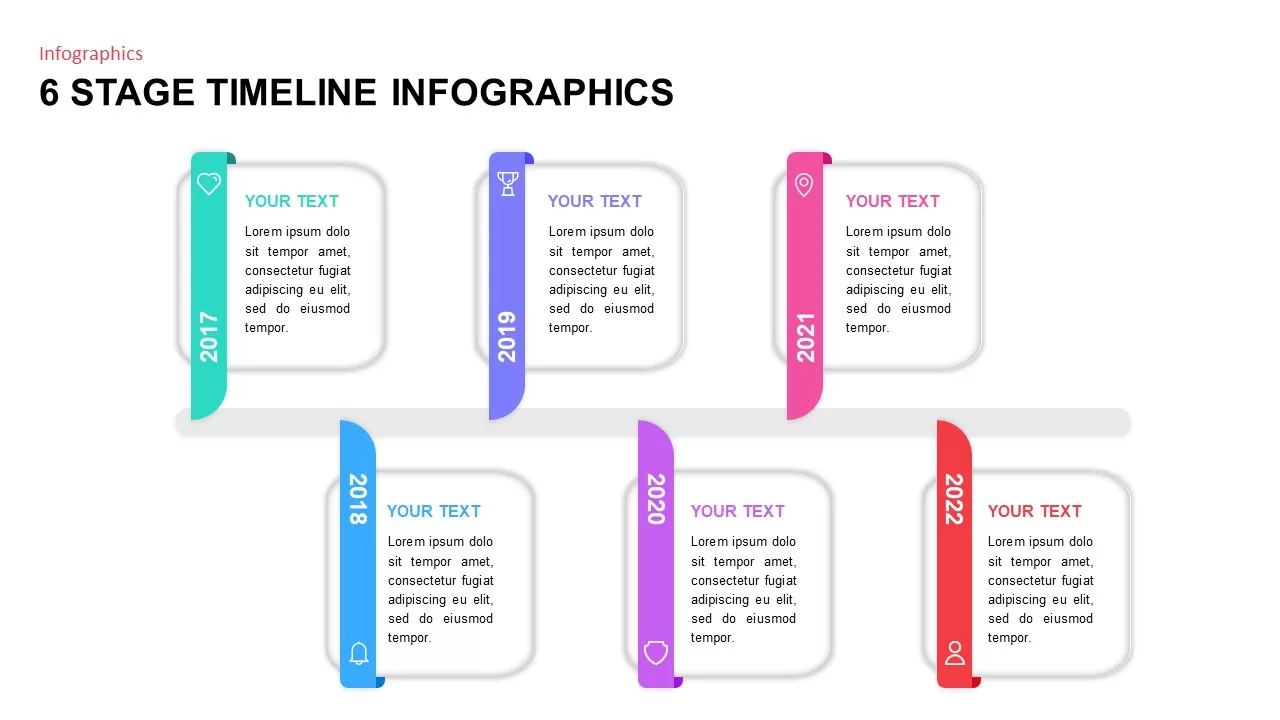
6 Stage Timeline Infographics template for PowerPoint & Google Slides
Timeline
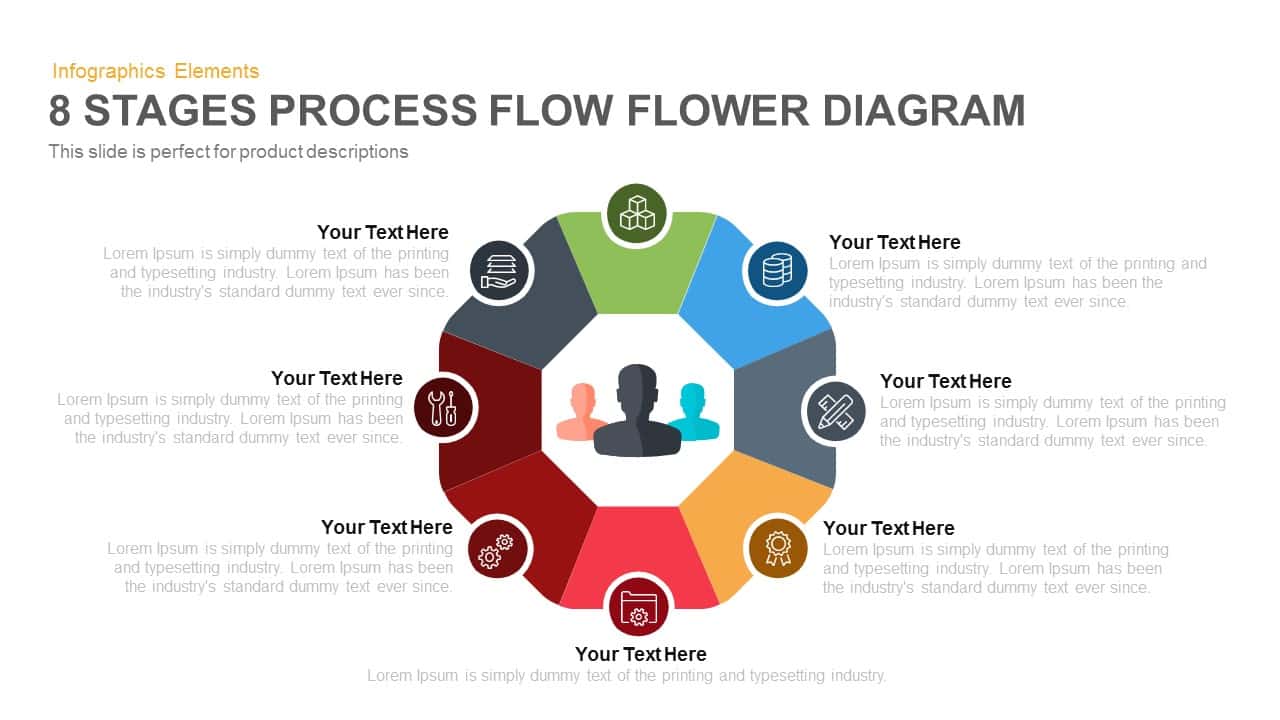
8-Stage Process Flow Flower Diagram Template for PowerPoint & Google Slides
Infographics
Arrow Stage Process Diagram template for PowerPoint & Google Slides
Arrow
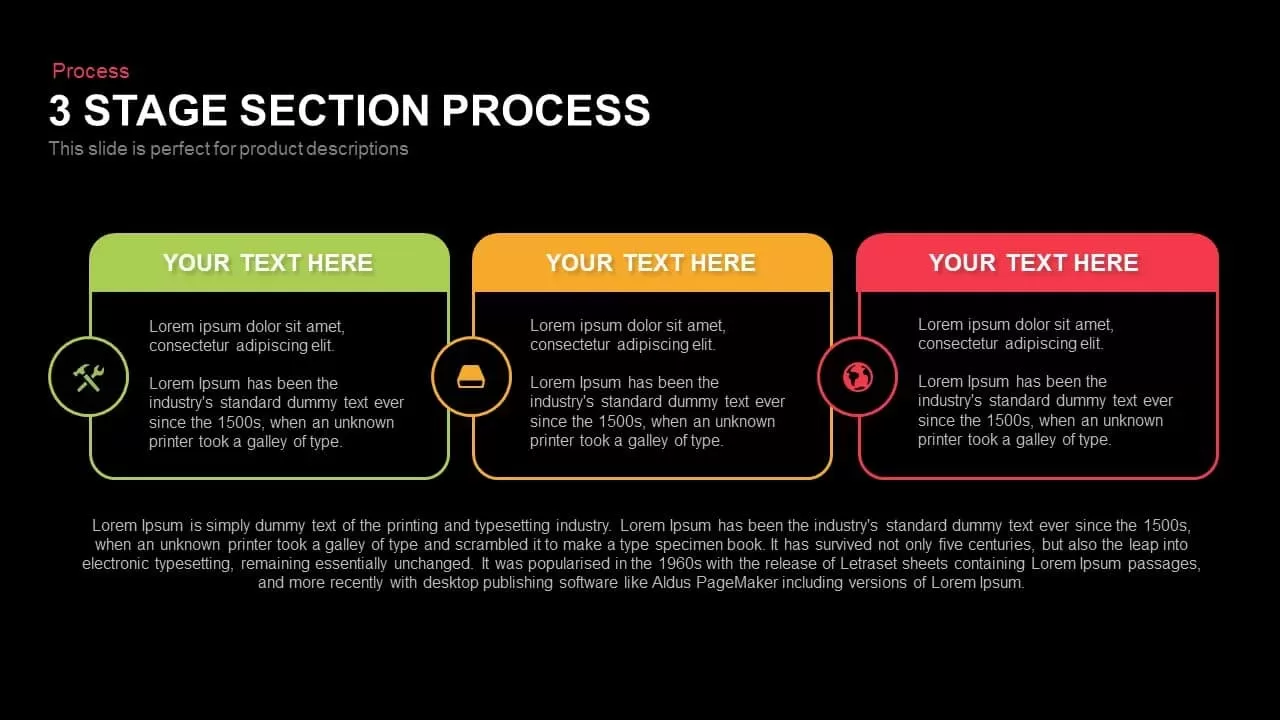
3 Stage Section Process Diagram Template for PowerPoint & Google Slides
Process

5 Stage Process Diagram Slide Overview Template for PowerPoint & Google Slides
Process
Three-Stage Ring Process Diagram Template for PowerPoint & Google Slides
Circular
Seven-Stage Arrow Process Diagram Template for PowerPoint & Google Slides
Process
Five-Stage Direct Flow Arrow Process Template for PowerPoint & Google Slides
Arrow
Colorful Four-Stage Infographic Process Template for PowerPoint & Google Slides
Process
Five Stage Process Diagram Infographic Template for PowerPoint & Google Slides
Process
Isometric Five-Stage Process Flow Template for PowerPoint & Google Slides
Process
Five-Stage Eco Tree Process Diagram Template for PowerPoint & Google Slides
Process
Gradient Chevron Five-Stage Process Flow Template for PowerPoint & Google Slides
Arrow
Five-Stage Pipe Process Diagram Template for PowerPoint & Google Slides
Process
5 Stage Linear Process Flow Diagram Template for PowerPoint & Google Slides
Process
4 Stage Linear Process Flow Diagram Template for PowerPoint & Google Slides
Process
8-Stage Brand Evaluation Process Diagram Template for PowerPoint & Google Slides
Process
4 stage Process Flow template for PowerPoint & Google Slides
Process
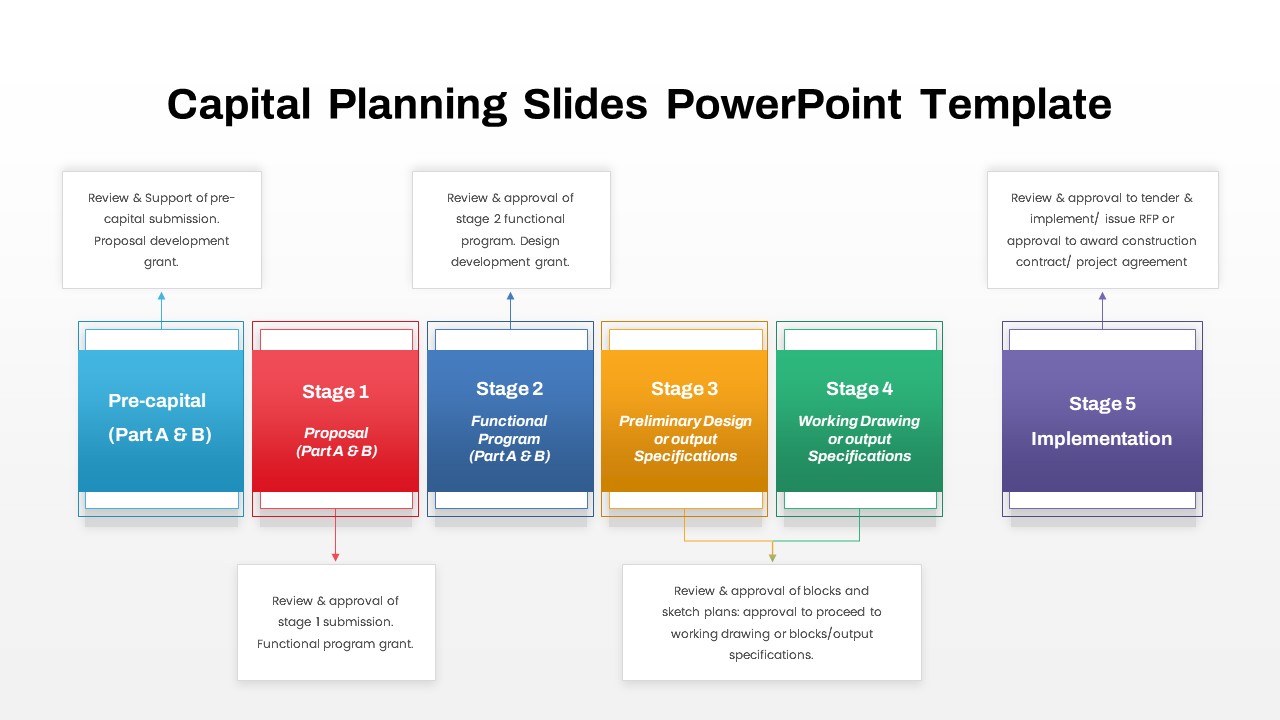
Capital Planning Five-Stage Process template for PowerPoint & Google Slides
Process
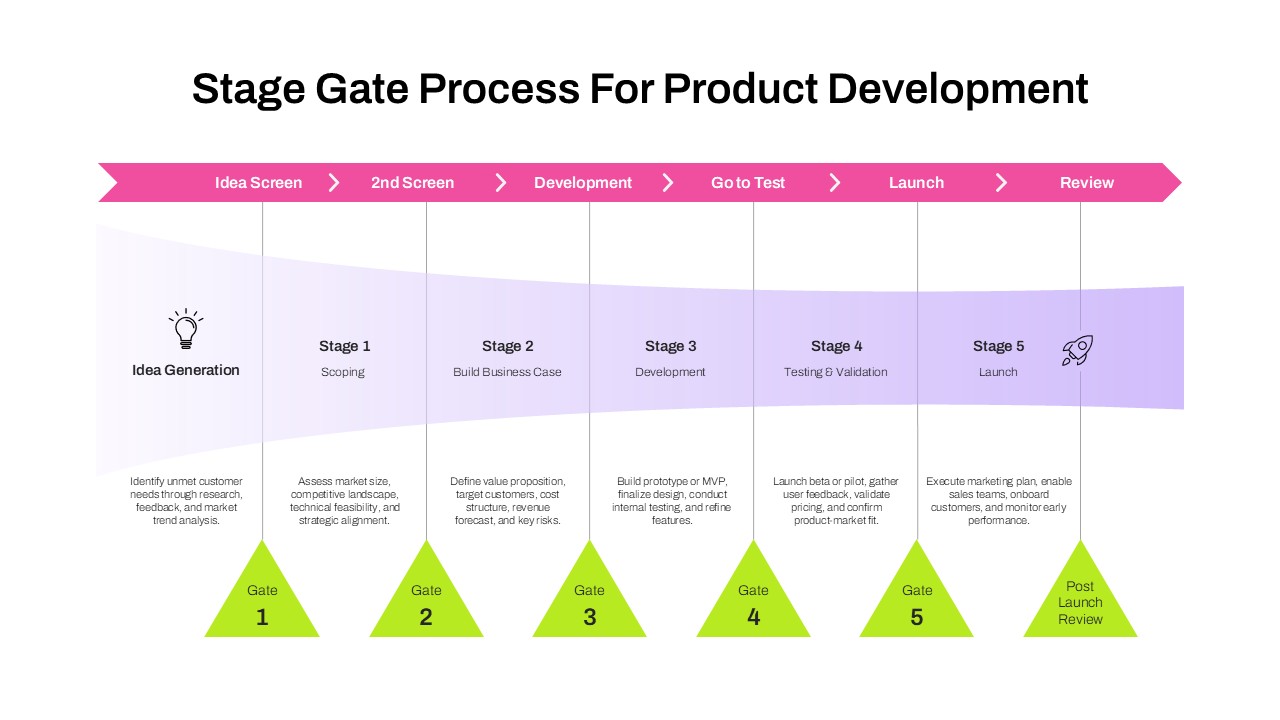
Stage Gate Process for Product Development Template for PowerPoint & Google Slides
Process