Fishbone Process Diagram template for PowerPoint & Google Slides

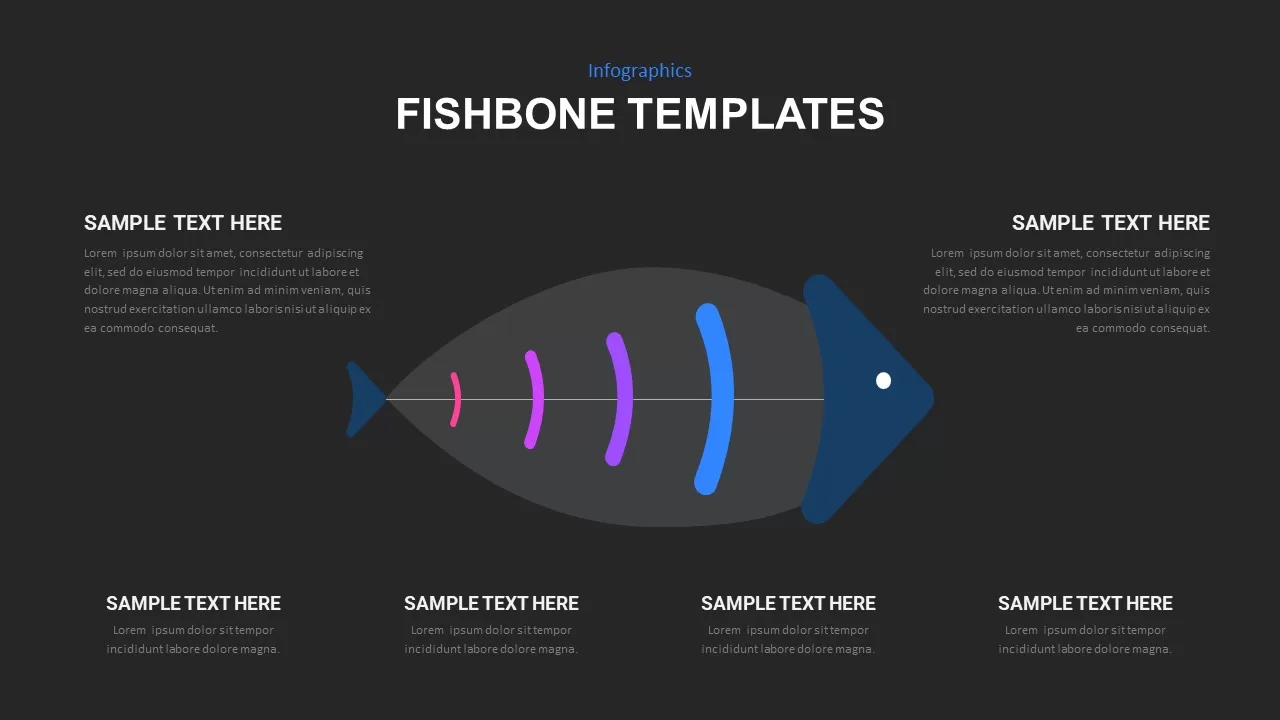
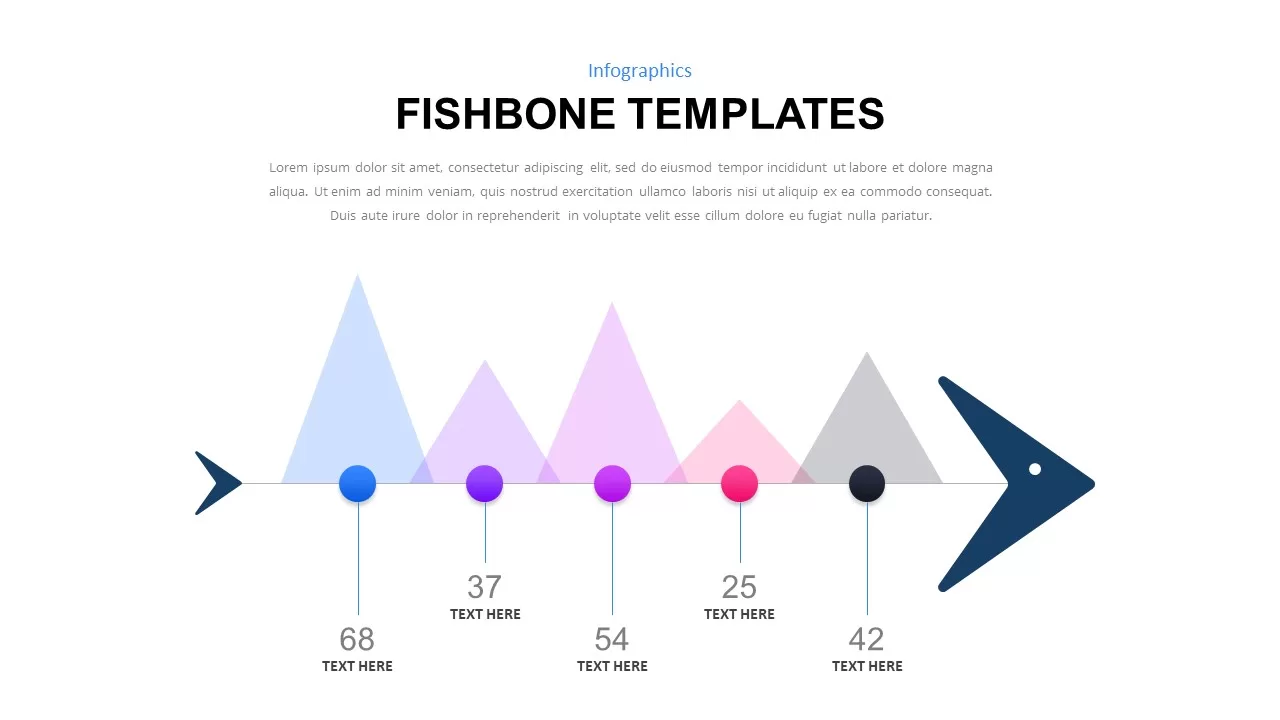
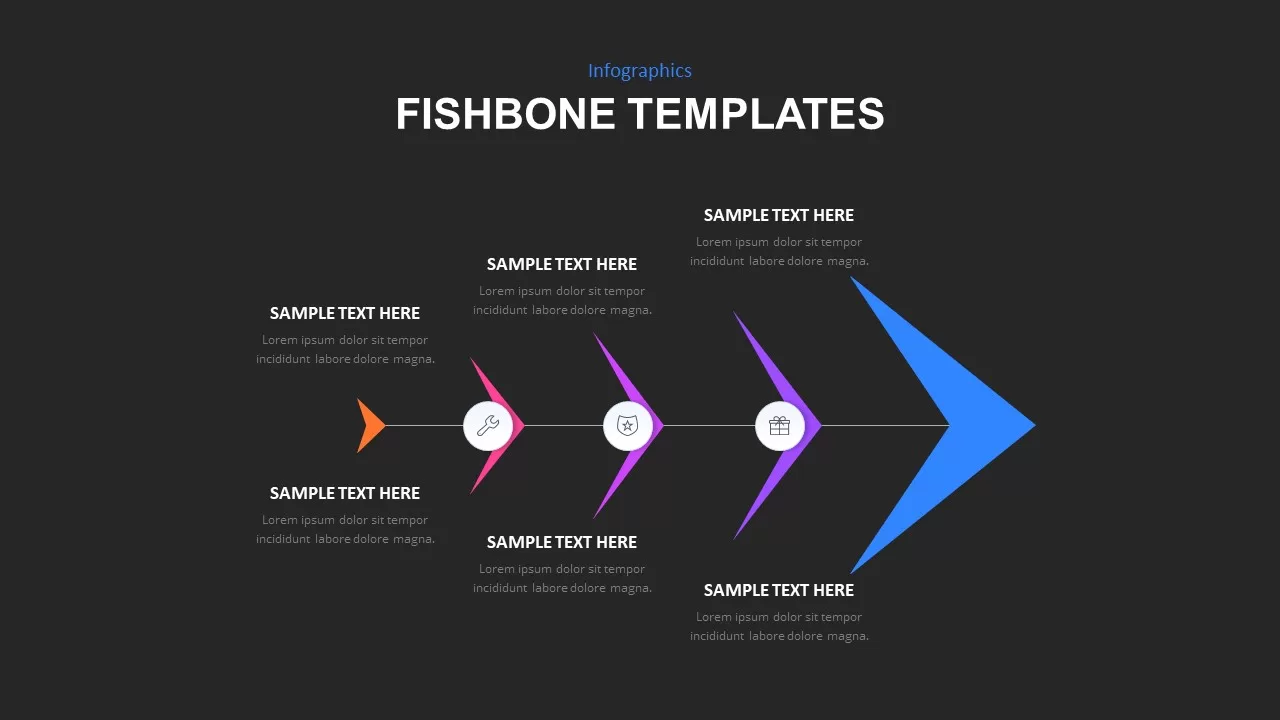
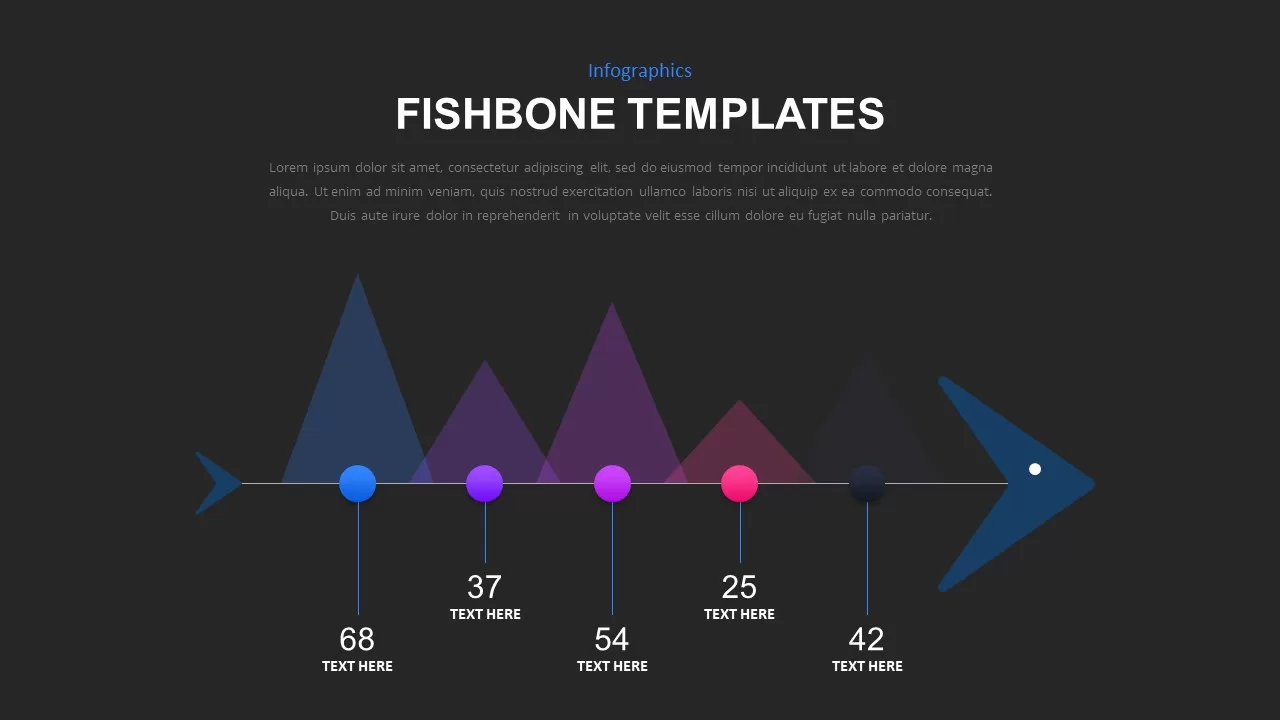
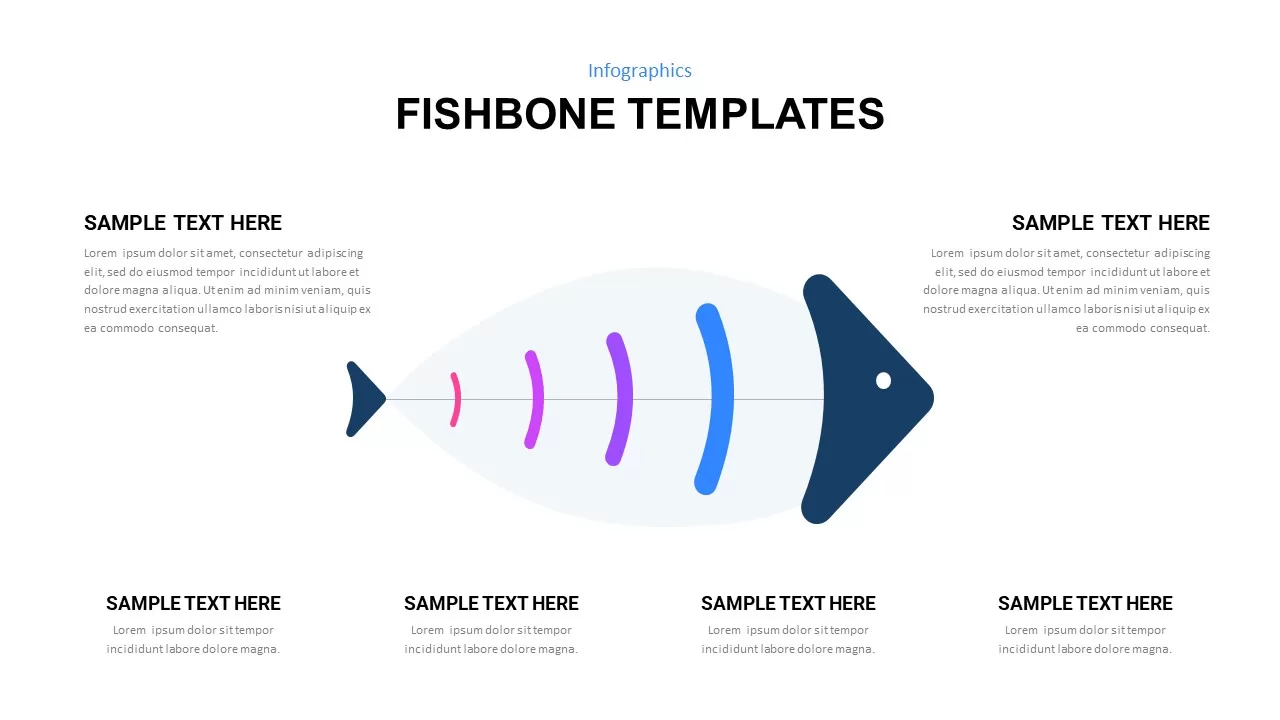
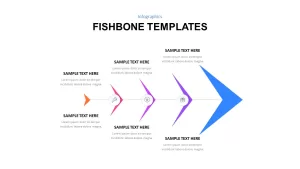
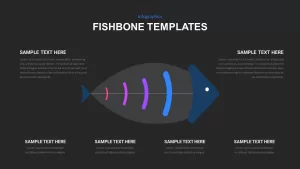

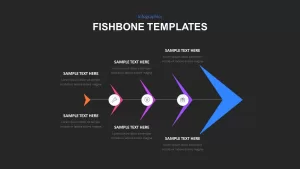
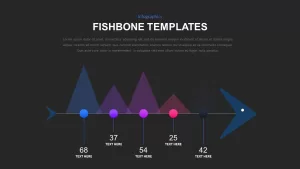

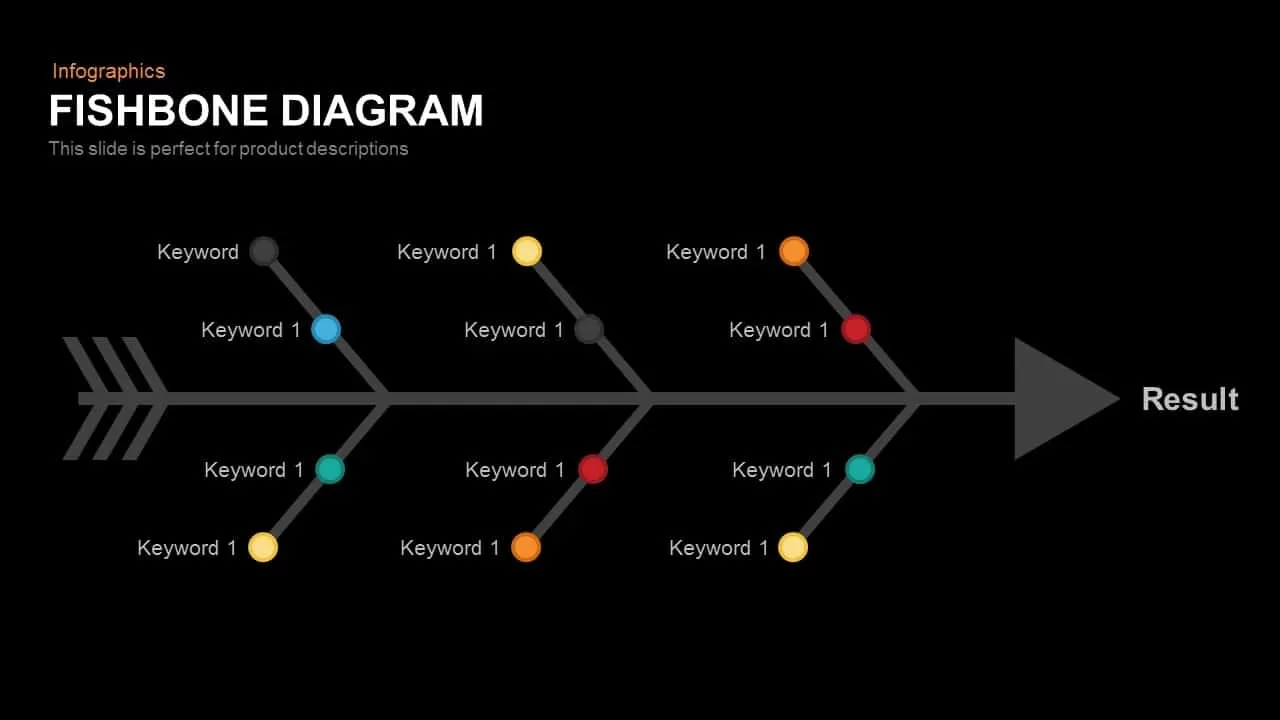
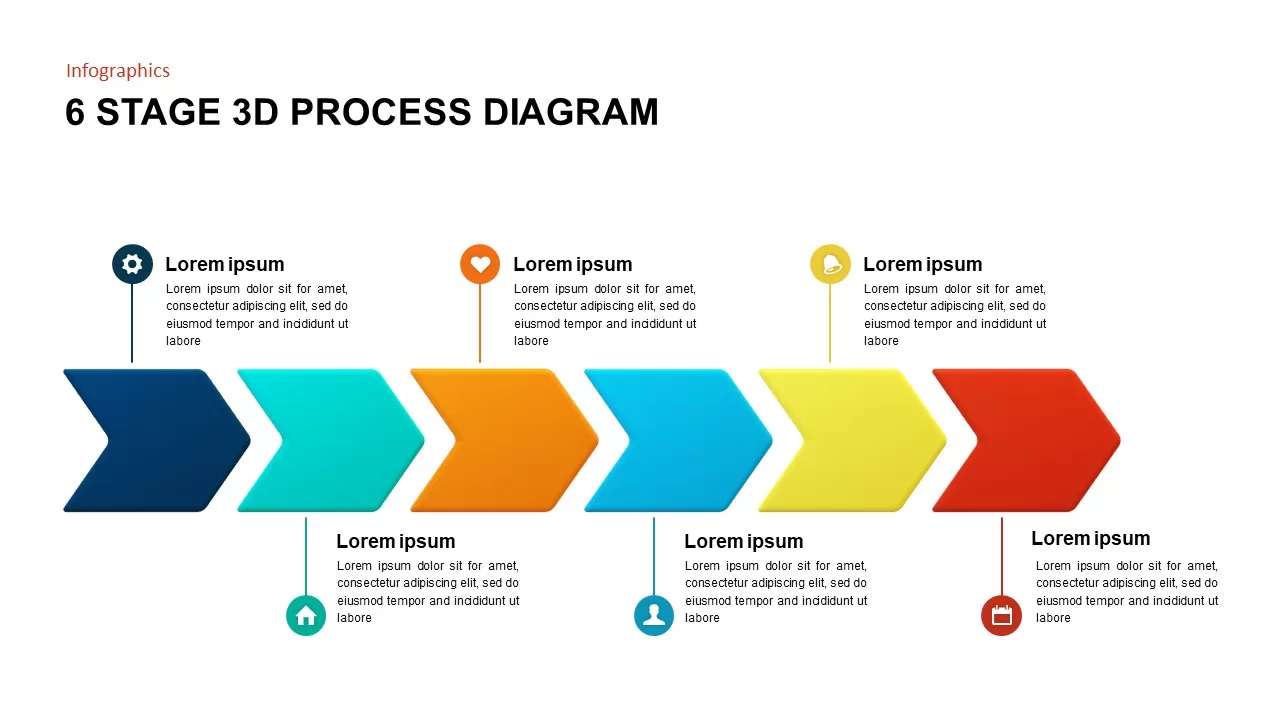
This Fishbone Process Diagram slide is designed to visually represent cause and effect in a systematic and structured manner. The slide uses dynamic arrows and icons to guide the viewer through different phases, clearly breaking down complex information into an easy-to-understand format. The color gradient of orange, purple, and blue arrows adds a modern and vibrant touch, making it ideal for presentations that aim to highlight key causes, issues, or actions in processes.
Each arrow can be customized with relevant icons and text to suit your specific needs, whether you’re explaining root causes in problem-solving scenarios or illustrating project timelines and workflows. The well-organized structure and intuitive design make this slide perfect for teams involved in quality control, project management, or strategic planning.
Beyond its primary function, this slide offers versatility, allowing you to adjust and reorder elements to fit a variety of use cases. Whether you are conducting a team brainstorming session, mapping out a workflow, or detailing a process for a business proposal, this Fishbone Process Diagram helps create clarity and fosters strategic conversations.
Who is it for
This slide is beneficial for project managers, operations managers, business analysts, and consultants who need to showcase the structure of processes, identify root causes, or map out complex workflows. It’s also valuable for team leaders and strategists working on process optimization or quality control within their organization.
Other Uses
Apart from process mapping, you can repurpose this slide for use in presenting business problems and solutions, workflow management, strategic planning, and risk management sessions. It can also be used in workshops or training to teach process analysis or help teams brainstorm solutions to challenges.
Login to download this file

Item ID
SB02073
Related Templates

Three-Section Fishbone Process Diagram template for PowerPoint & Google Slides
Process
Fishbone RCA Diagram Template for PowerPoint & Google Slides
Business Strategy
Fishbone Diagram Overview template for PowerPoint & Google Slides
Infographics
Fishbone Diagram Cause-and-Effect Template for PowerPoint & Google Slides
Process
Free Color-Coded Fishbone Diagram Template for PowerPoint & Google Slides
Project
Free
Fishbone Cause and Effect Diagram Template for PowerPoint & Google Slides
Process
Fishbone Diagram Analysis Template for PowerPoint & Google Slides
Flow Charts
Fishbone Cause Analysis Diagram Template for PowerPoint & Google Slides
Process
Underwater Fishbone Cause-Effect Diagram Template for PowerPoint & Google Slides
Process
Free Root Cause Analysis Fishbone Diagram Template for PowerPoint & Google Slides
Process
Free
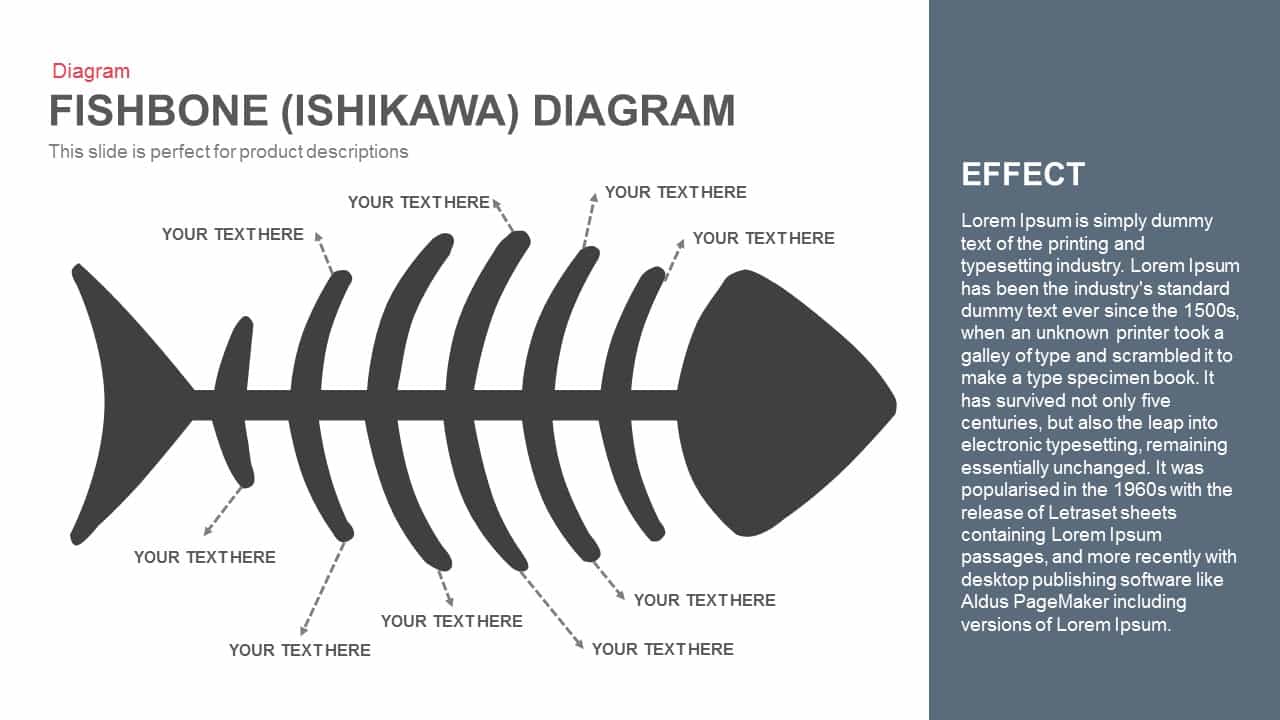
Fishbone (Ishikawa) Diagram for PowerPoint & Google Slides
Process
5 Why Fishbone Diagram for Root Cause Analysis in PowerPoint & Google Slides
Process
Fishbone Cause and Effect Infographic Template for PowerPoint & Google Slides
Infographics
Fishbone Timeline Infographic Series Template for PowerPoint & Google Slides
Manufacturing
Gear Process Diagram PowerPoint Template for PowerPoint & Google Slides
Process
Sales Process Workflow Funnel Diagram PowerPoint Template for PowerPoint & Google Slides
Funnel
5 Arrow Process Diagram Template for PowerPoint & Google Slides
Infographics
Six Hexagon Stages Process Flow Diagram Template for PowerPoint & Google Slides
Process
6-Step Arrow Process Diagram Template for PowerPoint & Google Slides
Process
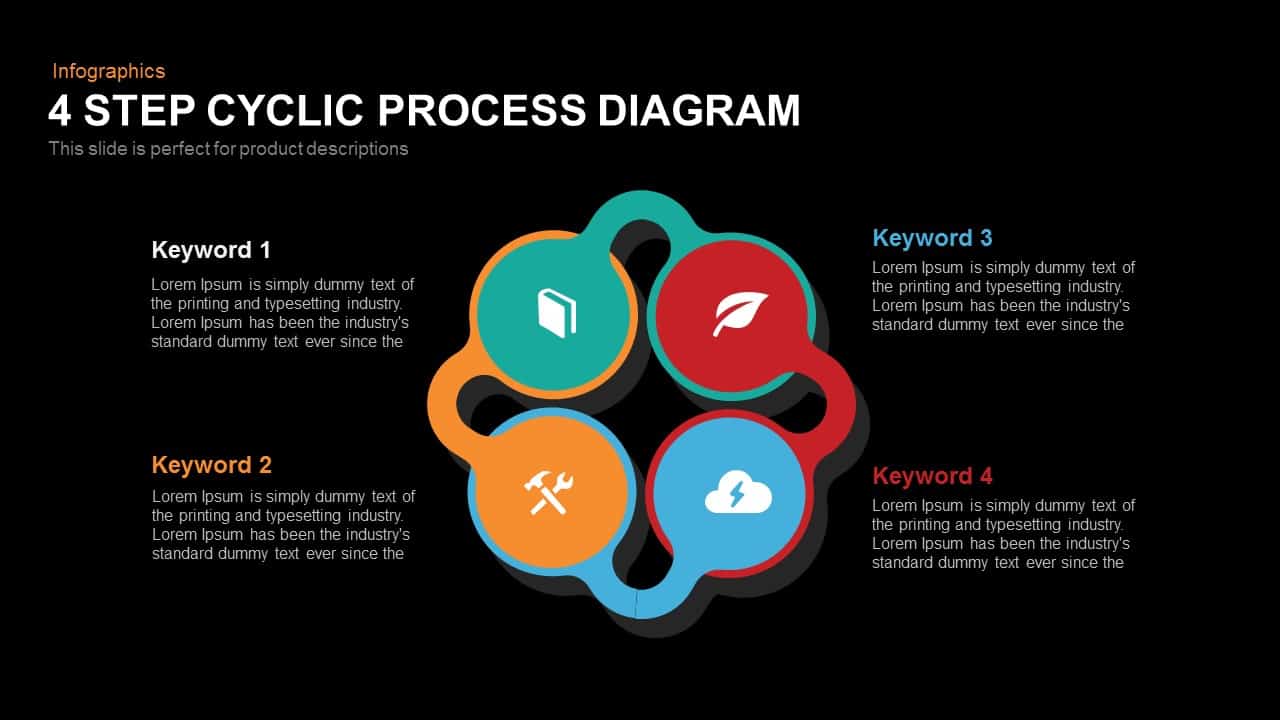
Modern 4-Step Cyclic Process Diagram Template for PowerPoint & Google Slides
Circular
Colorful Arrow Process Diagram Template for PowerPoint & Google Slides
Arrow
Process Flow Diagram template for PowerPoint & Google Slides
Infographics
Gear Process Phase Diagram template for PowerPoint & Google Slides
Process

Five-Step Gear Process Diagram Template for PowerPoint & Google Slides
Process
Three Stage 3D Arrow Process Diagram Template for PowerPoint & Google Slides
Process

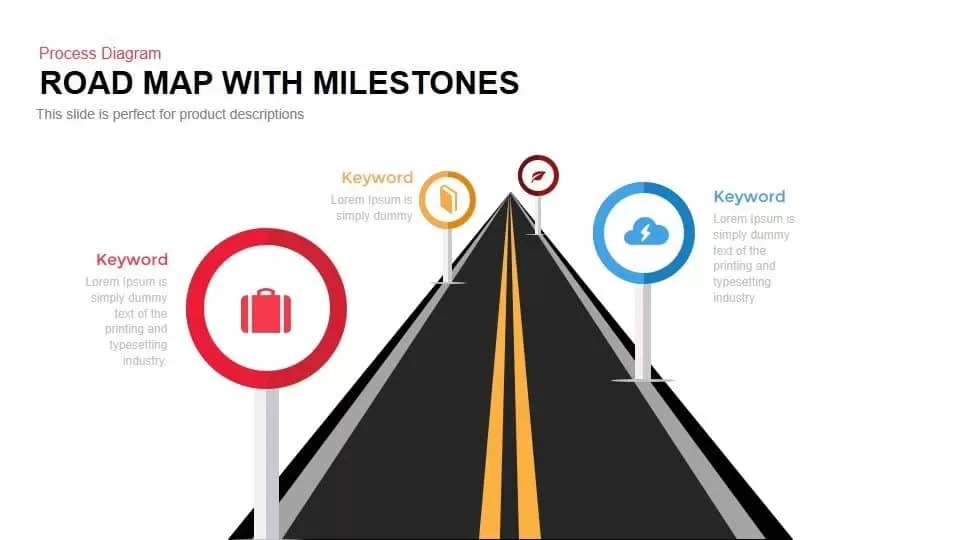
Roadmap with Milestones Process Diagram Template for PowerPoint & Google Slides
Roadmap
Pie Segment Diagram Four-Step Process Template for PowerPoint & Google Slides
Pie/Donut
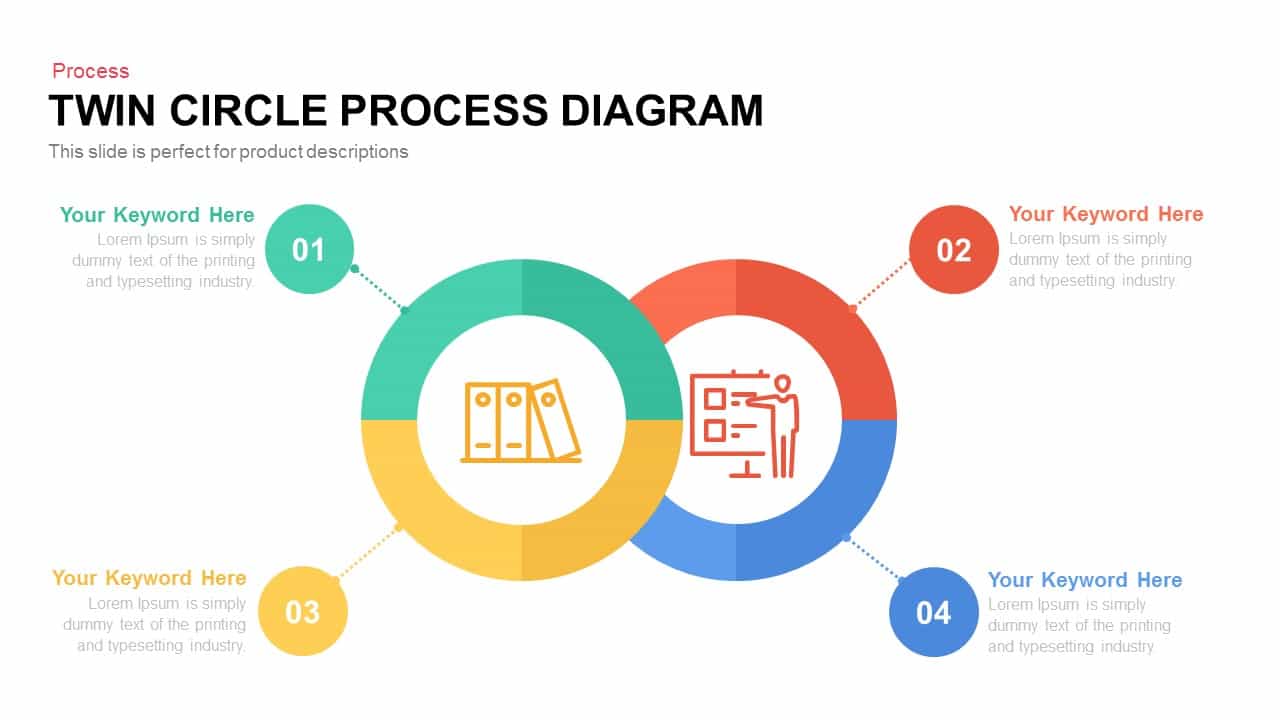
Editable Twin Circle Process Diagram Template for PowerPoint & Google Slides
Process
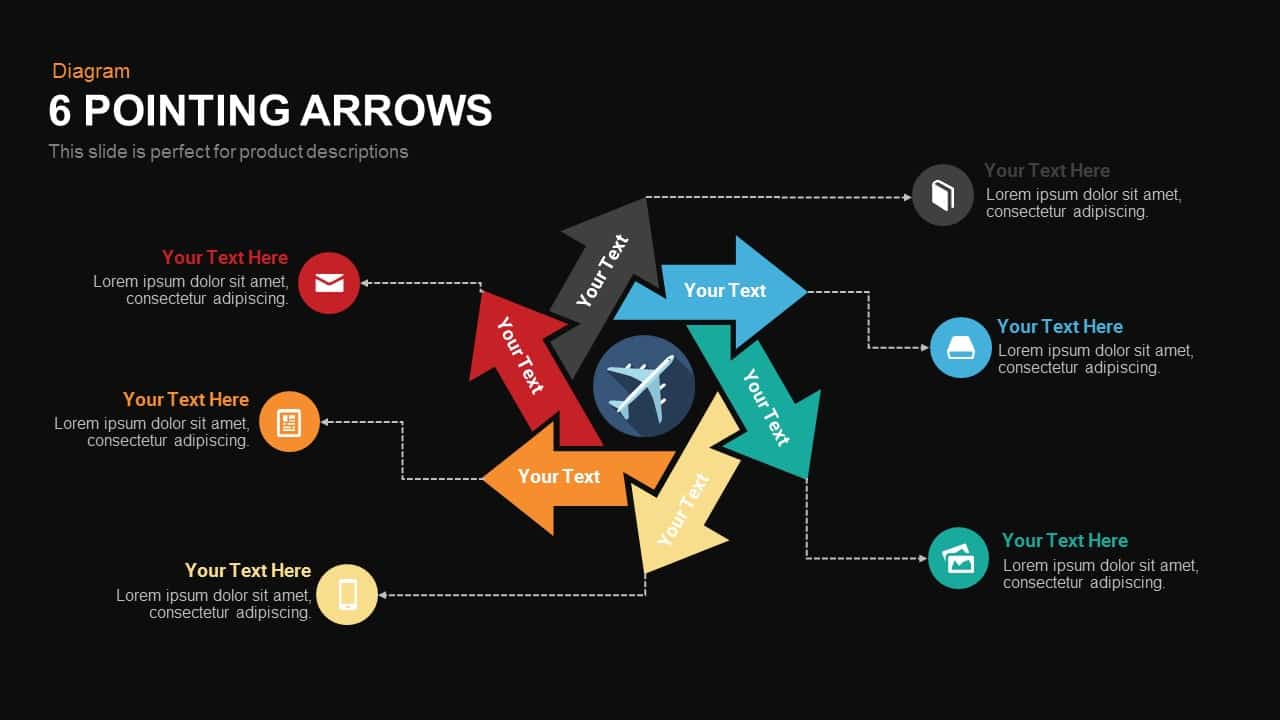
Six Pointing Arrow Process Diagram Template for PowerPoint & Google Slides
Arrow
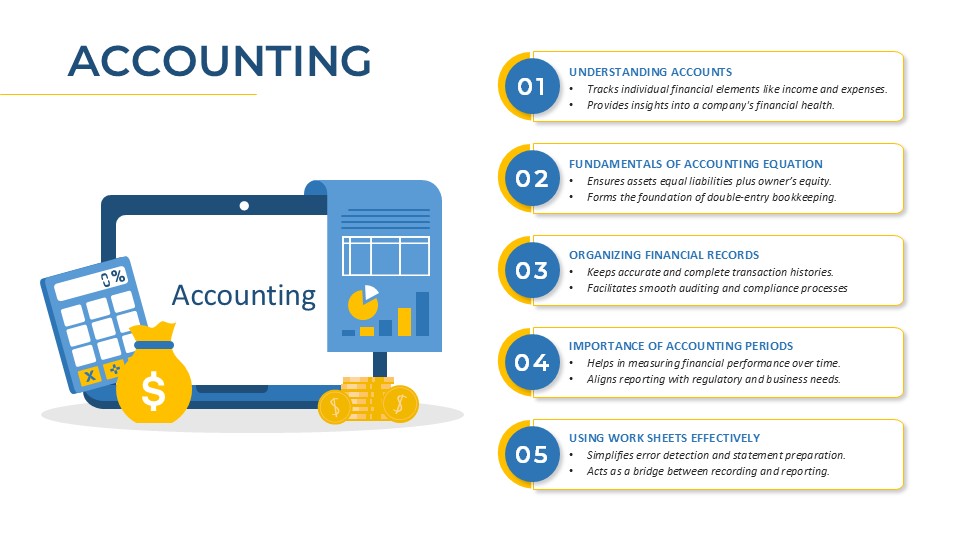
Accounting Process Metaphor Diagram Template for PowerPoint & Google Slides
Accounting
Modern Five-Stage Cycle Process Diagram Template for PowerPoint & Google Slides
Process
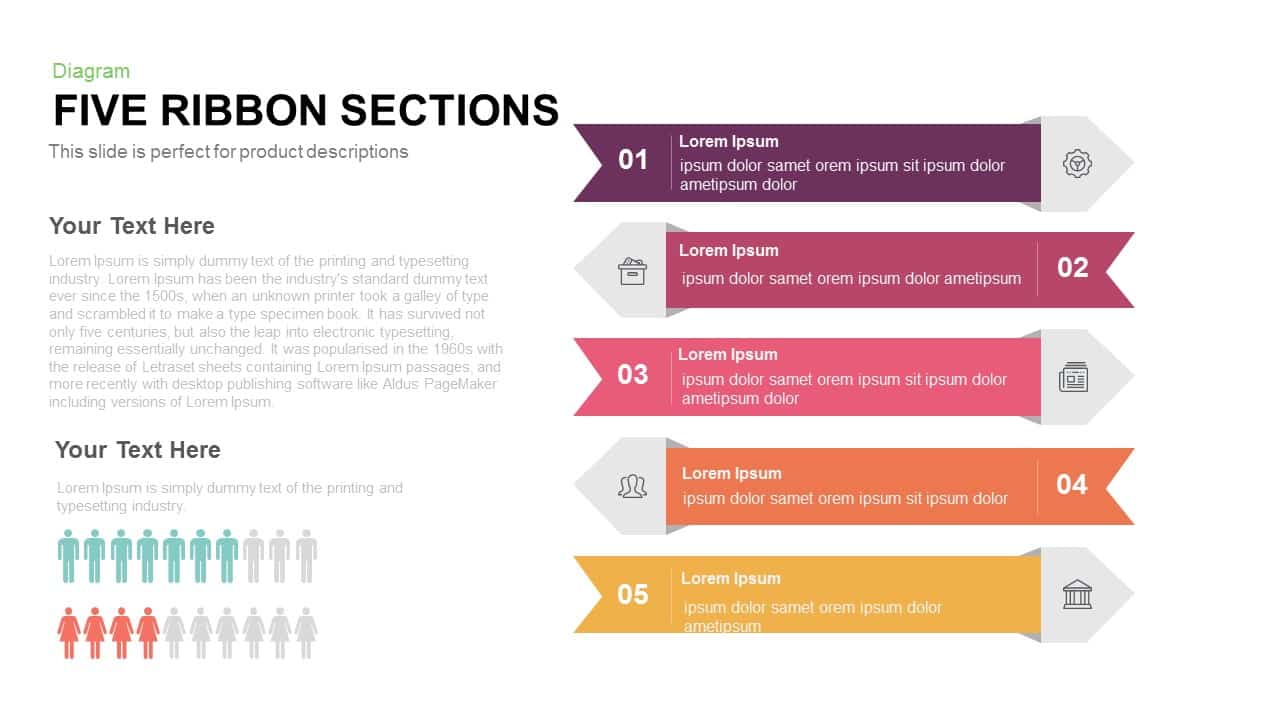
Five Ribbon Sections Process Diagram Template for PowerPoint & Google Slides
Process
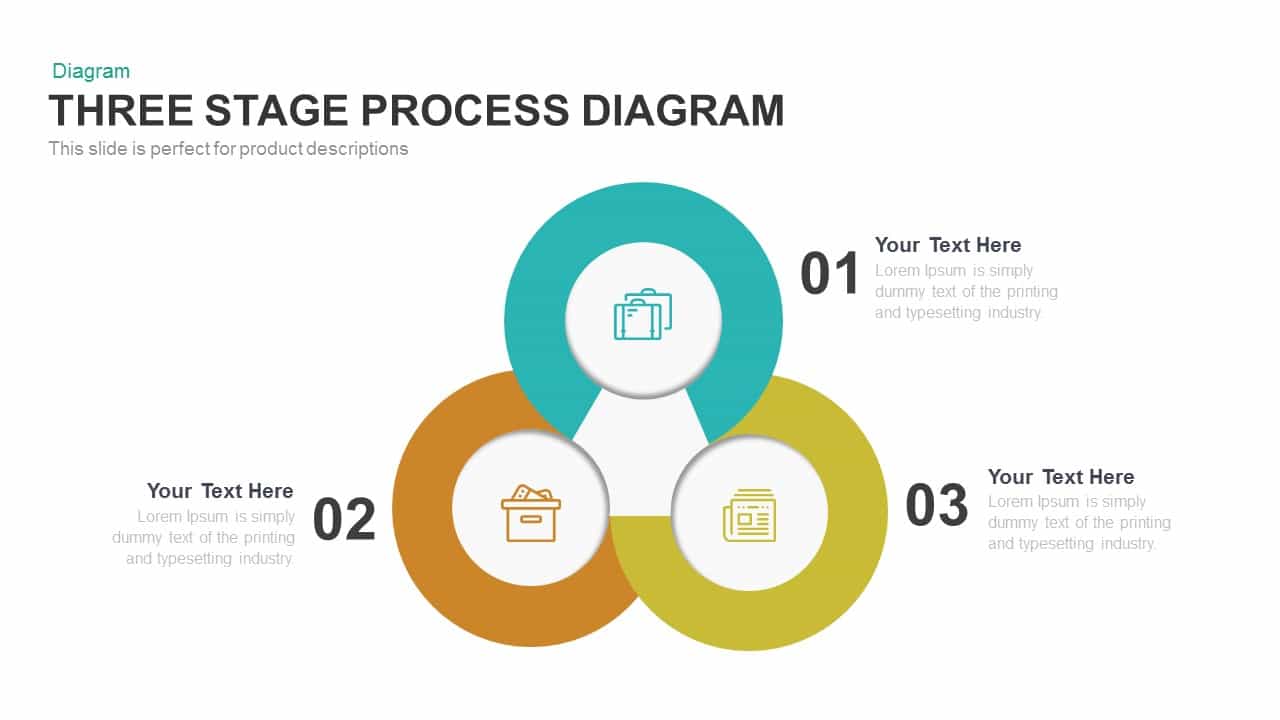
Engaging Three-Stage Process Diagram Template for PowerPoint & Google Slides
Process
Six-Sided Shutter Diagram Process Flow Template for PowerPoint & Google Slides
Process
Five Stage Process Diagram Infographic Template for PowerPoint & Google Slides
Process

Six-Process Circular Arrow Diagram Template for PowerPoint & Google Slides
Circular
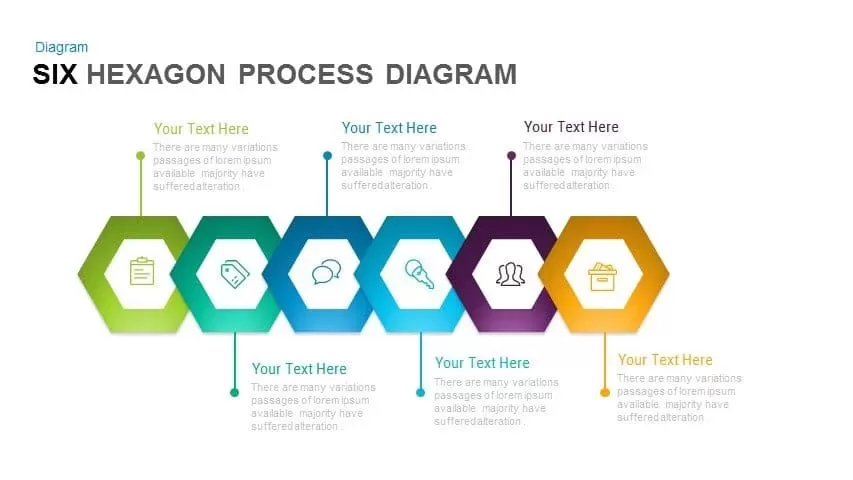
Six-Step Hexagon Process Diagram Template for PowerPoint & Google Slides
Process
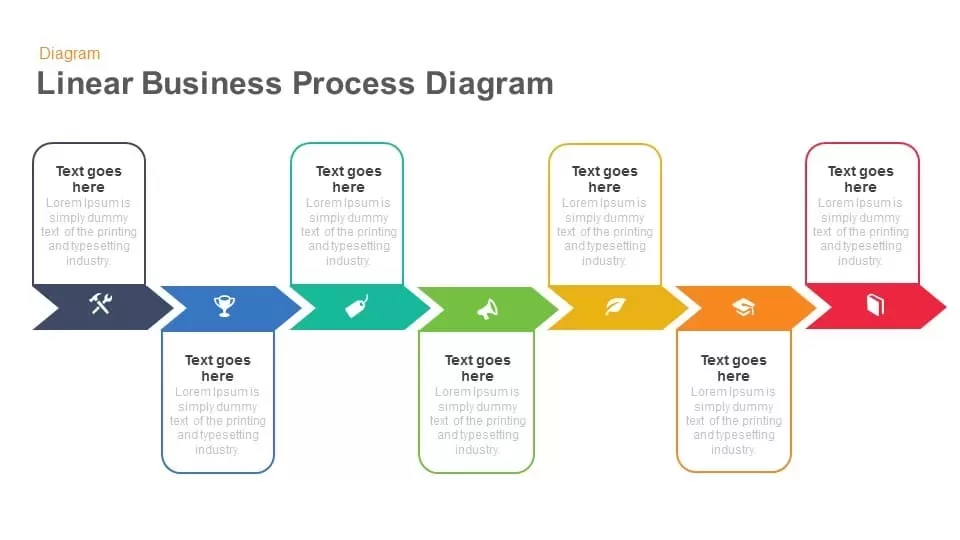
Linear Business Process Diagram template for PowerPoint & Google Slides
Process
10 Stages Business Flow Process Diagram template for PowerPoint & Google Slides
Business
Multidirectional Process Diagram template for PowerPoint & Google Slides
Process

Elegant Process Support Arrow Diagram Template for PowerPoint & Google Slides
Arrow
Eight Stage Process Diagram template for PowerPoint & Google Slides
Process
Free Six Stage Bubble Process Diagram template for PowerPoint & Google Slides
Process
Free
Nine-Stage 3D Funnel Process Diagram Template for PowerPoint & Google Slides
Funnel
Eight-Stage Radial Process Flow Diagram Template for PowerPoint & Google Slides
Process
Sales Activity Hexagon Process Diagram Template for PowerPoint & Google Slides
Process

Modern Five-Step Circles Process Diagram Template for PowerPoint & Google Slides
Circular
Ten-Stage Business Process Diagram Template for PowerPoint & Google Slides
Process
Six-Step Vertical Process Diagram Template for PowerPoint & Google Slides
Process
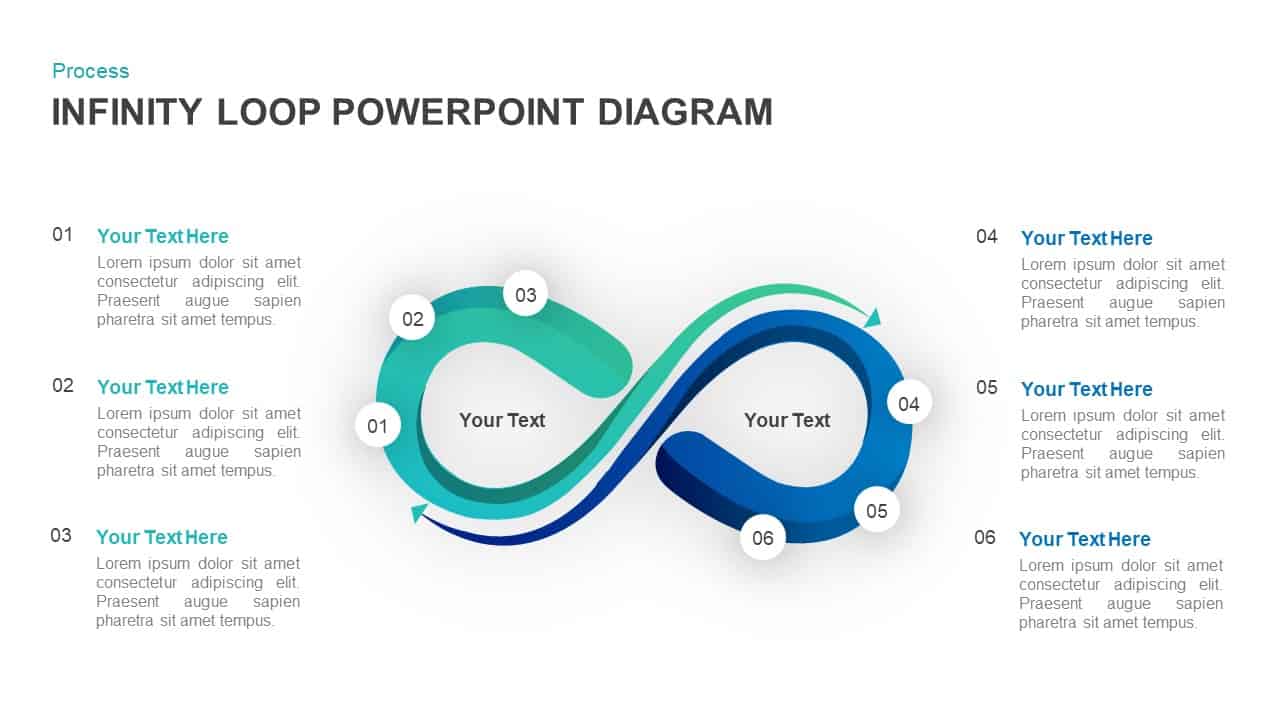
Infinity Process Diagram template for PowerPoint & Google Slides
Process
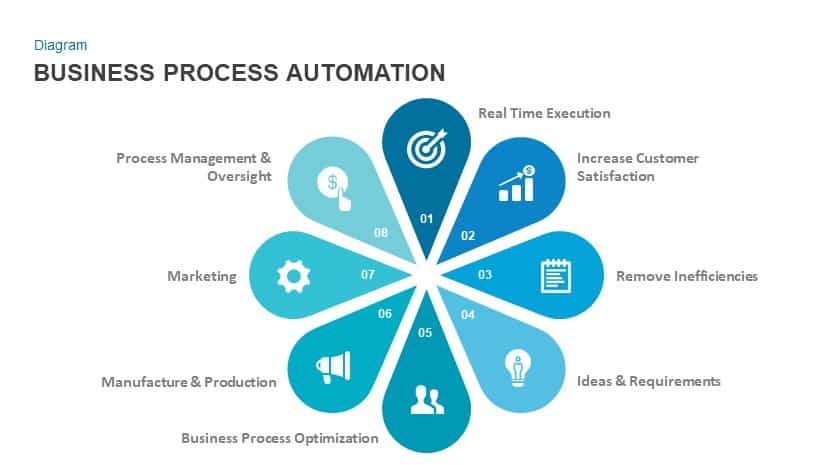
Business Process Automation Diagram Template for PowerPoint & Google Slides
Process
Free Six-Stage Arrow Process Diagram Template for PowerPoint & Google Slides
Process
Free
Six-Step Linear Arrow Process Diagram Template for PowerPoint & Google Slides
Process
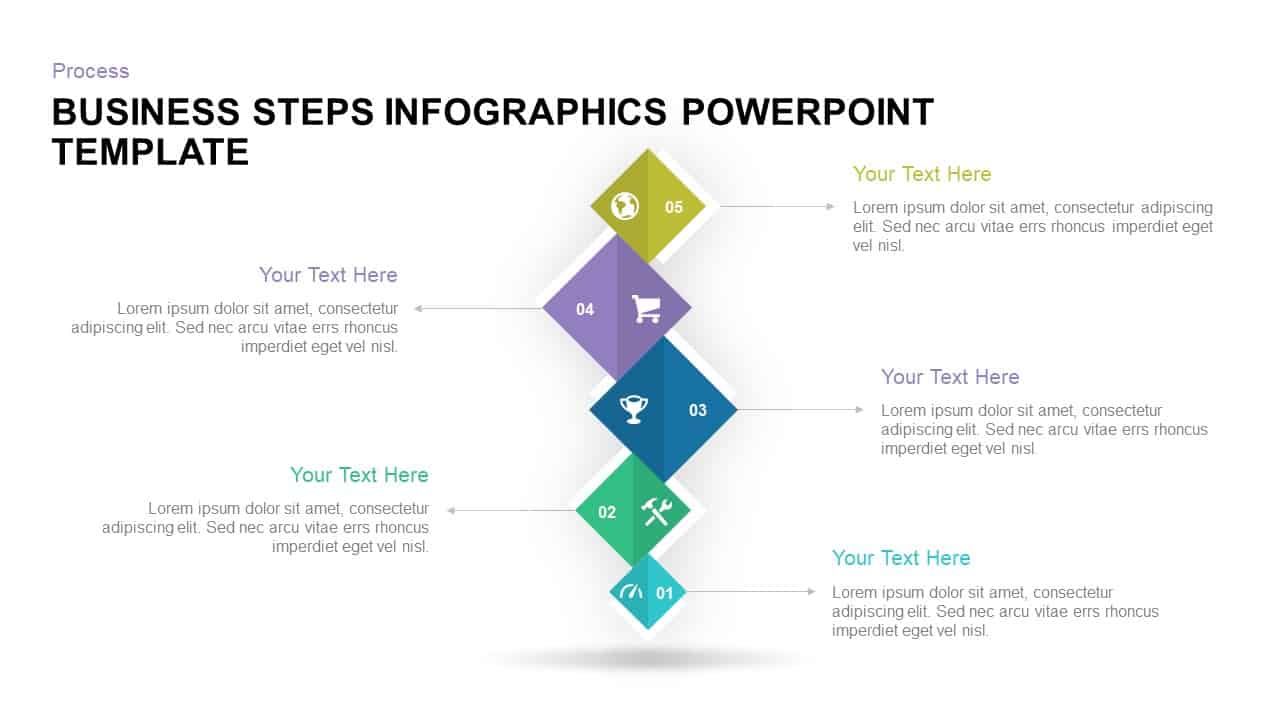
Five-Step Diamond Process Diagram Template for PowerPoint & Google Slides
Process
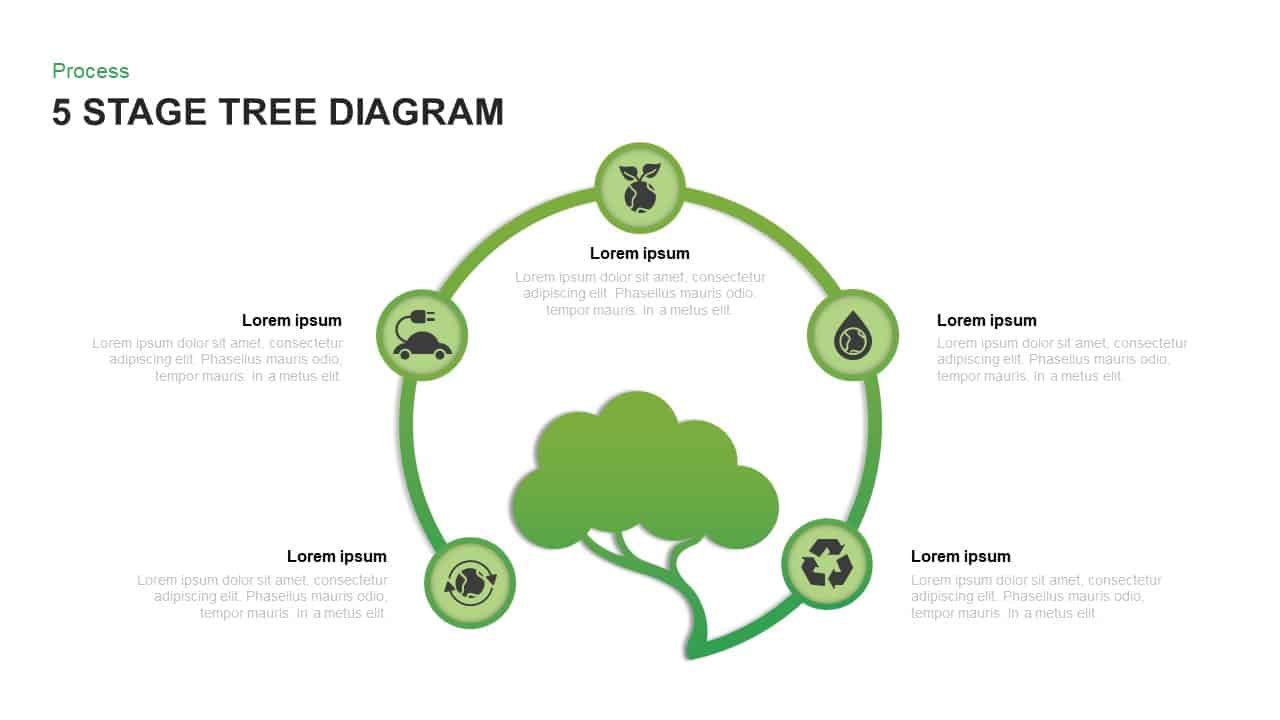
Five-Stage Eco Tree Process Diagram Template for PowerPoint & Google Slides
Process
Six-Stage Circular Diagram Process Template for PowerPoint & Google Slides
Circular
Three-Way Decision Process Arrow Diagram Template for PowerPoint & Google Slides
Arrow
Six-Step Hexagon Process Flow Diagram Template for PowerPoint & Google Slides
Process
Six-Stage Infinity Loop Process Diagram Template for PowerPoint & Google Slides
Process
3D Seven-Stage Process Flow Diagram Template for PowerPoint & Google Slides
Process
Circular CRM Process Diagram Infographic Template for PowerPoint & Google Slides
Circular
Converging Arrows Process Diagram Template for PowerPoint & Google Slides
Arrow
Supply Chain Management Process Diagram Template for PowerPoint & Google Slides
Process
Compass-Themed Six-Step Process Diagram Template for PowerPoint & Google Slides
Process
Why What How Process Diagram Template for PowerPoint & Google Slides
Process
4 Stage Linear Process Flow Diagram Template for PowerPoint & Google Slides
Process
6-Step Business Process Flow Diagram Template for PowerPoint & Google Slides
Process
Three-Step Flowchart Process Diagram Template for PowerPoint & Google Slides
Flow Charts
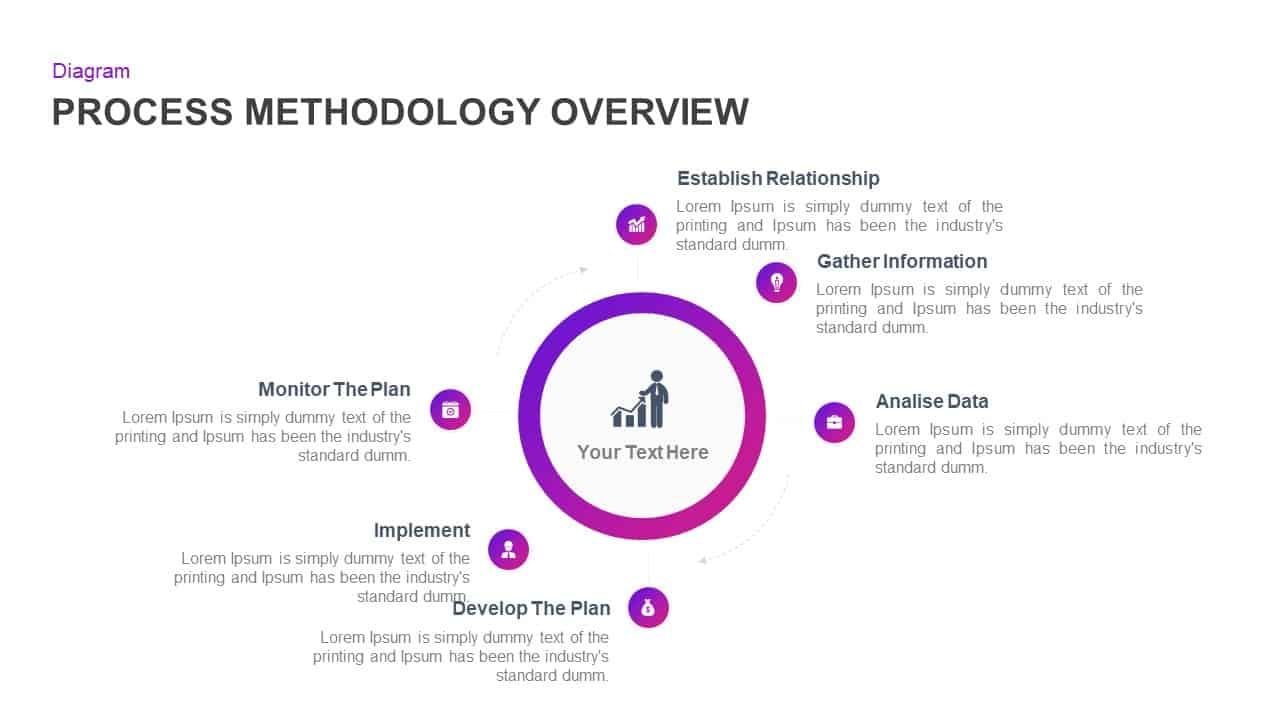
Process Methodology Overview Diagram Template for PowerPoint & Google Slides
Process
Value Chain Circular Process Diagram Template for PowerPoint & Google Slides
Business Models
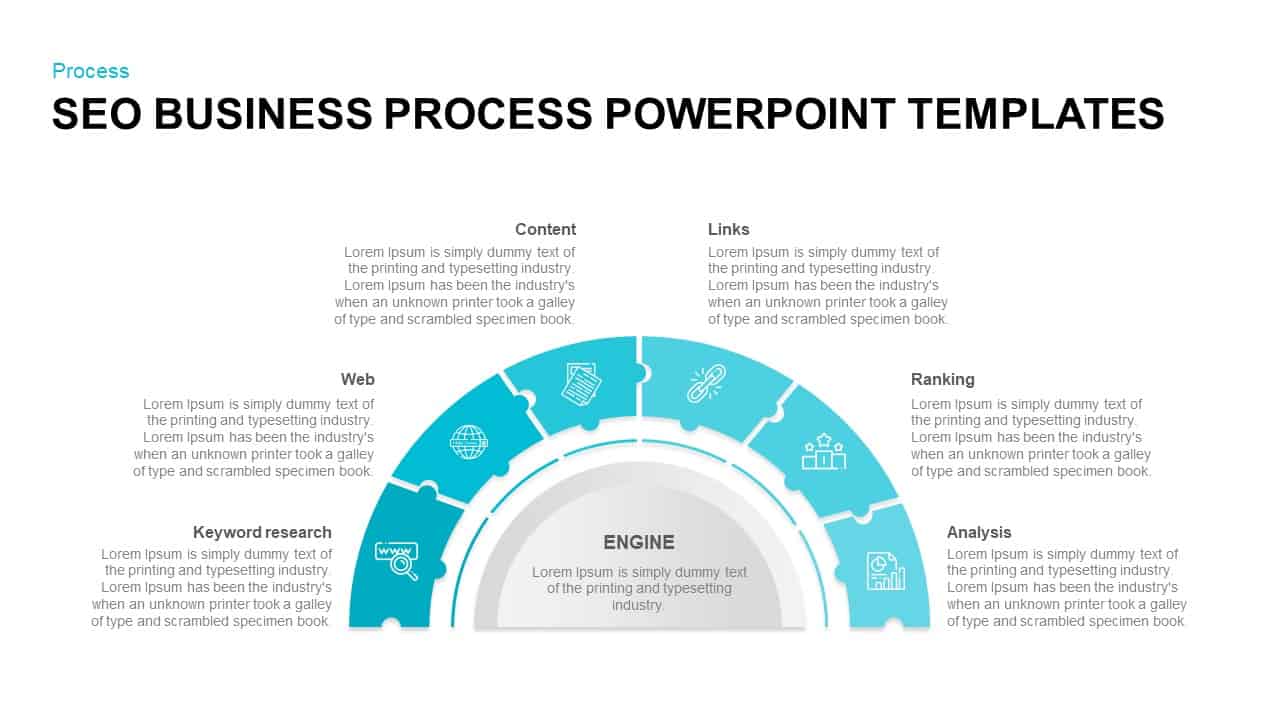
SEO Business Process Puzzle Diagram Template for PowerPoint & Google Slides
Process
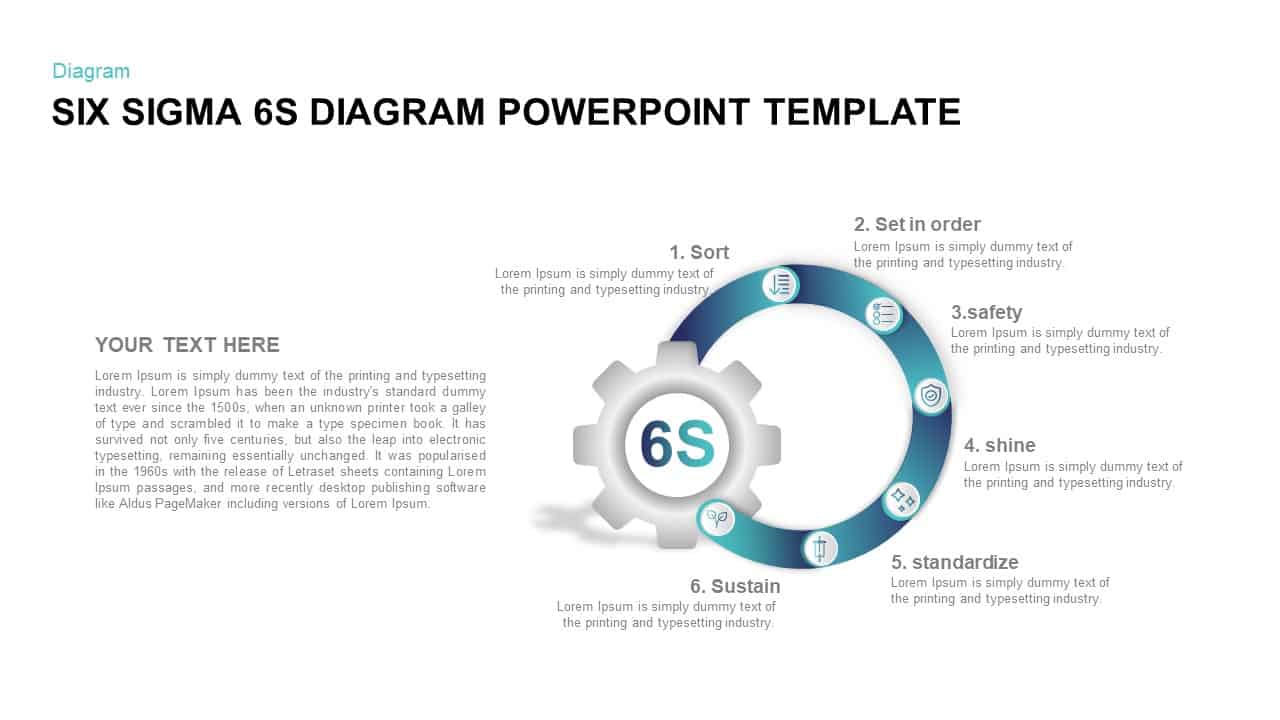
Six Sigma 6S Process Diagram Template for PowerPoint & Google Slides
Process
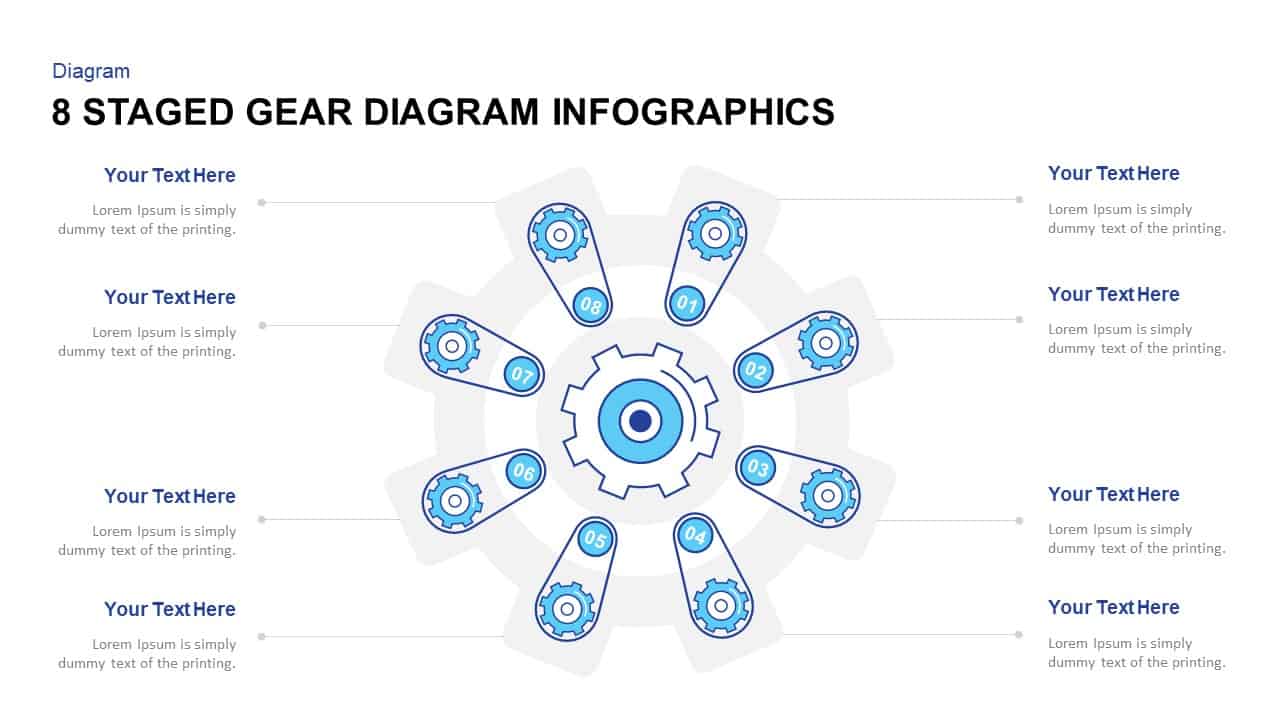
Eight-Stage Gear Diagram Process Template for PowerPoint & Google Slides
Process
Business Process Management Flow Diagram Template for PowerPoint & Google Slides
Process
Colorful 8-Stage Droplet Process Flow Diagram Template for PowerPoint & Google Slides
Process

Editable SIPOC Process Diagram Deck Template for PowerPoint & Google Slides
Pitch Deck
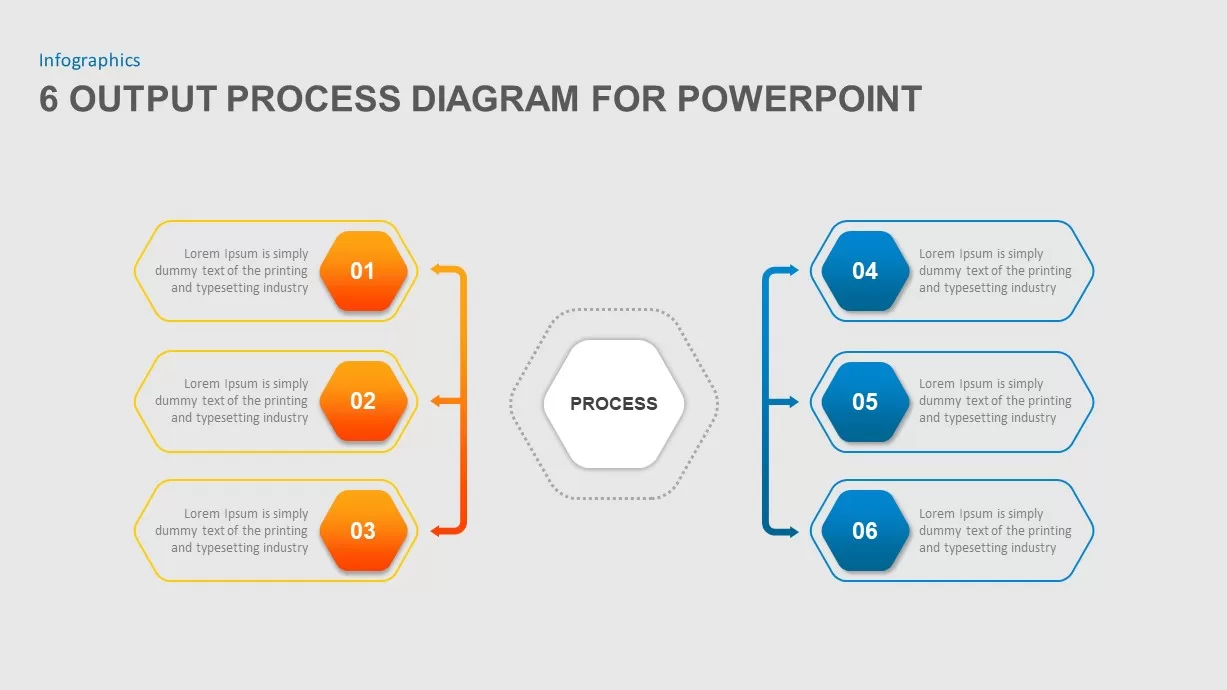
Six-Step Output Process Diagram Template for PowerPoint & Google Slides
Process
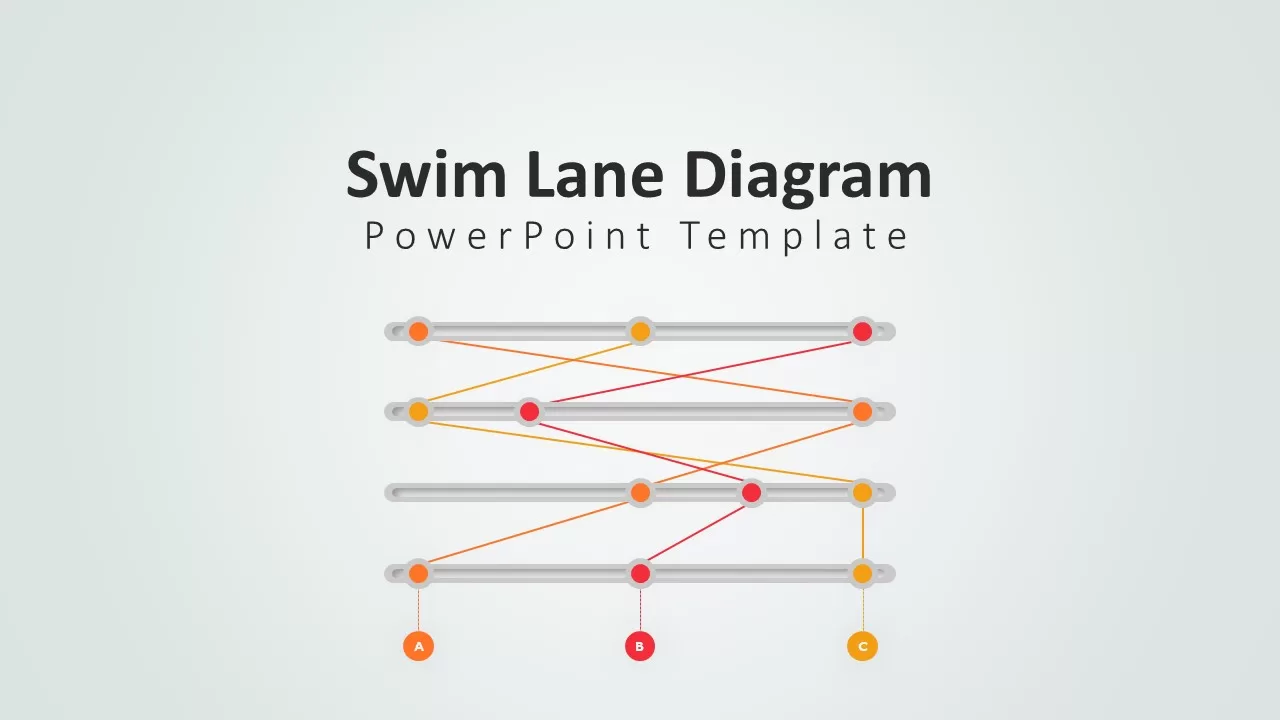
Swim Lane Diagram PowerPoint & Google Slides Template for Process Mapping
Business Strategy
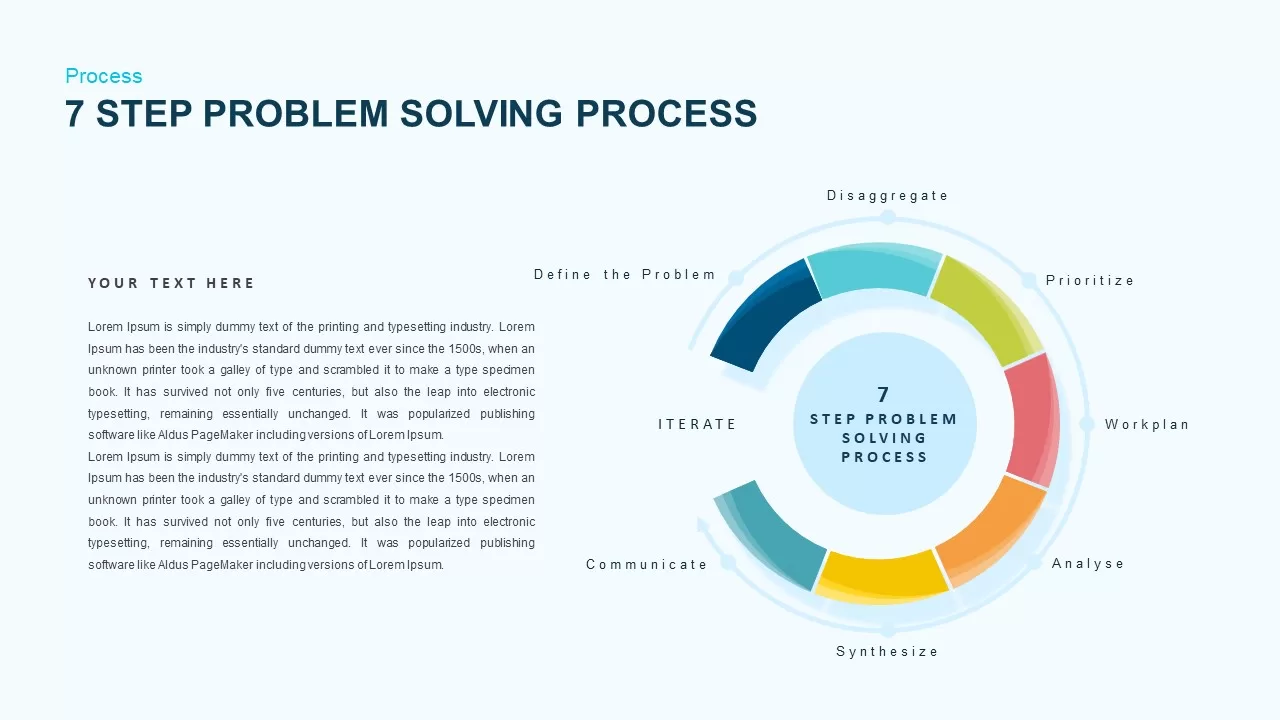
Problem Solving Process Diagram Template for PowerPoint & Google Slides
Process
Animated Six-Stage 3D Process Diagram Template for PowerPoint & Google Slides
Arrow
Curved Arrow Process Flow Diagram Template for PowerPoint & Google Slides
Process
Elegant PDCA Four-Step Process Diagram Template for PowerPoint & Google Slides
Process
Chain Link Process Infographic Diagram Template for PowerPoint & Google Slides
Process
Chain Link Process Infographic Diagram Template for PowerPoint & Google Slides
Process
E-Waste Management Process Flow Diagram Template for PowerPoint & Google Slides
Process
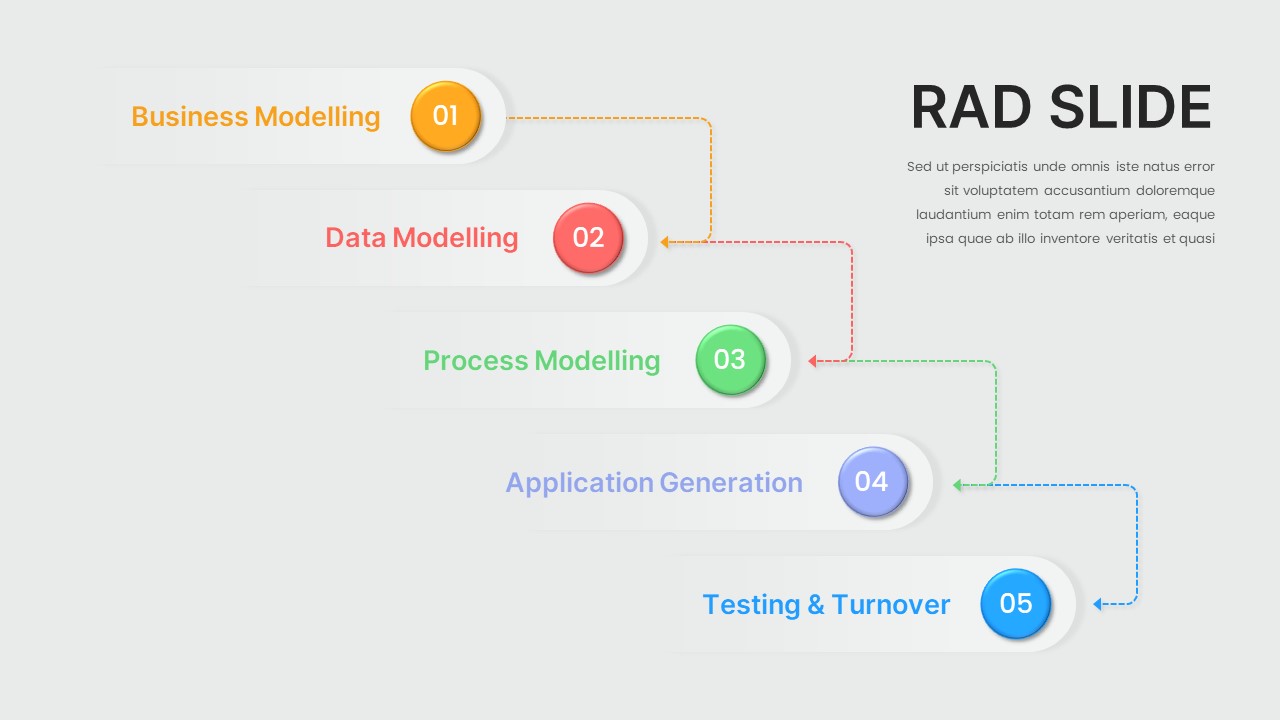
Five-Step Modelling Process Diagram Template for PowerPoint & Google Slides
Process
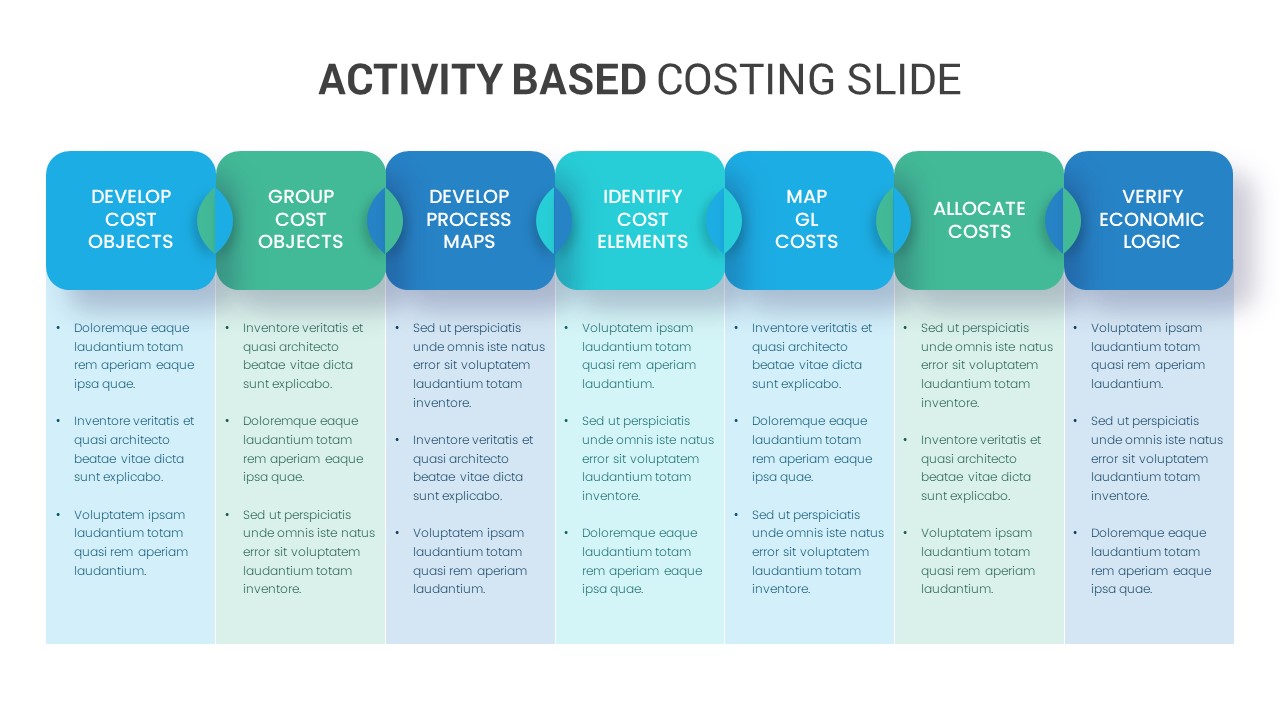
Activity Based Costing Process Diagram Template for PowerPoint & Google Slides
Process
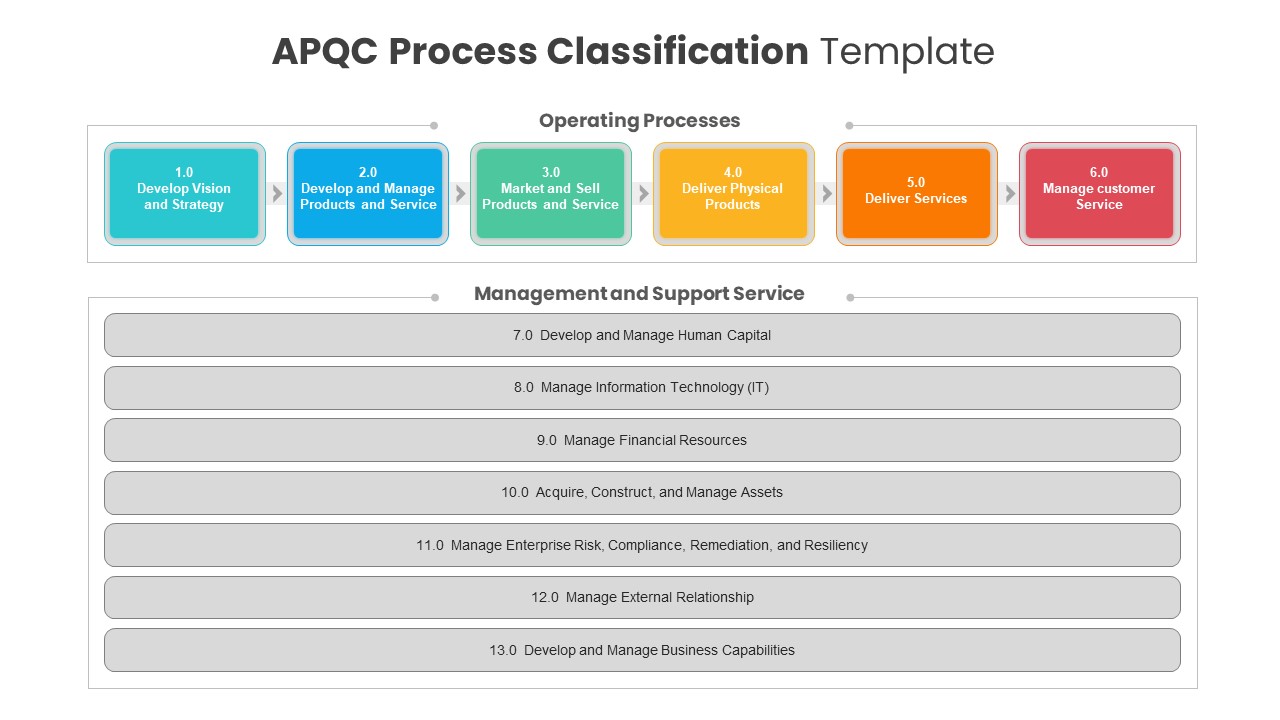
APQC Process Classification Diagram Template for PowerPoint & Google Slides
Process
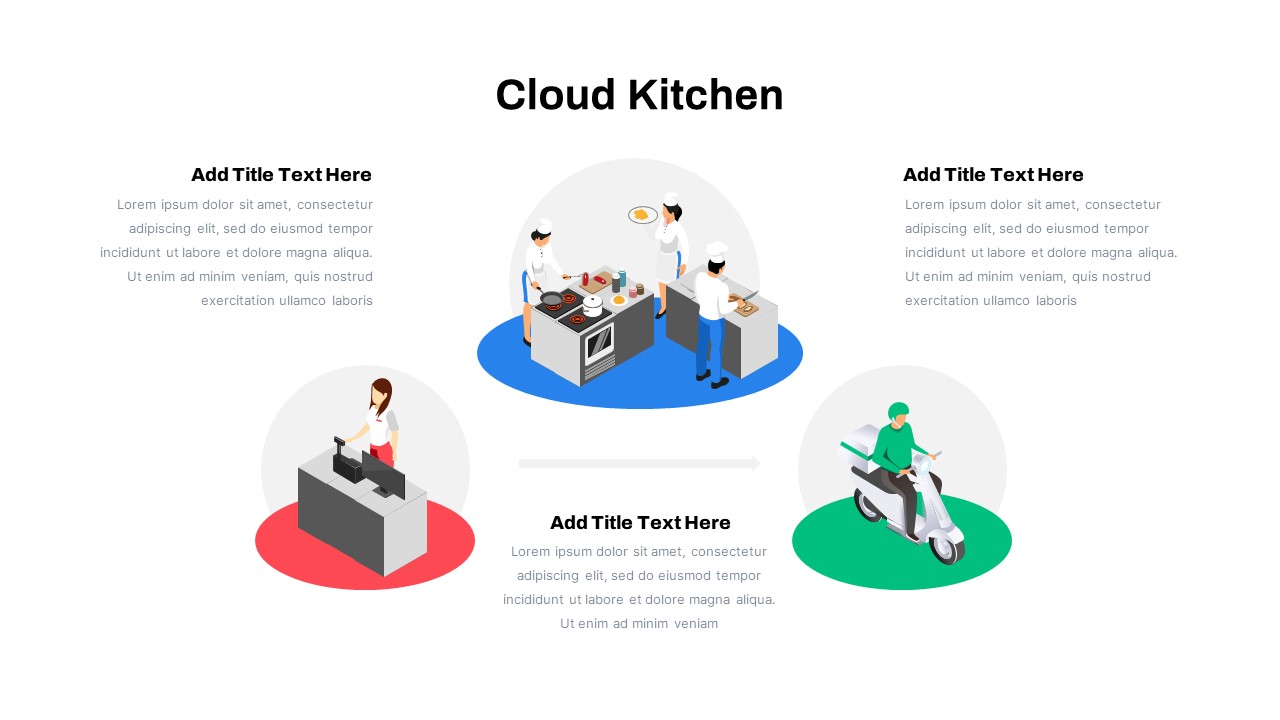
Cloud Kitchen Business Process Diagram Template for PowerPoint & Google Slides
Process
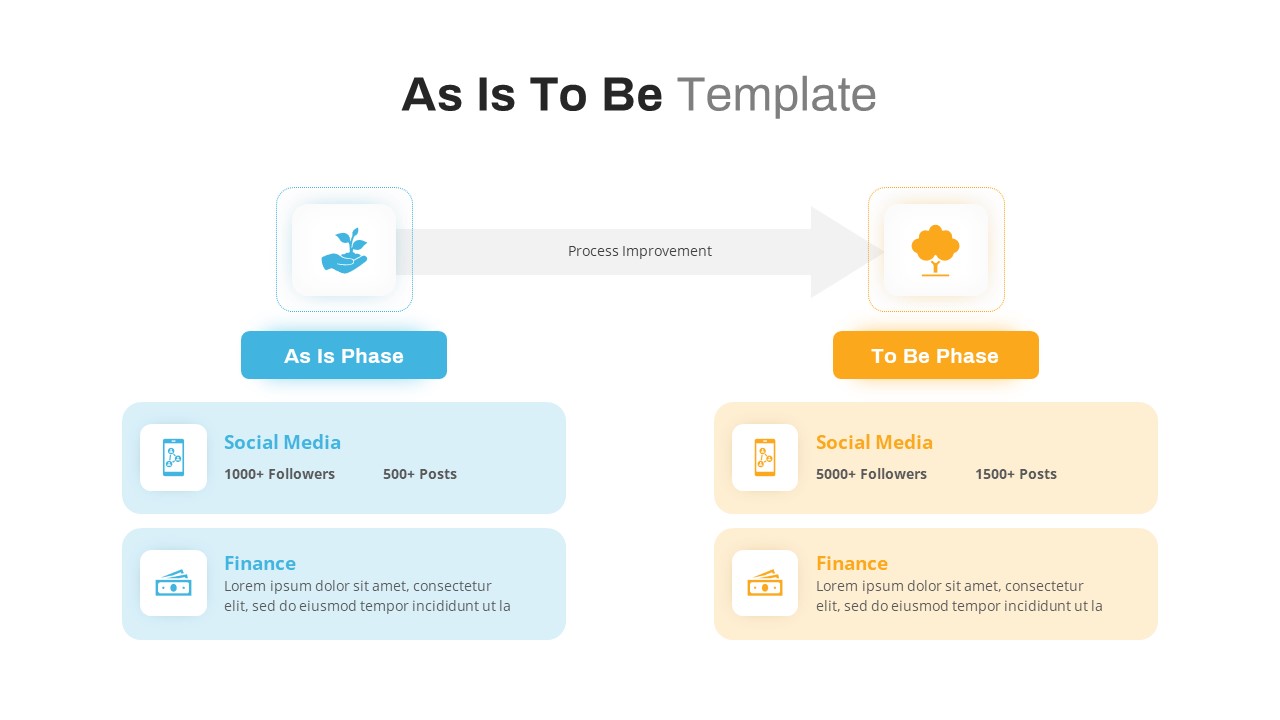
As Is to Be Process Improvement Diagram Template for PowerPoint & Google Slides
Business Strategy
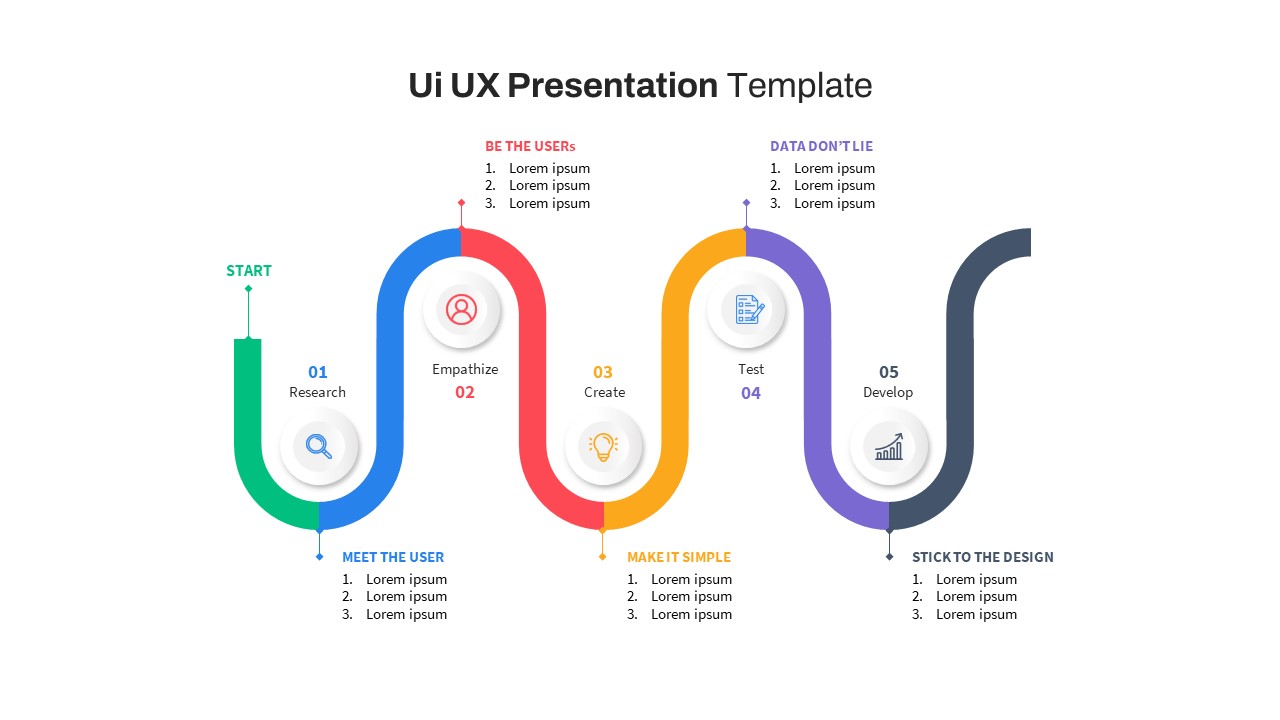
Free UI/UX Process Timeline Diagram Template for PowerPoint & Google Slides
Process
Free
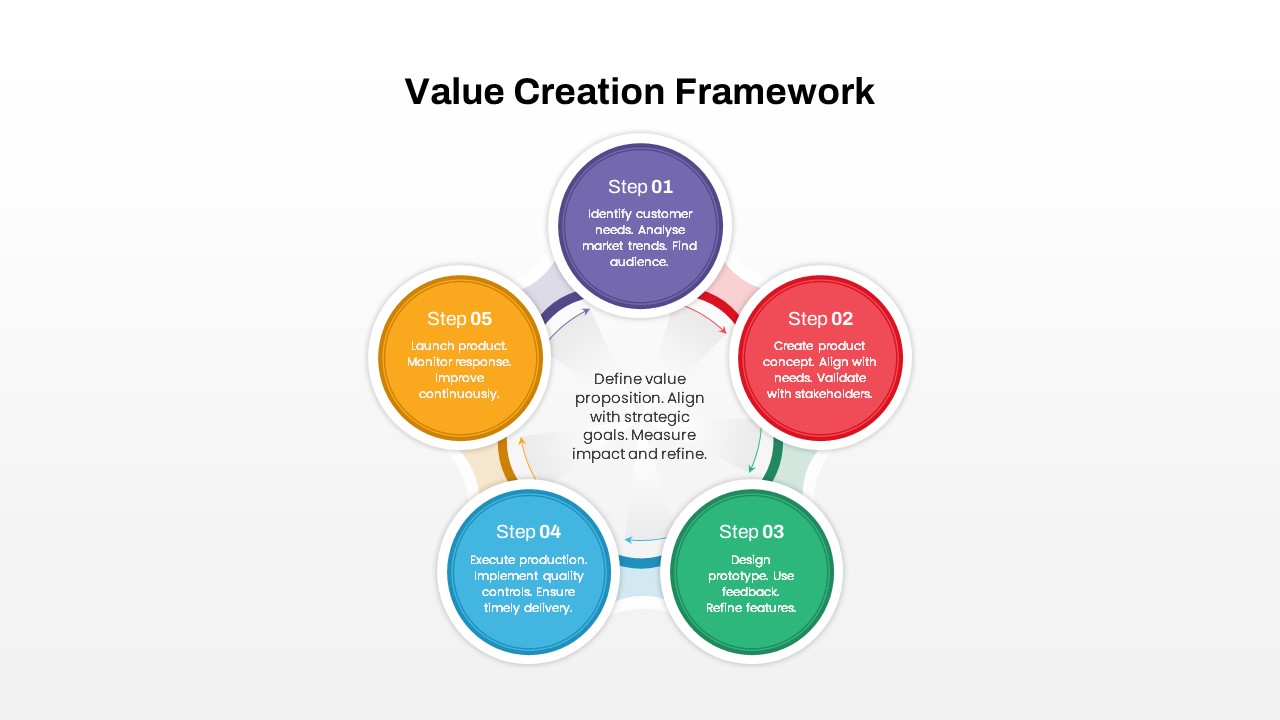
Value Creation Framework Process Diagram Template for PowerPoint & Google Slides
Business Plan
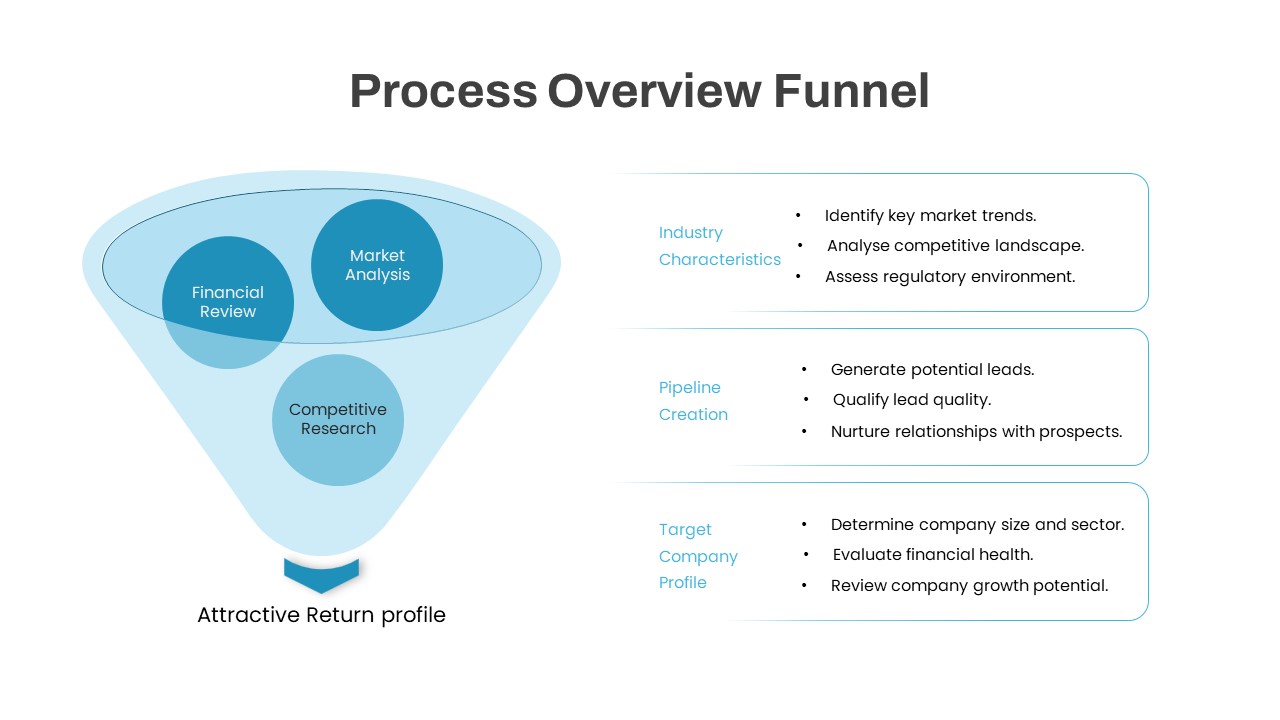
Process Overview Funnel Diagram Template for PowerPoint & Google Slides
Funnel
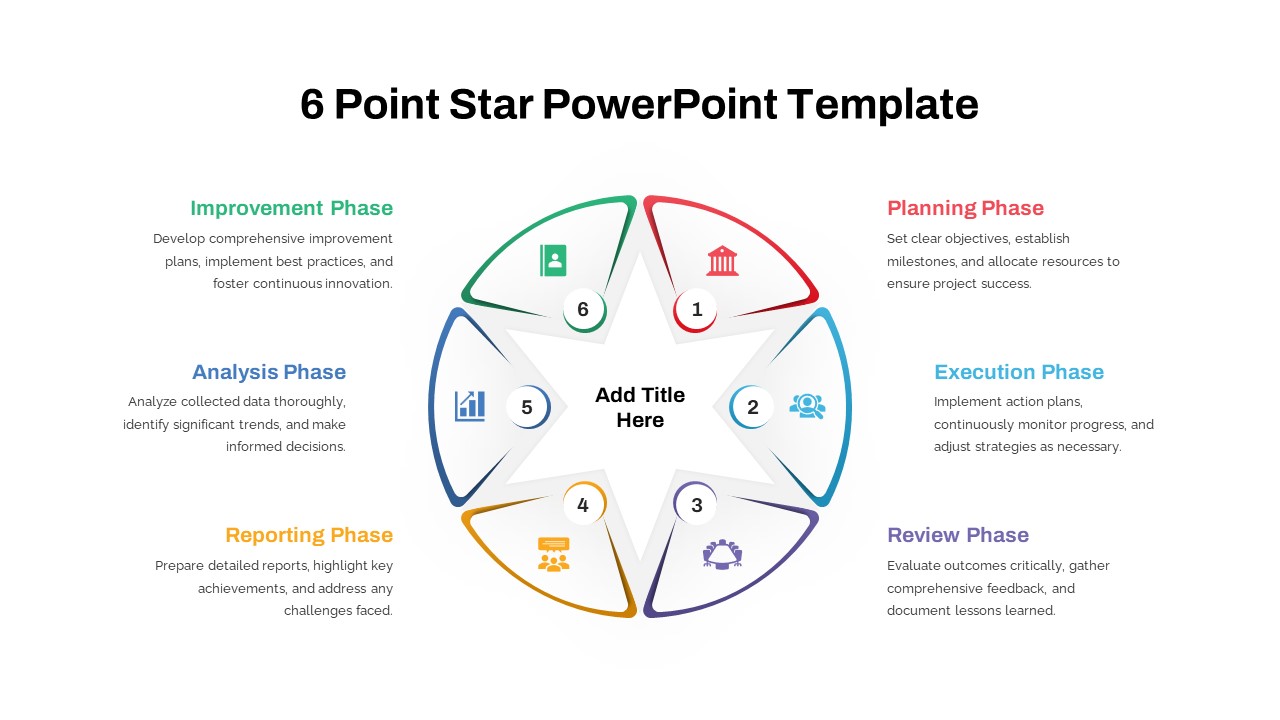
Six-Point Star Process Diagram Template for PowerPoint & Google Slides
Process
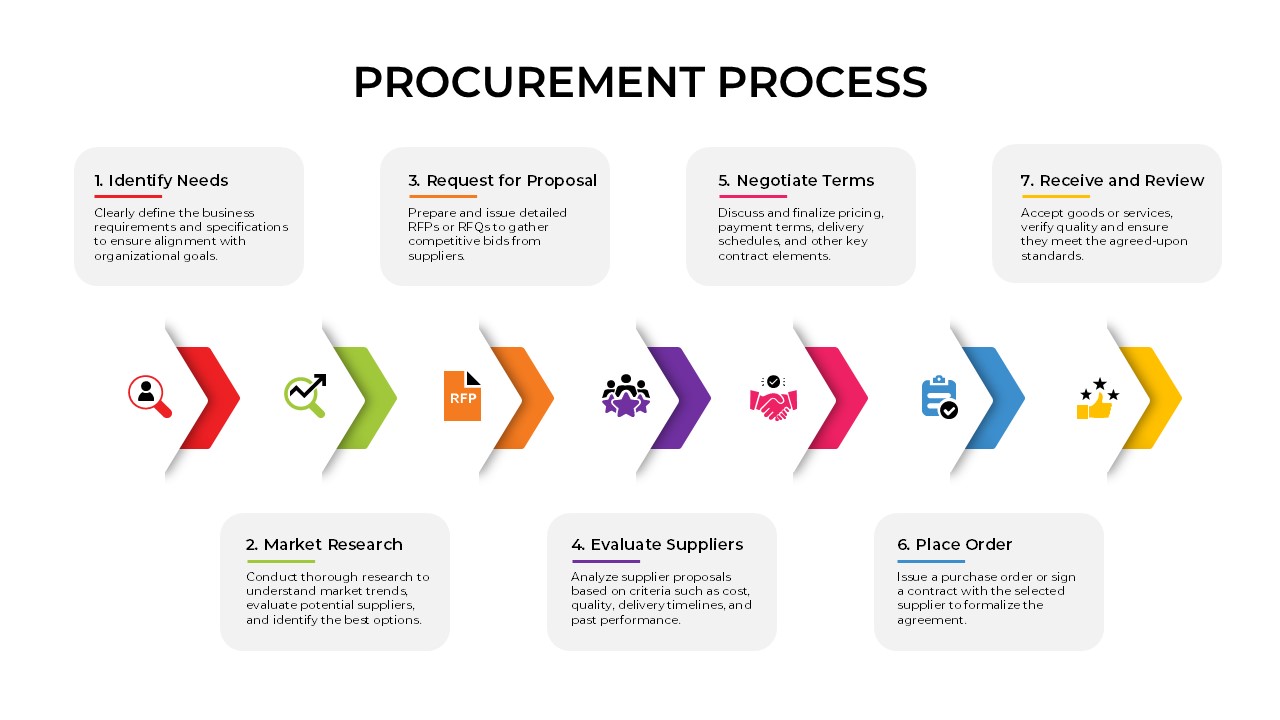
Seven-Step Procurement Process Diagram Template for PowerPoint & Google Slides
Process
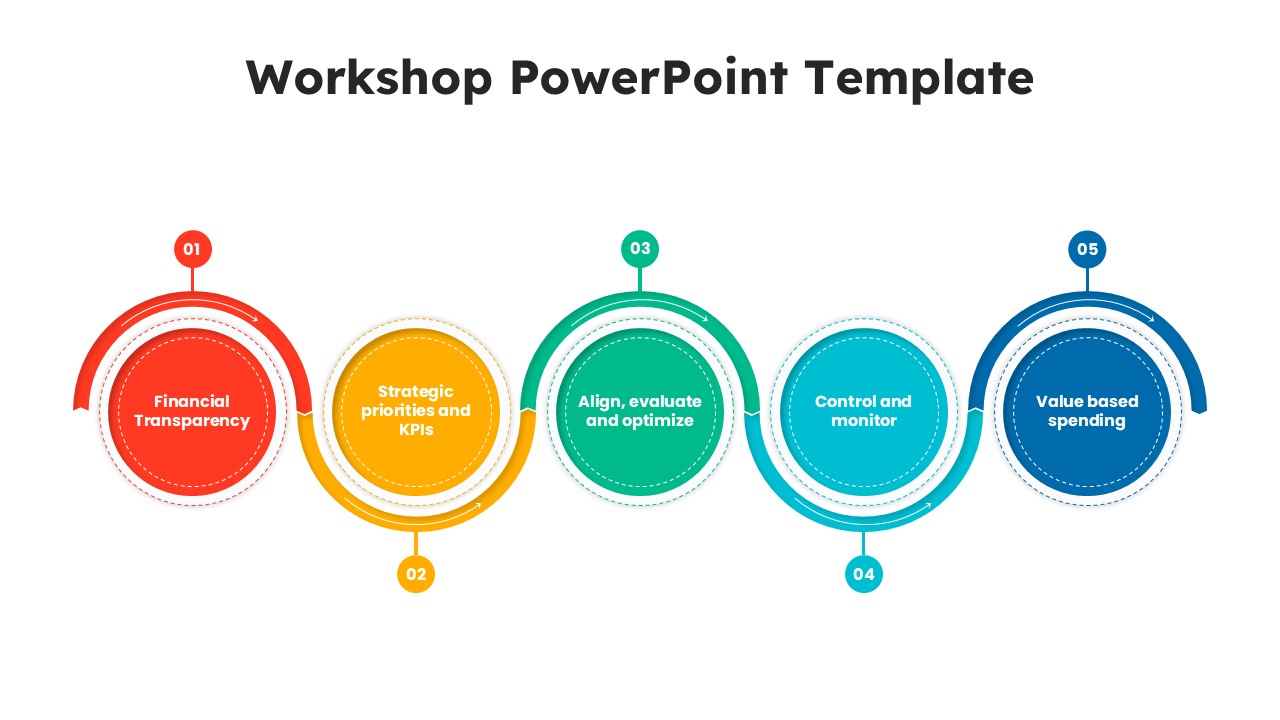
Workshop 5-Step Circular Process Diagram Template for PowerPoint & Google Slides
Circular
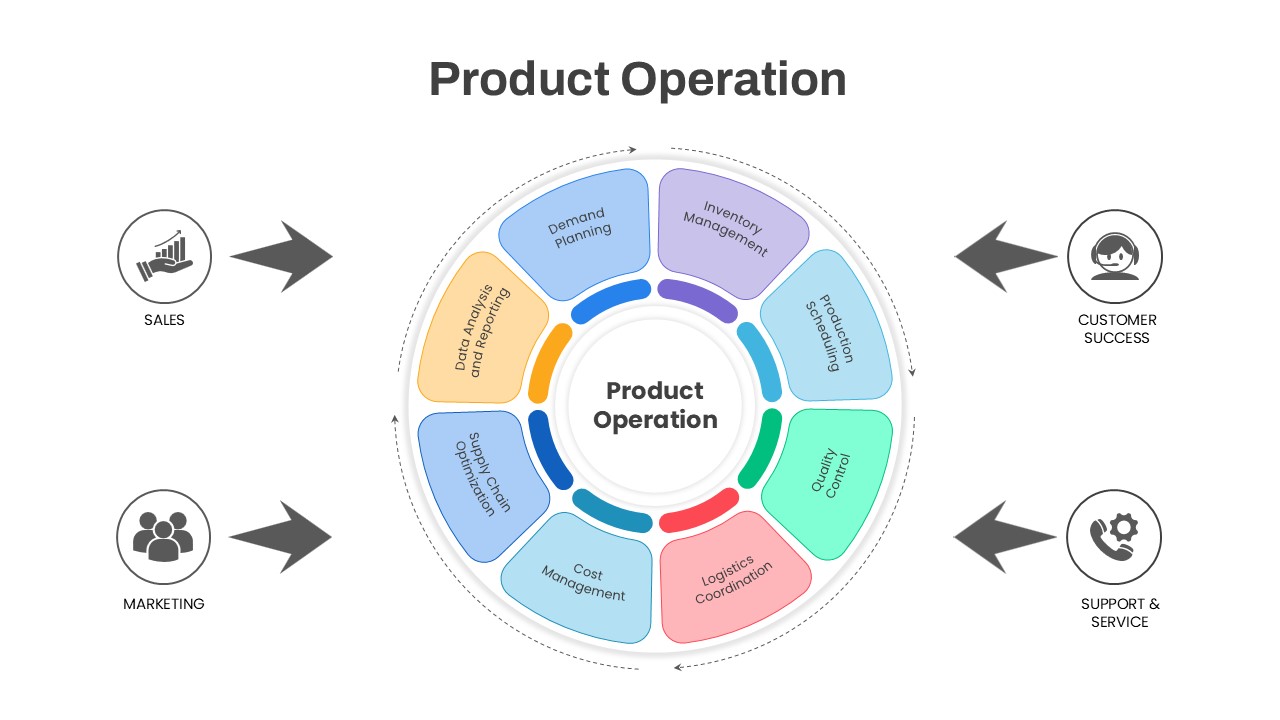
Product Operation Process Diagram Template for PowerPoint & Google Slides
Process
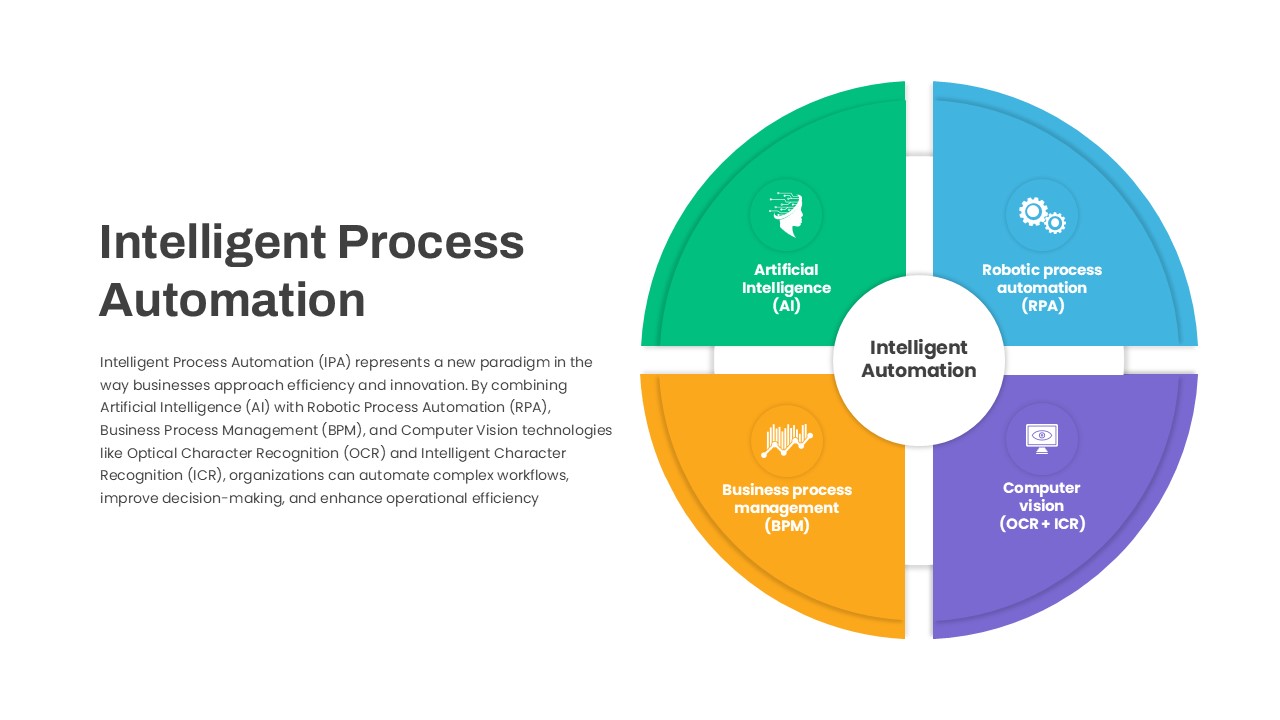
Intelligent Process Automation Diagram Template for PowerPoint & Google Slides
Circular
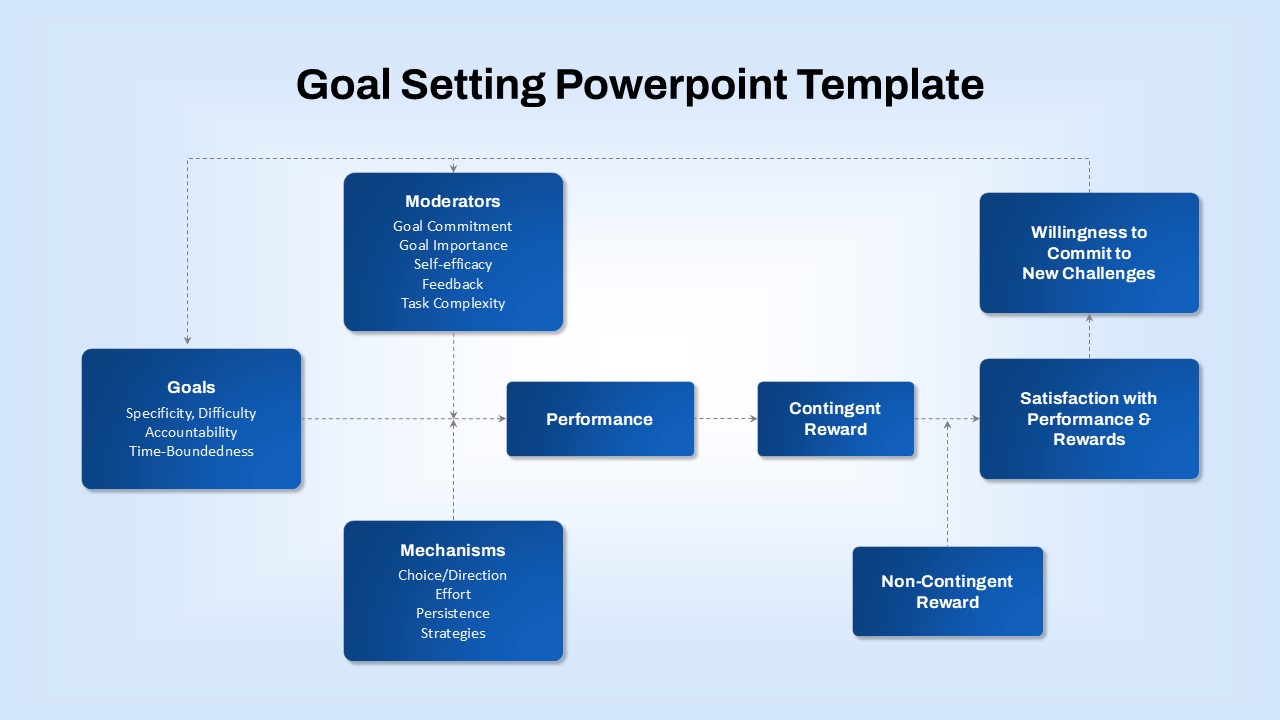
Goal-Setting Process Flow Diagram Template for PowerPoint & Google Slides
Goals
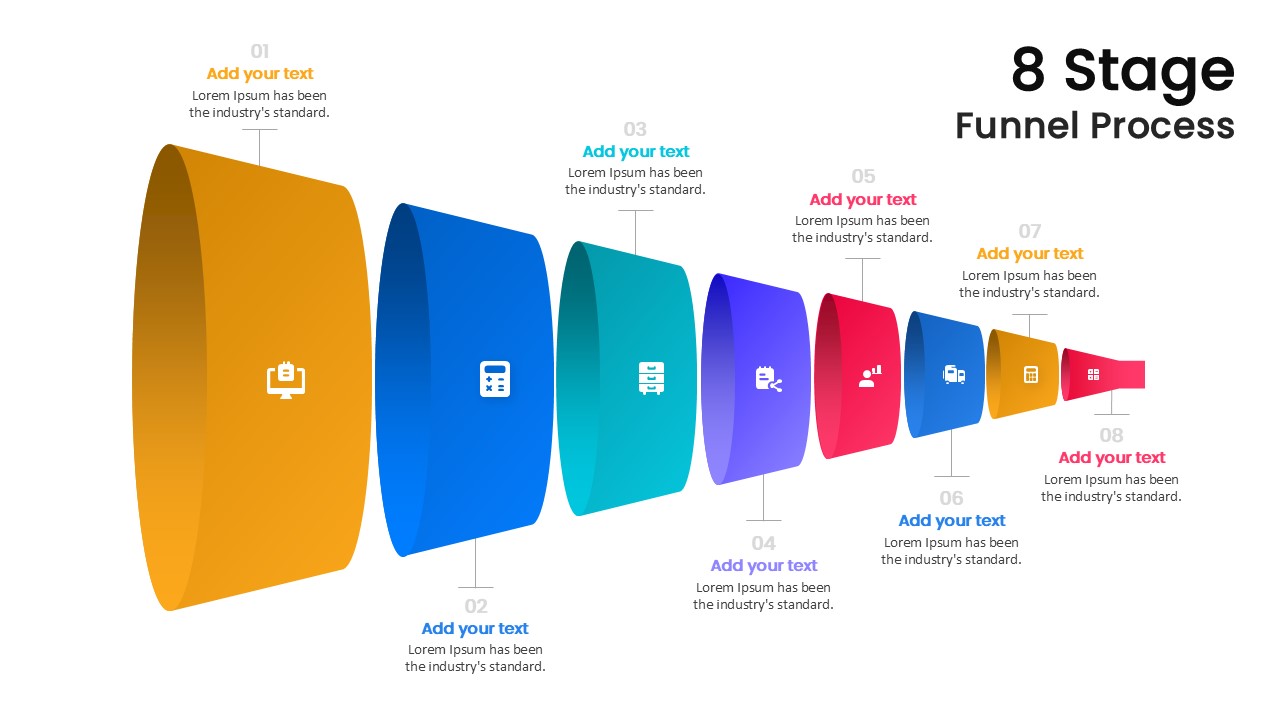
Modern 8-Stage Funnel Process Diagram Template for PowerPoint & Google Slides
Funnel