Robotic Process Automation Diagram Template for PowerPoint & Google Slides
Description
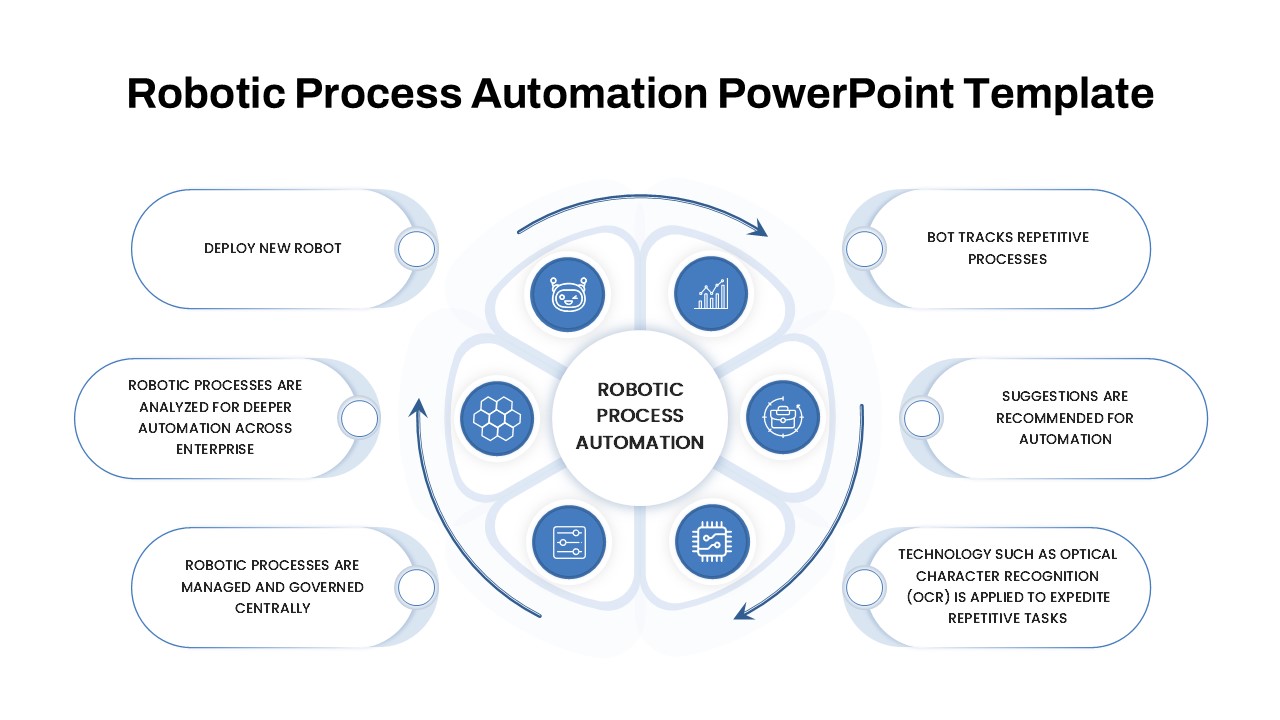
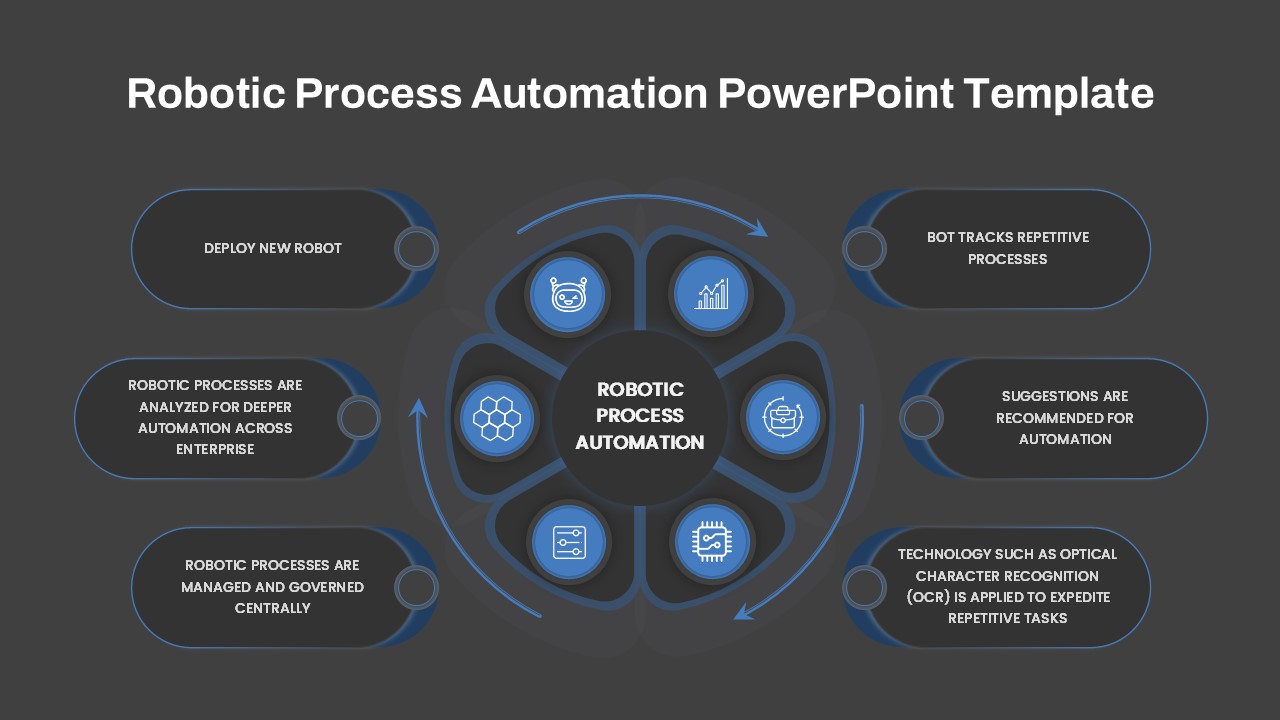
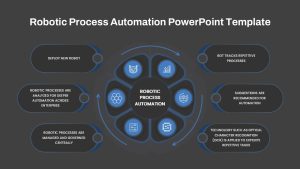
Use this versatile RPA cycle diagram template to visualize the end-to-end robotic process automation workflow in a clean, circular format. The slide centers on a “Robotic Process Automation” hub surrounded by six interlocking segments, each featuring a bold icon within a blue accent circle. Key steps—process tracking, automation suggestion, OCR task acceleration, central governance, deeper enterprise analysis, and new robot deployment—are displayed through editable callout labels connected to each segment by subtle pointer lines. The outer cycle arrows reinforce the continuous nature of automation improvement and help guide audience focus.
Built for both PowerPoint and Google Slides, this asset leverages master slide layouts and intuitive placeholders that let you swap icons, edit labels, adjust segment order, or update accent colors to align with corporate branding in seconds. The minimal flat design, crisp typography, and generous white space ensure maximum readability and a polished, professional look across devices. Subtle drop shadows on callout boxes and segments add depth without clutter, while the balanced circular arrangement keeps each automation stage equally prominent.
This template eliminates formatting headaches by preserving alignment, spacing, and resolution consistency when scaling or duplicating slides. Whether you’re preparing an operations review, automation roadmap presentation, or technology strategy pitch, this diagram delivers clarity and impact. Simply duplicate the slide to illustrate parallel processes, overlay performance metrics in the central hub, or customize segment count to match specific workflow variations. Leverage this slide to benchmark team performance or track automation ROI metrics directly within the central hub.
Who is it for
Automation engineers, process improvement managers, IT leaders, and operations teams will find this RPA cycle diagram invaluable for presenting automation roadmaps, performance benchmarks, and continuous improvement strategies to stakeholders.
Other Uses
Repurpose this circular framework for any six-stage lifecycle or feedback loop—including IT incident management, compliance monitoring cycles, service-delivery workflows, or continuous improvement models. Easily relabel segments to map project phases, KPI dashboards, or training curricula.
Login to download this file

Item ID
SB04459
Related Templates

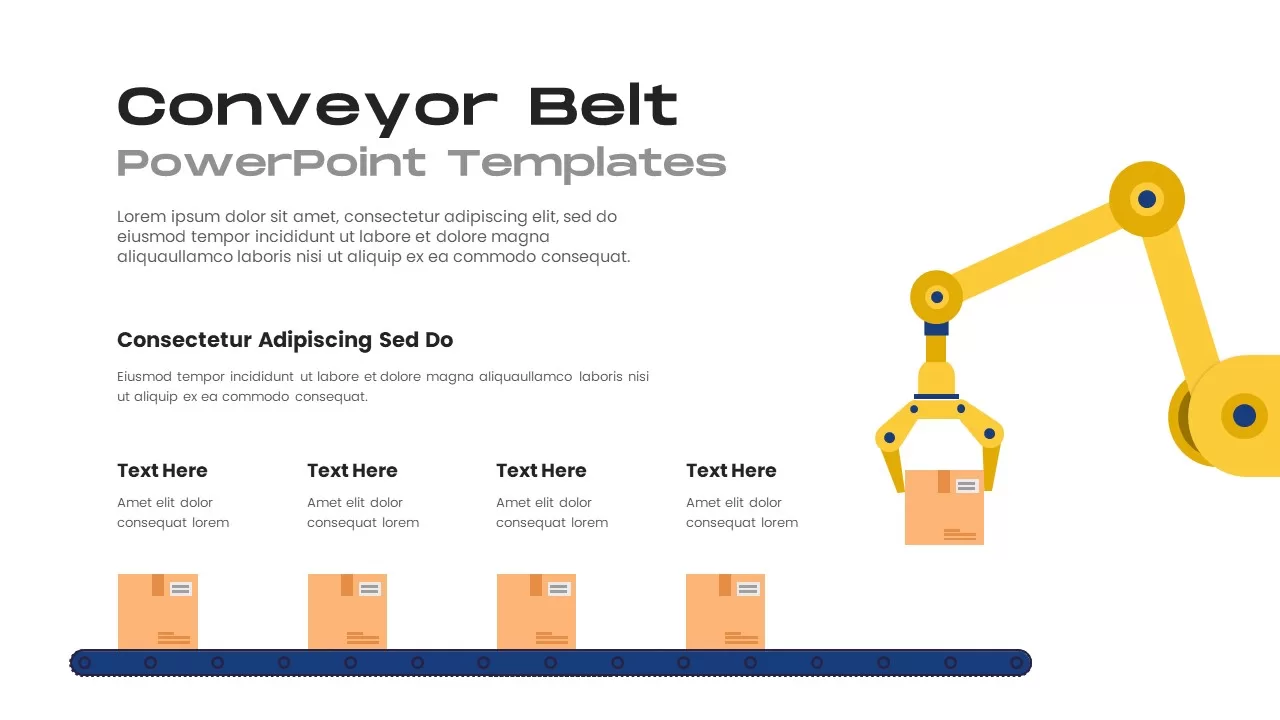
Robotic Conveyor Belt Process Diagram Template for PowerPoint & Google Slides
Process

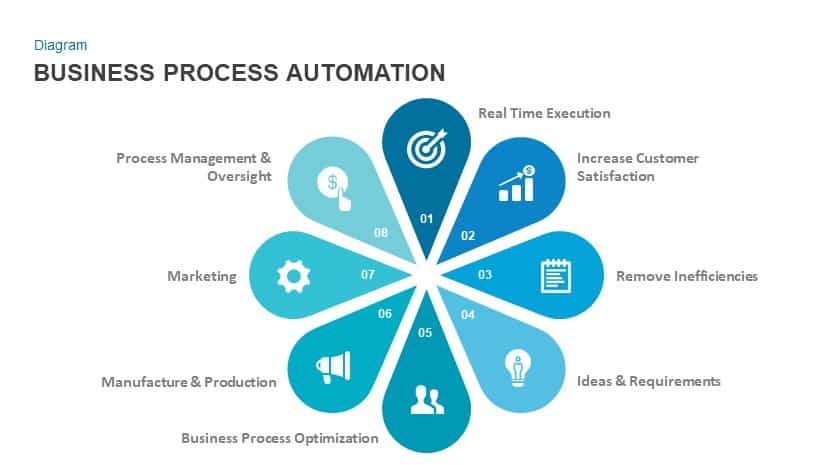
Business Process Automation Diagram Template for PowerPoint & Google Slides
Process
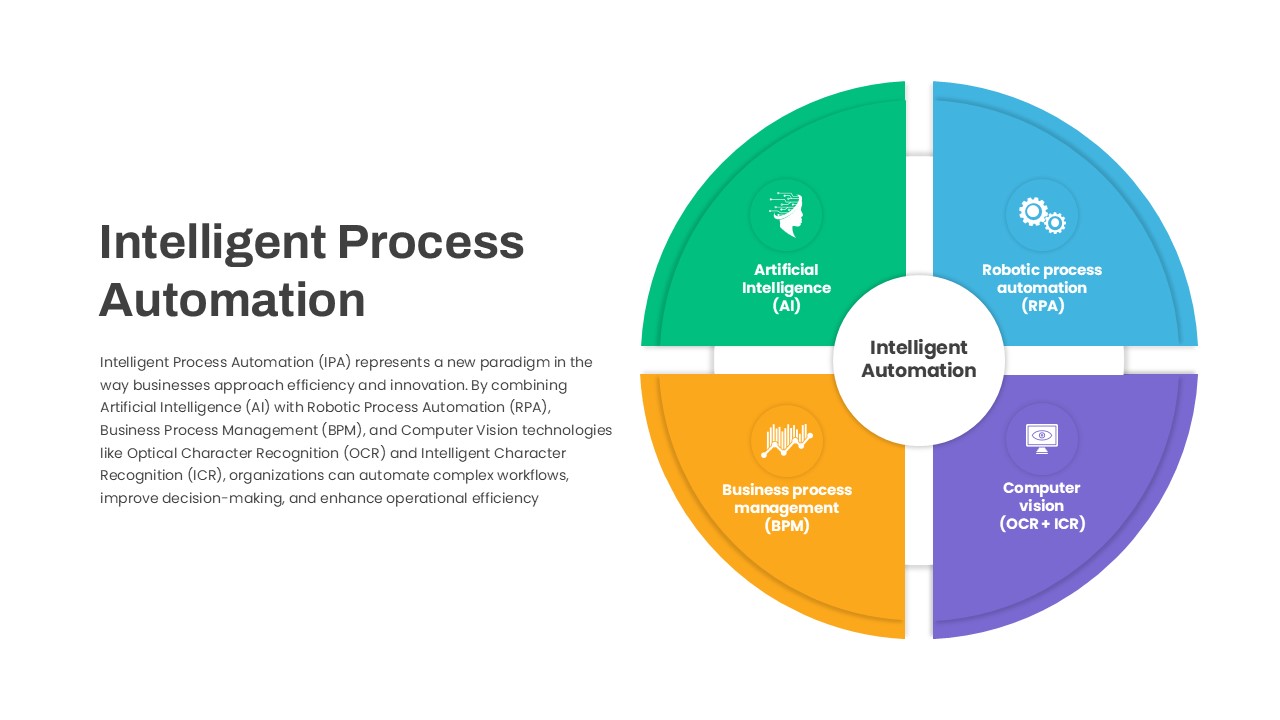
Intelligent Process Automation Diagram Template for PowerPoint & Google Slides
Circular
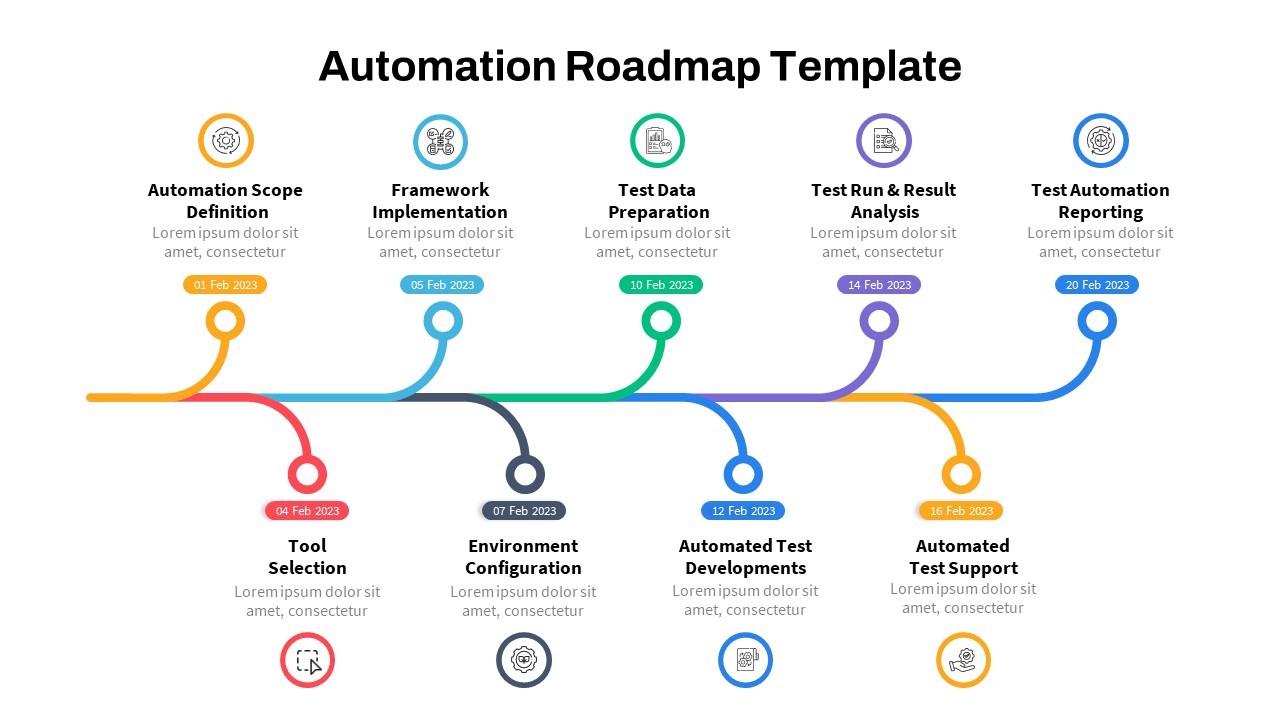
Automation Process Roadmap Infographic Template for PowerPoint & Google Slides
Roadmap
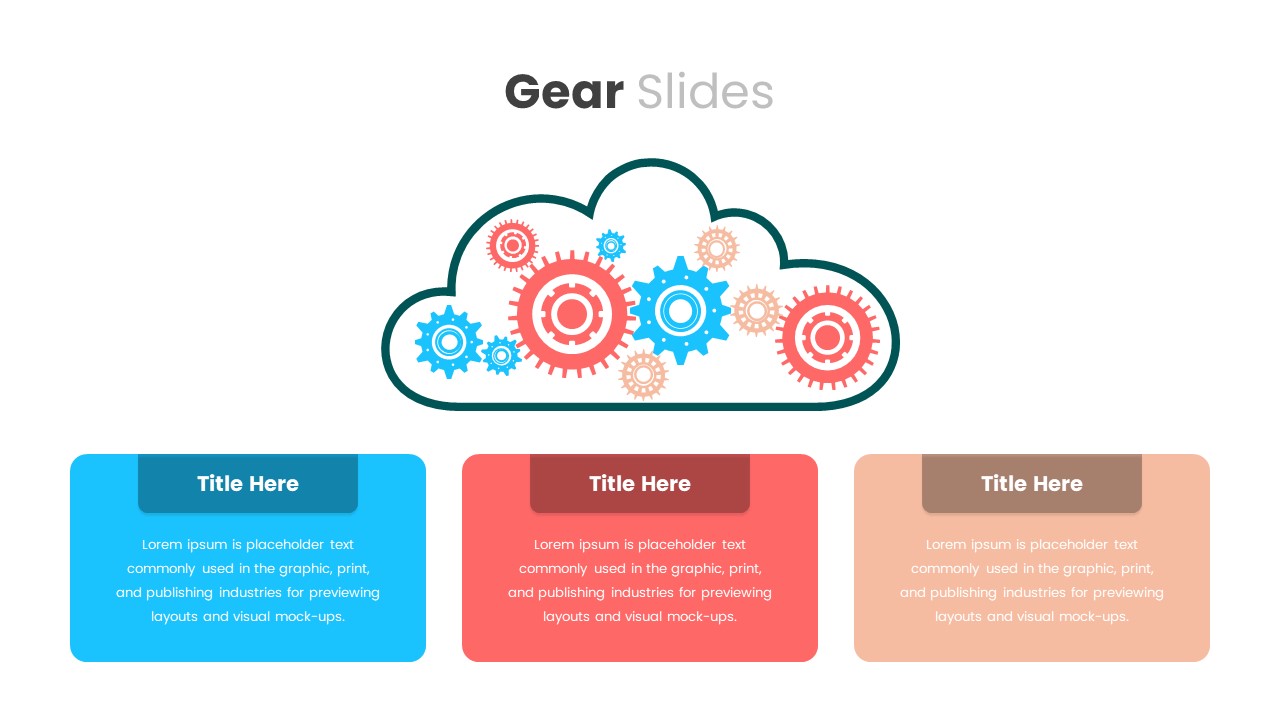
Cloud Gear Automation Diagram Template for PowerPoint & Google Slides
Cloud Computing
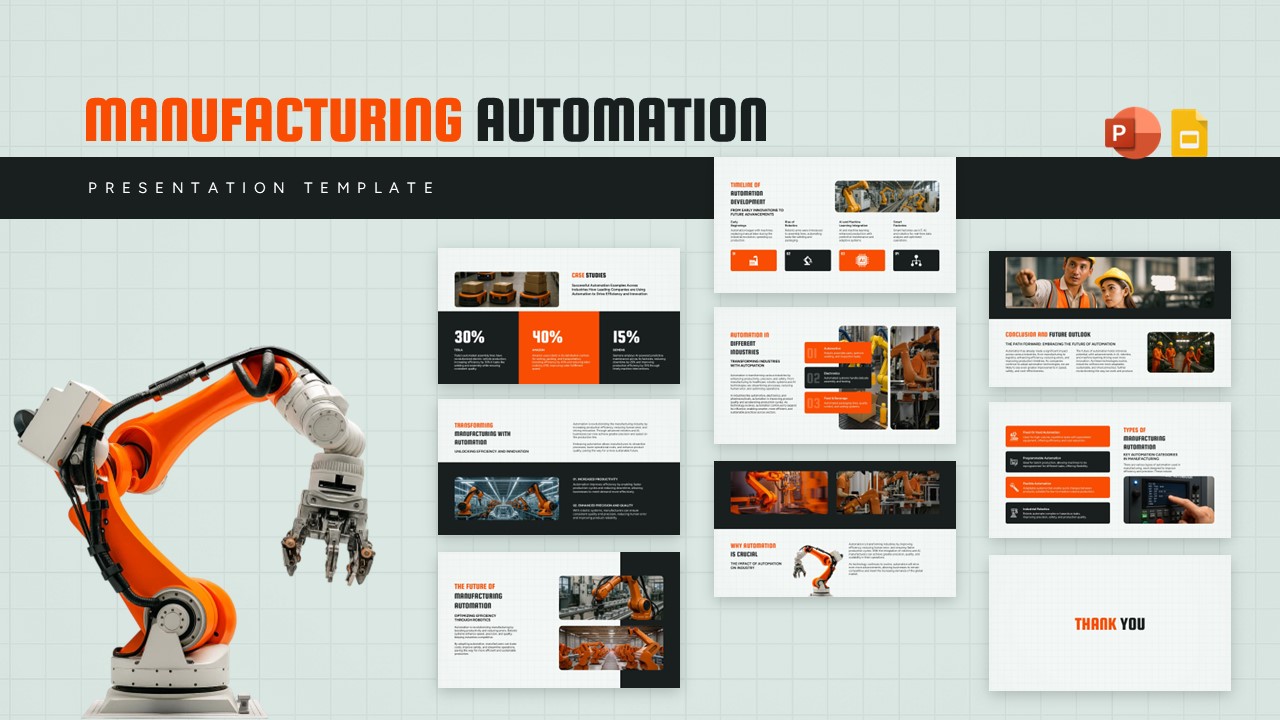
Manufacturing And Automation Presentation Template for PowerPoint & Google Slides
Company Profile
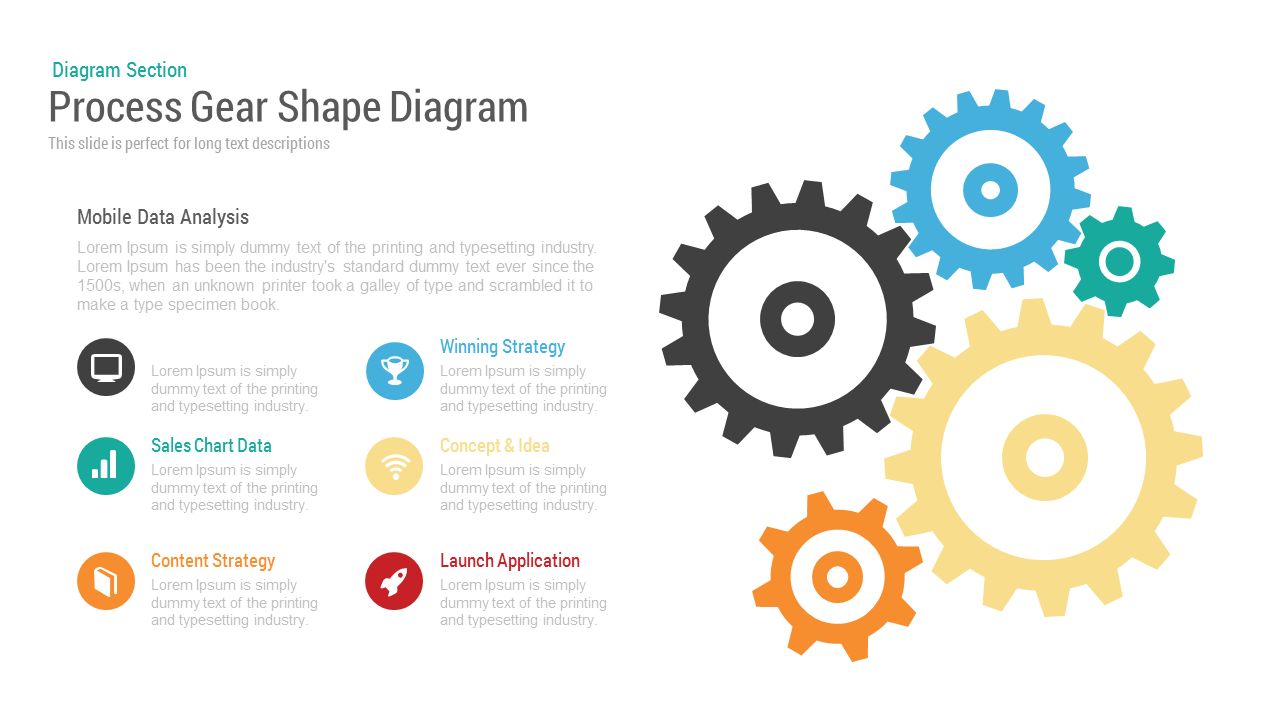
Gear Process Diagram PowerPoint Template for PowerPoint & Google Slides
Process
Sales Process Workflow Funnel Diagram PowerPoint Template for PowerPoint & Google Slides
Funnel
Gear Process Diagram template for PowerPoint & Google Slides
Process
5 Arrow Process Diagram Template for PowerPoint & Google Slides
Infographics
Six Hexagon Stages Process Flow Diagram Template for PowerPoint & Google Slides
Process
6-Step Arrow Process Diagram Template for PowerPoint & Google Slides
Process
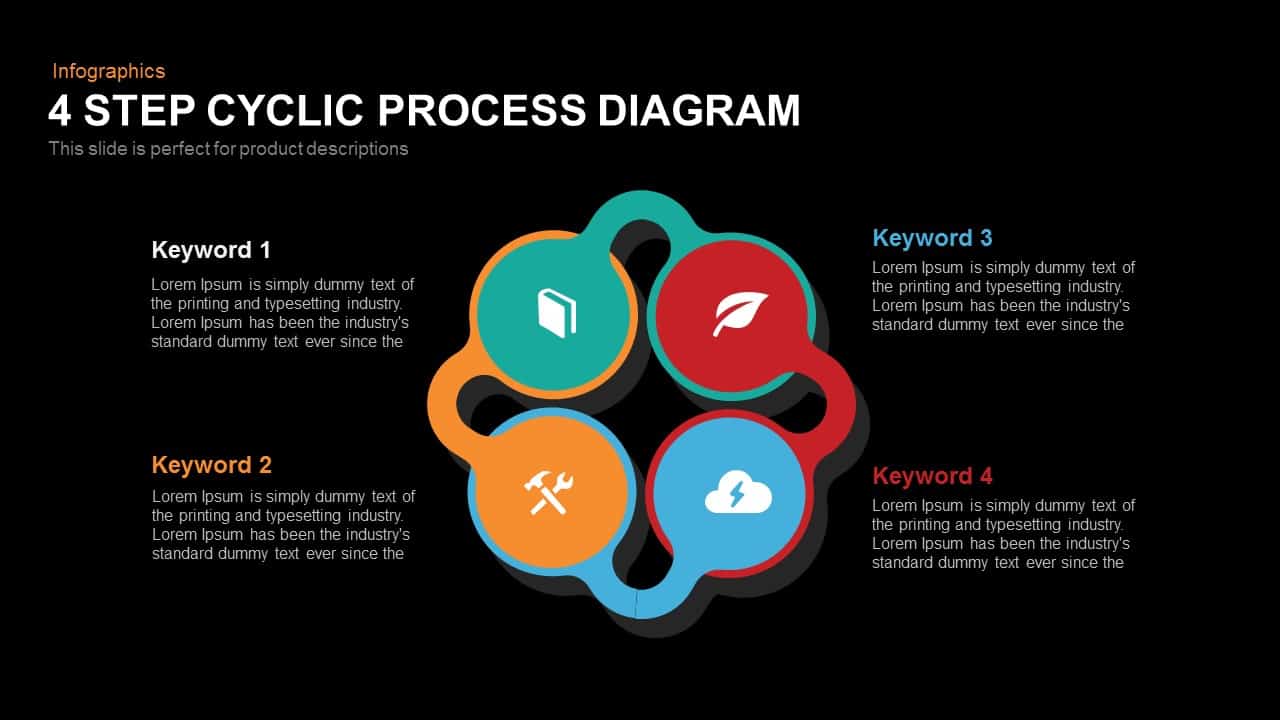
Modern 4-Step Cyclic Process Diagram Template for PowerPoint & Google Slides
Circular
Three Circle Arrow Process Diagram template for PowerPoint & Google Slides
Circular
Process Flow Diagram template for PowerPoint & Google Slides
Infographics
Gear Process Phase Diagram template for PowerPoint & Google Slides
Process

Five-Step Gear Process Diagram Template for PowerPoint & Google Slides
Process
Three Stage 3D Arrow Process Diagram Template for PowerPoint & Google Slides
Process
Arrow Stage Process Diagram template for PowerPoint & Google Slides
Arrow

Dynamic 4 Gear Process Diagram Template for PowerPoint & Google Slides
Process
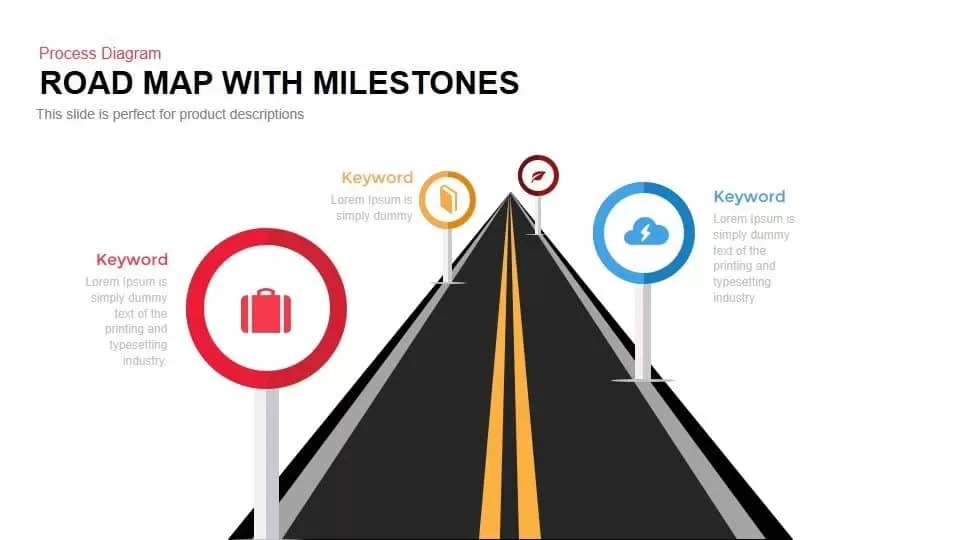
Roadmap with Milestones Process Diagram Template for PowerPoint & Google Slides
Roadmap
Pie Segment Diagram Four-Step Process Template for PowerPoint & Google Slides
Pie/Donut
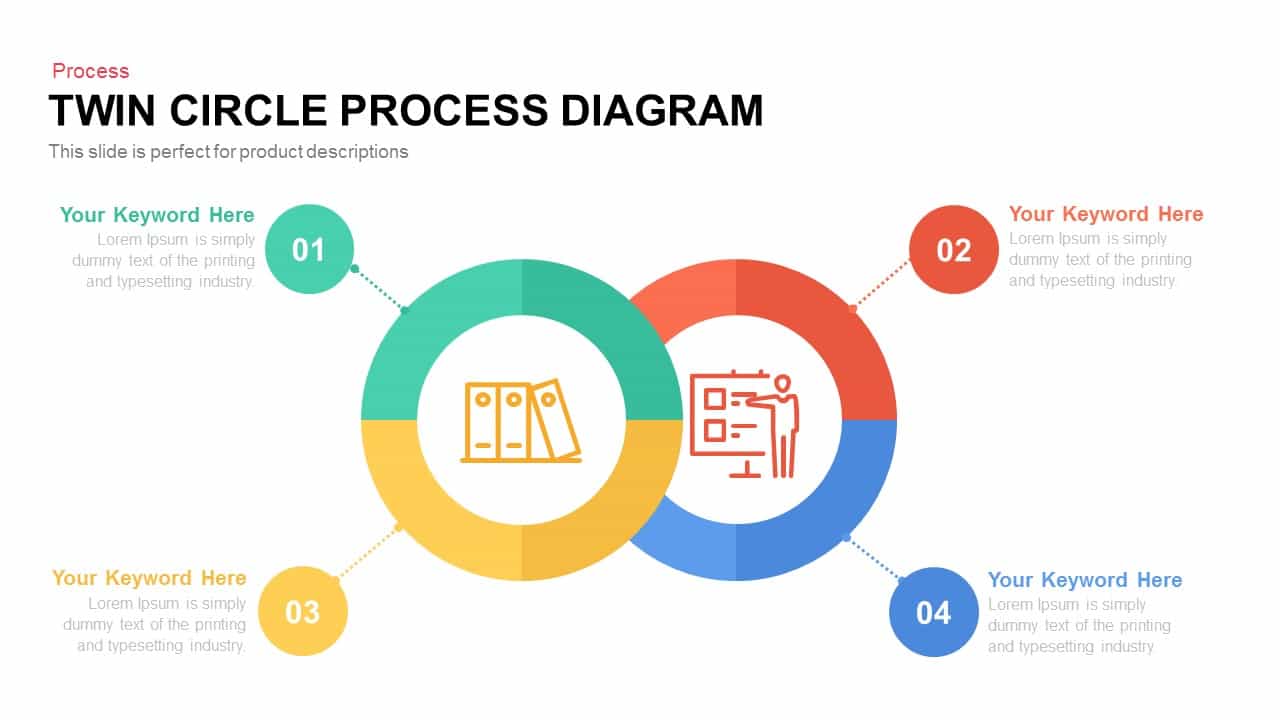
Editable Twin Circle Process Diagram Template for PowerPoint & Google Slides
Process
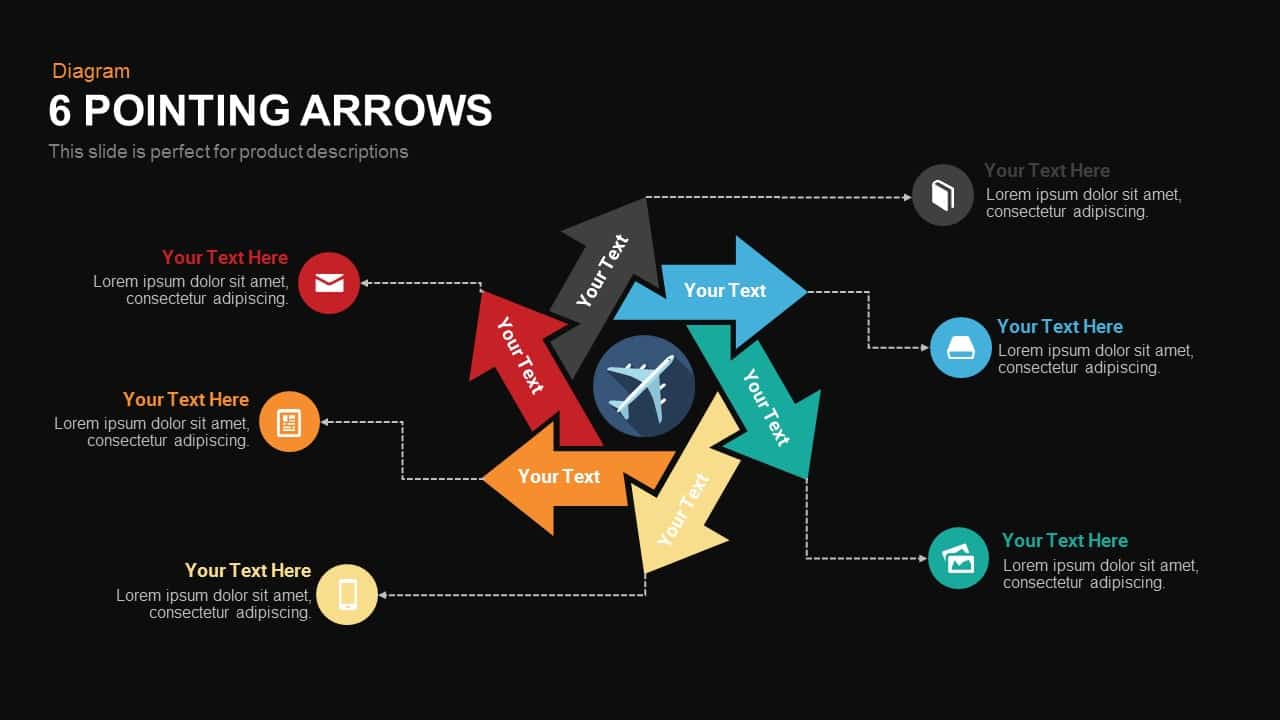
Six Pointing Arrow Process Diagram Template for PowerPoint & Google Slides
Arrow
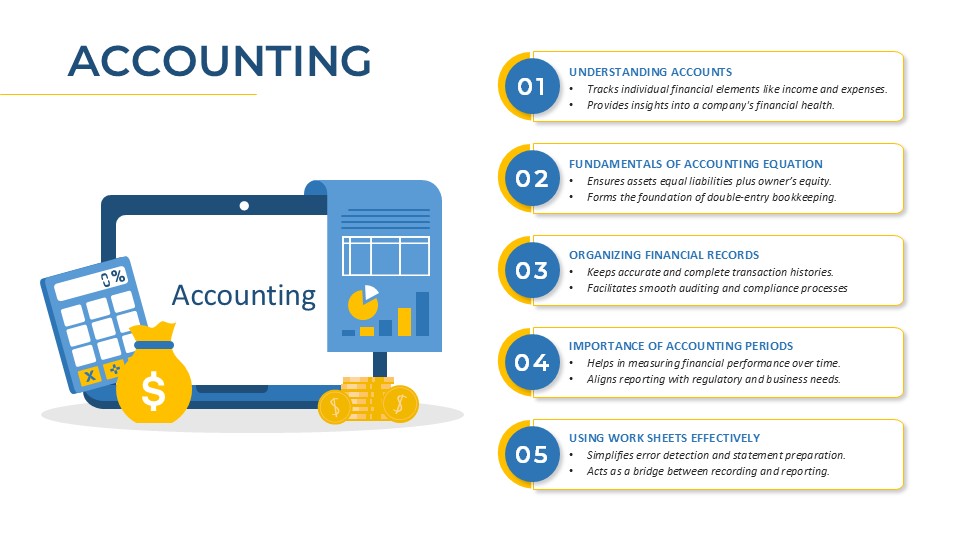
Accounting Process Metaphor Diagram Template for PowerPoint & Google Slides
Accounting
Modern Five-Stage Cycle Process Diagram Template for PowerPoint & Google Slides
Process
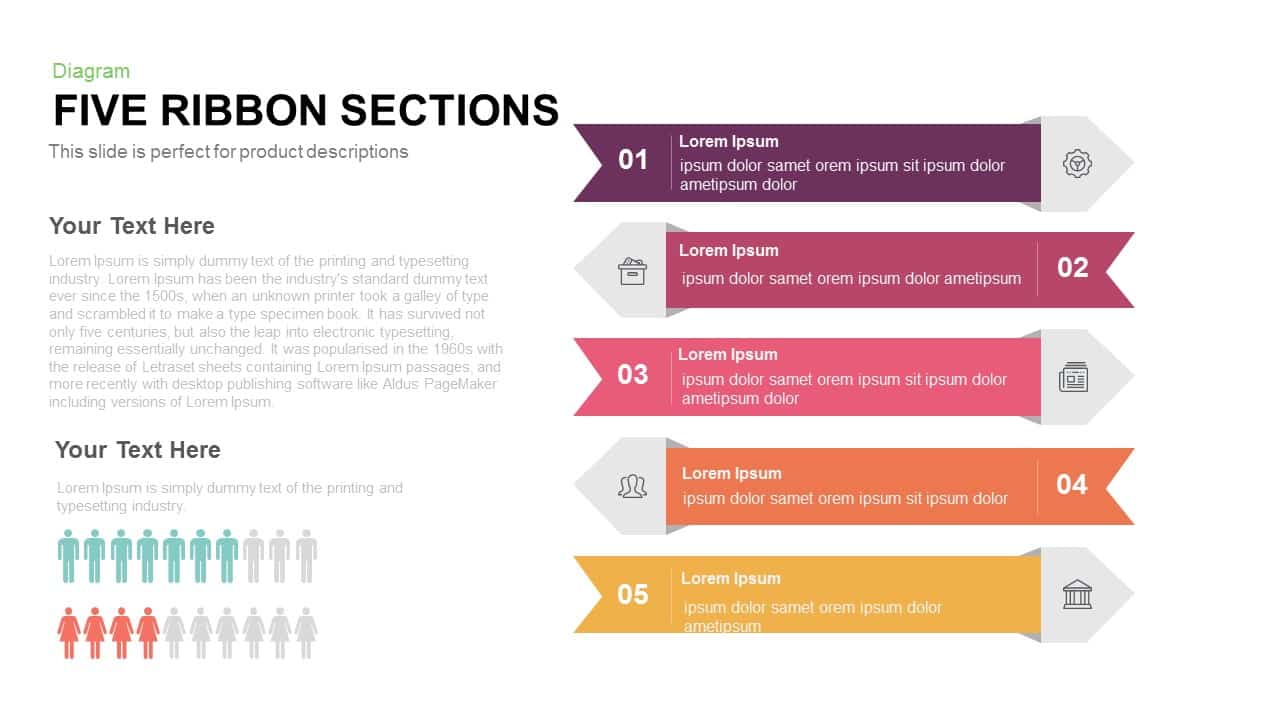
Five Ribbon Sections Process Diagram Template for PowerPoint & Google Slides
Process
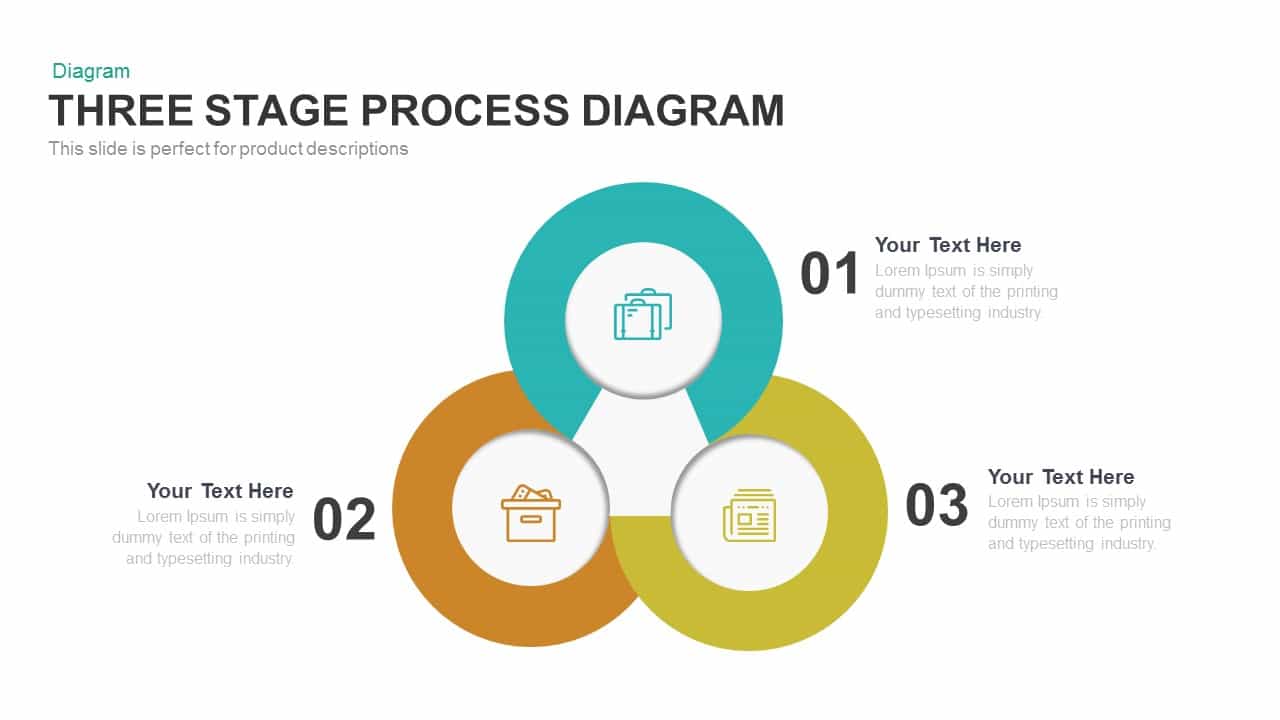
Engaging Three-Stage Process Diagram Template for PowerPoint & Google Slides
Process
Five Stage Process Diagram Infographic Template for PowerPoint & Google Slides
Process

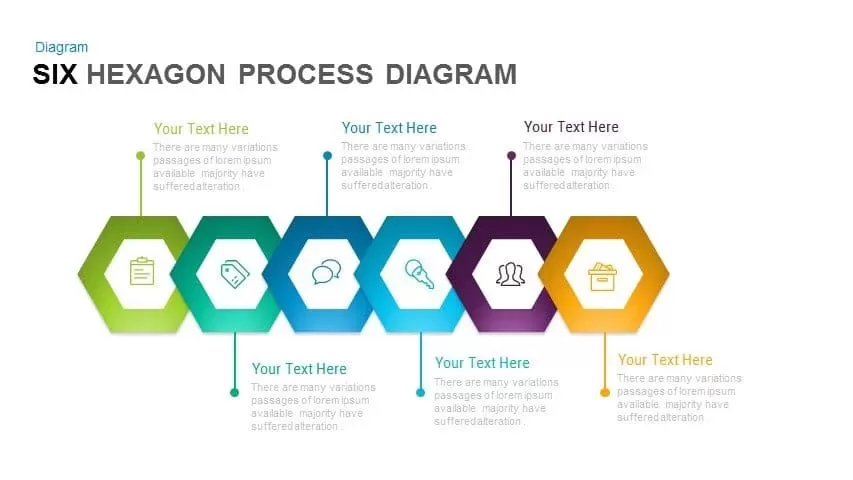
Six-Step Hexagon Process Diagram Template for PowerPoint & Google Slides
Process
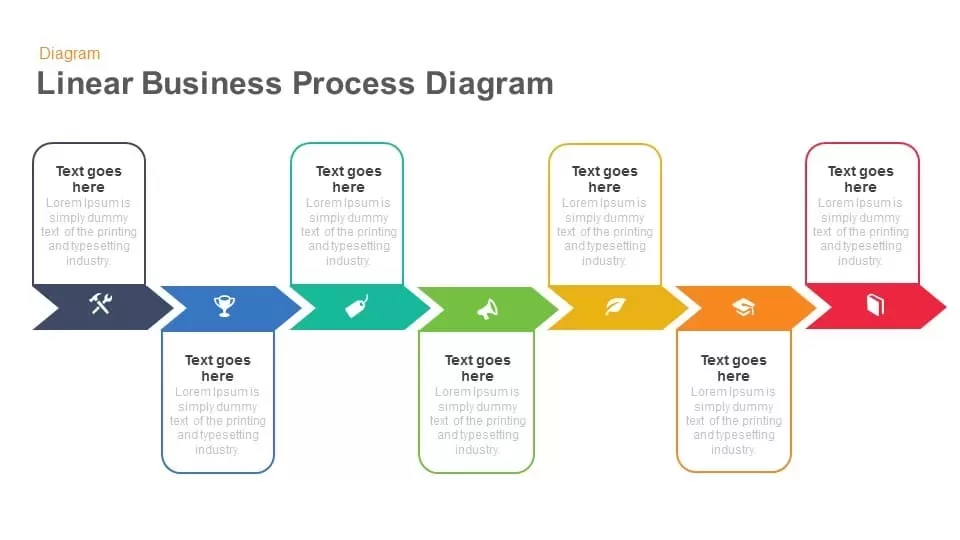
Linear Business Process Diagram template for PowerPoint & Google Slides
Process
10 Stages Business Flow Process Diagram template for PowerPoint & Google Slides
Business
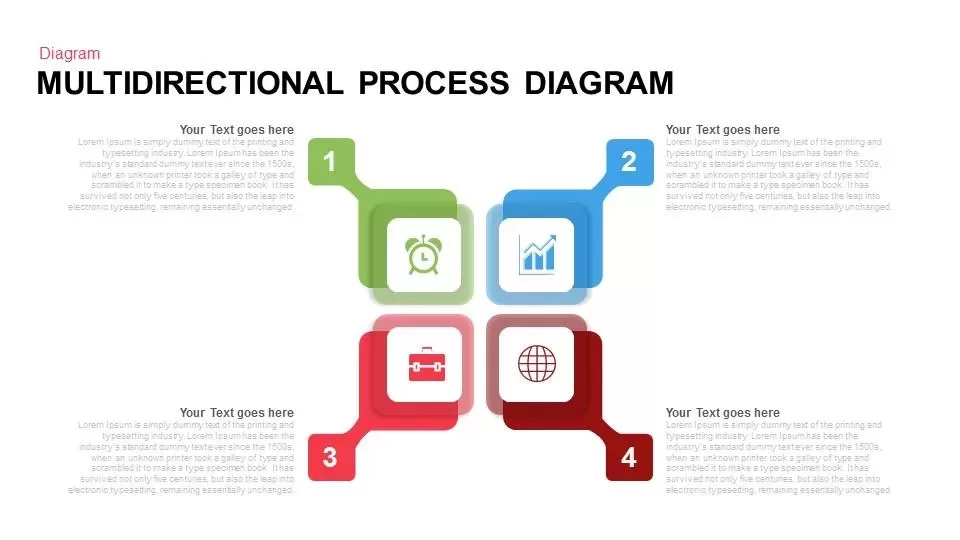
Multidirectional Process Diagram template for PowerPoint & Google Slides
Process
Elegant Process Support Arrow Diagram Template for PowerPoint & Google Slides
Arrow
Free Six Stage Bubble Process Diagram template for PowerPoint & Google Slides
Process
Free
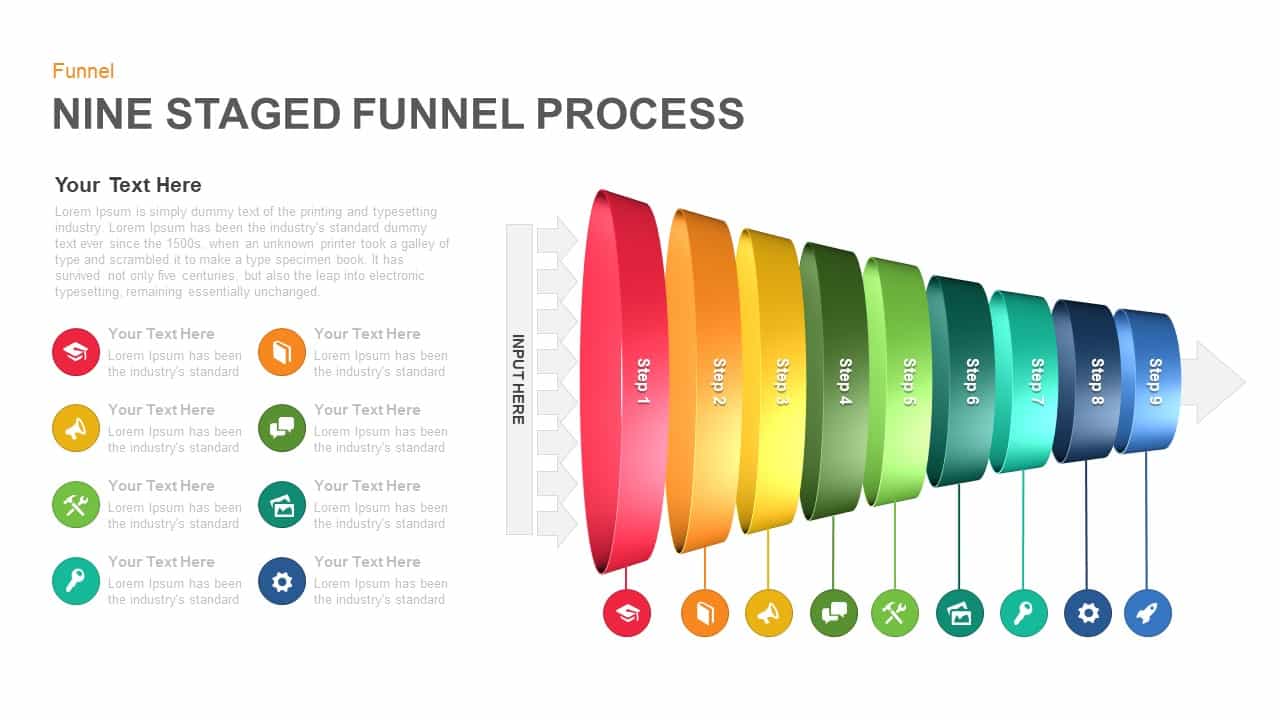
Nine-Stage 3D Funnel Process Diagram Template for PowerPoint & Google Slides
Funnel
Eight-Stage Radial Process Flow Diagram Template for PowerPoint & Google Slides
Process
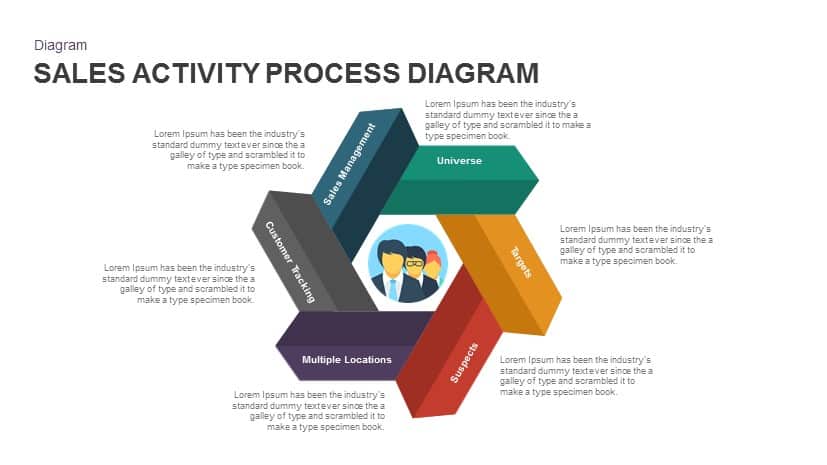
Sales Activity Hexagon Process Diagram Template for PowerPoint & Google Slides
Process

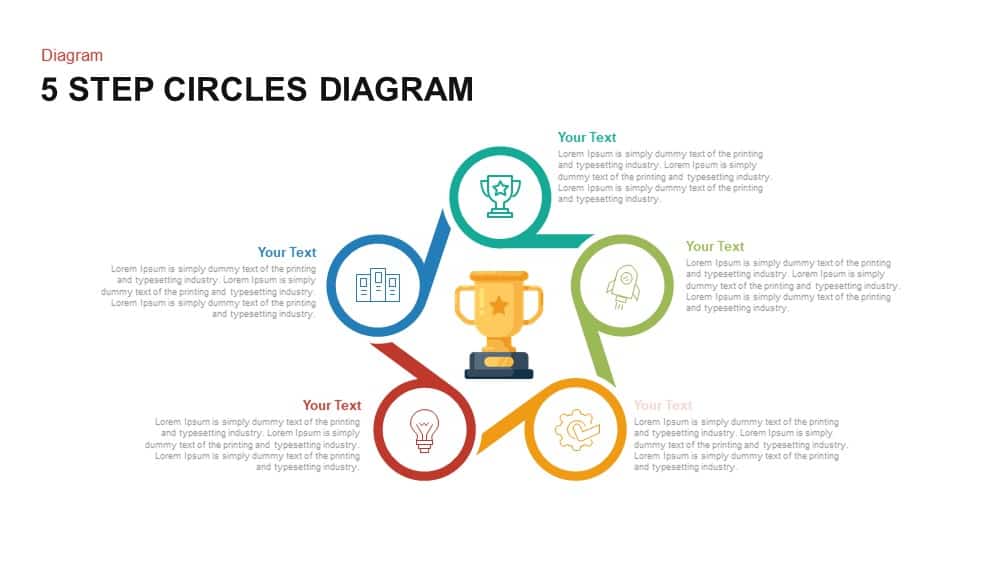
Modern Five-Step Circles Process Diagram Template for PowerPoint & Google Slides
Circular
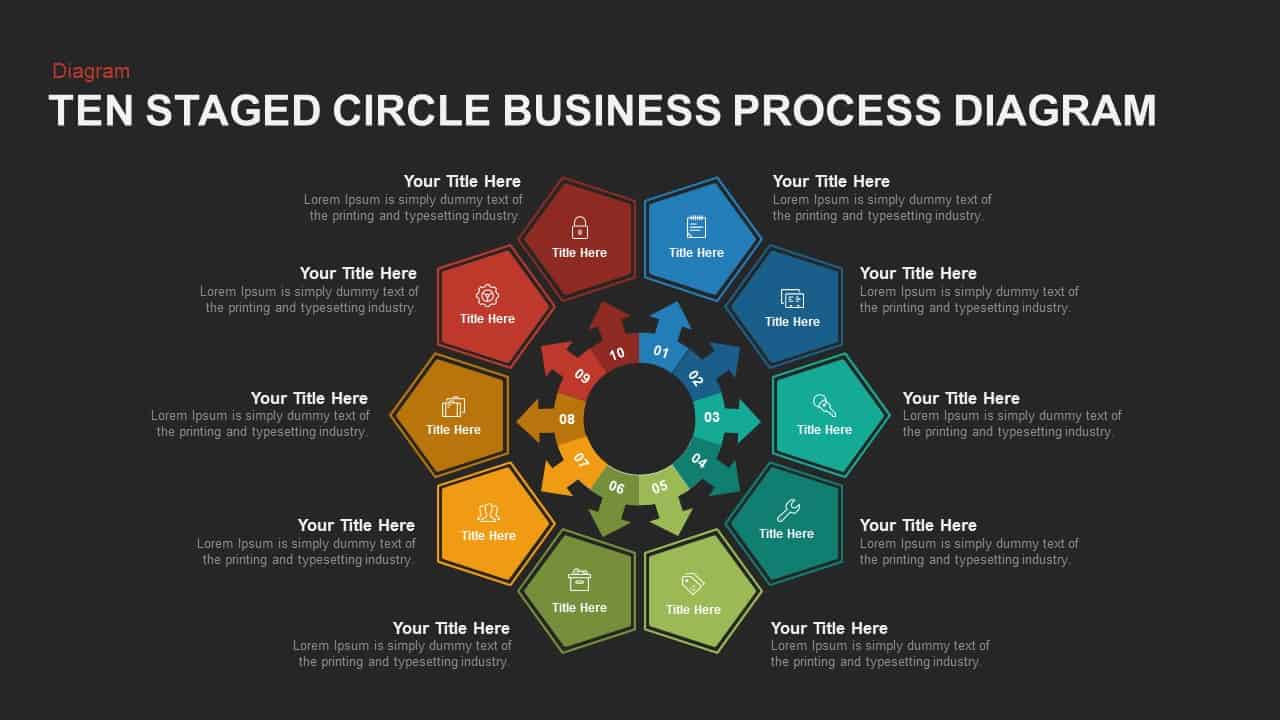
Ten-Stage Business Process Diagram Template for PowerPoint & Google Slides
Process
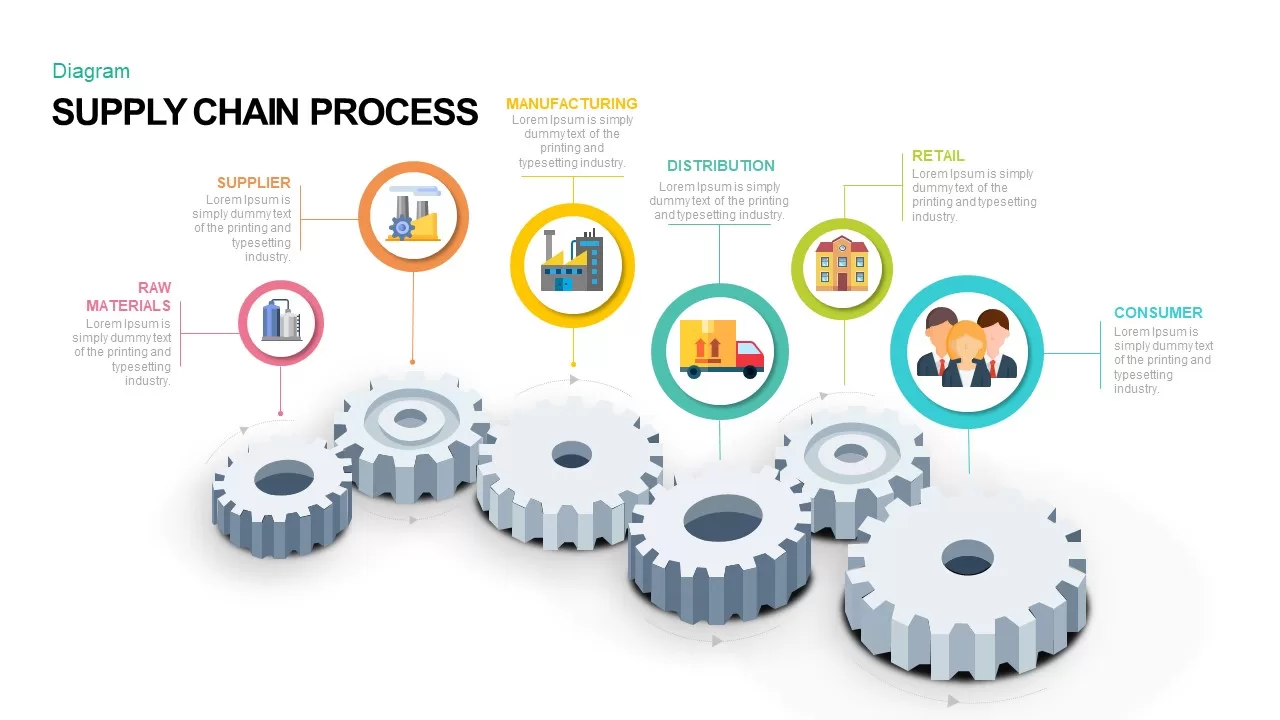
Supply Chain Process Gear Diagram Template for PowerPoint & Google Slides
Process
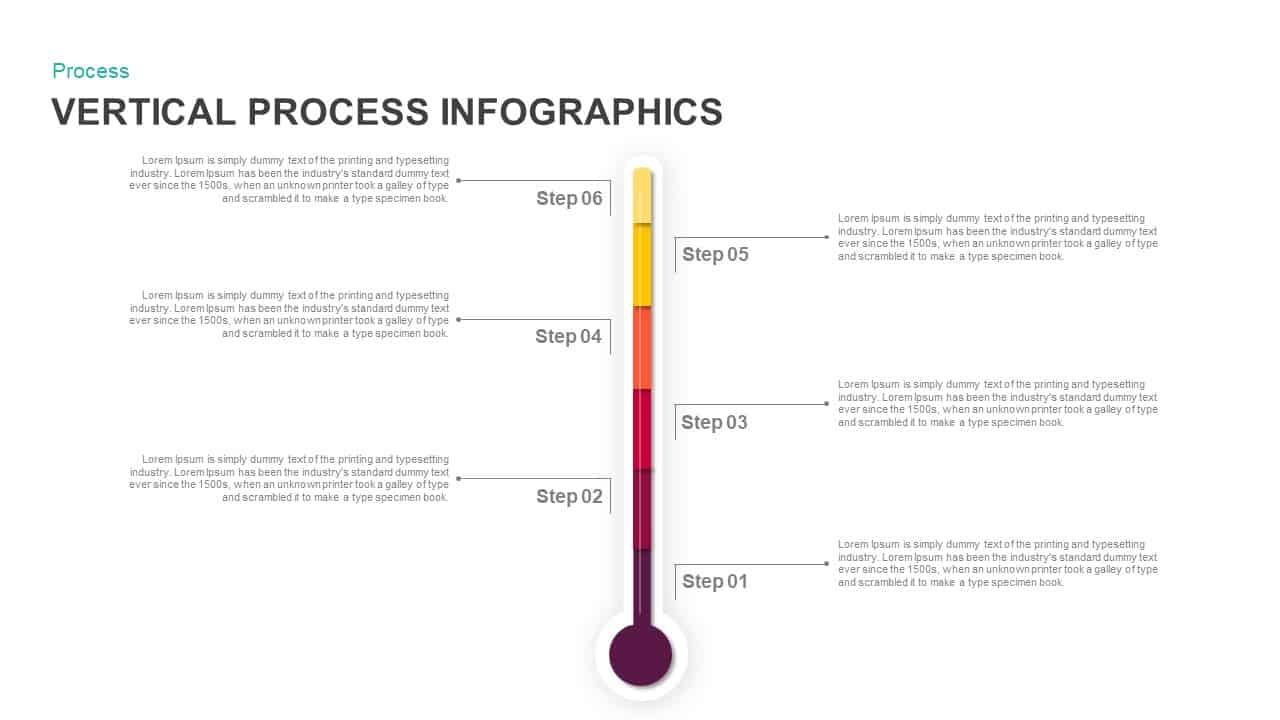
Six-Step Vertical Process Diagram Template for PowerPoint & Google Slides
Process
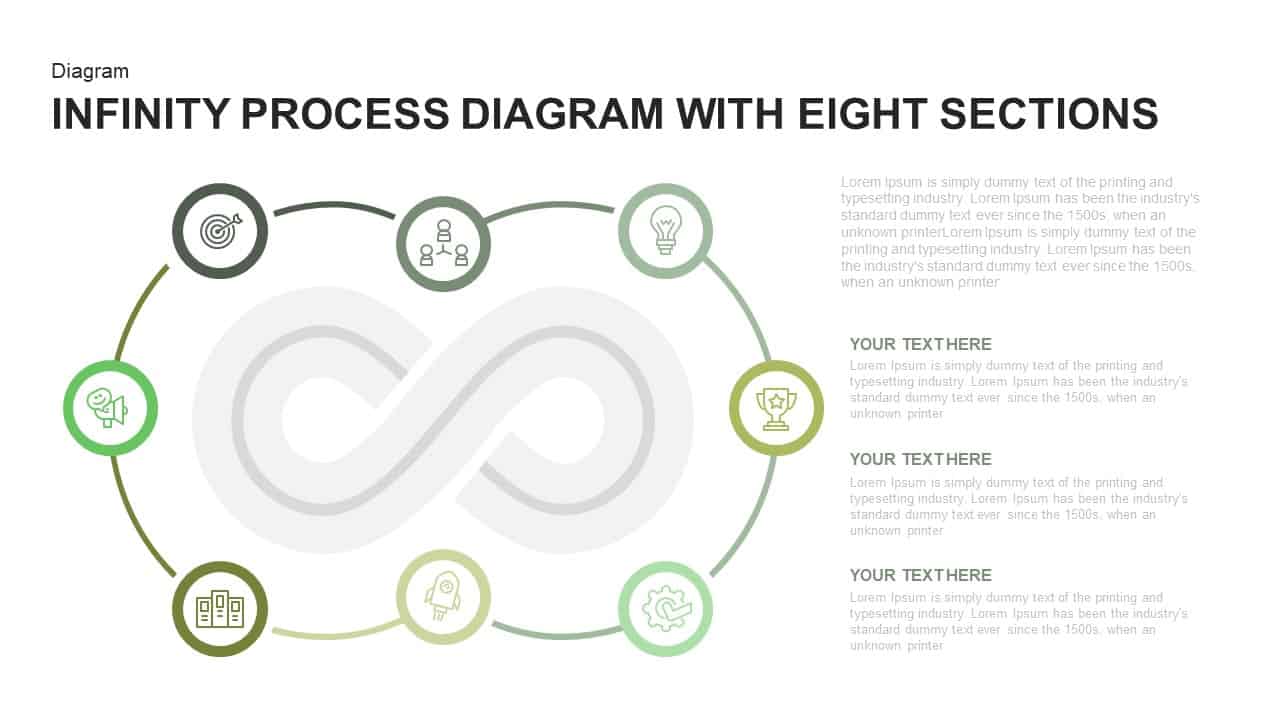
Infinity Process Diagram template for PowerPoint & Google Slides
Process
4 Staged Circular Business Process Diagram template for PowerPoint & Google Slides
Process
Free Six-Stage Arrow Process Diagram Template for PowerPoint & Google Slides
Process
Free
Six-Step Linear Arrow Process Diagram Template for PowerPoint & Google Slides
Process
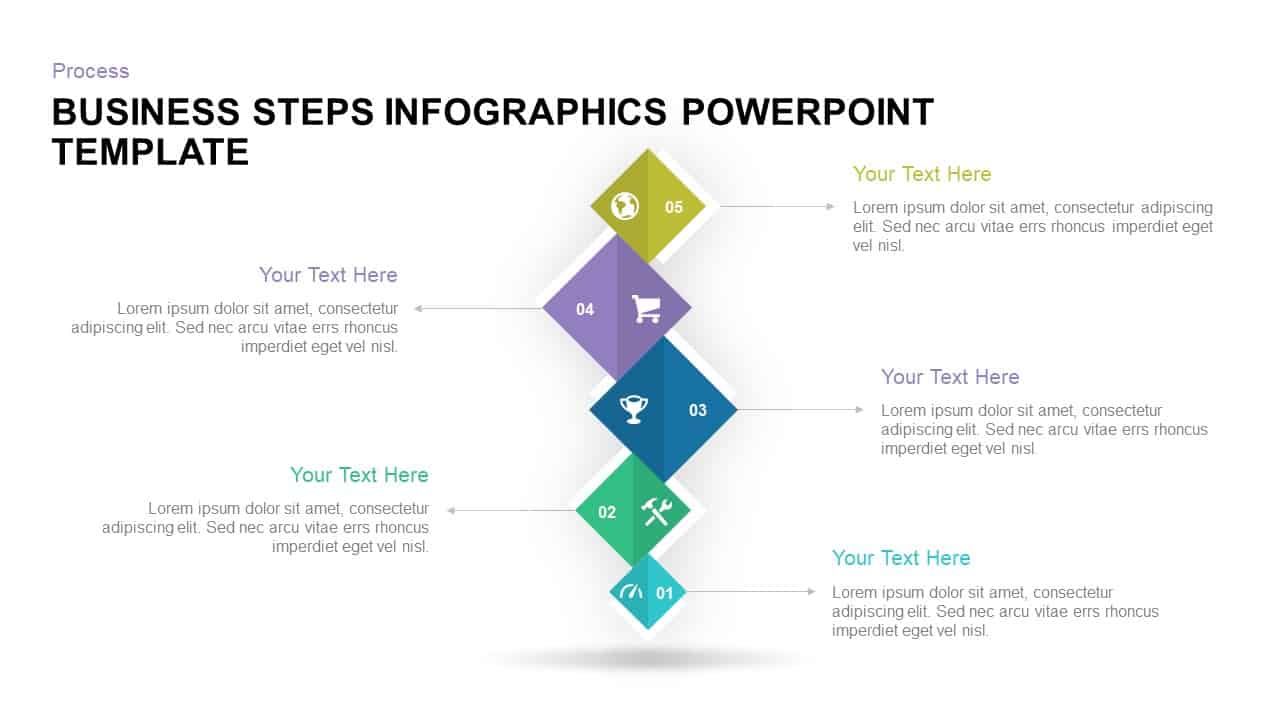
Five-Step Diamond Process Diagram Template for PowerPoint & Google Slides
Process
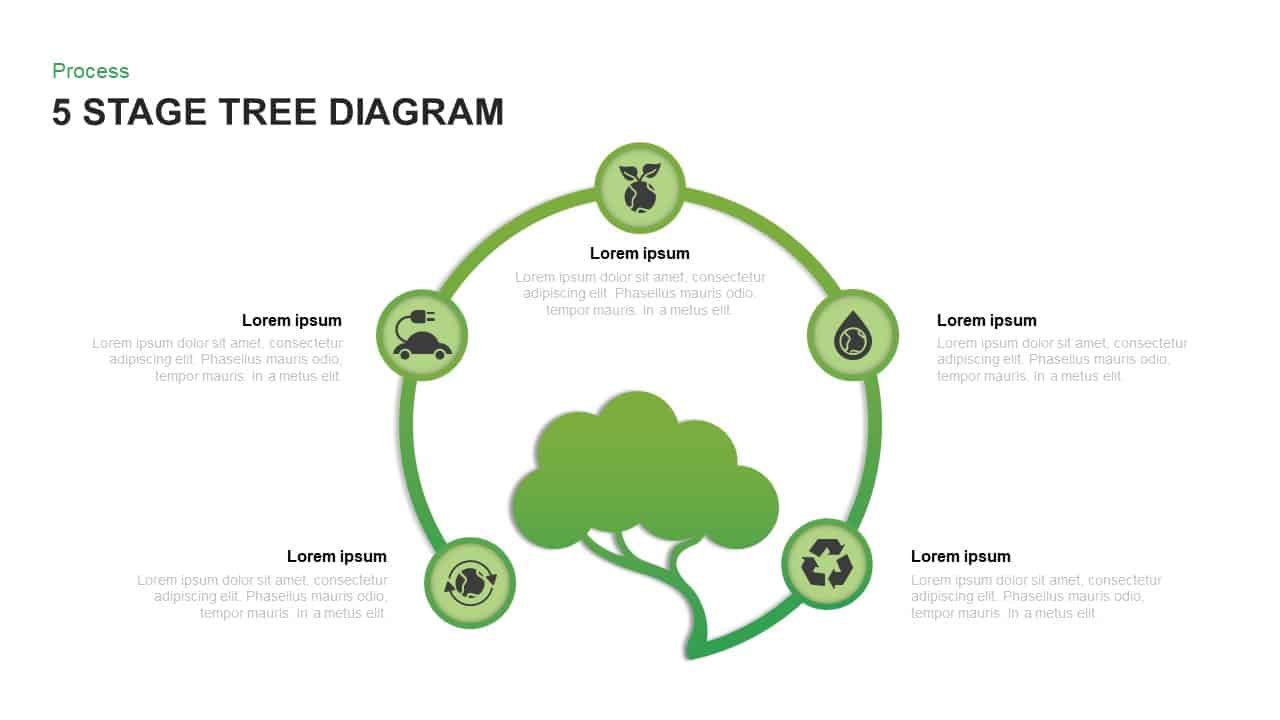
Five-Stage Eco Tree Process Diagram Template for PowerPoint & Google Slides
Process
Six-Stage Circular Diagram Process Template for PowerPoint & Google Slides
Circular
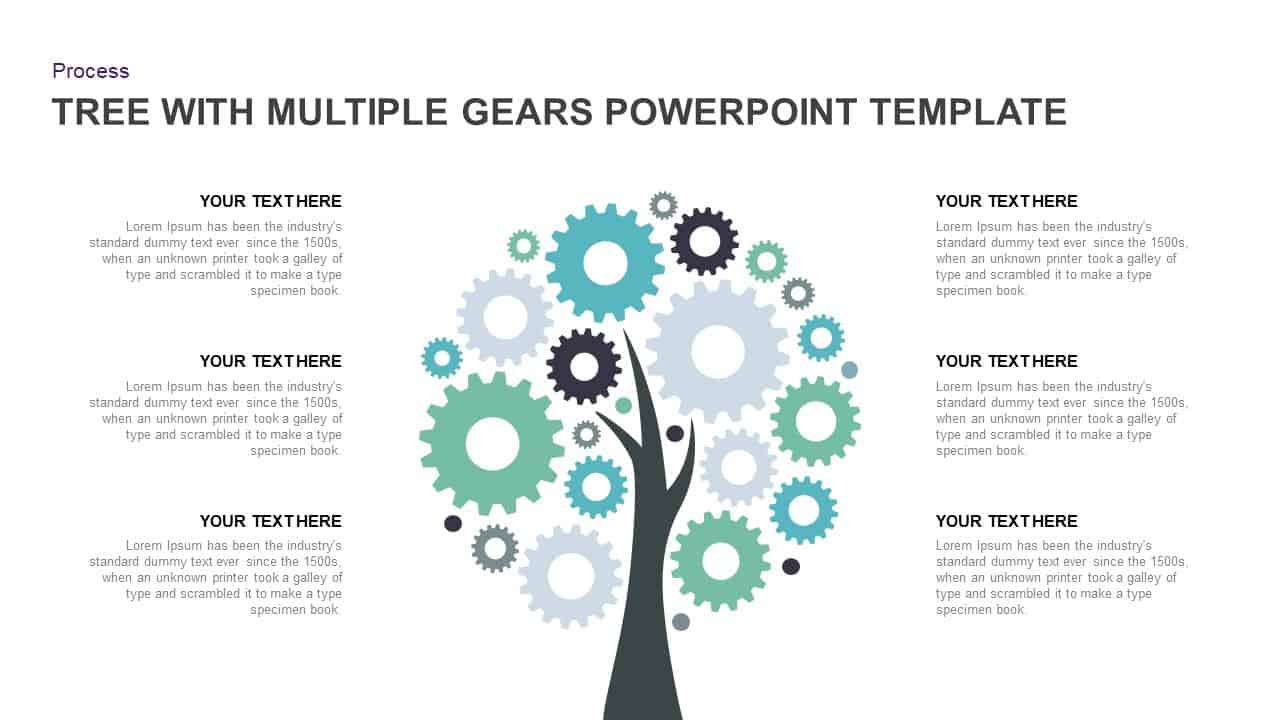
Tree Diagram with Gears Process Template for PowerPoint & Google Slides
Process
Three-Way Decision Process Arrow Diagram Template for PowerPoint & Google Slides
Arrow
Six-Step Hexagon Process Flow Diagram Template for PowerPoint & Google Slides
Process
Five-Step Circular Process Diagram Template for PowerPoint & Google Slides
Circular
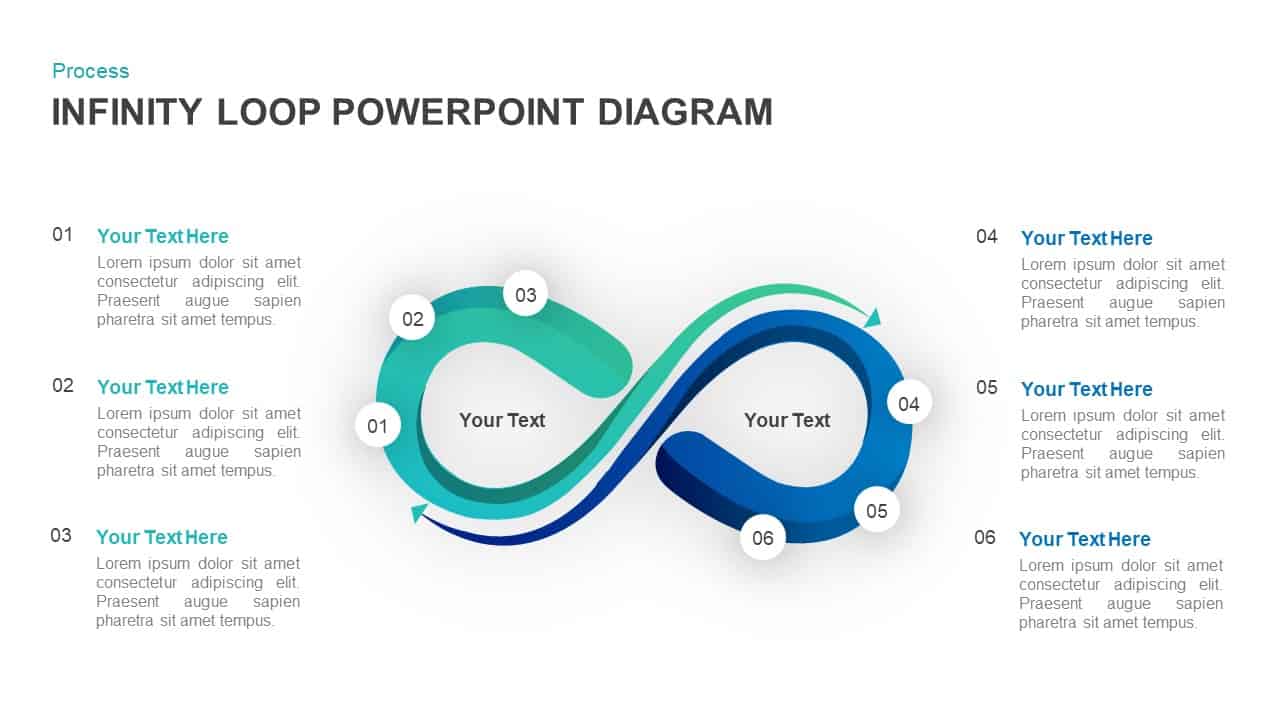
Six-Stage Infinity Loop Process Diagram Template for PowerPoint & Google Slides
Process
3D Seven-Stage Process Flow Diagram Template for PowerPoint & Google Slides
Process
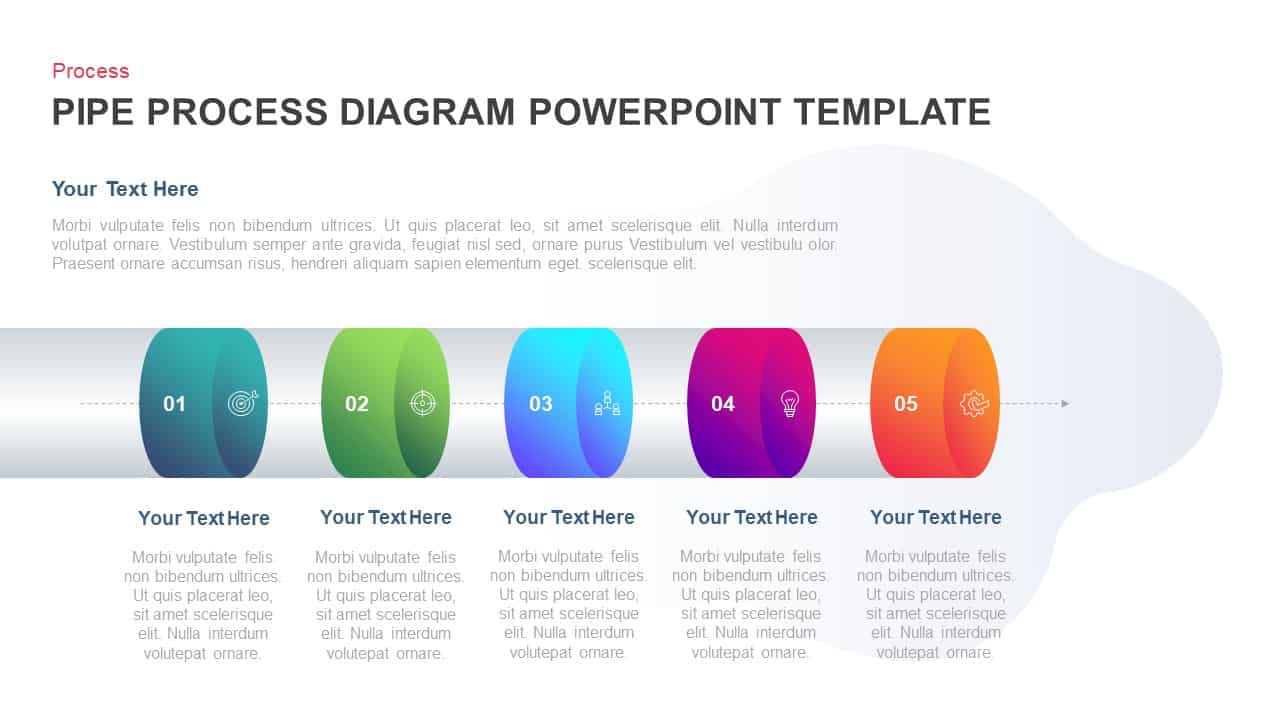
Five-Stage Pipe Process Diagram Template for PowerPoint & Google Slides
Process
Circular CRM Process Diagram Infographic Template for PowerPoint & Google Slides
Circular
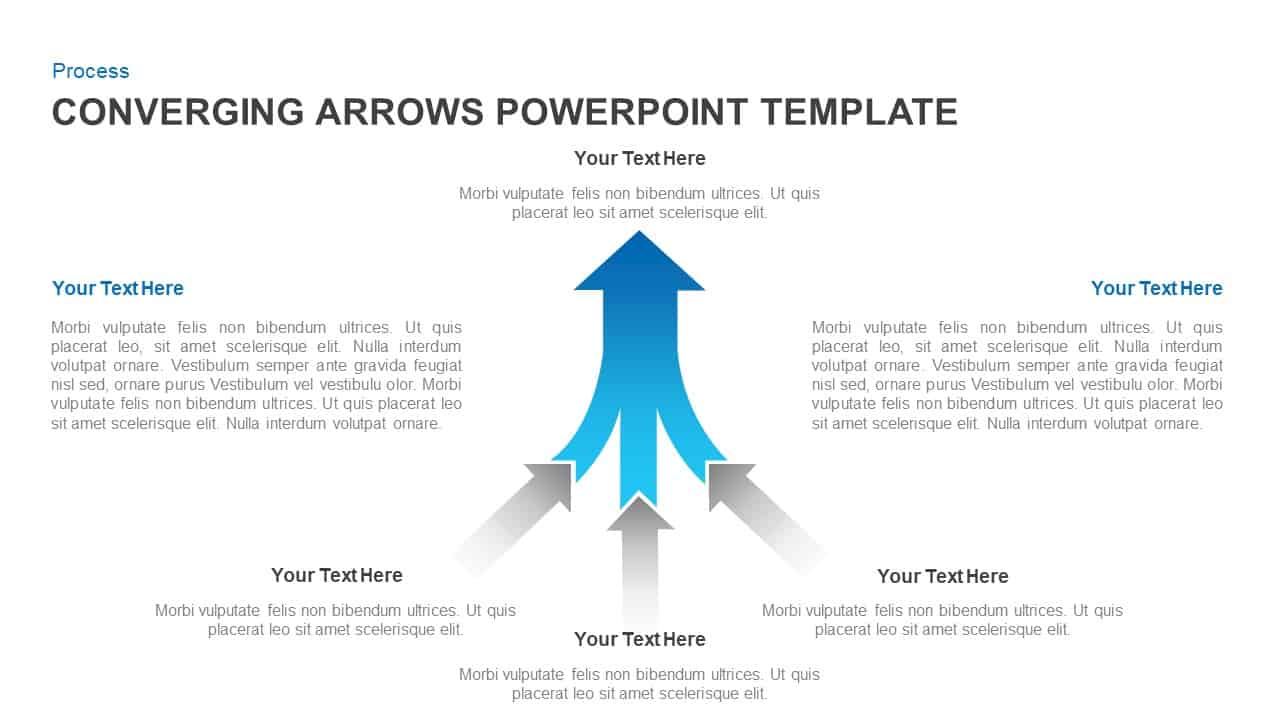
Converging Arrows Process Diagram Template for PowerPoint & Google Slides
Arrow
5 Stage Linear Process Flow Diagram Template for PowerPoint & Google Slides
Process
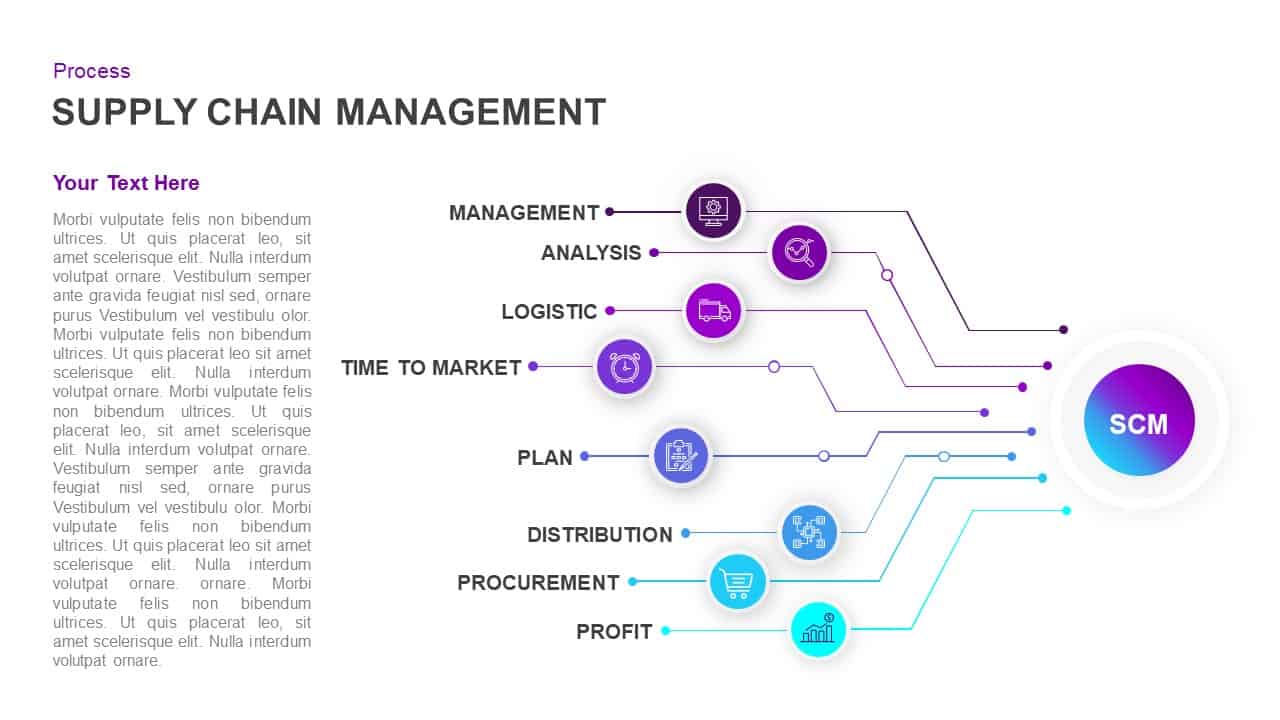
Supply Chain Management Process Diagram Template for PowerPoint & Google Slides
Process
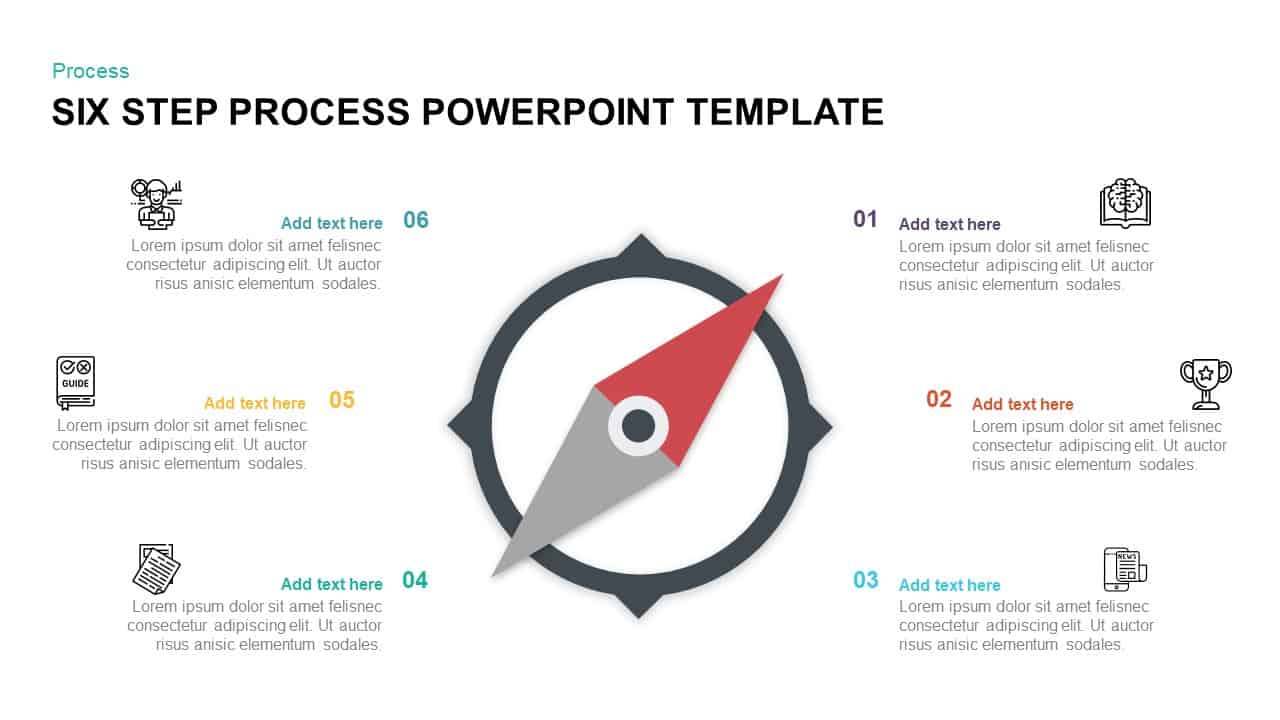
Compass-Themed Six-Step Process Diagram Template for PowerPoint & Google Slides
Process
4 Stage Linear Process Flow Diagram Template for PowerPoint & Google Slides
Process
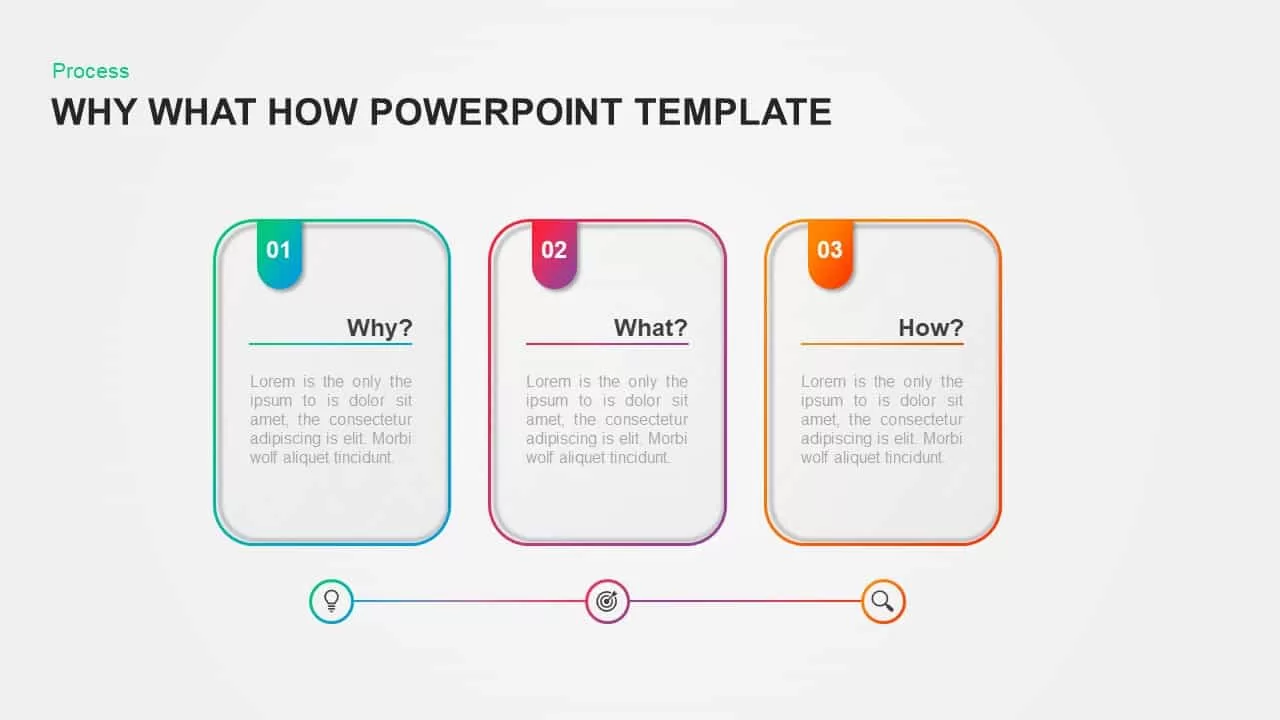
Why What How Process Diagram Template for PowerPoint & Google Slides
Process
4 Stage Linear Process Flow Diagram Template for PowerPoint & Google Slides
Process
6-Step Business Process Flow Diagram Template for PowerPoint & Google Slides
Process
Three-Step Flowchart Process Diagram Template for PowerPoint & Google Slides
Flow Charts
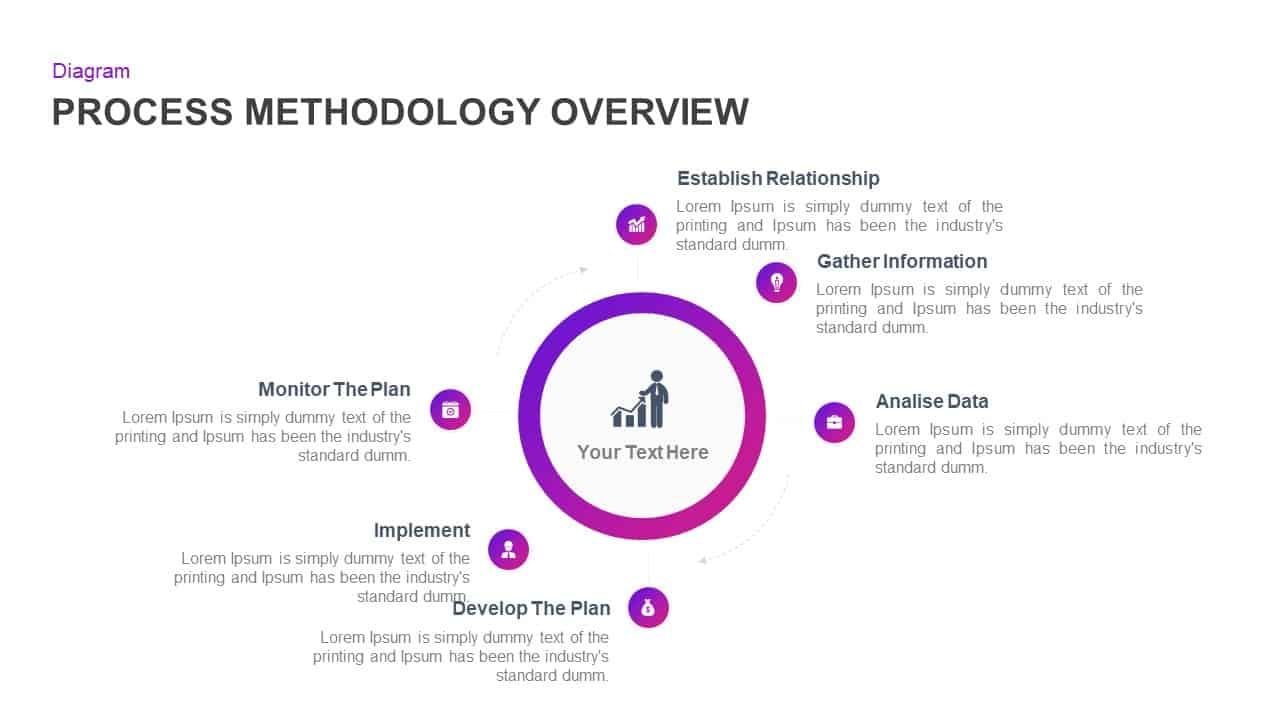
Process Methodology Overview Diagram Template for PowerPoint & Google Slides
Process
Value Chain Circular Process Diagram Template for PowerPoint & Google Slides
Business Models
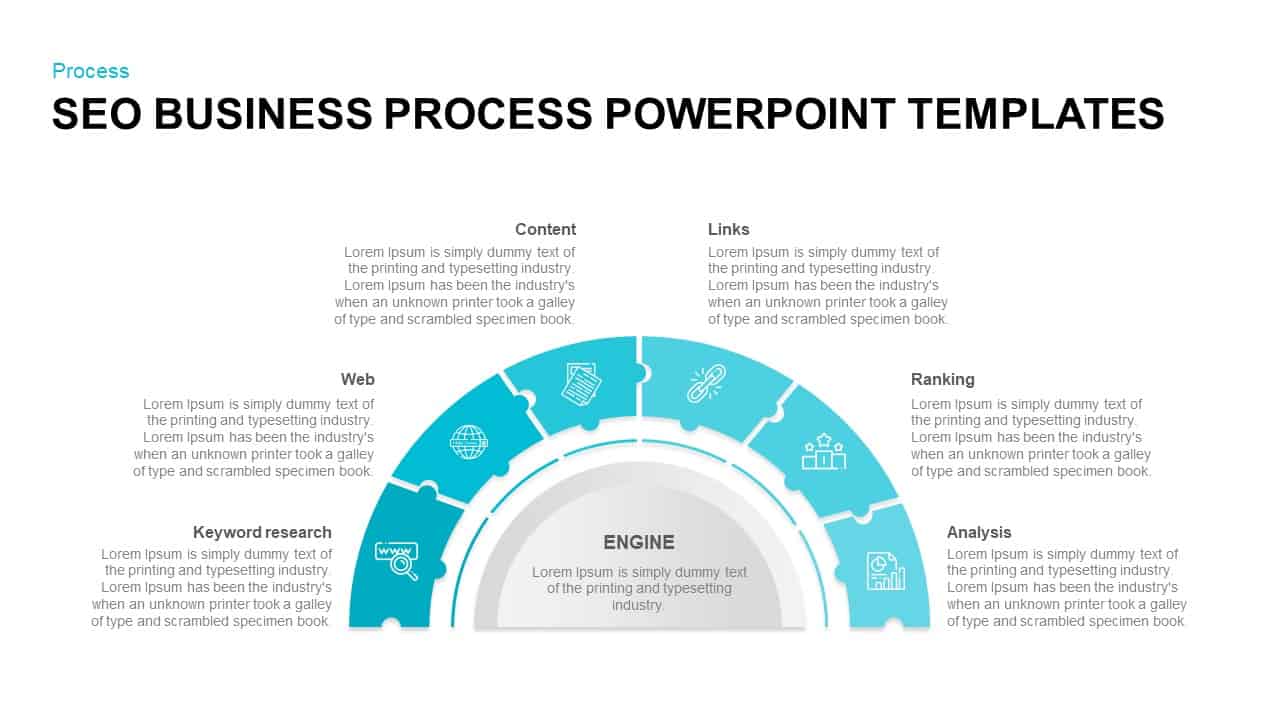
SEO Business Process Puzzle Diagram Template for PowerPoint & Google Slides
Process
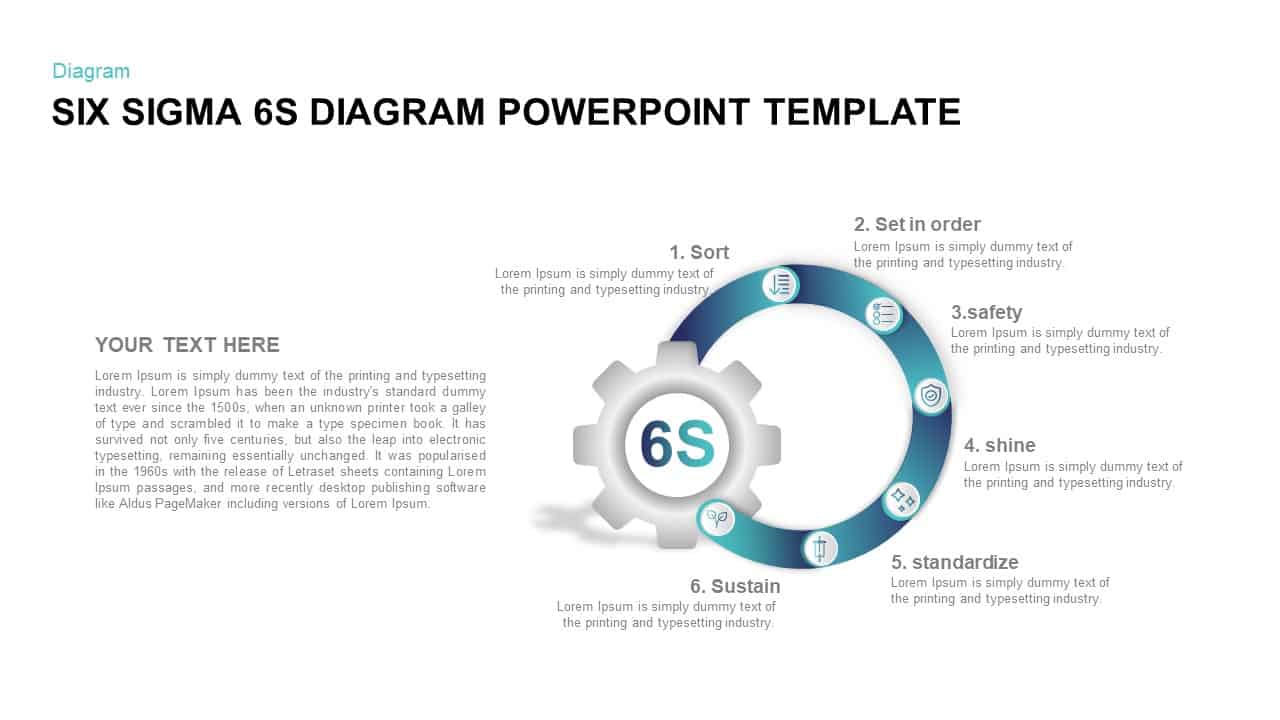
Six Sigma 6S Process Infographic Diagram Template for PowerPoint & Google Slides
Process
Six Sigma 6S Process Diagram Template for PowerPoint & Google Slides
Process
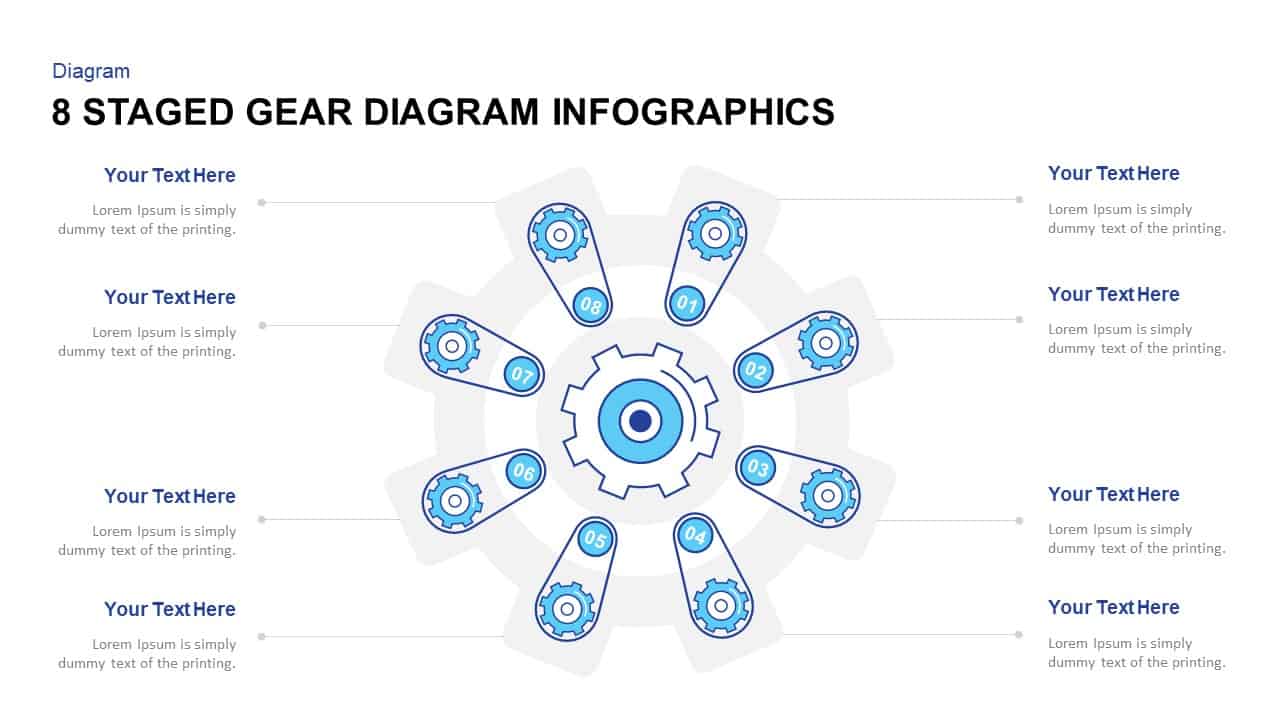
Eight-Stage Gear Diagram Process Template for PowerPoint & Google Slides
Process
Business Process Management Flow Diagram Template for PowerPoint & Google Slides
Process
Colorful 8-Stage Droplet Process Flow Diagram Template for PowerPoint & Google Slides
Process

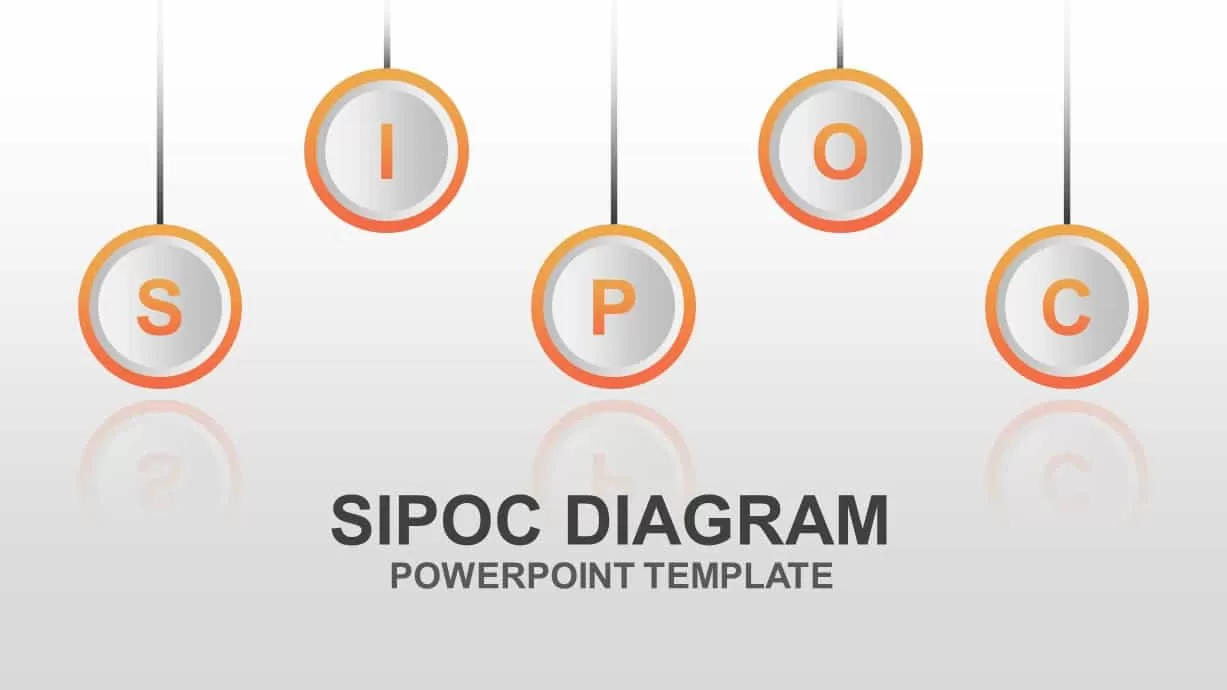
Editable SIPOC Process Diagram Deck Template for PowerPoint & Google Slides
Pitch Deck
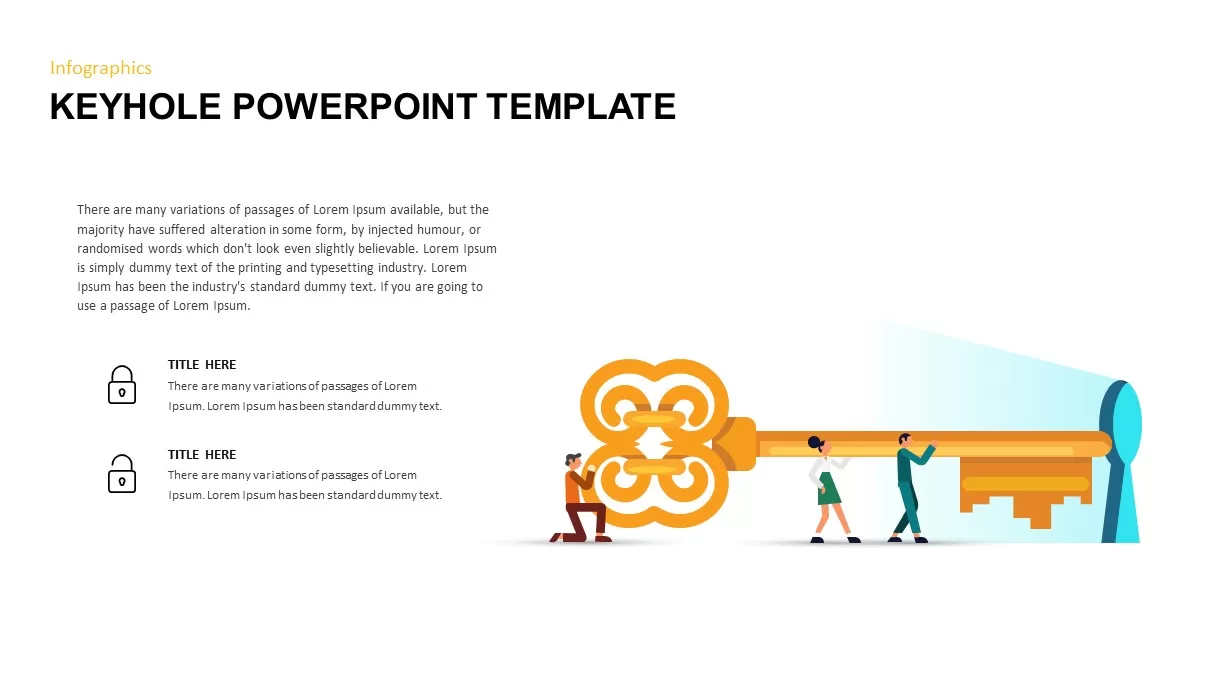
Keyhole Infographic Process Diagram Template for PowerPoint & Google Slides
Process
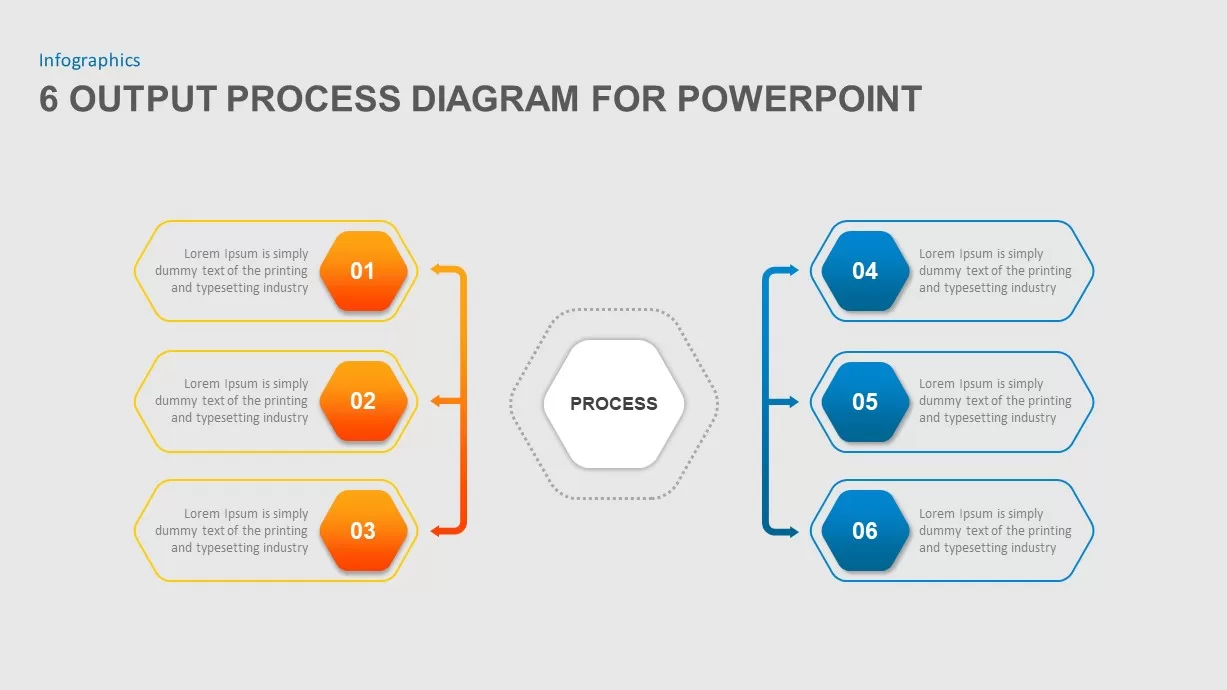
Six-Step Output Process Diagram Template for PowerPoint & Google Slides
Process
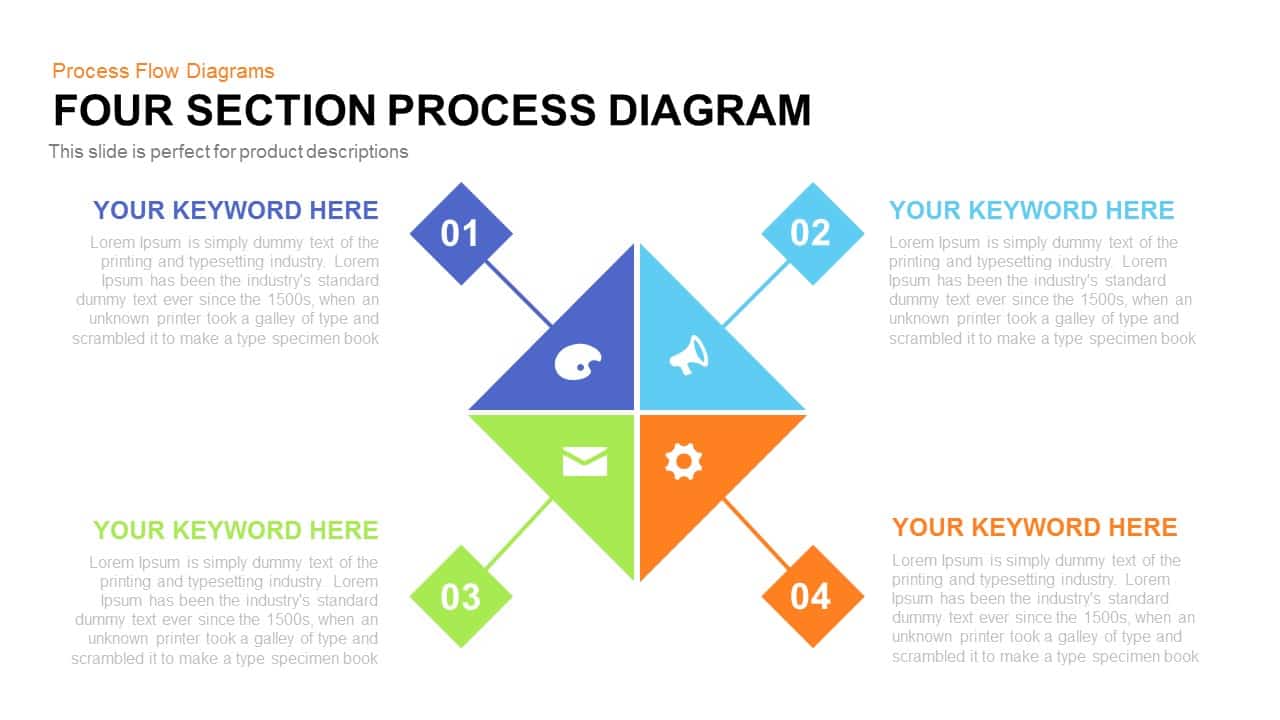
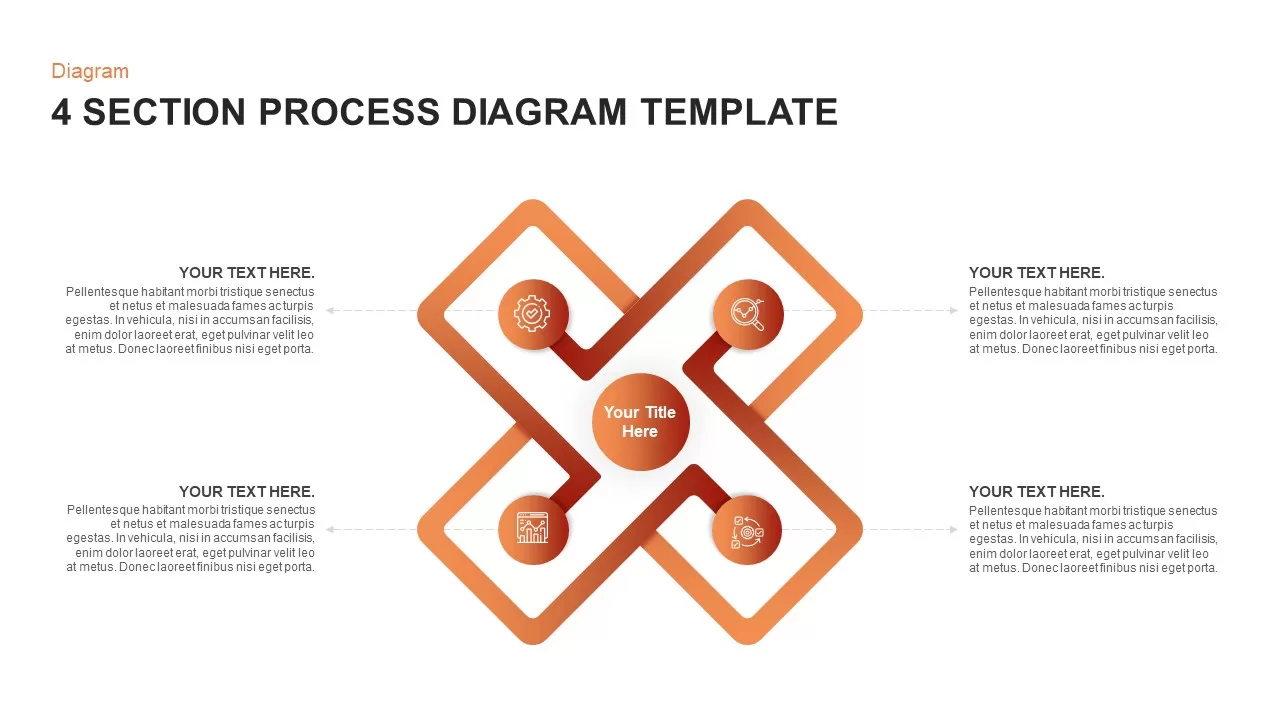
Modern 4 Section Process Diagram Template for PowerPoint & Google Slides
Process
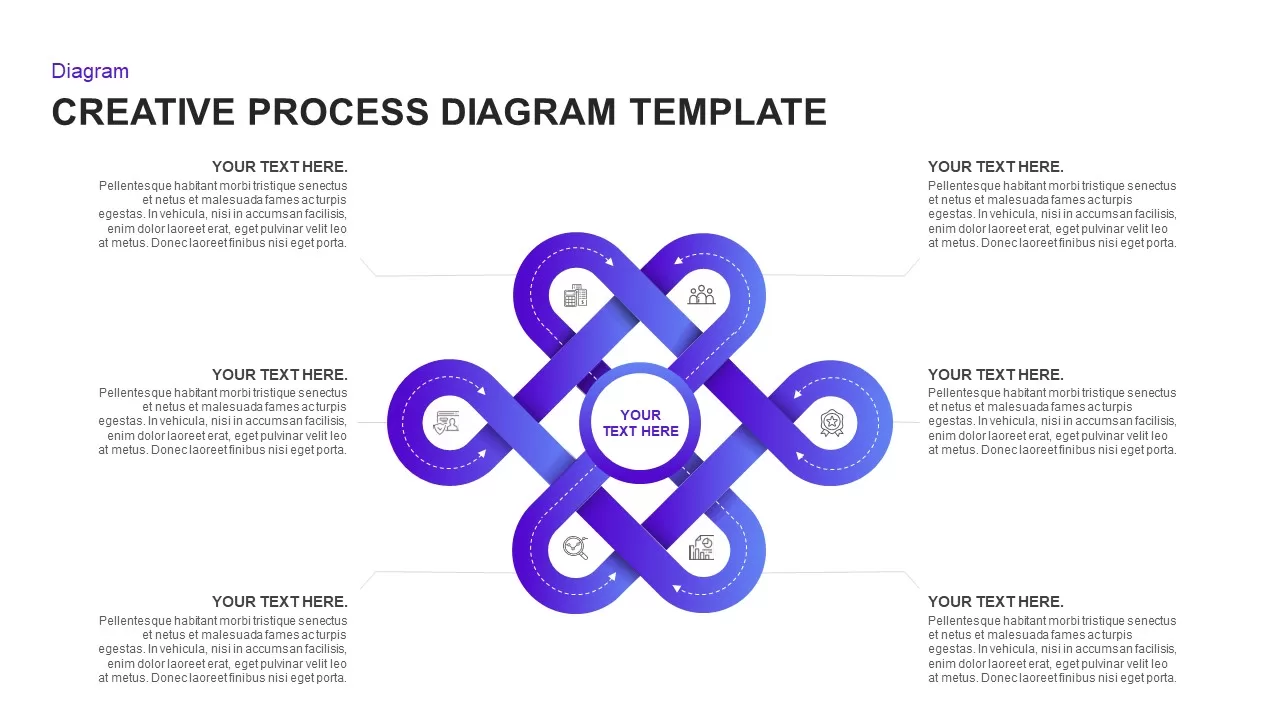
Creative Infinity Loop Process Diagram Template for PowerPoint & Google Slides
Process
Snowball Effect Process Diagram Template for PowerPoint & Google Slides
Process
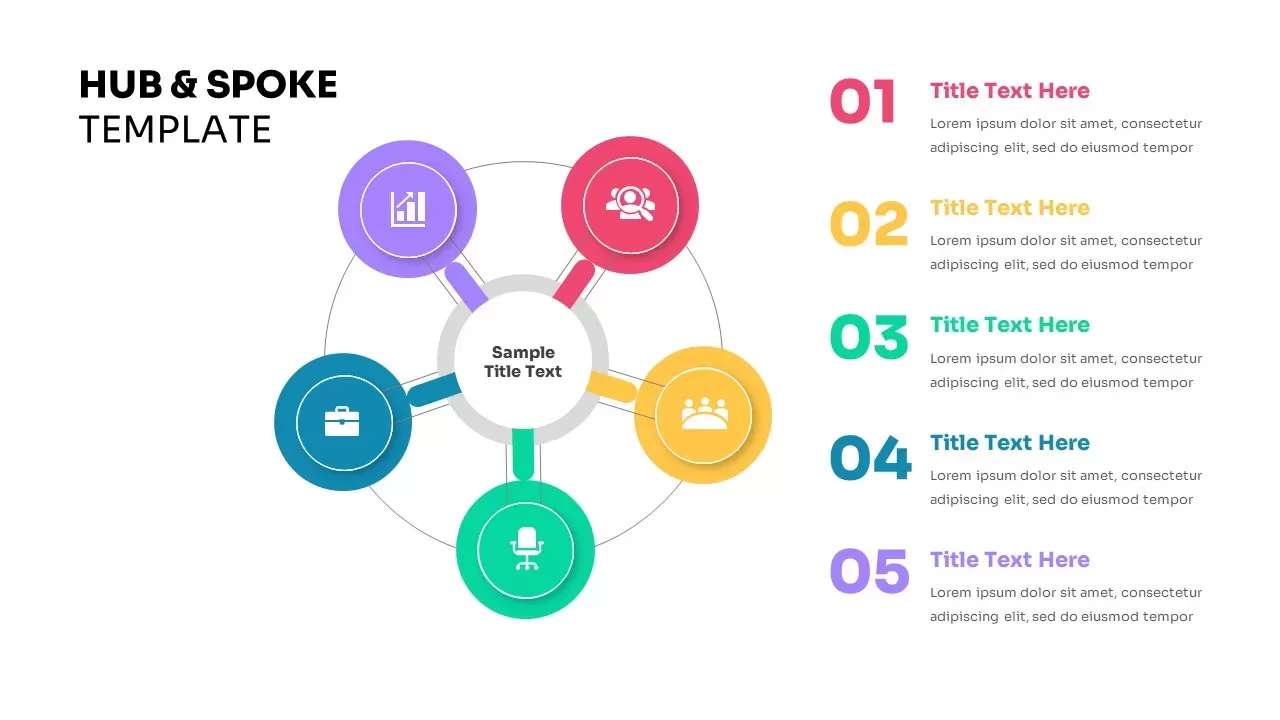
Five-Node Hub & Spoke Diagram Process Template for PowerPoint & Google Slides
Business Models
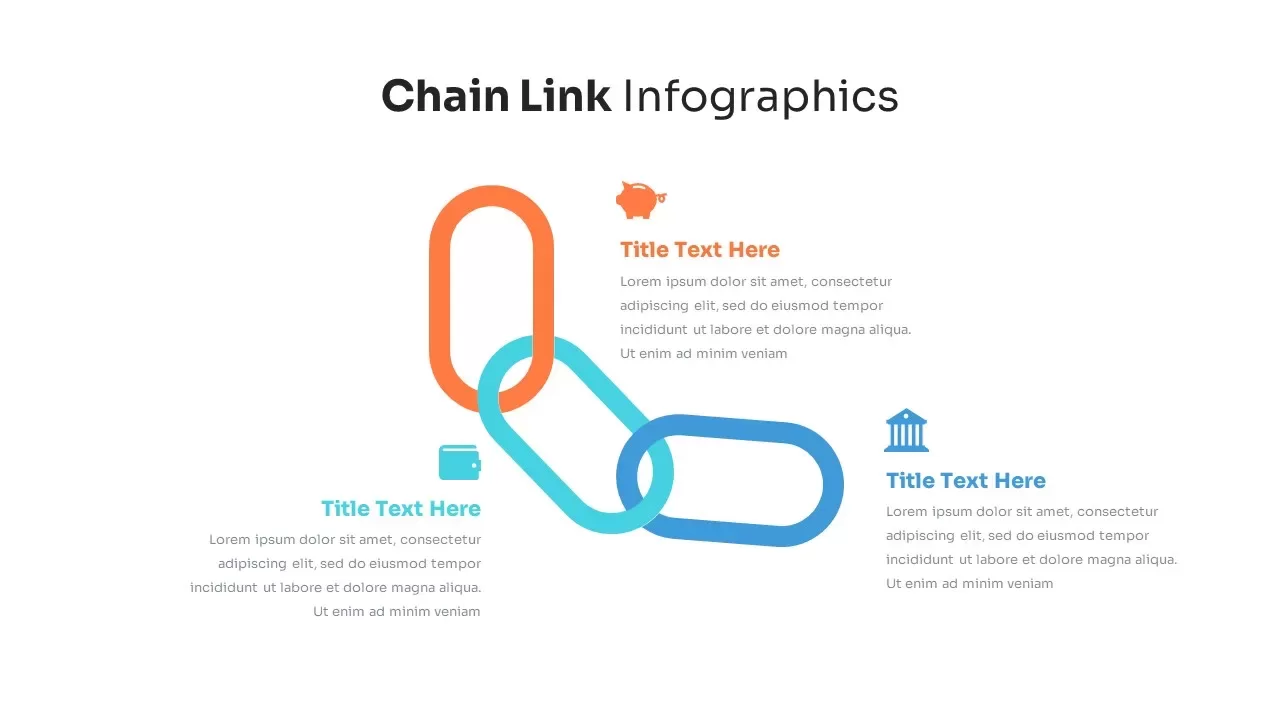
Chain Link Process Infographic Diagram Template for PowerPoint & Google Slides
Process
10 Step Circular Process Diagram Template for PowerPoint & Google Slides
Circular
3D Conveyor Belt Process Flow Diagram Template for PowerPoint & Google Slides
Process
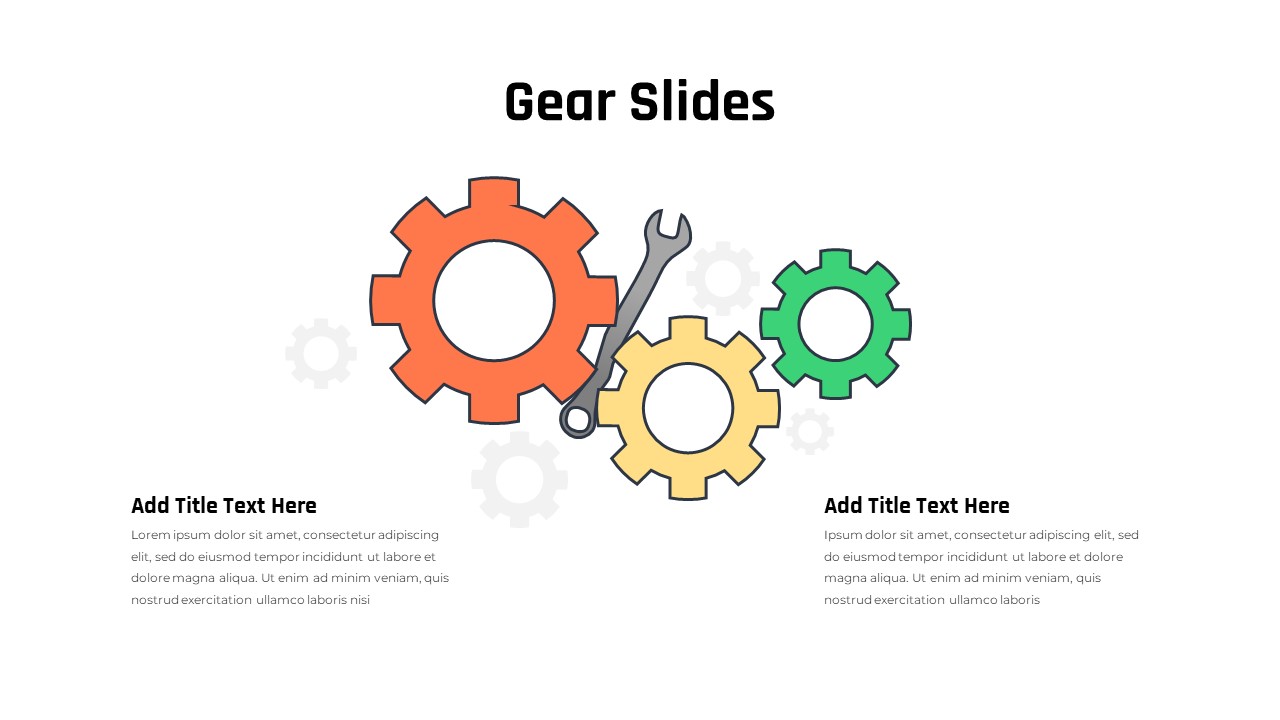
Gear Process Diagram Template for PowerPoint & Google Slides
Process
E-Waste Management Process Flow Diagram Template for PowerPoint & Google Slides
Process
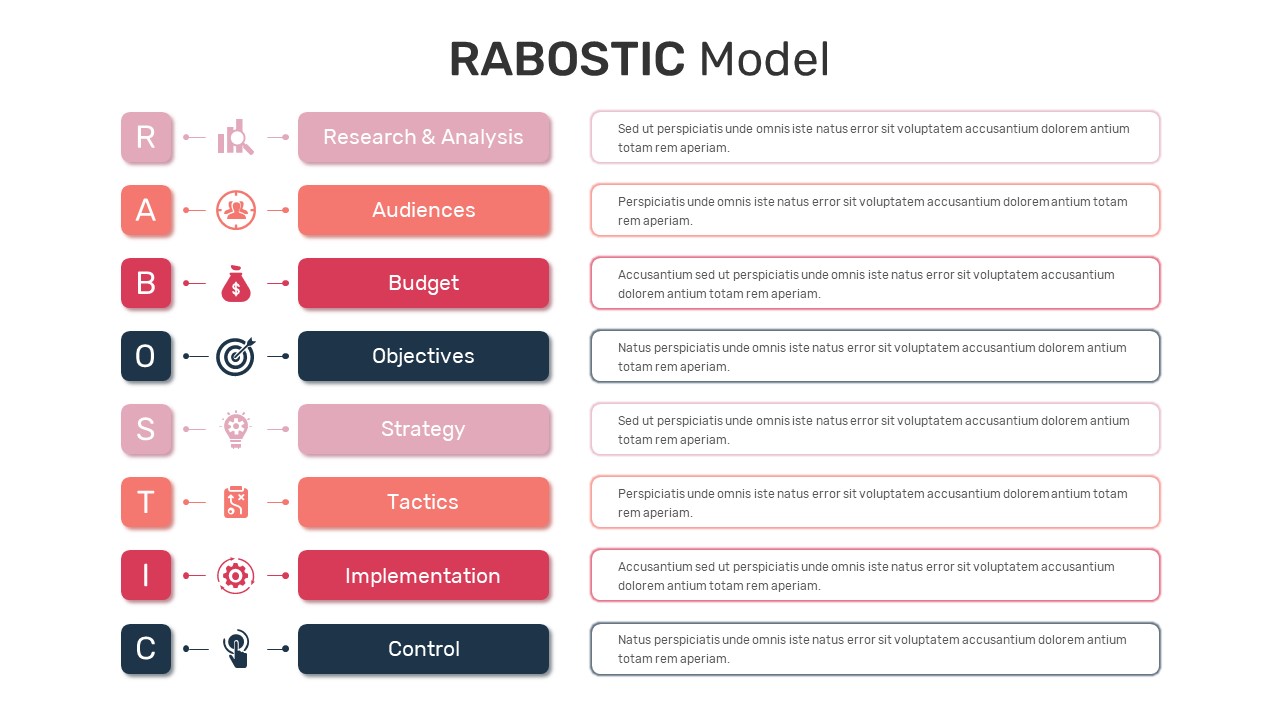
RABOSTIC Marketing Model Process Diagram Template for PowerPoint & Google Slides
Process
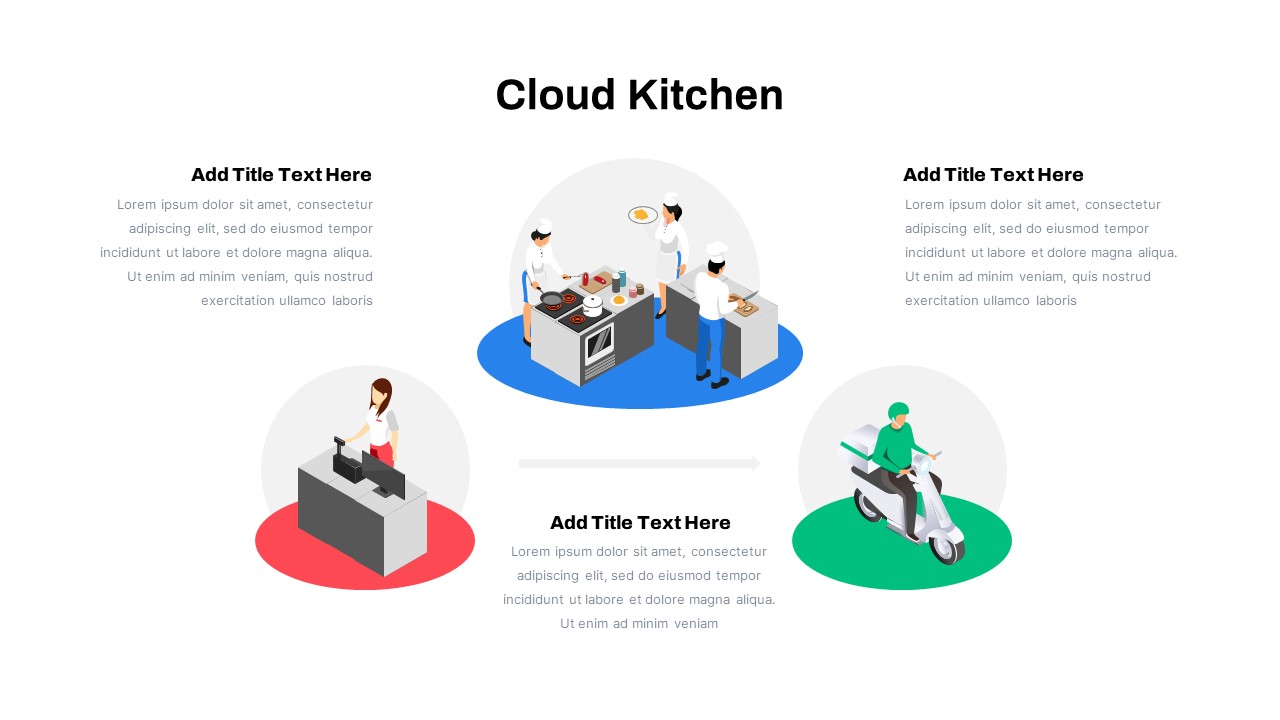
Cloud Kitchen Business Process Diagram Template for PowerPoint & Google Slides
Process
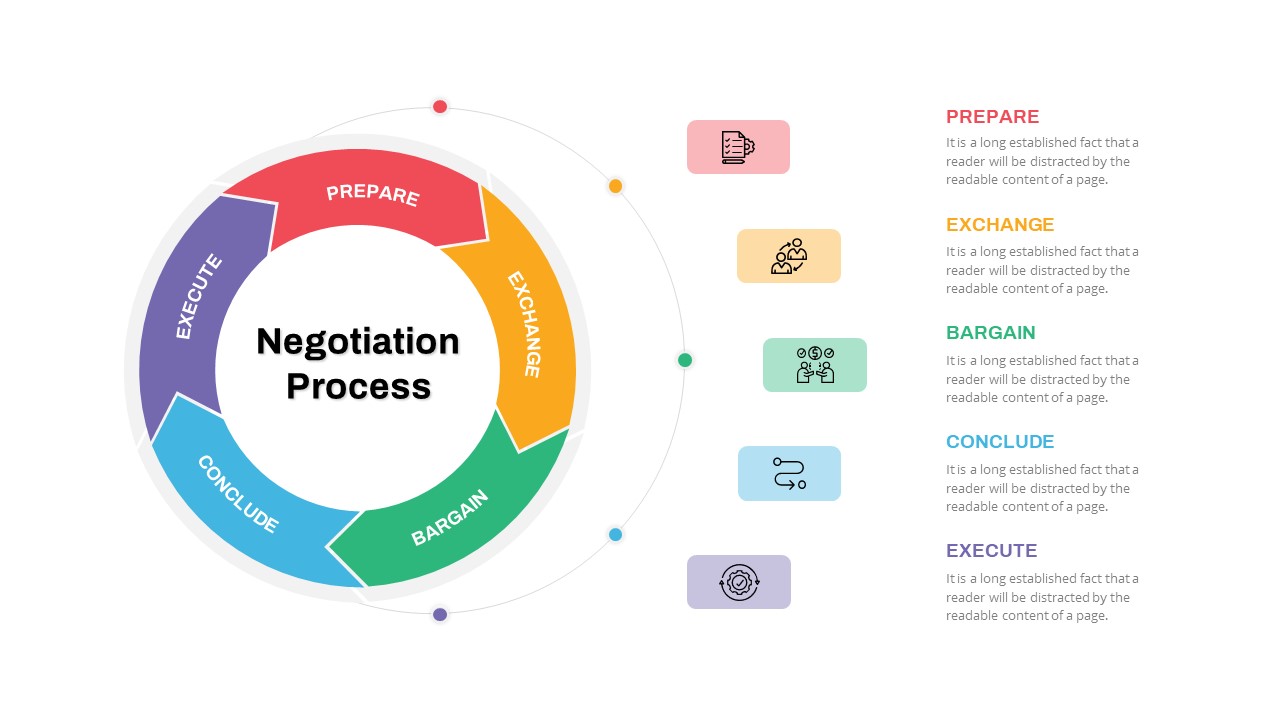
Negotiation Process Circular Diagram Template for PowerPoint & Google Slides
Circular
Business Process Analysis Cycle Diagram Template for PowerPoint & Google Slides
Business Strategy
Comprehensive Process Flow Diagram Template for PowerPoint & Google Slides
Process
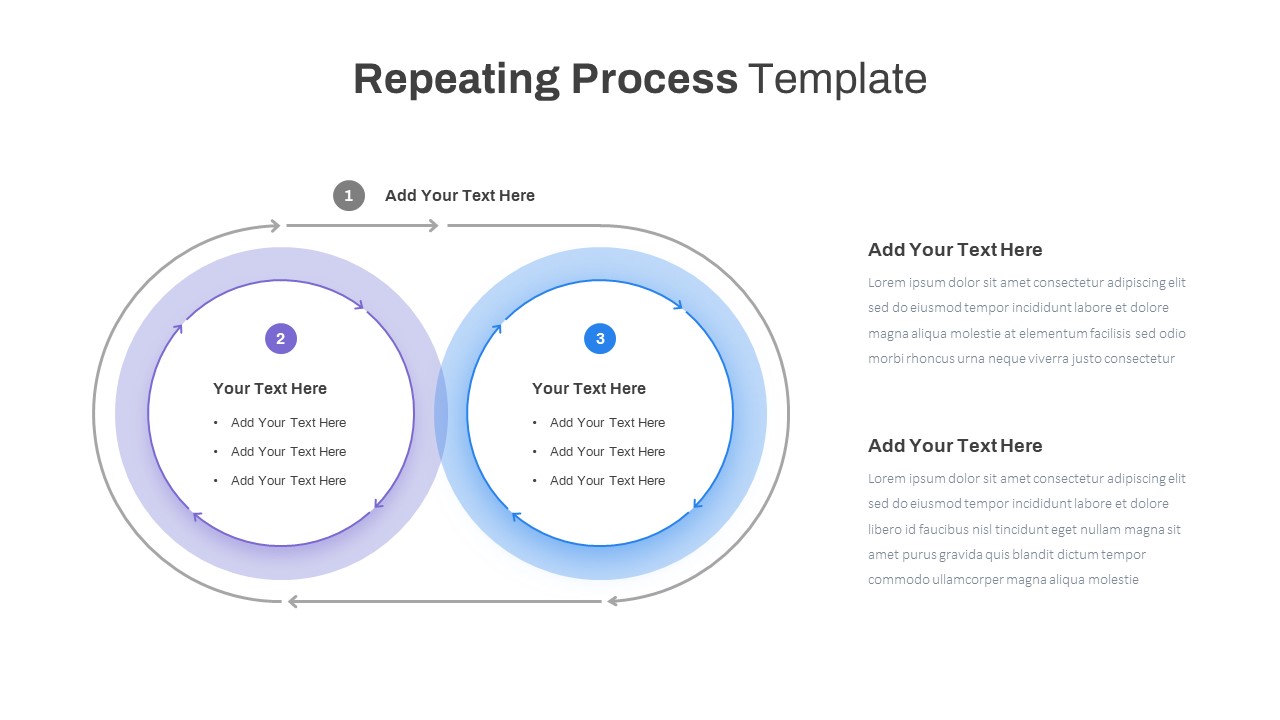
Repeating Overlapping Process Diagram Template for PowerPoint & Google Slides
Process
Animated Gears Process Flow Diagram Template for PowerPoint & Google Slides
Process
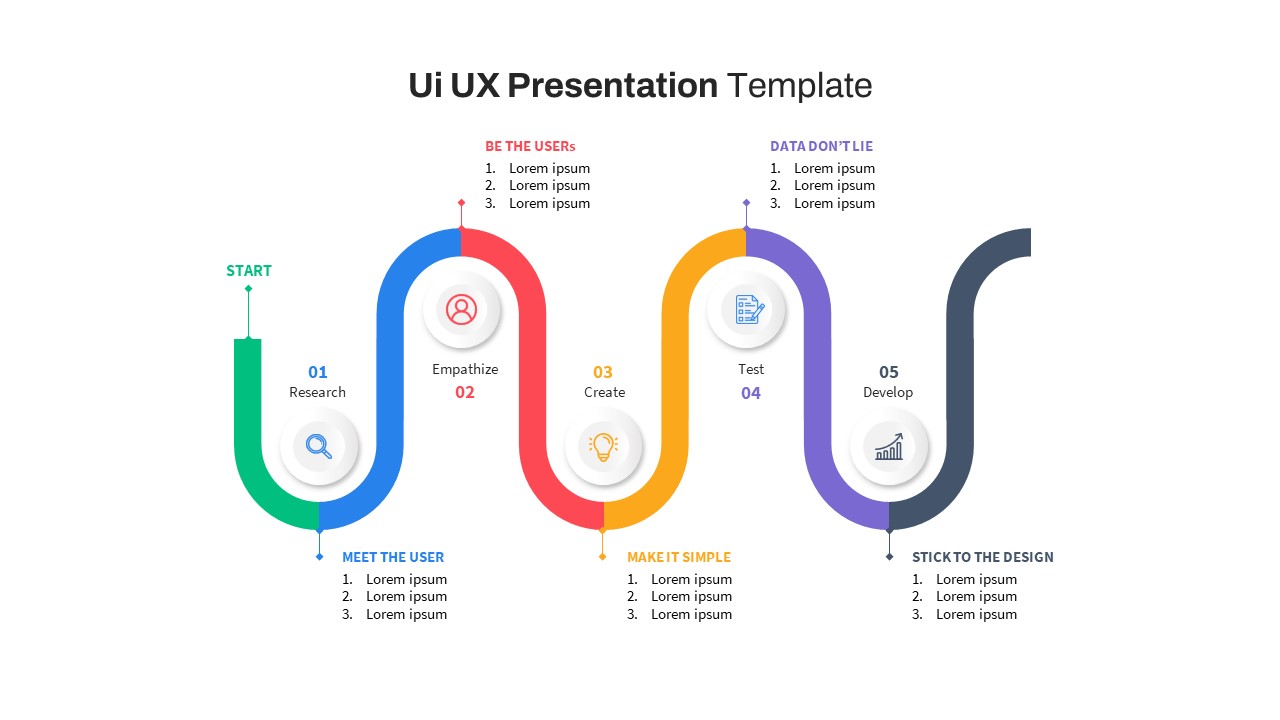
Free UI/UX Process Timeline Diagram Template for PowerPoint & Google Slides
Process
Free
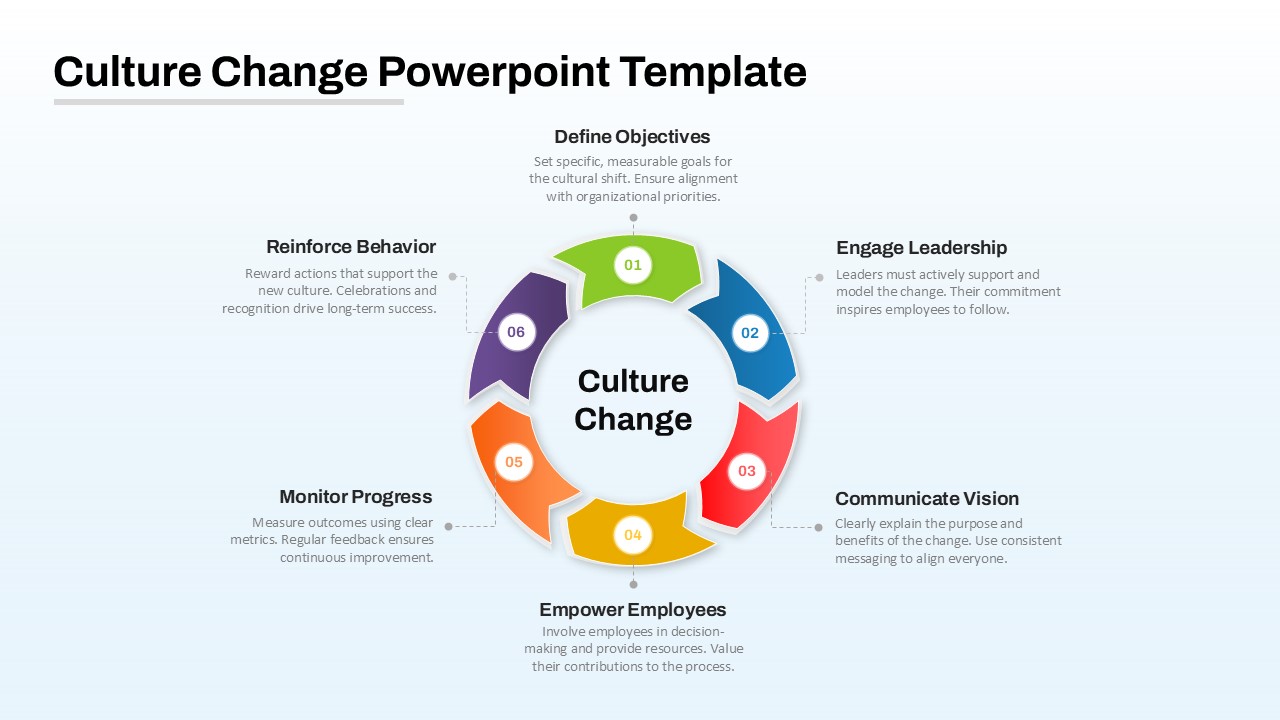
Culture Change Circular Process Diagram Template for PowerPoint & Google Slides
Process
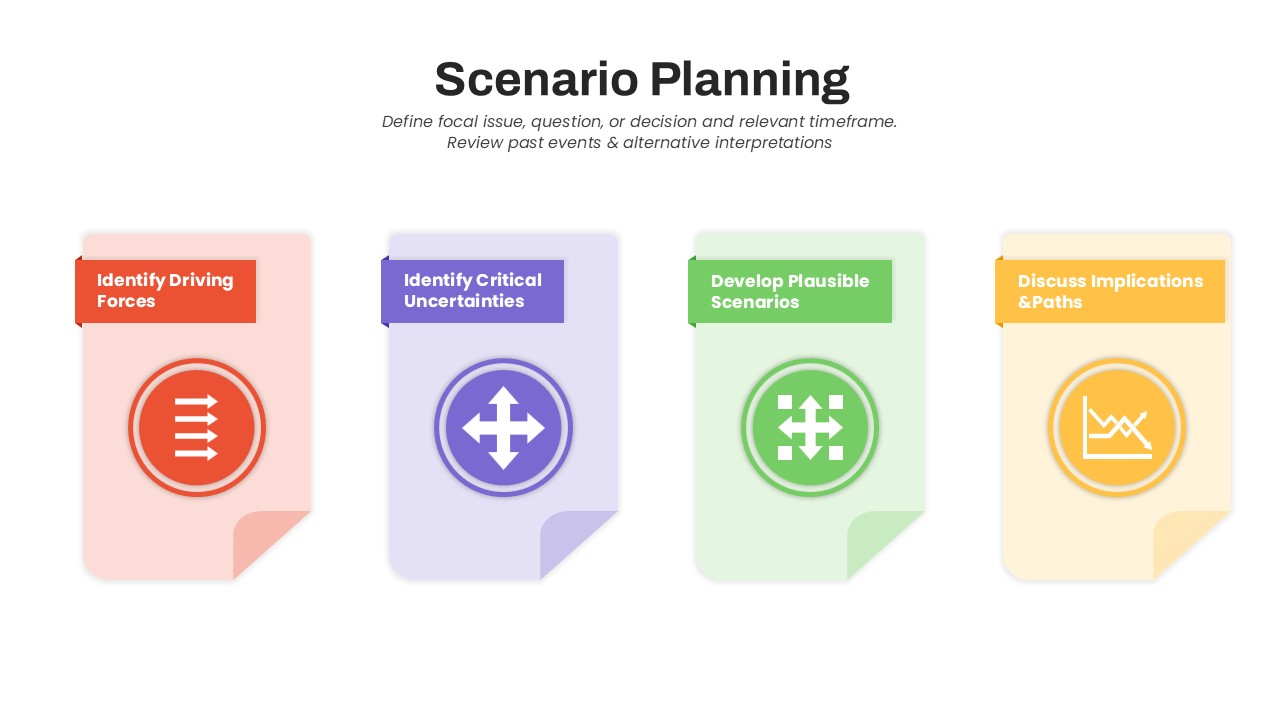
Scenario Planning Process Diagram Template for PowerPoint & Google Slides
Process
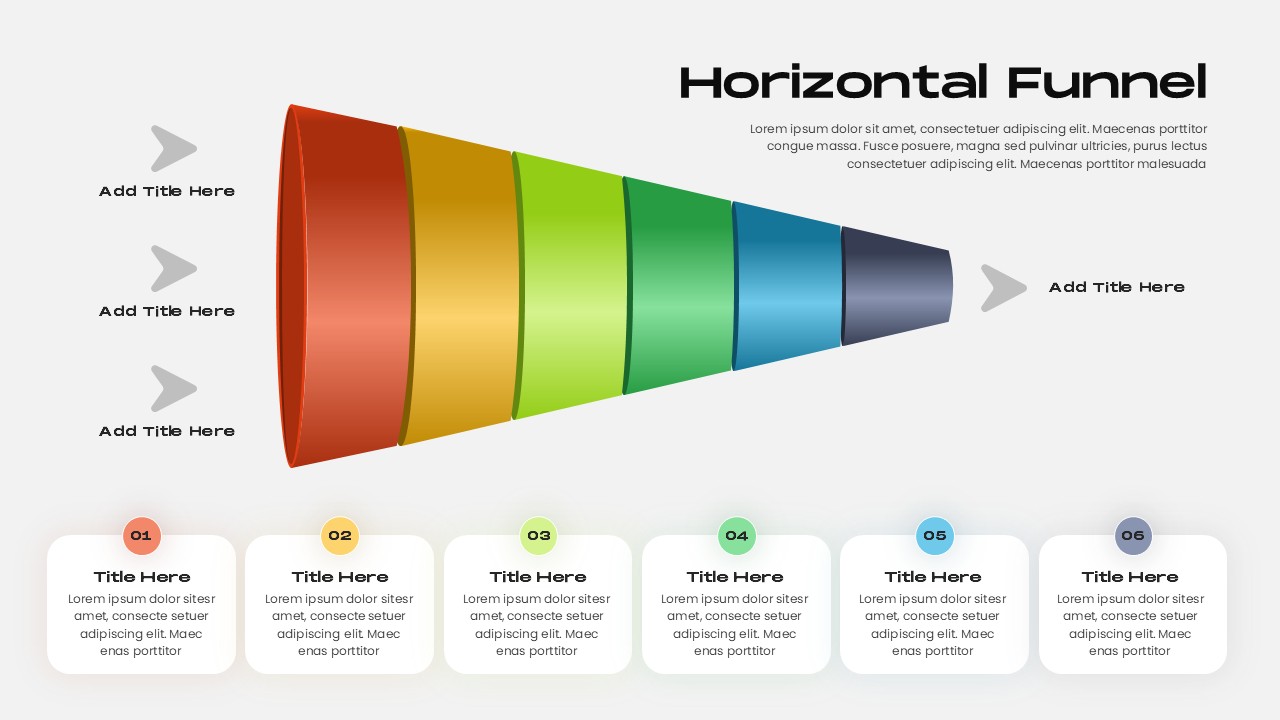
Horizontal Funnel Diagram Process Template for PowerPoint & Google Slides
Funnel
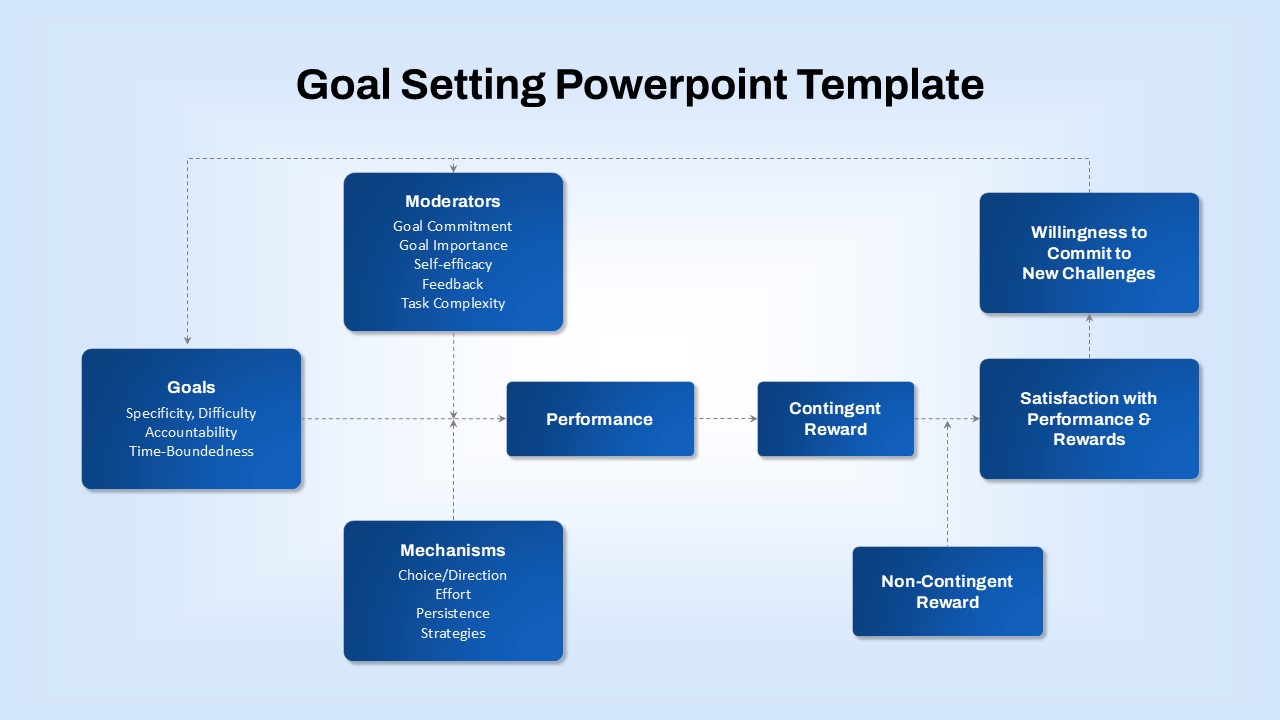
Goal-Setting Process Flow Diagram Template for PowerPoint & Google Slides
Goals
Change Management Process Cycle Diagram Template for PowerPoint & Google Slides
Process
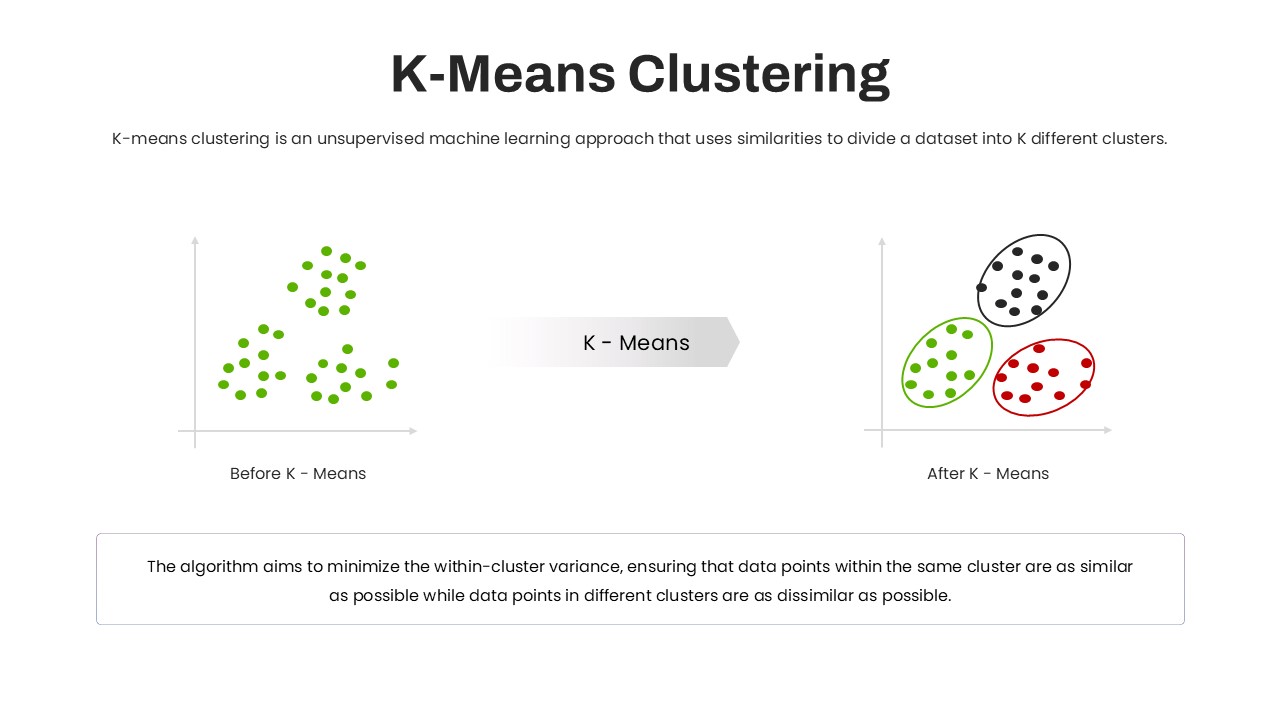
K-Means Clustering Process Diagram Template for PowerPoint & Google Slides
Machine Learning