Comprehensive Release & Deployment KPI Template for PowerPoint & Google Slides
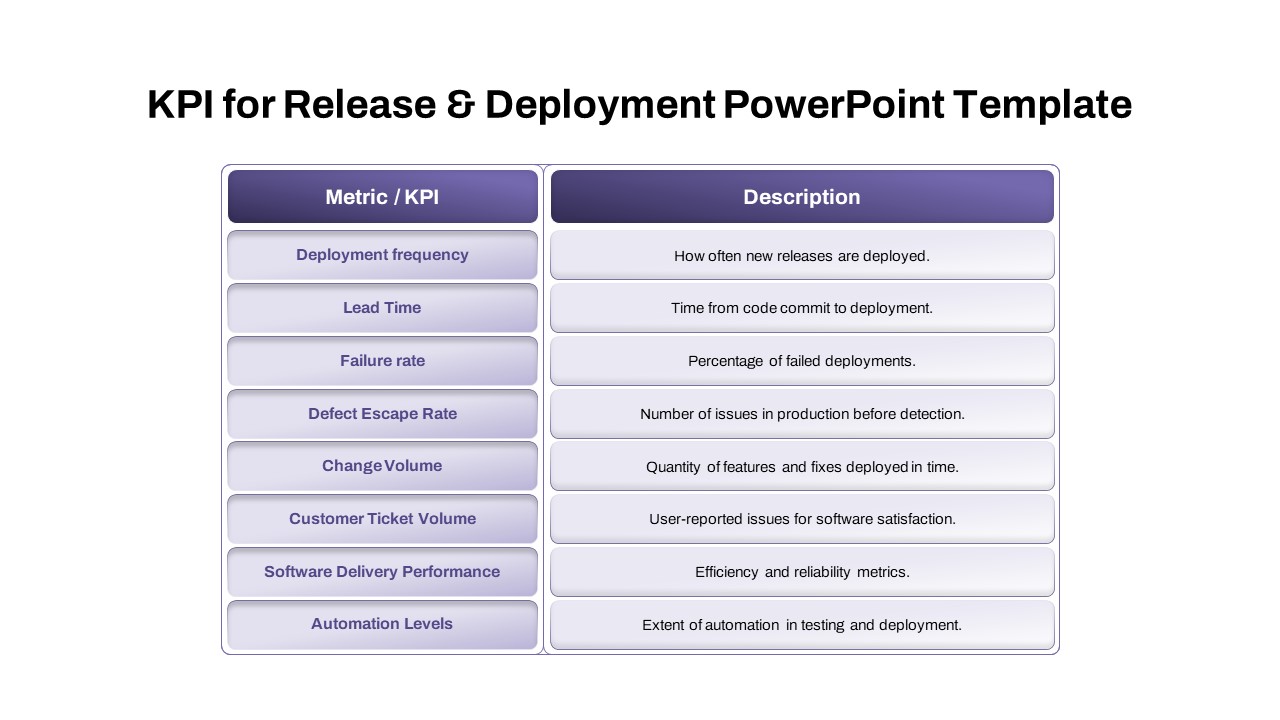
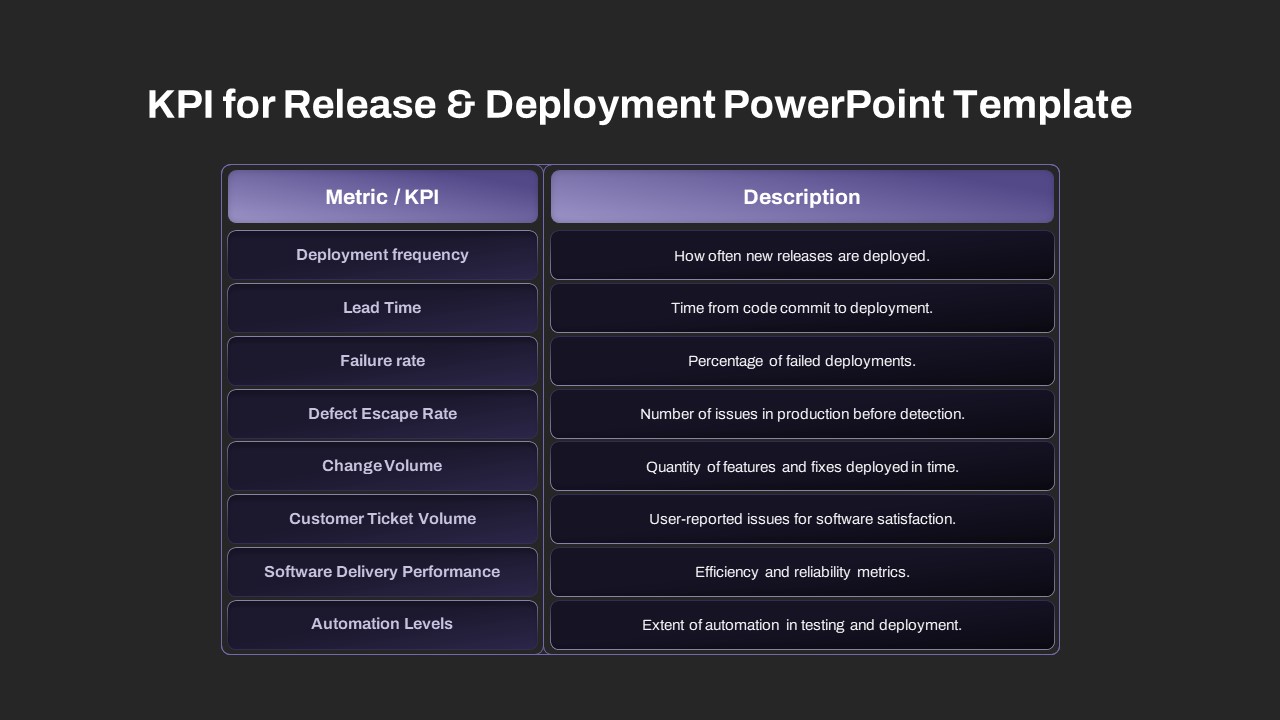

Visualize release and deployment metrics with this KPI slide template featuring a two-column metrics table designed for PowerPoint & Google Slides. The slide’s title header sits above a fully editable table divided into Metric/KPI and Description columns. Eight rows highlight key DevOps performance measures—Deployment Frequency, Lead Time, Failure Rate, Defect Escape Rate, Change Volume, Customer Ticket Volume, Software Delivery Performance, and Automation Levels—paired with concise definitions. Soft purple header cells and light gradient row fills create hierarchy, while subtle cell borders and rounded corners ensure a polished, professional look.
Built on master slides, every table element is fully customizable via drag-and-drop placeholders and theme settings. Adjust header and row colors, modify column widths, or update font styles without disturbing the layout. Replace KPI names or extend rows when needed, and your changes propagate across the deck. The template’s minimal design preserves ample white space for readability and accommodates additional slide notes or callouts. Consistent slide numbering and built-in grid guides guarantee pixel-perfect alignment on any screen size or projector.
Ideal for Agile retrospectives, DevOps reviews, and executive presentations, this KPI table slide communicates complex data clearly and efficiently. Use it to track sprint releases, evaluate deployment health, or benchmark team automation progress. Swap purple accents for your brand palette, then integrate the slide into larger decks with no reformatting. Fully compatible with both PowerPoint and Google Slides, this template accelerates your reporting workflows and reduces formatting errors, so you can focus on insights instead of design. Follows best practices for accessible table design and data contrast.
Who is it for
DevOps engineers, release managers, and project leads will leverage this slide to report on deployment health. Financial controllers, CTOs, and process auditors can also adopt it for performance reviews and risk assessments.
Other Uses
Repurpose this KPI table for sprint retrospectives, quality-assurance dashboards, or cross-team scorecards. Adapt row labels to track marketing metrics, sales targets, or customer-support SLAs with the same clear, organized structure.
Login to download this file

Item ID
SB04369
Related Templates

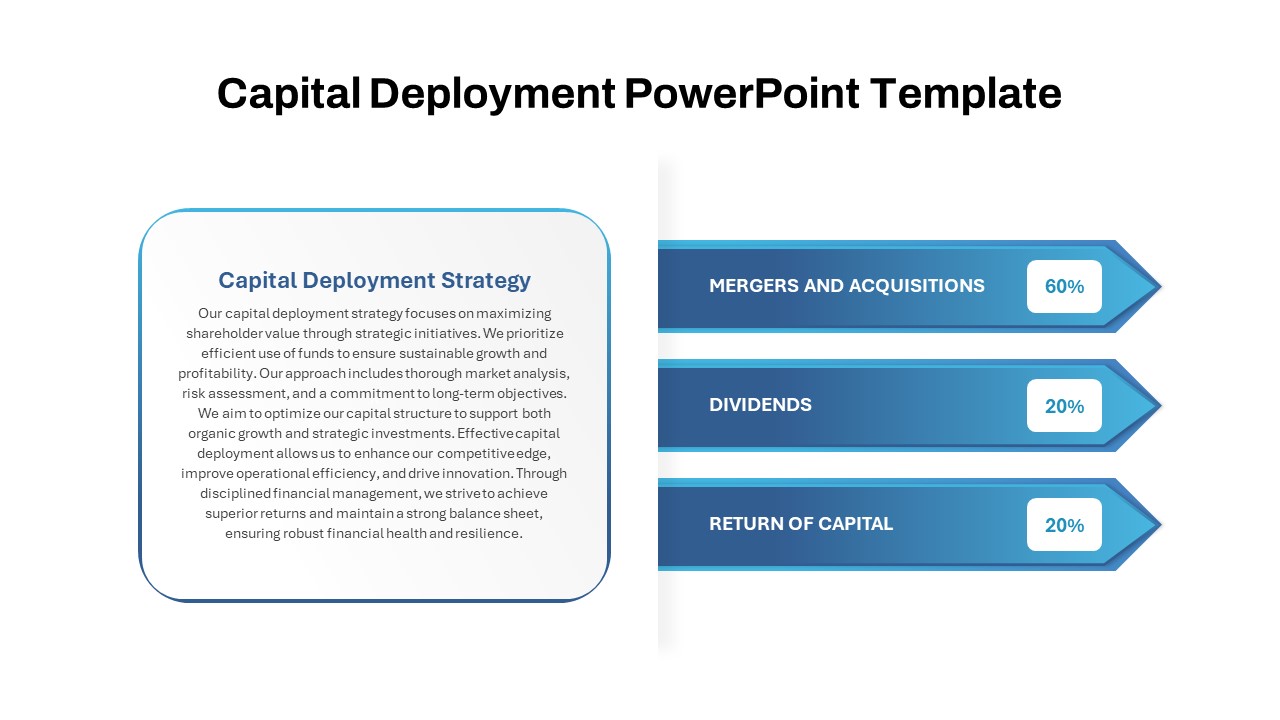
Capital Deployment Percentage Breakdown Template for PowerPoint & Google Slides
Pitch Deck
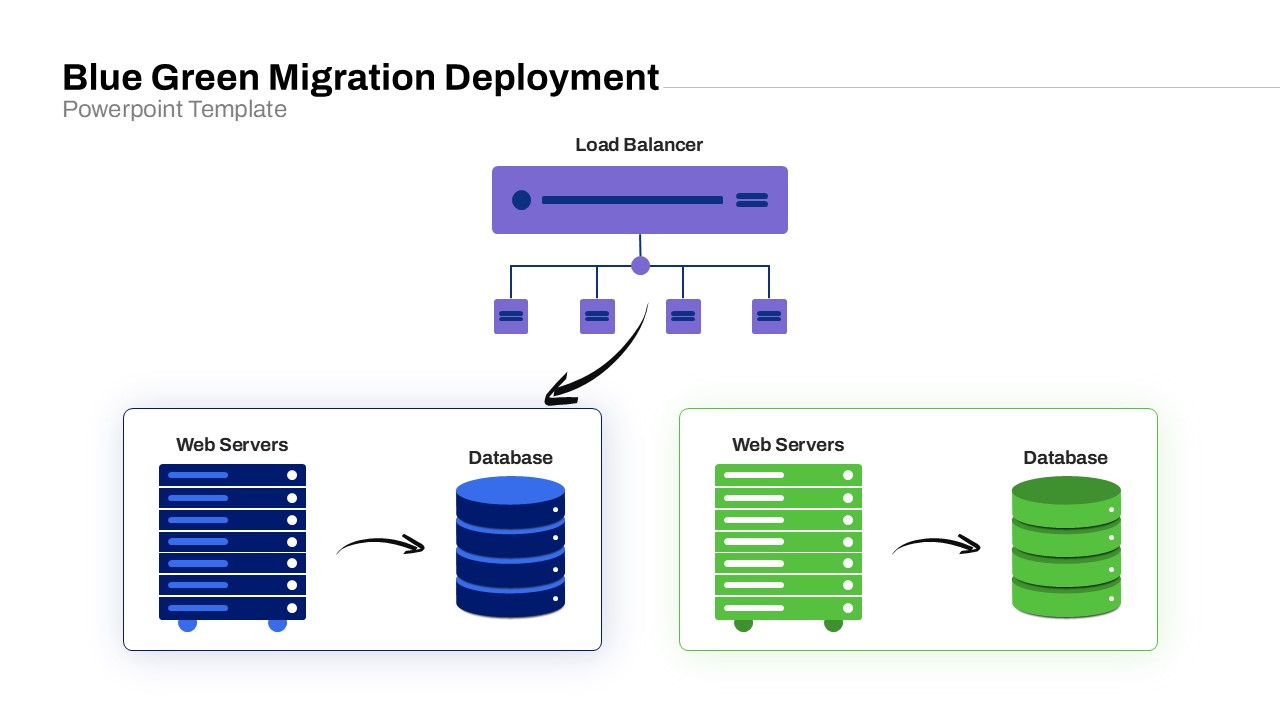
Blue-Green Cloud Deployment Diagram Template for PowerPoint & Google Slides
Cloud Computing
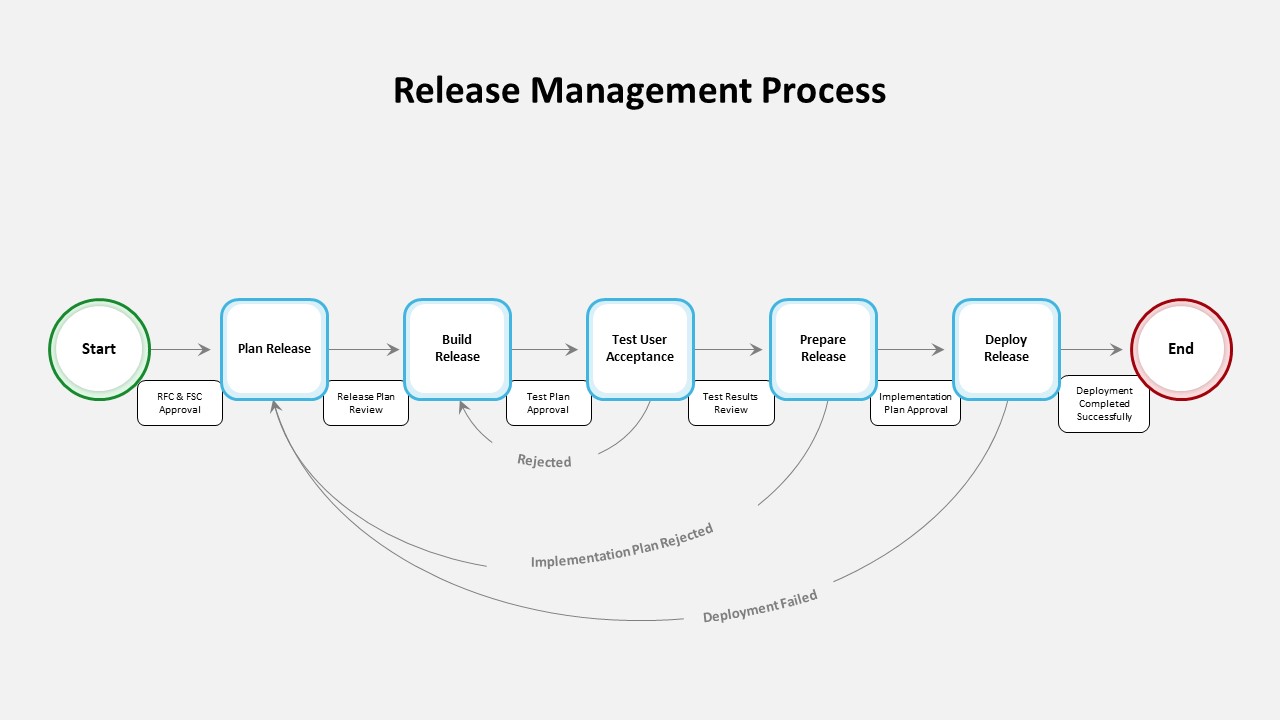
IT Agile Release Management Process Template for PowerPoint & Google Slides
Software Development
Release Management Cycle Circular Diagram Template for PowerPoint & Google Slides
Software Development
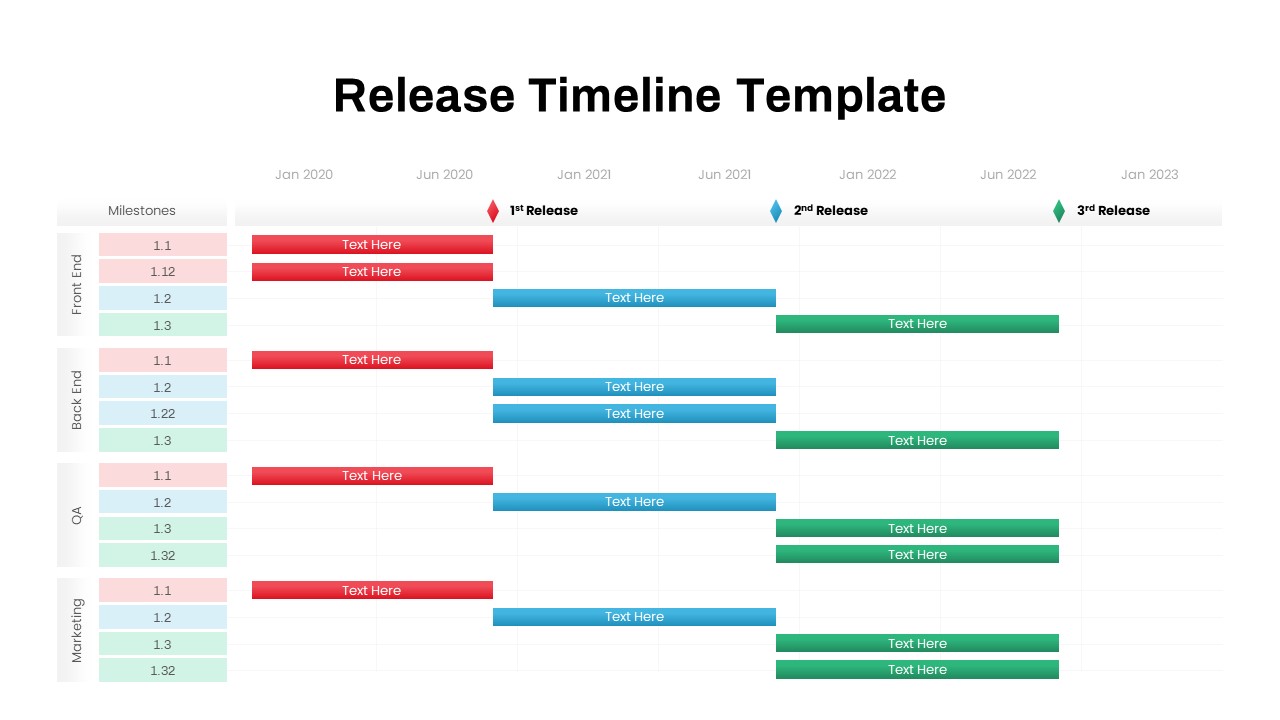
Multi-Team Multi-Phase Release Timeline Template for PowerPoint & Google Slides
Timeline
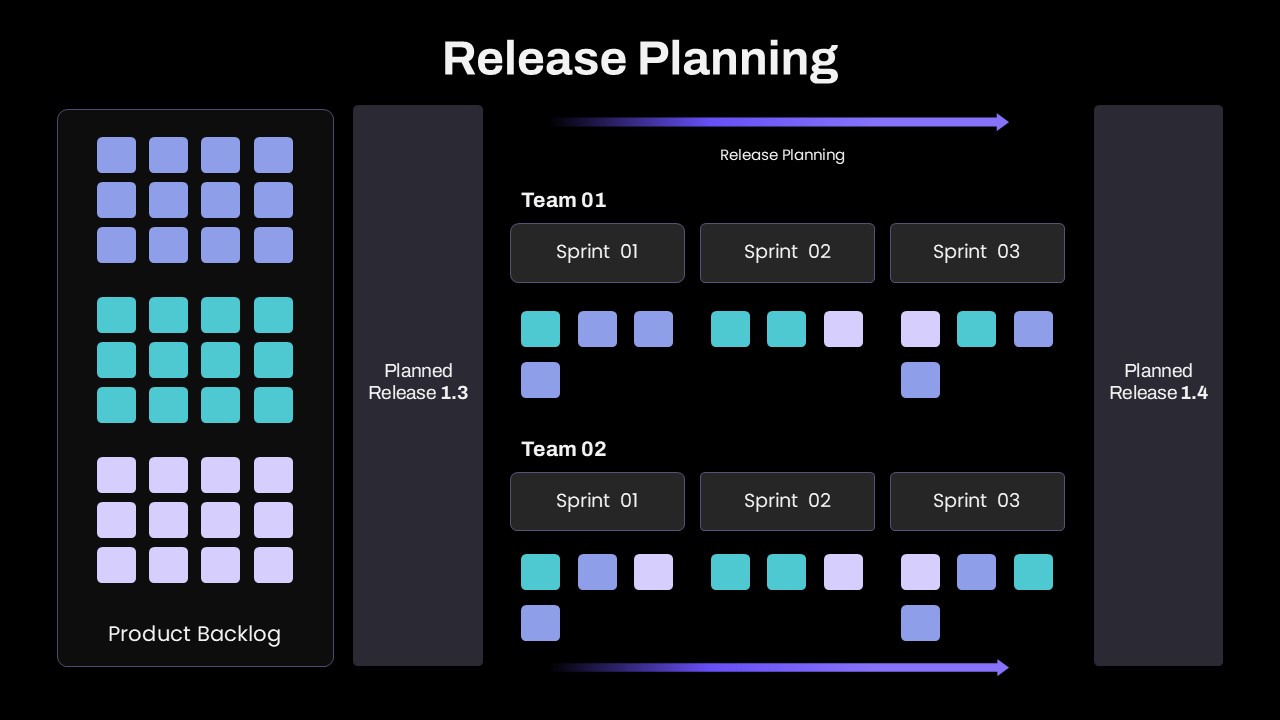
Release Planning Template for PowerPoint & Google Slides
Scrum
Comprehensive Social Media Icons Slide Template for PowerPoint & Google Slides
Advertising
Comprehensive Car Insurance Services Diagram Template for PowerPoint & Google Slides
Business
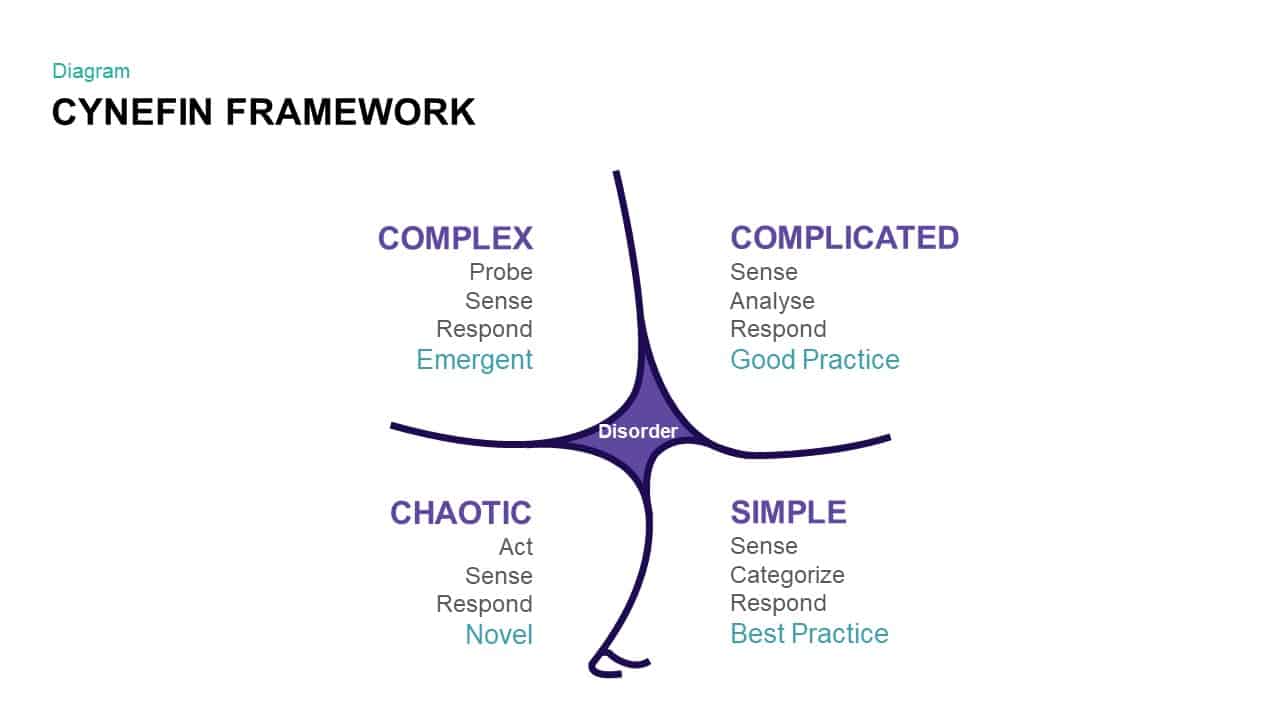
Comprehensive Cynefin Framework Diagram Template for PowerPoint & Google Slides
Opportunities Challenges
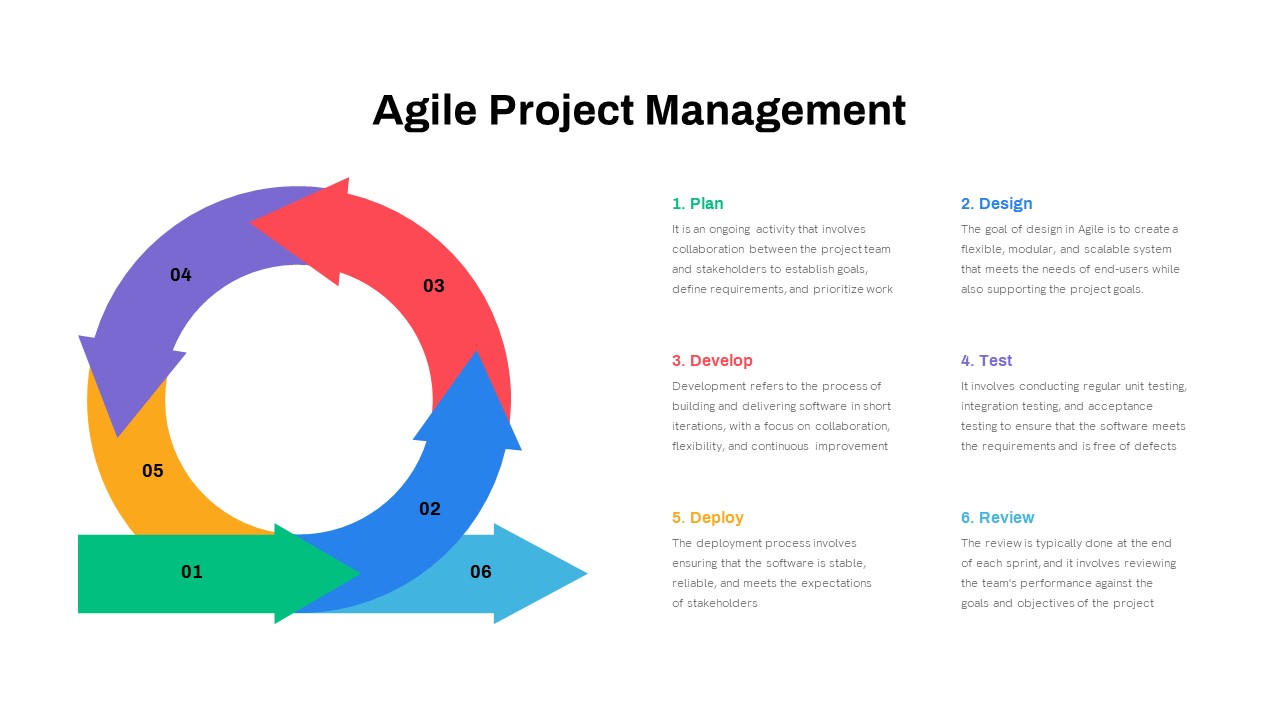
Comprehensive Agile Project Management Template for PowerPoint & Google Slides
Scrum
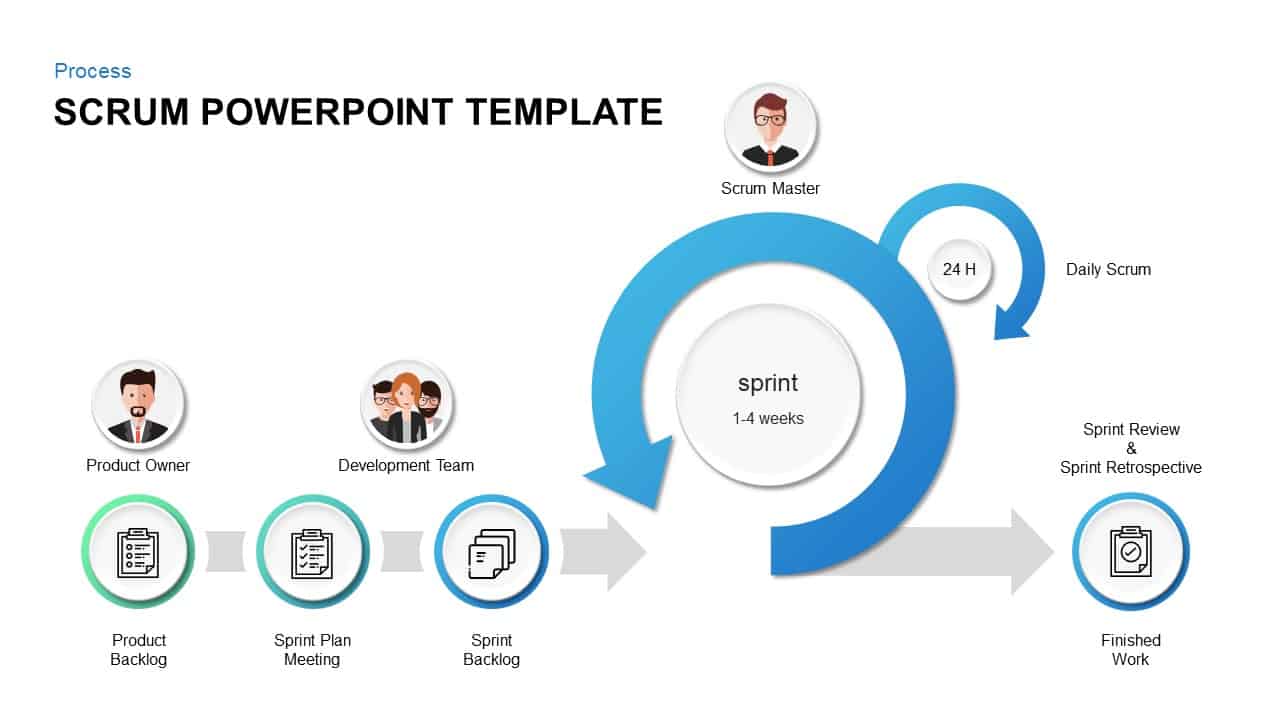
Comprehensive Scrum Infographics Pack Template for PowerPoint & Google Slides
Scrum

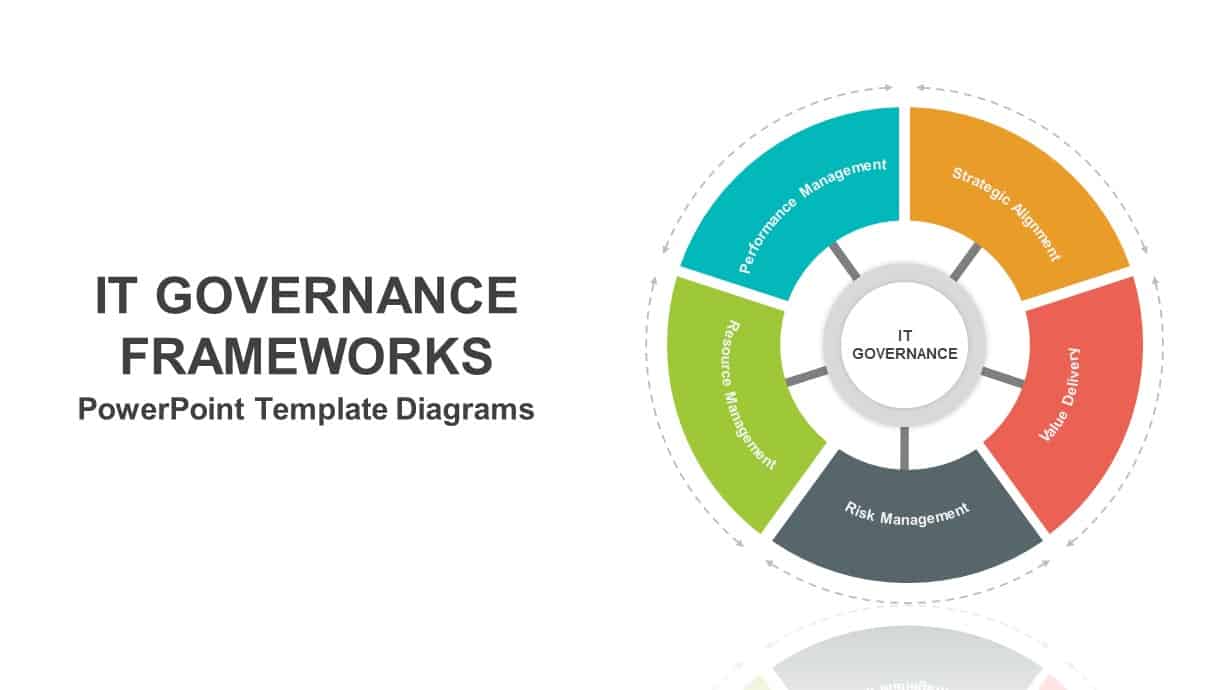
Comprehensive IT Governance Frameworks Template for PowerPoint & Google Slides
Pitch Deck
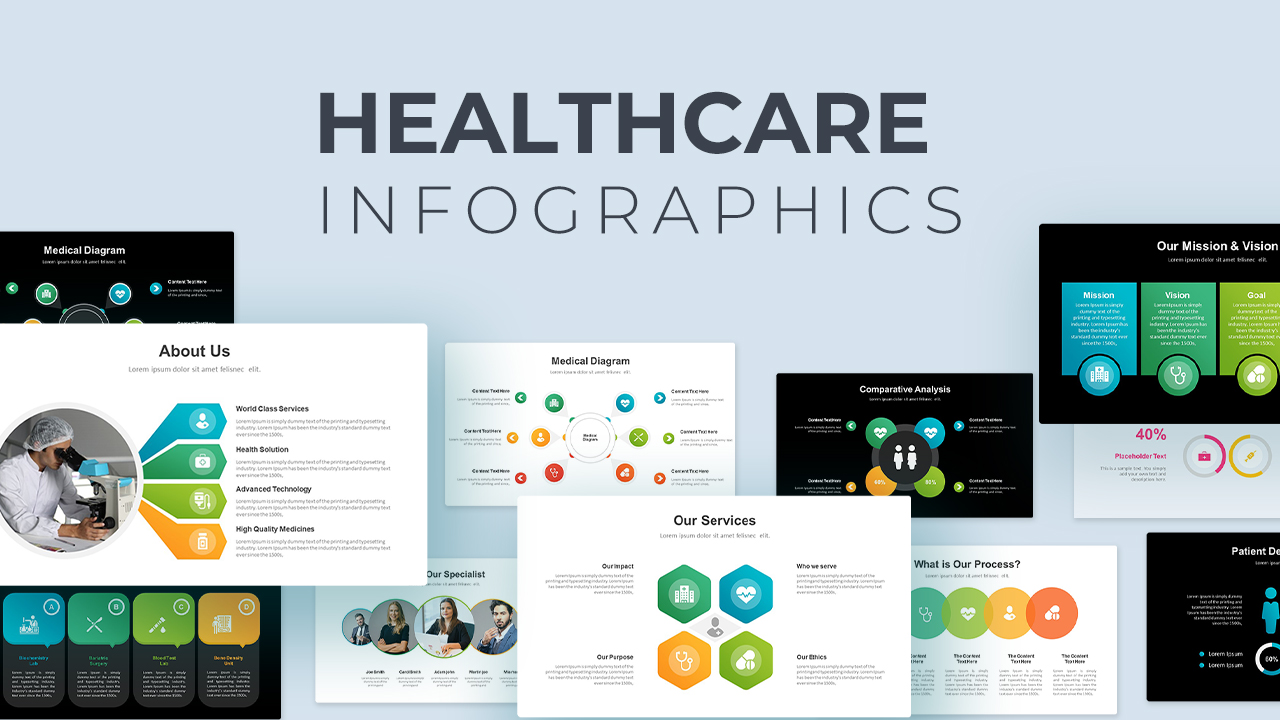
Comprehensive Healthcare Overview Deck Template for PowerPoint & Google Slides
Medical
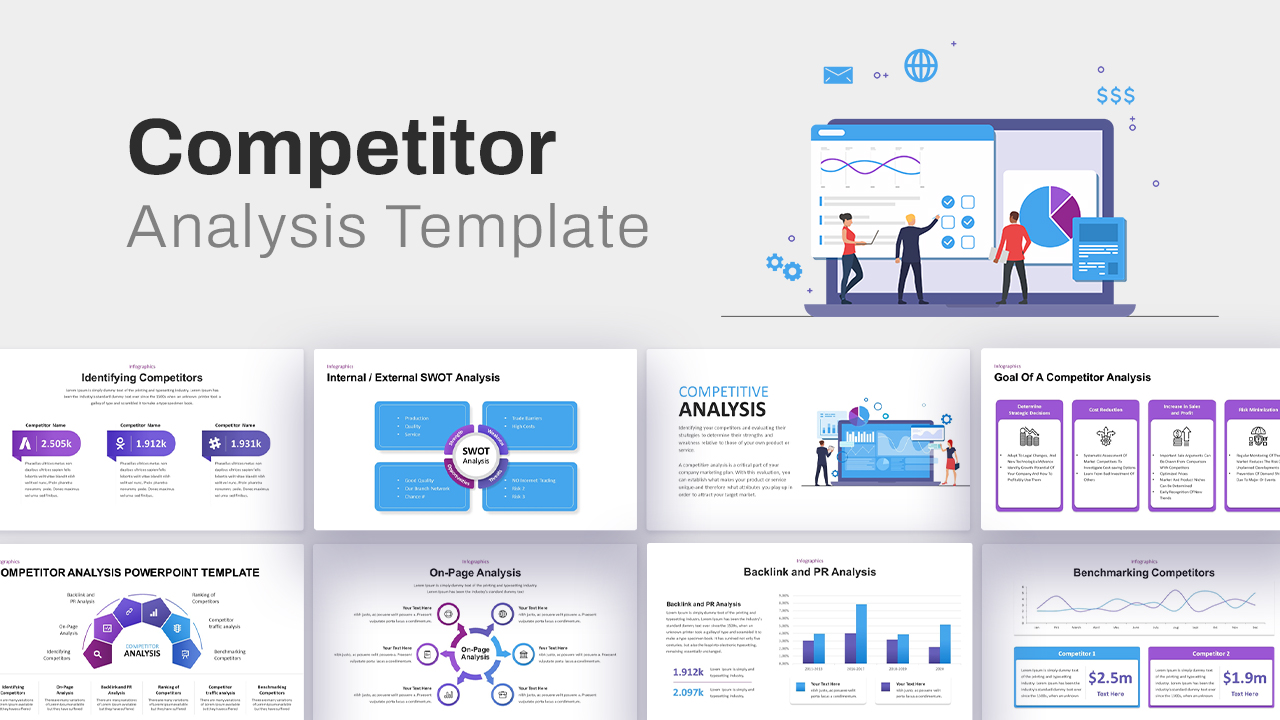
Comprehensive Competitor Analysis Template for PowerPoint & Google Slides
Competitor Analysis
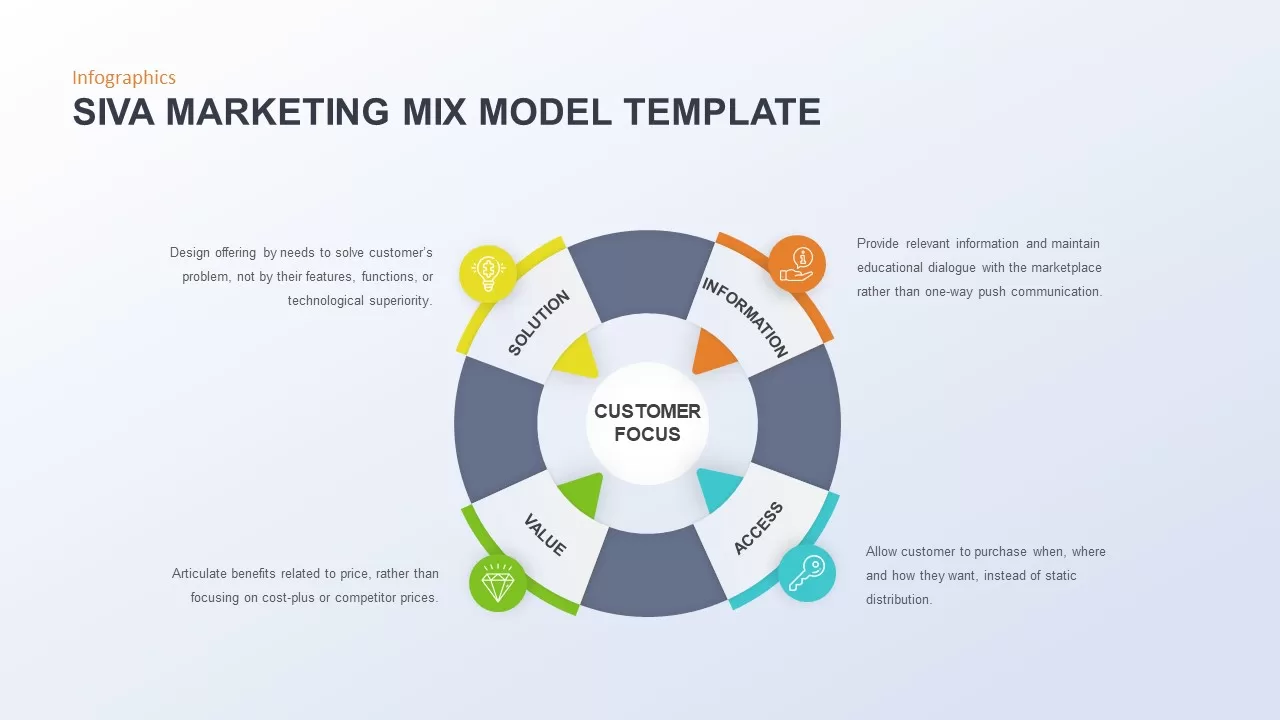
Comprehensive SIVA Marketing Mix Model Template for PowerPoint & Google Slides
Marketing
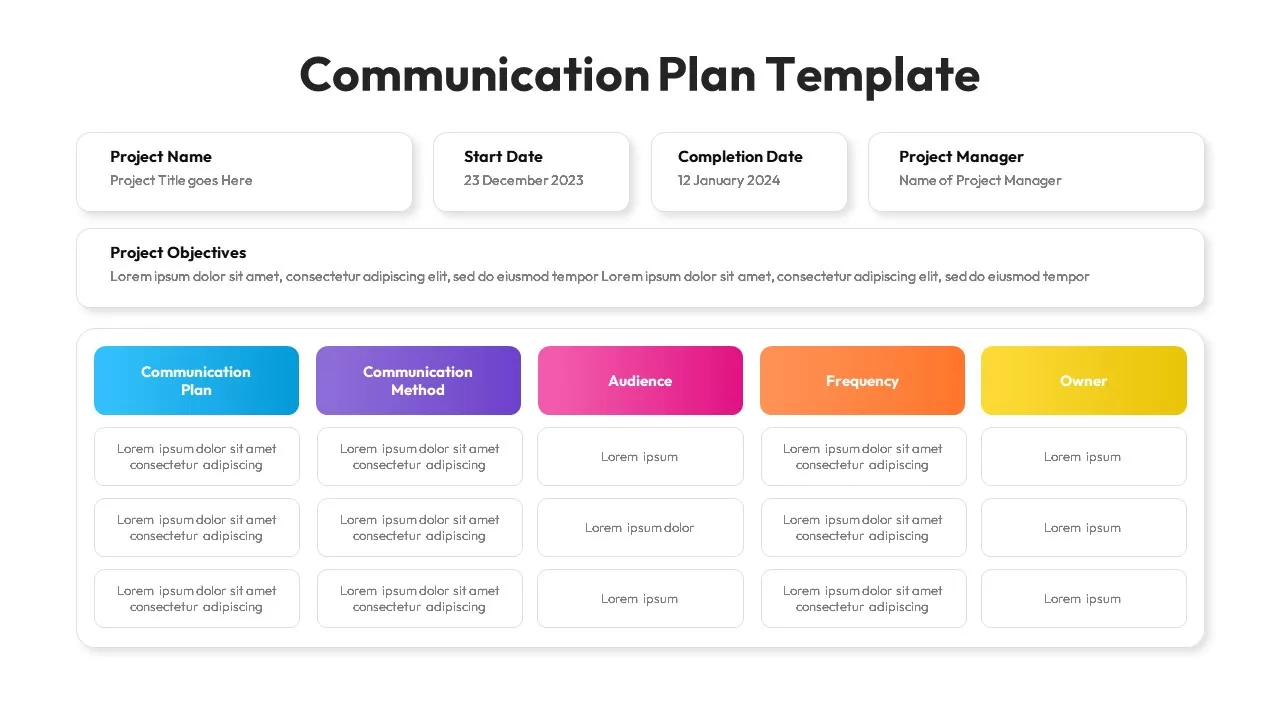
Comprehensive Communication Plan Template for PowerPoint & Google Slides
Business Plan
Comprehensive Recruitment Metrics Report Template for PowerPoint & Google Slides
Recruitment

Comprehensive Thesis Defense Presentation Template for PowerPoint & Google Slides
Pitch Deck
Comprehensive Risk Impact Analysis Template for PowerPoint & Google Slides
Risk Management
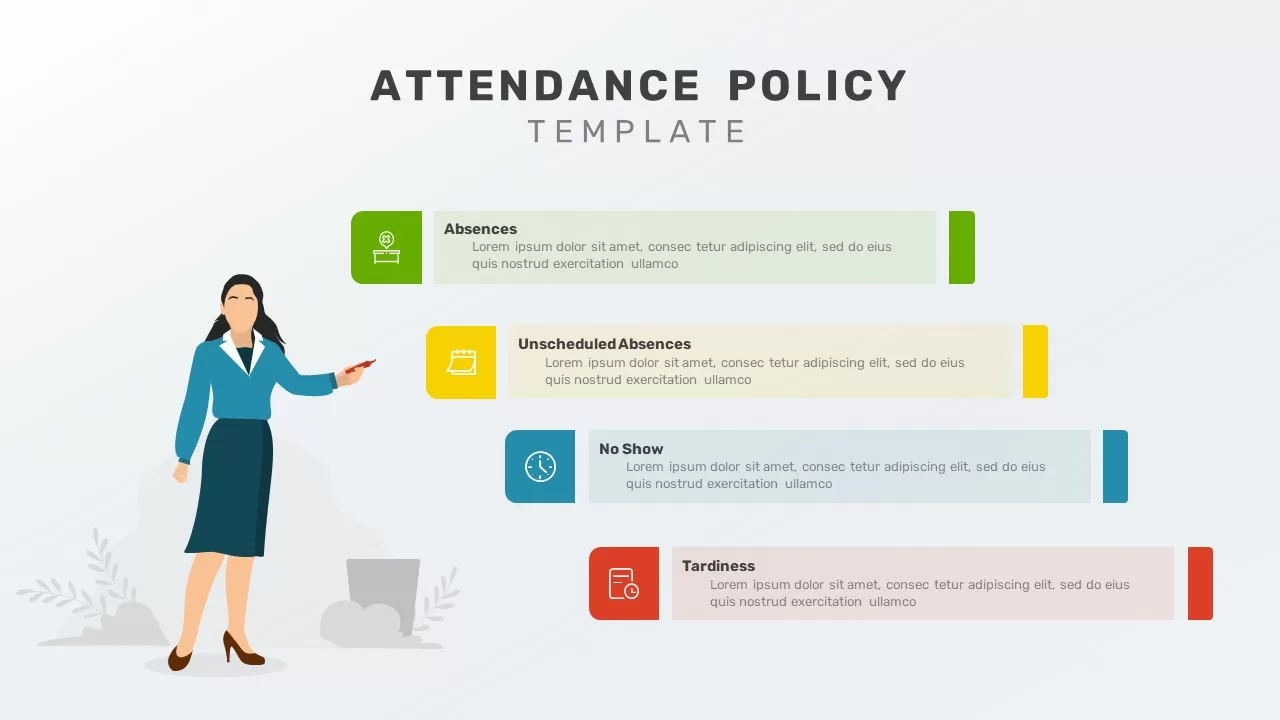
Comprehensive Attendance Policy Overview Template for PowerPoint & Google Slides
Process
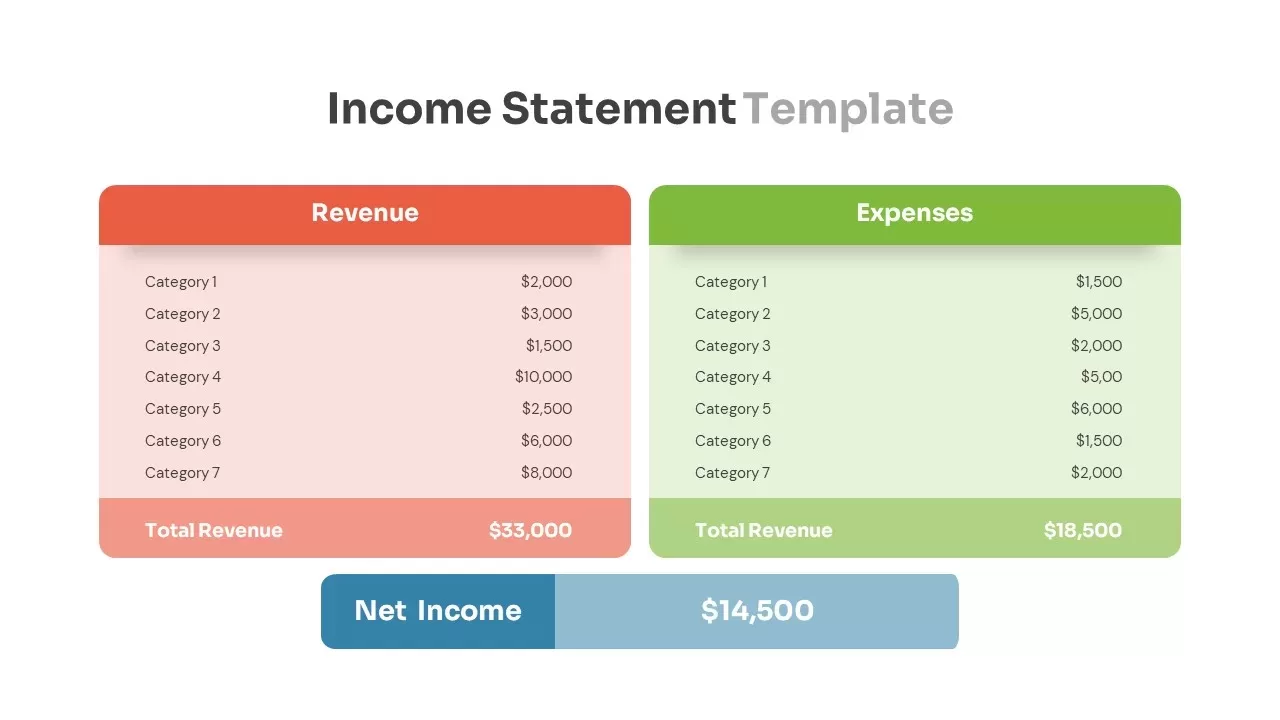
Comprehensive Income Statement Overview Template for PowerPoint & Google Slides
Business Report
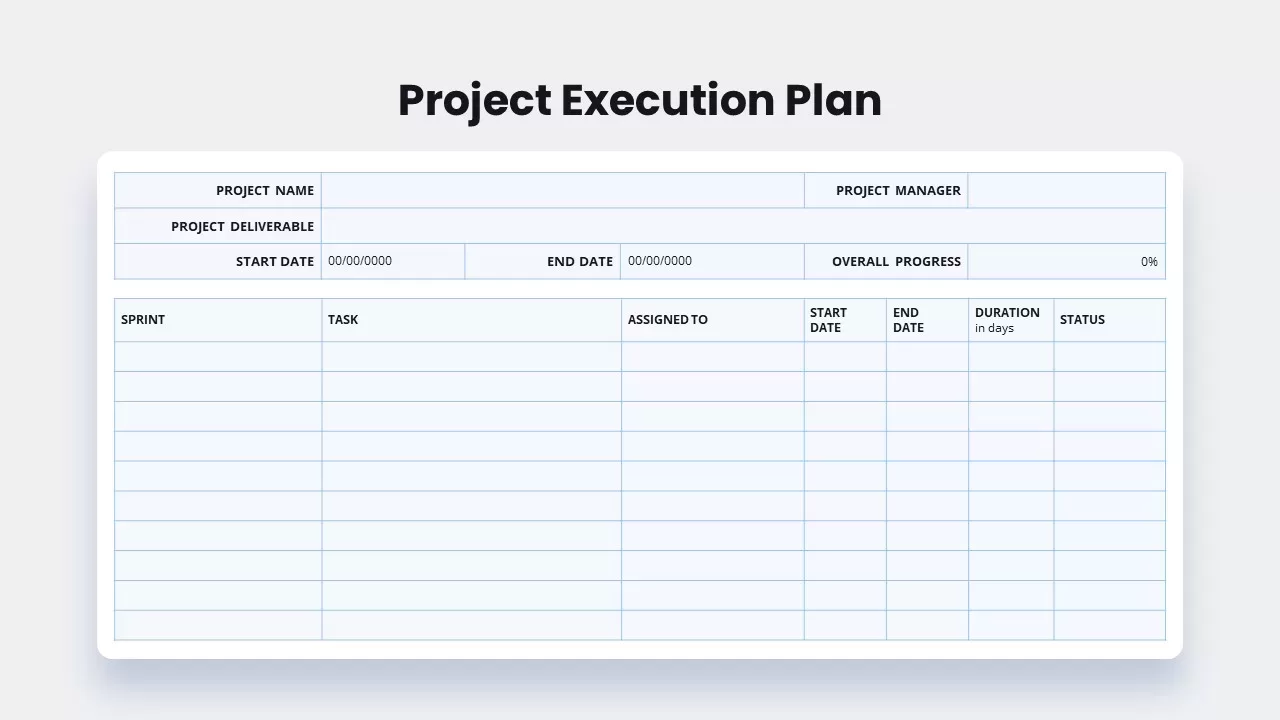
Comprehensive Project Execution Plan template for PowerPoint & Google Slides
Project Status
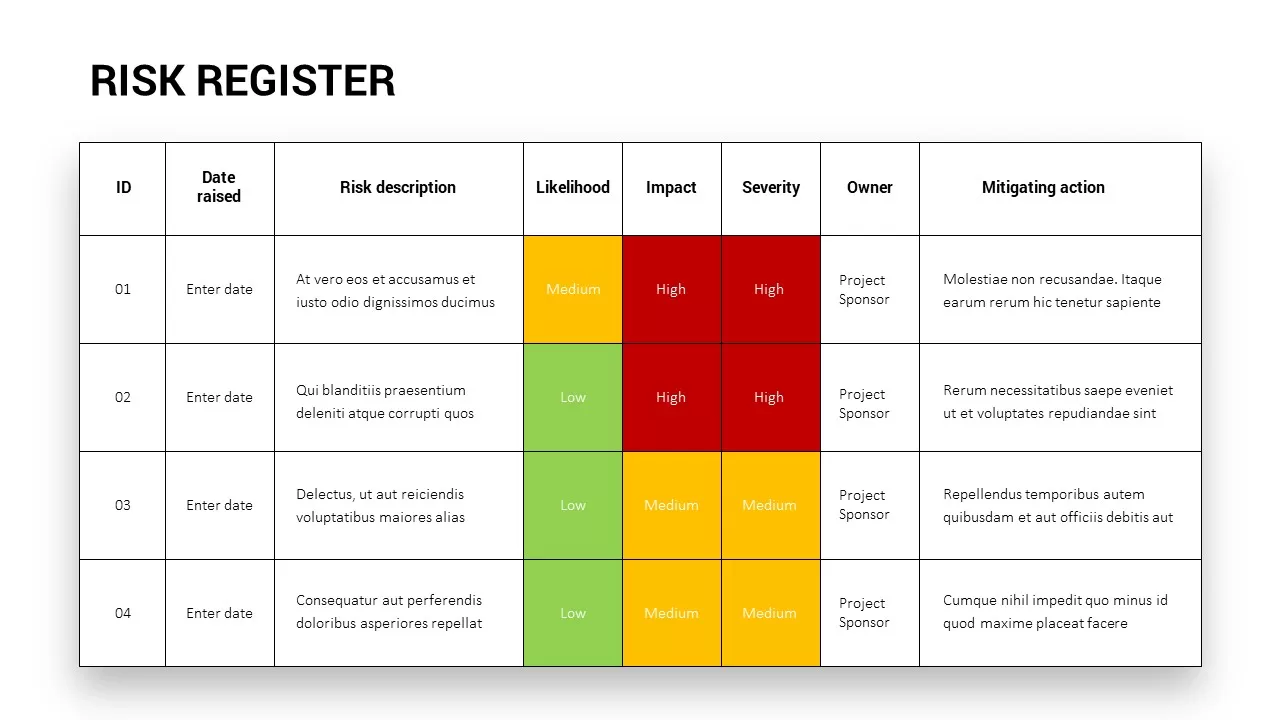
Comprehensive Risk Register Table Template for PowerPoint & Google Slides
Risk Management
Comprehensive Resource Planning Table Template for PowerPoint & Google Slides
Project
Comprehensive Hiring Process Flow Chart Template for PowerPoint & Google Slides
Flow Charts
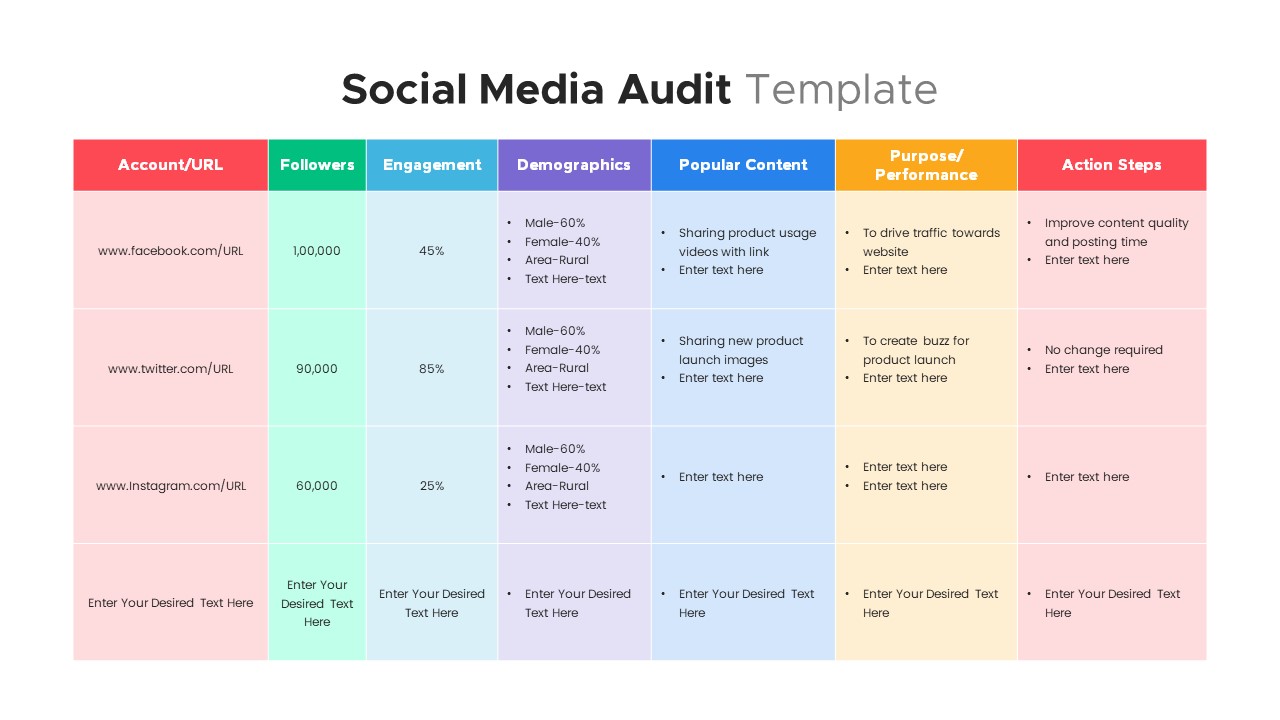
Comprehensive Social Media Audit Template for PowerPoint & Google Slides
Digital Marketing
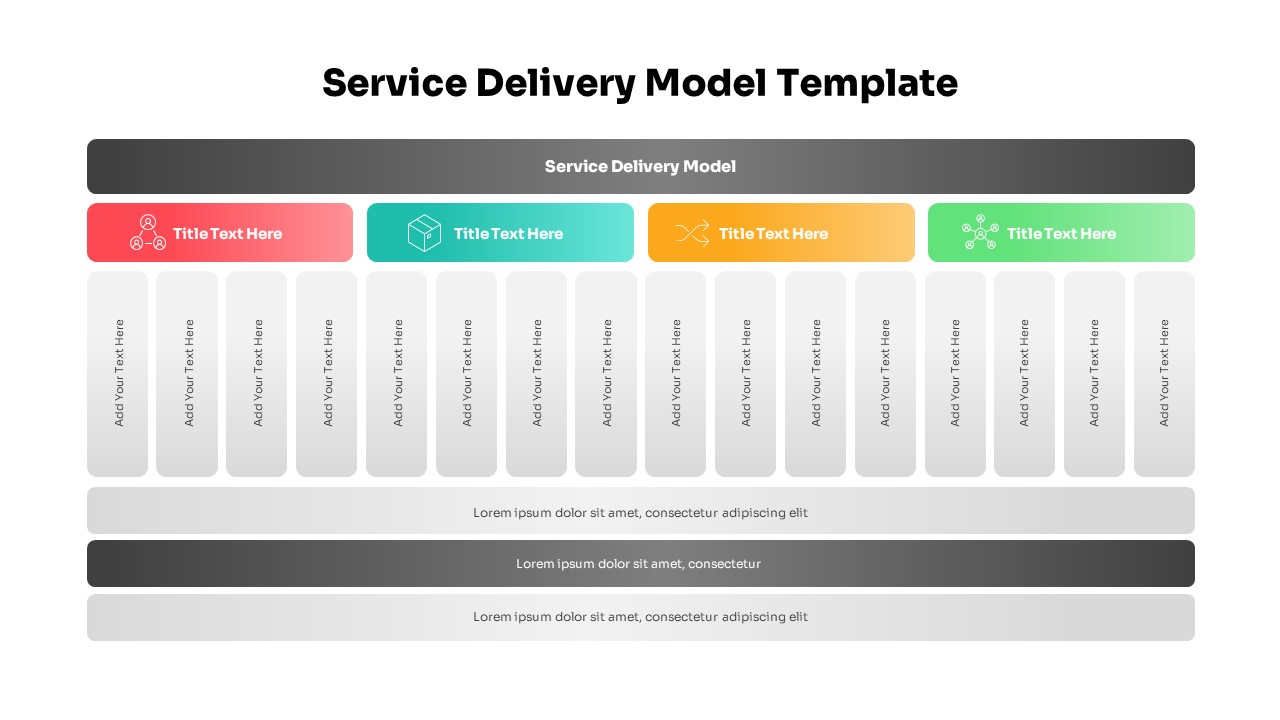
Comprehensive Service Delivery Model Template for PowerPoint & Google Slides
Project
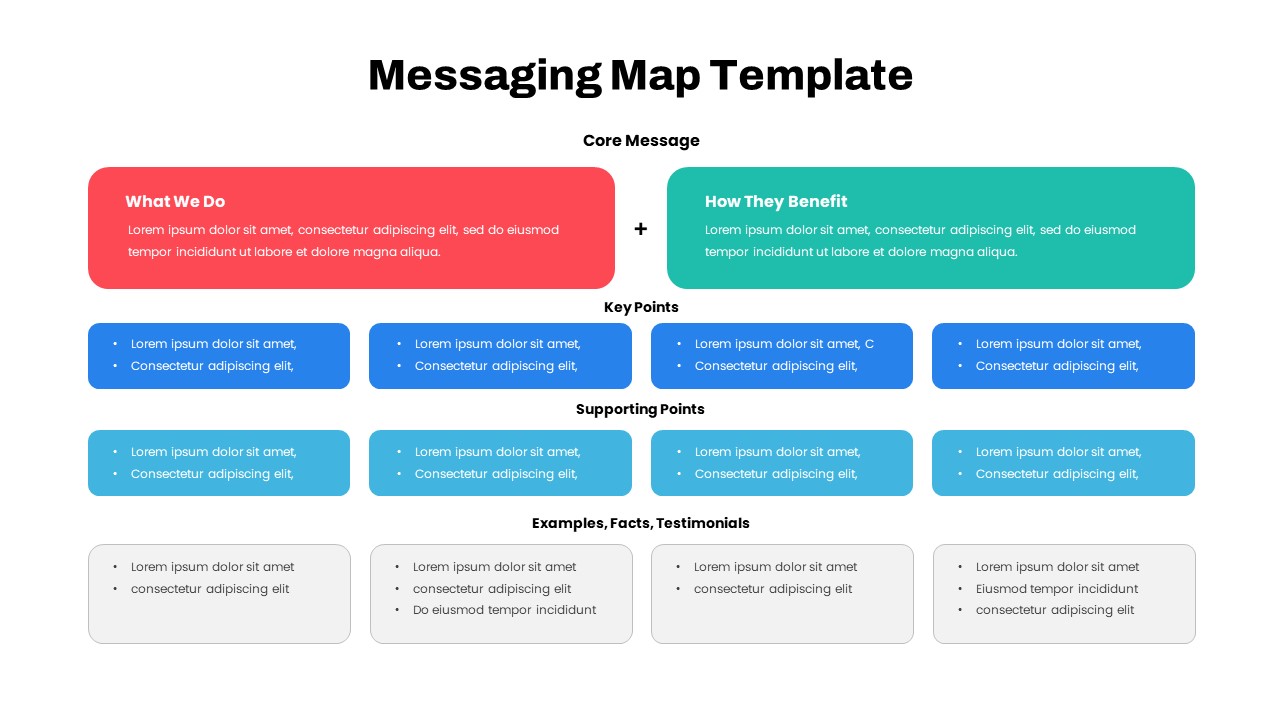
Comprehensive Messaging Map Framework Template for PowerPoint & Google Slides
Process
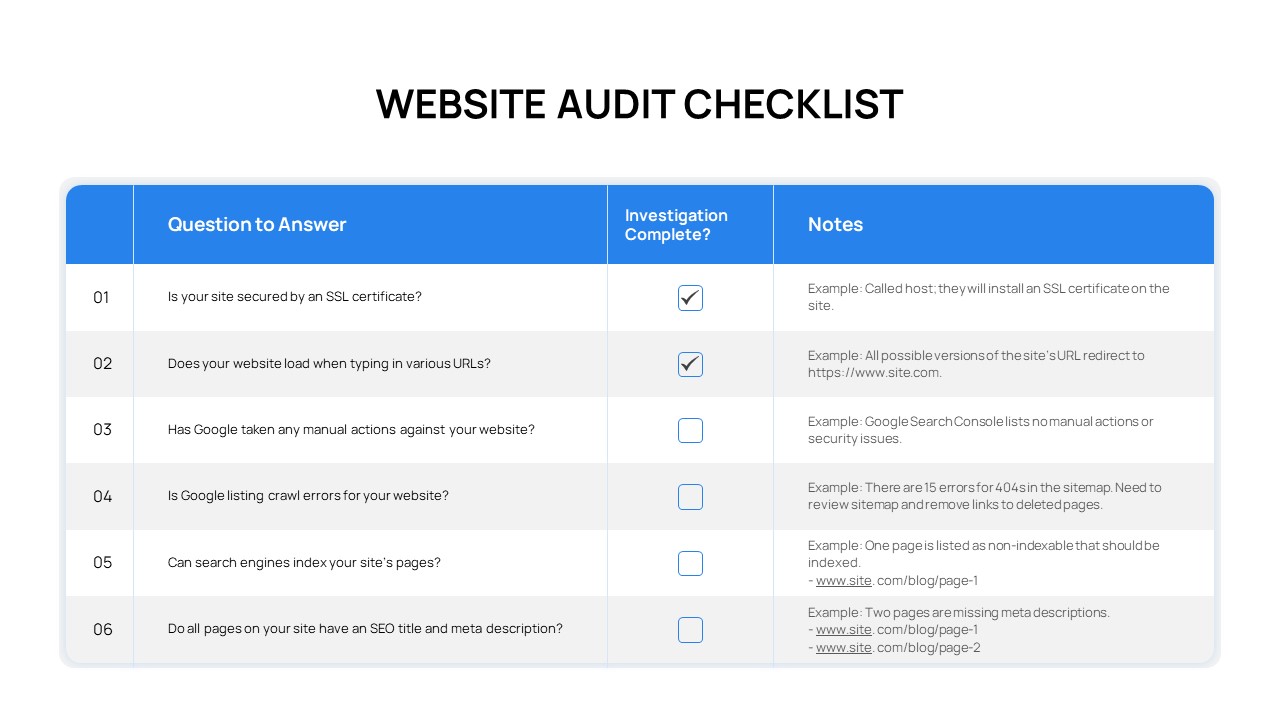
Comprehensive Website Audit Checklist Template for PowerPoint & Google Slides
Technology
Comprehensive Process Flow Diagram Template for PowerPoint & Google Slides
Process
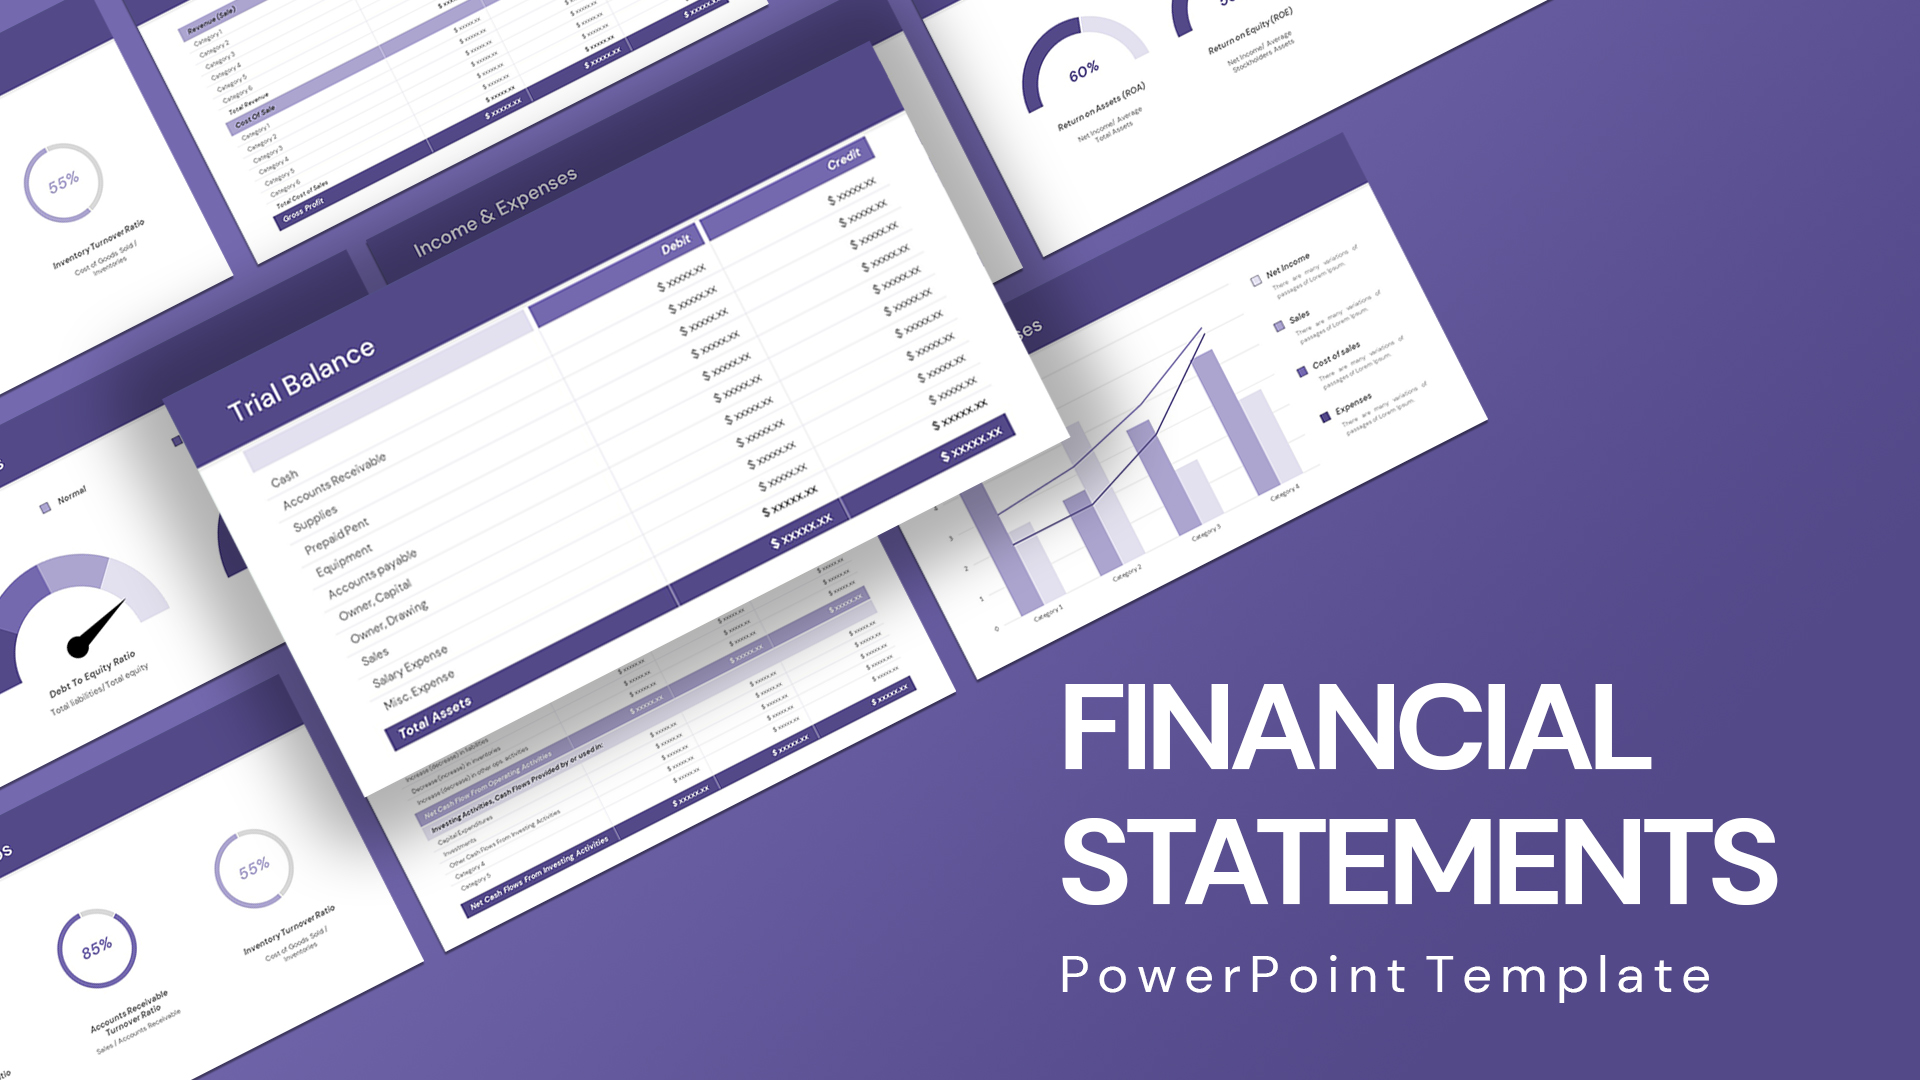
Comprehensive Financial Statements Template for PowerPoint & Google Slides
Finance
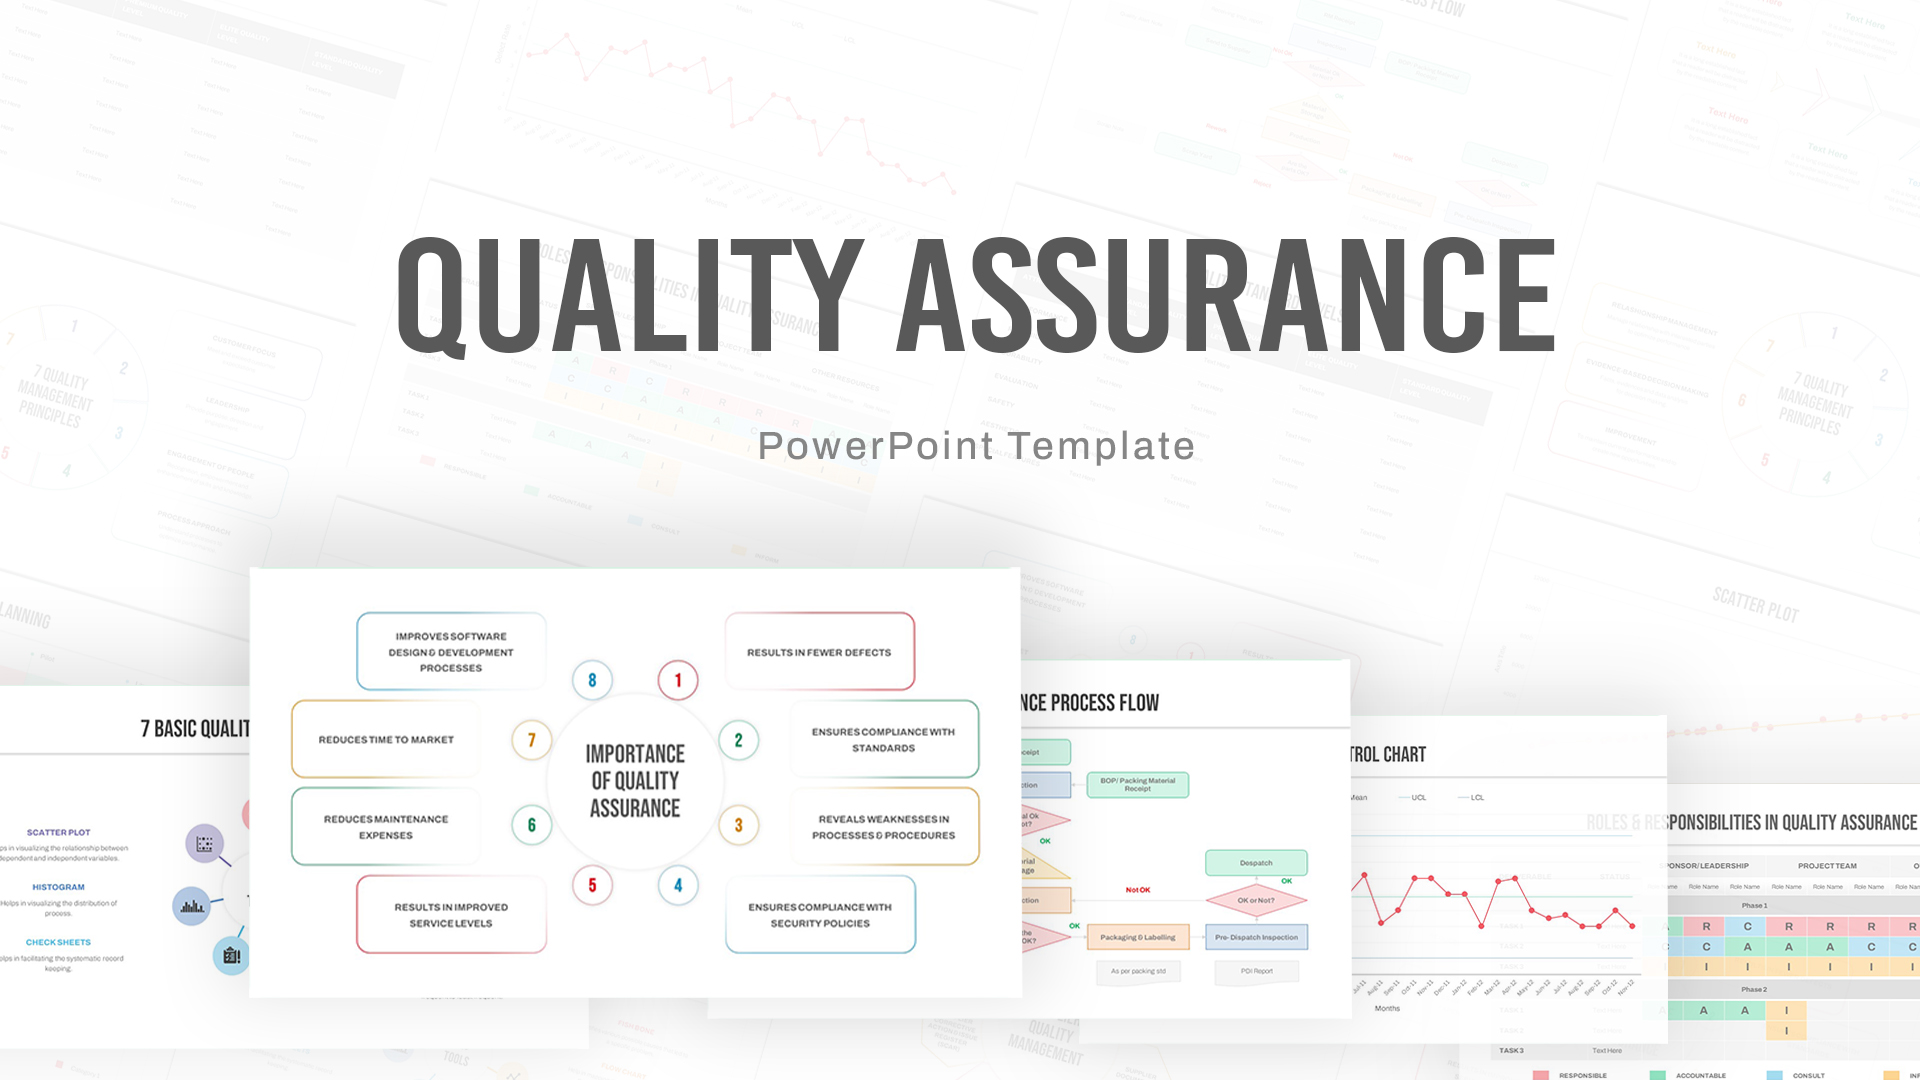
Comprehensive Quality Assurance Workflow Template for PowerPoint & Google Slides
Company Profile

Free Comprehensive Social Work Presentation Template for PowerPoint & Google Slides
Pitch Deck
Free
Free Comprehensive Charts & Graphs Template for PowerPoint & Google Slides
Charts
Free
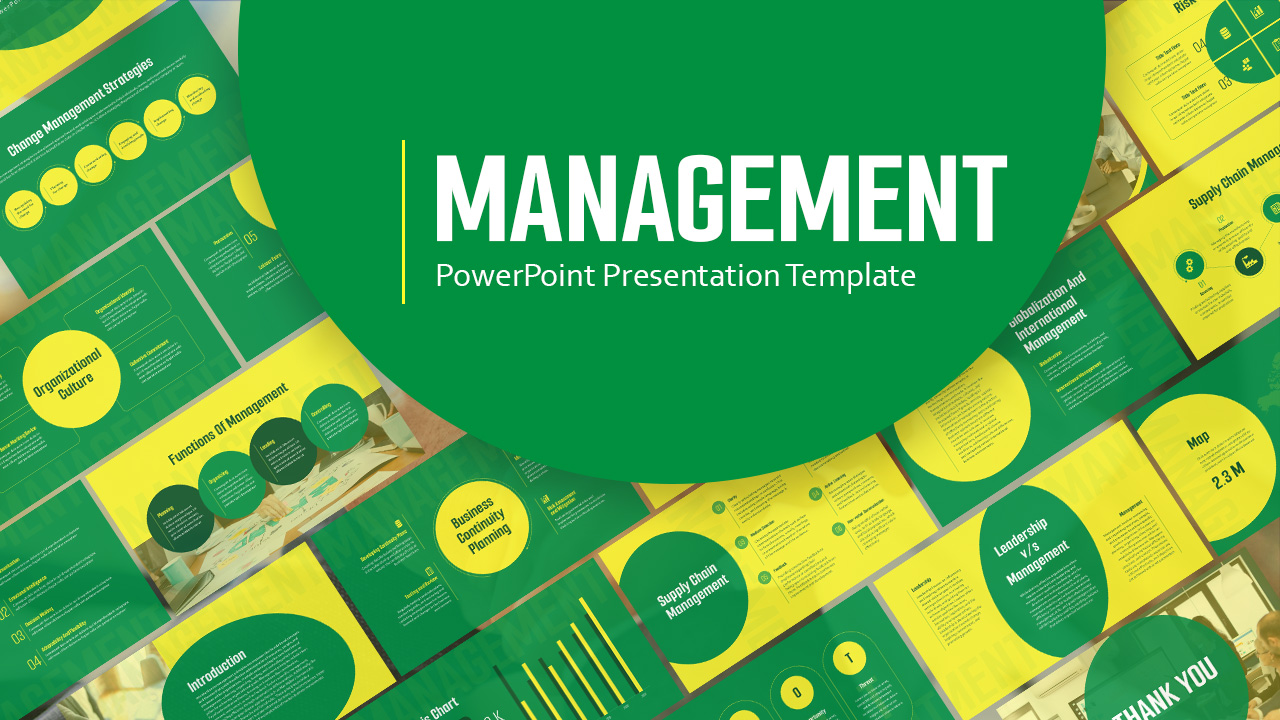
Free Comprehensive Management Strategy Deck Template for PowerPoint & Google Slides
Pitch Deck
Free
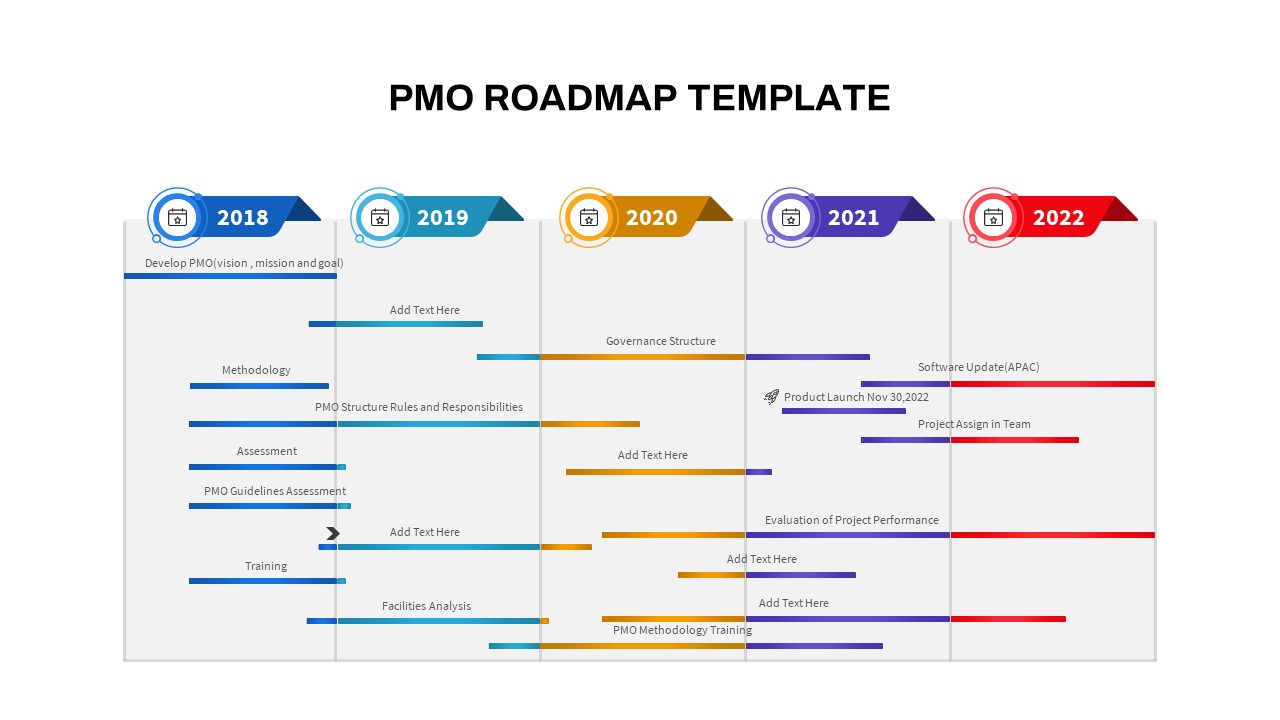
Comprehensive PMO Roadmap Timeline Template for PowerPoint & Google Slides
Roadmap
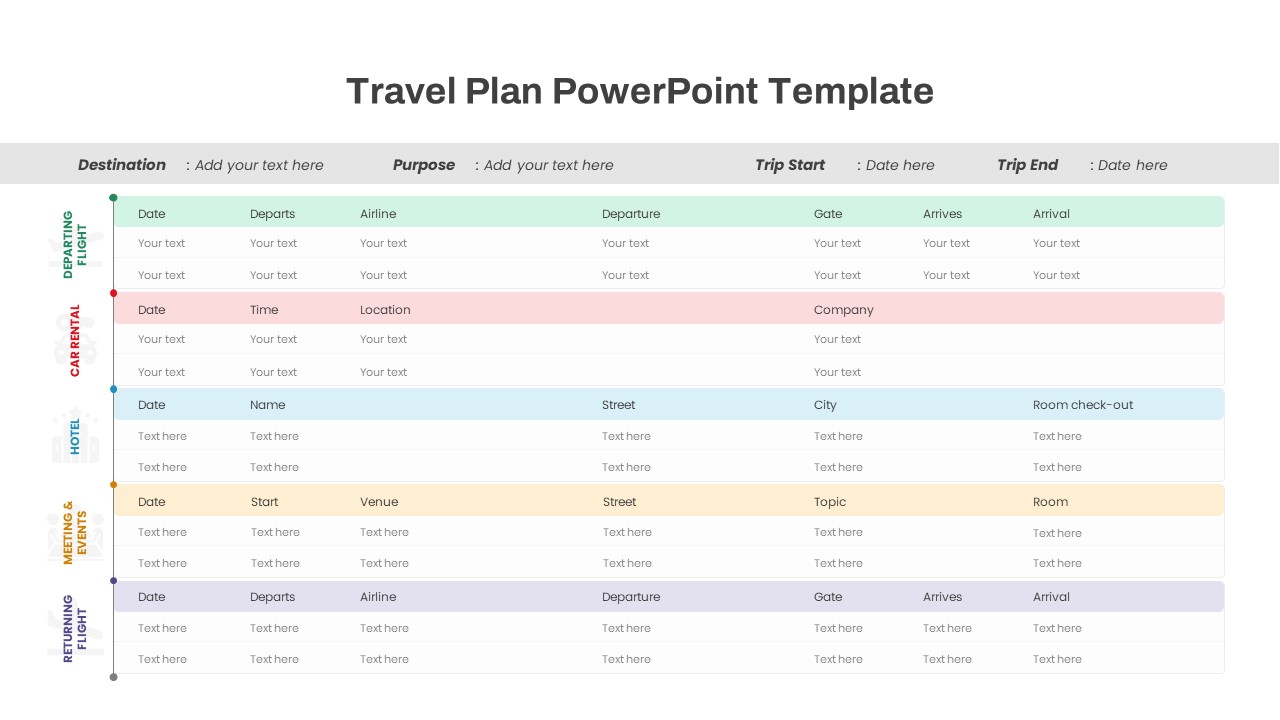
Comprehensive Travel Itinerary Slide Template for PowerPoint & Google Slides
Agenda
Comprehensive Nature Presentation Template for PowerPoint & Google Slides
Pitch Deck
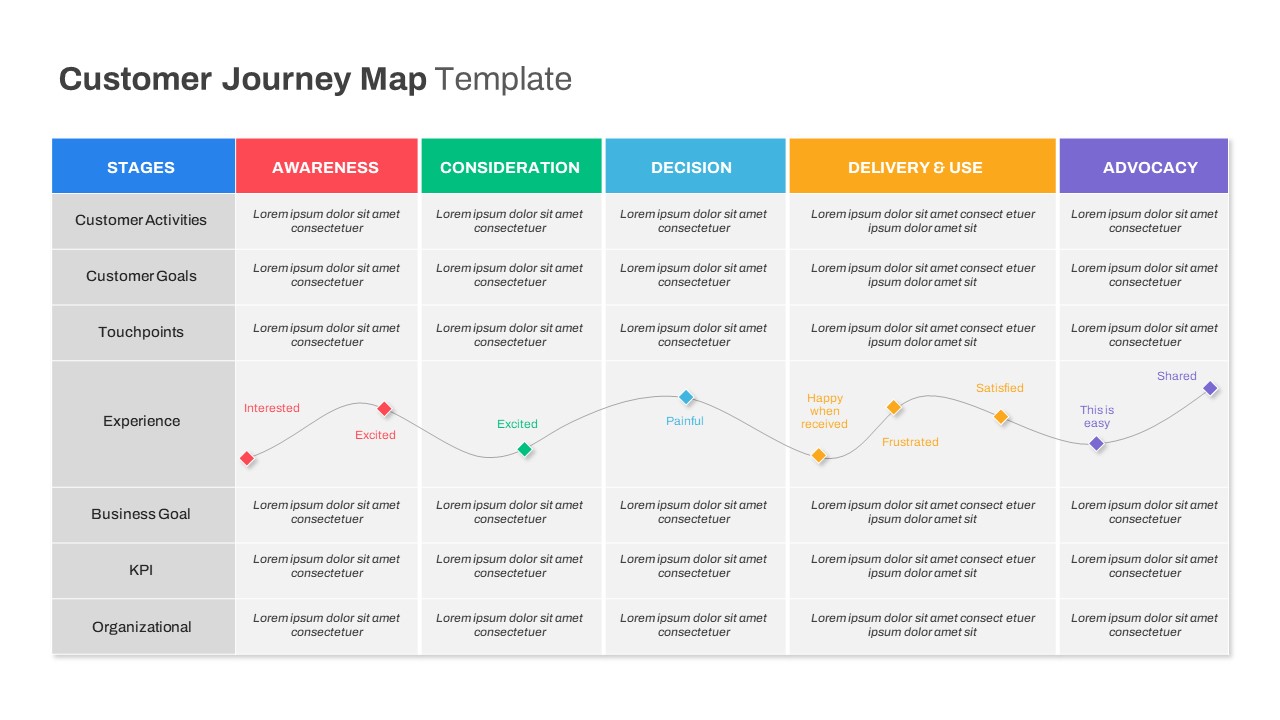
Comprehensive Customer Journey Map Template for PowerPoint & Google Slides
Customer Journey
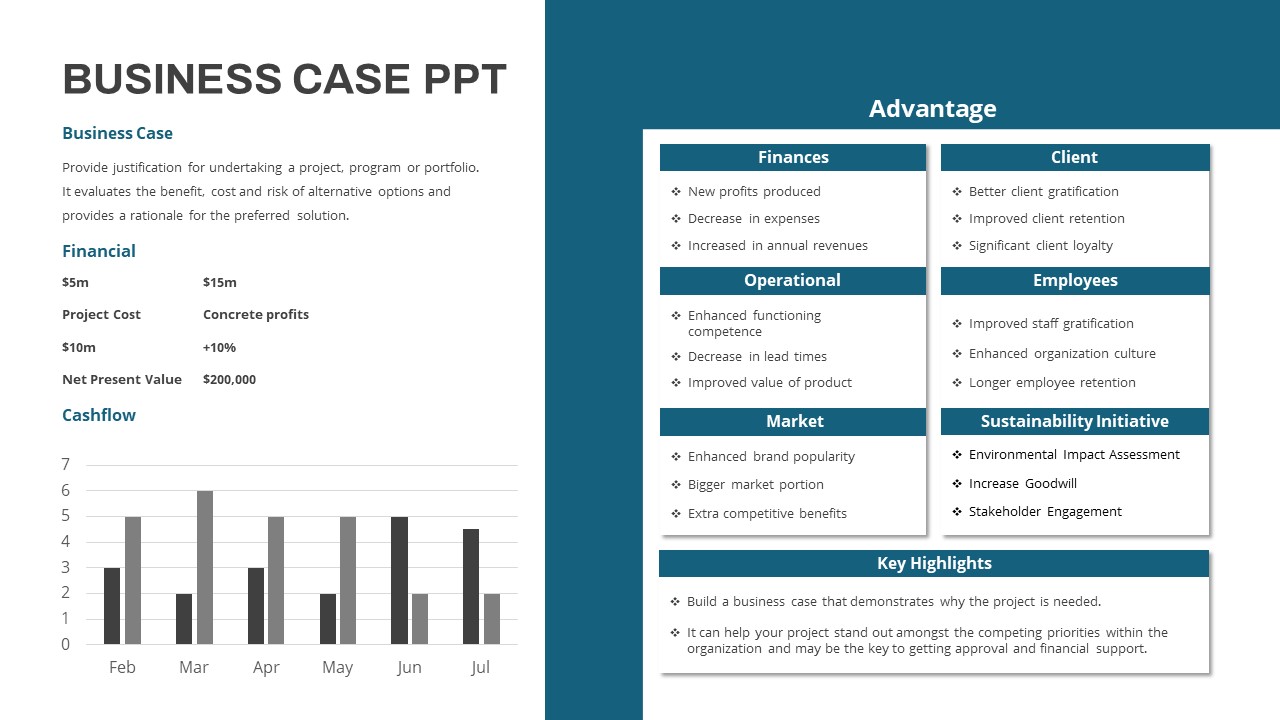
Comprehensive Business Case Presentation Template for PowerPoint & Google Slides
Pie/Donut
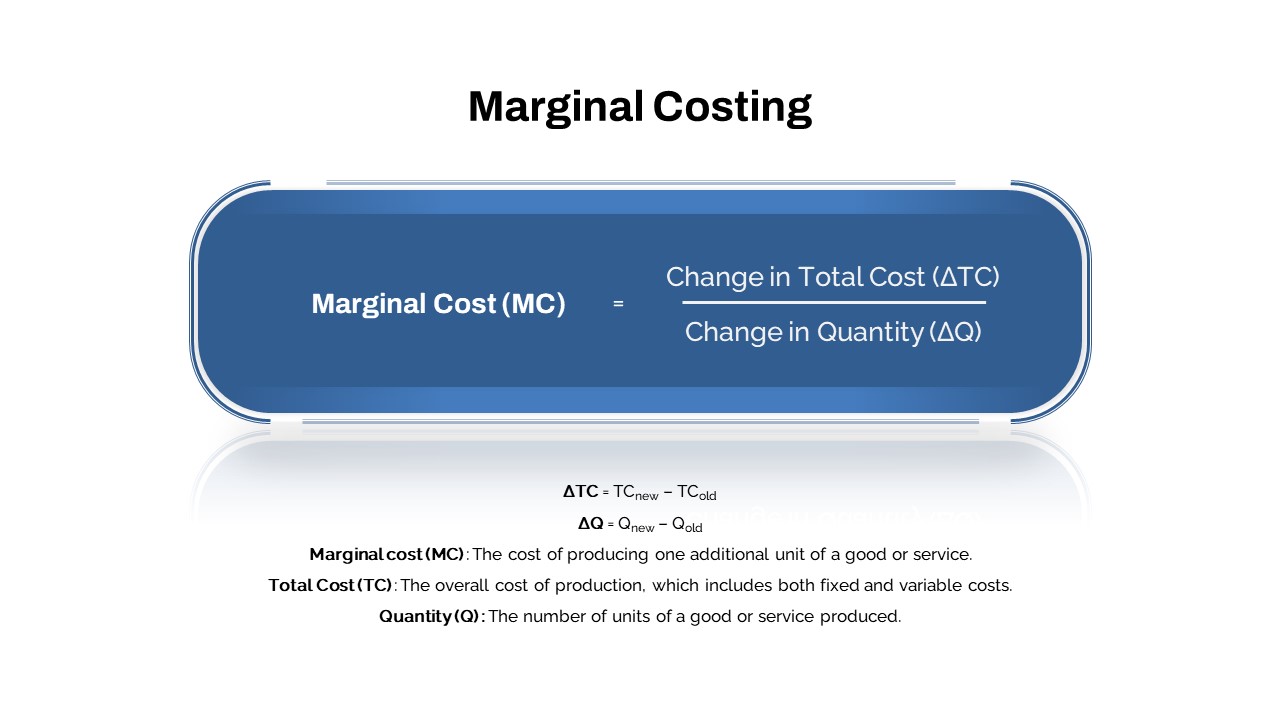
Comprehensive Marginal Costing Formula Template for PowerPoint & Google Slides
Process
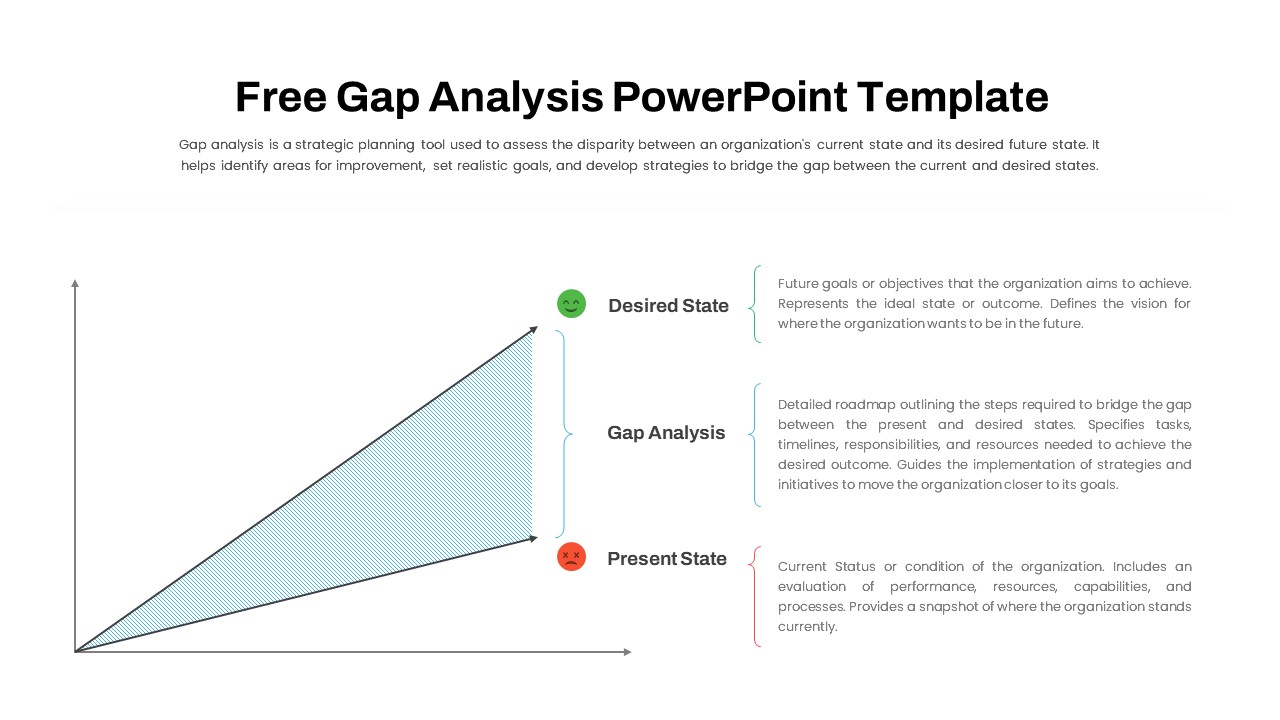
Free Comprehensive Gap Analysis Framework Template for PowerPoint & Google Slides
Opportunities Challenges
Free
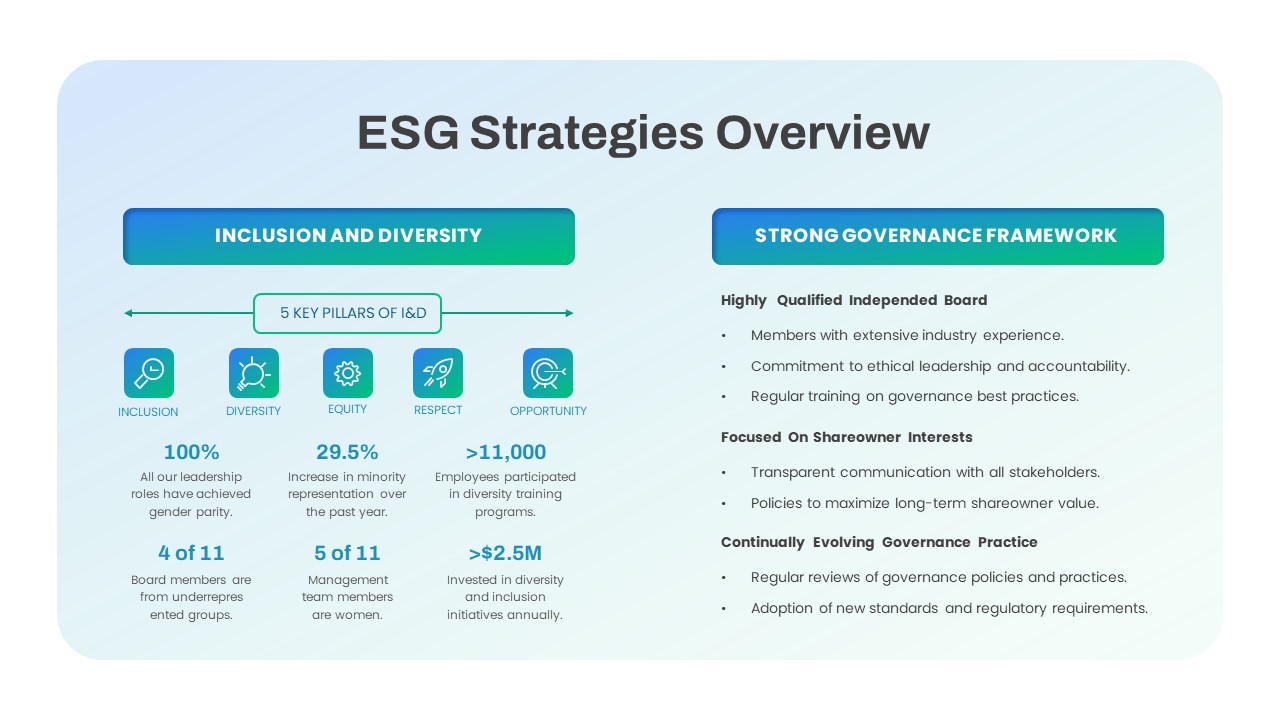
Comprehensive ESG Strategies Overview Template for PowerPoint & Google Slides
Infographics
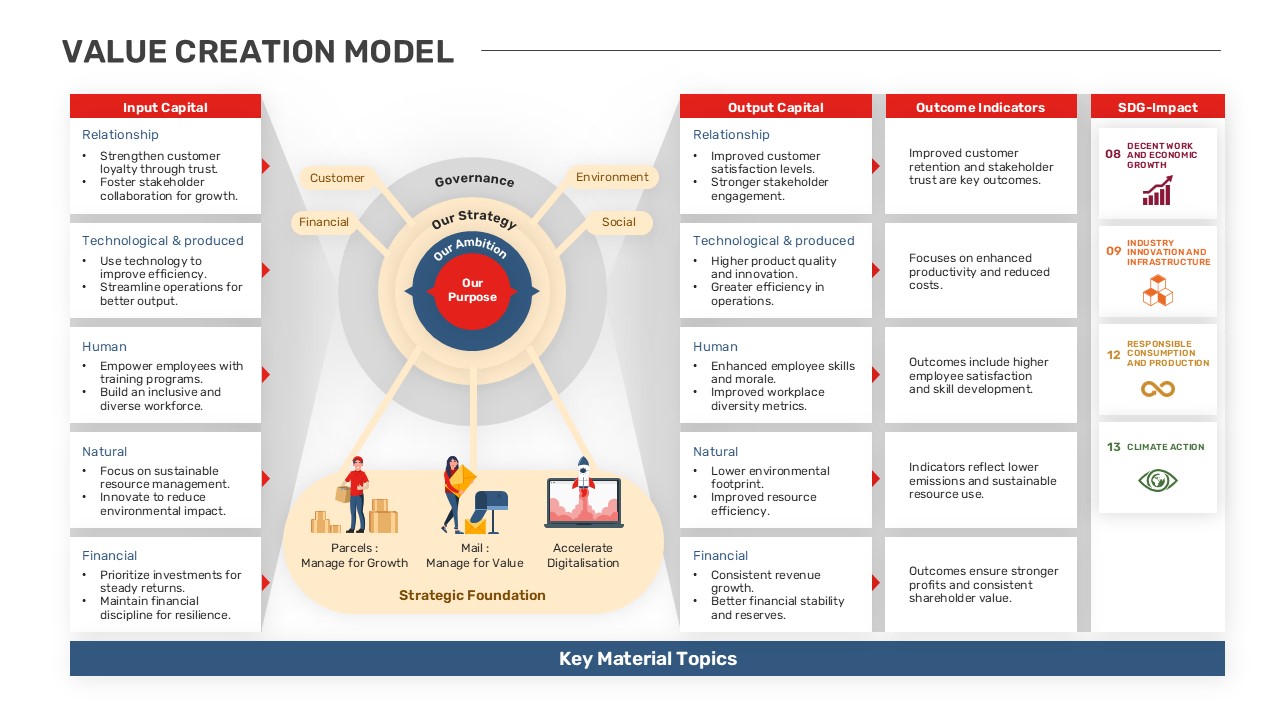
Comprehensive Value Creation Model Template for PowerPoint & Google Slides
Business Models
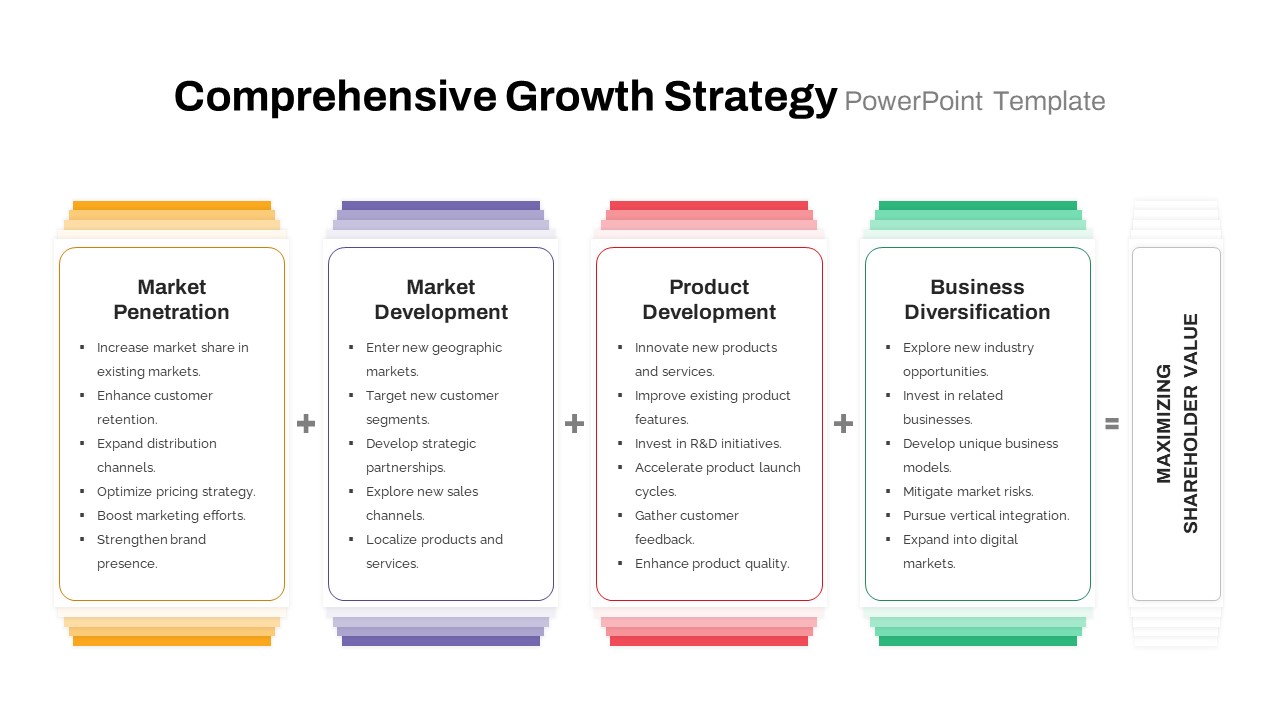
Comprehensive Growth Strategy Cards Template for PowerPoint & Google Slides
Infographics
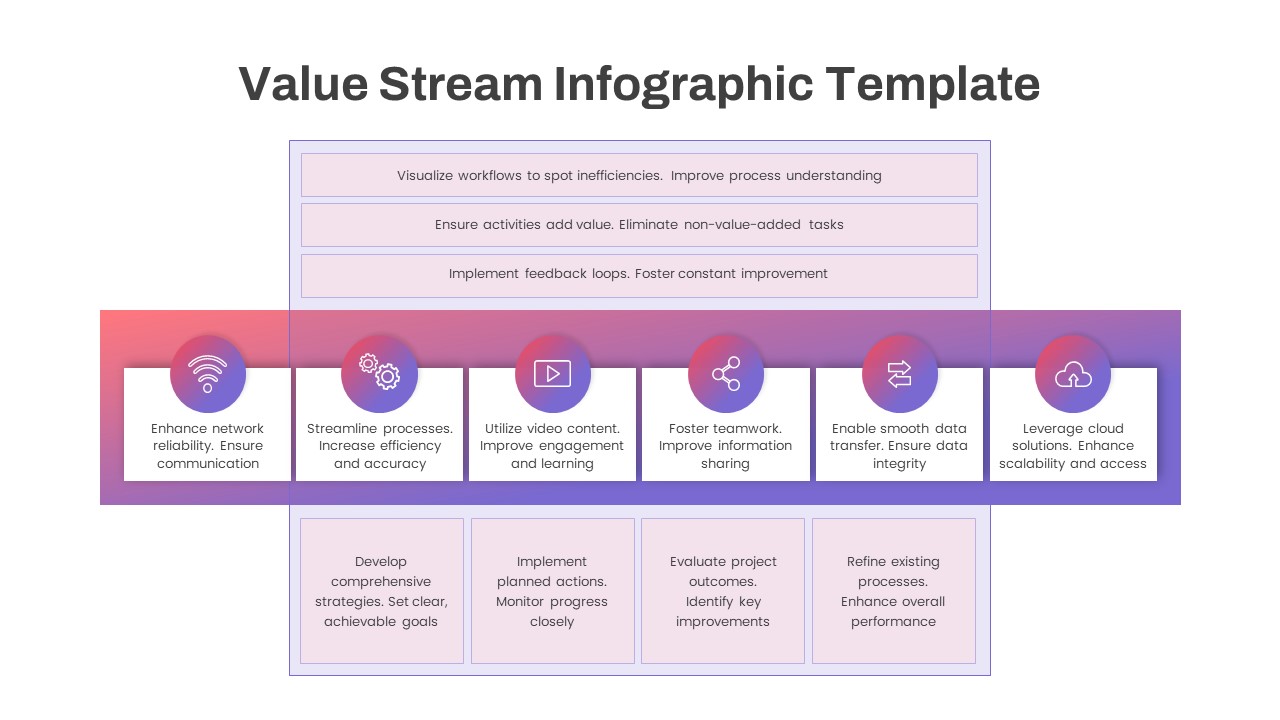
Comprehensive Value Stream Infographic Template for PowerPoint & Google Slides
Process
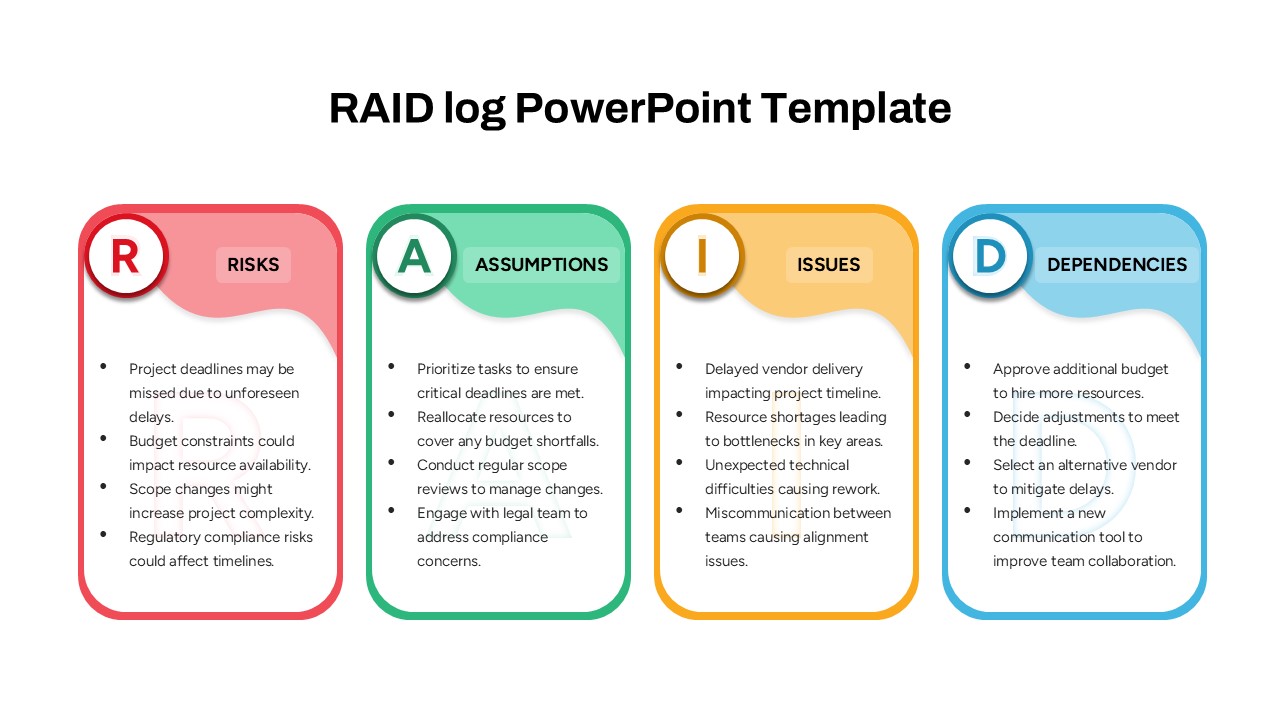
Comprehensive RAID Log Slide Pack Template for PowerPoint & Google Slides
Project
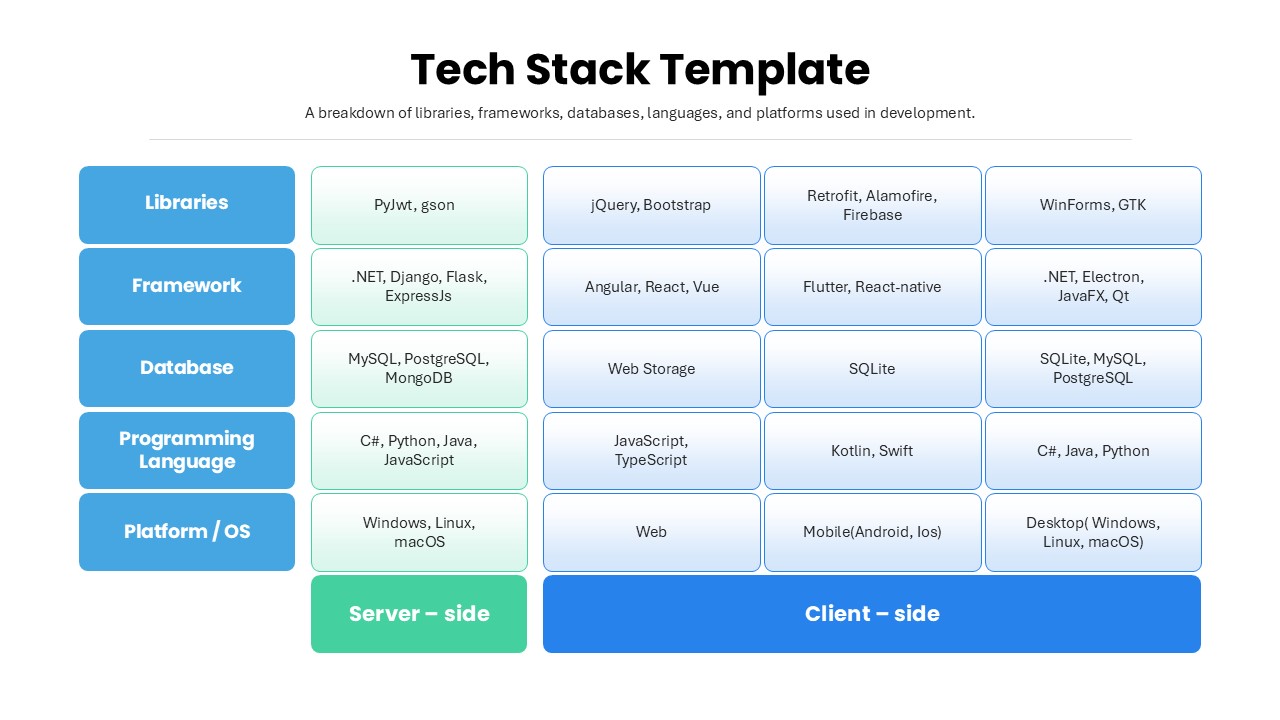
Comprehensive Tech Stack Breakdown Slide Template for PowerPoint & Google Slides
Software Development
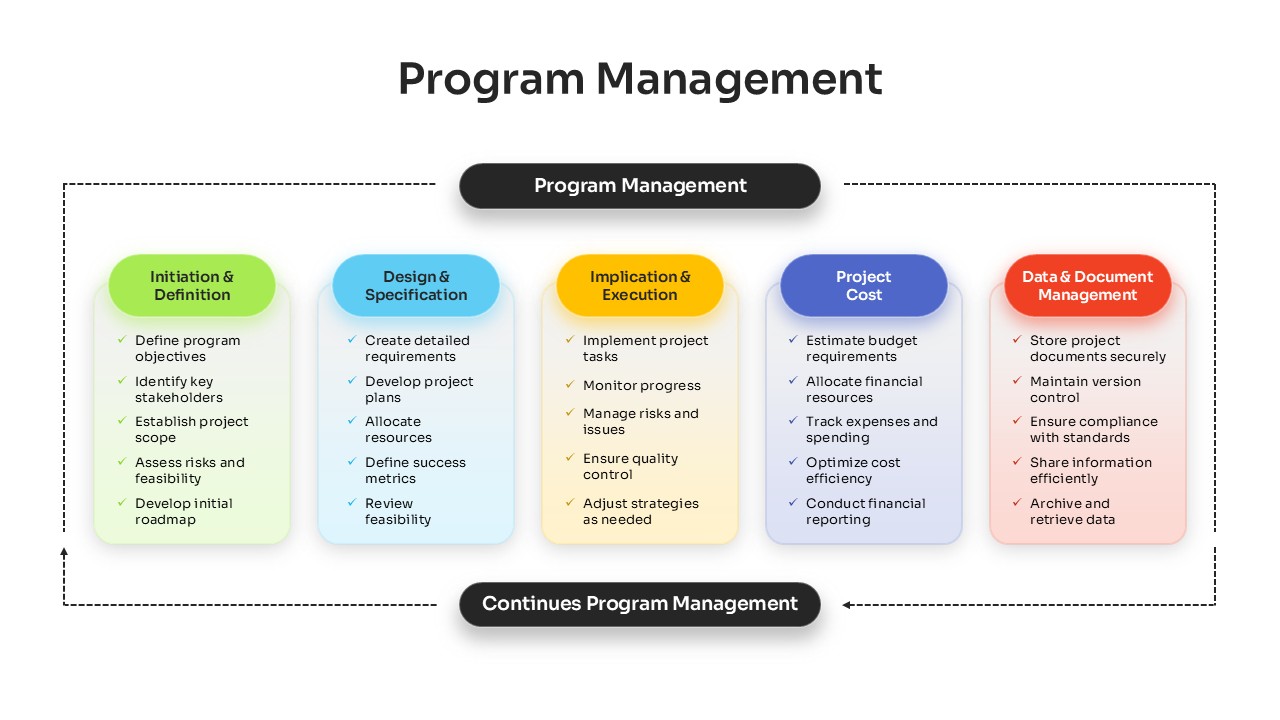
Comprehensive Program Management Process Template for PowerPoint & Google Slides
Process
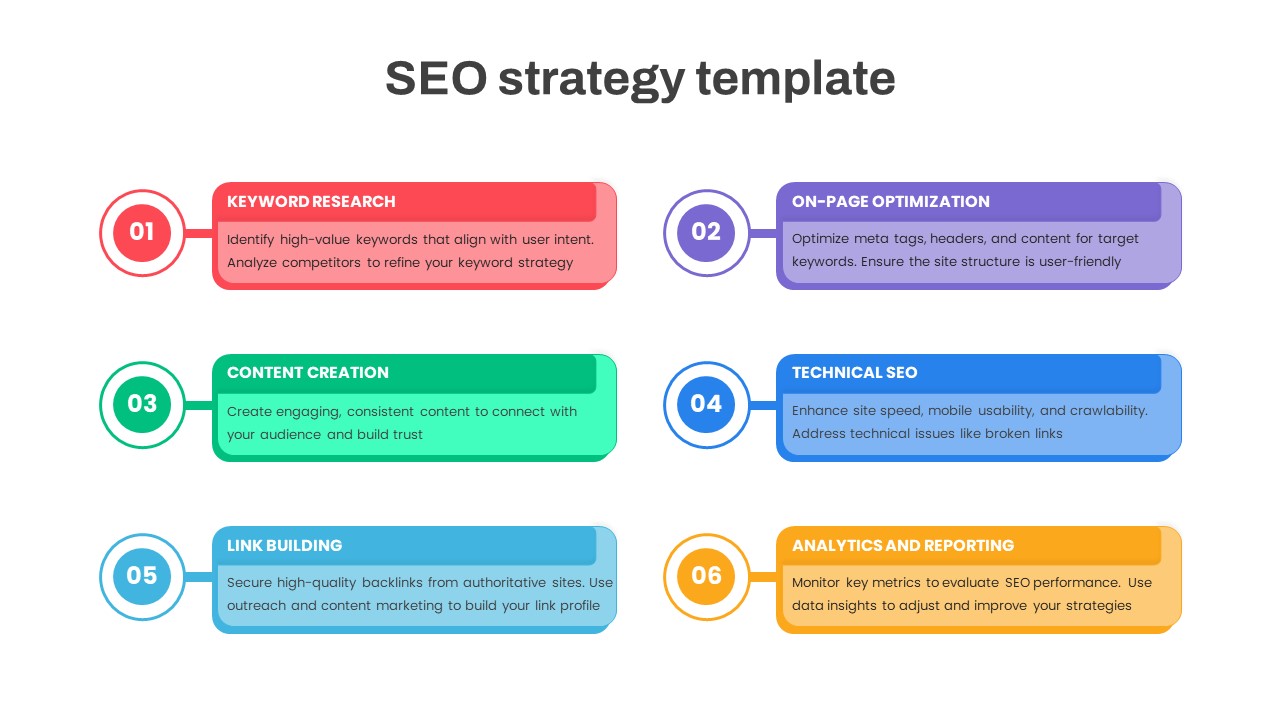
Comprehensive SEO Strategy Roadmap Template for PowerPoint & Google Slides
Digital Marketing
Comprehensive Data & AI Capability Model Template for PowerPoint & Google Slides
AI
Comprehensive Action Tracker Table Template for PowerPoint & Google Slides
Business
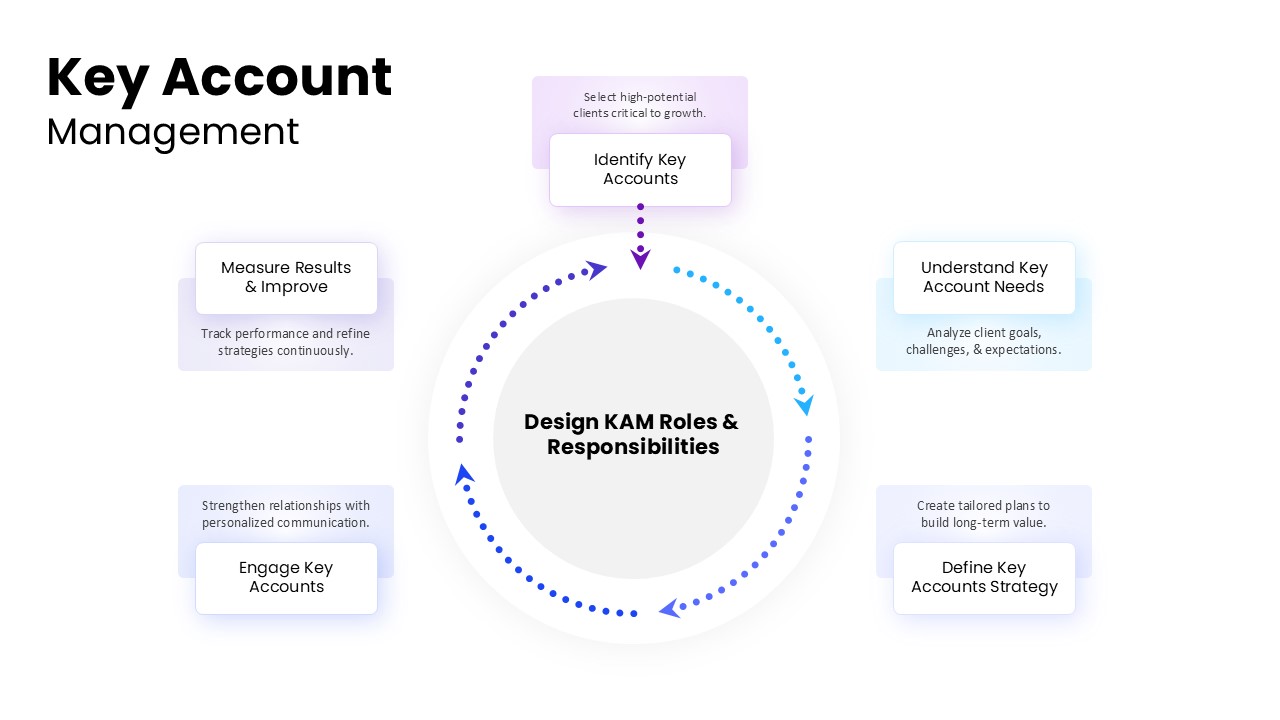
Comprehensive Key Account Management Template for PowerPoint & Google Slides
Process
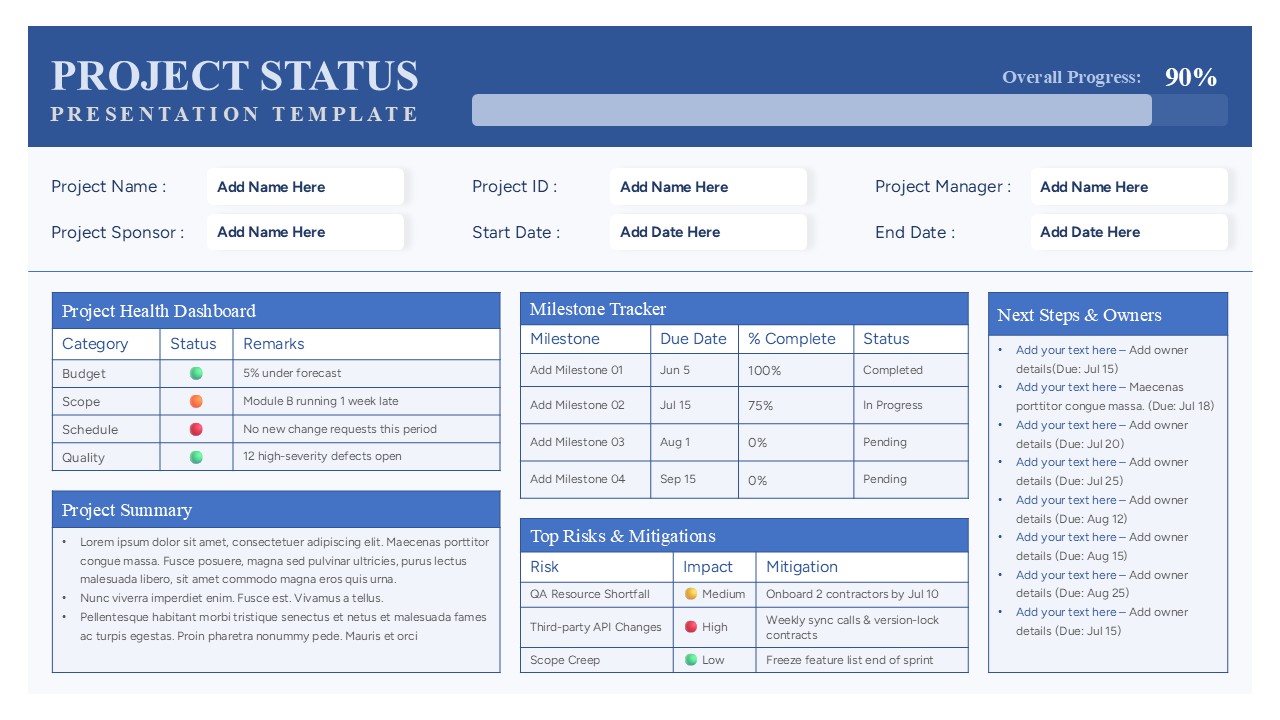
Comprehensive Project Status Report Template for PowerPoint & Google Slides
Project Status
Free KPI Dashboard PowerPoint Template for PowerPoint & Google Slides
Charts
Free
Asia Map with KPI Metrics and Legend Template for PowerPoint & Google Slides
World Maps

Efficiency KPI Dashboard Metaphor Template for PowerPoint & Google Slides
Infographics

Application Revenue Line Chart KPI Template for PowerPoint & Google Slides
Revenue
Sales Growth Dashboard: KPI Gauge & Line Template for PowerPoint & Google Slides
Revenue
Performance KPI Dashboard Slide Template for PowerPoint & Google Slides
Business Report
KPI Dashboard template for PowerPoint & Google Slides
Business Report
KPI Dashboard Overview template for PowerPoint & Google Slides
Finance
KPI Dashboard Data Visualization Template for PowerPoint & Google Slides
Bar/Column
KPI Dashboard Data Overview Slide Template for PowerPoint & Google Slides
Bar/Column
Professional Team Collage & KPI Slide Template for PowerPoint & Google Slides
Business
Circular Image Gallery & KPI Metrics Template for PowerPoint & Google Slides
Pie/Donut
Statistics Infographic & KPI Bar Chart Template for PowerPoint & Google Slides
Bar/Column
Monthly Recurring Revenue KPI Bar Chart Template for PowerPoint & Google Slides
Bar/Column
Customer Satisfaction KPI Dashboard Template for PowerPoint & Google Slides
Customer Experience
Free Balanced Scorecard Quadrant KPI Layout Template for PowerPoint & Google Slides
Employee Performance
Free
Michigan County Map with KPI Dashboard Template for PowerPoint & Google Slides
World Maps
DevOps KPI Dashboard Performance Metrics Template for PowerPoint & Google Slides
Software Development
Purchasing KPI Metrics Dashboard Template for PowerPoint & Google Slides
Business Report
Procurement KPI Dashboard & Metrics Template for PowerPoint & Google Slides
Business Report
Three Segment Donut Chart KPI Infographic Template for PowerPoint & Google Slides
Pie/Donut
4DX Scoreboard KPI Gauge Dashboard Template for PowerPoint & Google Slides
Business Strategy
Year in Review KPI Highlights Slide for PowerPoint & Google Slides
Business Report
Patient-Satisfaction KPI Dashboard for PowerPoint & Google Slides
Business
Statement of Comprehensive Income & Income Statement Template for PowerPoint
Business Report