Rainbow Cloud Infographics Diagram Template for PowerPoint & Google Slides

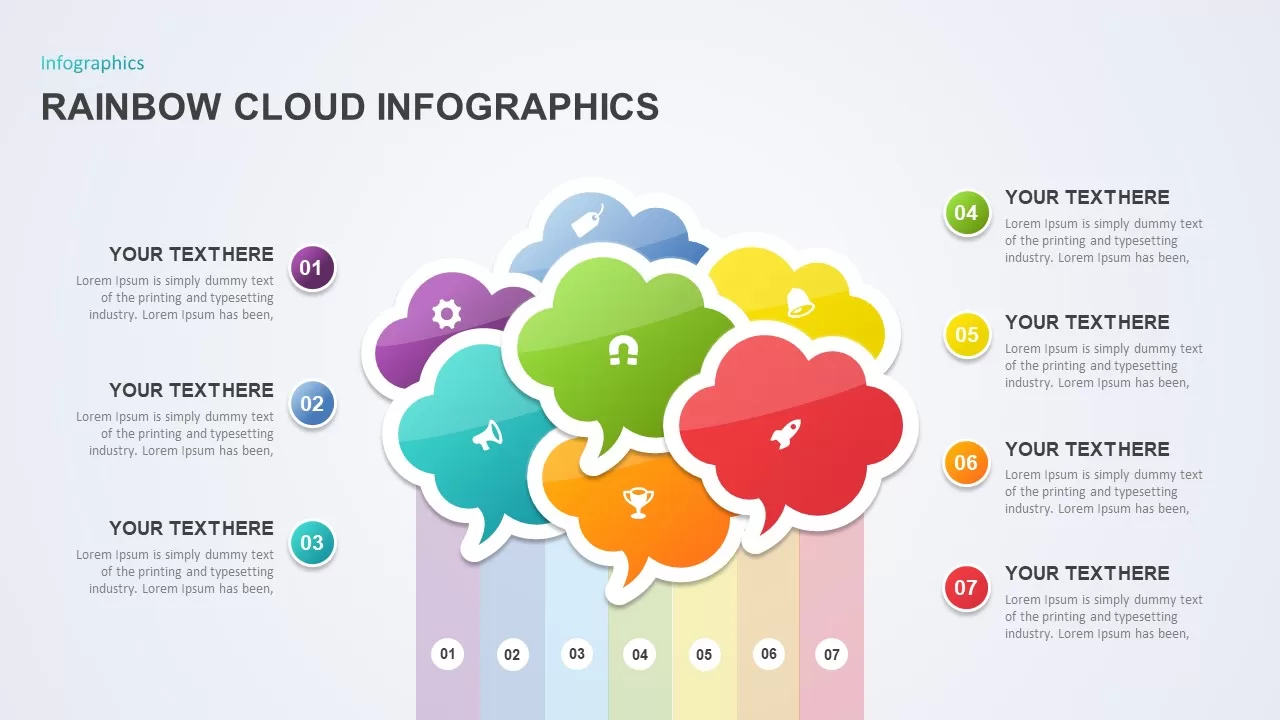

This vibrant rainbow cloud infographic slide features seven colorful cloud-shaped elements, each connected to a corresponding vertical bar and clearly numbered for intuitive sequencing. Each cloud bubble includes a unique icon—gear for settings, megaphone for announcements, tag for labeling, magnet for attraction, trophy for achievement, bell for alerts, and rocket for launch—providing immediate visual cues for different concepts or project phases. The overlapping cloud arrangement creates a dynamic, layered effect, while the dark background maximizes contrast and focus. Built with editable vector shapes and master slide layouts, you can effortlessly adjust hues, swap icons, or edit labels to align with any brand palette or presentation theme.
Optimized for both PowerPoint and Google Slides, this infographic maintains crisp resolution on all devices and platforms. The intuitive master placeholders facilitate rapid text updates, and the organized layer structure ensures components remain fully customizable without losing alignment. Users can duplicate clouds, rearrange order, or resize bars in seconds, streamlining workflow and reducing preparation time. The combination of bold typography, subtle shadows, and bright accent colors enhances engagement, making complex information accessible and memorable.
Ideal for illustrating process flows, categorizing key objectives, or mapping project milestones, this versatile template supports a wide range of presentation needs. Leverage the cloud diagram to break down marketing strategies, visualize product roadmaps, present performance dashboards, or conduct training sessions. Whether used in board meetings, client pitches, or team workshops, this infographic empowers presenters to convey multi-step concepts with clarity and impact.
Extend its utility by customizing icon sets to represent departmental KPIs, objectives, or risk factors. Incorporate this slide into strategic briefings, investor decks, or educational workshops to drive engagement and facilitate collaborative discussions. With its vibrant design and systematic layout, you can communicate multi-faceted ideas, compare categories, or track progress.
Who is it for
Project managers, marketing teams, product developers, and educators who need to present multi-step processes, concept breakdowns, or strategic roadmaps with visual clarity and impact.
Other Uses
Use this cloud infographic to illustrate customer journeys, highlight team achievements, compare feature sets, map out 30-60-90 day plans, or visualize audit results. It also works well in executive summaries, dashboard overviews, and educational modules where sequential or categorical data must be communicated effectively.
Login to download this file

Item ID
SB01841
Related Templates

Colorful Rainbow Slides Template for PowerPoint & Google Slides
Graphics
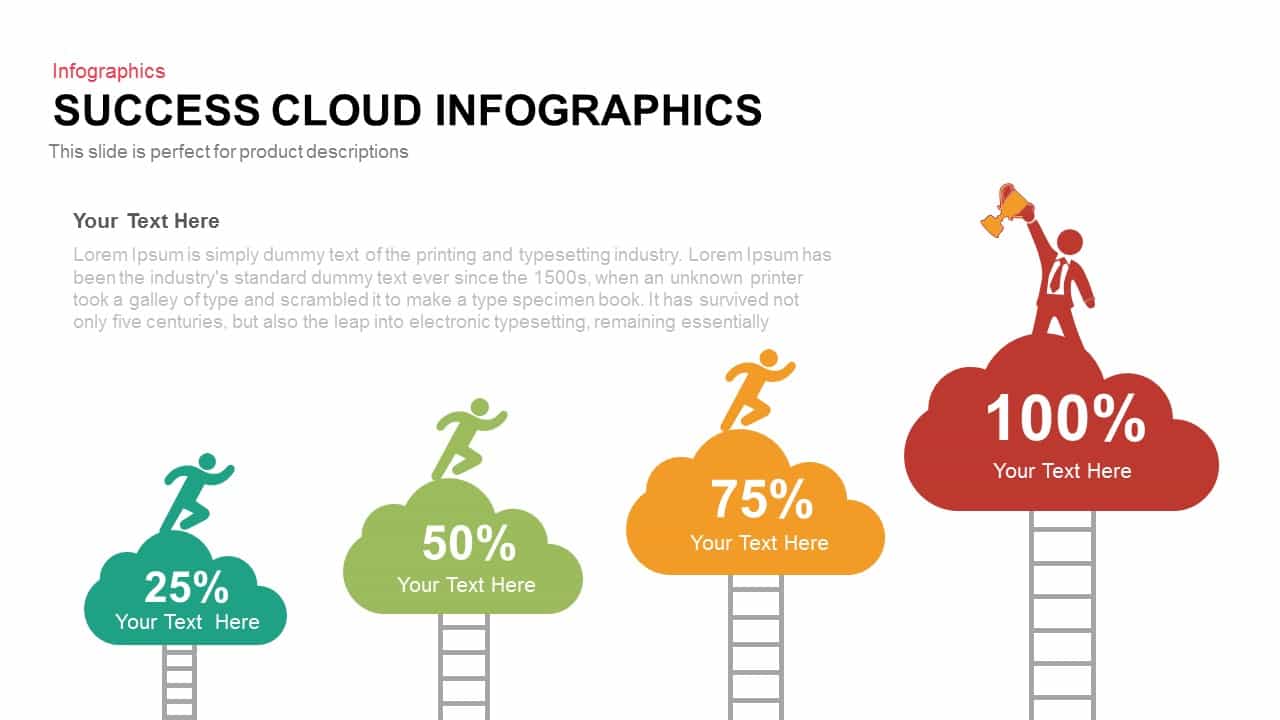
Success Cloud Progress Infographics Template for PowerPoint & Google Slides
Charts
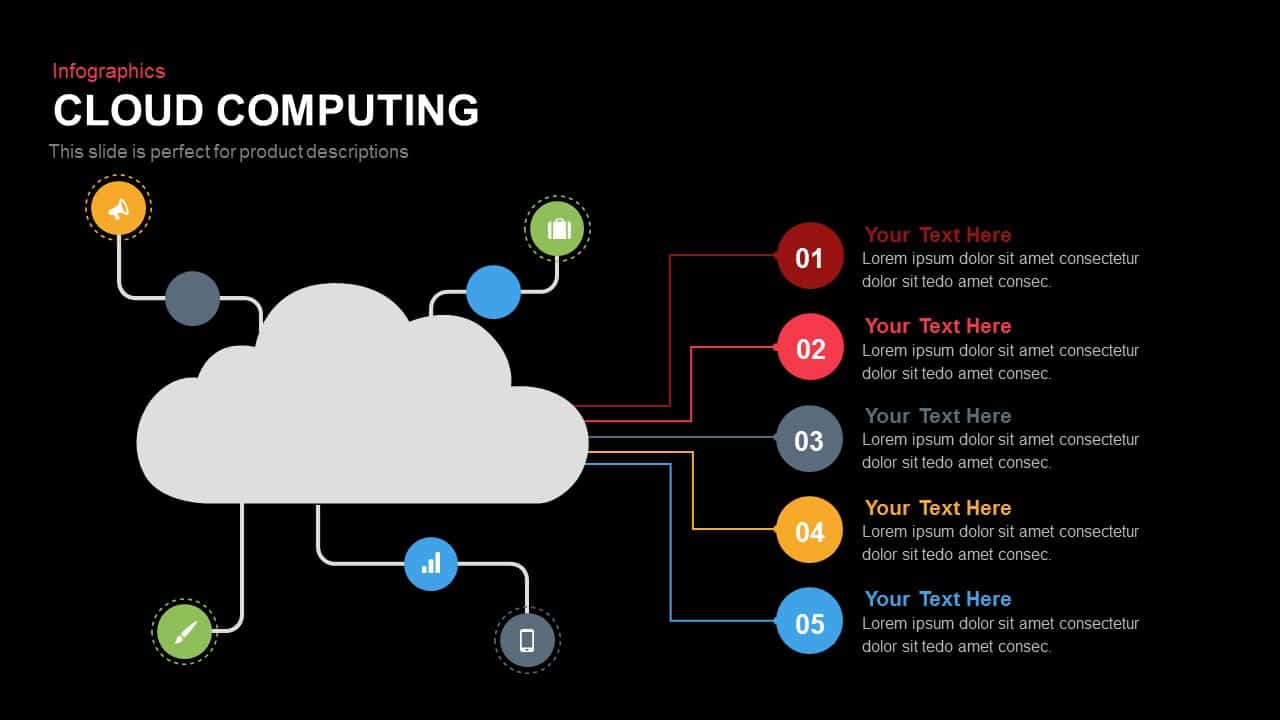
Cloud Computing Infographics template for PowerPoint & Google Slides
Cloud Computing
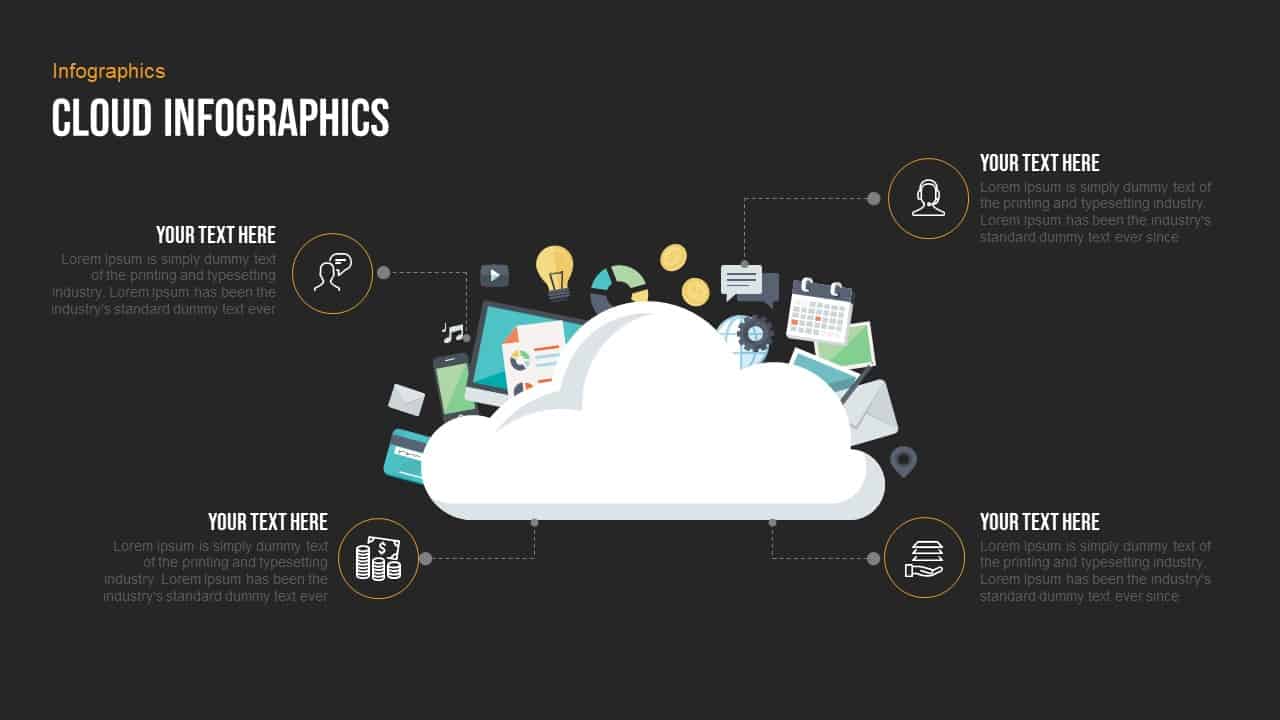
Cloud Computing Infographics template for PowerPoint & Google Slides
Cloud Computing
Free Professional Cloud Infographics Template for PowerPoint & Google Slides
Process
Free
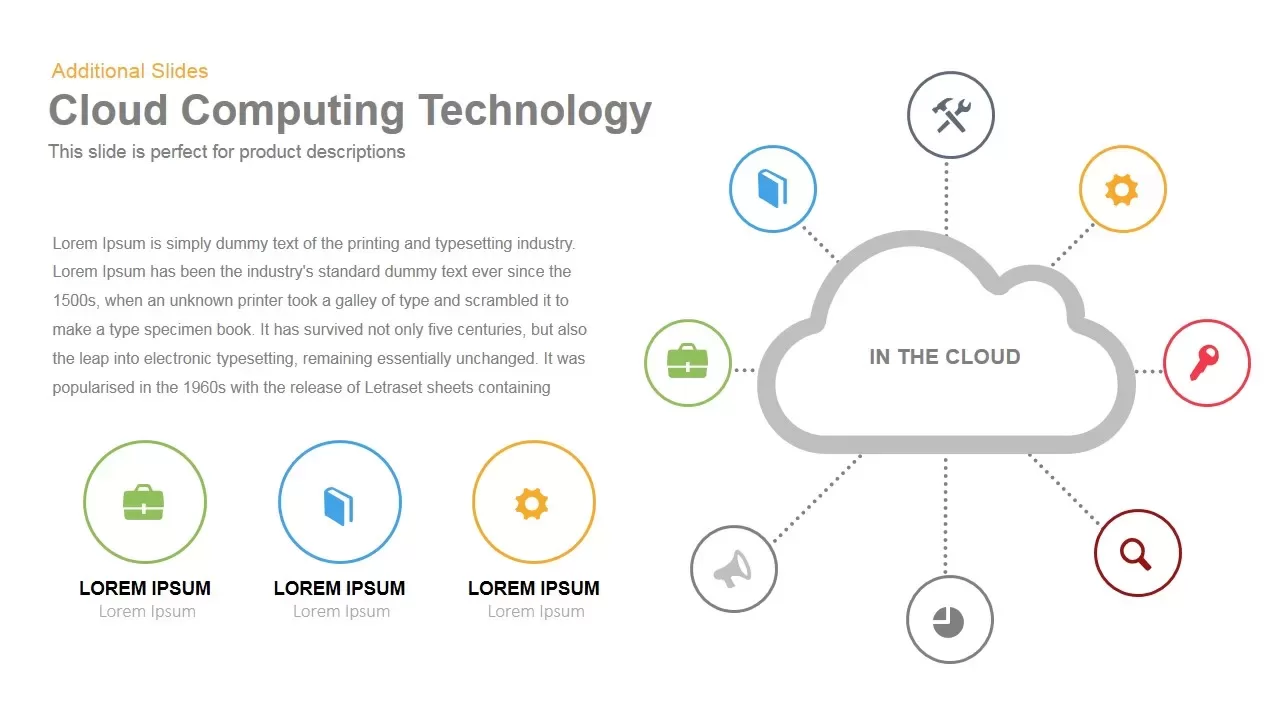
Cloud Computing Diagram template for PowerPoint & Google Slides
Technology

Cloud Computing Hub and Spoke Diagram Template for PowerPoint & Google Slides
Cloud Computing
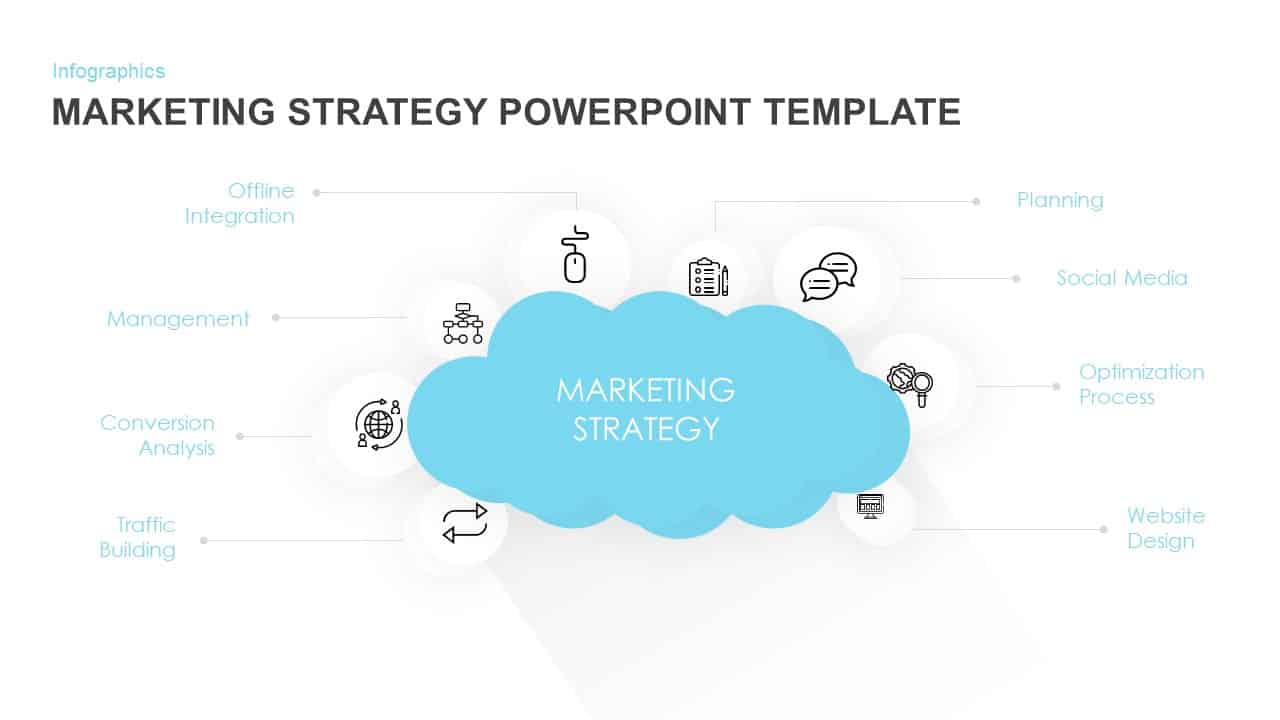
Marketing Strategy Cloud Diagram Template for PowerPoint & Google Slides
Digital Marketing
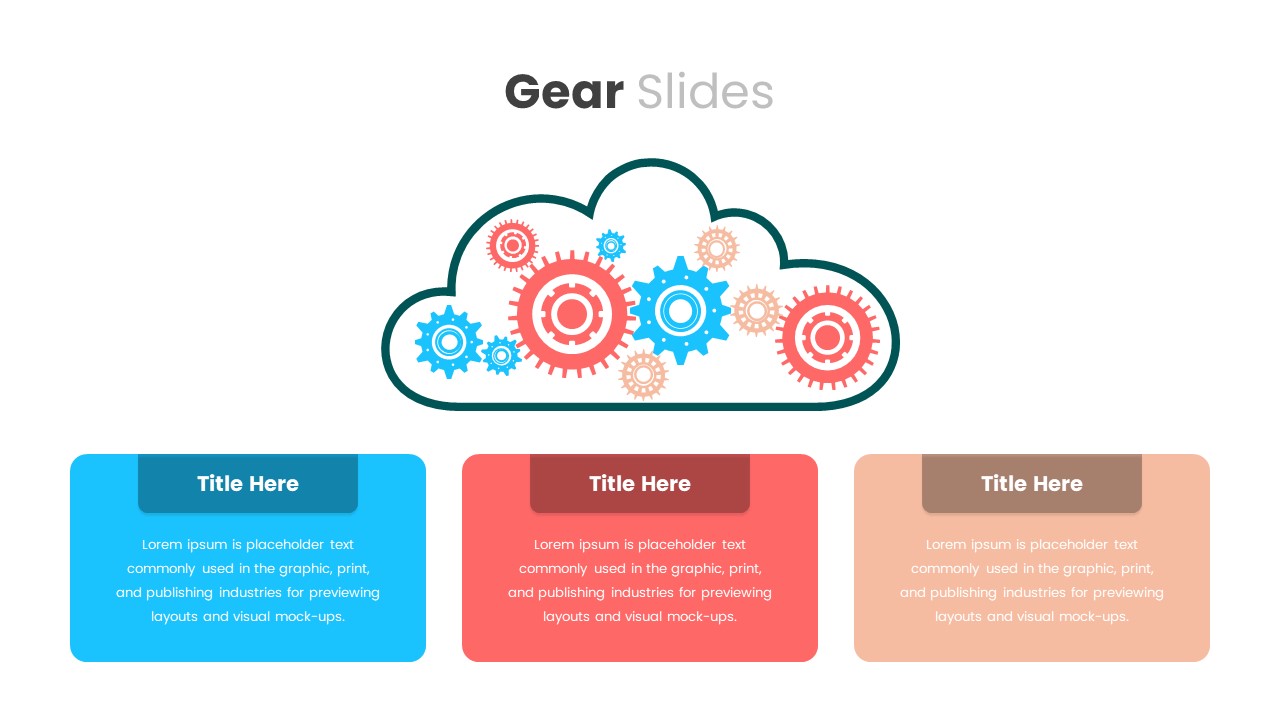
Cloud Gear Automation Diagram Template for PowerPoint & Google Slides
Cloud Computing
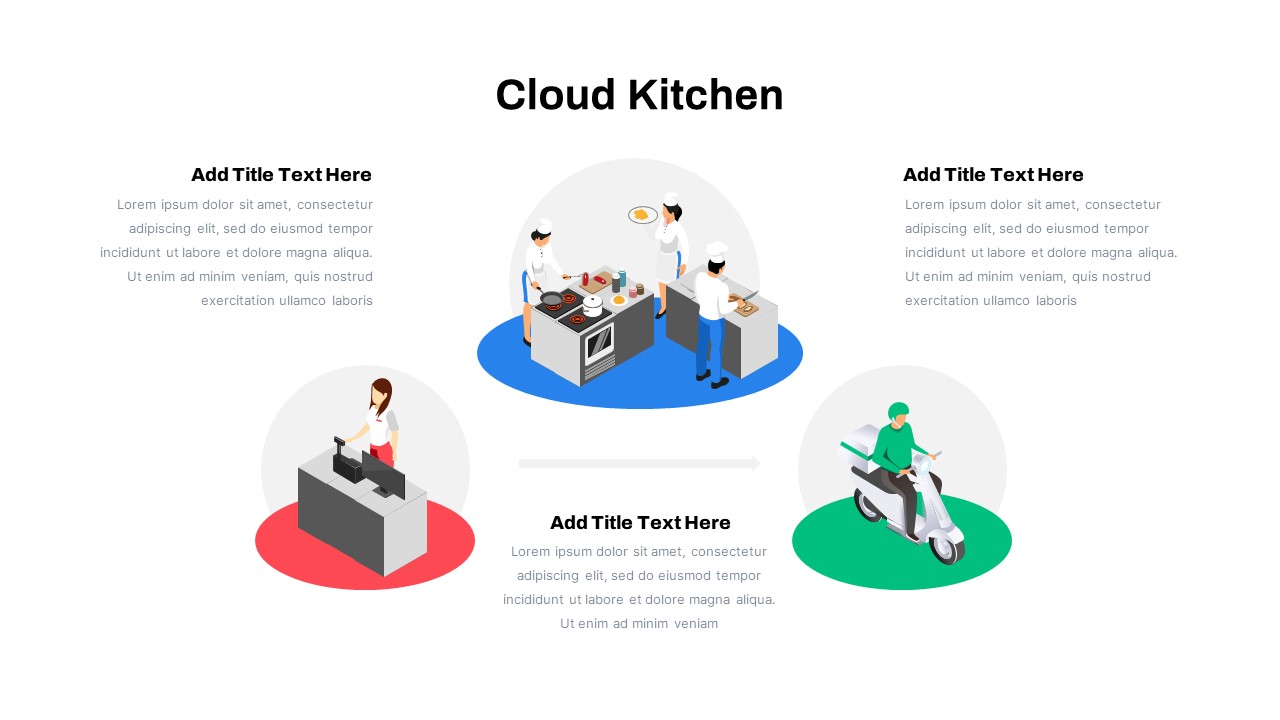
Cloud Kitchen Business Process Diagram Template for PowerPoint & Google Slides
Process
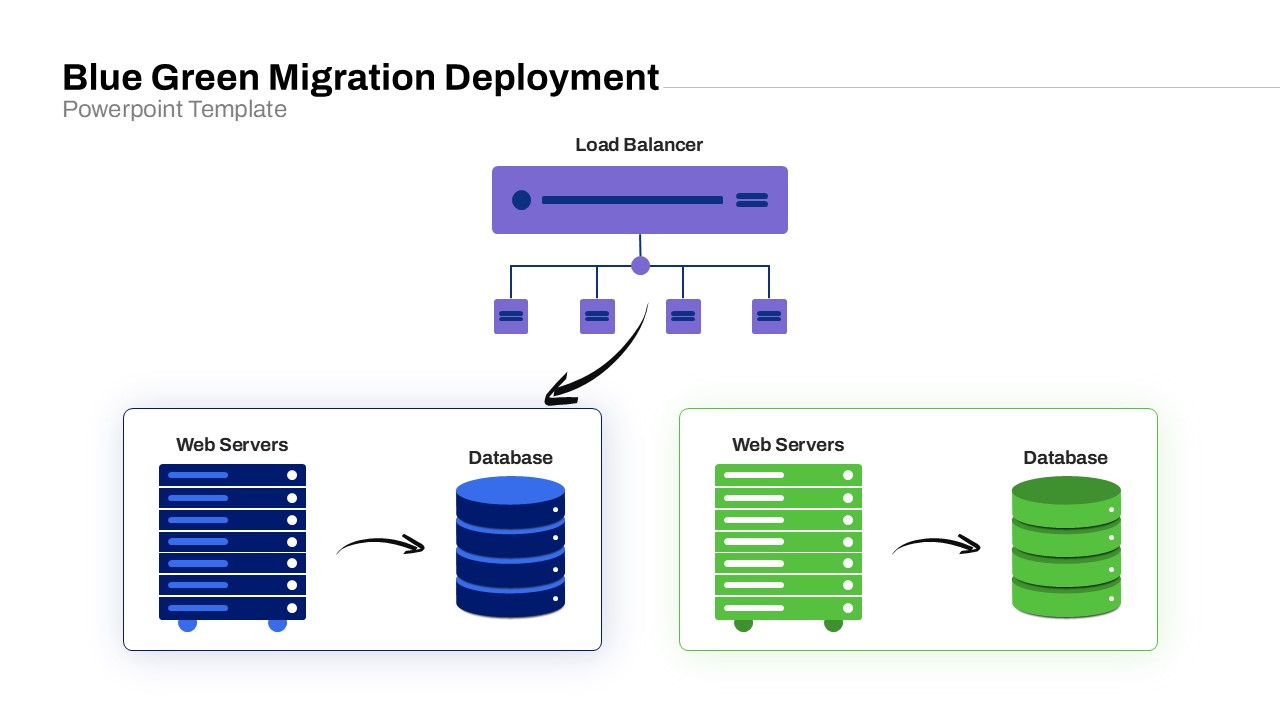
Blue-Green Cloud Deployment Diagram Template for PowerPoint & Google Slides
Cloud Computing
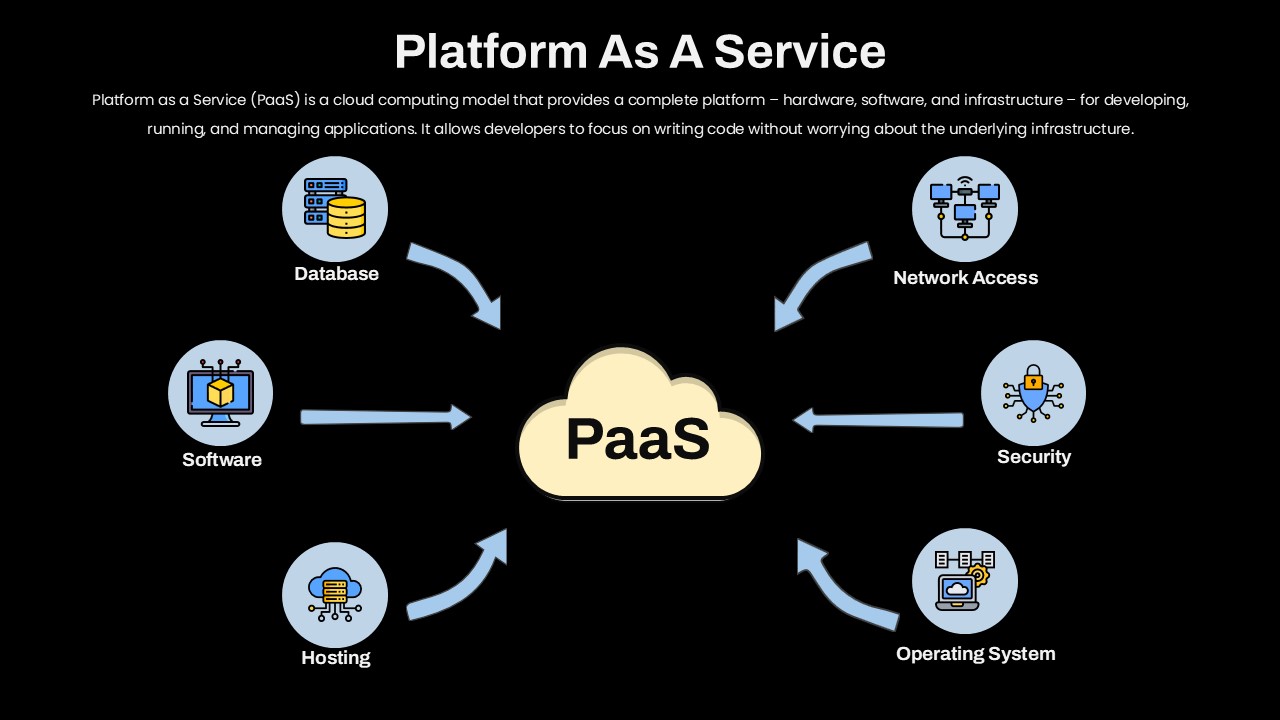
Platform as a Service Cloud Diagram Template for PowerPoint & Google Slides
Cloud Computing
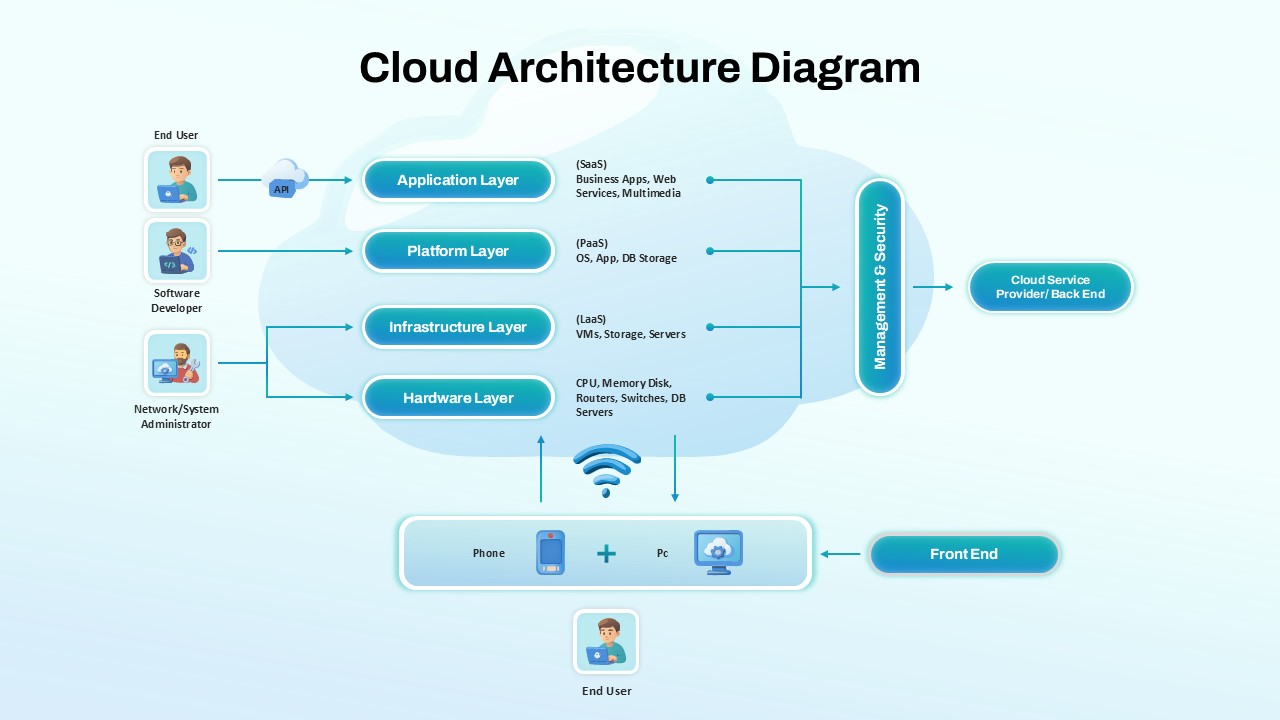
Cloud Architecture Diagram template for PowerPoint & Google Slides
Cloud Computing
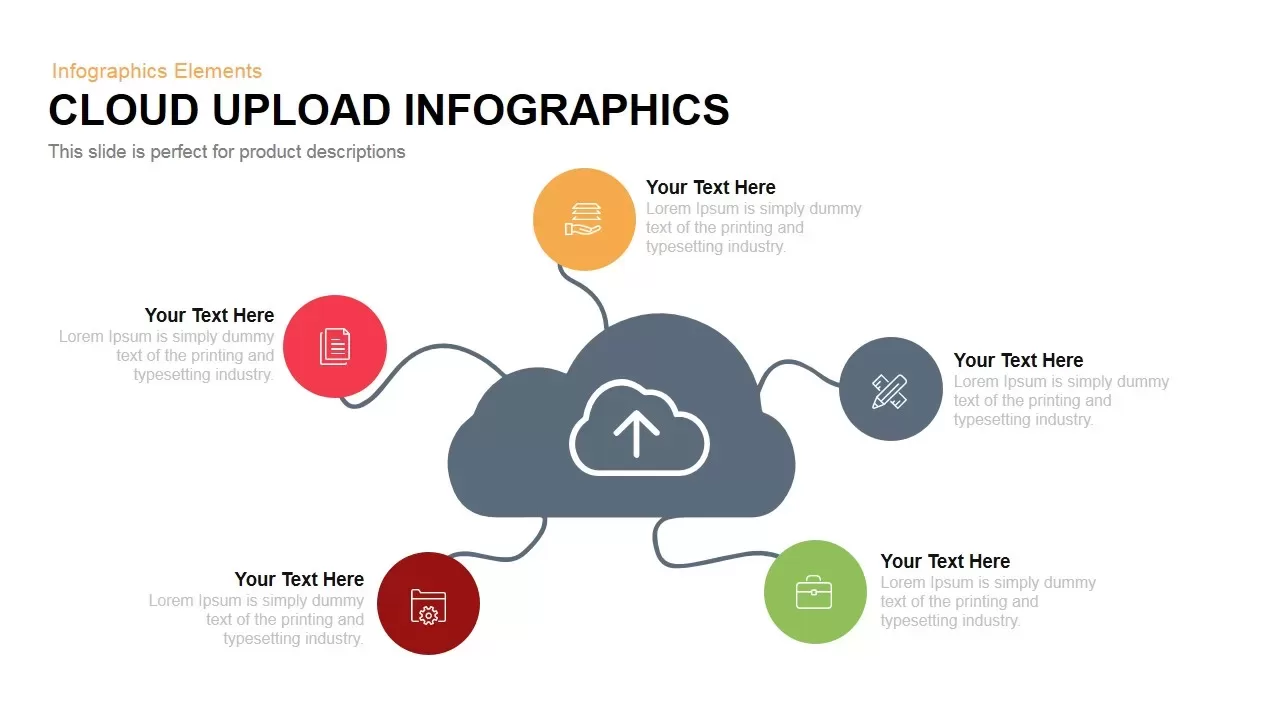
Cloud Upload Hub-and-Spoke Infographic Template for PowerPoint & Google Slides
Circular
Minimalist Cloud Illustration Slide Template for PowerPoint & Google Slides
Infographics
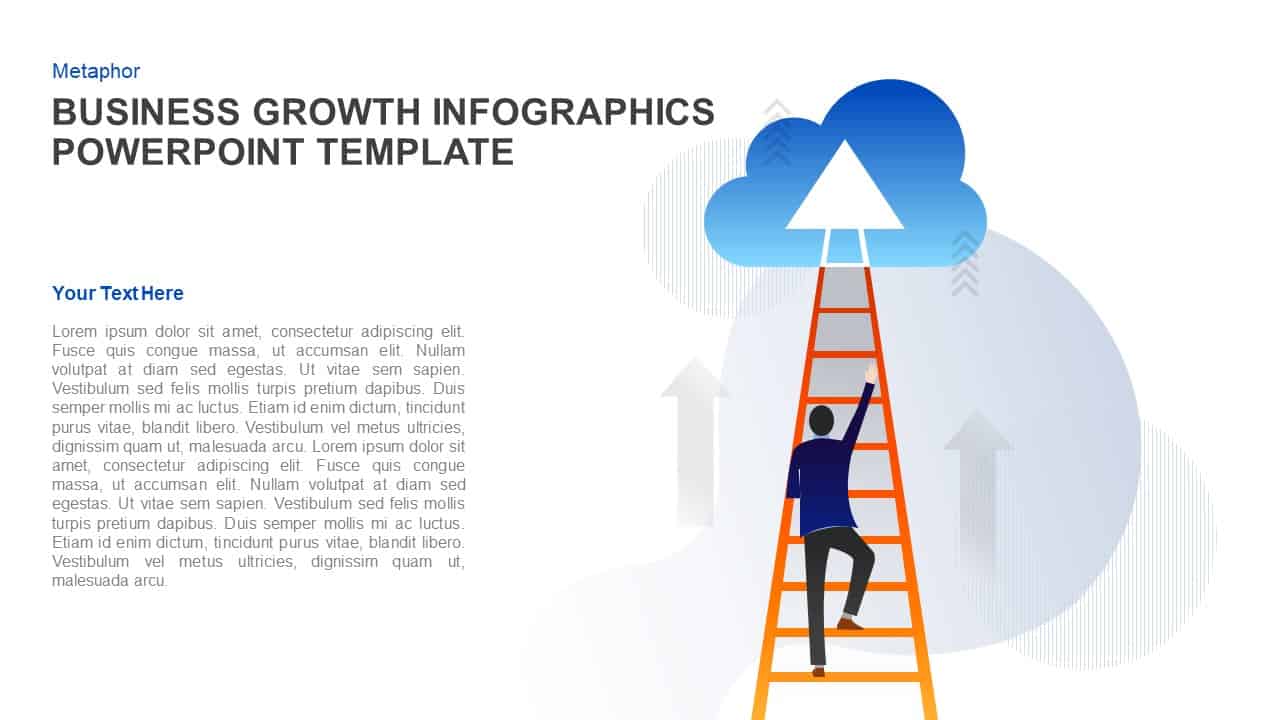
Business Growth Ladder to Cloud Metaphor Template for PowerPoint & Google Slides
Vision and Mission
Gradient Cloud Computing Dark Cover Template for PowerPoint & Google Slides
Pitch Deck
Cloud Revel Sales Presentation Template for PowerPoint & Google Slides
Marketing
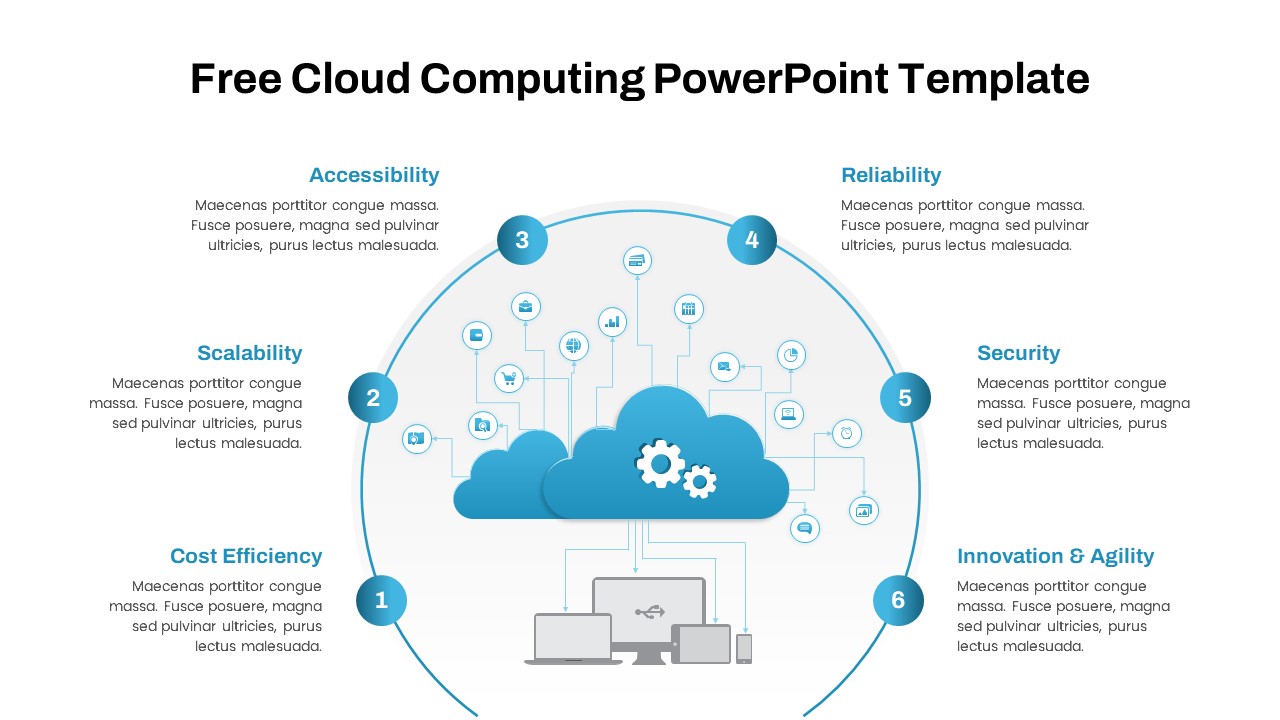
Free Cloud Computing Six-Step Circular Template for PowerPoint & Google Slides
Cloud Computing
Free
Strategy Word Cloud Infographic Template for PowerPoint & Google Slides
Infographics
Free
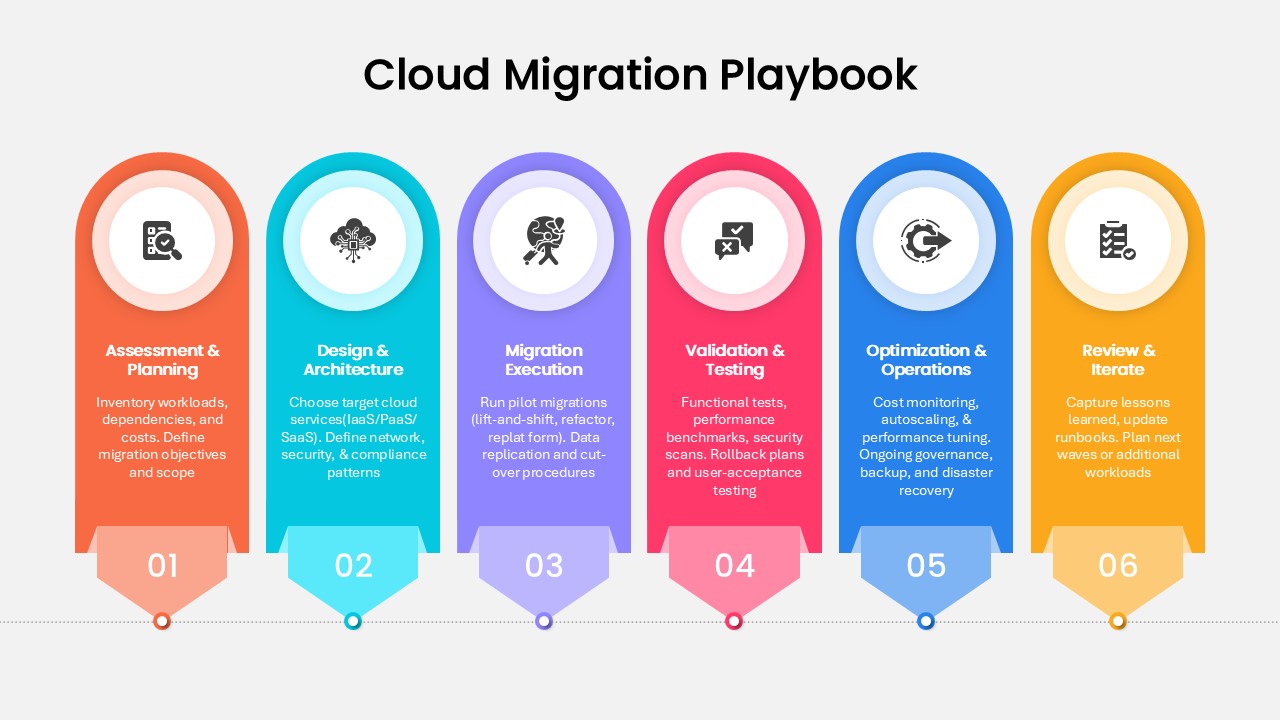
Step-by-Step Cloud Migration Playbook Template for PowerPoint & Google Slides
Cloud Computing
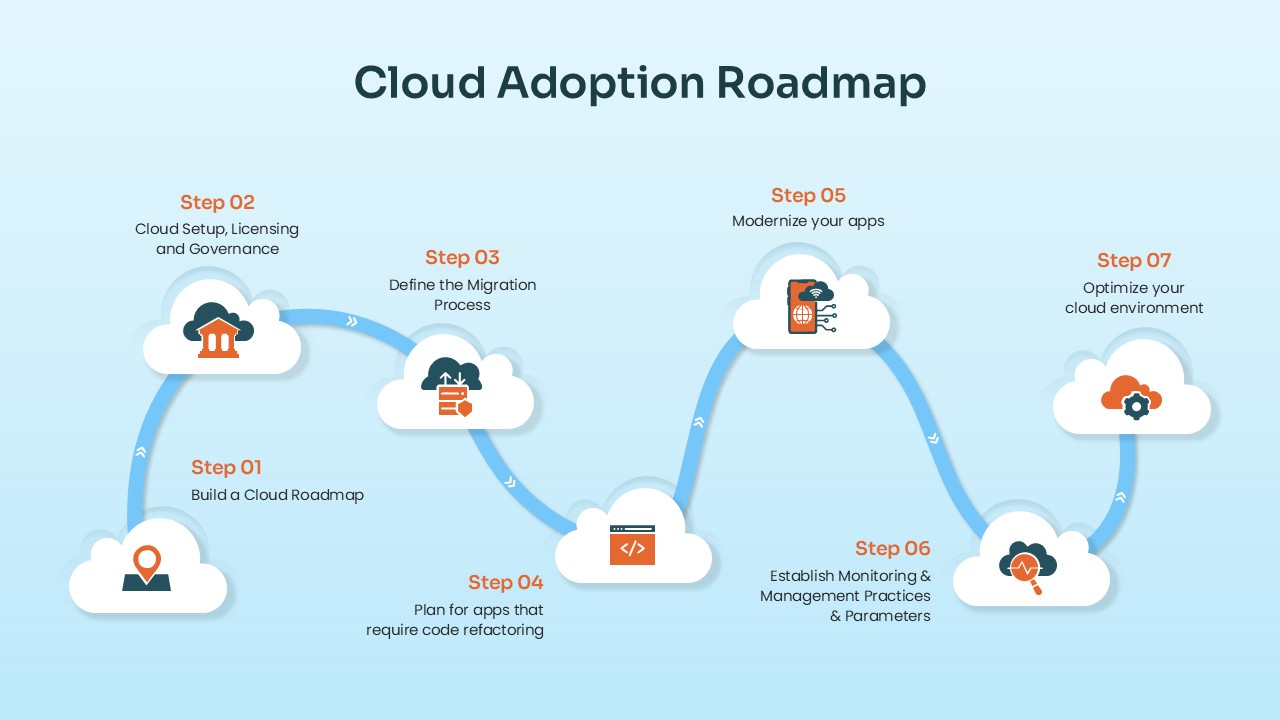
Cloud Adoption Roadmap Steps template for PowerPoint & Google Slides
Cloud Computing
Data Protection & Encryption in the Cloud Overview template for PowerPoint & Google Slides
Cloud Computing
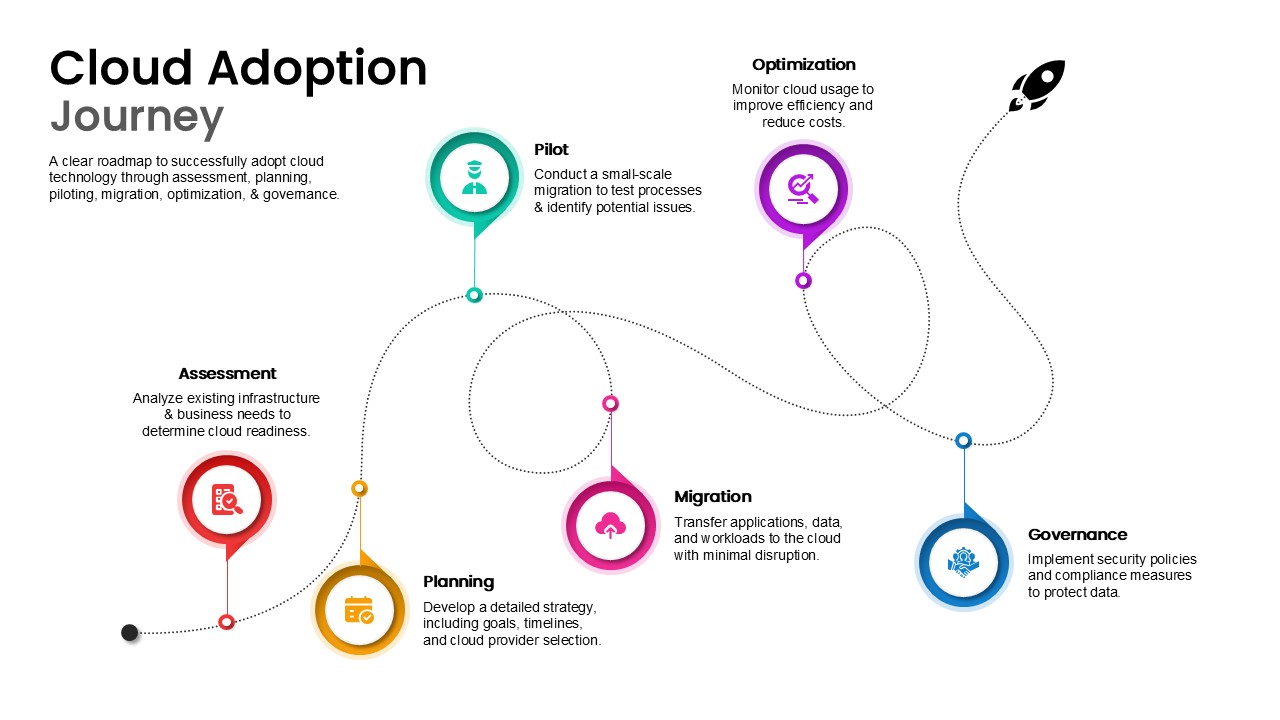
Cloud Adoption Journey Roadmap Template for PowerPoint & Google Slides
Cloud Computing
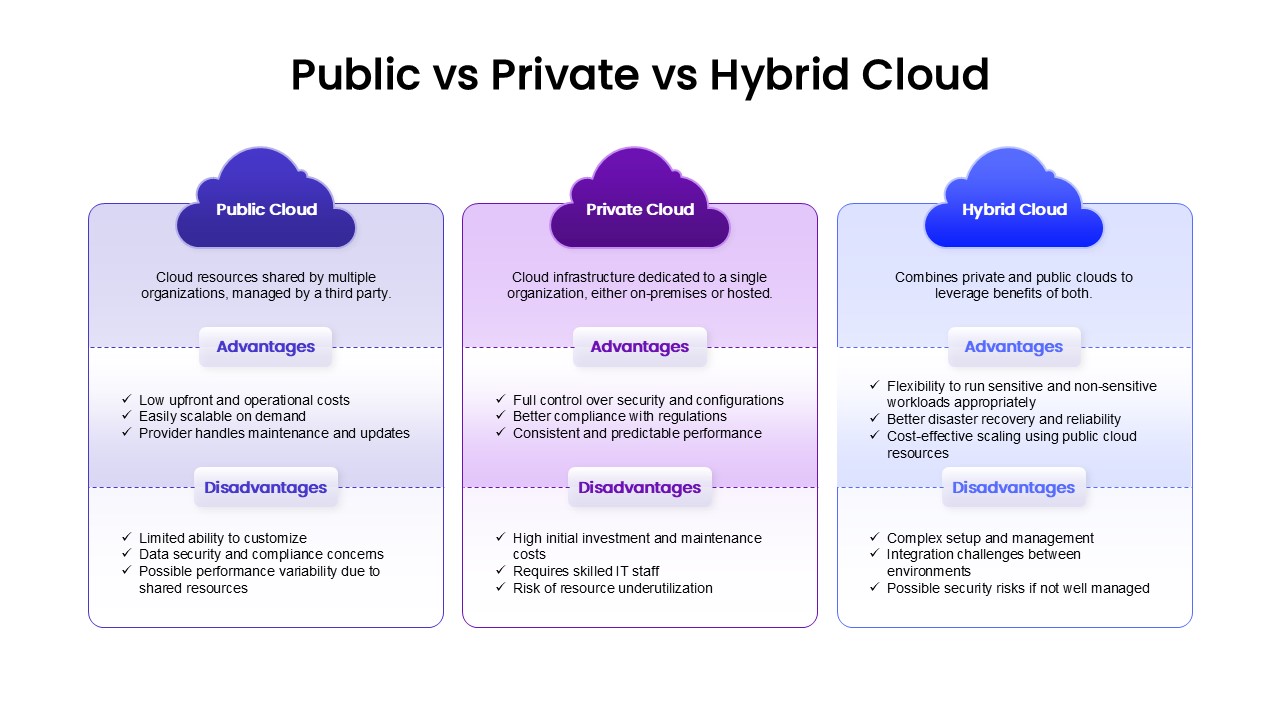
Public, Private & Hybrid Cloud Comparison Template for PowerPoint & Google Slides
Cloud Computing
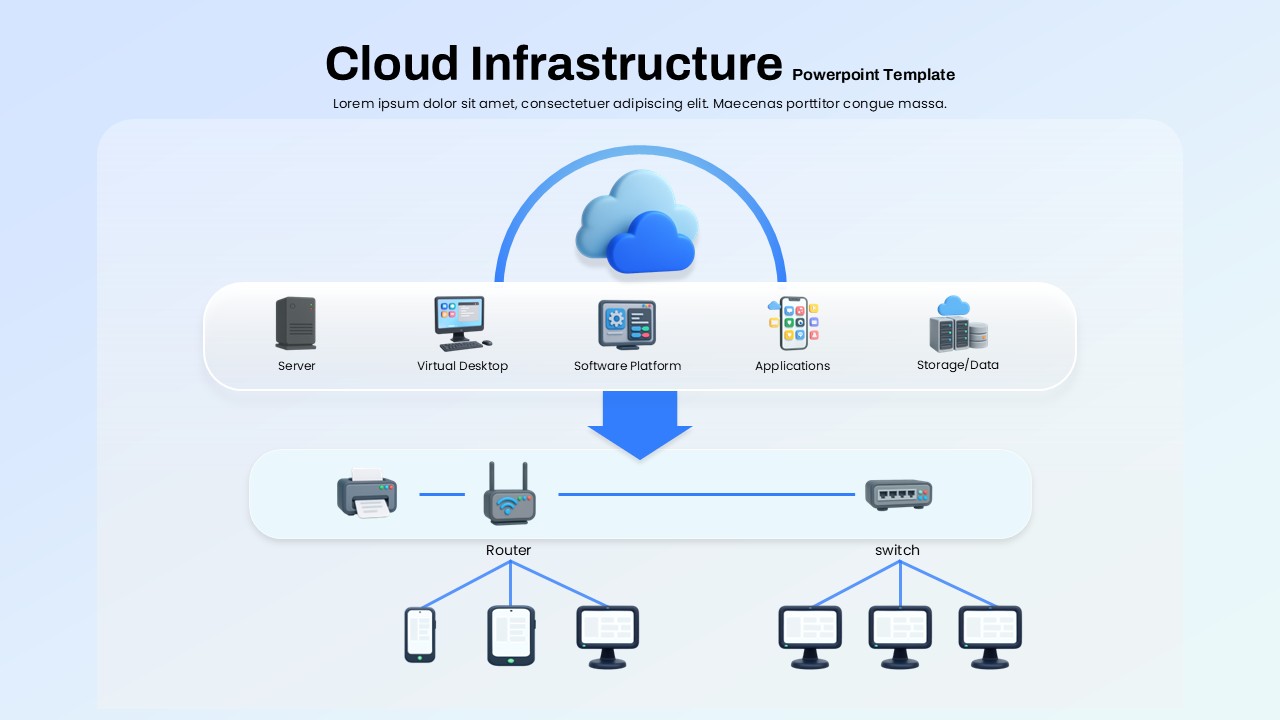
Cloud Infrastructure Overview template for PowerPoint & Google Slides
Information Technology
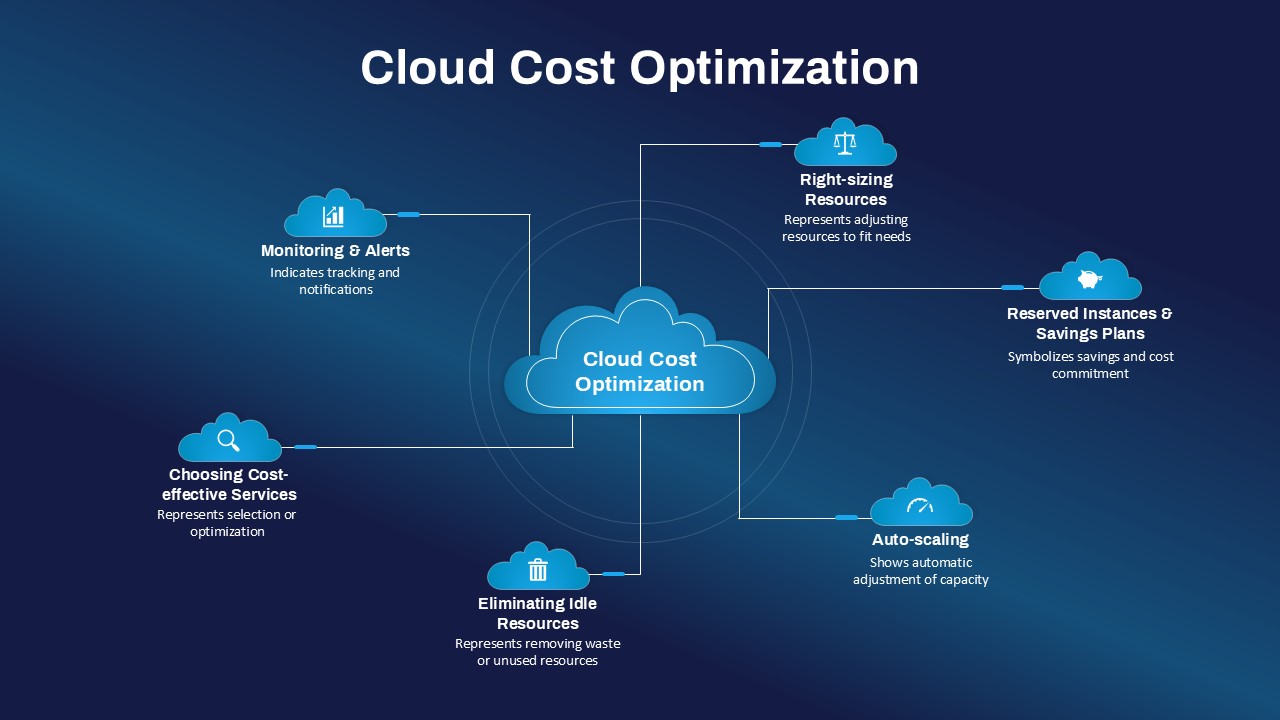
Cloud Cost Optimization Hub-and-Spoke Template for PowerPoint & Google Slides
Cloud Computing
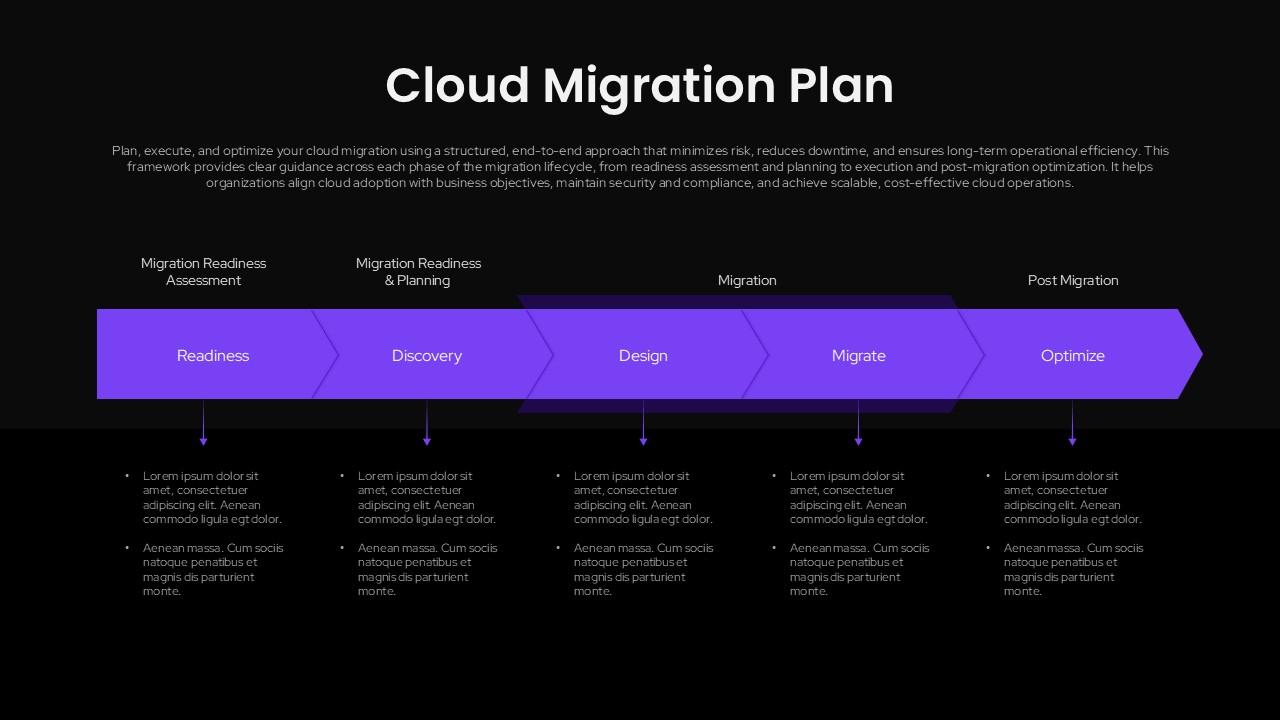
Cloud Migration Plan Chevron Process Template for PowerPoint & Google Slides
Cloud Computing
3D Four Arrow Infographics Diagram Template for PowerPoint & Google Slides
Arrow
Five Arrow Infographics Diagram Template for PowerPoint & Google Slides
Arrow
Five-Stage Pyramid Infographics Diagram Template for PowerPoint & Google Slides
Pyramid
Timeline Arrow Infographics Diagram Template for PowerPoint & Google Slides
Timeline
Business Strategy Infographics Diagram Template for PowerPoint & Google Slides
Business Strategy
Free Bulb Puzzle Infographics Diagram Template for PowerPoint & Google Slides
Process
Free
Pipe Water Infographics Flow Diagram Template for PowerPoint & Google Slides
Process
Venn Diagram Infographics Pack Template for PowerPoint & Google Slides
Circular
3D 6-Step Infographics Process Diagram Template for PowerPoint & Google Slides
Infographics
Colorful Venn Diagram Infographics Template for PowerPoint & Google Slides
Circular
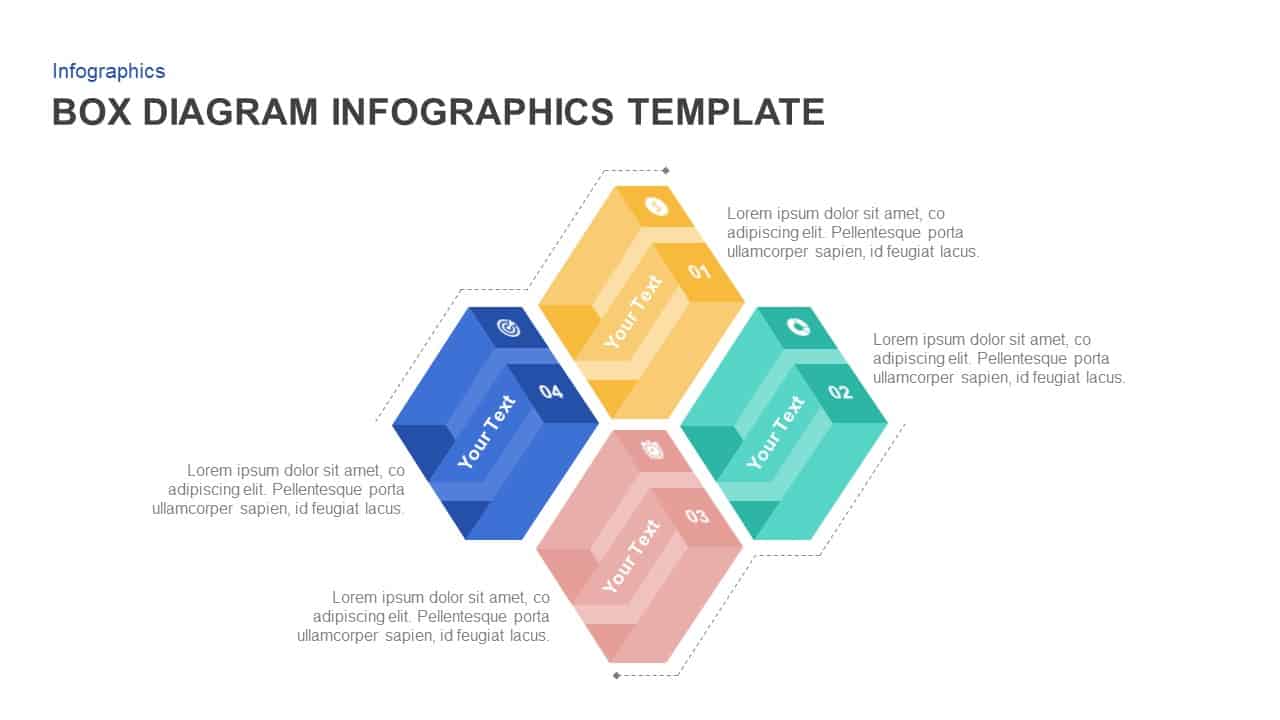
Box Diagram Infographics template for PowerPoint & Google Slides
Business
Four Section Diagram Infographics template for PowerPoint & Google Slides
Process
Six-Step Circular Diagram Infographics Template for PowerPoint & Google Slides
Circular
8-Step Circular Diagram Infographics Template for PowerPoint & Google Slides
Circular
Dynamic Gear Diagram Infographics Template for PowerPoint & Google Slides
Process
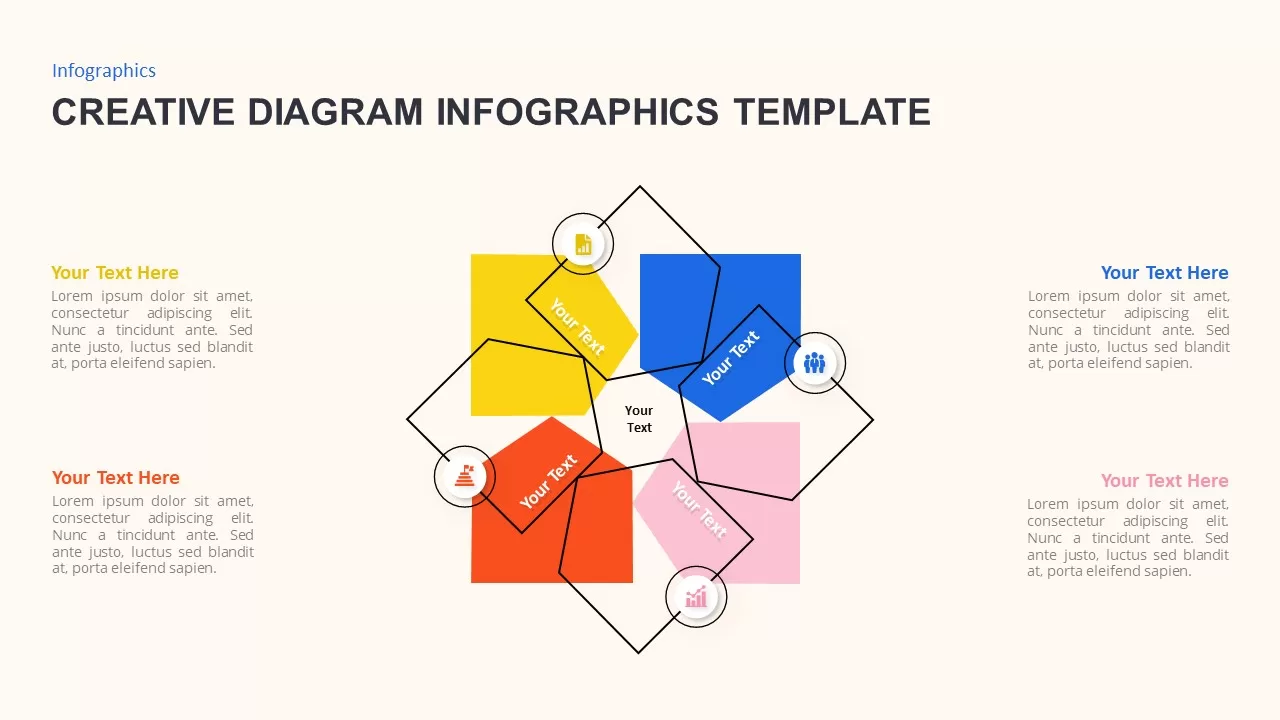
Versatile Creative Diagram Infographics Template for PowerPoint & Google Slides
Process
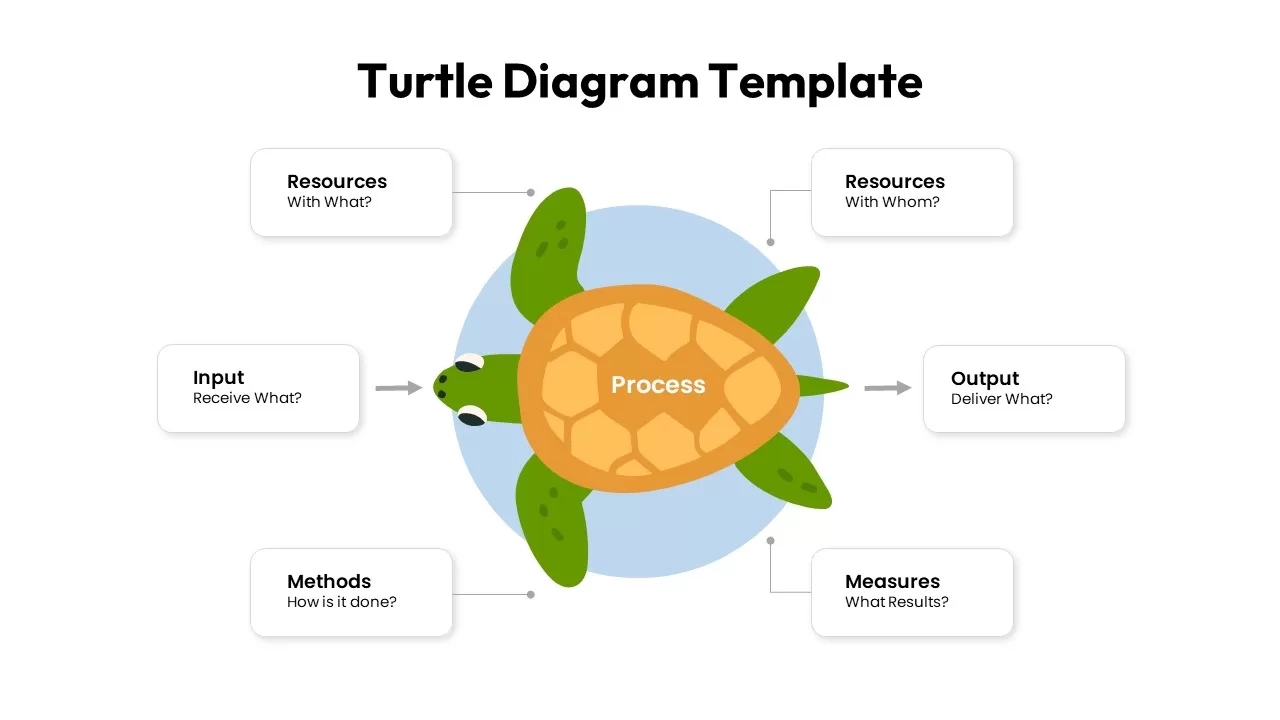
Turtle Diagram Infographics Template for PowerPoint & Google Slides
Process
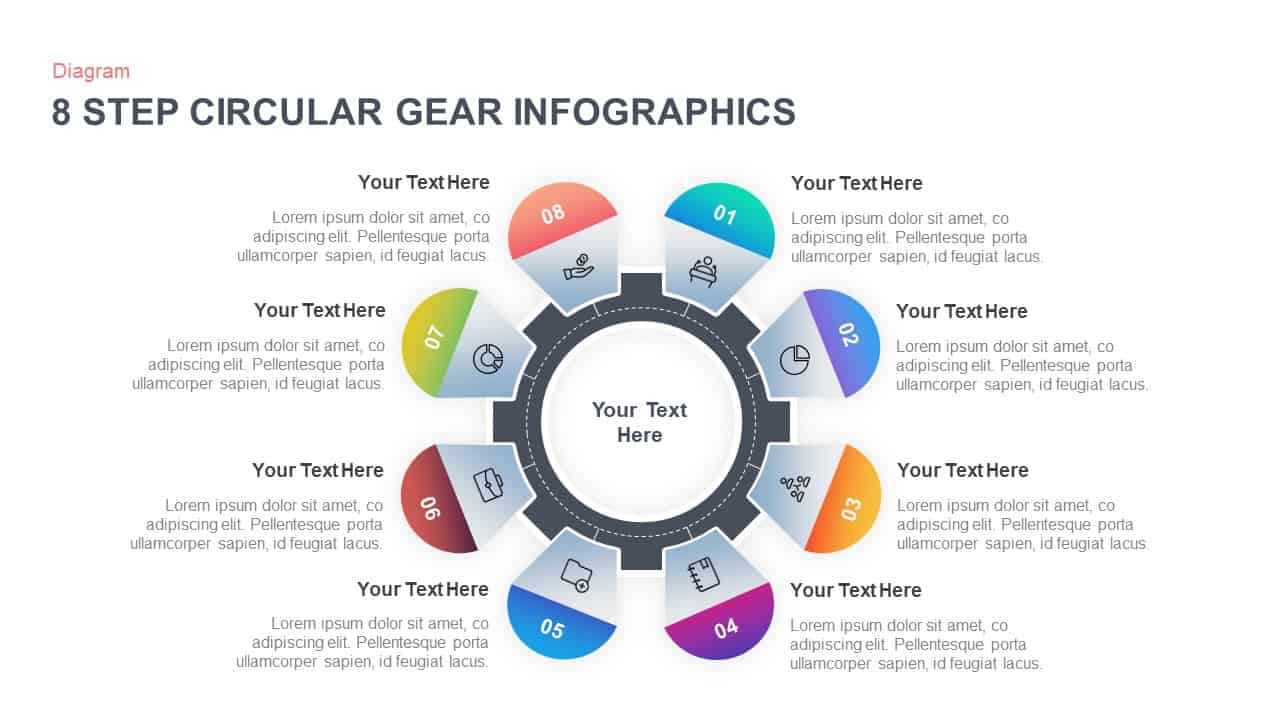
8-Step Circular Gear Infographics Diagram for PowerPoint & Google Slides
Process
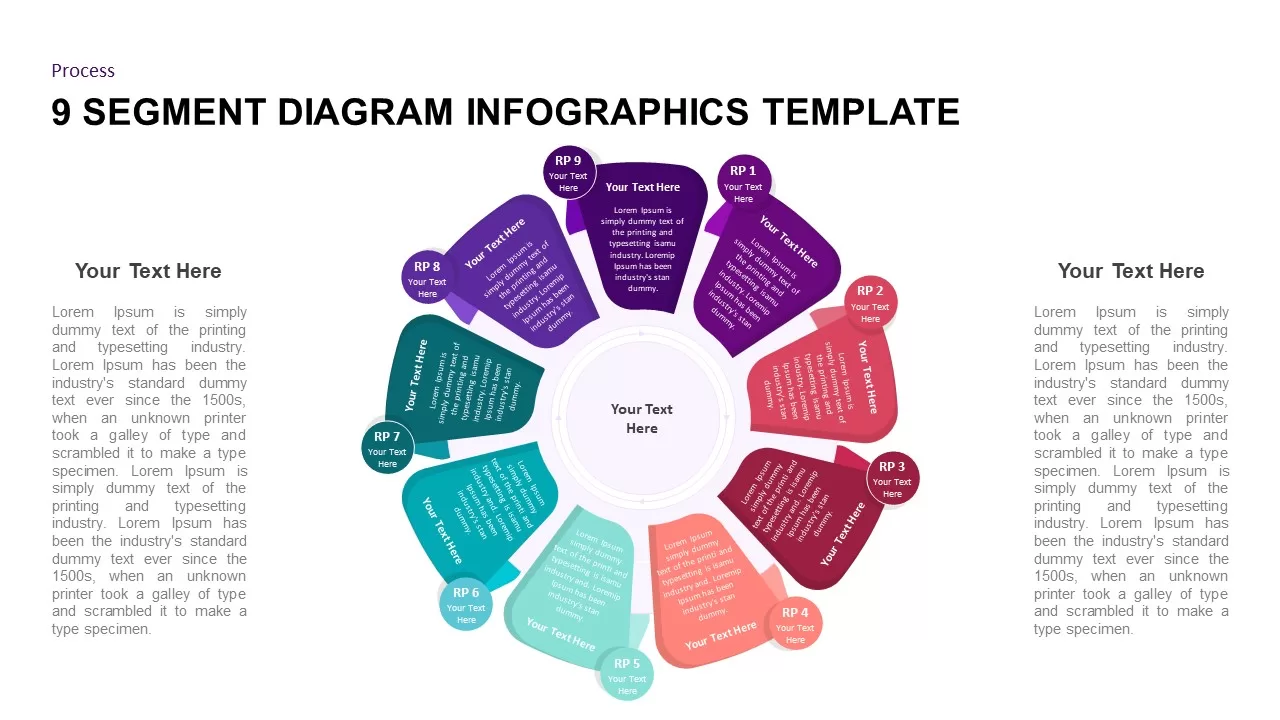
9 Segment Diagram Infographics for PowerPoint & Google Slides
Process
4 Business Data Infographics Diagram for PowerPoint & Google Slides
Process
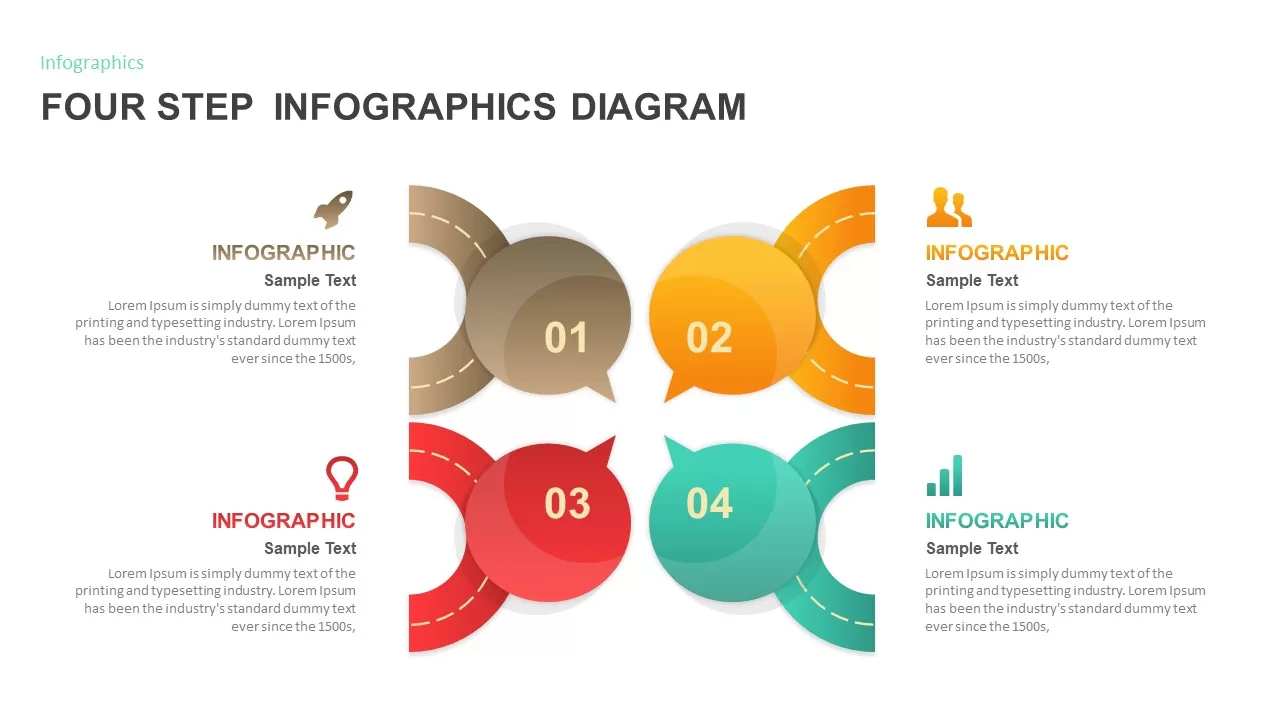
Four Step Infographics Diagram for PowerPoint & Google Slides
Process
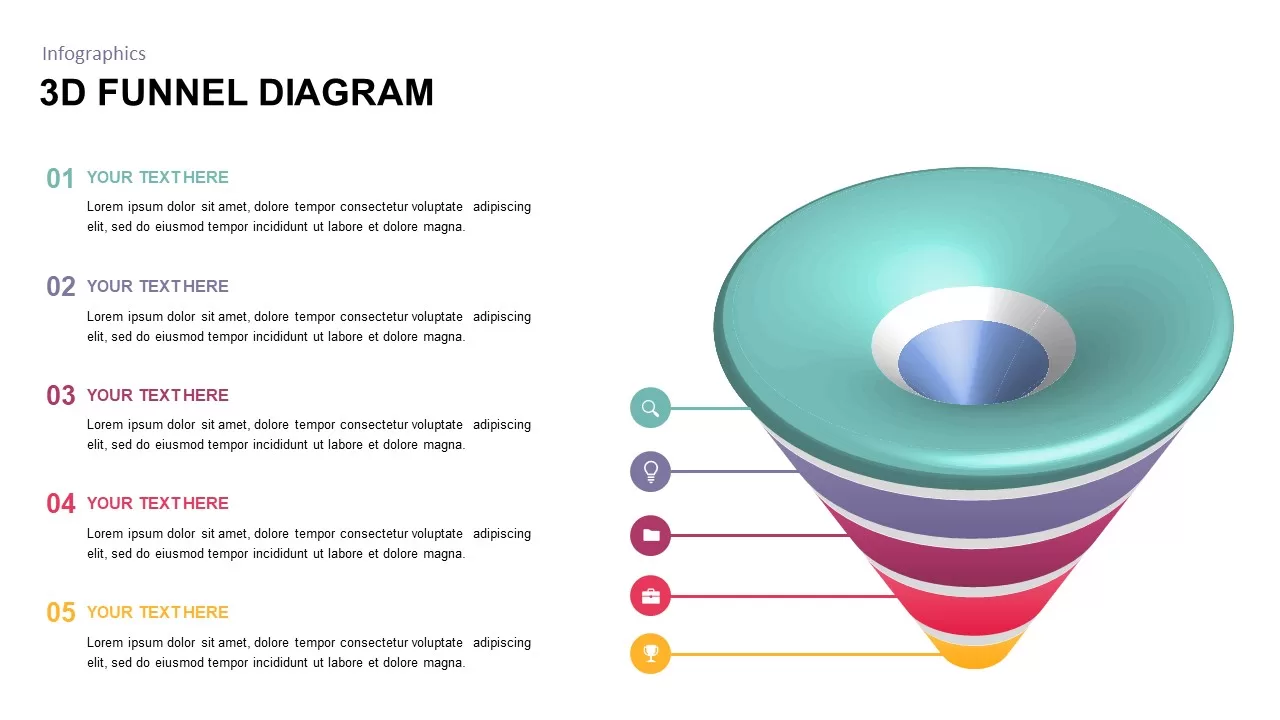
3D Funnel Diagram Infographics for PowerPoint & Google Slides
Funnel
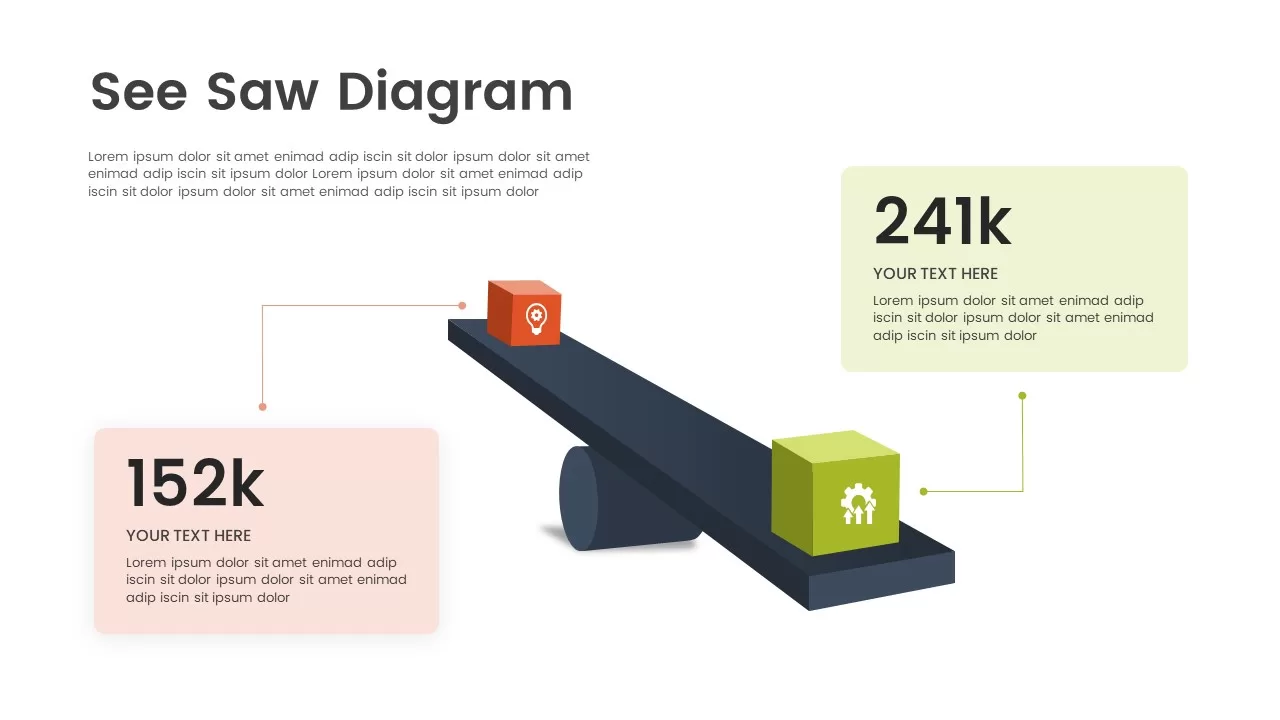
See Saw Diagram Infographics for PowerPoint & Google Slides
Business
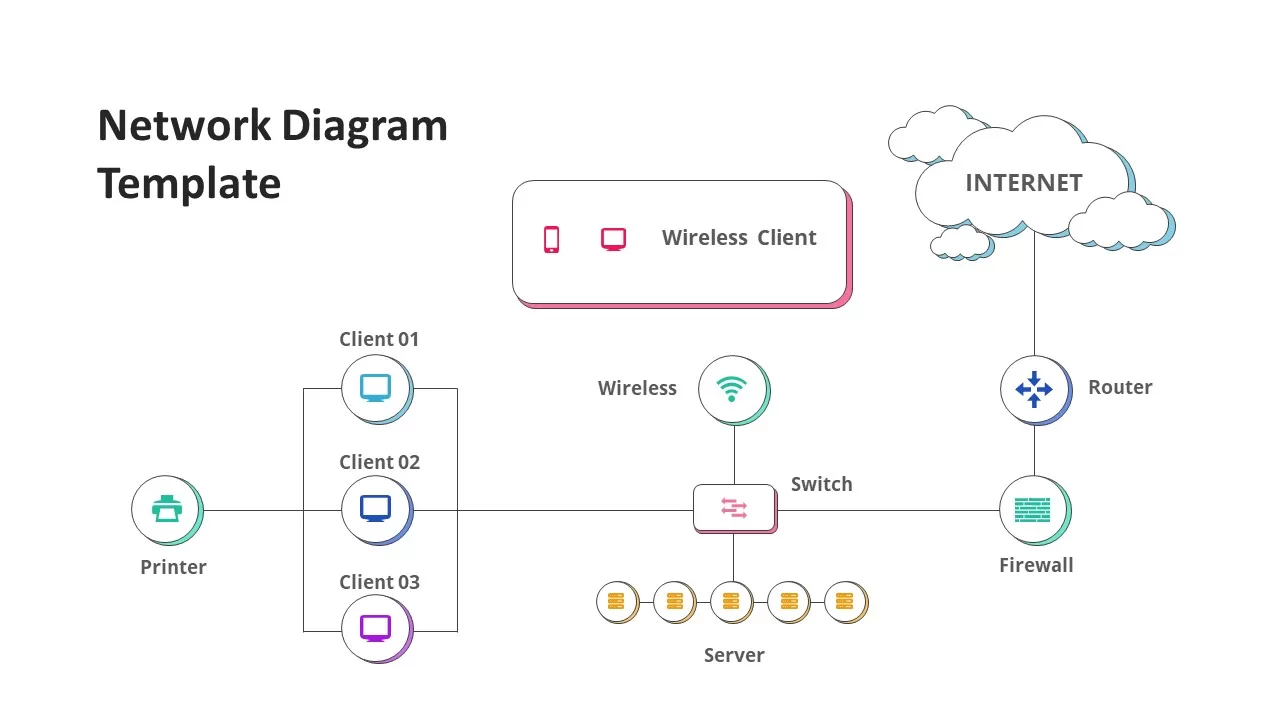
Network Diagram Infographics for PowerPoint & Google Slides
Technology
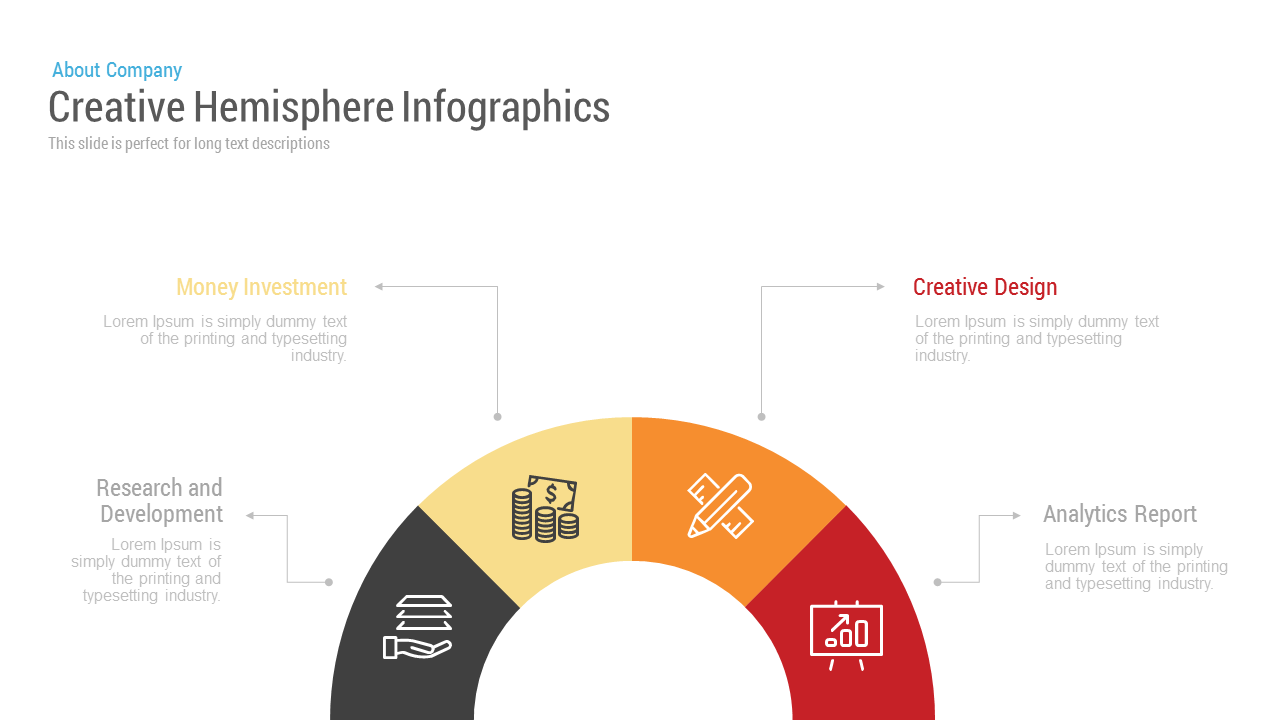
Free Creative Hemisphere Infographics template for PowerPoint & Google Slides
Infographics
Free
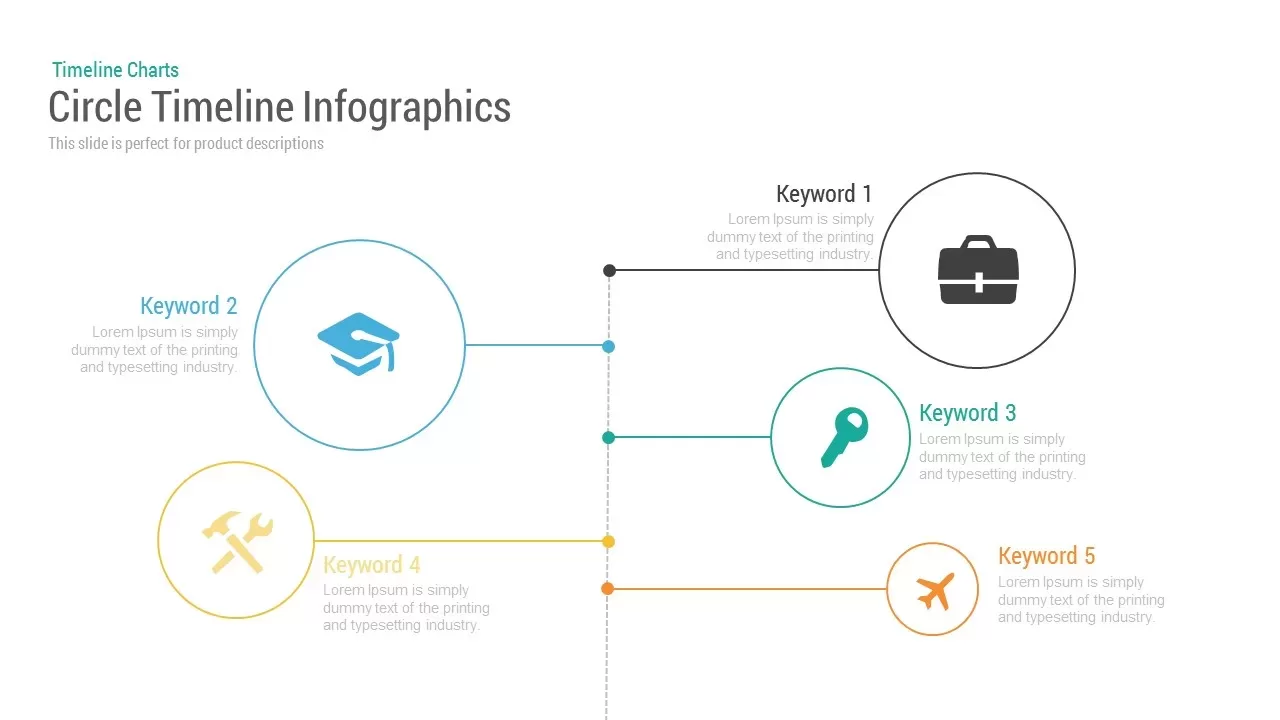
Circle Timeline Infographics template for PowerPoint & Google Slides
Timeline
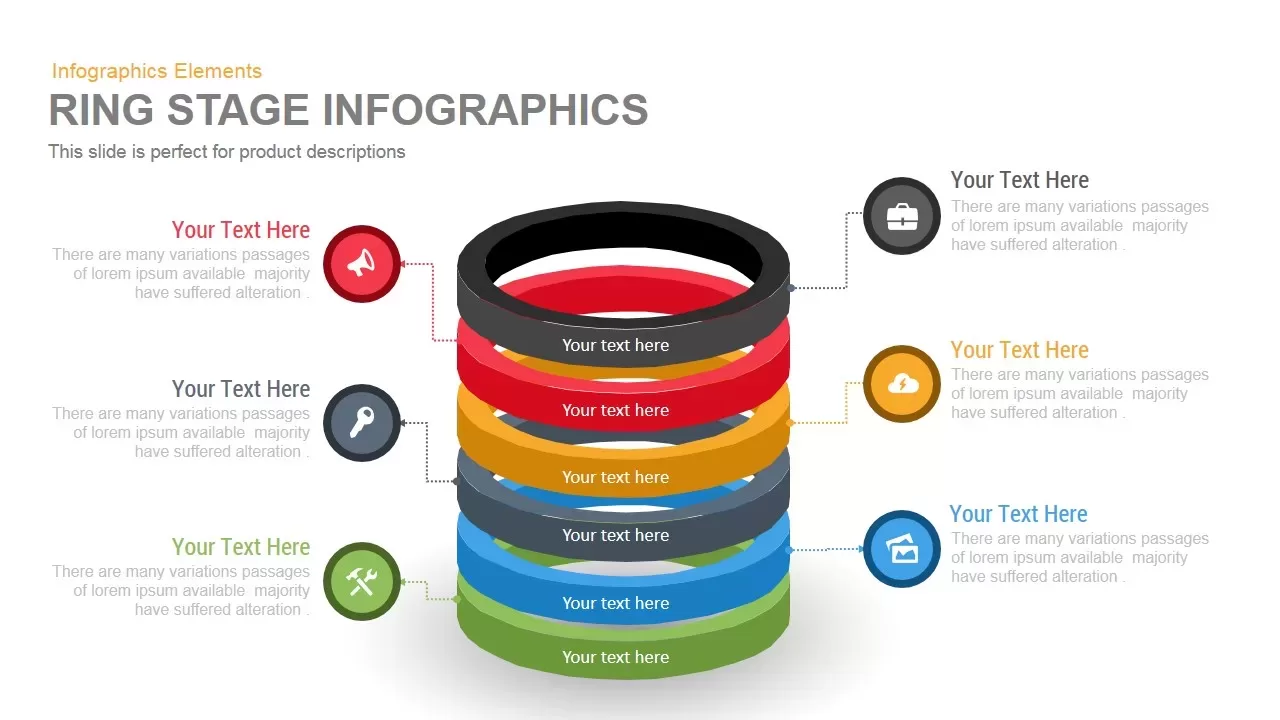
Ring Infographics template for PowerPoint & Google Slides
Circular
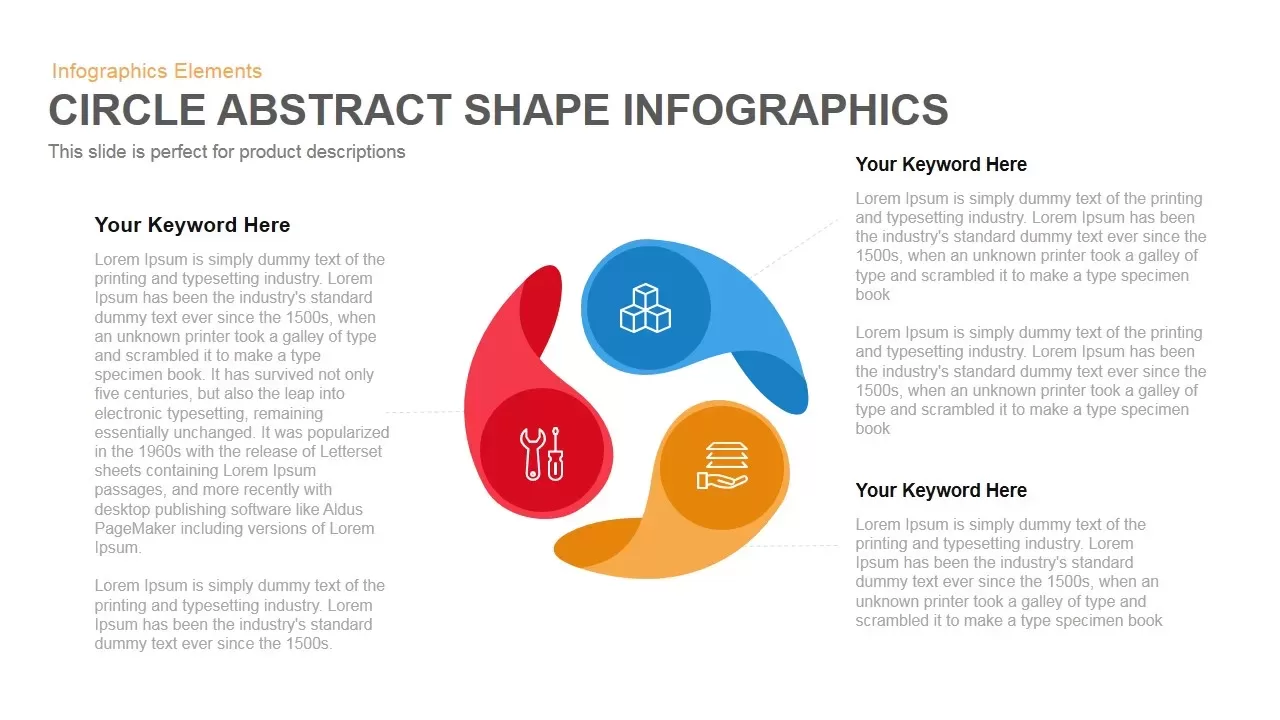
Circle Abstract Shape Infographics Template for PowerPoint & Google Slides
Circular
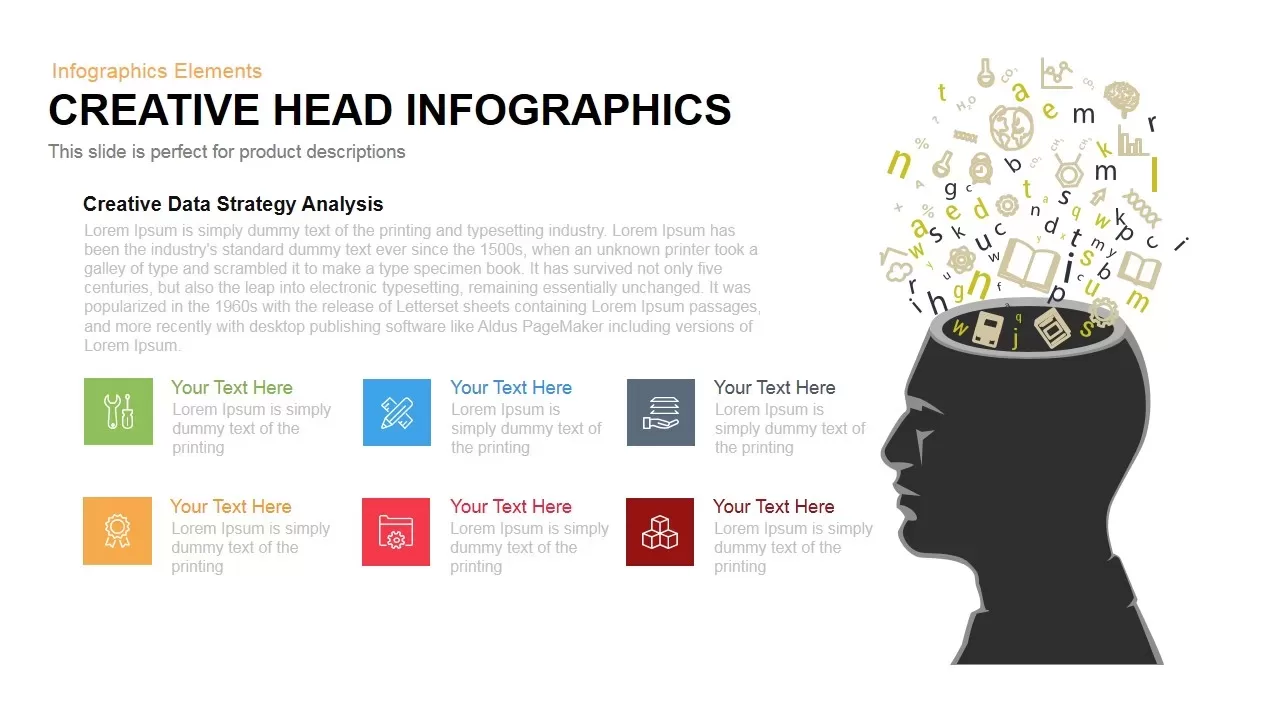
Dynamic Creative Head Infographics Template for PowerPoint & Google Slides
Circular
Four Arrow Square Infographics Template for PowerPoint & Google Slides
Arrow
Brain Gear Hub-and-Spoke Infographics template for PowerPoint & Google Slides
Org Chart
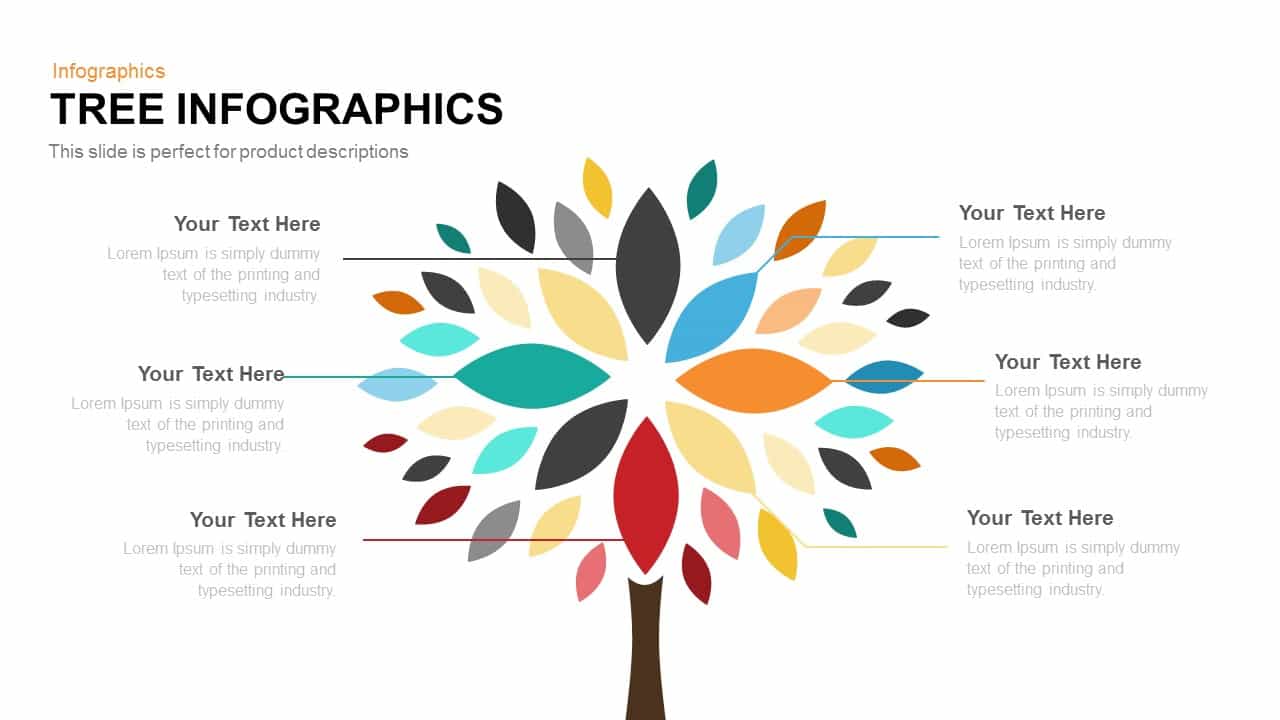
Tree Infographics template for PowerPoint & Google Slides
Infographics
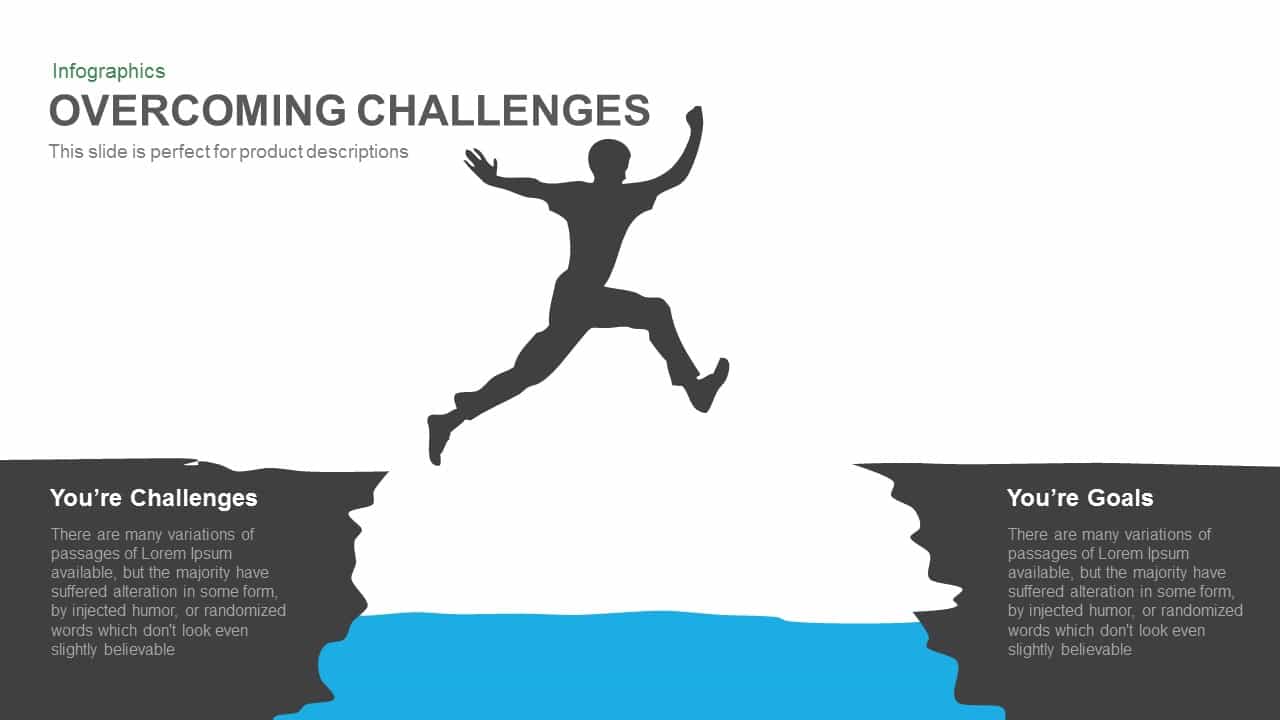
Overcoming Challenges Infographics template for PowerPoint & Google Slides
Opportunities Challenges
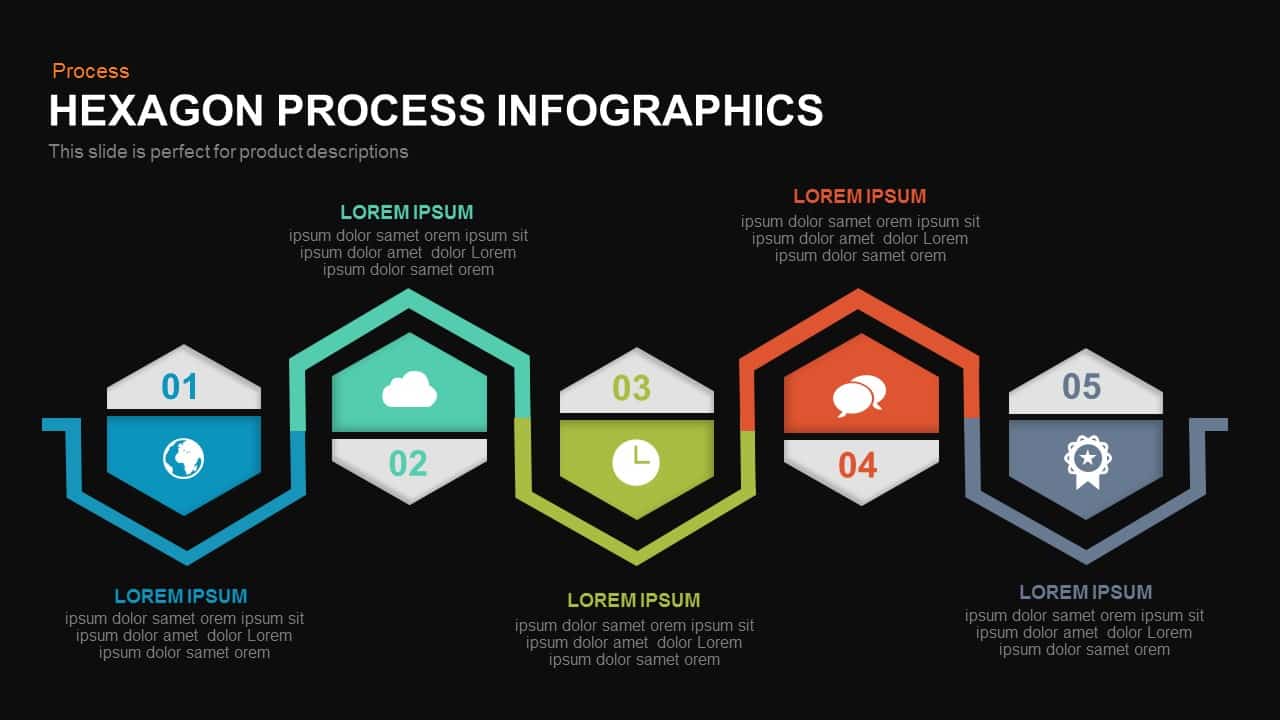
Five-Stage Hexagon Process Infographics template for PowerPoint & Google Slides
Process
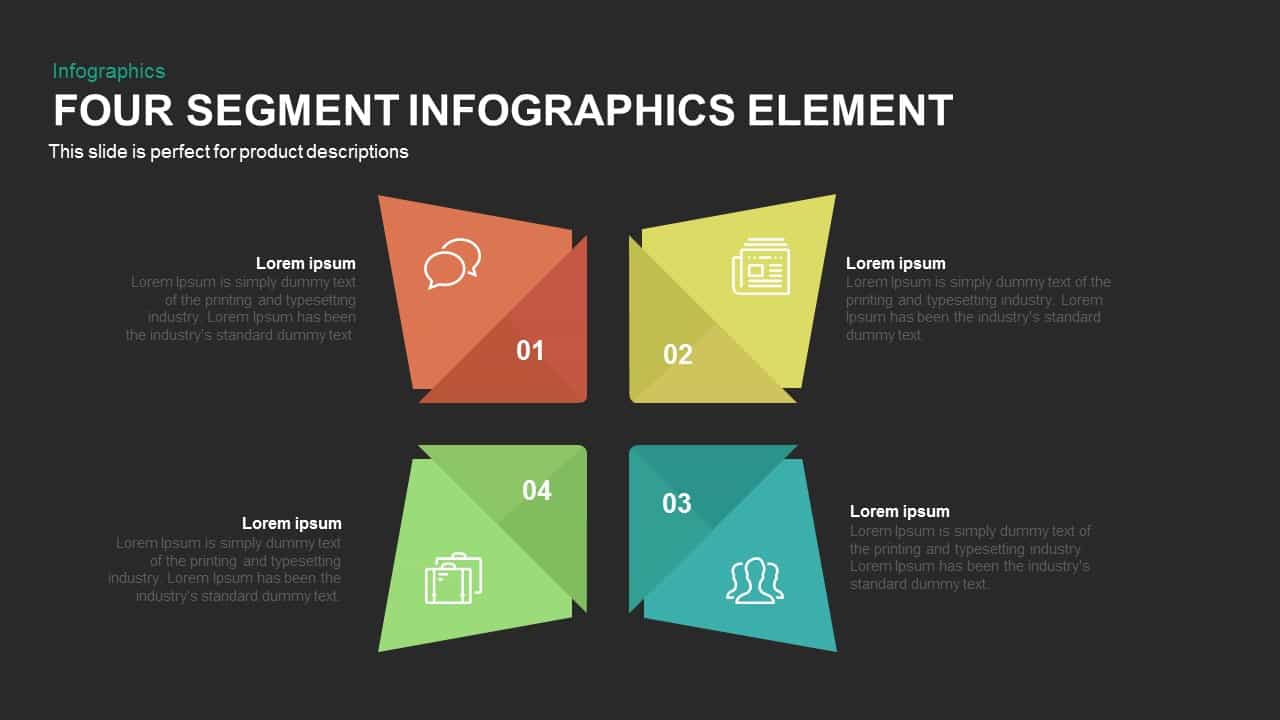
Four Segment Infographics Element Template for PowerPoint & Google Slides
Comparison
Six-Stage Time Arrow Infographics Template for PowerPoint & Google Slides
Arrow
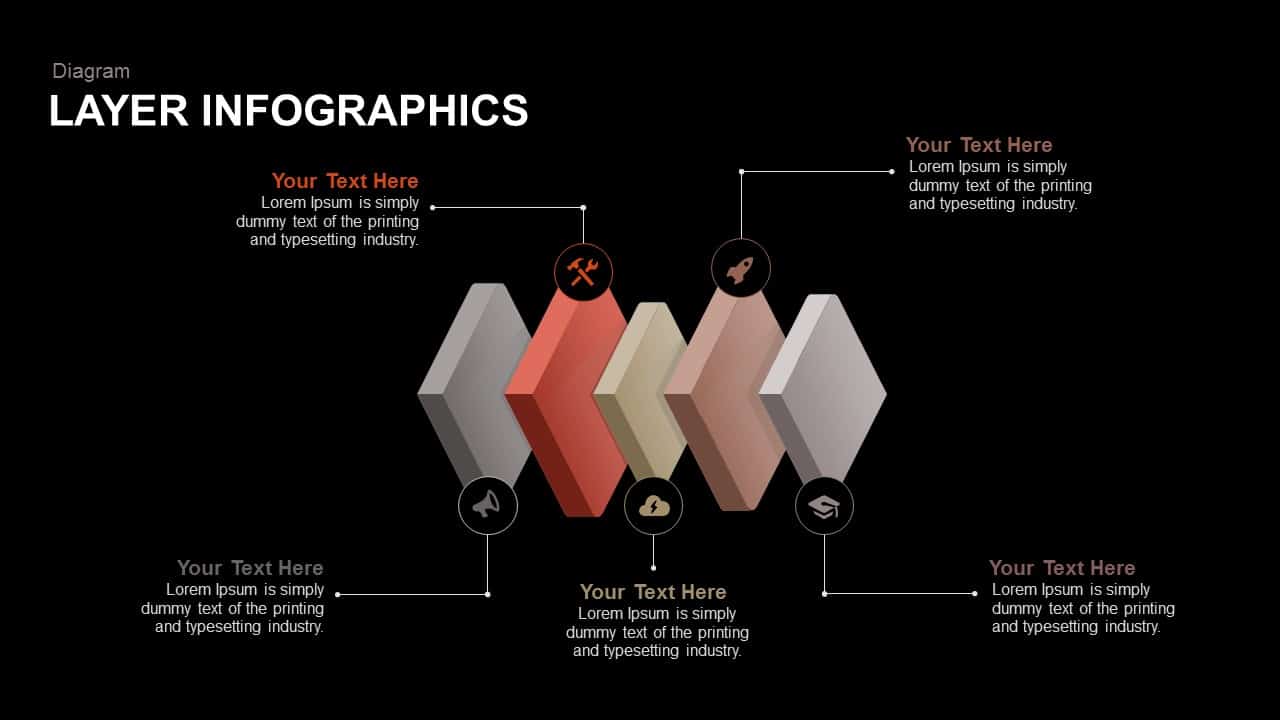
Layer Infographics template for PowerPoint & Google Slides
Process
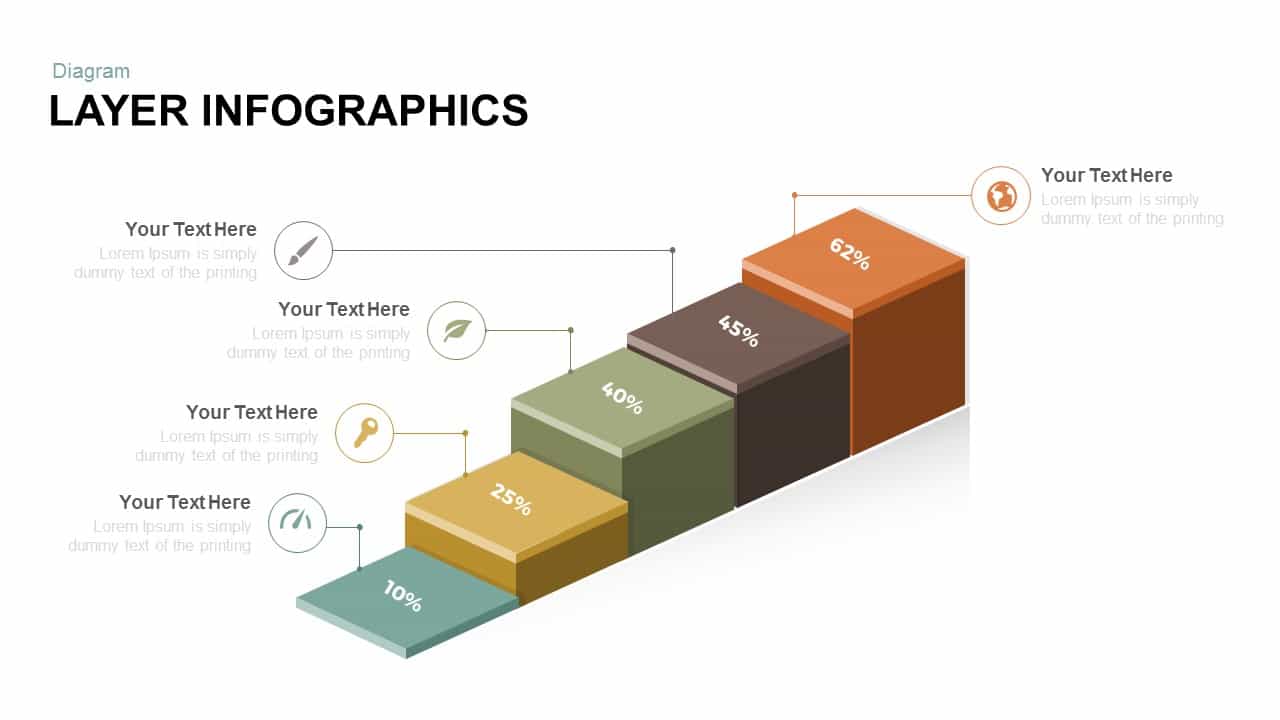
Free Layer Infographics template for PowerPoint & Google Slides
Process
Free

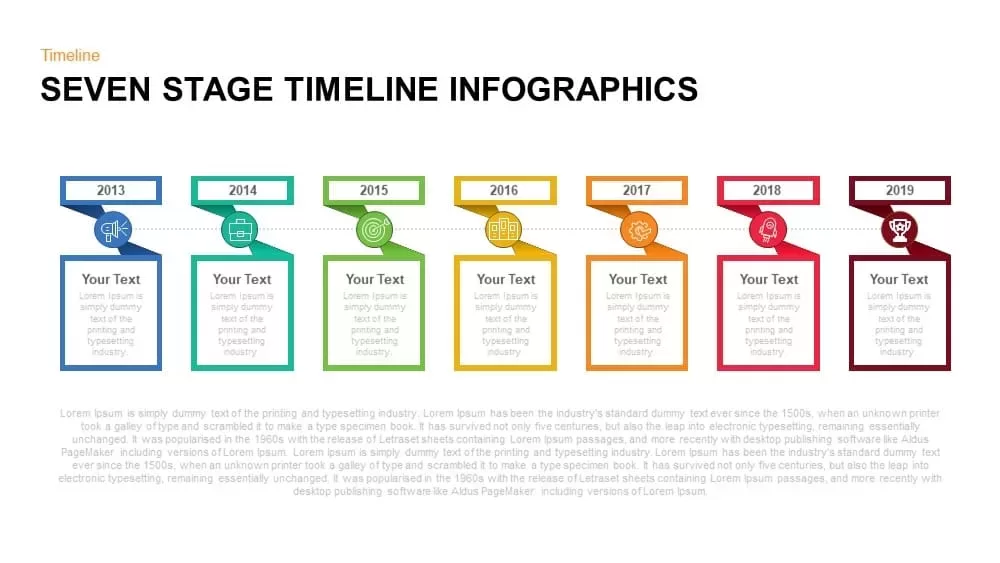
Seven-Stage Timeline Infographics Template for PowerPoint & Google Slides
Timeline
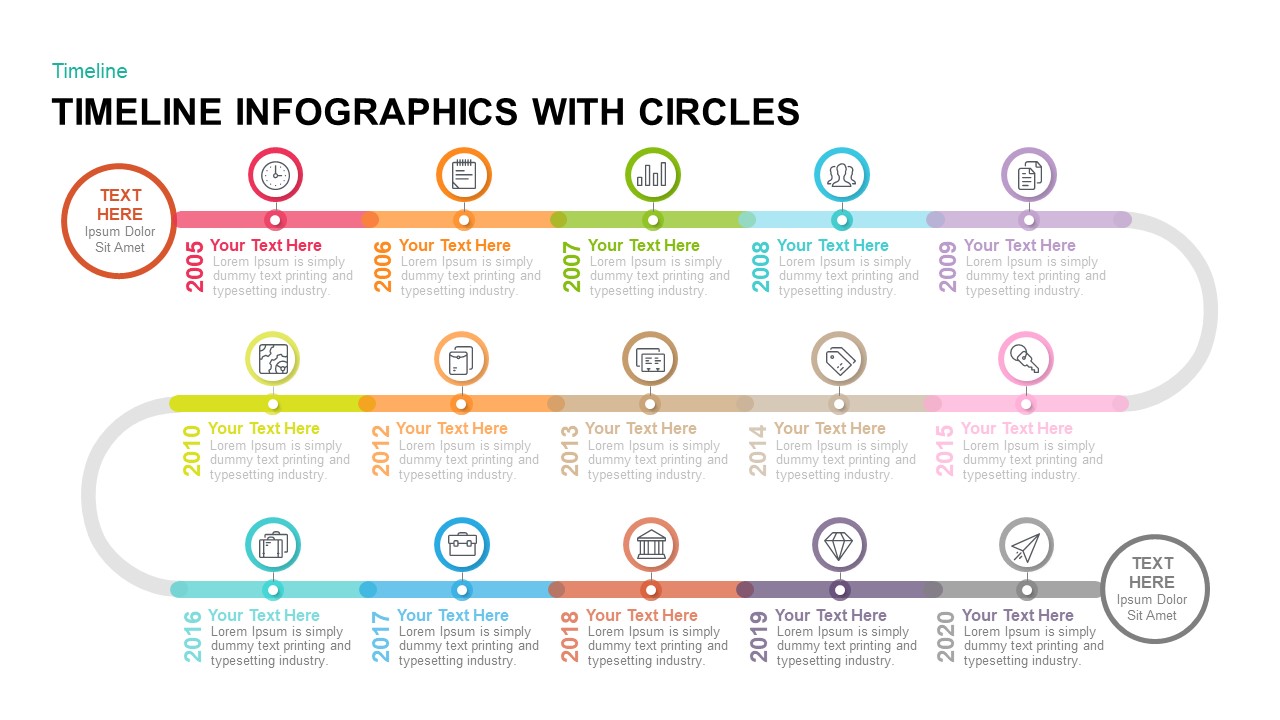
Circular Timeline Infographics Template for PowerPoint & Google Slides
Timeline
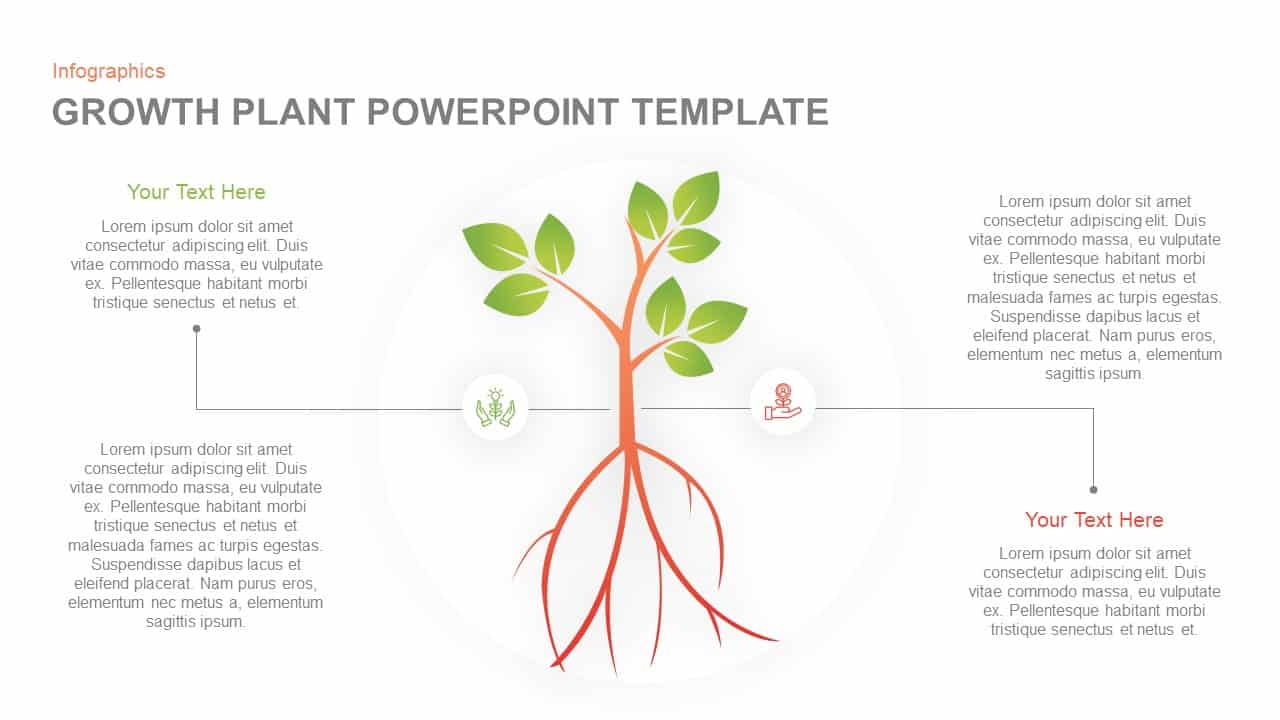
Growth Plant Infographics template for PowerPoint & Google Slides
Process
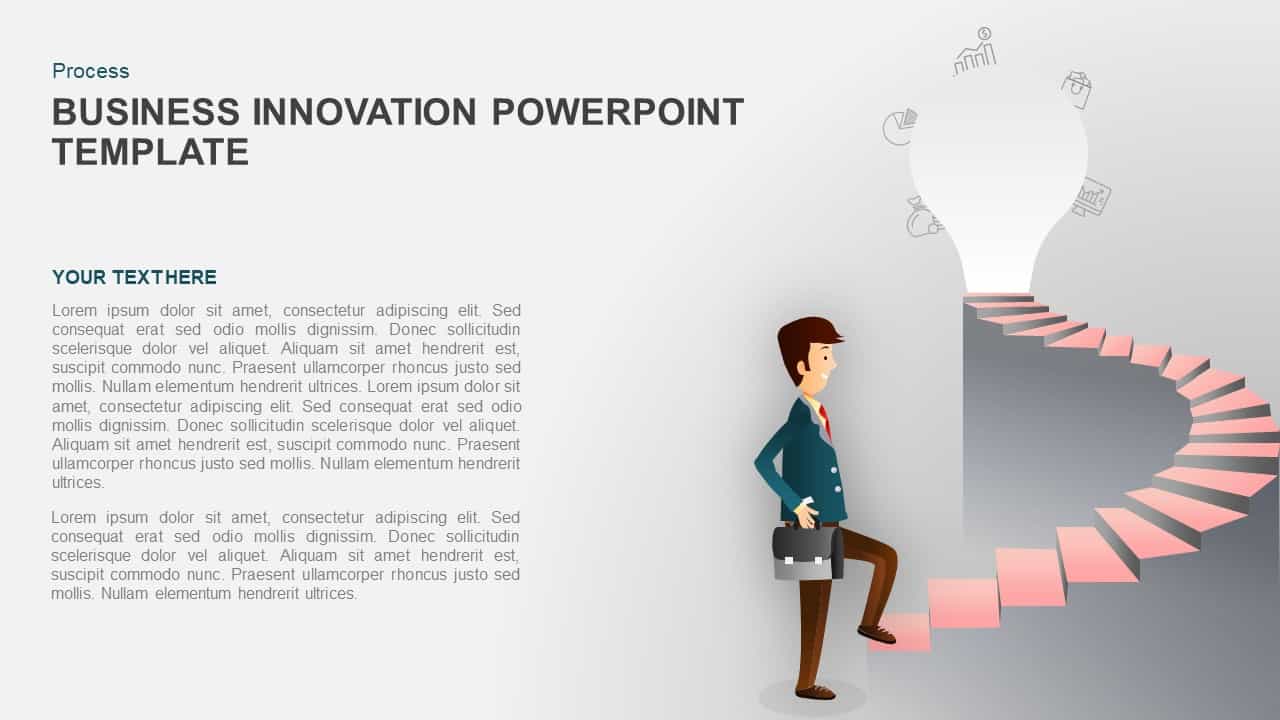
Business Innovation Infographics template for PowerPoint & Google Slides
Process
Five-Stage Pyramid Infographics Process Template for PowerPoint & Google Slides
Pyramid
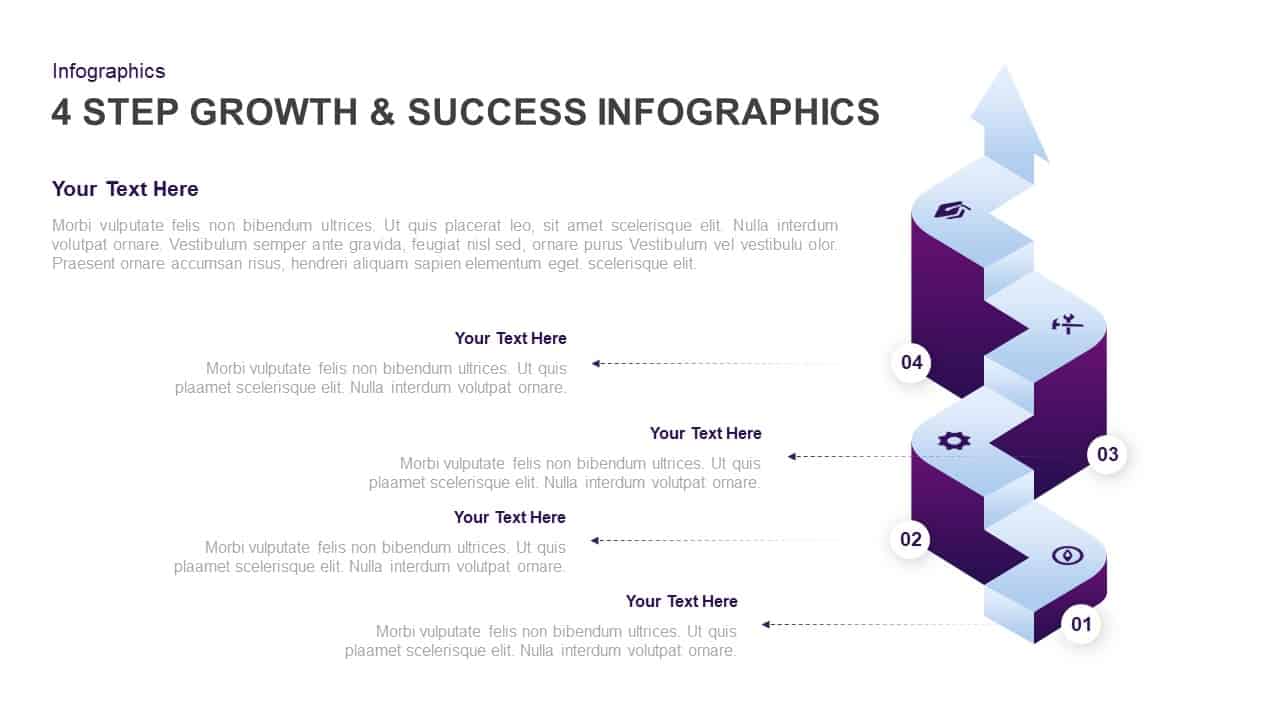
4-Step Growth & Success Infographics Template for PowerPoint & Google Slides
Accomplishment
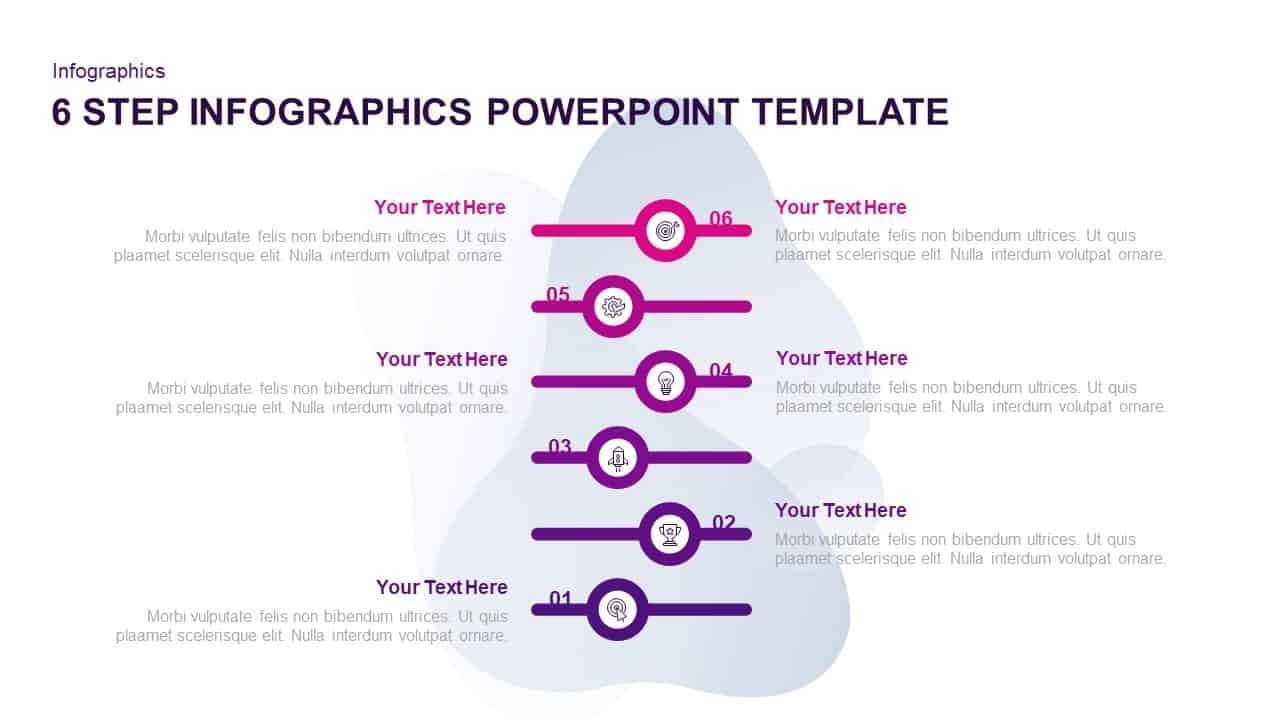
Six-Step Purple Gradient Infographics Template for PowerPoint & Google Slides
Process
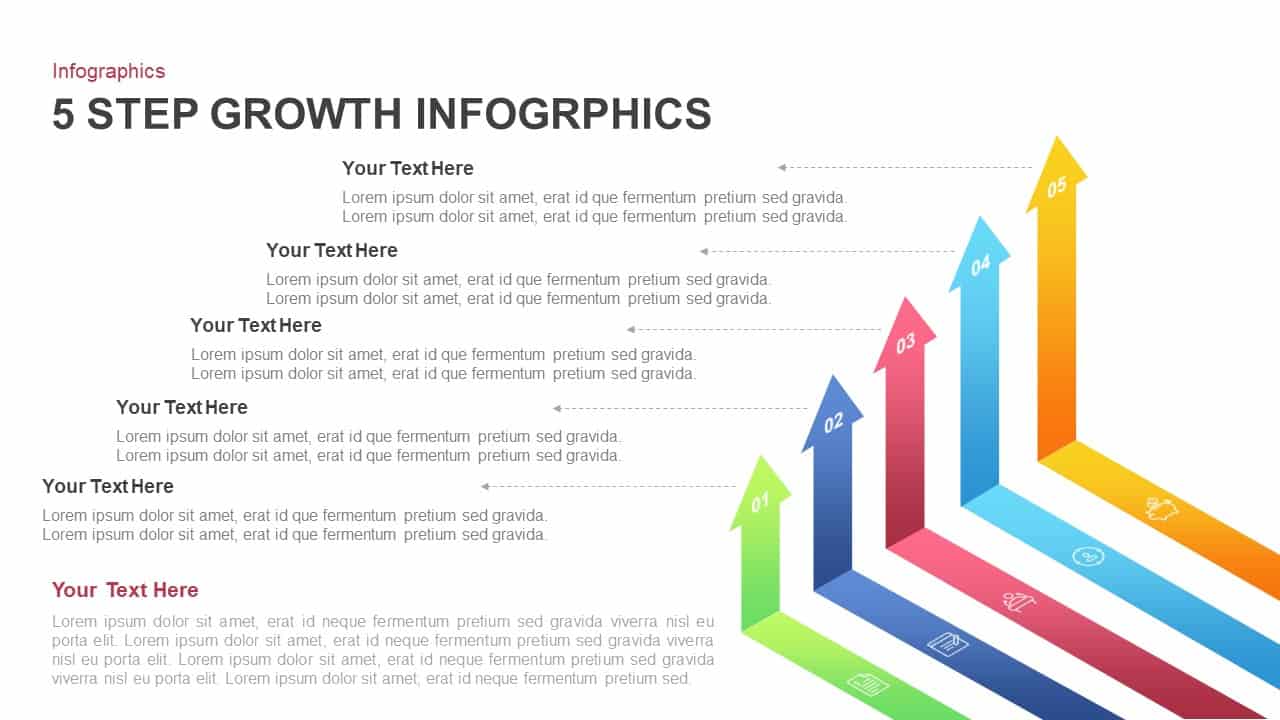
5-Step Growth Arrow Infographics Template for PowerPoint & Google Slides
Arrow
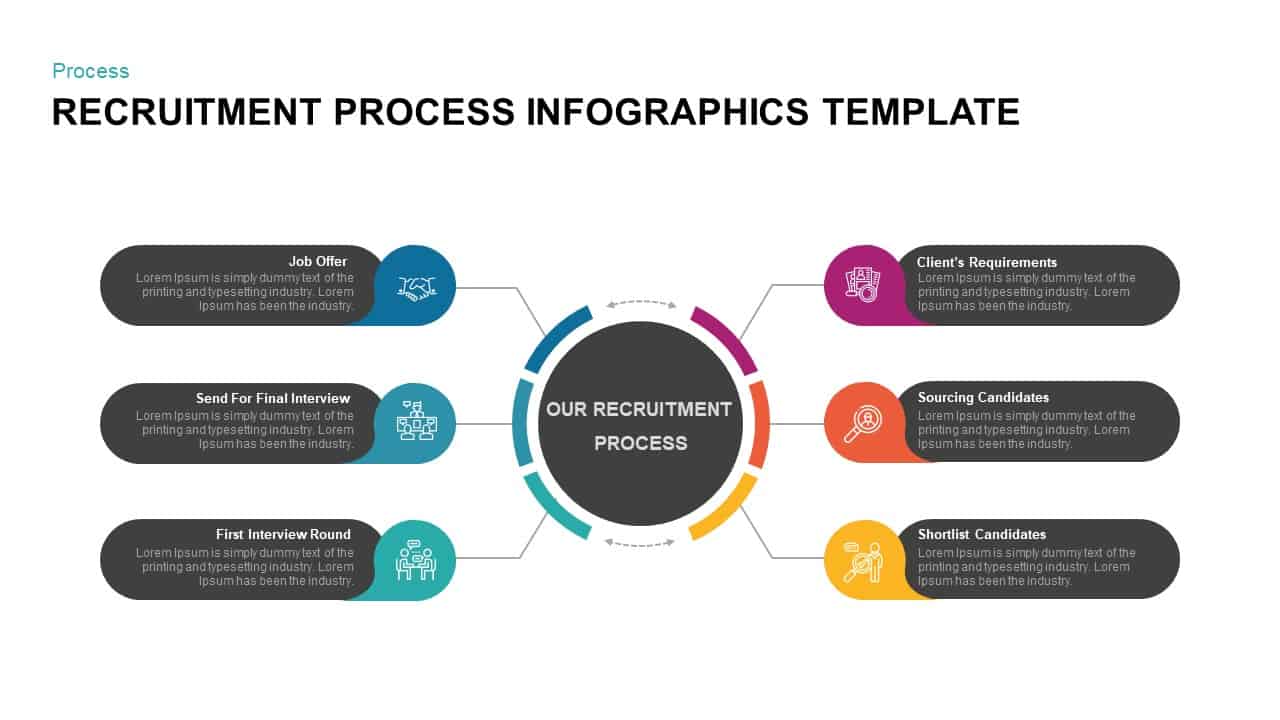
Recruitment Process Infographics Template for PowerPoint & Google Slides
Process
Ecology Infographics Overview template for PowerPoint & Google Slides
Business Proposal
Mind Map Infographics template for PowerPoint & Google Slides
Mind Maps

Creative Cycle Process Infographics Template for PowerPoint & Google Slides
Process
Time Management Infographics Template for PowerPoint & Google Slides
Process
Modern 5-Step Flow Infographics Template for PowerPoint & Google Slides
Process
Opposing Ideas Infographics Pack Template for PowerPoint & Google Slides
Comparison
Medical Infographics Data Visualization Template for PowerPoint & Google Slides
Health
Isometric 3D Cube Shapes Infographics Template for PowerPoint & Google Slides
Infographics
Doodle Infographics Template for PowerPoint & Google Slides
Infographics
3, 4, and 5 Step Gear Infographics Template for PowerPoint & Google Slides
Process
Agenda Infographics Diamond template for PowerPoint & Google Slides
Business Plan
Weisbord’s Six Box Model Infographics Template for PowerPoint & Google Slides
Circular
Timeline Infographics template for PowerPoint & Google Slides
Timeline
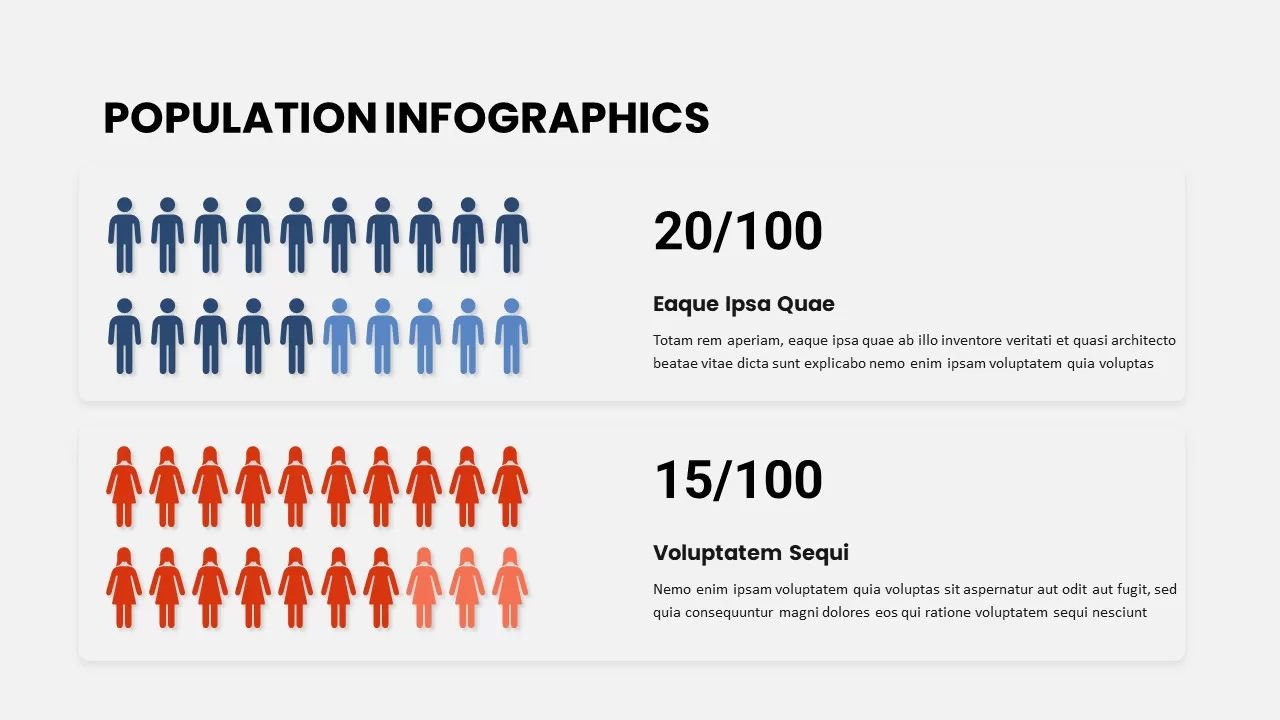
Population Infographics template for PowerPoint & Google Slides
Comparison
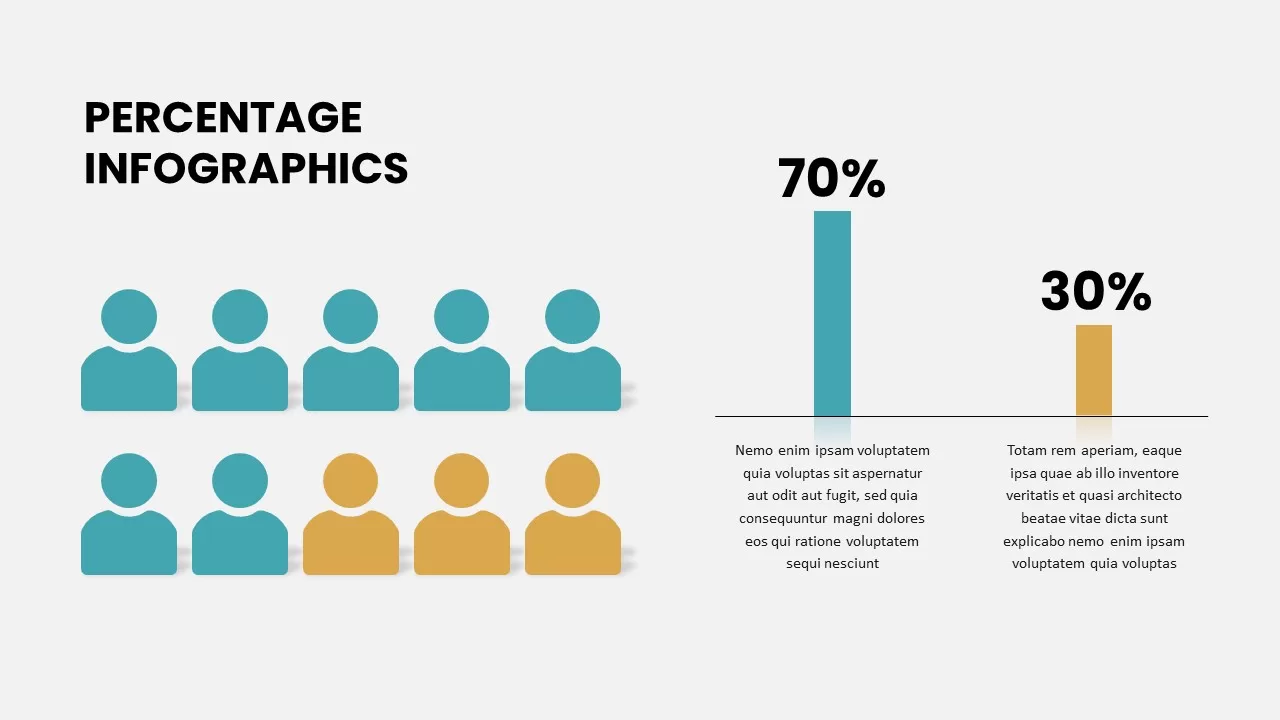
Free Percentage Infographics template for PowerPoint & Google Slides
Comparison
Free
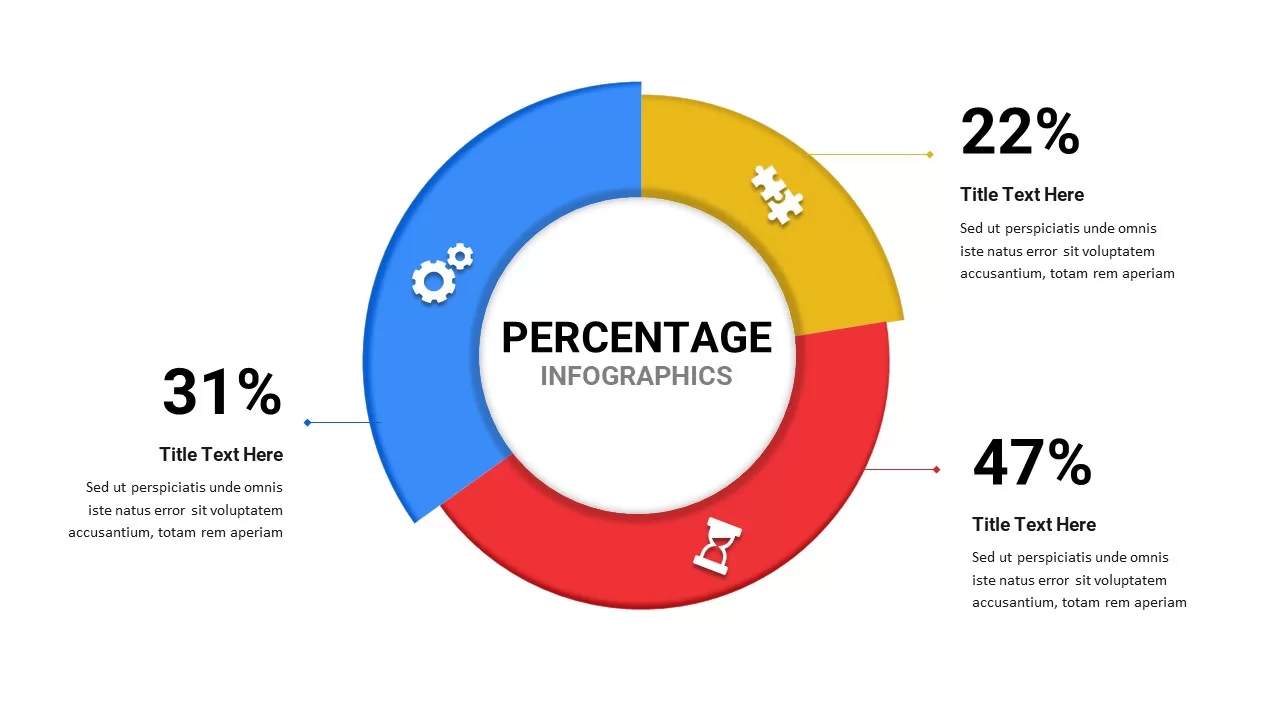
Percentage Infographics template for PowerPoint & Google Slides
Comparison
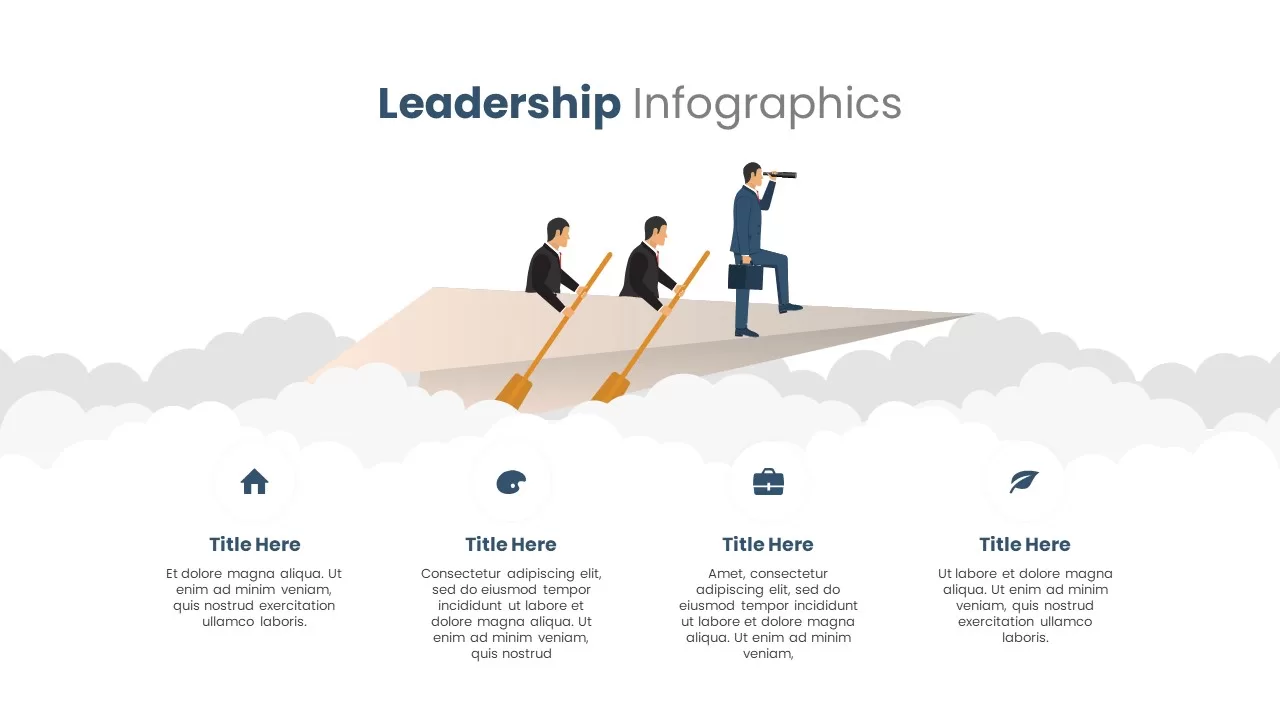
Versatile Leadership Infographics Template for PowerPoint & Google Slides
Infographics
Agriculture Windmill Infographics Template for PowerPoint & Google Slides
Comparison
Domino Effect Sequential Infographics Template for PowerPoint & Google Slides
Process
Hiring Process Timeline Infographics Template for PowerPoint & Google Slides
Recruitment
Modern Social Media Infographics Template for PowerPoint & Google Slides
Digital Marketing
Shield Infographics Four-Part Framework Template for PowerPoint & Google Slides
Process

DevOps Infographics & Process Flow Template for PowerPoint & Google Slides
Information Technology

Free Colorful Timeline Infographics Template for PowerPoint & Google Slides
Timeline
Free
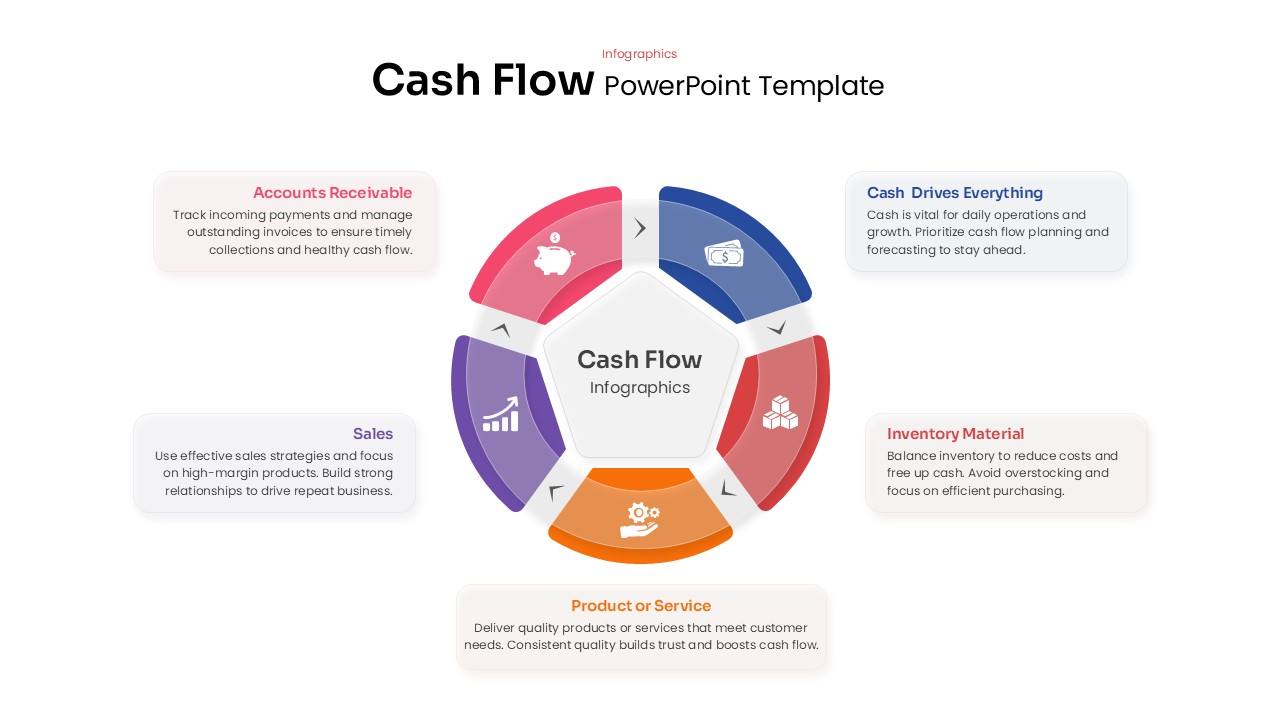
Cash Flow Infographics template for PowerPoint & Google Slides
Business