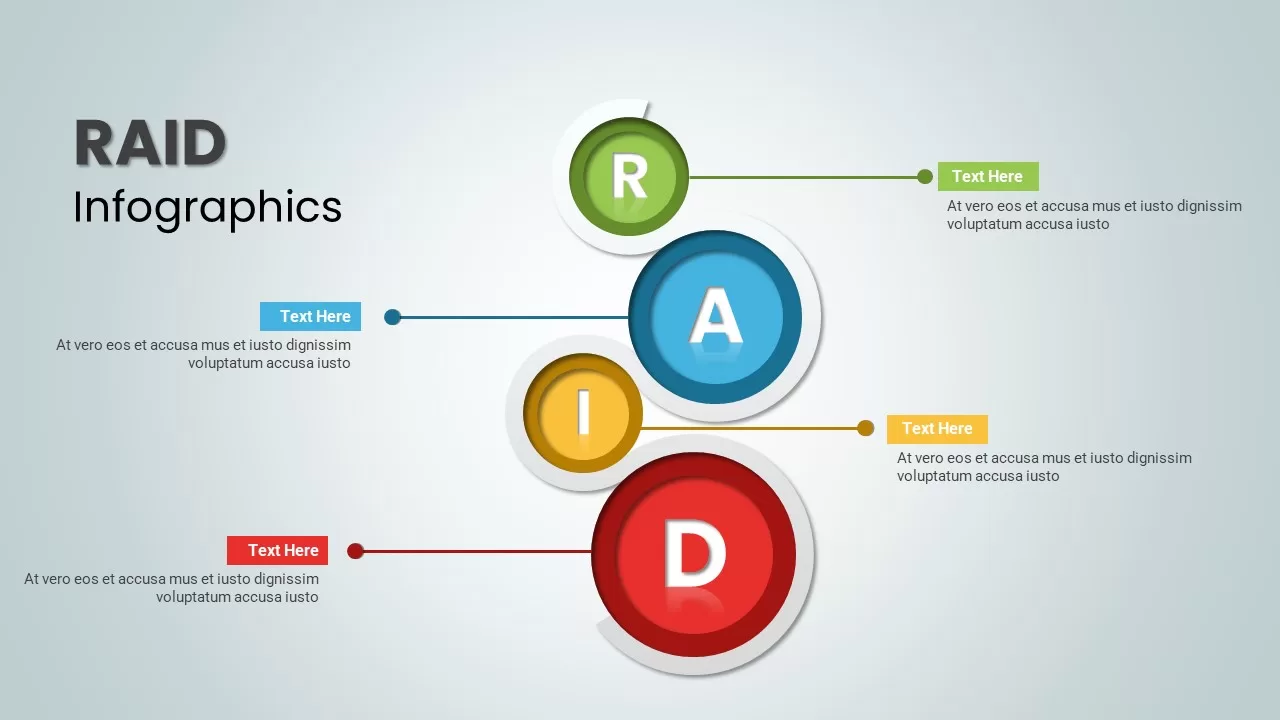
RAID Infographics template for PowerPoint & Google Slides


Description
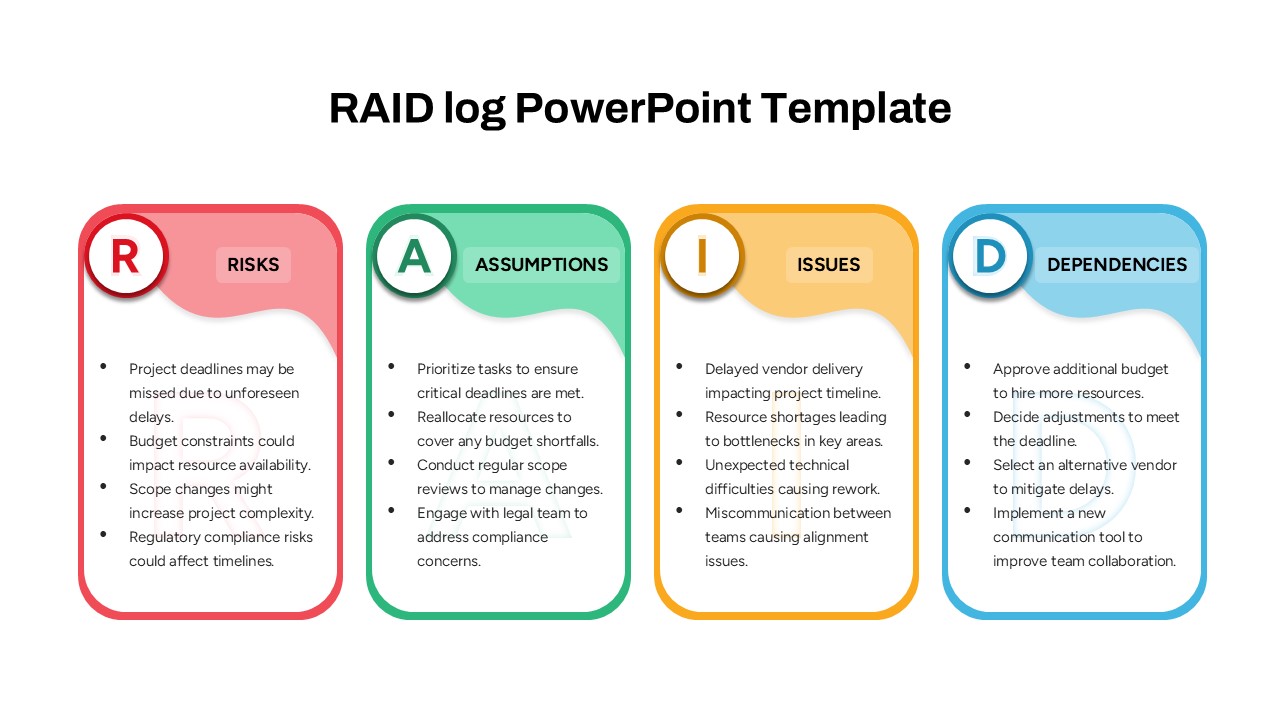
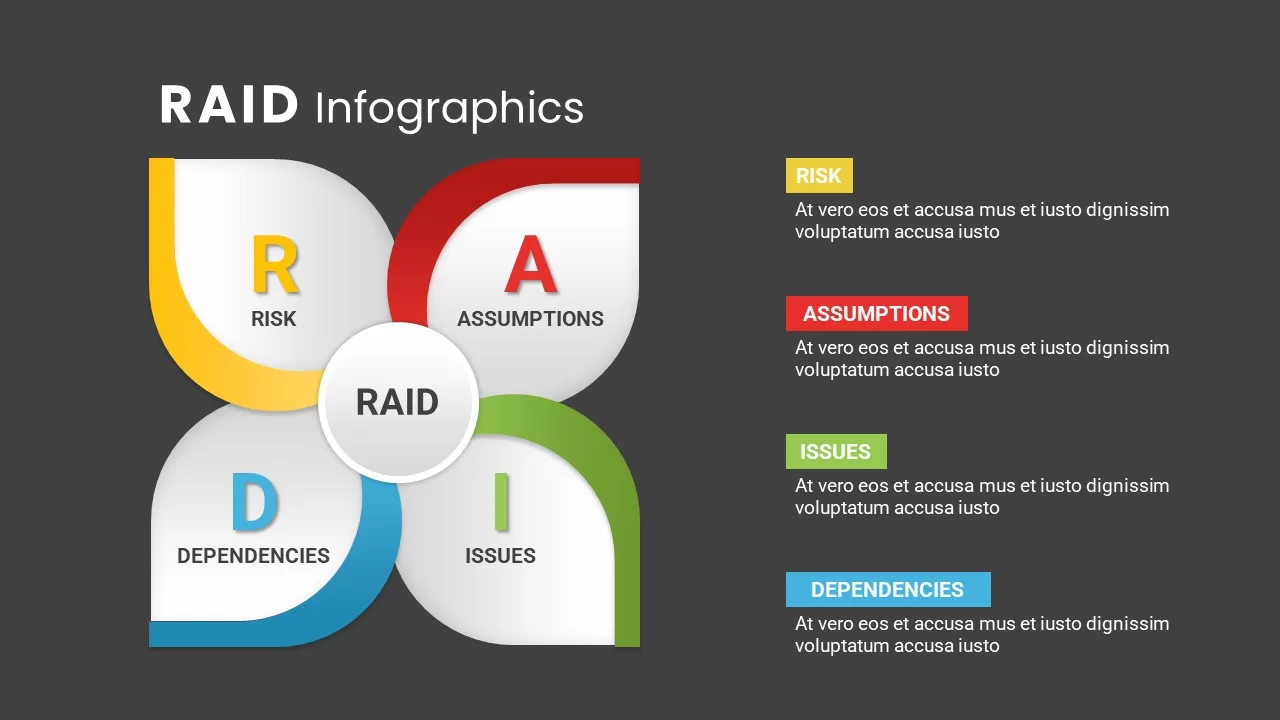
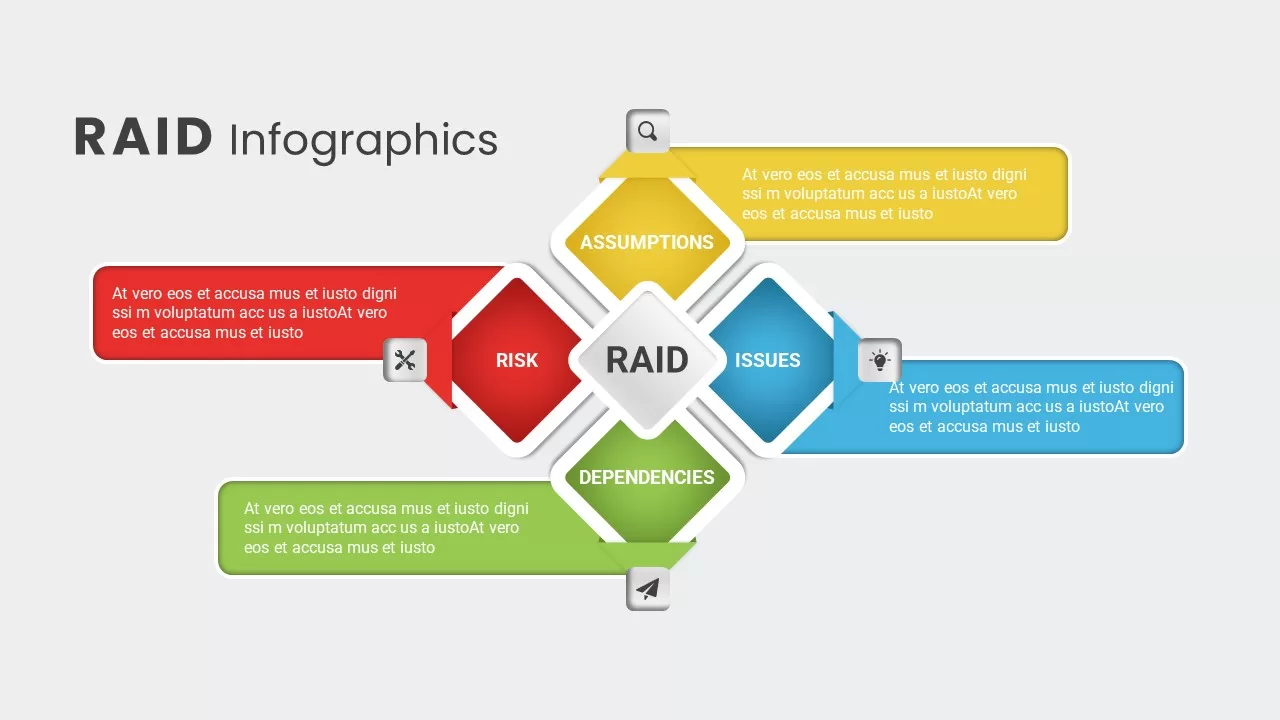
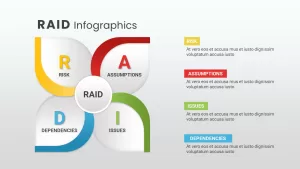
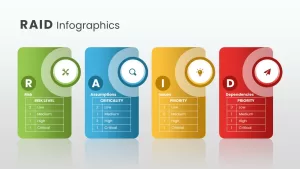
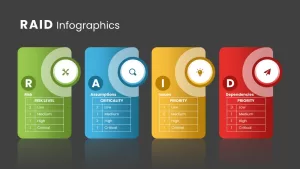
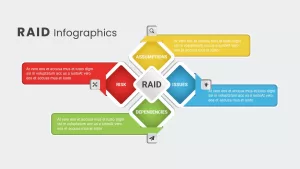
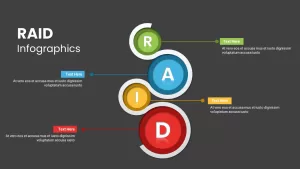
The RAID Infographics template is designed to visually represent the four key elements of the RAID analysis—Risk, Assumptions, Issues, and Dependencies. This template utilizes colorful icons and sleek design elements, each representing one of the elements in a circular or flow format. The distinct color coding (red for risk, yellow for assumptions, blue for issues, and green for dependencies) ensures clarity and ease of understanding.
This template is perfect for professionals in project management, risk assessment, or strategic planning. It can be used to illustrate and categorize various aspects of project analysis, allowing for efficient communication of complex information. Whether you are managing a project, conducting risk analysis, or outlining assumptions and dependencies, this template will allow you to present your data in an engaging and structured way.
The RAID Infographics template is fully customizable, enabling you to adapt it to your own needs, whether for presentations or strategic discussions. The clean design and vibrant colors help keep the content visually interesting and highly readable.
Who is it for
This template is ideal for project managers, risk analysts, strategic planners, and business consultants who need to assess and communicate risk, assumptions, issues, and dependencies in projects or organizational strategies. It is perfect for stakeholders involved in risk management, project management, and business analysis.
Other Uses
Apart from project management and risk analysis, this template can be used for tracking dependencies between tasks, identifying and managing project risks, formulating assumptions for decision-making processes, and resolving issues in project workflows. Additionally, it is useful for any team or organization looking to present complex information in a simple, clear, and organized format.
Login to download this file

Item ID
SB02264
Related Templates

Comprehensive RAID Log Slide Pack Template for PowerPoint & Google Slides
Project
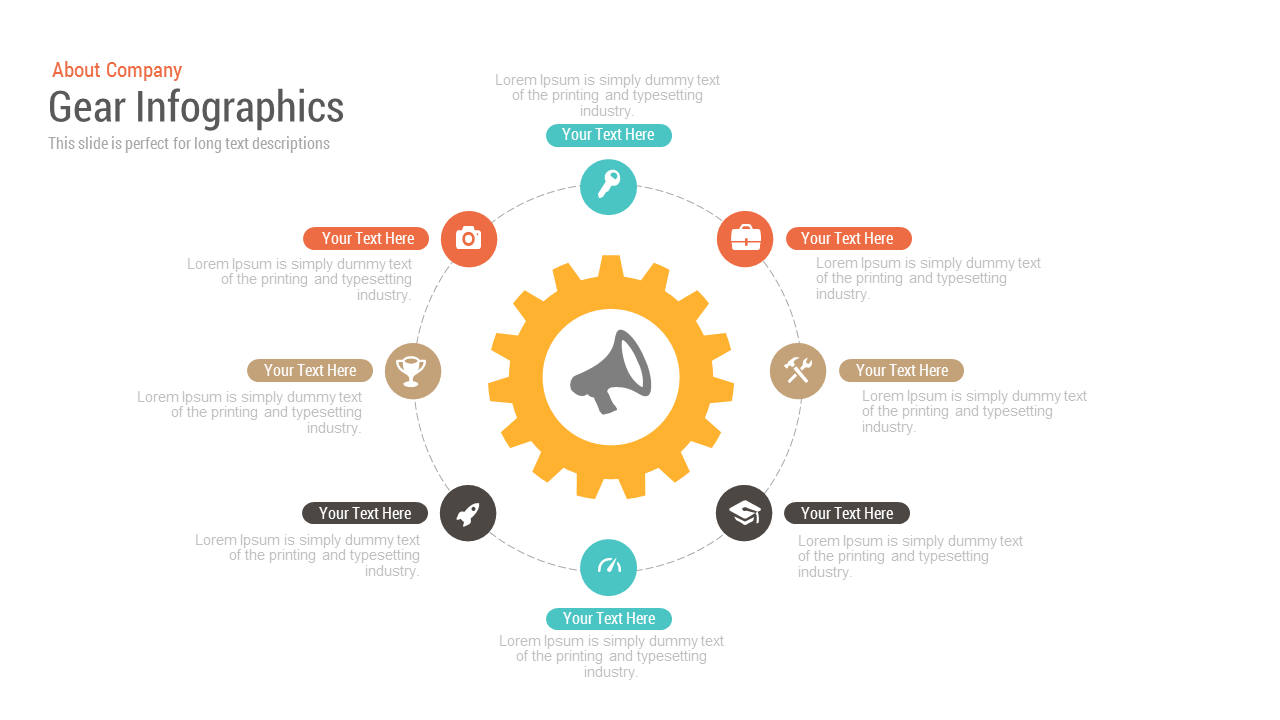
Free Gear Infographics template for PowerPoint & Google Slides
Process
Free
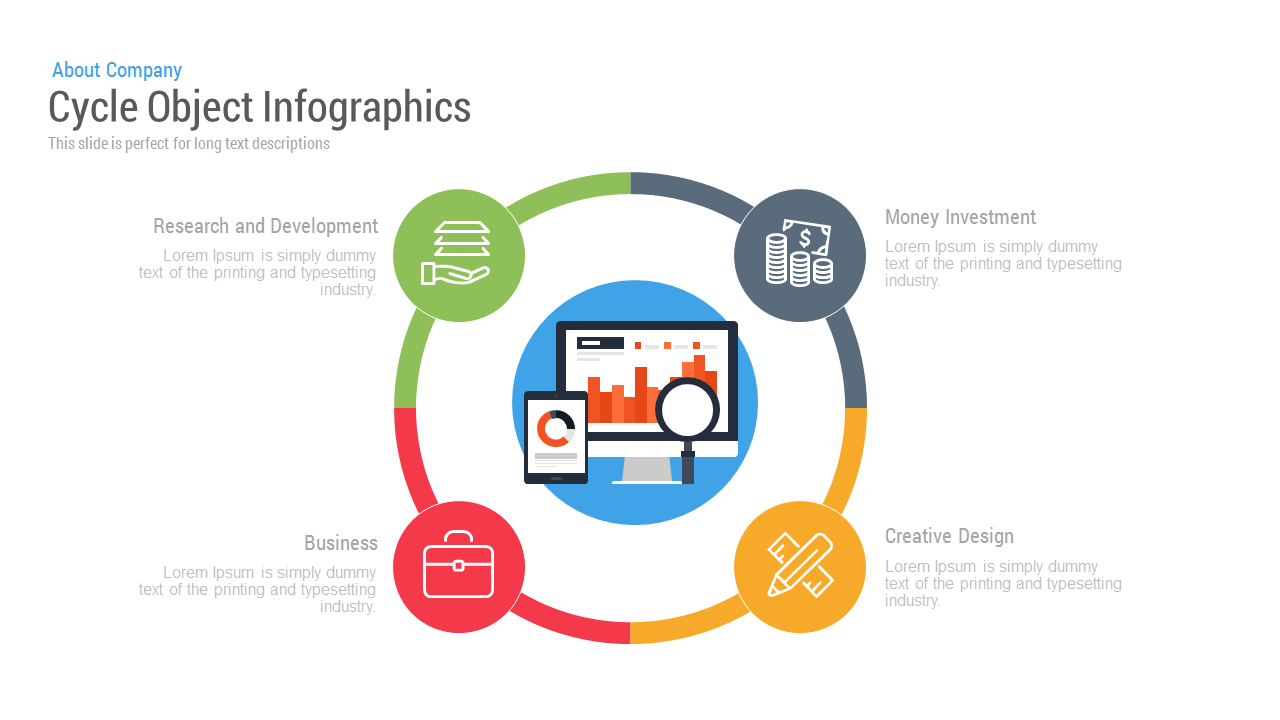
Free Cycle Object Infographics template for PowerPoint & Google Slides
Process
Free
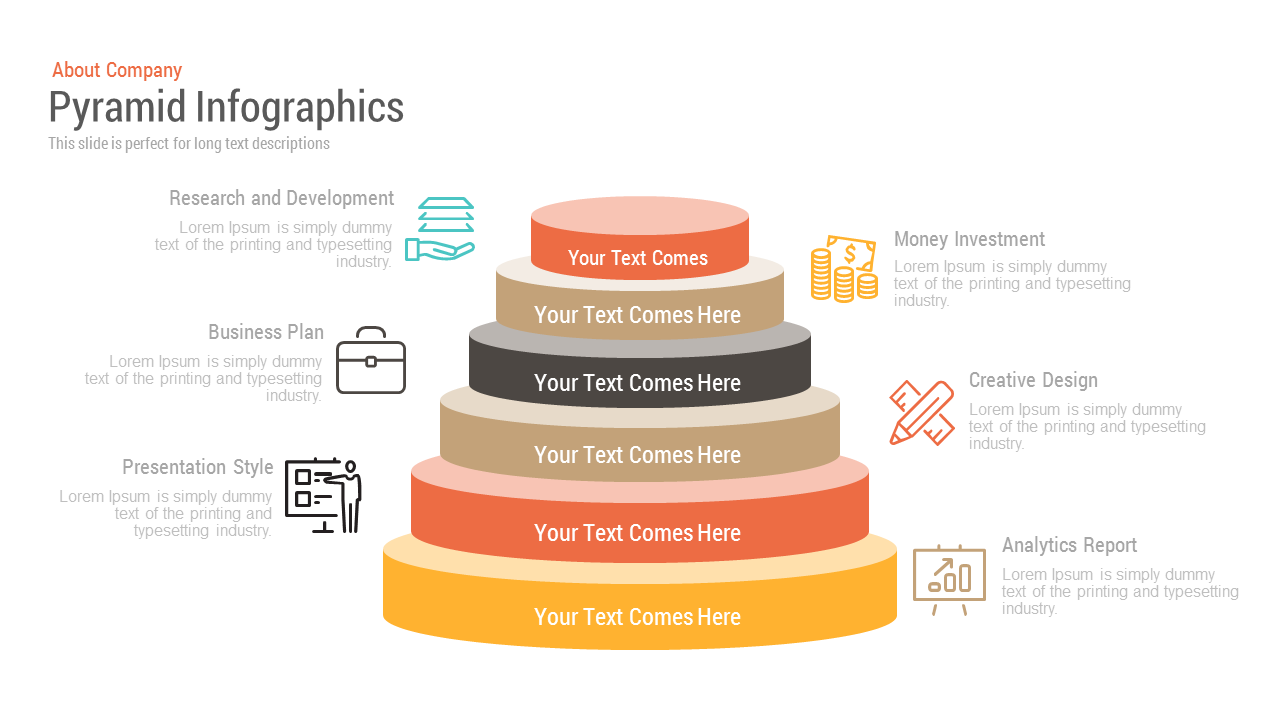
Free Pyramid Infographics template for PowerPoint & Google Slides
Pyramid
Free
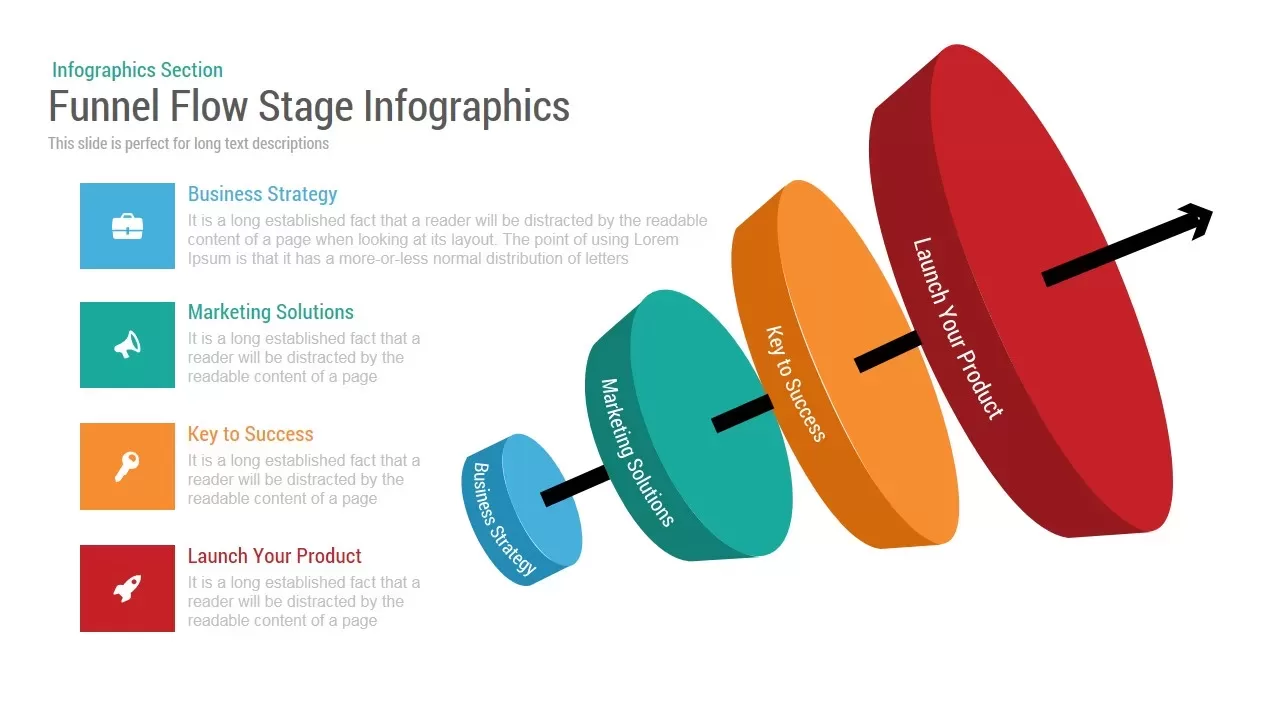
Funnel Flow Stage Infographics template for PowerPoint & Google Slides
Funnel
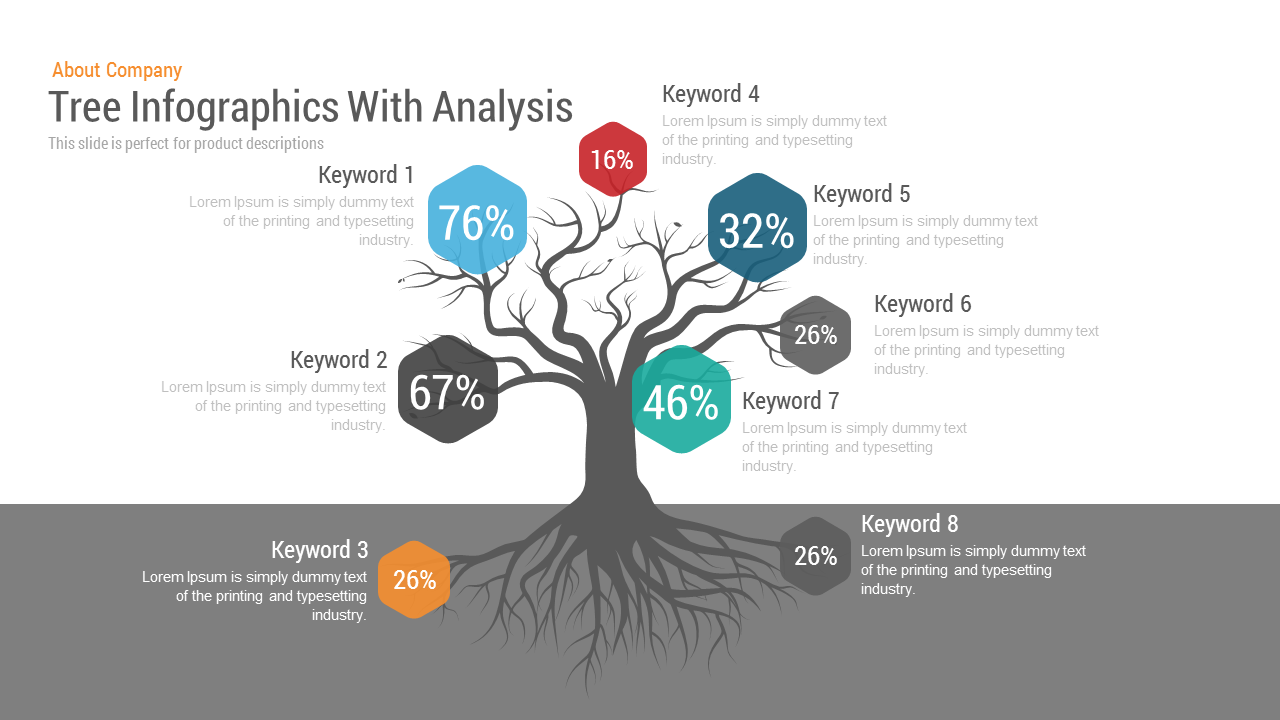
Tree Infographics template for PowerPoint & Google Slides
Decision Tree
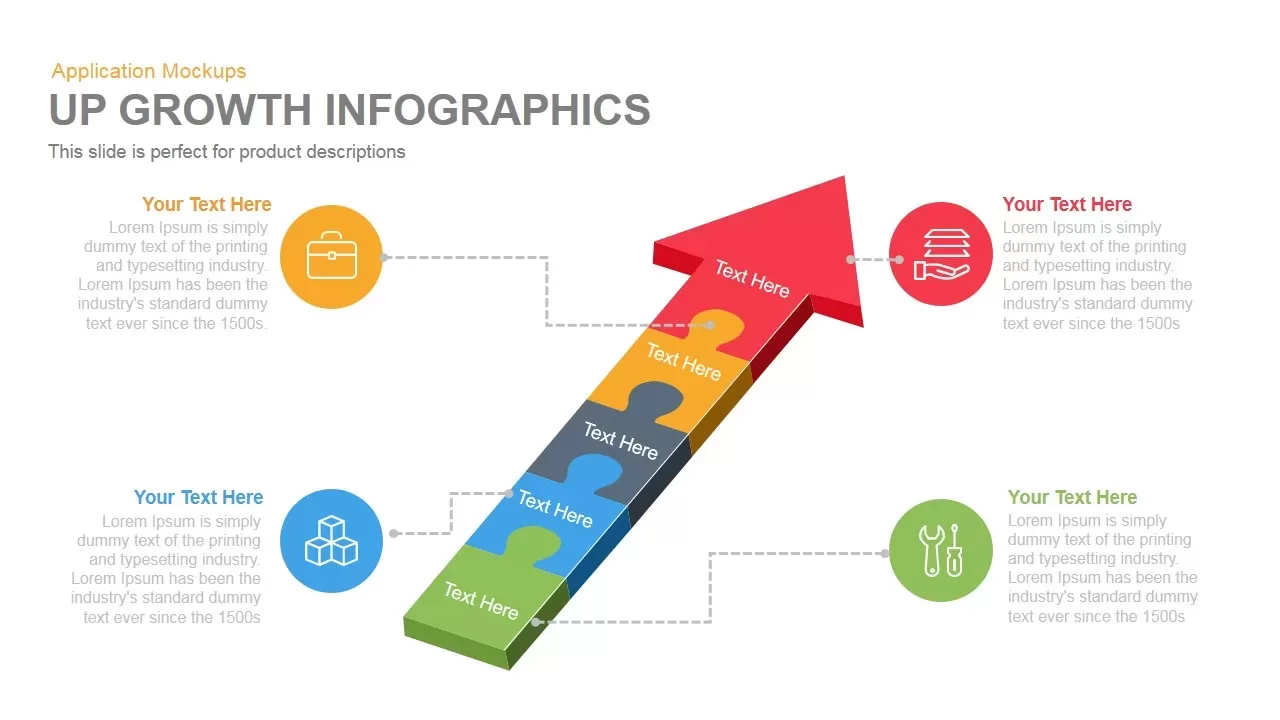
Growth Infographics template for PowerPoint & Google Slides
Arrow
Arrow Infographics template for PowerPoint & Google Slides
Infographics
3D Arrow Infographics Circular Flow Template for PowerPoint & Google Slides
Arrow
3D Bar Chart Data Infographics Template for PowerPoint & Google Slides
Bar/Column
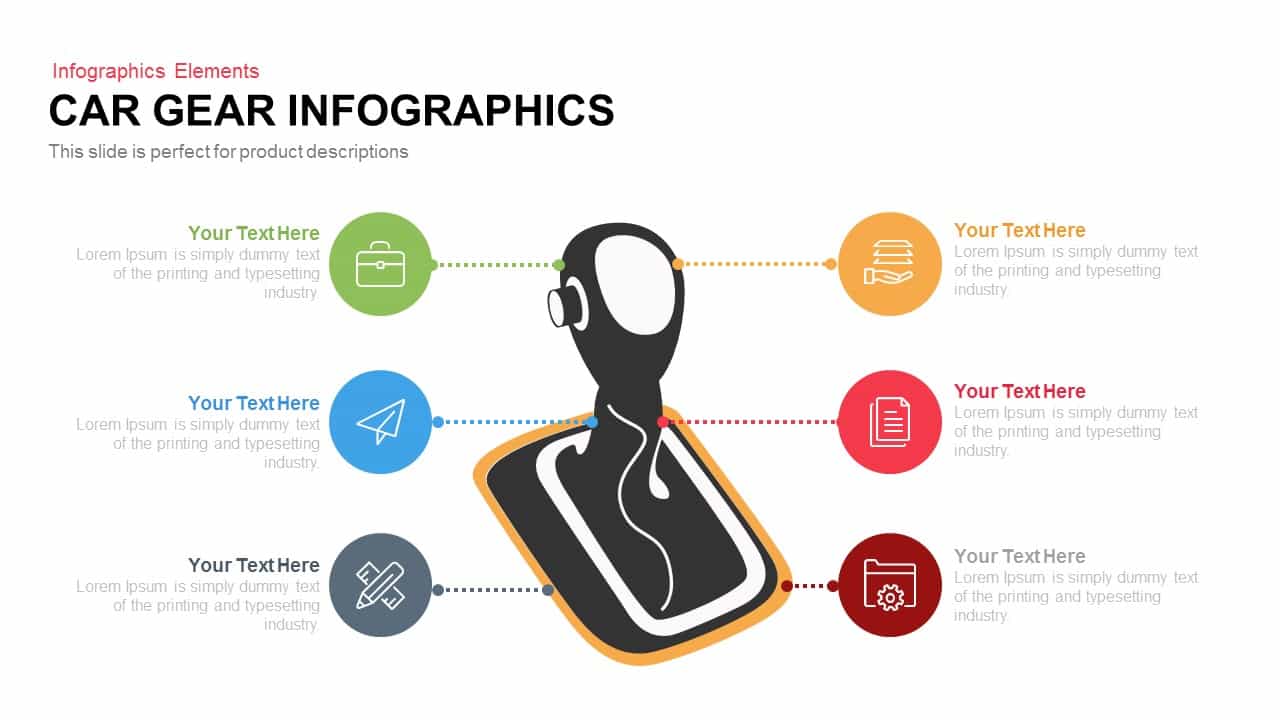
Car Gear Infographics Template for PowerPoint & Google Slides
Infographics
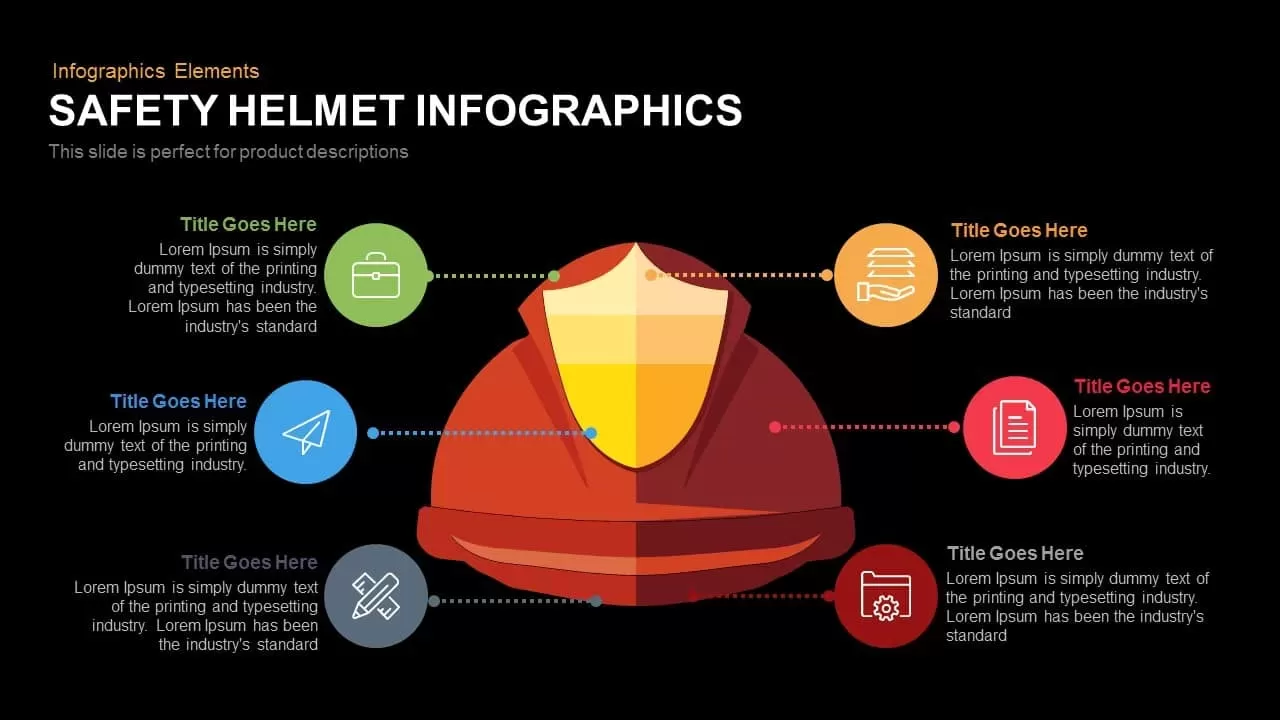
Safety Helmet Infographics Template for PowerPoint & Google Slides
Infographics
5-Stage Arrow Infographics Process Flow Template for PowerPoint & Google Slides
Arrow
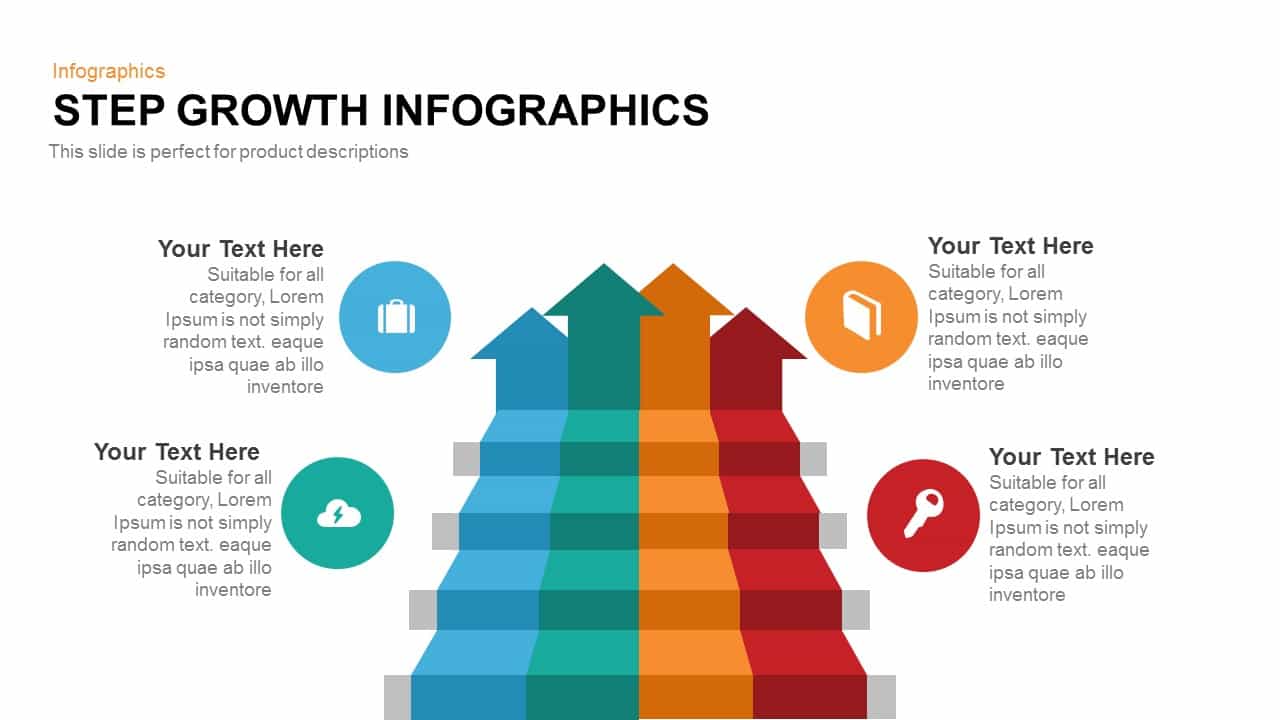
Modern Step Growth Infographics Template for PowerPoint & Google Slides
Process
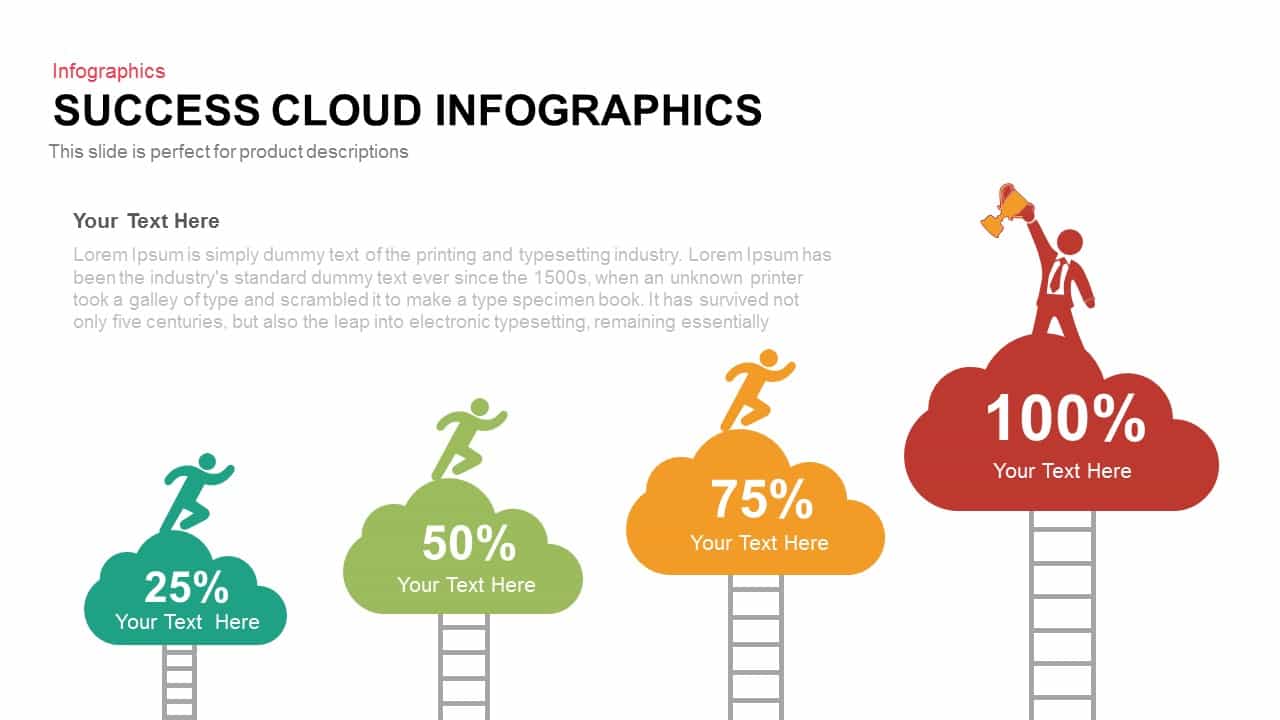
Success Cloud Progress Infographics Template for PowerPoint & Google Slides
Charts
Four Swoosh Arrow Infographics template for PowerPoint & Google Slides
Arrow

Dynamic Circle Timeline Infographics template for PowerPoint & Google Slides
Timeline

Arrow Step Infographics Workflow Template for PowerPoint & Google Slides
Arrow
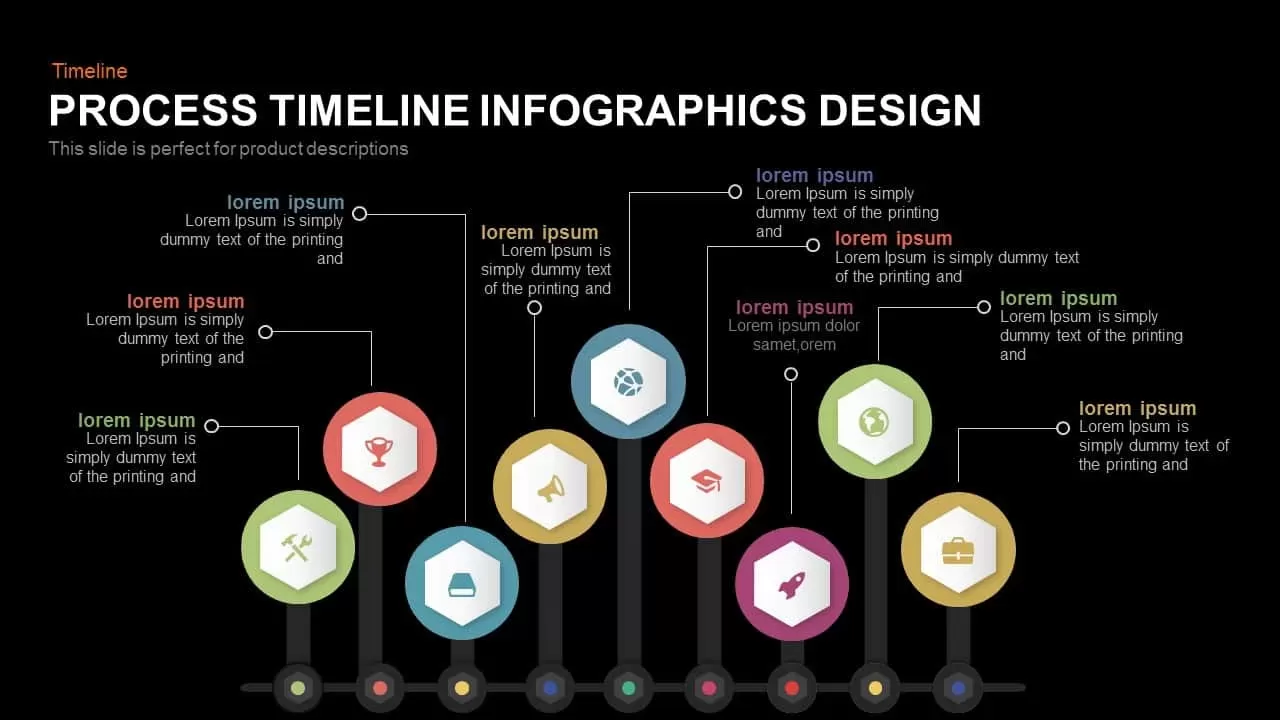
Process Timeline Infographics Design template for PowerPoint & Google Slides
Timeline
9 Process Stage Infographics template for PowerPoint & Google Slides
Process
Cloud Computing Infographics template for PowerPoint & Google Slides
Cloud Computing
Square Circulation Infographics Template for PowerPoint & Google Slides
Process
Six-Step Infographics Template for PowerPoint & Google Slides
Process

Modern 9-Section Circle Infographics Template for PowerPoint & Google Slides
Circular
Eight-Segment 3D Arrow Infographics Template for PowerPoint & Google Slides
Arrow
3D Four-Directional Arrow Infographics Template for PowerPoint & Google Slides
Arrow
Five-Stage Arrow Infographics Timeline Template for PowerPoint & Google Slides
Arrow
Five-Stage Pyramid Infographics Diagram Template for PowerPoint & Google Slides
Pyramid
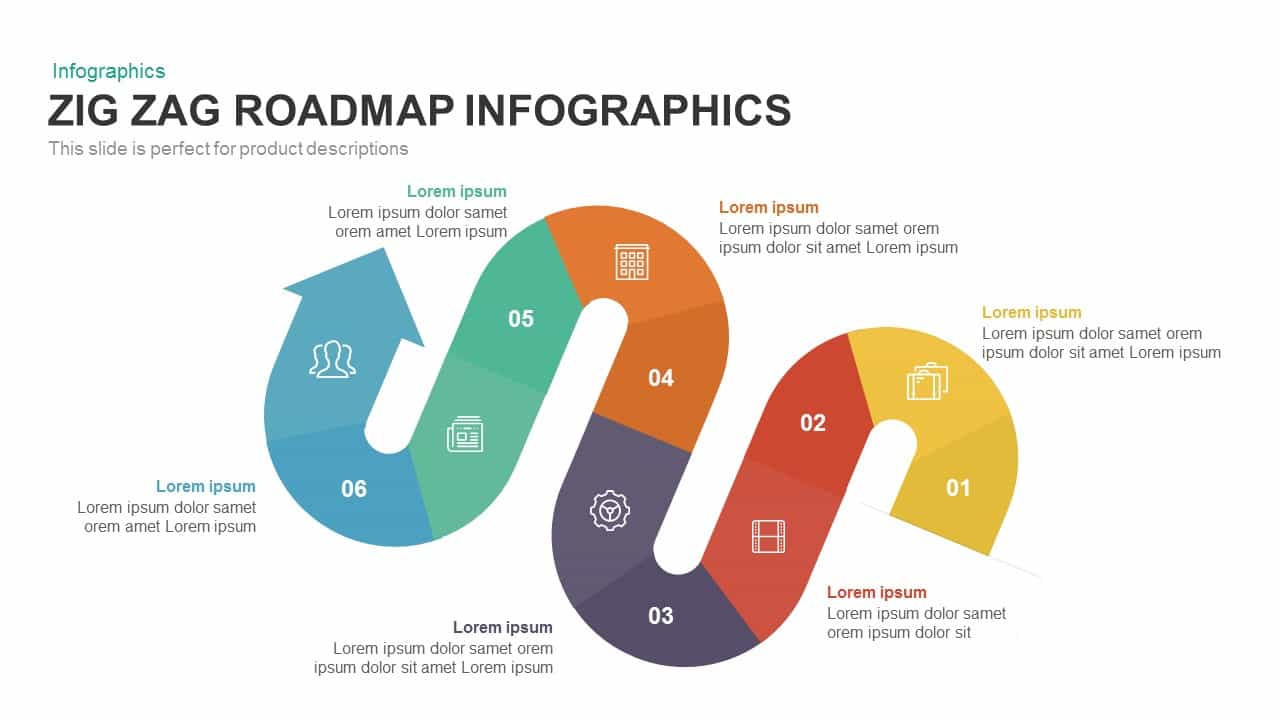
Six-Stage Zig-Zag Roadmap Infographics Template for PowerPoint & Google Slides
Roadmap
Timeline Arrow Infographics Diagram Template for PowerPoint & Google Slides
Timeline
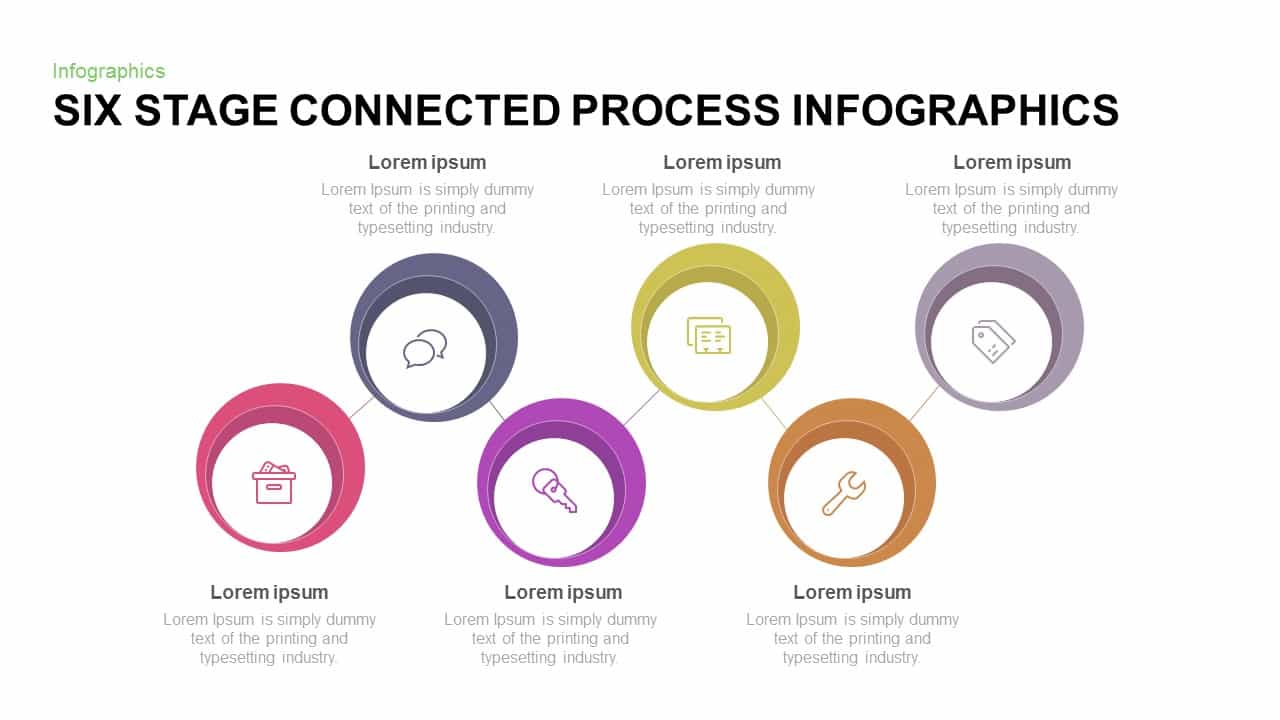
Six-Stage Connected Process Infographics Template for PowerPoint & Google Slides
Process
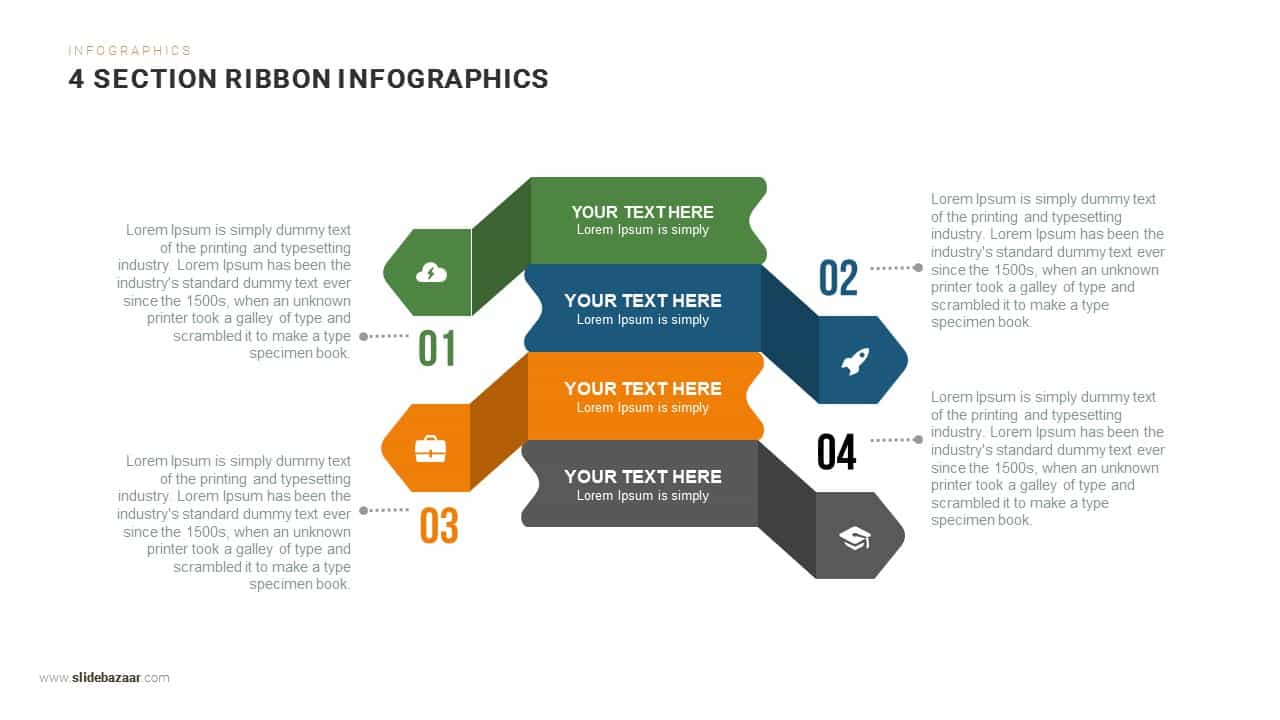
Four-Section Ribbon Infographics Template for PowerPoint & Google Slides
Process
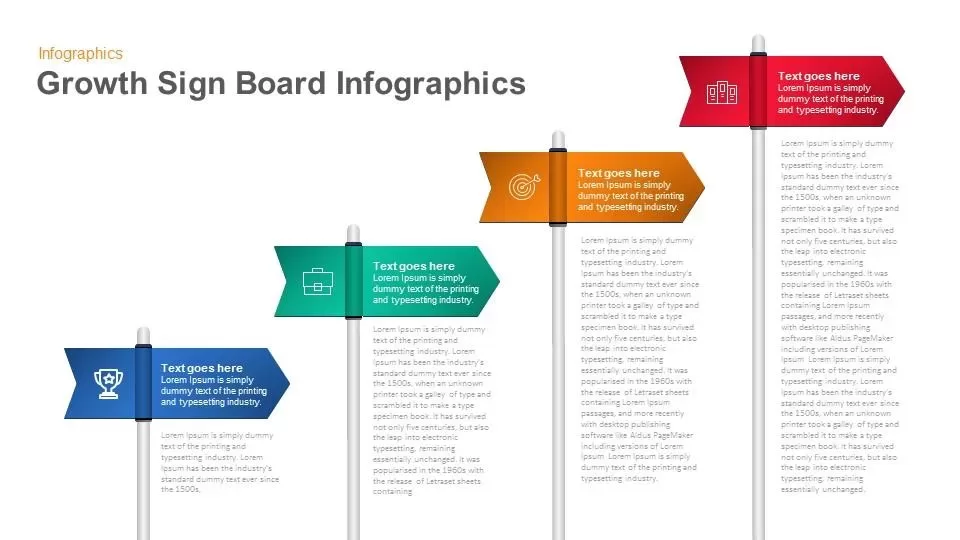
Growth Sign Board Infographics template for PowerPoint & Google Slides
Timeline
Triangle Process Infographics template for PowerPoint & Google Slides
Process
Layer Infographics template for PowerPoint & Google Slides
Process
Ribbon Infographics Step-by-Step Process Template for PowerPoint & Google Slides
Process
Business Roadmap Infographics template for PowerPoint & Google Slides
Roadmap
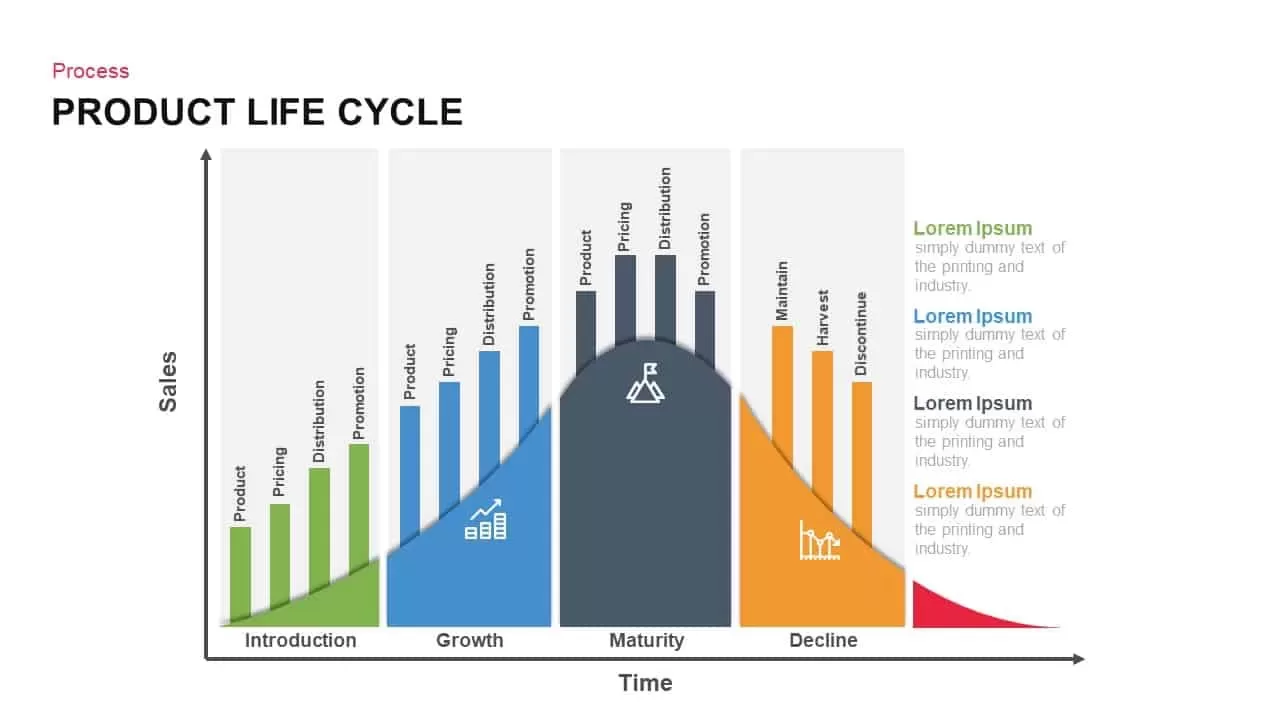
Product Life Cycle Infographics template for PowerPoint & Google Slides
Business
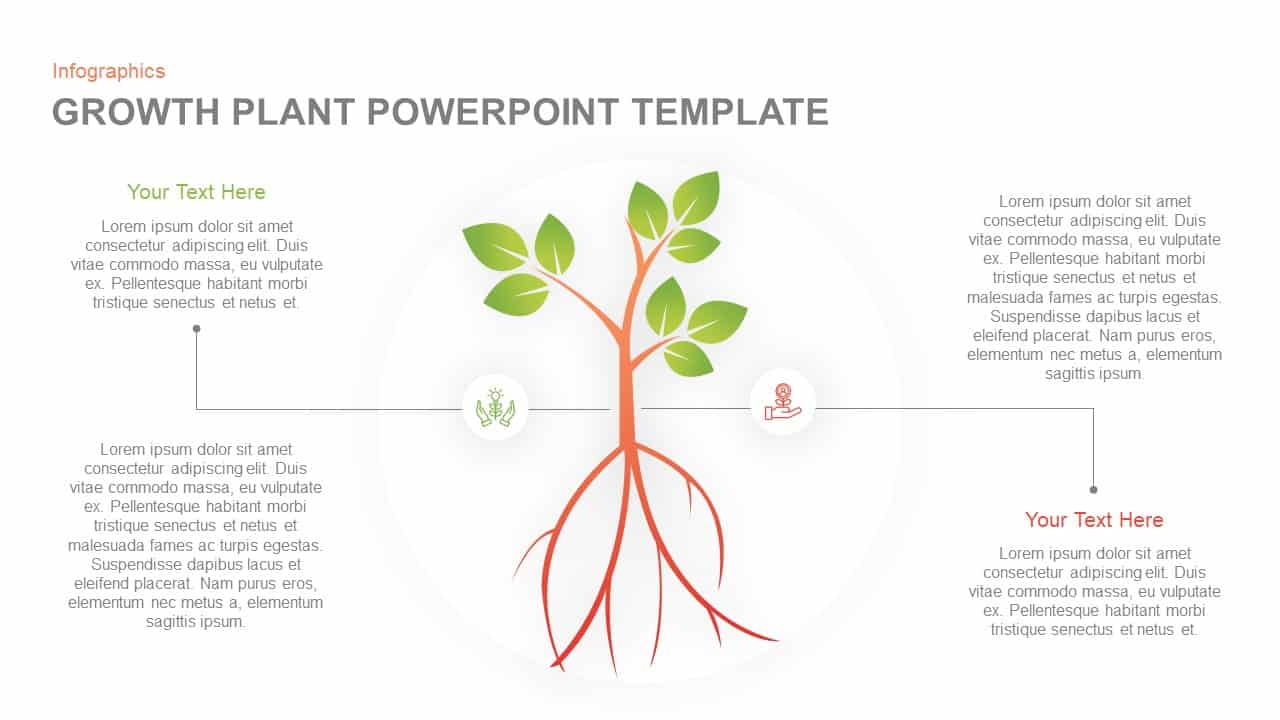
Growth Plant Infographics template for PowerPoint & Google Slides
Process
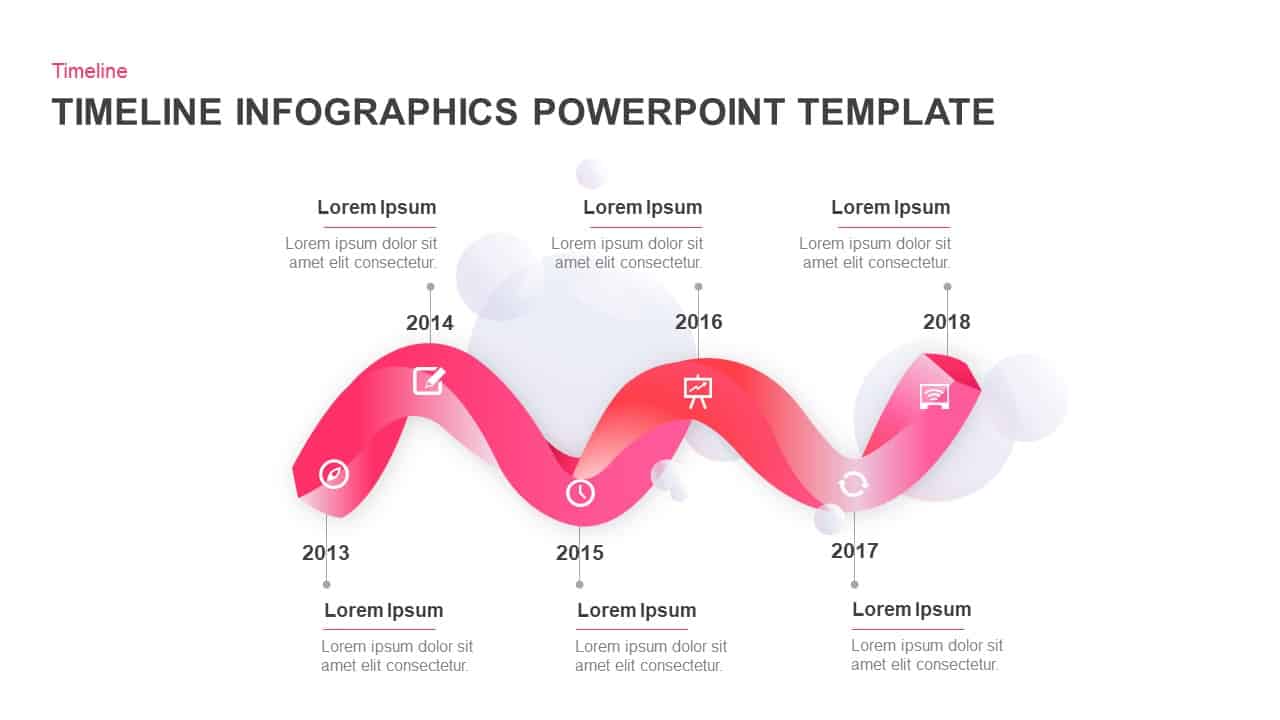
Wavy Ribbon Timeline Infographics Template for PowerPoint & Google Slides
Timeline
Venn Diagram Infographics Pack Template for PowerPoint & Google Slides
Circular
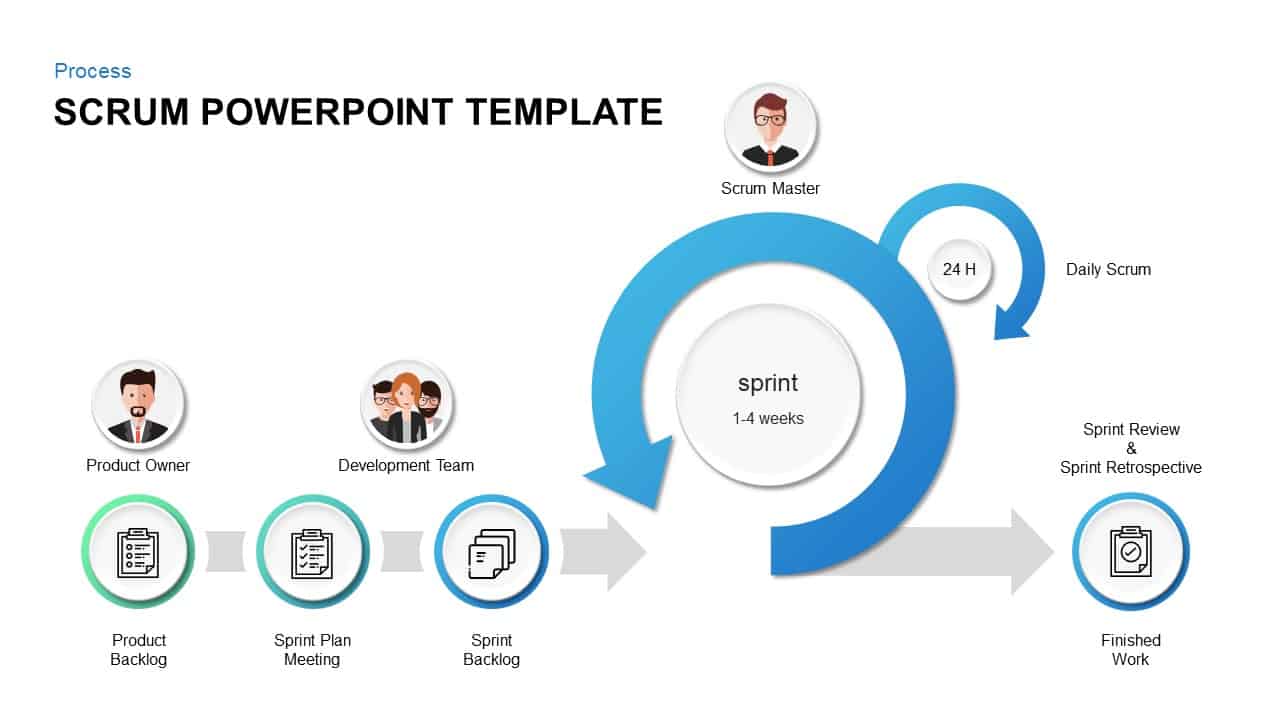
Comprehensive Scrum Infographics Pack Template for PowerPoint & Google Slides
Scrum
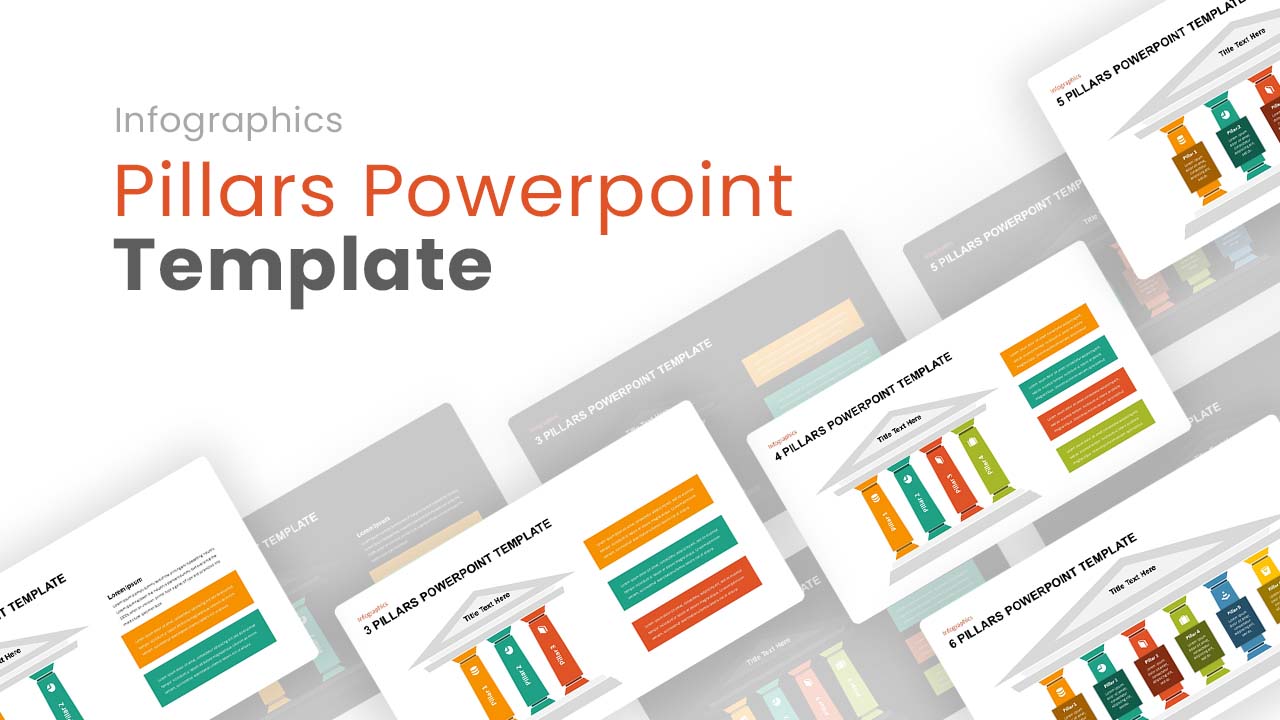
Editable Pillars Infographics Pack Template for PowerPoint & Google Slides
Infographics
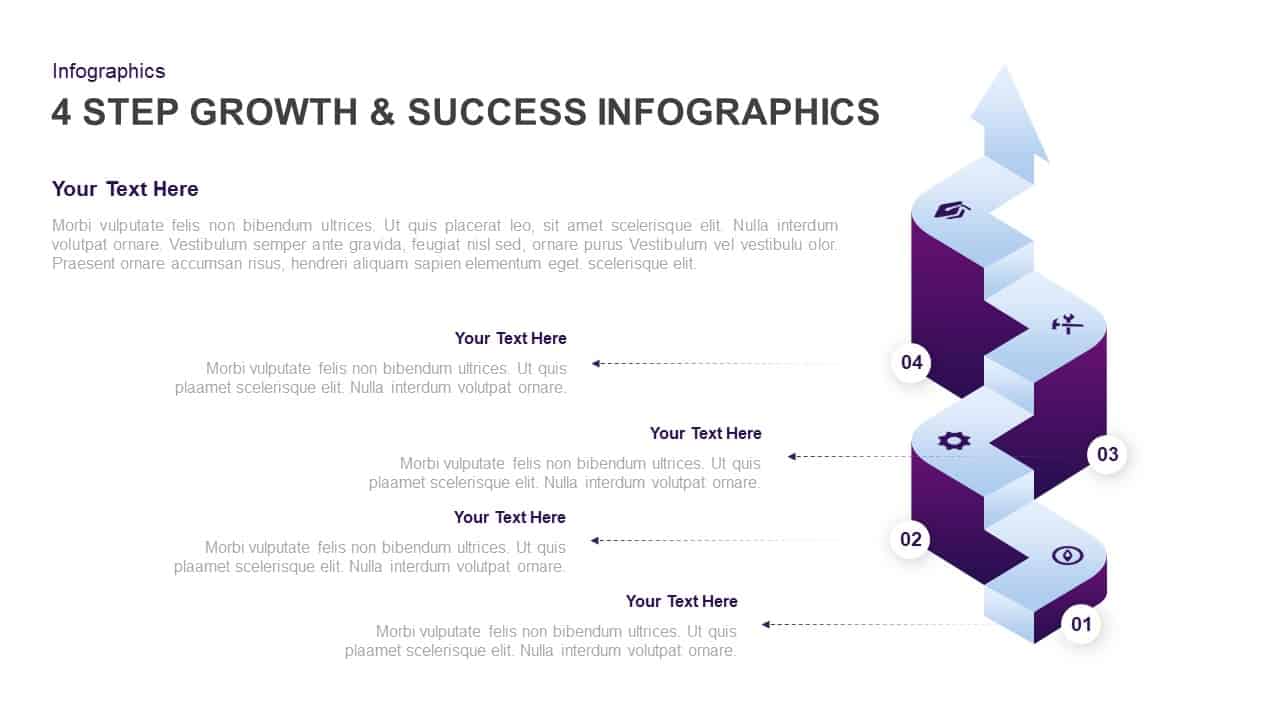
4-Step Growth & Success Infographics Template for PowerPoint & Google Slides
Accomplishment
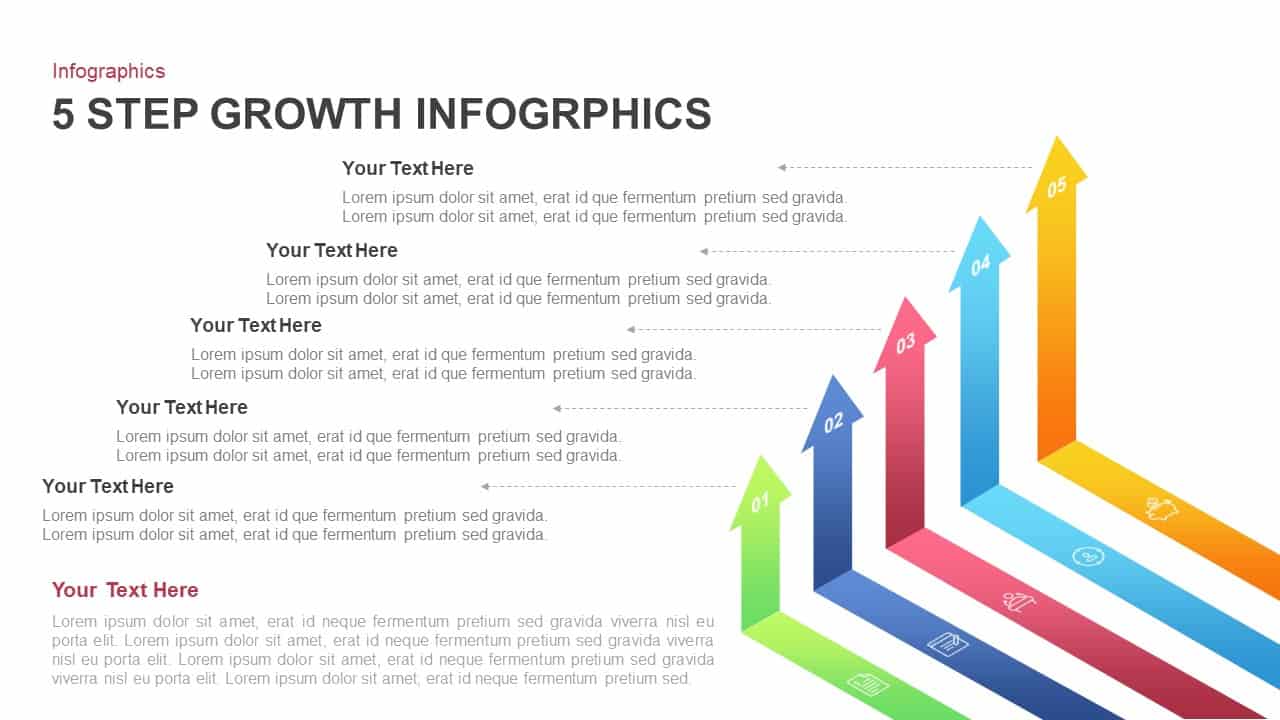
5-Step Growth Arrow Infographics Template for PowerPoint & Google Slides
Arrow
Colorful Venn Diagram Infographics Template for PowerPoint & Google Slides
Circular
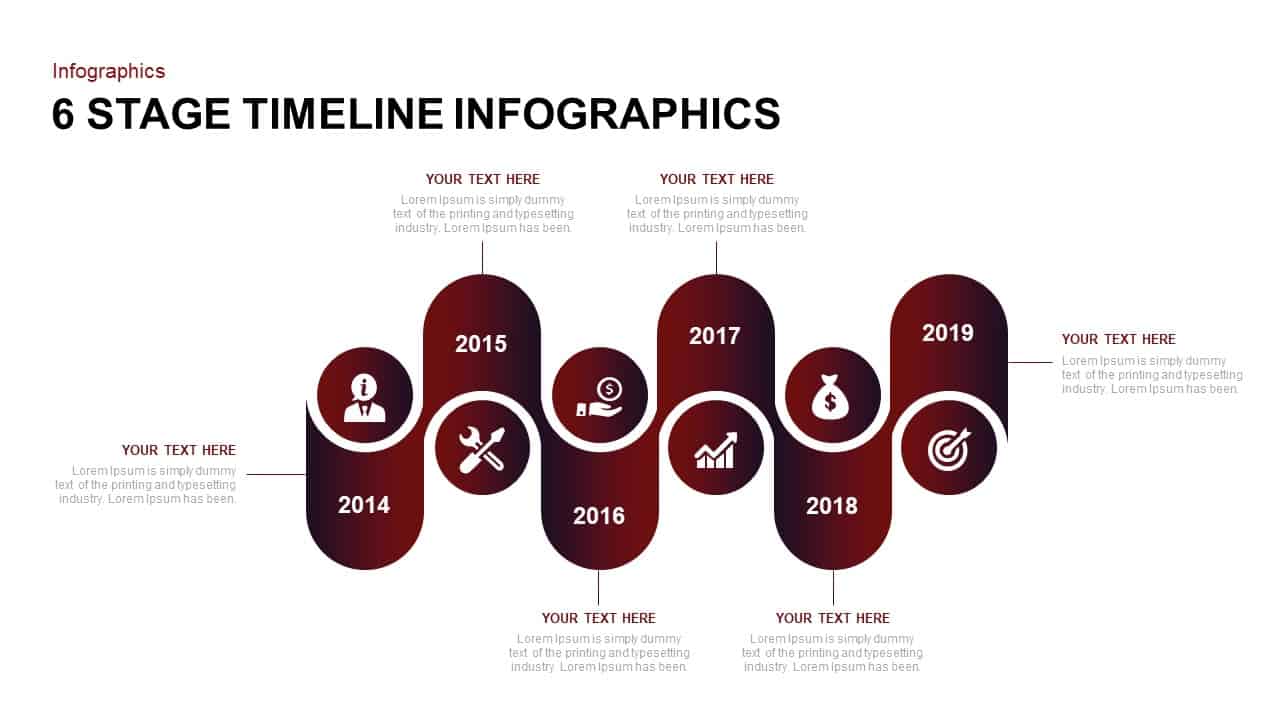
Six-Stage Timeline Infographics Slide Template for PowerPoint & Google Slides
Timeline
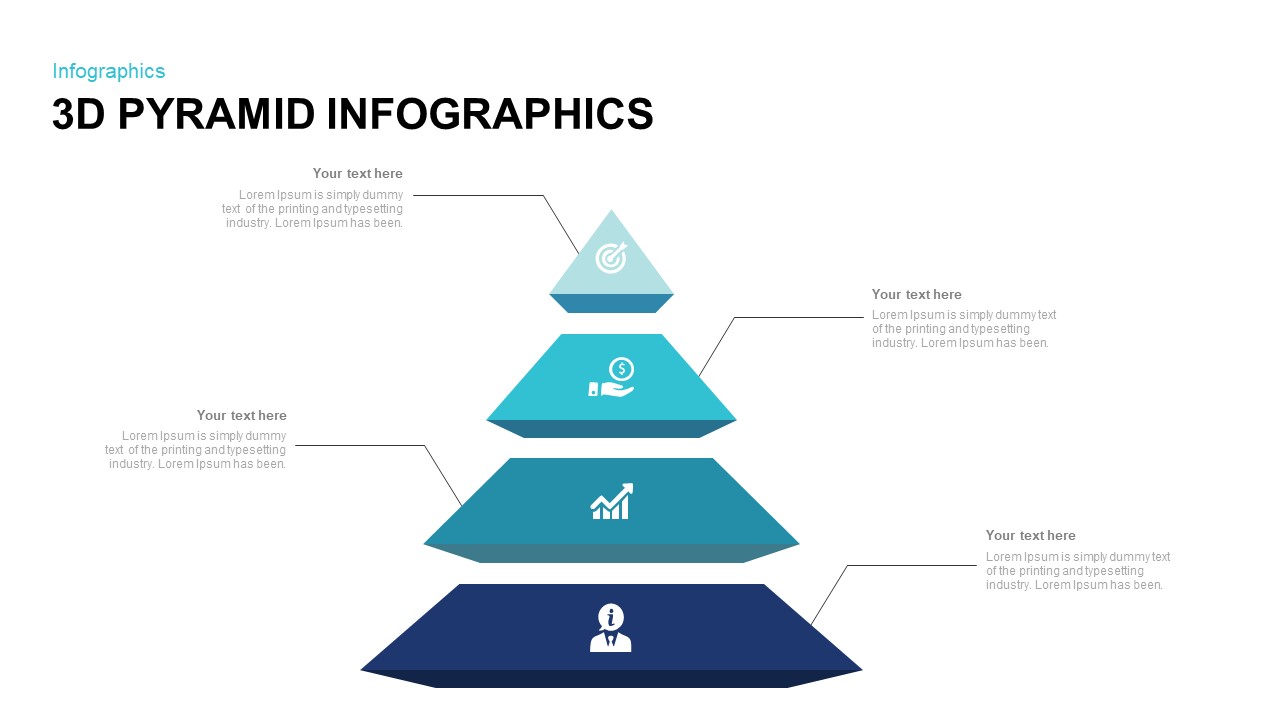
3D Pyramid Infographics Slide Template for PowerPoint & Google Slides
Pyramid
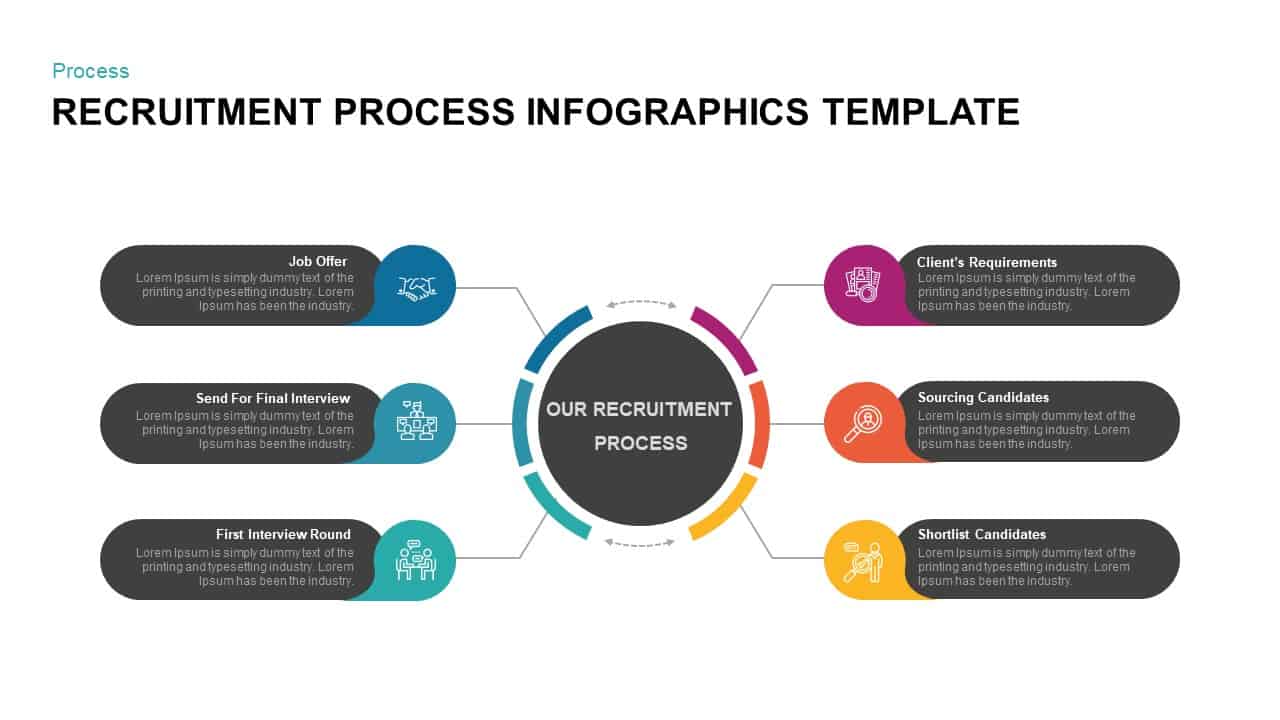
Recruitment Process Infographics Template for PowerPoint & Google Slides
Process
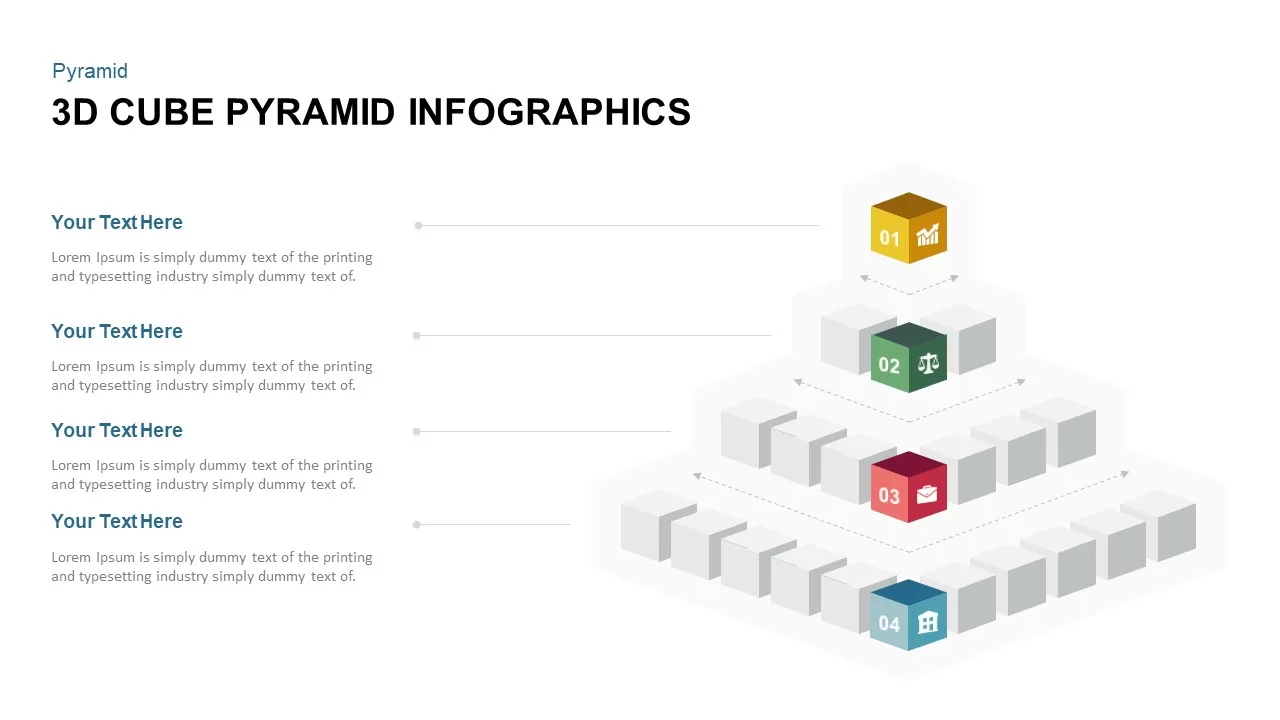
3D Cube Pyramid Infographics Slide Template for PowerPoint & Google Slides
Pyramid
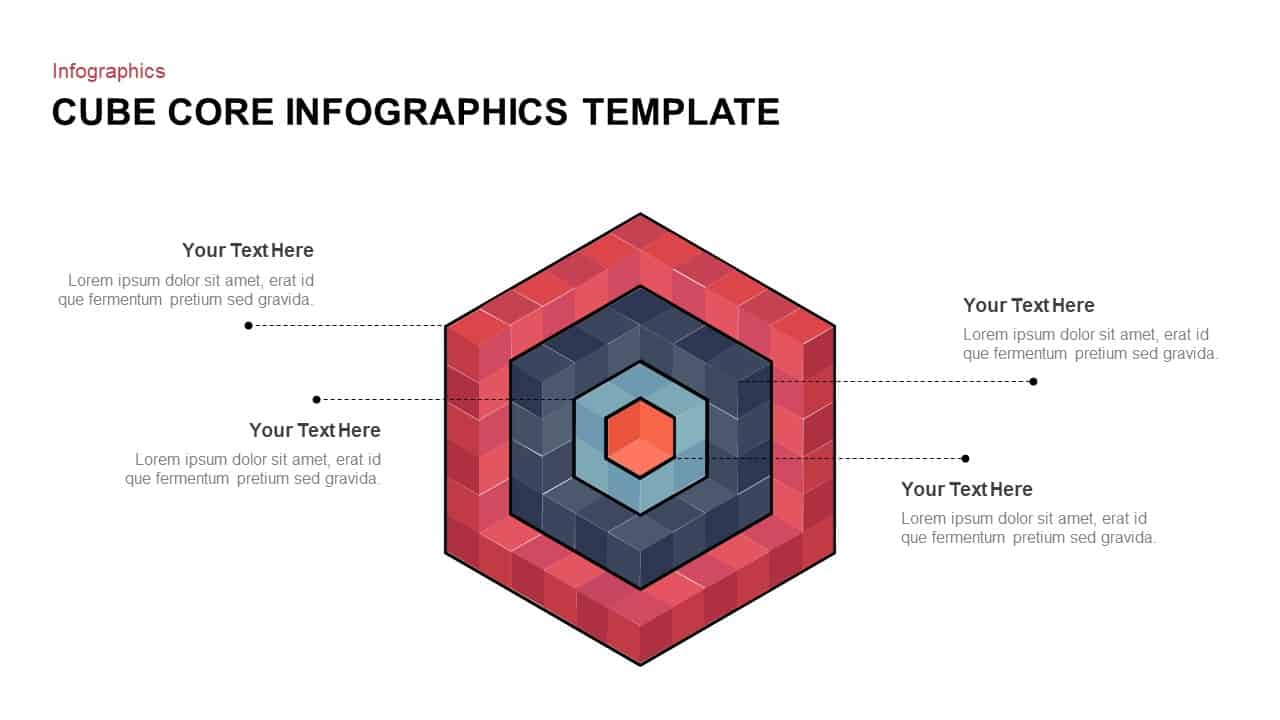
Cube Core Infographics Template for PowerPoint & Google Slides
Process
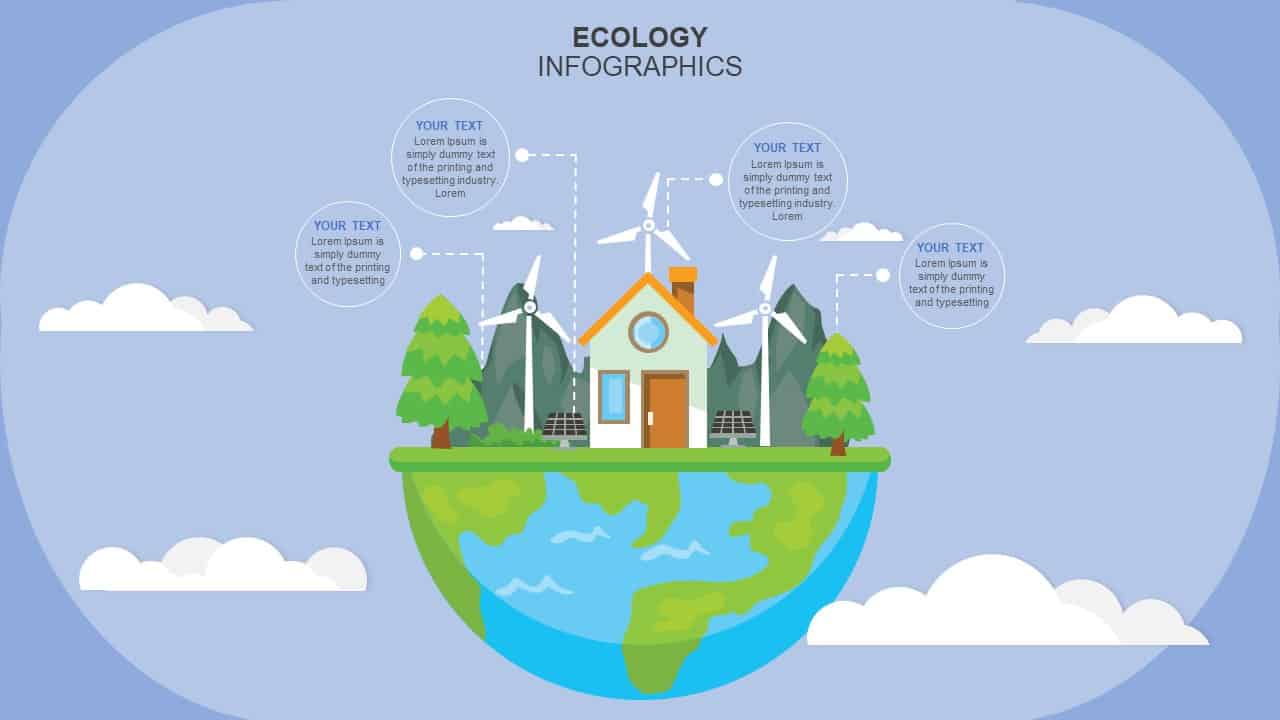
Ecology Infographics Overview template for PowerPoint & Google Slides
Business Proposal
Four Section Diagram Infographics template for PowerPoint & Google Slides
Process
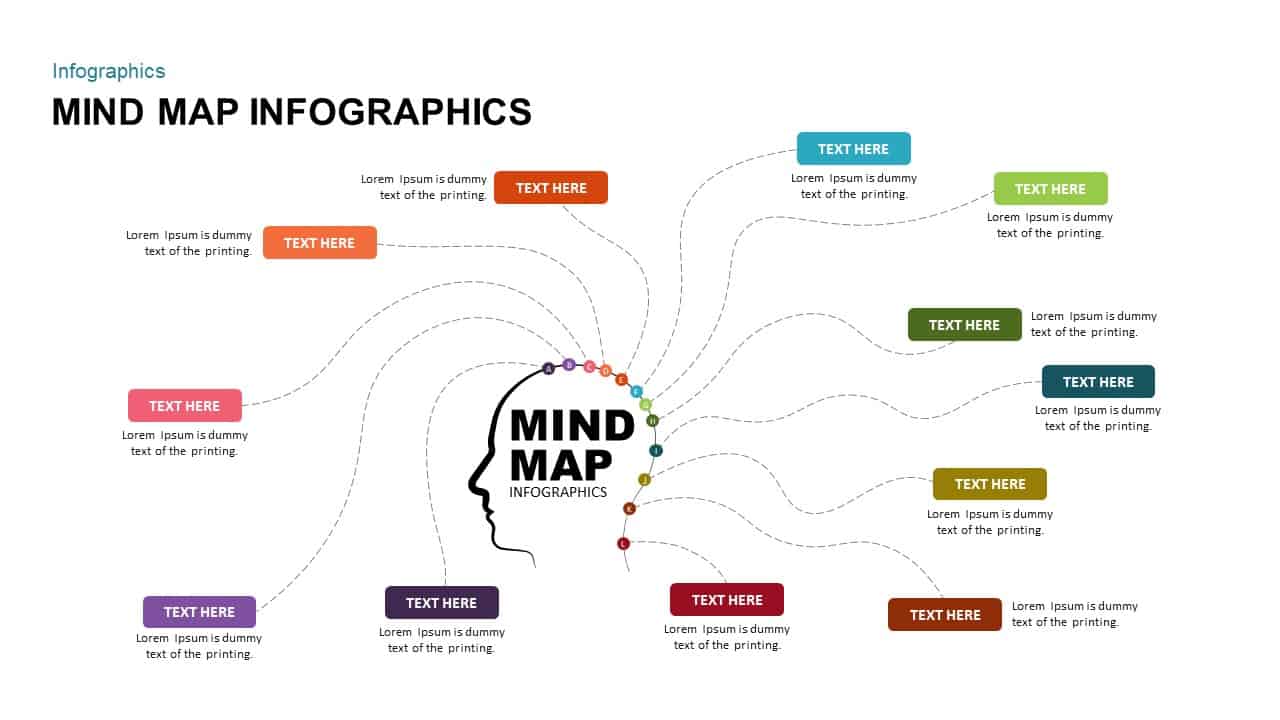
Mind Map Infographics template for PowerPoint & Google Slides
Mind Maps

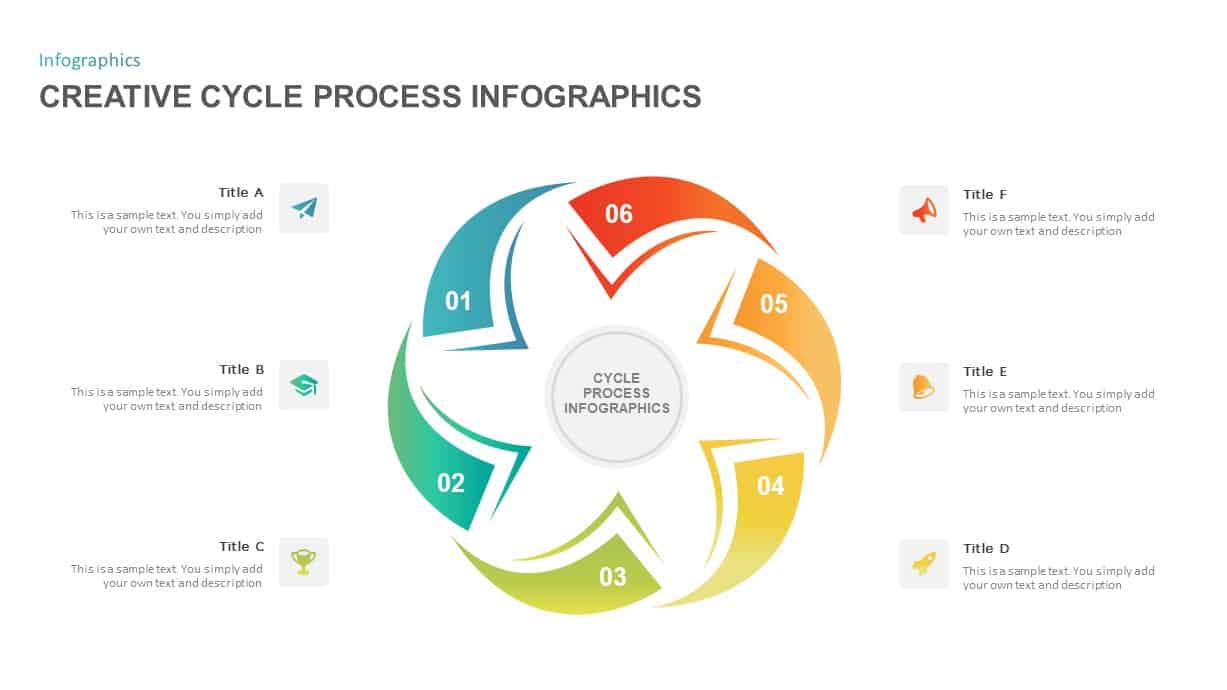
Creative Cycle Process Infographics Template for PowerPoint & Google Slides
Process
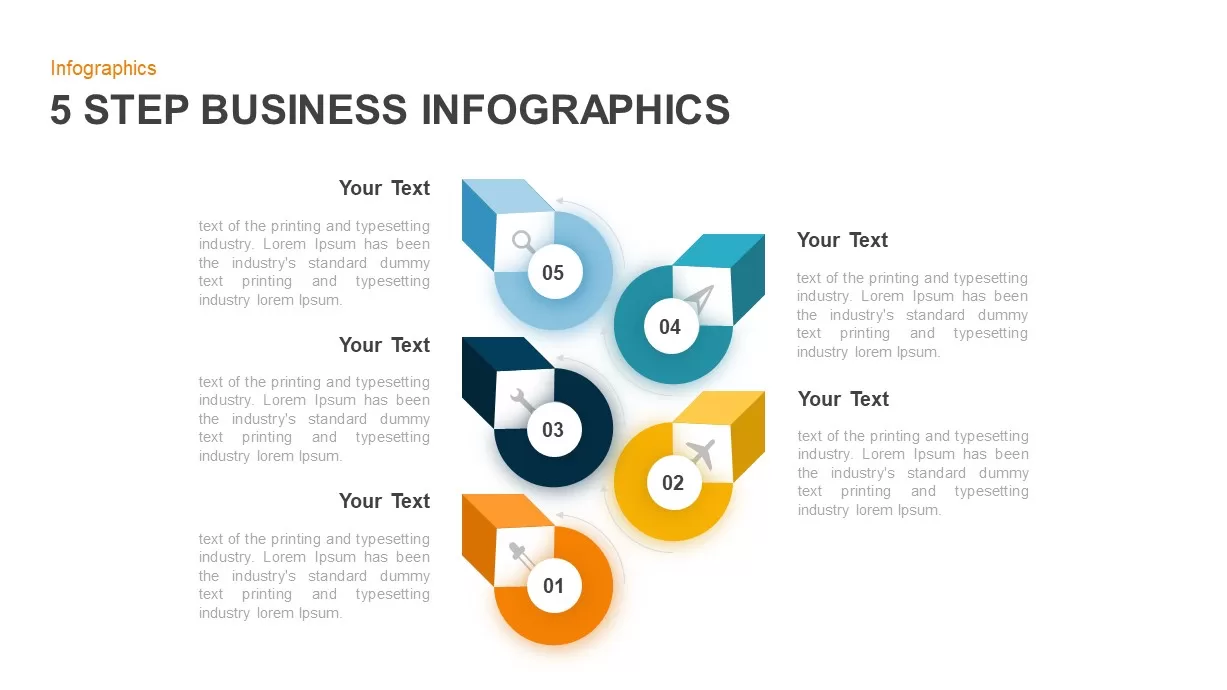
Five-Step Business Infographics Template for PowerPoint & Google Slides
Infographics
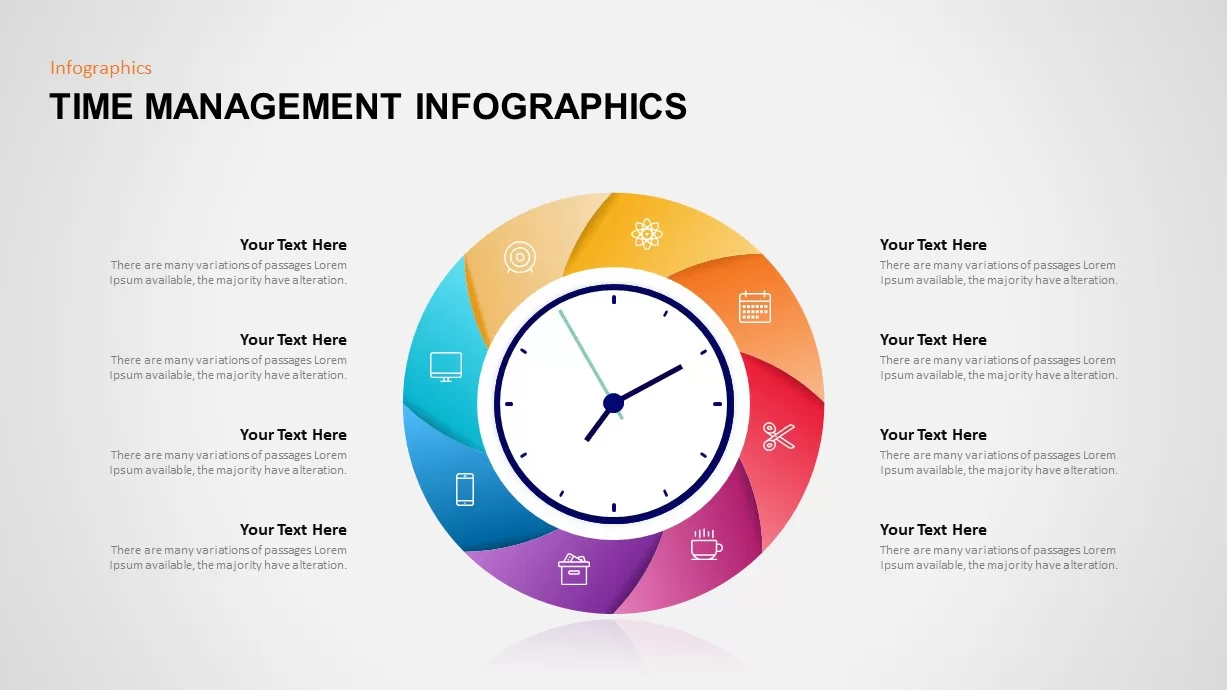
Time Management Infographics Template for PowerPoint & Google Slides
Process
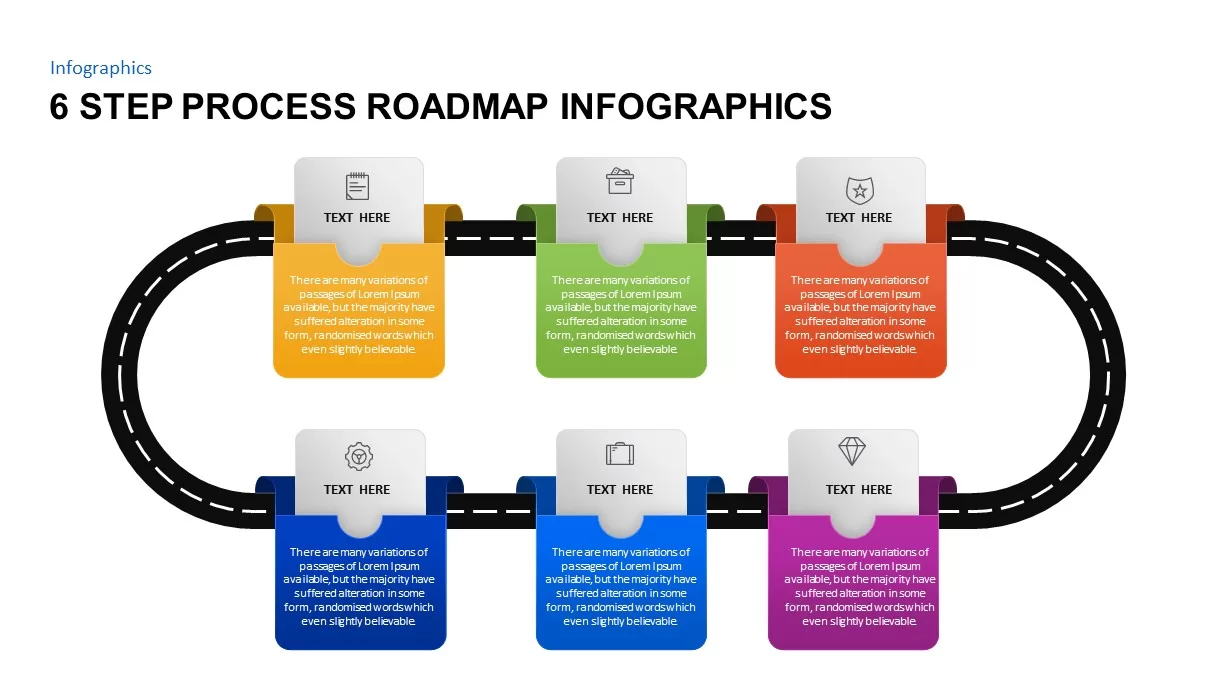
6 Step Process Roadmap Infographics Template for PowerPoint & Google Slides
Roadmap
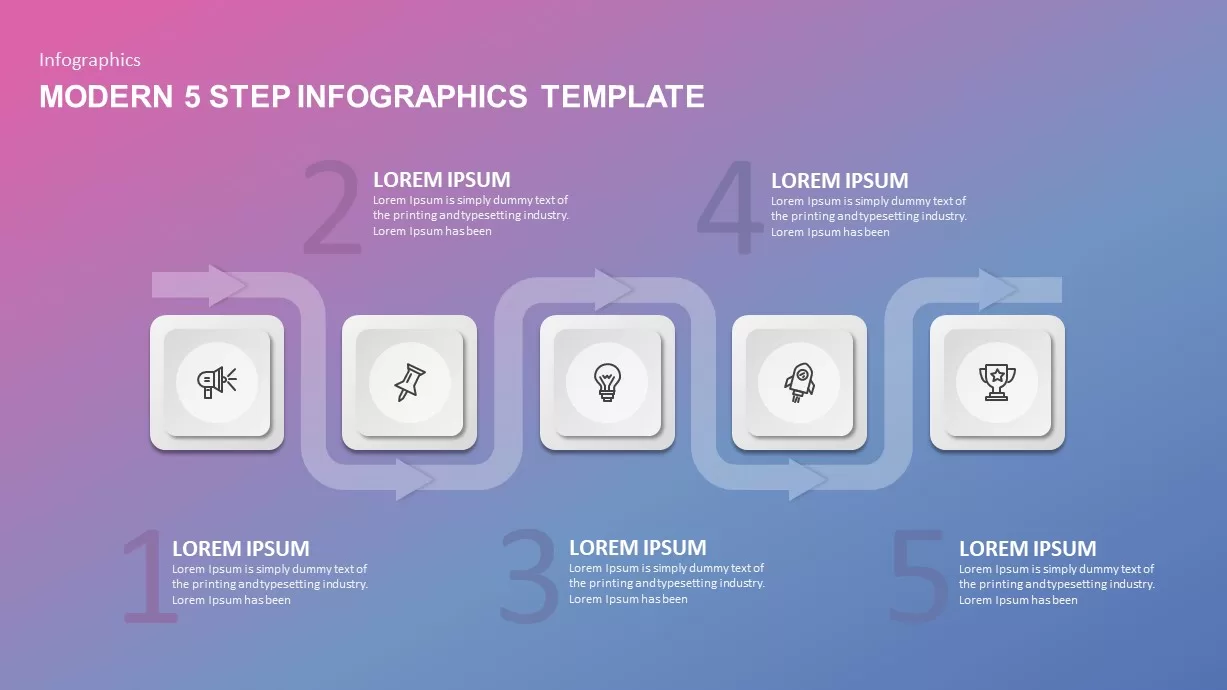
Modern 5-Step Flow Infographics Template for PowerPoint & Google Slides
Process
Four-Step Circular Process Infographics Template for PowerPoint & Google Slides
Circular
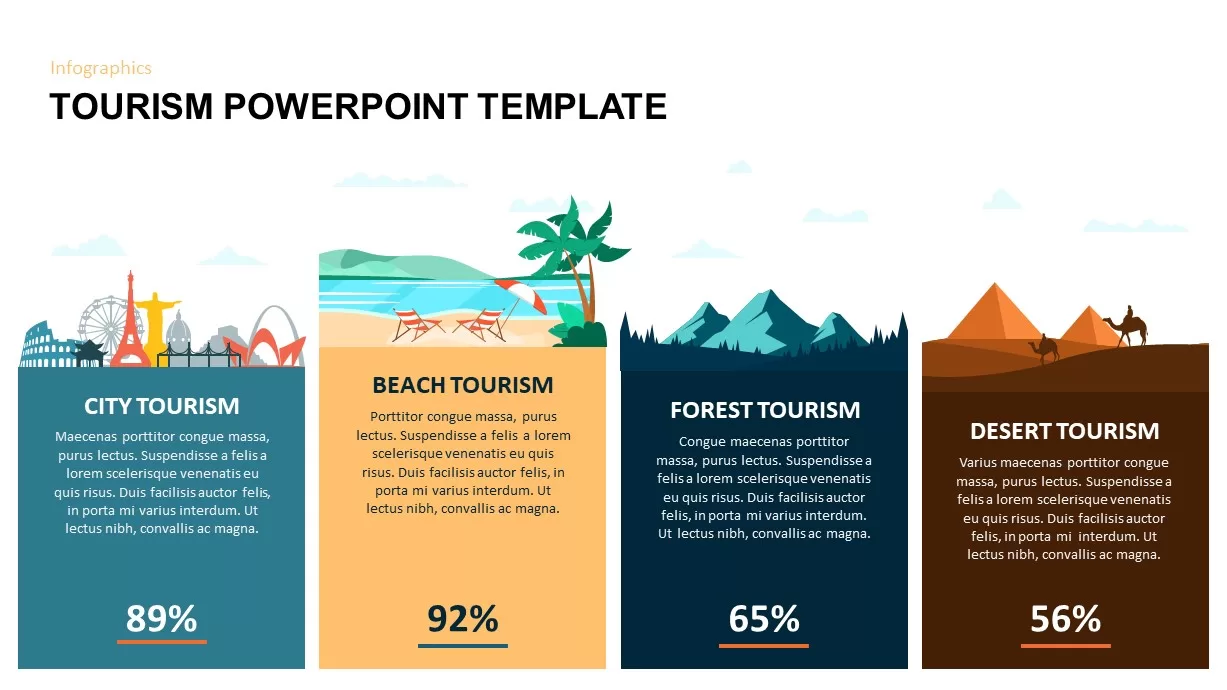
Comparative Tourism Infographics Template for PowerPoint & Google Slides
Comparison
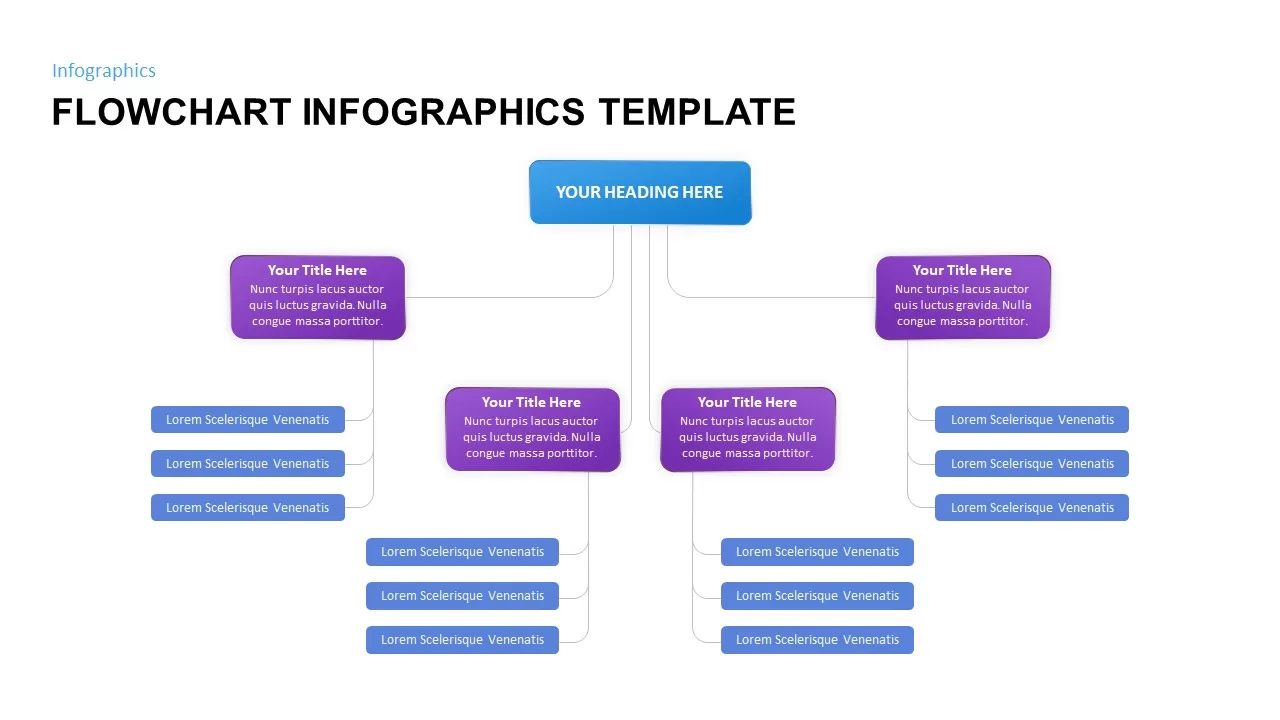
Flowchart Infographics Template for PowerPoint & Google Slides
Infographics
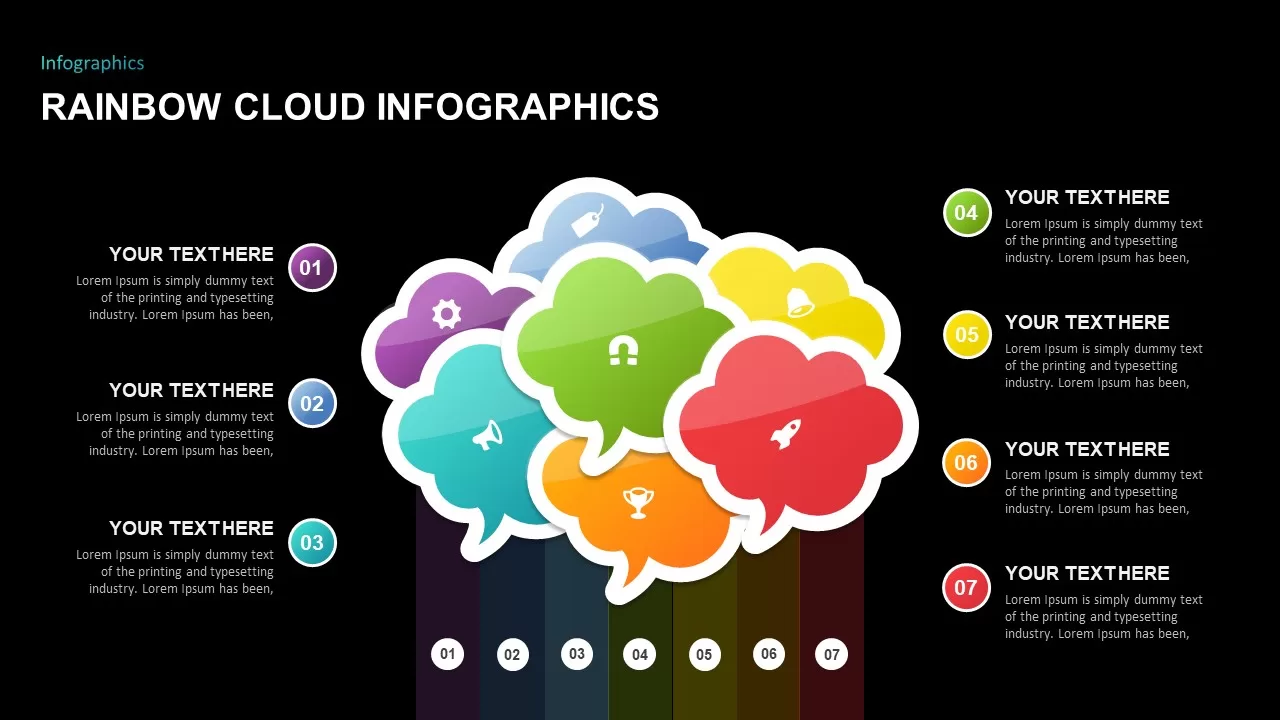
Rainbow Cloud Infographics Diagram Template for PowerPoint & Google Slides
Process
Medical Infographics Data Visualization Template for PowerPoint & Google Slides
Health
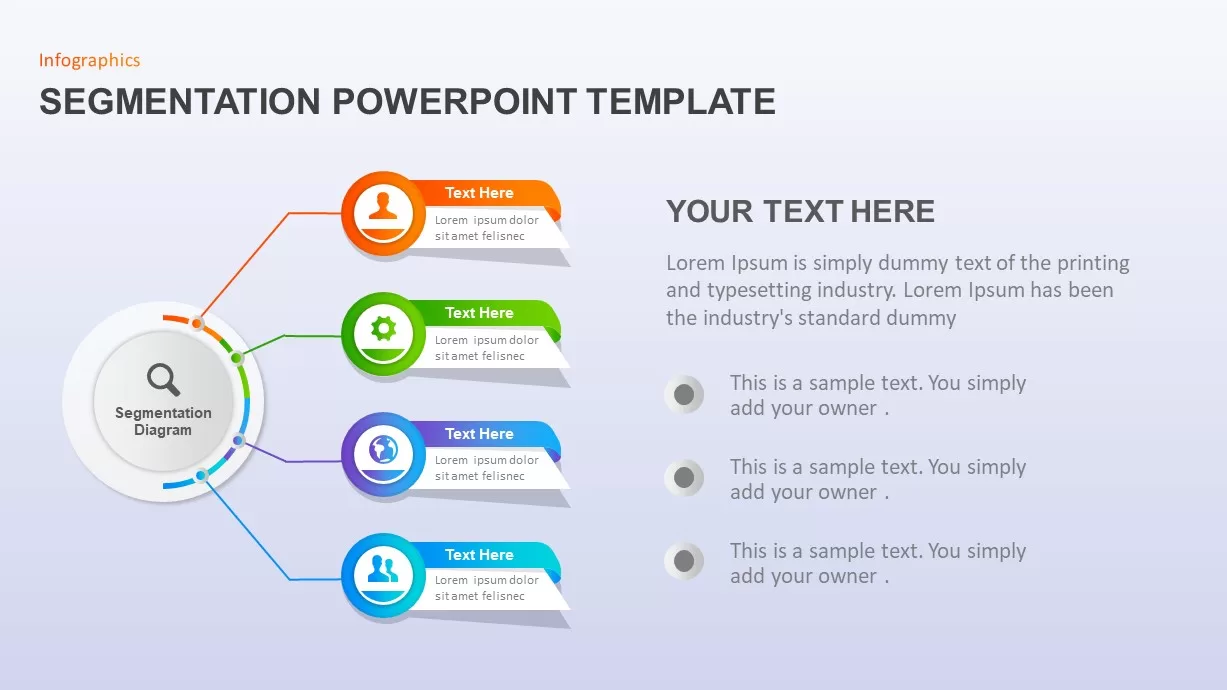
Market Segmentation & STP Infographics Pack Template for PowerPoint & Google Slides
Marketing
Business Growth Plant Infographics Pack Template for PowerPoint & Google Slides
Process
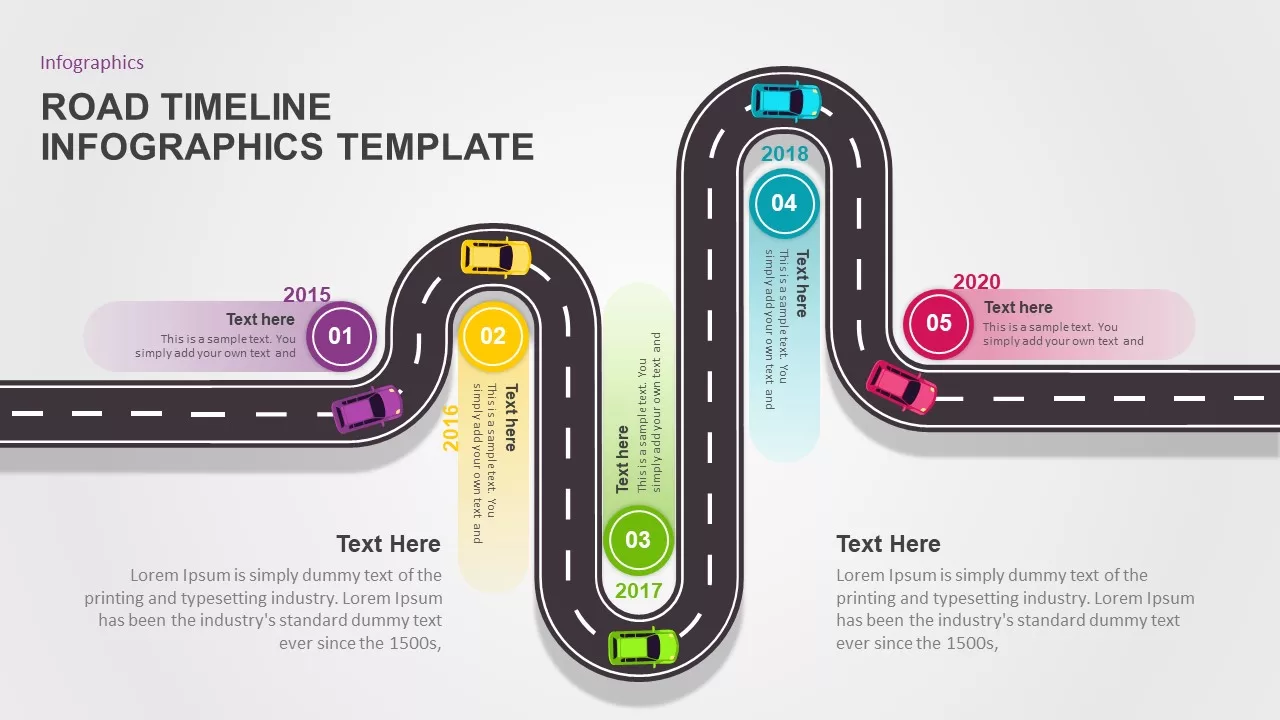
Road Timeline Infographics Template for PowerPoint & Google Slides
Timeline
Six-Step Circular Diagram Infographics Template for PowerPoint & Google Slides
Circular
Dynamic Gear Diagram Infographics Template for PowerPoint & Google Slides
Process
Floating Island Ecosystem Infographics Template for PowerPoint & Google Slides
Graphics
Versatile Creative Diagram Infographics Template for PowerPoint & Google Slides
Process
Versatile 3D Modular Shape Infographics Template for PowerPoint & Google Slides
Infographics
6 Stage Timeline Infographics template for PowerPoint & Google Slides
Timeline

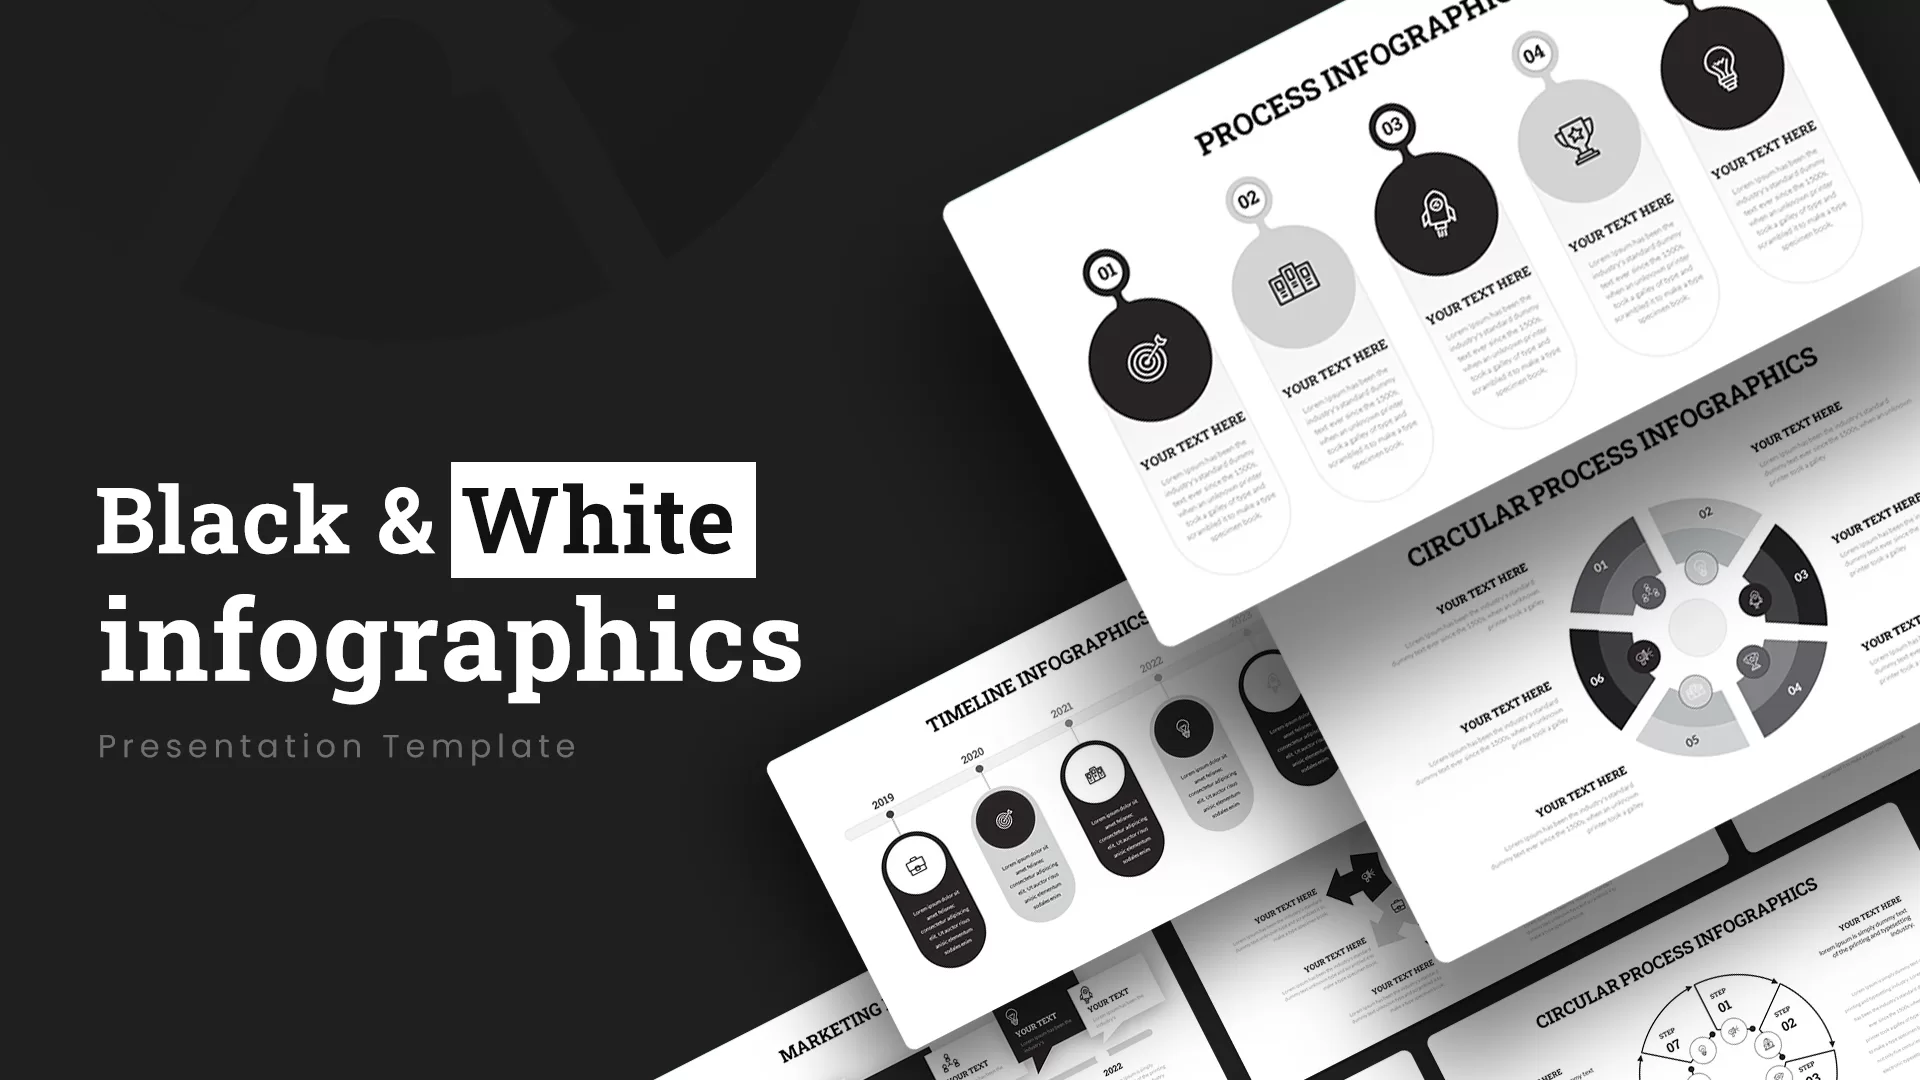
Black and White Infographics template for PowerPoint & Google Slides
Business
Free Colorful Process Flow Infographics Template for PowerPoint & Google Slides
Process
Free
Colorful Process Flow Infographics Template for PowerPoint & Google Slides
Process
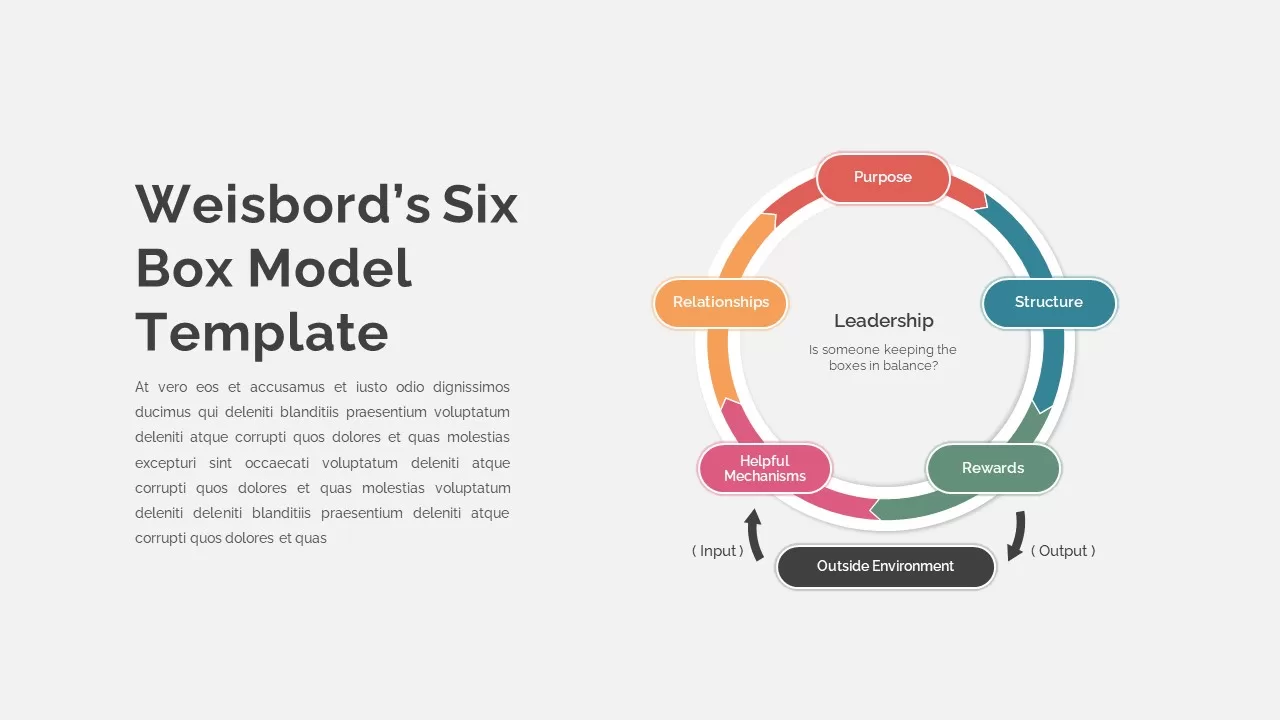
Weisbord’s Six Box Model Infographics Template for PowerPoint & Google Slides
Circular
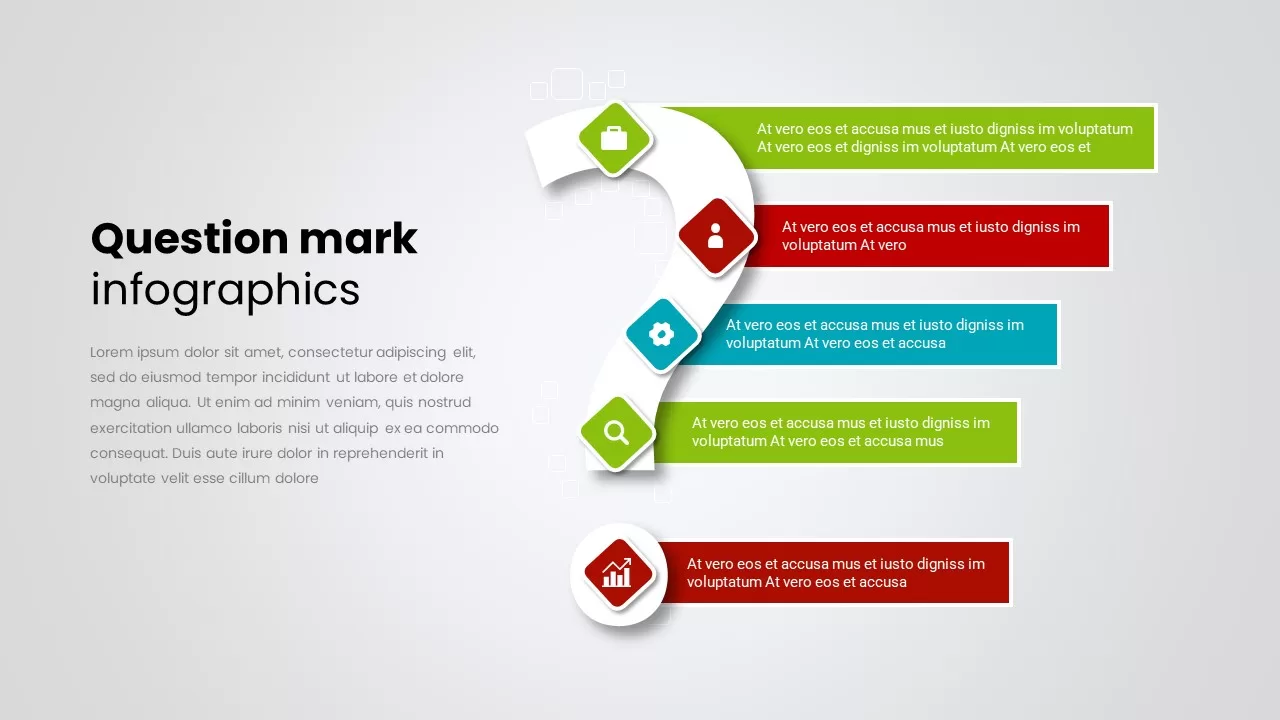
Question Mark Infographics template for PowerPoint & Google Slides
Infographics
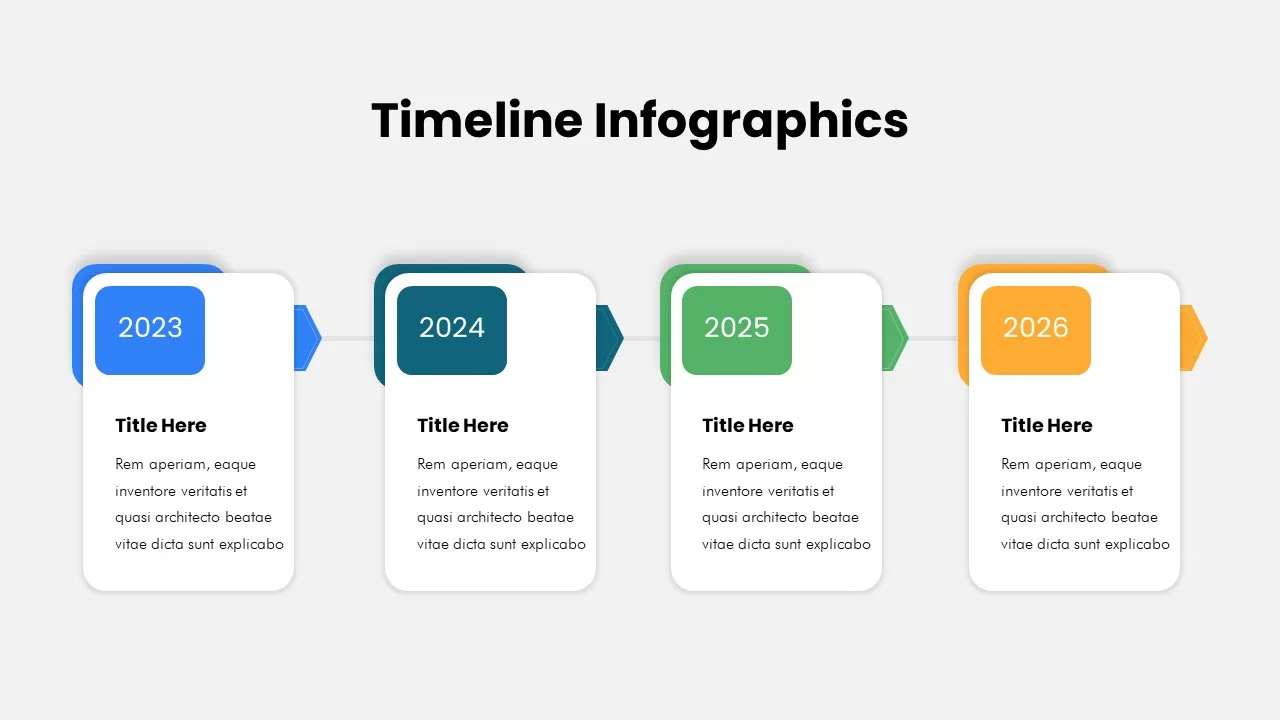
Animated Timeline Infographics template for PowerPoint & Google Slides
Timeline
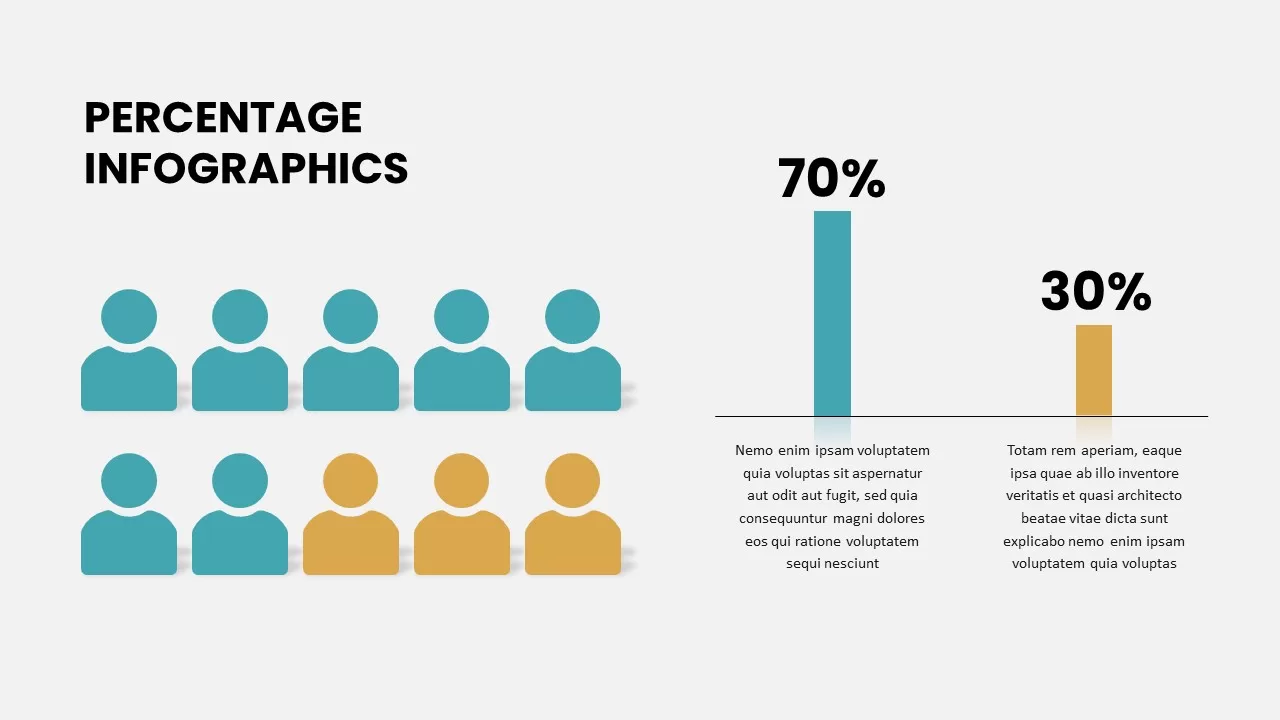
Percentage Infographics template for PowerPoint & Google Slides
Comparison
Before and After Comparison Infographics Template for PowerPoint & Google Slides
Comparison
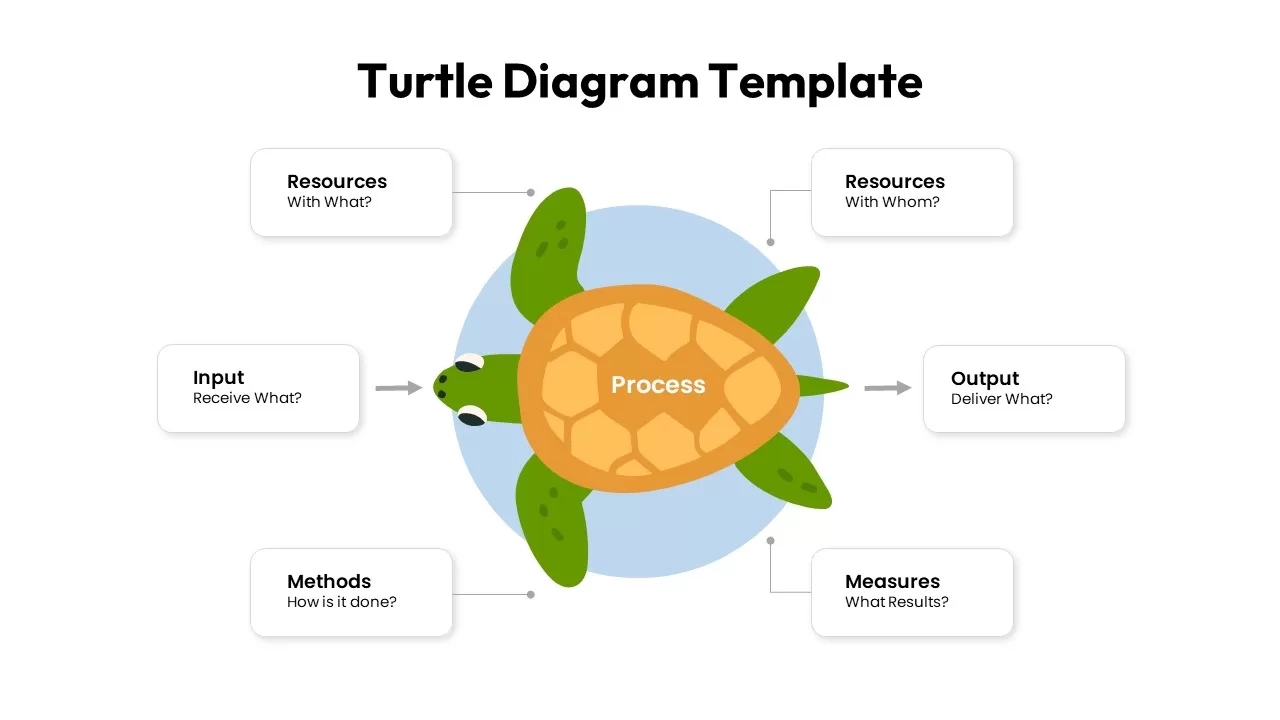
Turtle Diagram Infographics Template for PowerPoint & Google Slides
Process
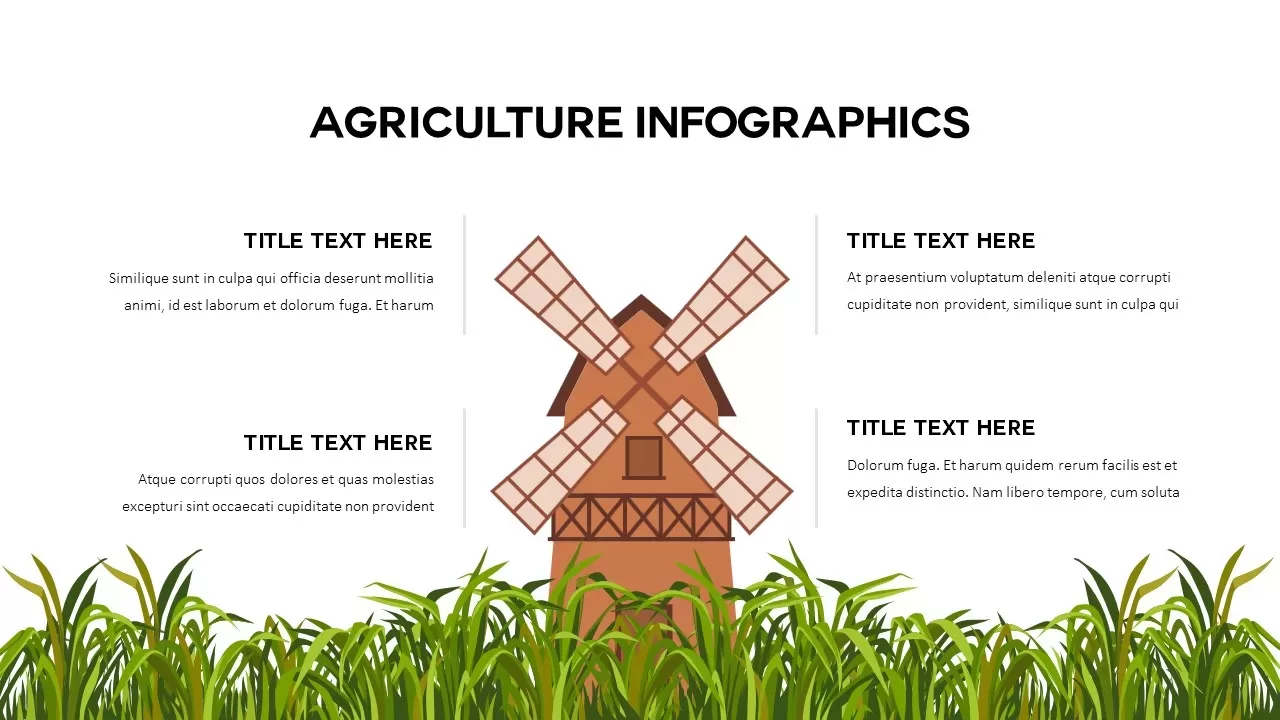
Agriculture Windmill Infographics Template for PowerPoint & Google Slides
Comparison
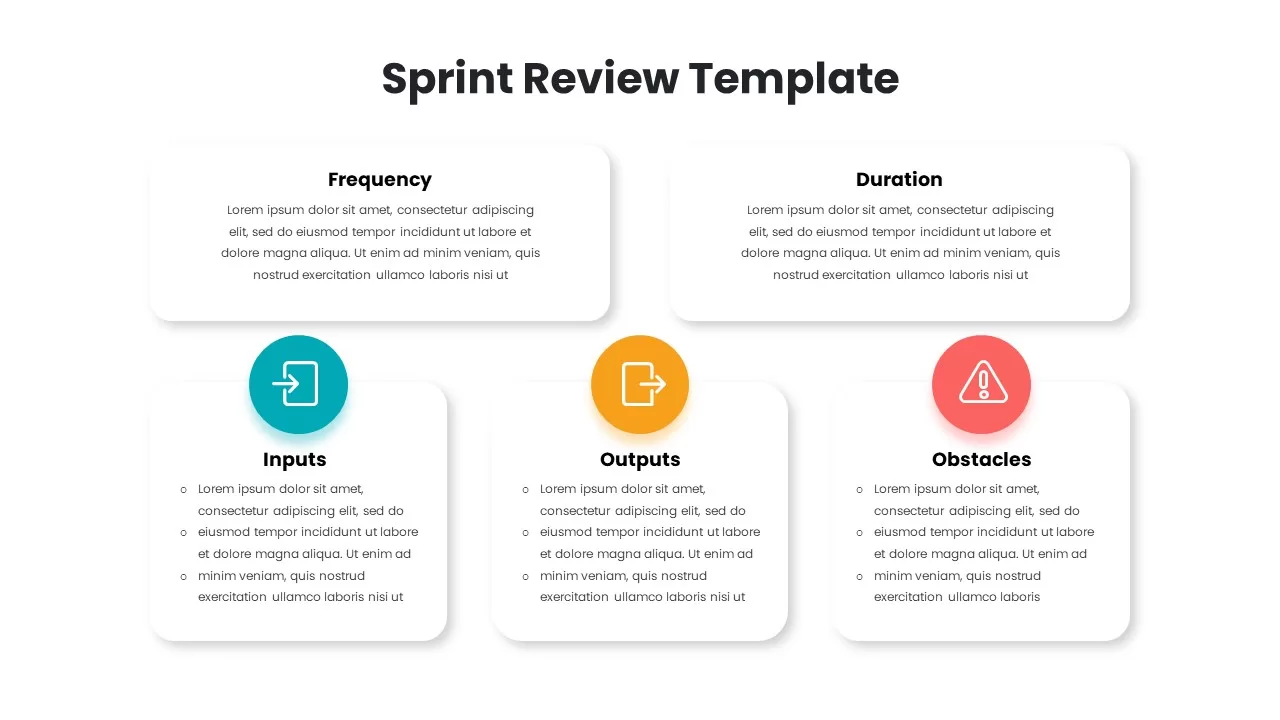
Sprint Review Process Infographics Pack Template for PowerPoint & Google Slides
Infographics
Flywheel Infographics template for PowerPoint & Google Slides
Process
Flywheel Infographics template for PowerPoint & Google Slides
Business Strategy
Flywheel Infographics template for PowerPoint & Google Slides
Business Strategy
Flywheel Infographics template for PowerPoint & Google Slides
Business Strategy
Social Media Hub-and-Spoke Infographics Template for PowerPoint & Google Slides
Circular
Three-Part Shield Infographics Template for PowerPoint & Google Slides
Comparison

Steps Infographics Template for PowerPoint & Google Slides
Decks
Surgery Infographics Comparison Template for PowerPoint & Google Slides
Health
Free Mental Health Awareness & Infographics Presentation Template for PowerPoint & Google Slides
Health
Free
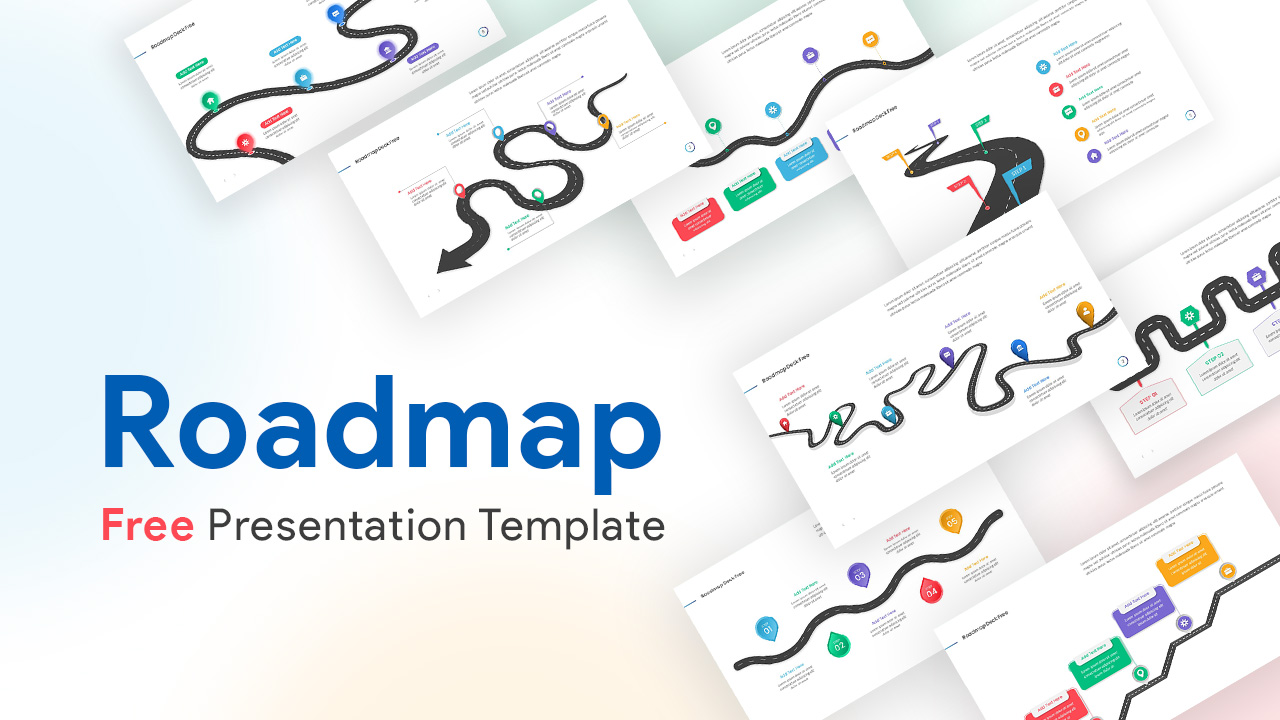
Free Roadmap Infographics Pack Template for PowerPoint & Google Slides
Pitch Deck
Free
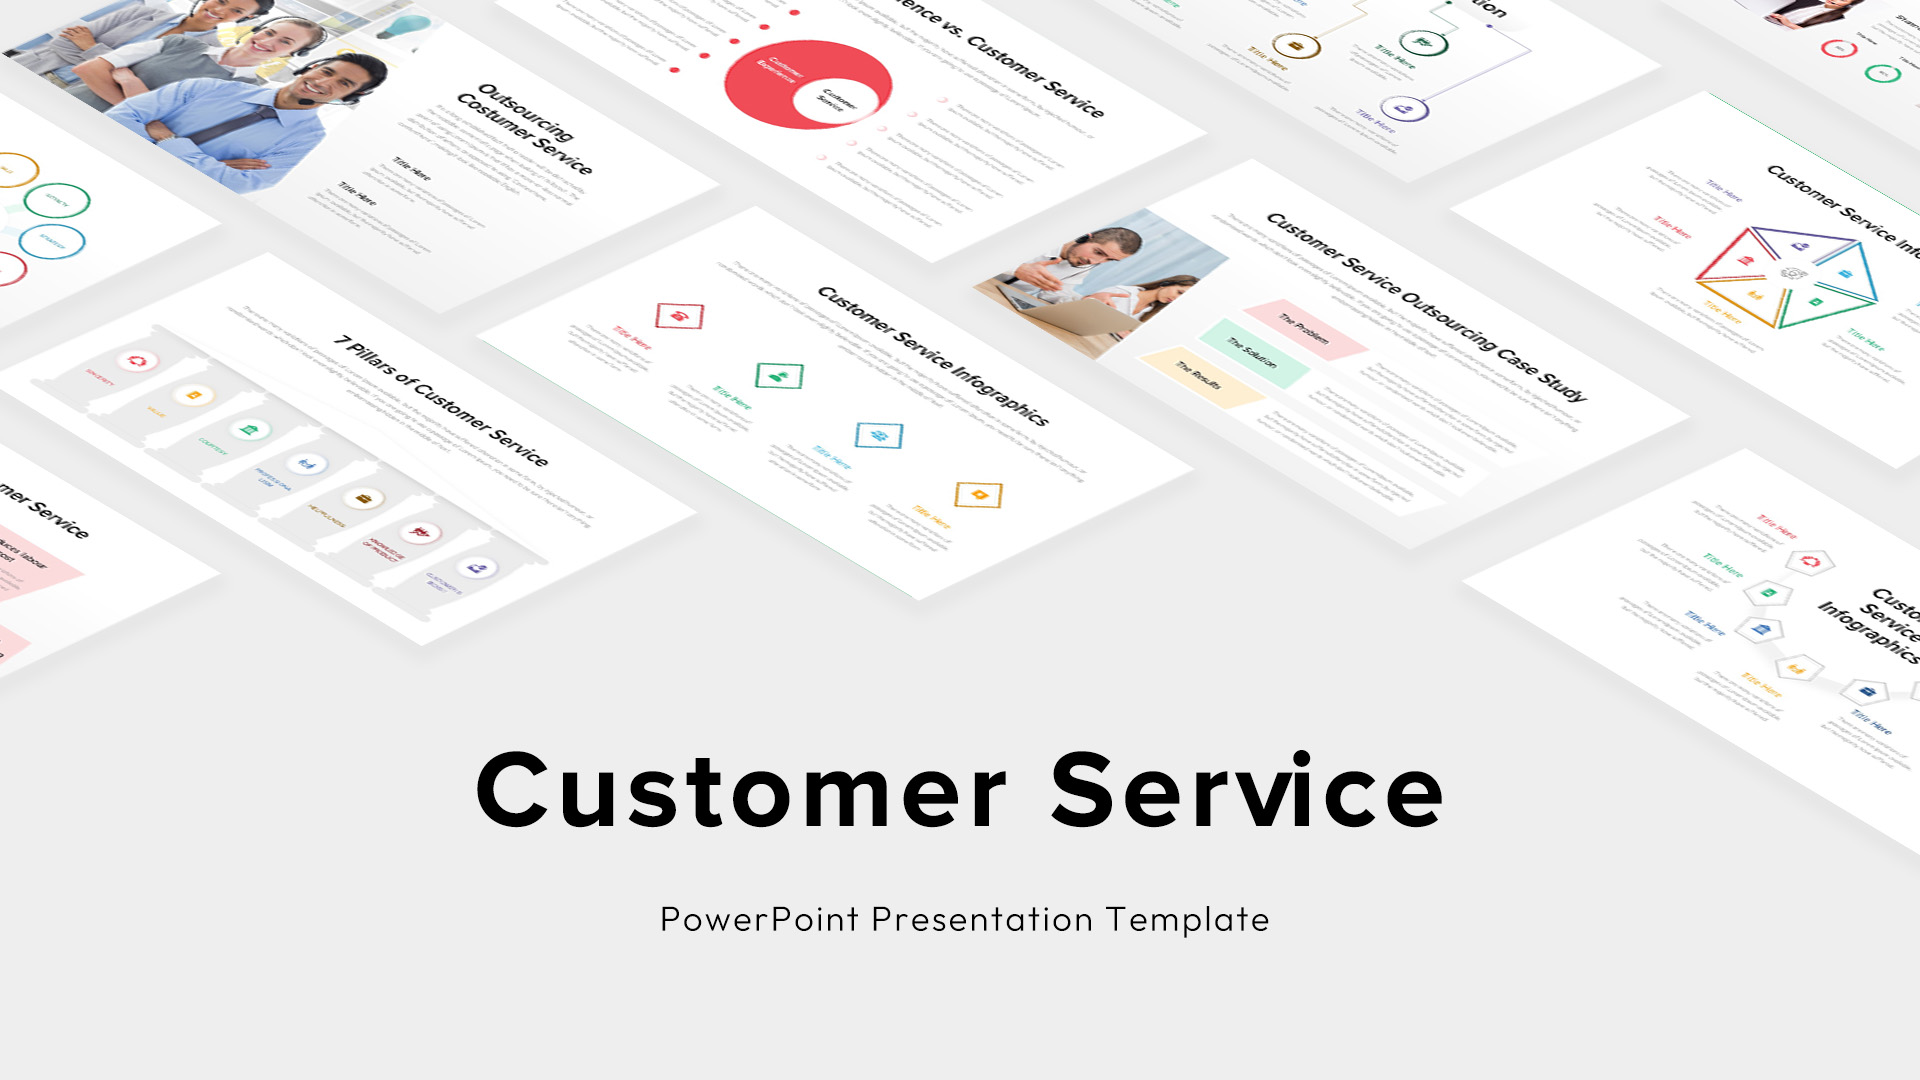
Custom Customer Service Infographics Template for PowerPoint & Google Slides
Process
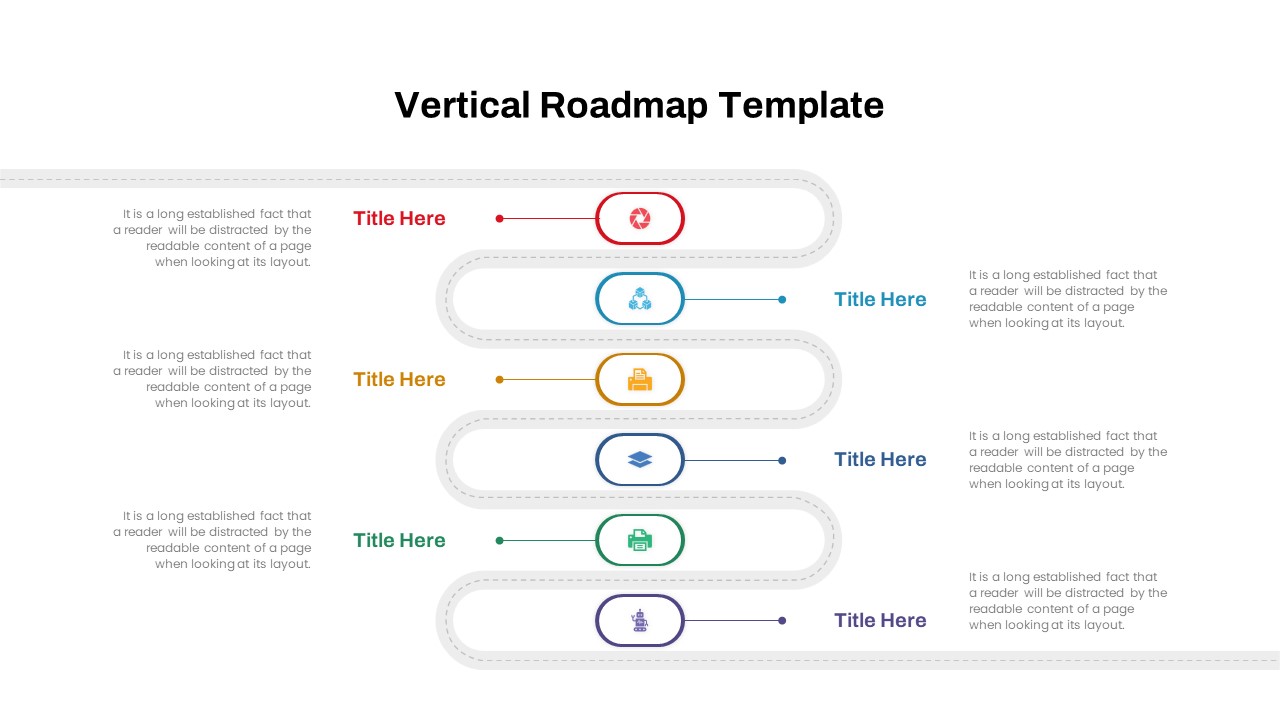
Vertical Roadmap Infographics Template for PowerPoint & Google Slides
Roadmap
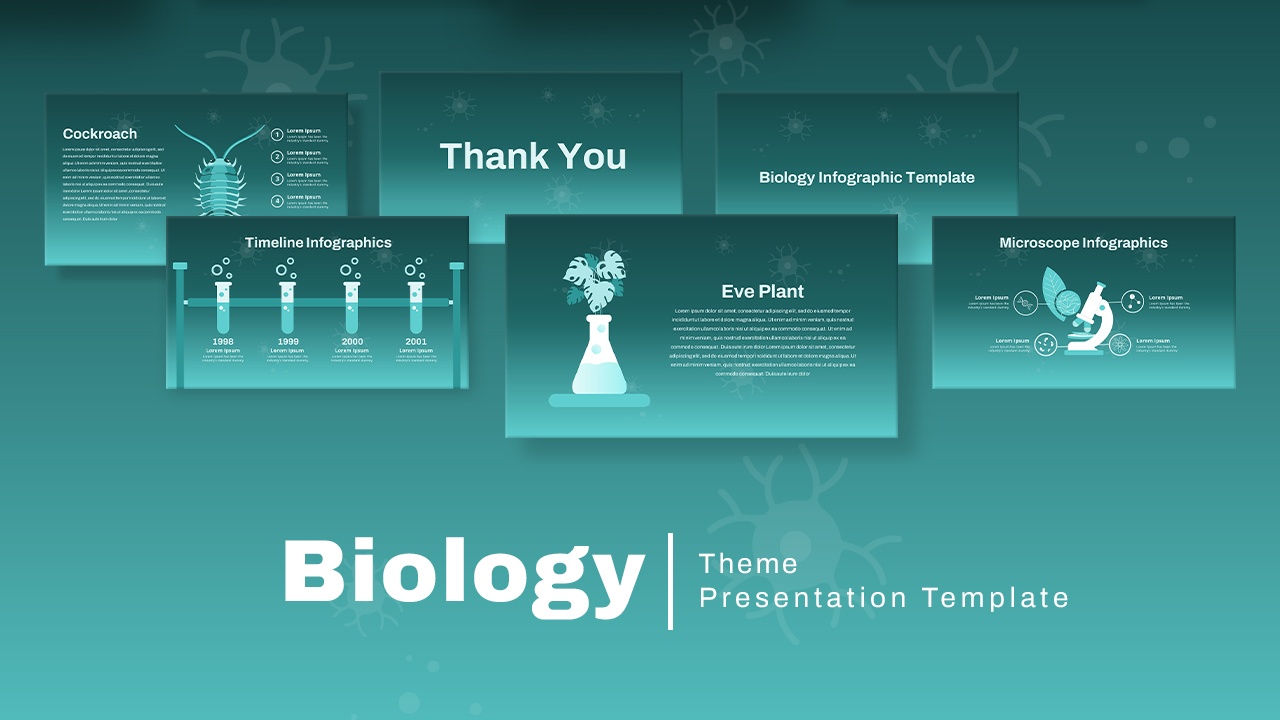
Free Biology Theme Infographics Deck Template for PowerPoint & Google Slides
Health
Free
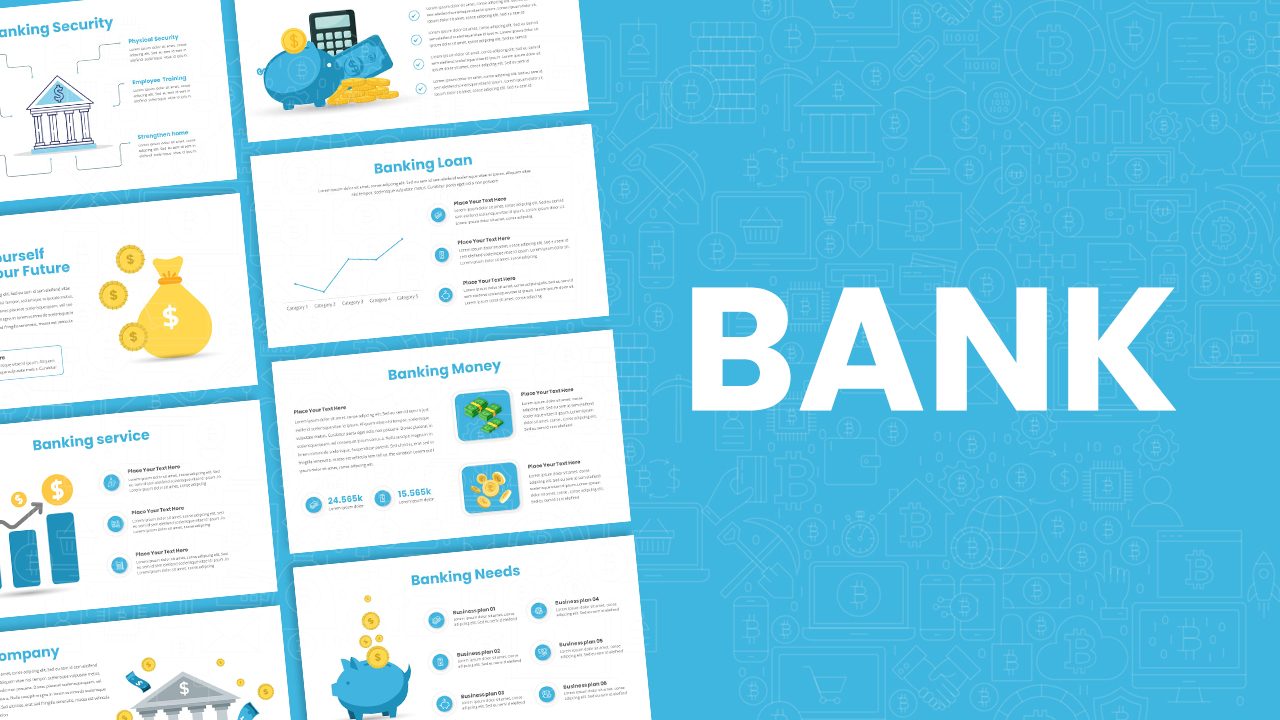
Banking Service & Finance Infographics Template for PowerPoint & Google Slides
Finance
Free
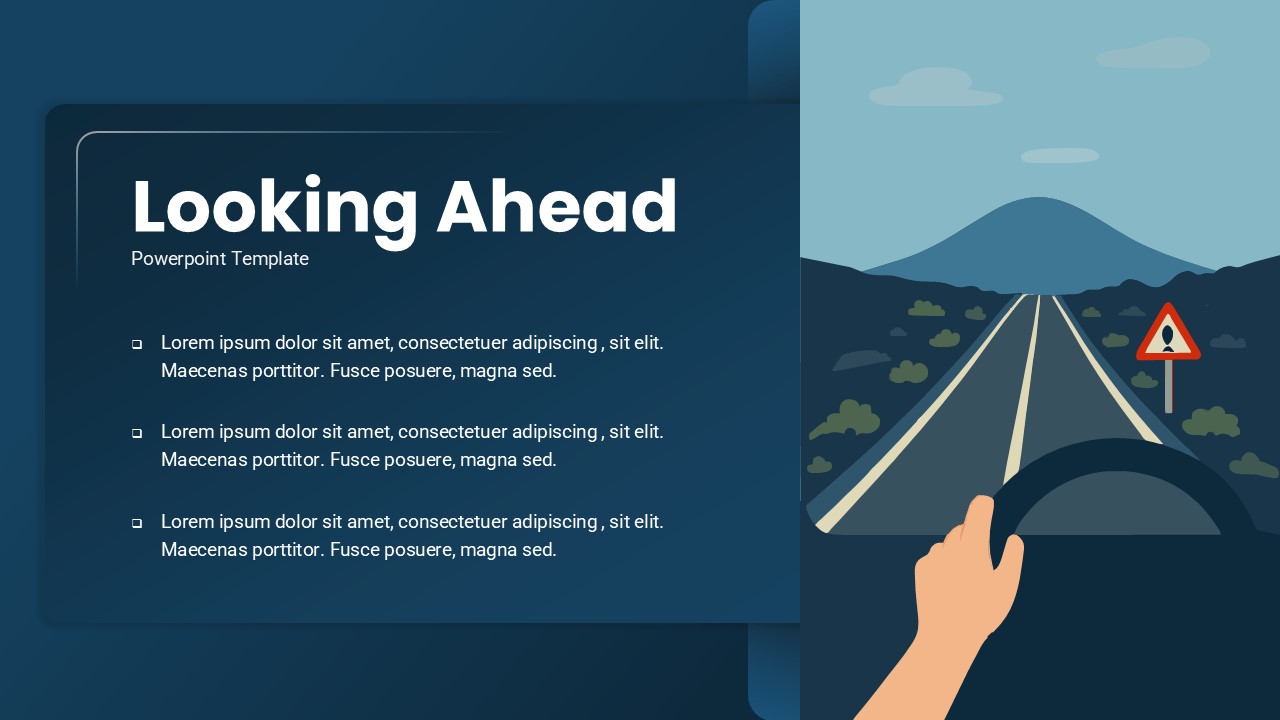
Looking Ahead 3-Slide Infographics Pack Template for PowerPoint & Google Slides
Business
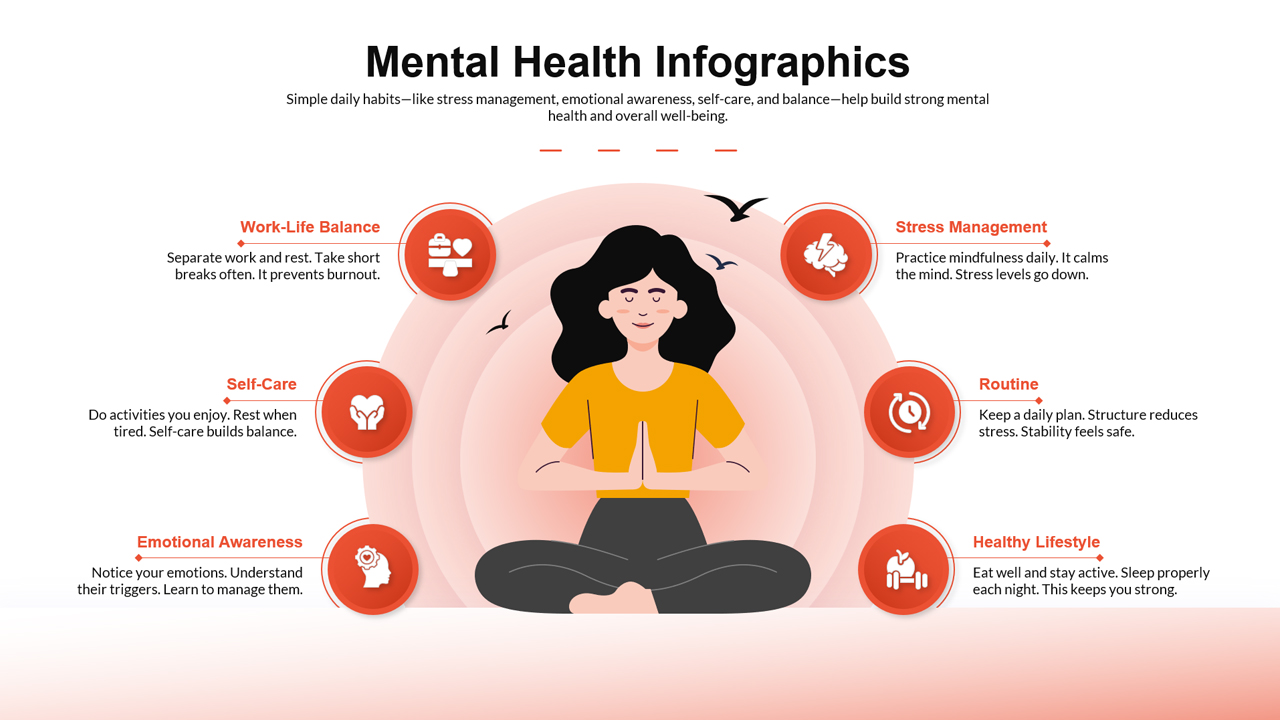
Mental Health Infographics Template for PowerPoint & Google Slides
Health