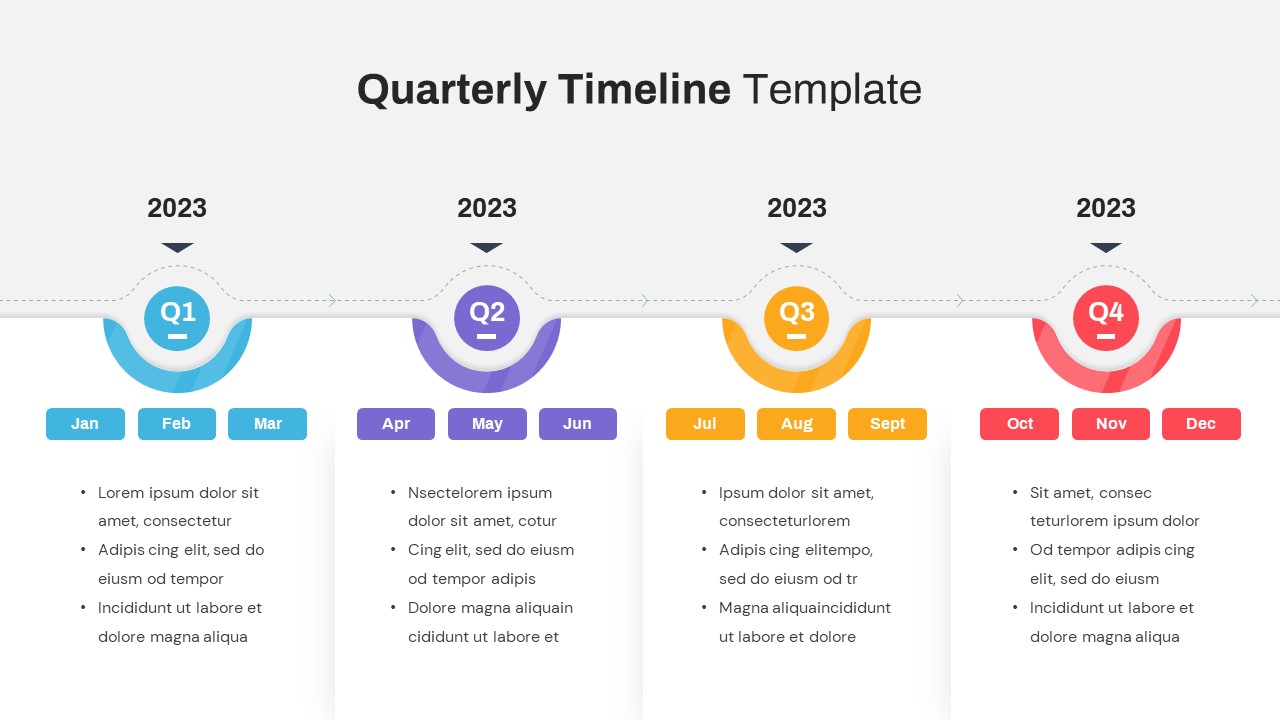
Quarterly Timeline Infographic Template for PowerPoint & Google Slides

Description
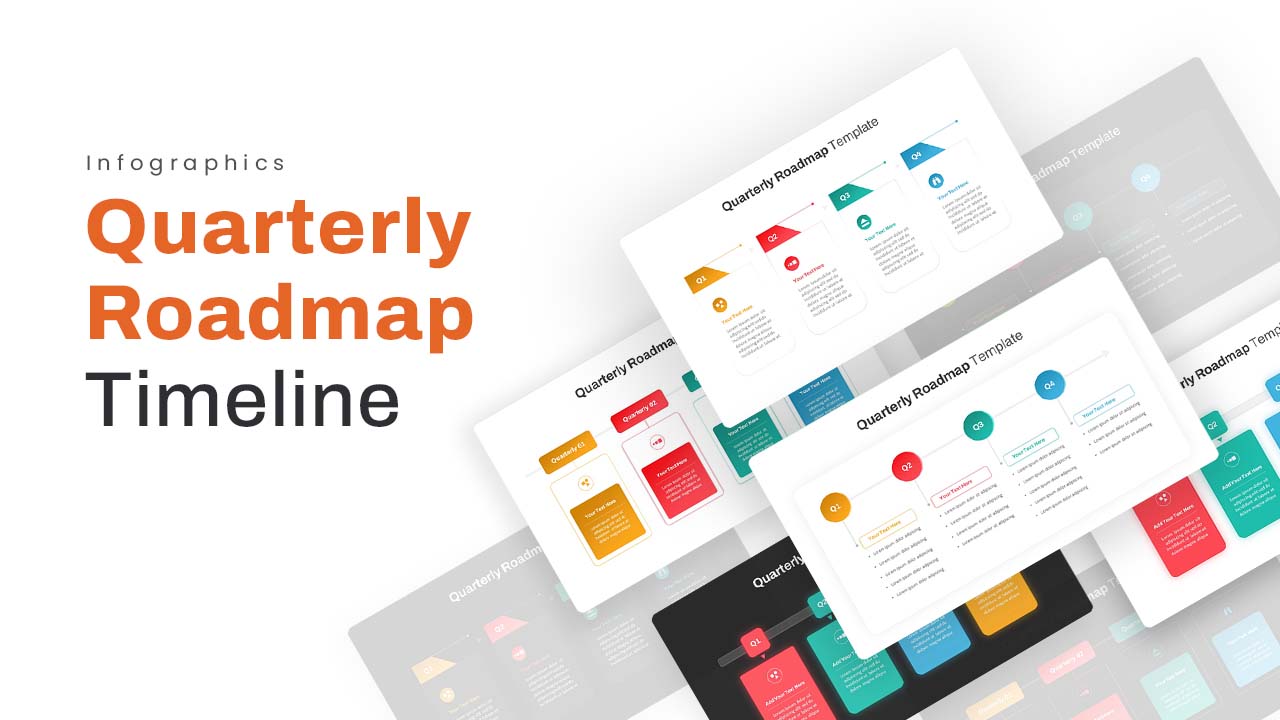
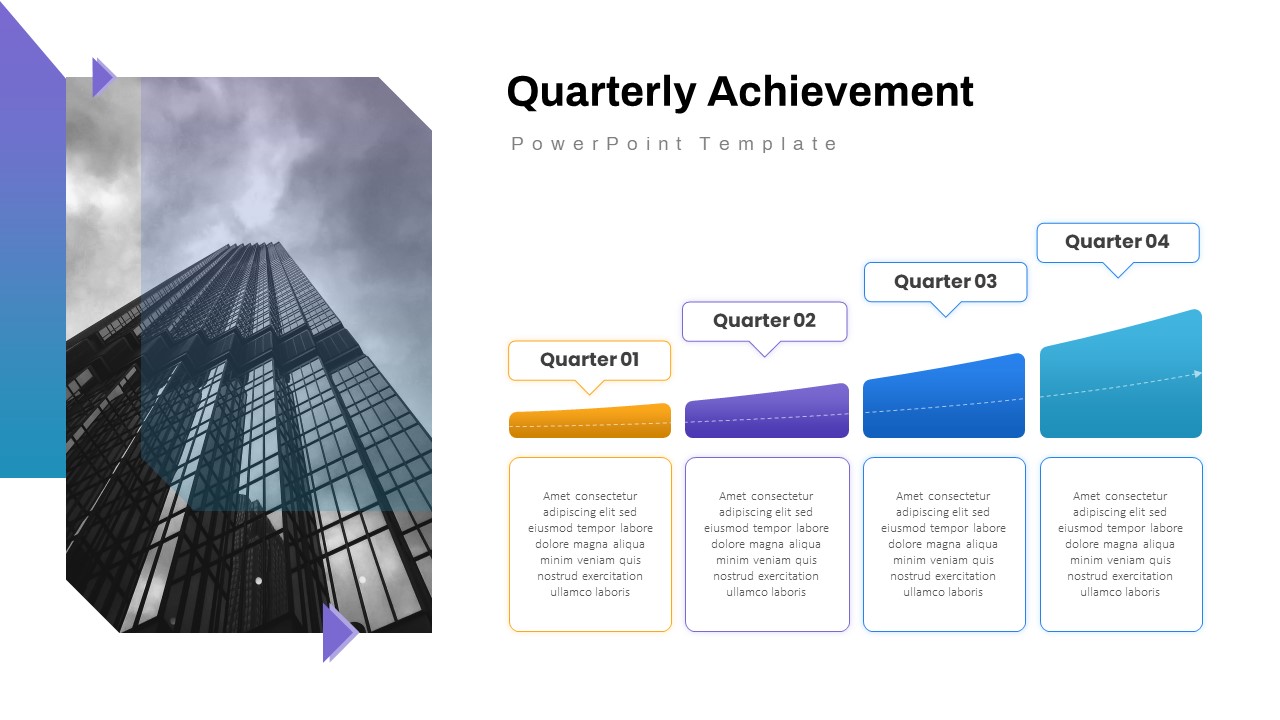
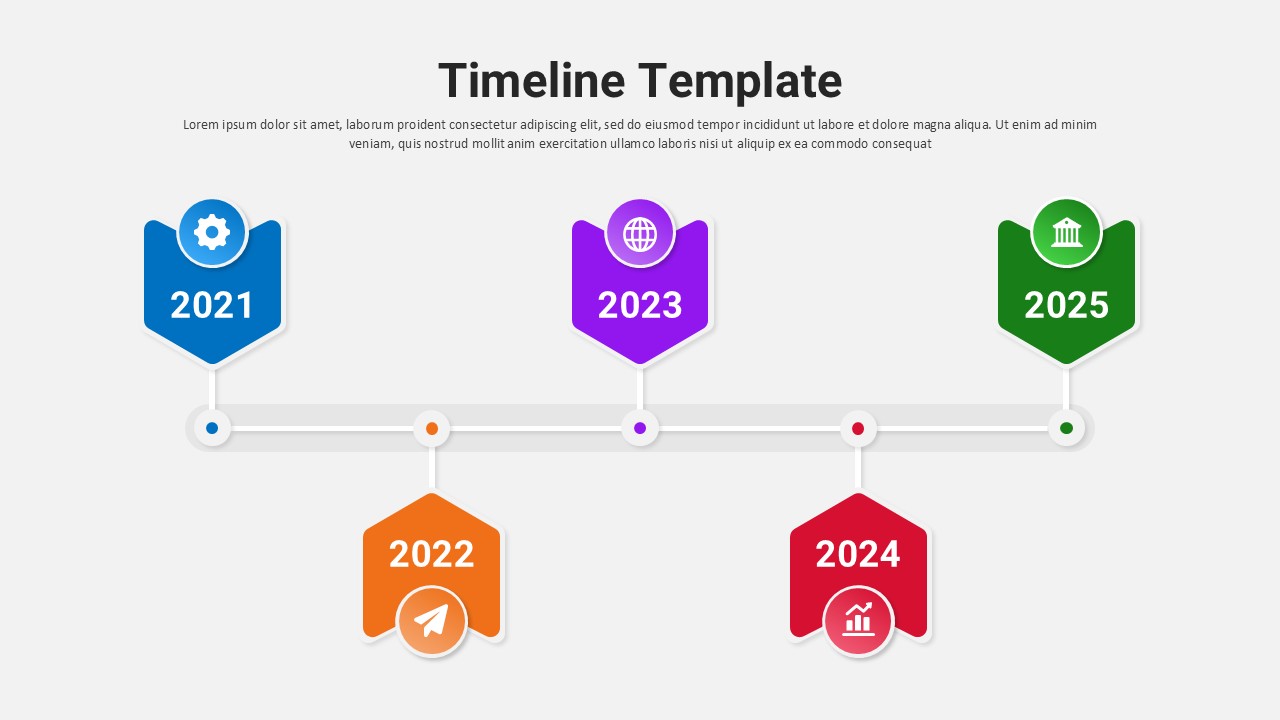
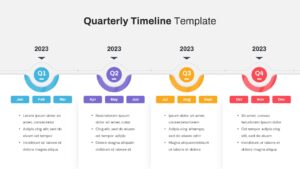
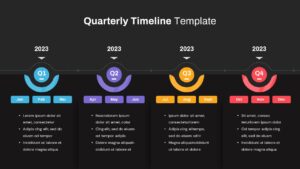
This clean, modern quarterly timeline slide splits the year into four phases—Q1 through Q4—using a horizontal dashed connector line and color-coded half-circle accents. Each quarter features a vibrant circle labeled Q1 (blue), Q2 (purple), Q3 (orange), and Q4 (red), with three month blocks beneath for intuitive date mapping. Below each segment, bullet-style text placeholders let you highlight key milestones, deliverables, or objectives in a structured, easy-to-scan layout. The minimalist white background and subtle drop shadows create visual separation without clutter.
Built on vector graphics and master layouts, this slide maintains brand consistency, accelerates editing workflows, and minimizes version control conflicts. Editable placeholders for quarter labels, month tags, and bullet text ensure rapid updates without disrupting the overall design integrity.
Designed for seamless integration, this template supports resizing or repositioning timeline elements, adjustment of date ranges, and swapping color palettes to match any brand identity. Whether you’re presenting quarterly business updates, product roadmaps, marketing plans, or strategic reviews, this asset ensures consistency across devices and platforms—PowerPoint and Google Slides—so you can focus on storytelling, not formatting.
Who is it for
Project managers, marketing leaders, business analysts, and executive teams will benefit from this quarterly timeline slide when outlining progress, milestones, and roadmaps at stakeholder meetings, strategy workshops, and board presentations.
Other Uses
Repurpose this framework for fiscal year planning, product launch schedules, HR training timelines, event planning roadmaps, or academic semester overviews. Simply adjust labels, colors, and bullet text to apply this versatile infographic across any department or initiative.
Login to download this file

Item ID
SB03642
Related Templates

Quarterly Roadmap Timeline Infographic Template for PowerPoint & Google Slides
Timeline

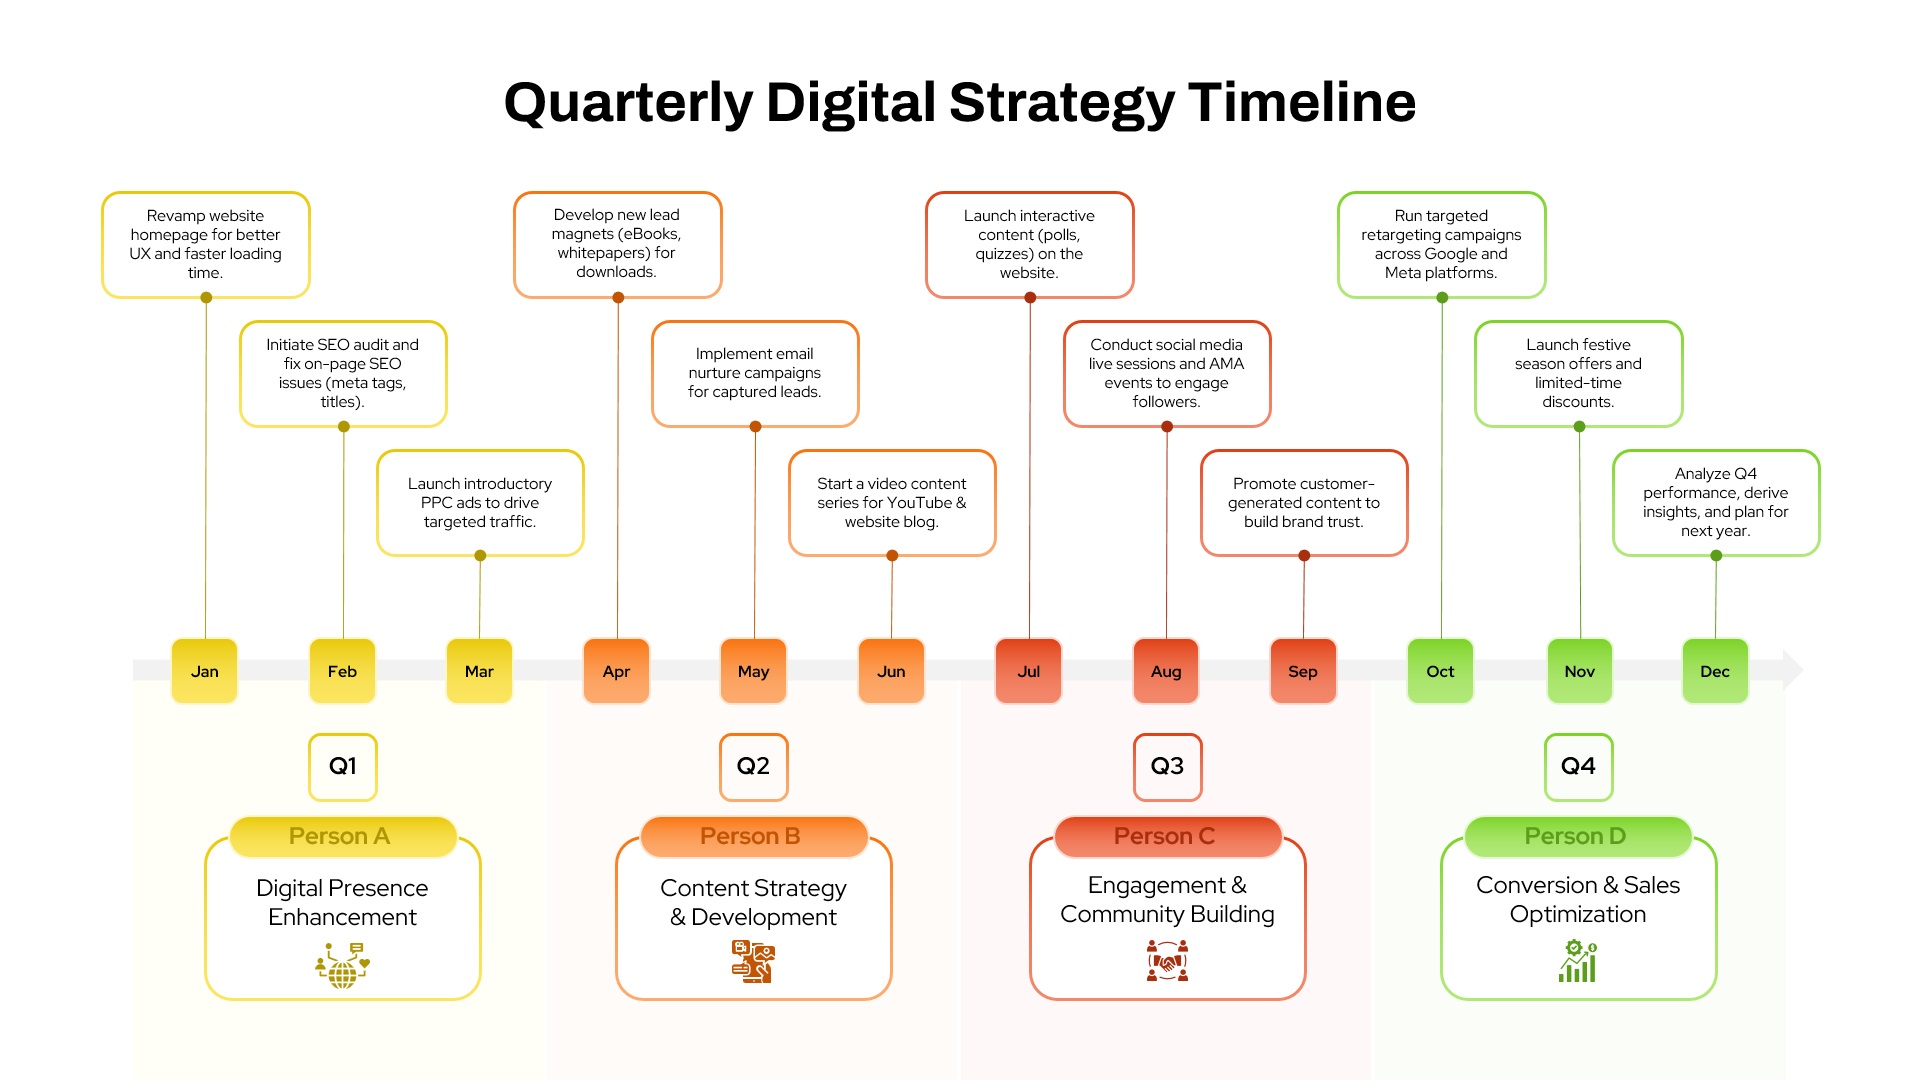
Quarterly Digital Strategy Timeline template for PowerPoint & Google Slides
Digital Marketing
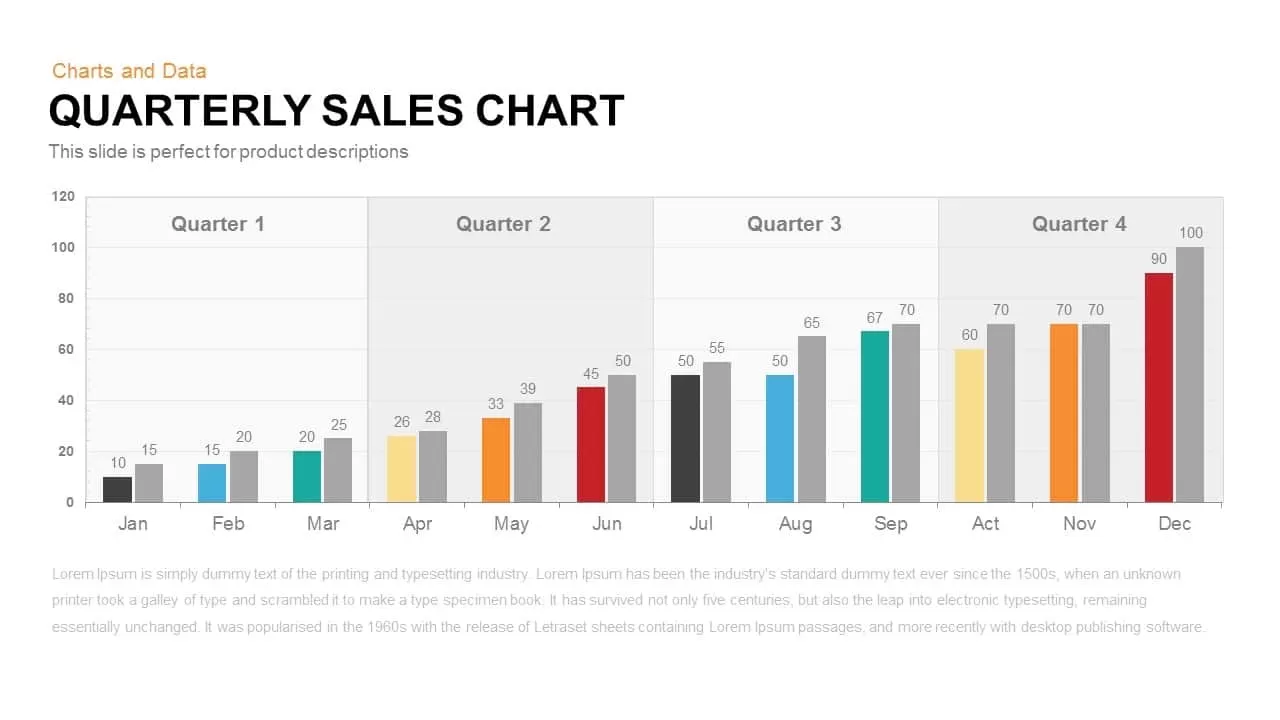
Quarterly Sales template for PowerPoint & Google Slides
Bar/Column
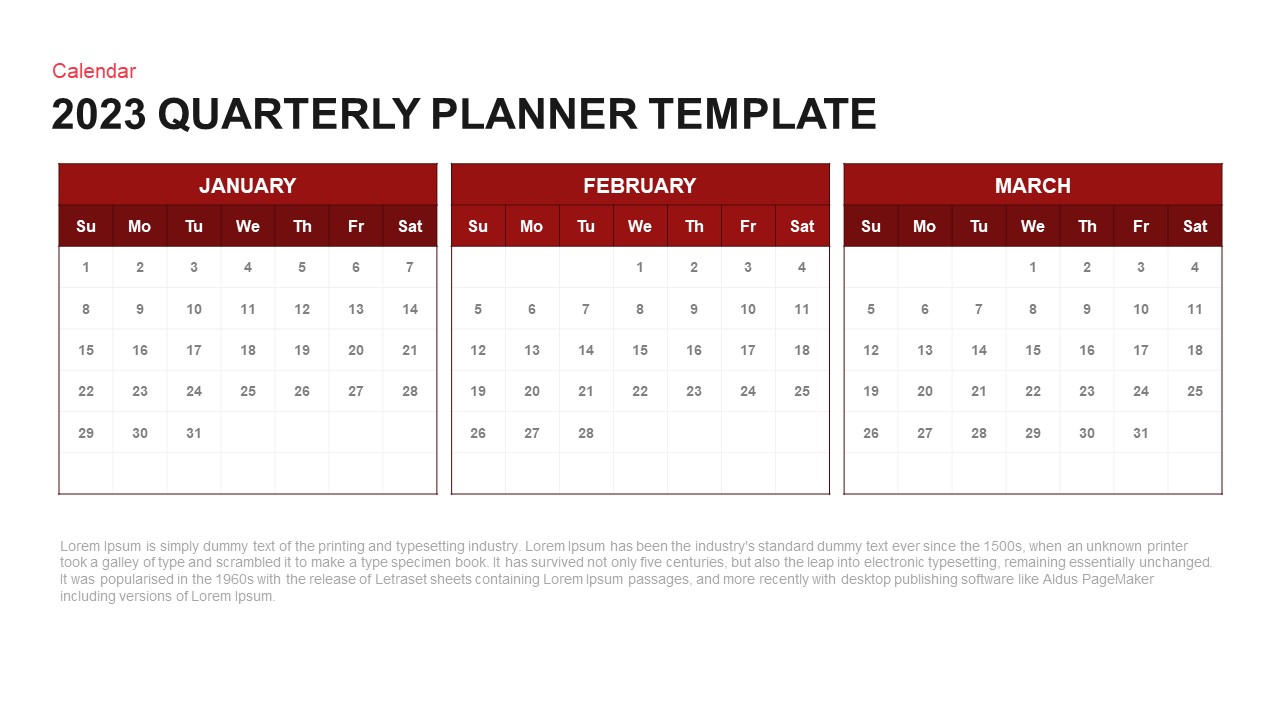
Quarterly Planner Calendar Layout Template for PowerPoint & Google Slides
Project
Quarterly Achievement Progress Template for PowerPoint & Google Slides
Accomplishment
Free Quarterly Business Review Dashboard Template for PowerPoint & Google Slides
Business
Free
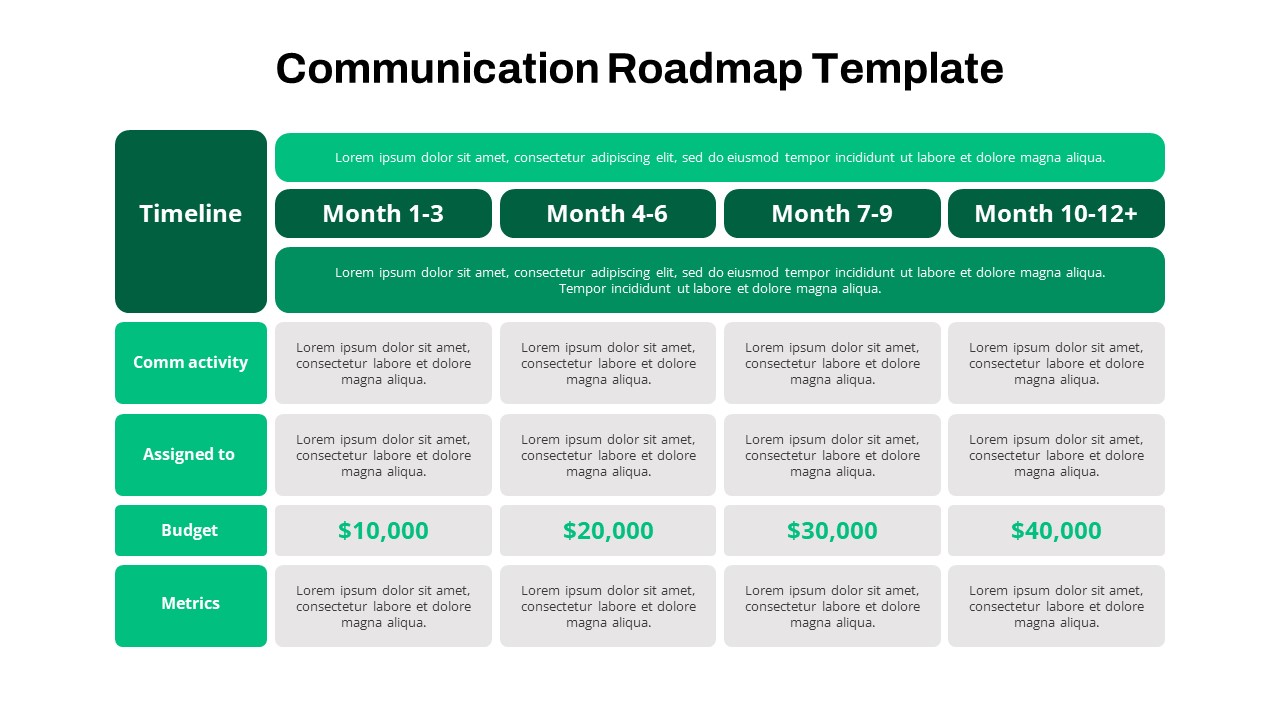
Quarterly Communication Roadmap Grid Template for PowerPoint & Google Slides
Marketing
Quarterly Credit Loss Provisions Chart Template for PowerPoint & Google Slides
Bar/Column
Quarterly Financial Summary Dashboard Template for PowerPoint & Google Slides
Business Report
Quarterly Gross Profit Rate Chart Template for PowerPoint & Google Slides
Revenue
Quarterly Network Volume Analysis Template for PowerPoint & Google Slides
Business Report
Quarterly Business Review Dashboard Template for PowerPoint & Google Slides
Pitch Deck
Quarterly Revenue Comparison Bar Chart Template for PowerPoint & Google Slides
Bar/Column

Quarterly Net Interest Income Growth Template for PowerPoint & Google Slides
Bar/Column
Quarterly Sales Review Bar Chart Template for PowerPoint & Google Slides
Bar/Column
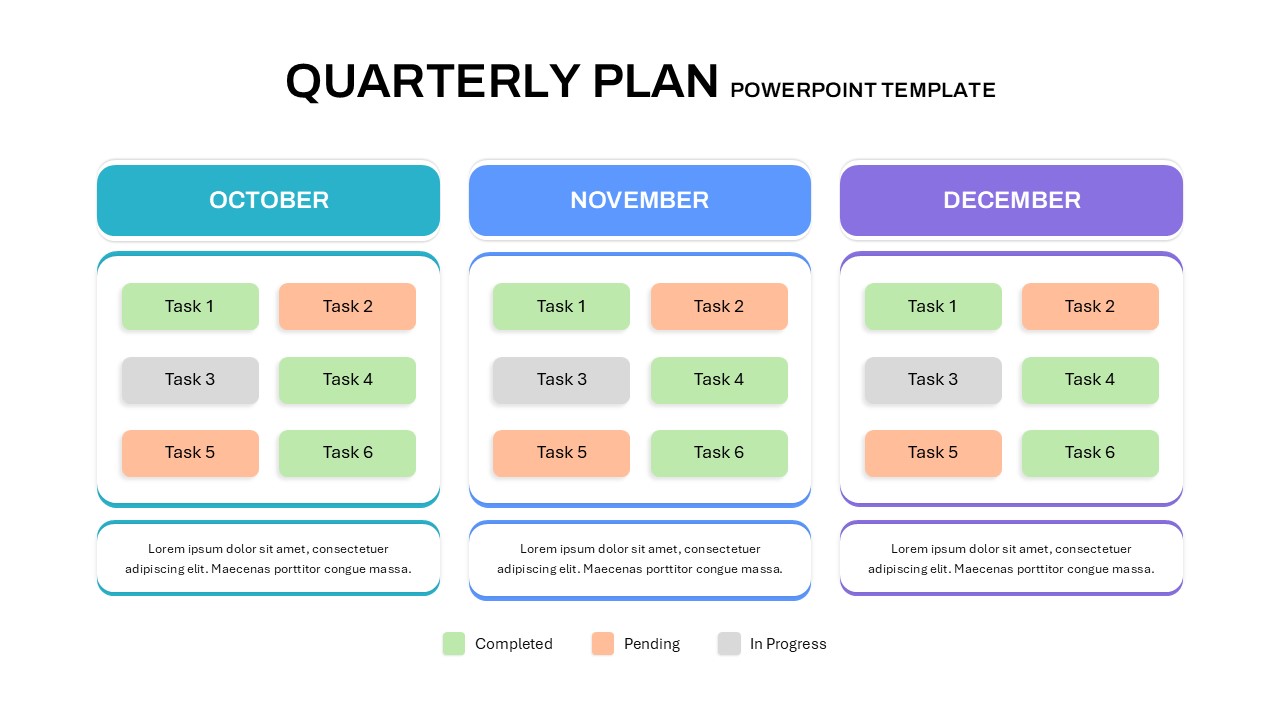
Quarterly Plan Template for PowerPoint & Google Slides
Project Status
Quarterly Gantt Chart with Today Marker Template for PowerPoint & Google Slides
Gantt Chart
Quarterly Comparison Pie Chart Template for PowerPoint & Google Slides
Pie/Donut
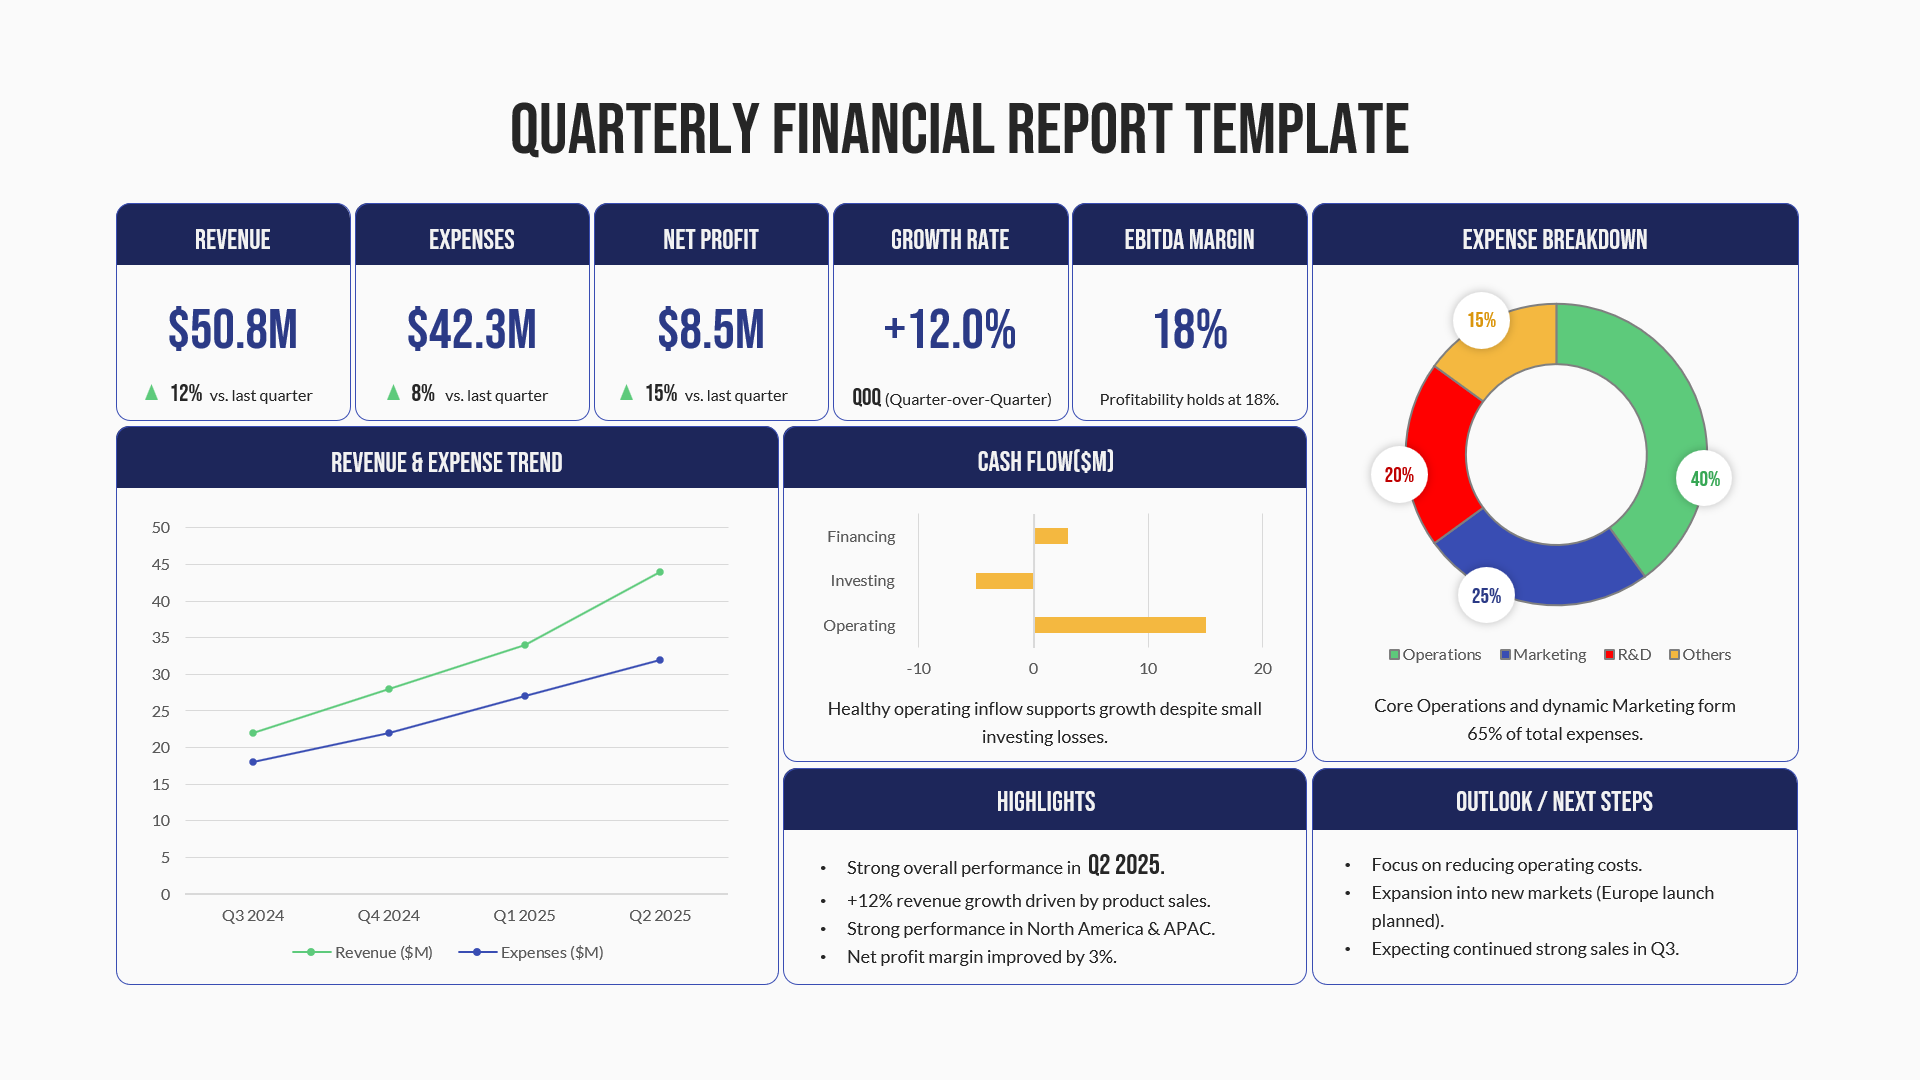
Quarterly Financial Report Dashboard Template for PowerPoint & Google Slides
Finance
7-Stage Colorful Timeline Infographic Template for PowerPoint & Google Slides
Timeline
Creative Pencil Timeline Infographic Template for PowerPoint & Google Slides
Timeline
Three Four Five Stage Timeline Infographic Template for PowerPoint & Google Slides
Timeline
Curved Five-Section Timeline Infographic template for PowerPoint & Google Slides
Timeline
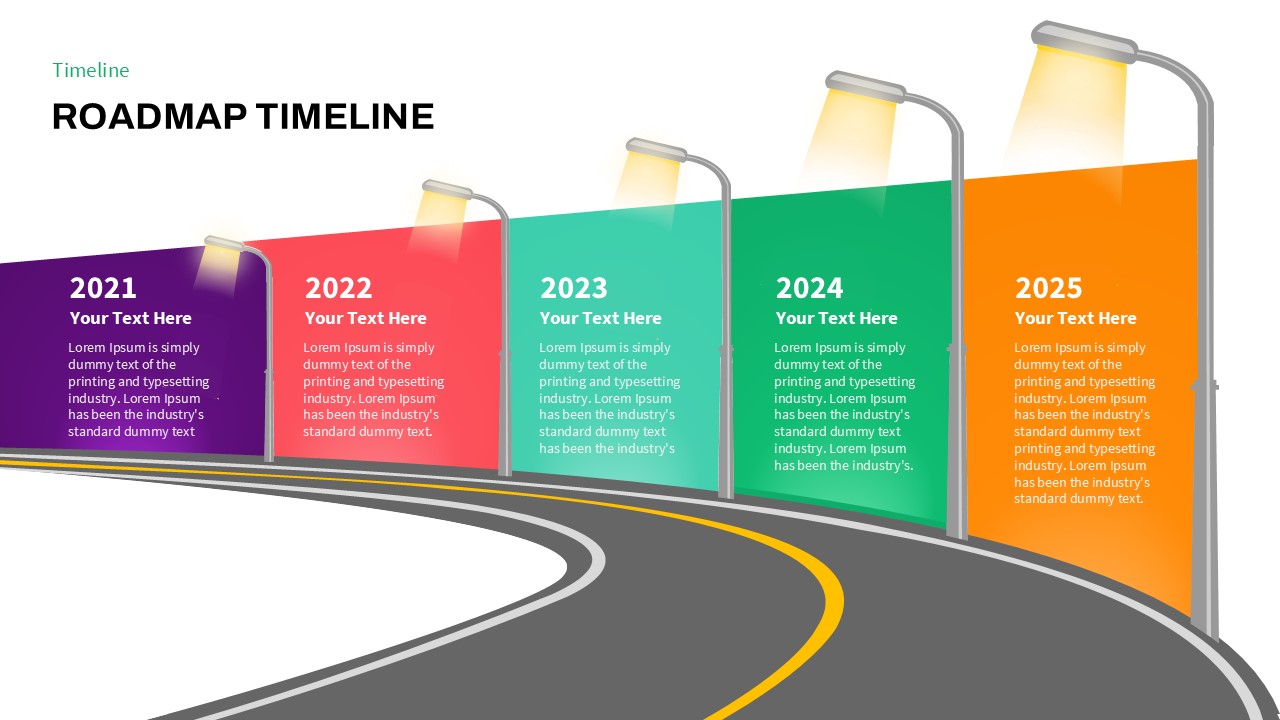
Curved Road Map Timeline Infographic Template for PowerPoint & Google Slides
Roadmap
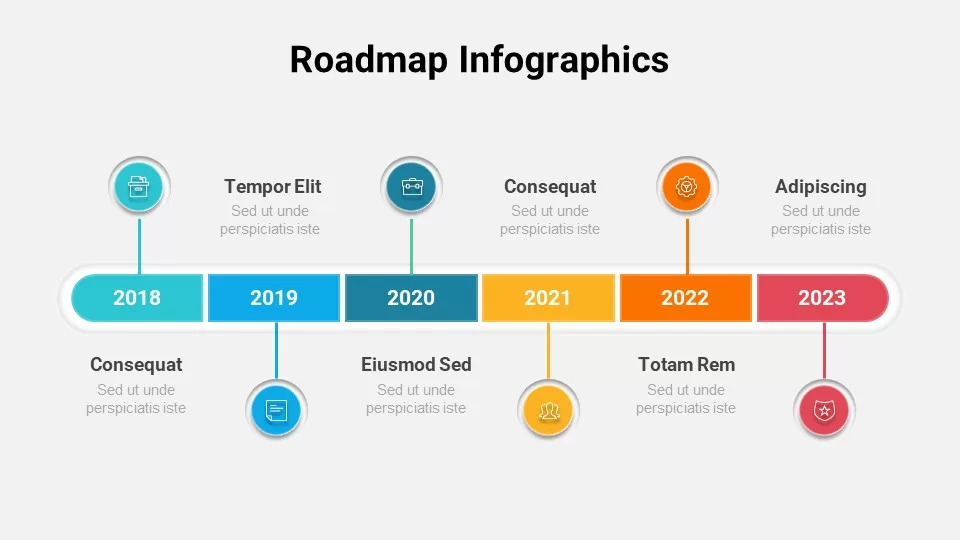
Roadmap Infographic Timeline Slide Template for PowerPoint & Google Slides
Roadmap
Horizontal Timeline Infographic Template for PowerPoint & Google Slides
Timeline
Professional Linear Timeline Infographic Template for PowerPoint & Google Slides
Timeline
Six-Stage Hexagon Timeline Infographic Template for PowerPoint & Google Slides
Timeline

Medical Stethoscope Timeline Infographic Template for PowerPoint & Google Slides
Timeline

Timeline Infographic Design Seven Stage template for PowerPoint & Google Slides
Timeline

Timeline Roadmap Milestones Infographic Template for PowerPoint & Google Slides
Roadmap
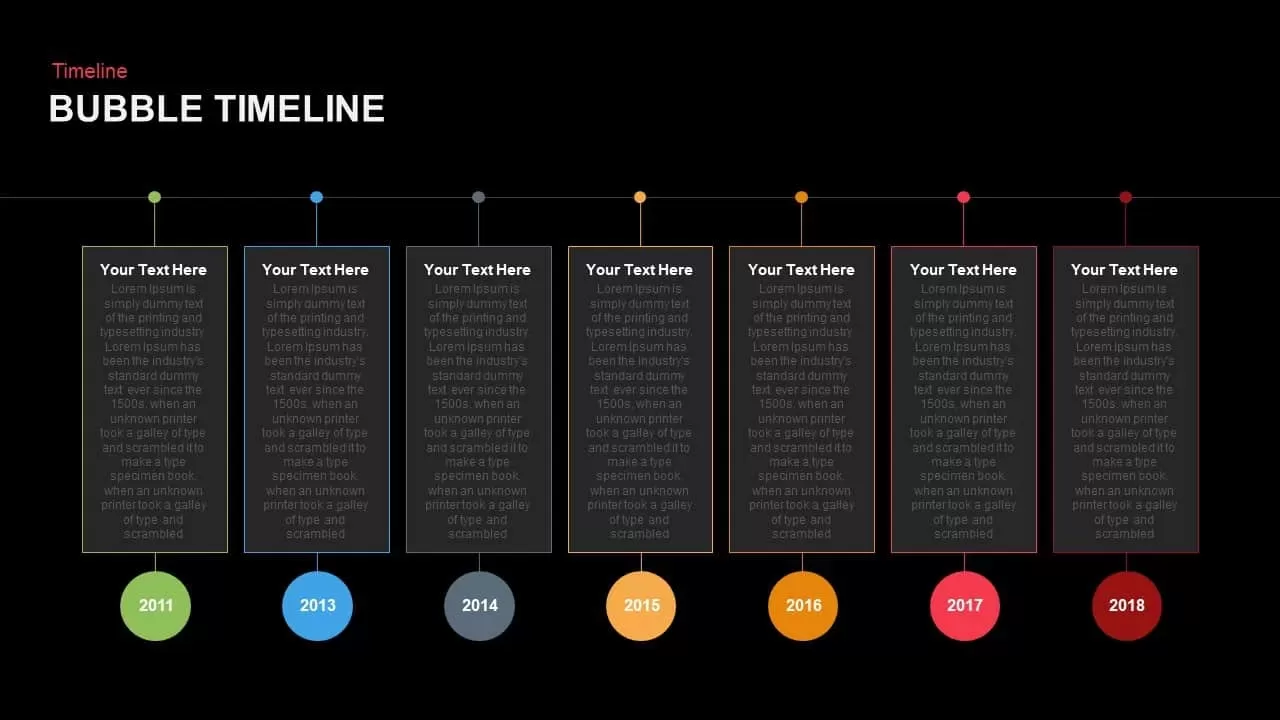
Modern Bubble Timeline Infographic Template for PowerPoint & Google Slides
Timeline
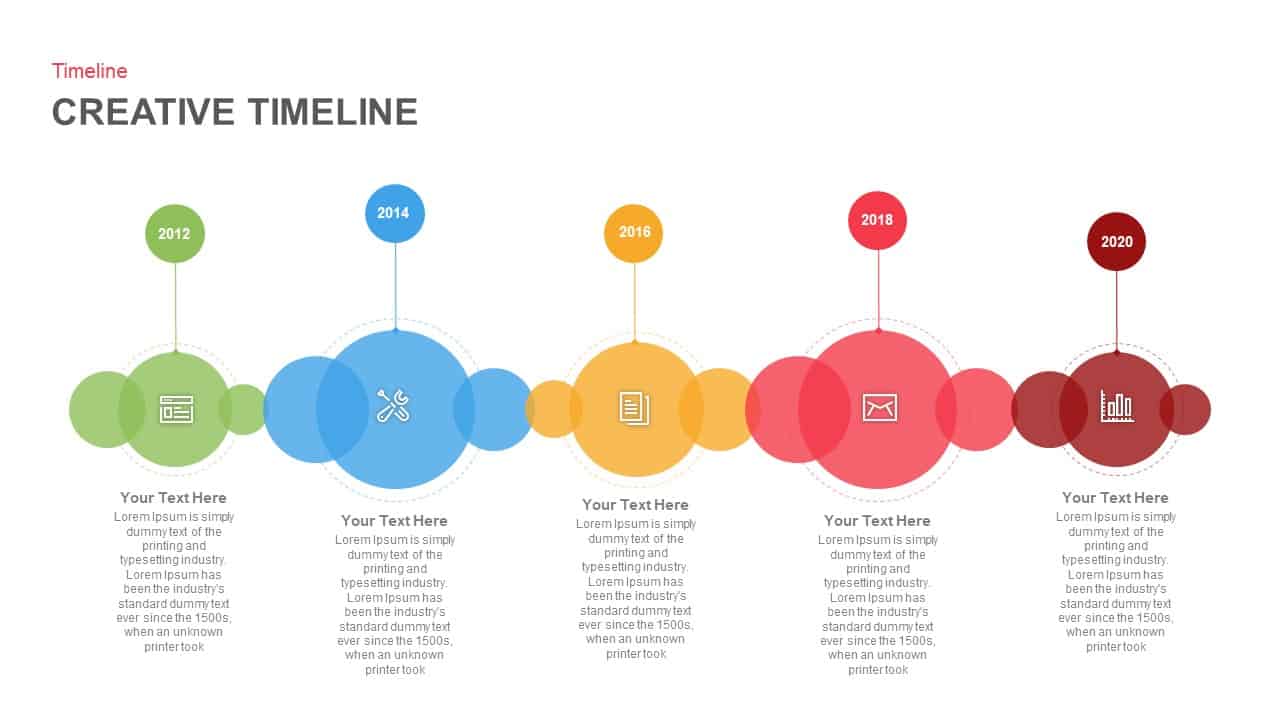
Creative Bubble Timeline Infographic Template for PowerPoint & Google Slides
Timeline
Multi-Year Timeline Infographic Template for PowerPoint & Google Slides
Timeline
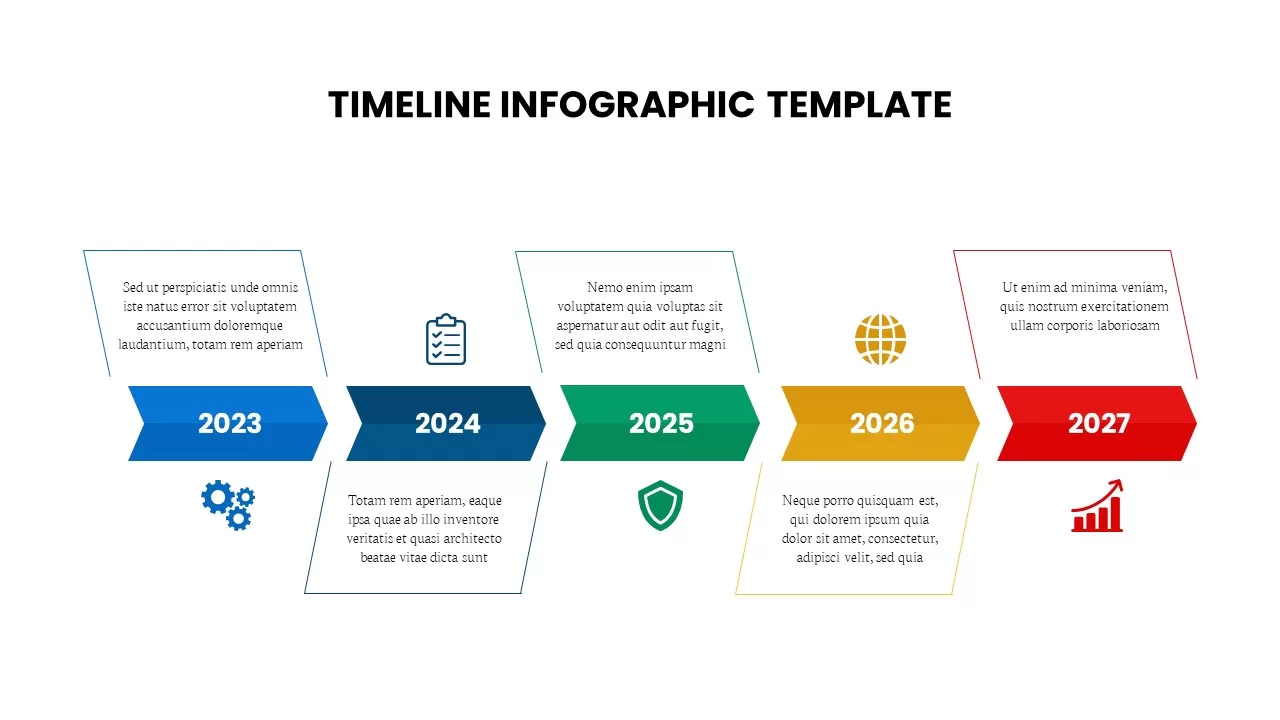
Arrow Timeline Infographic Slide Template for PowerPoint & Google Slides
Timeline
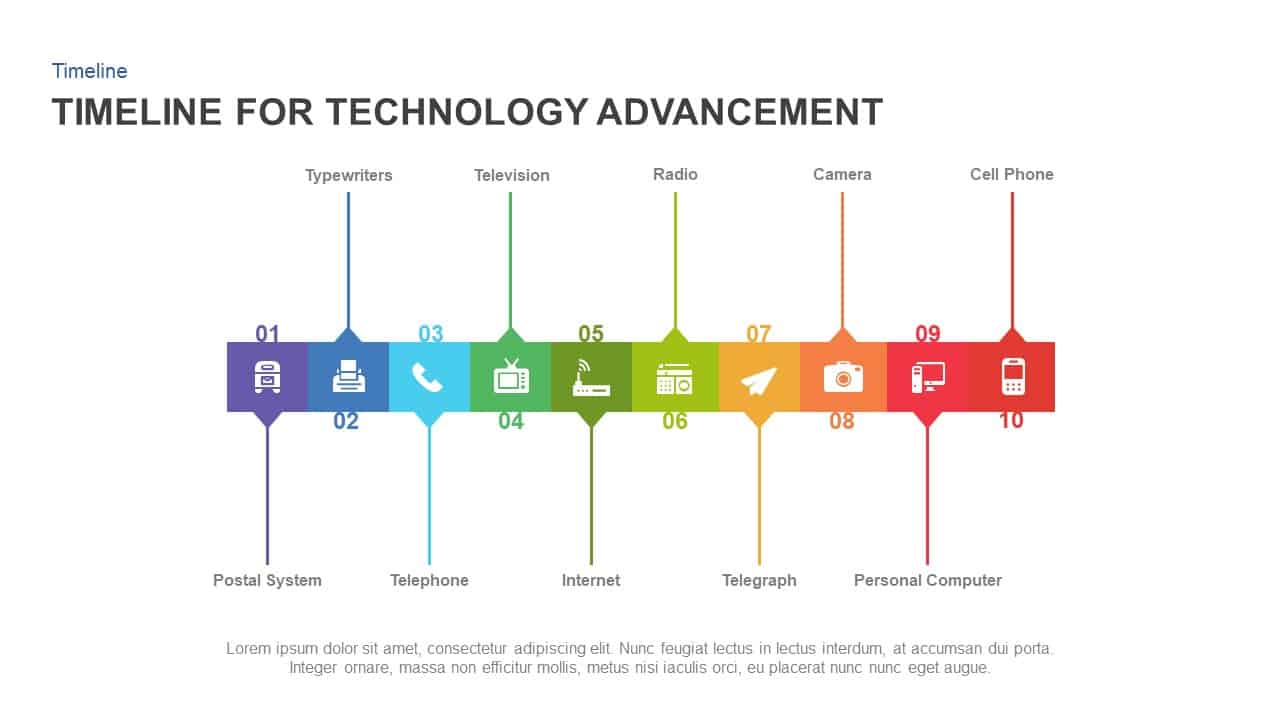
Technology Advancement Timeline Infographic Template for PowerPoint & Google Slides
Information Technology
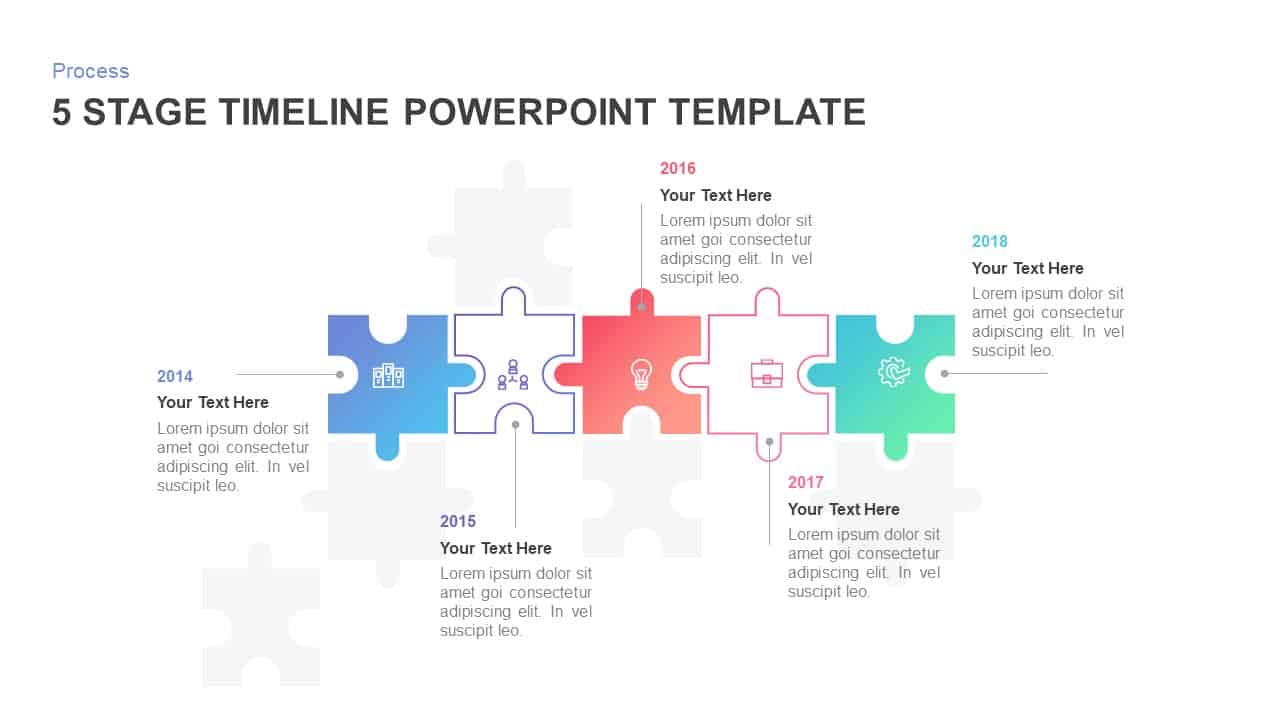
Animated 5-Stage Puzzle Timeline Infographic Template for PowerPoint & Google Slides
Timeline
5 Stage Circular Timeline Infographic Template for PowerPoint & Google Slides
Timeline
Six-Stage Timeline Infographic Template for PowerPoint & Google Slides
Timeline
5 Stage Timeline Infographic Slide Template for PowerPoint & Google Slides
Timeline
Five-Year Gradient Timeline Infographic Template for PowerPoint & Google Slides
Timeline
Five-Step Growth Timeline Infographic Template for PowerPoint & Google Slides
Timeline
Business Timeline Envelope Infographic Template for PowerPoint & Google Slides
Timeline
5-Stage Timeline Infographic Slide Template for PowerPoint & Google Slides
Timeline
Seven-Stage Hexagon Timeline Infographic Template for PowerPoint & Google Slides
Timeline
Lighthouse Timeline Infographic Template for PowerPoint & Google Slides
Timeline
Six-Stage Road Map Infographic Timeline Template for PowerPoint & Google Slides
Roadmap
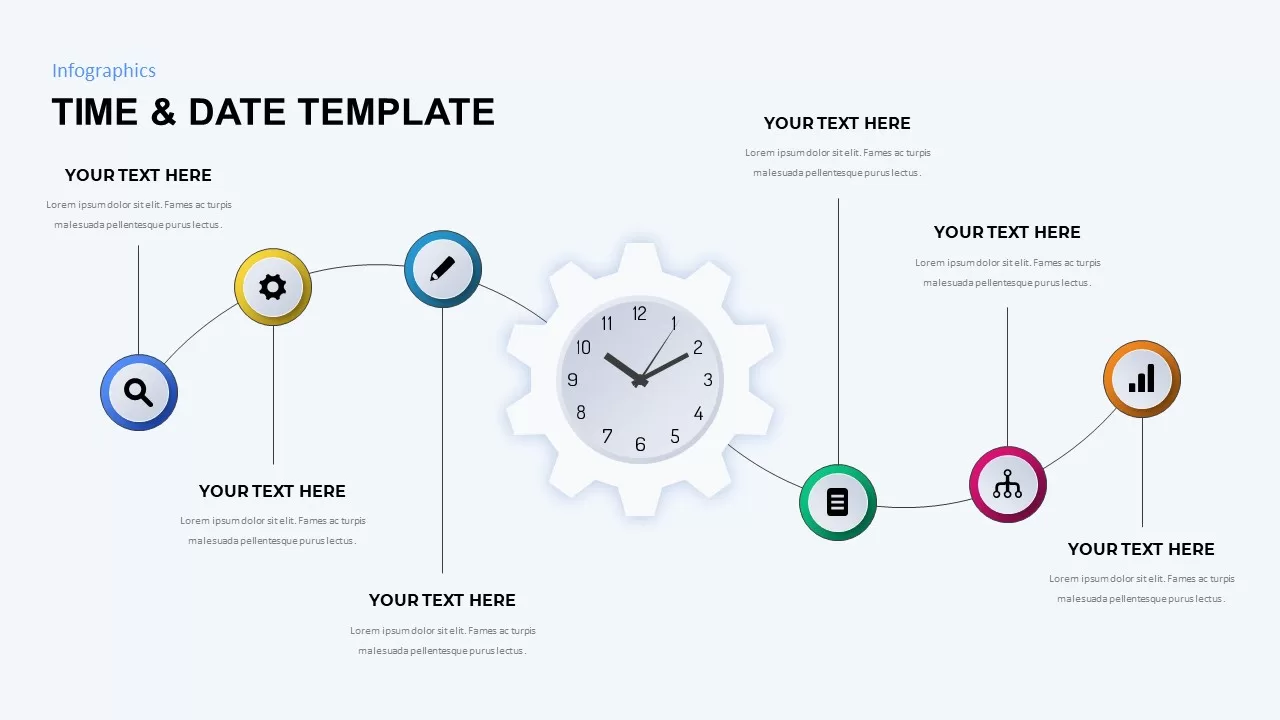
Time & Date Infographic Timeline Template for PowerPoint & Google Slides
Decks
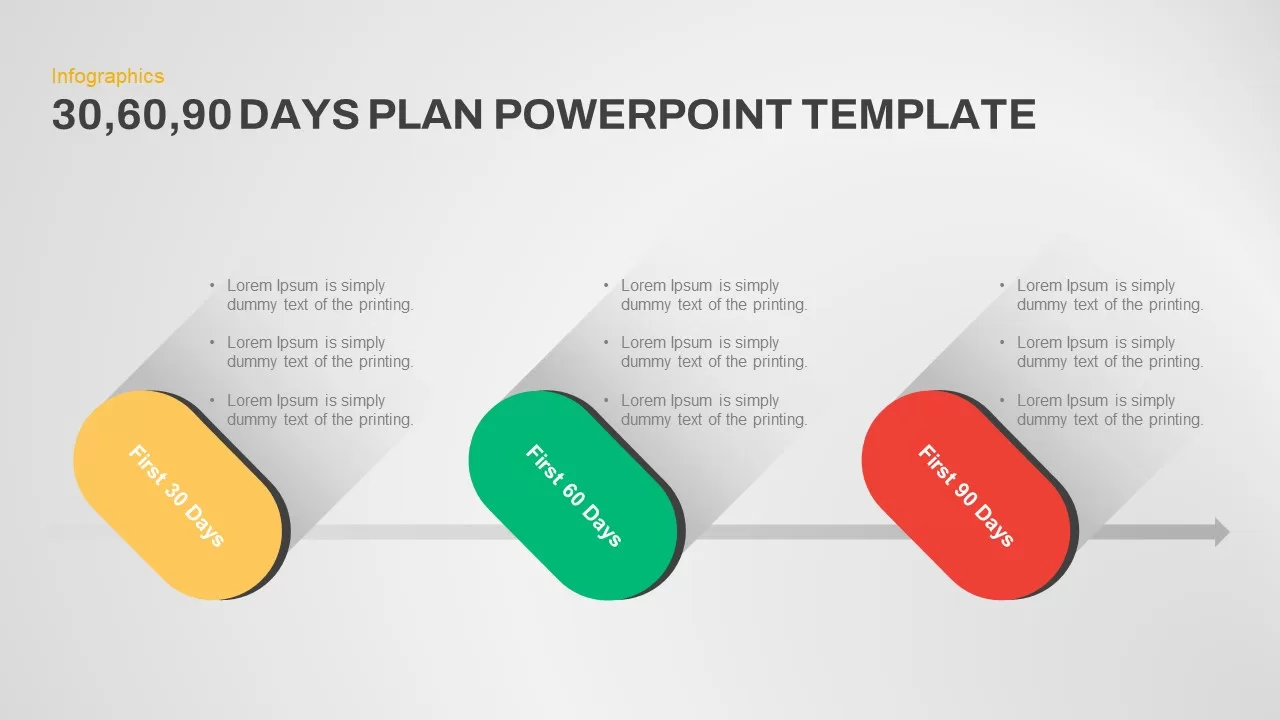
Pill-Style 30-60-90 Timeline Infographic Template for PowerPoint & Google Slides
Timeline
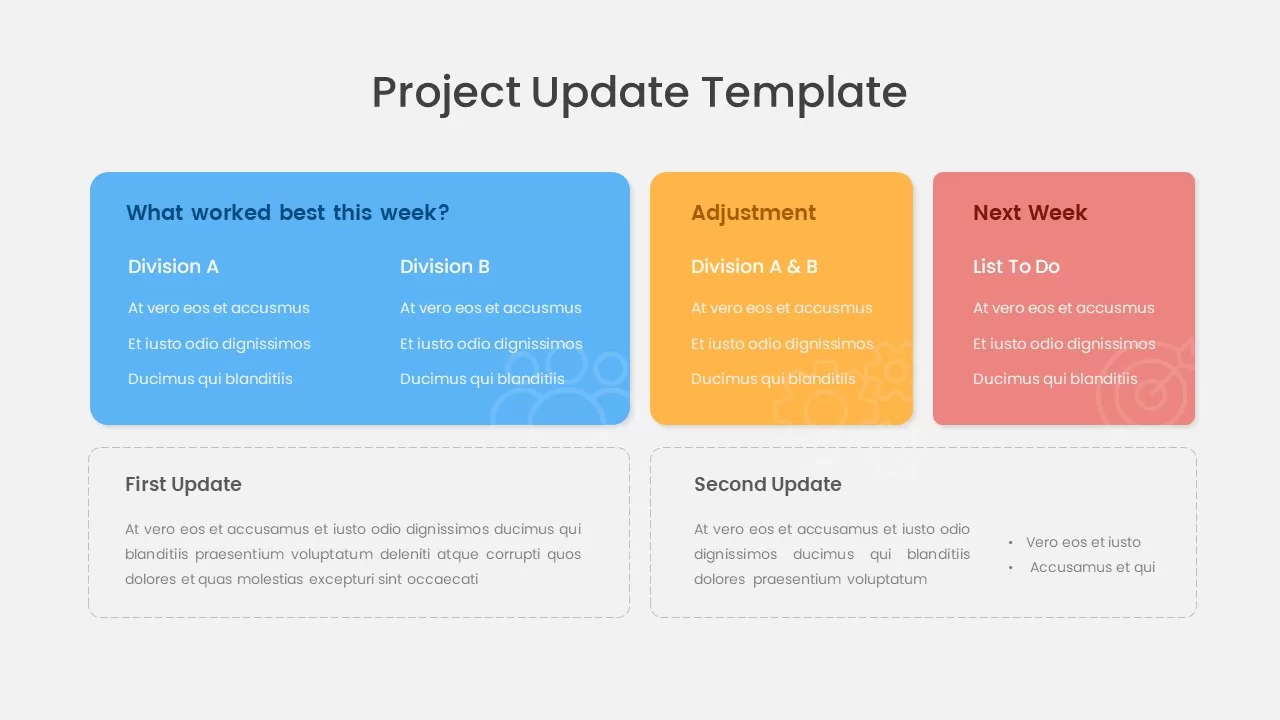
Project Update & Timeline Infographic Template for PowerPoint & Google Slides
Business
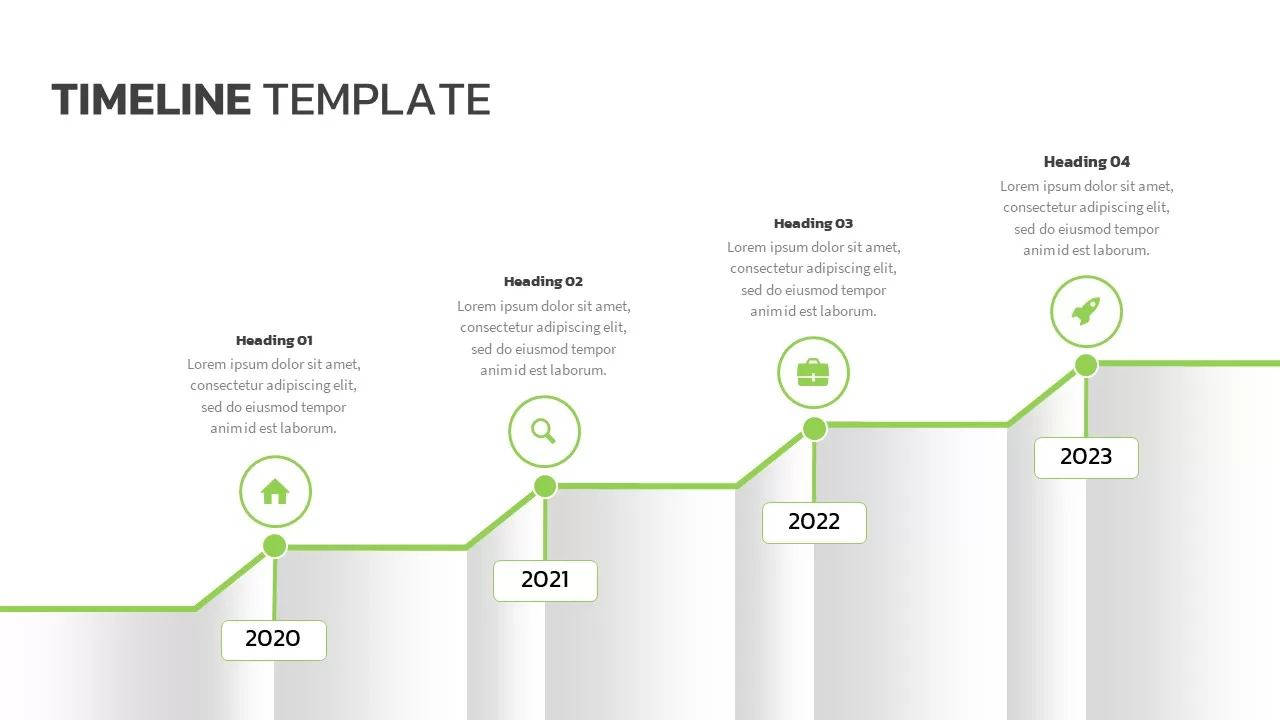
Modern Green Timeline Infographic Template for PowerPoint & Google Slides
Timeline
Free Multi-Year Arrow Timeline Infographic Template for PowerPoint & Google Slides
Timeline
Free
Free Five-Step Circular Timeline Infographic Template for PowerPoint & Google Slides
Timeline
Free
Free Colorful Roadmap Timeline Infographic Template for PowerPoint & Google Slides
Roadmap
Free
Timeline Infographic Steps template for PowerPoint & Google Slides
Business Plan
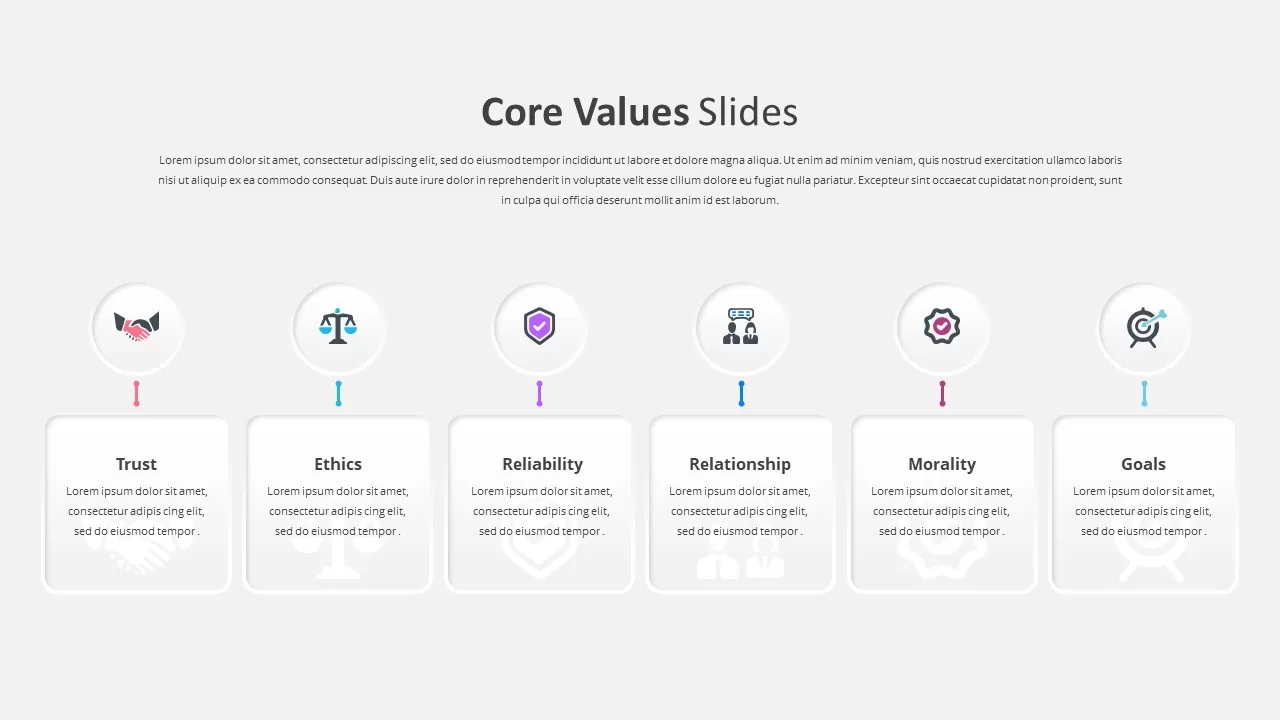
Six Core Values Infographic Timeline Template for PowerPoint & Google Slides
Comparison
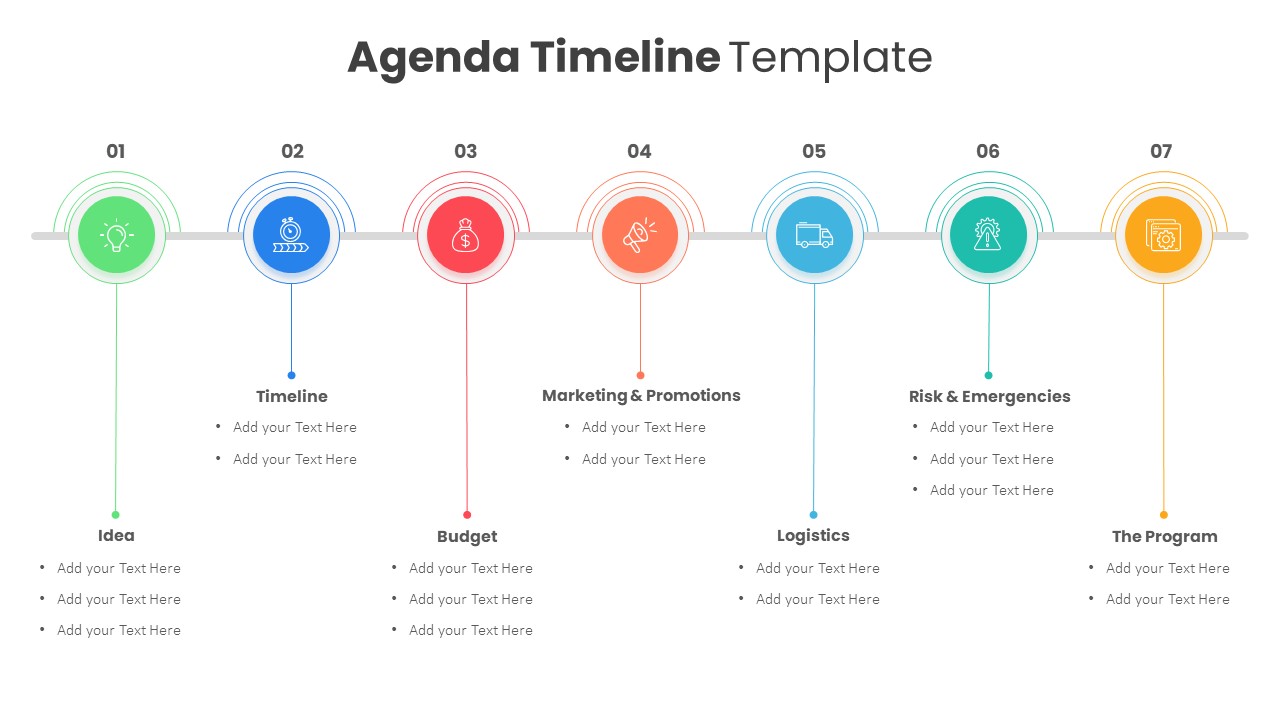
Colorful Agenda Timeline Infographic Template for PowerPoint & Google Slides
Agenda
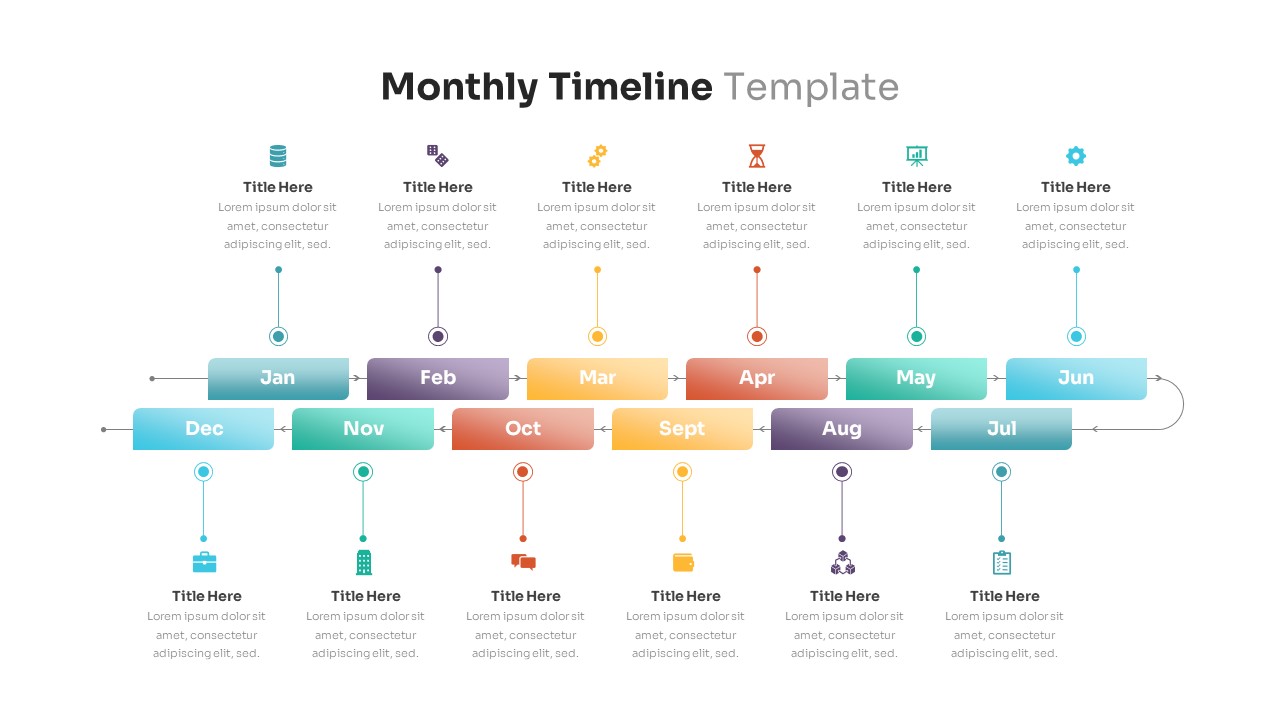
Editable Monthly Timeline Infographic Template for PowerPoint & Google Slides
Timeline
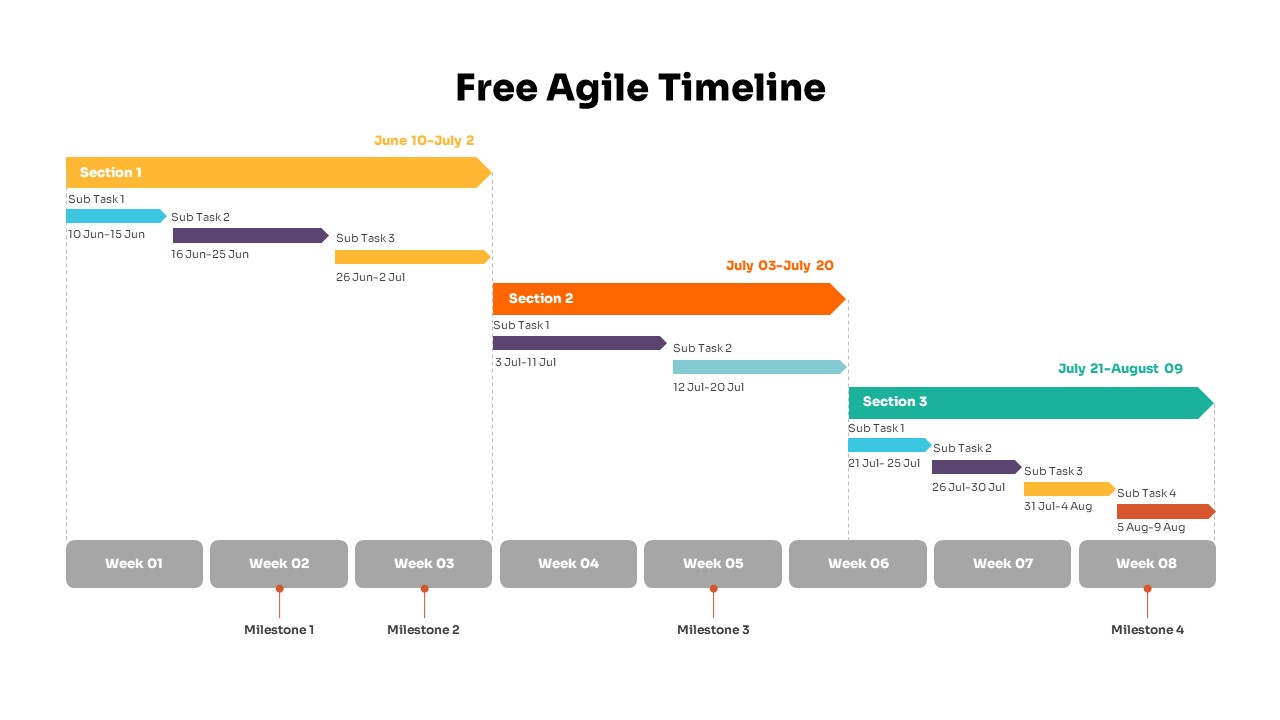
Colorful Agile Timeline Infographic Template for PowerPoint & Google Slides
Timeline
Free
Dynamic Chevron Timeline Infographic Template for PowerPoint & Google Slides
Timeline
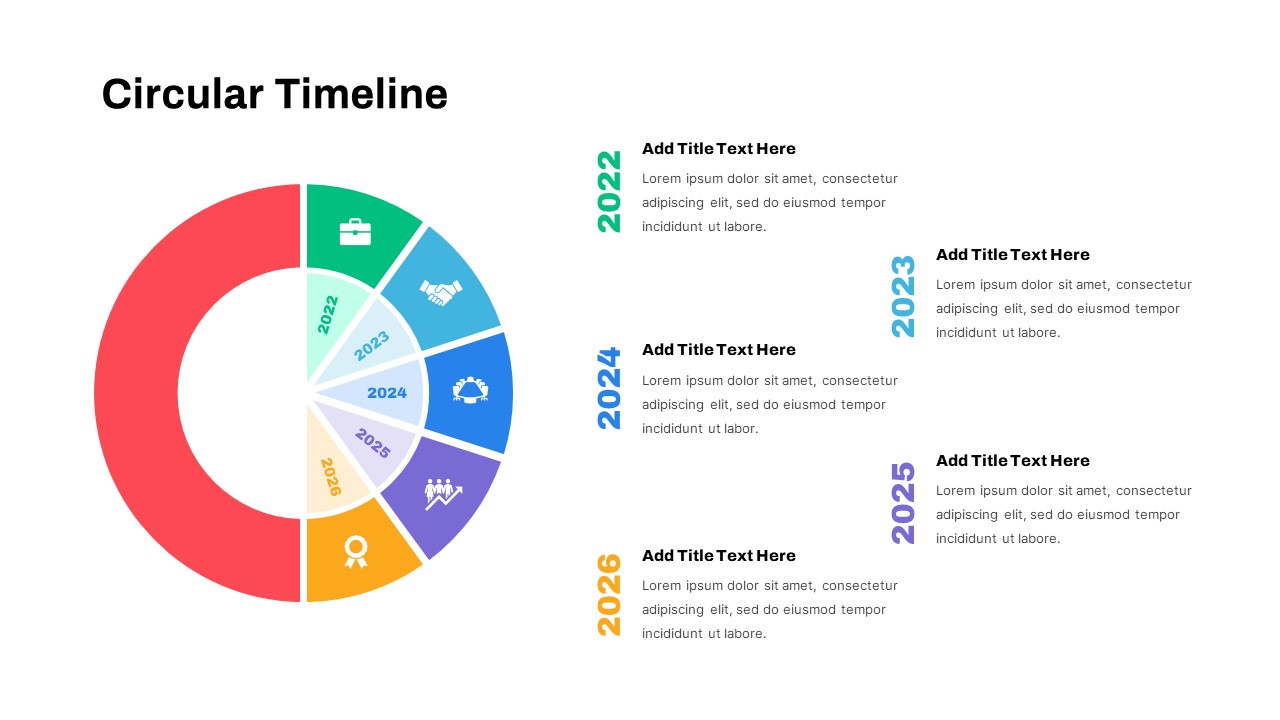
Circular Timeline Infographic Template for PowerPoint & Google Slides
Timeline
Minimalist Timeline Infographic Template for PowerPoint & Google Slides
Timeline
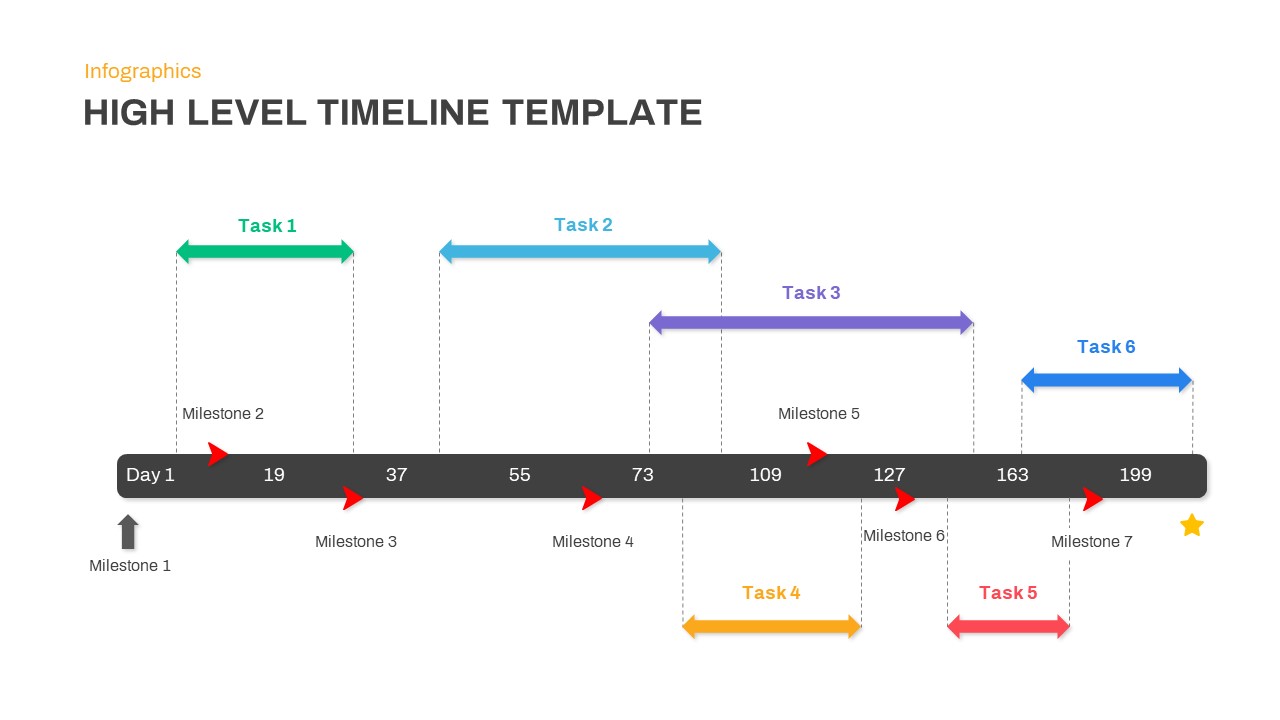
High-Level Timeline Infographic Template for PowerPoint & Google Slides
Timeline
Modern Six-Point Timeline Infographic Template for PowerPoint & Google Slides
Timeline
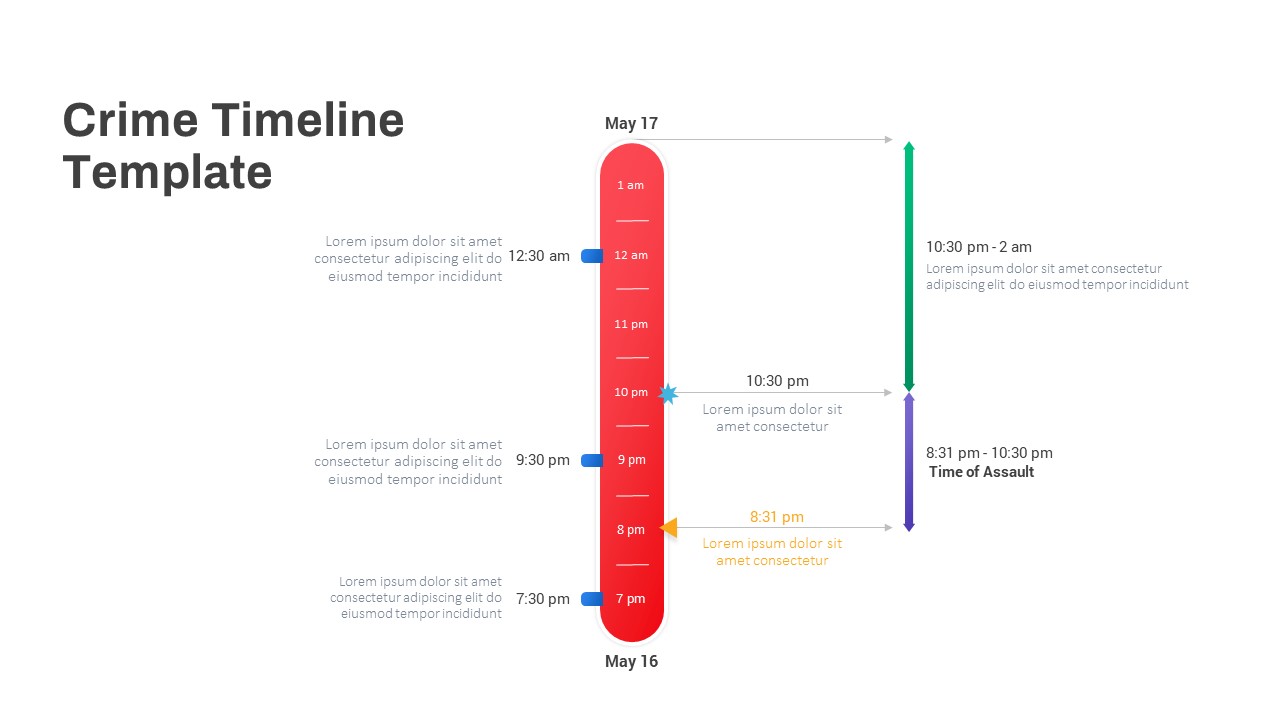
Vertical Crime Timeline Infographic Template for PowerPoint & Google Slides
Timeline
Fishbone Timeline Infographic Series Template for PowerPoint & Google Slides
Manufacturing
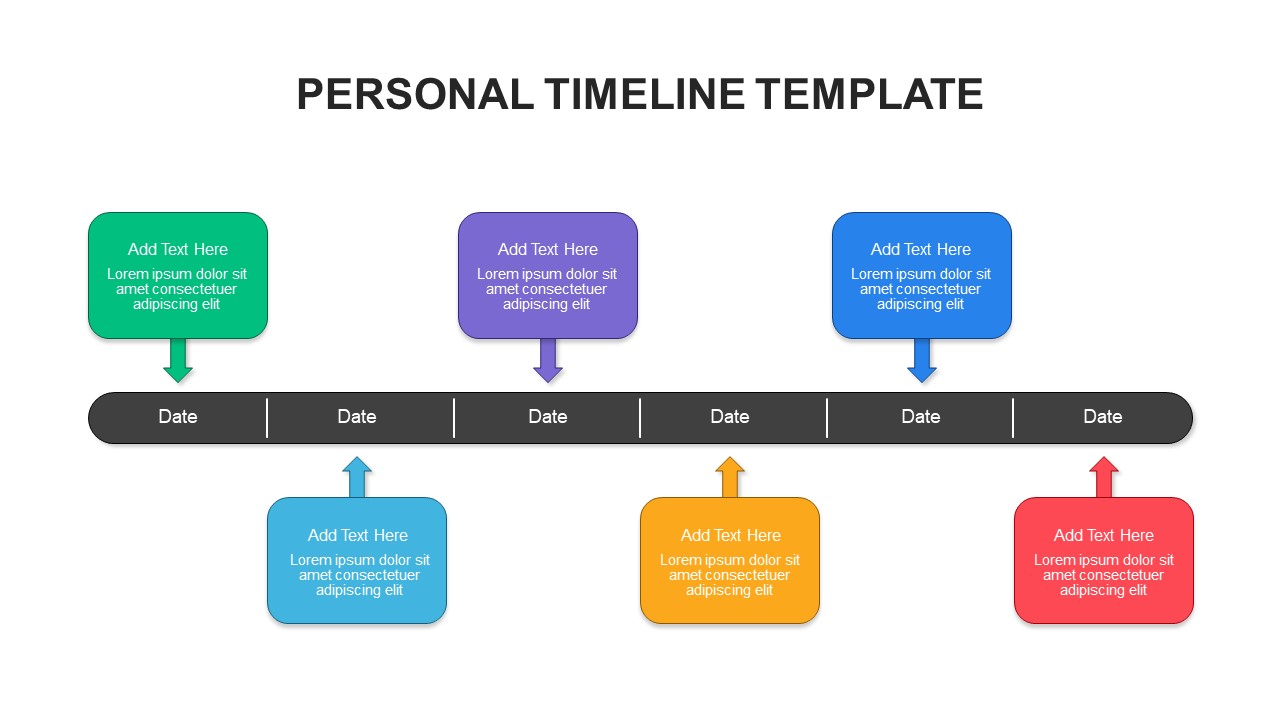
Personal Timeline Infographic Template for PowerPoint & Google Slides
Timeline
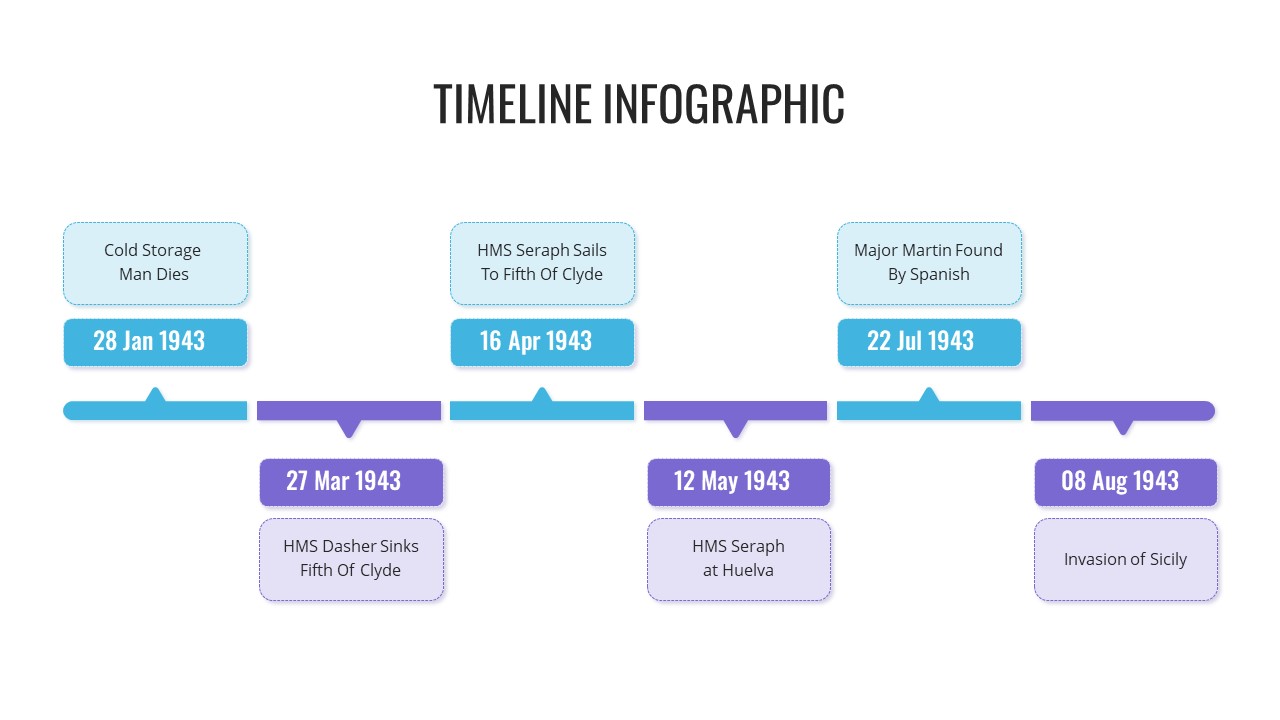
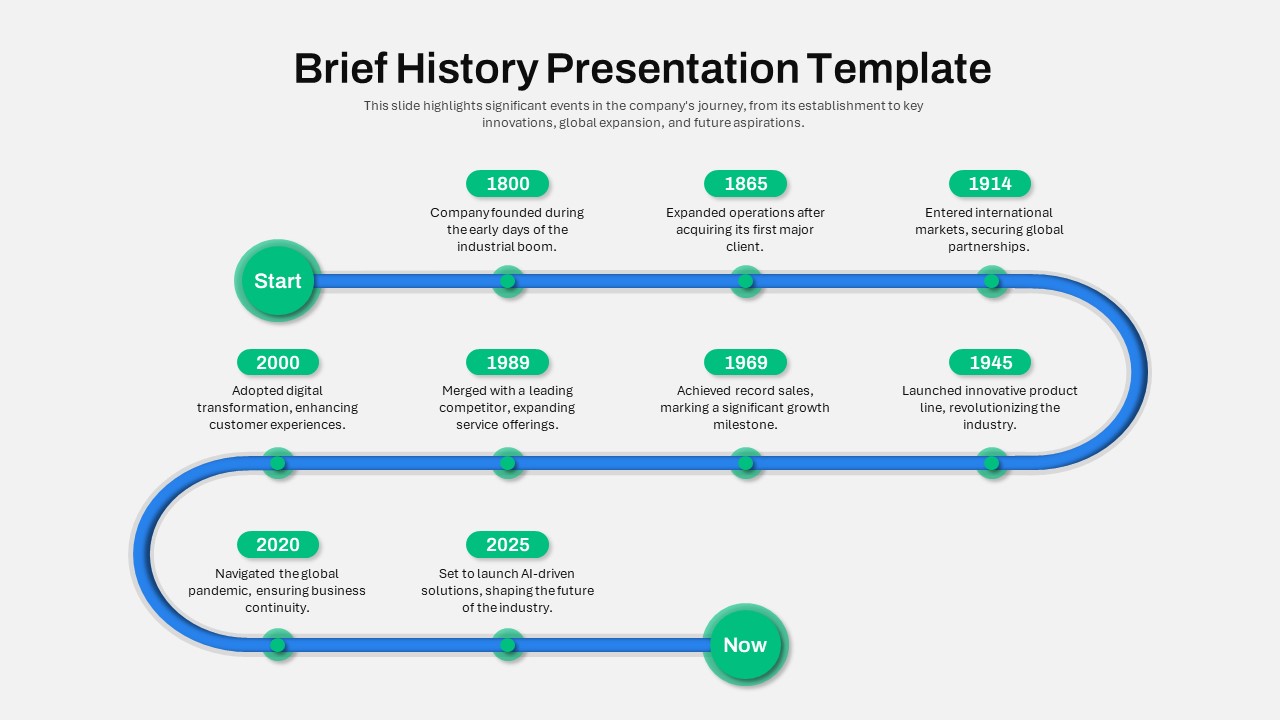
Brief History Timeline Infographic Template for PowerPoint & Google Slides
Timeline
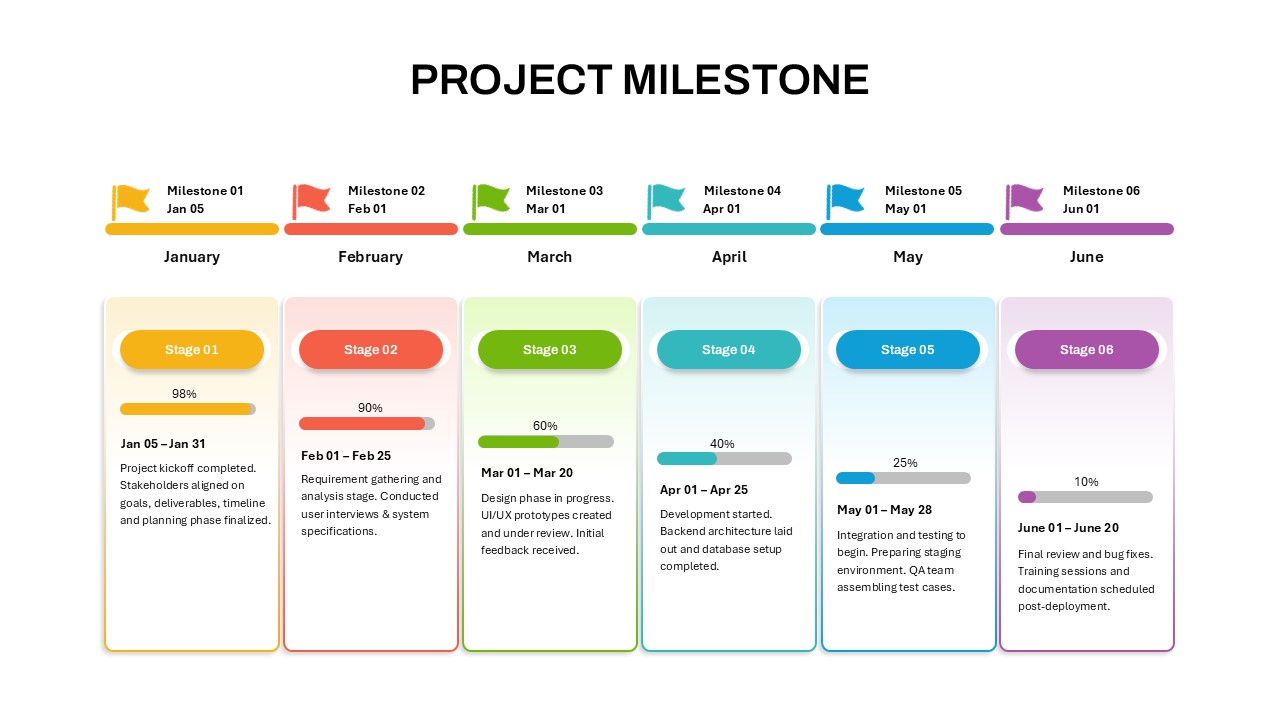
Project Milestone Timeline Infographic Template for PowerPoint & Google Slides
Timeline
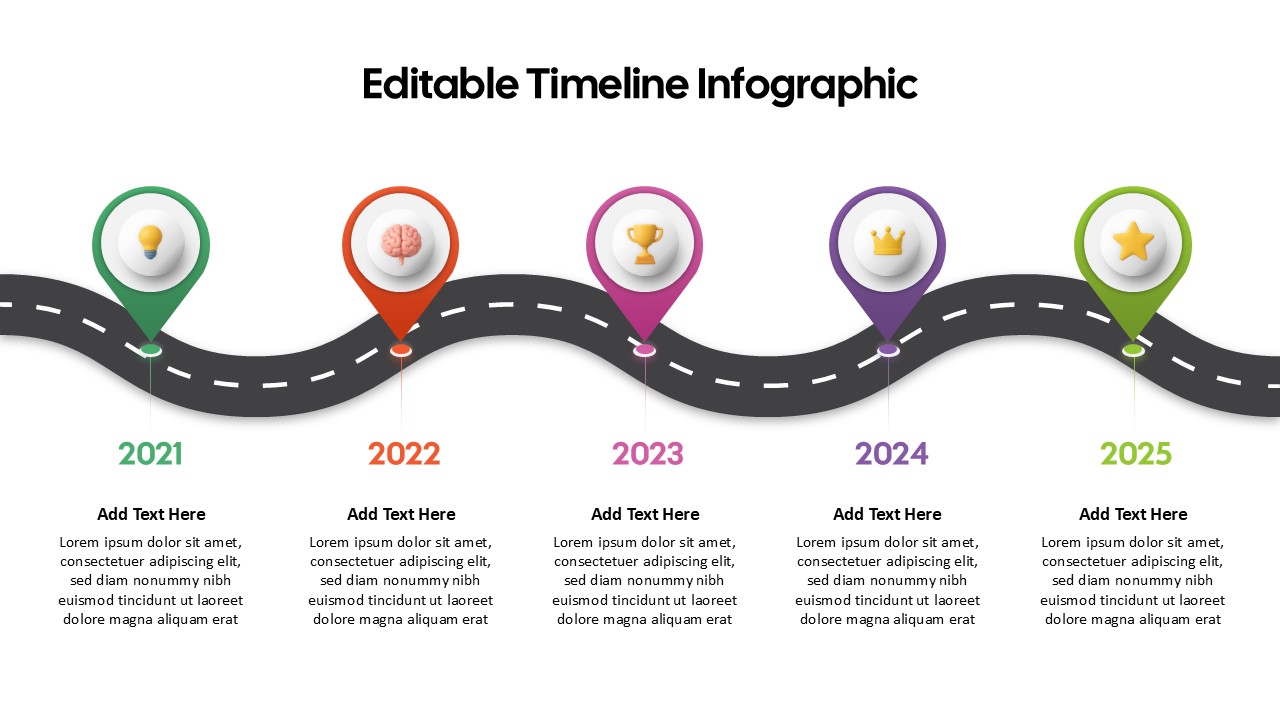
Curved Road Timeline Infographic Template for PowerPoint & Google Slides
Timeline
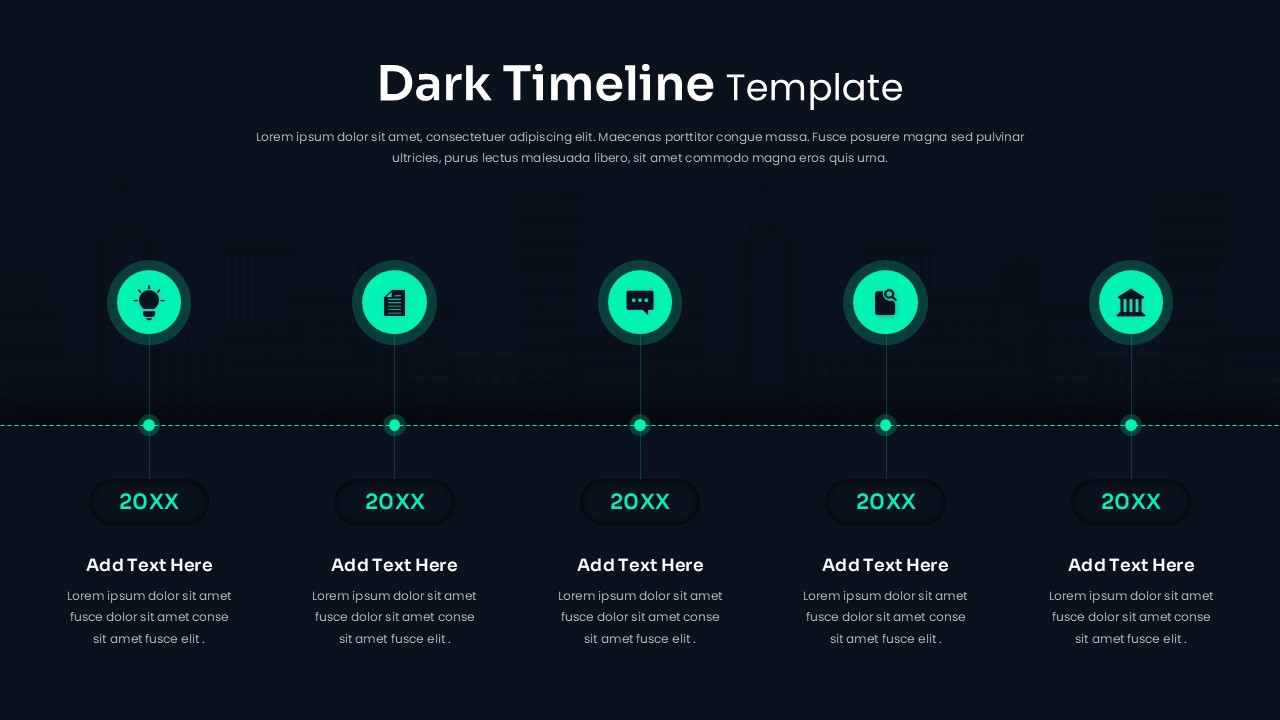
Dark Horizontal Timeline Infographic Template for PowerPoint & Google Slides
Timeline
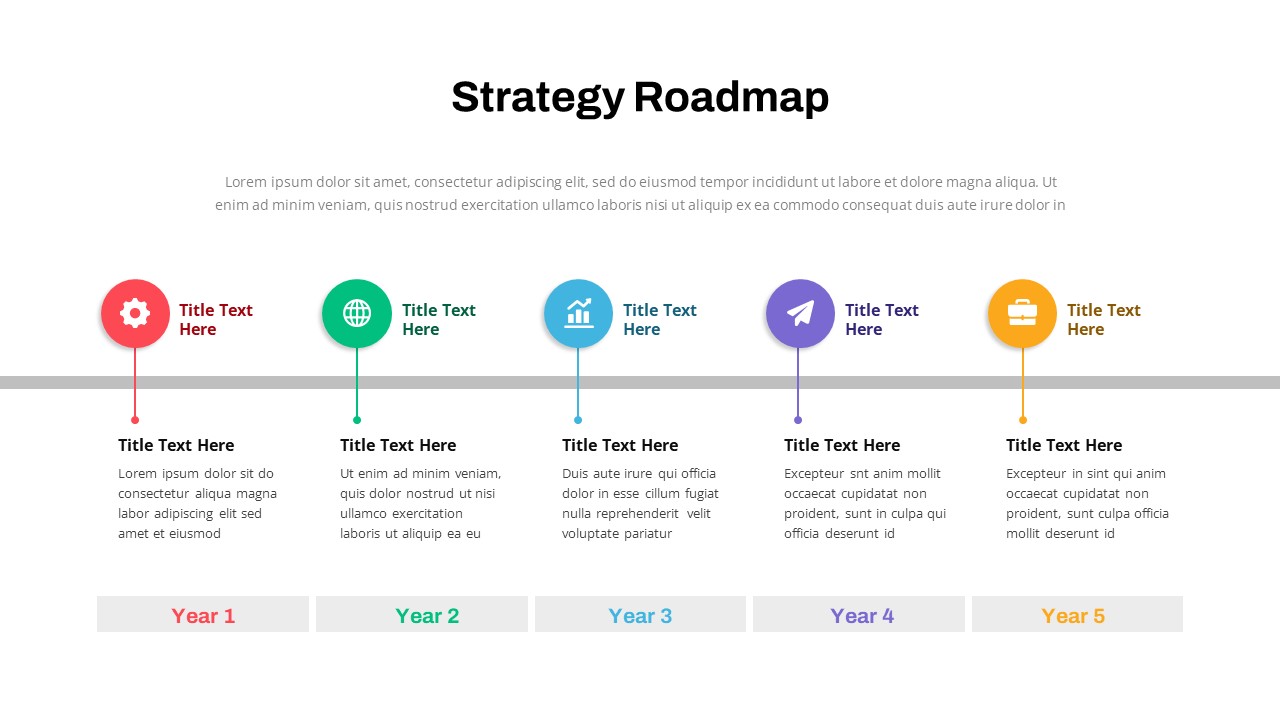
Strategy Roadmap Timeline Slides Template for PowerPoint & Google Slides
Roadmap
Google Ads Optimization & Performance Infographic Template for PowerPoint & Google Slides
Digital Marketing
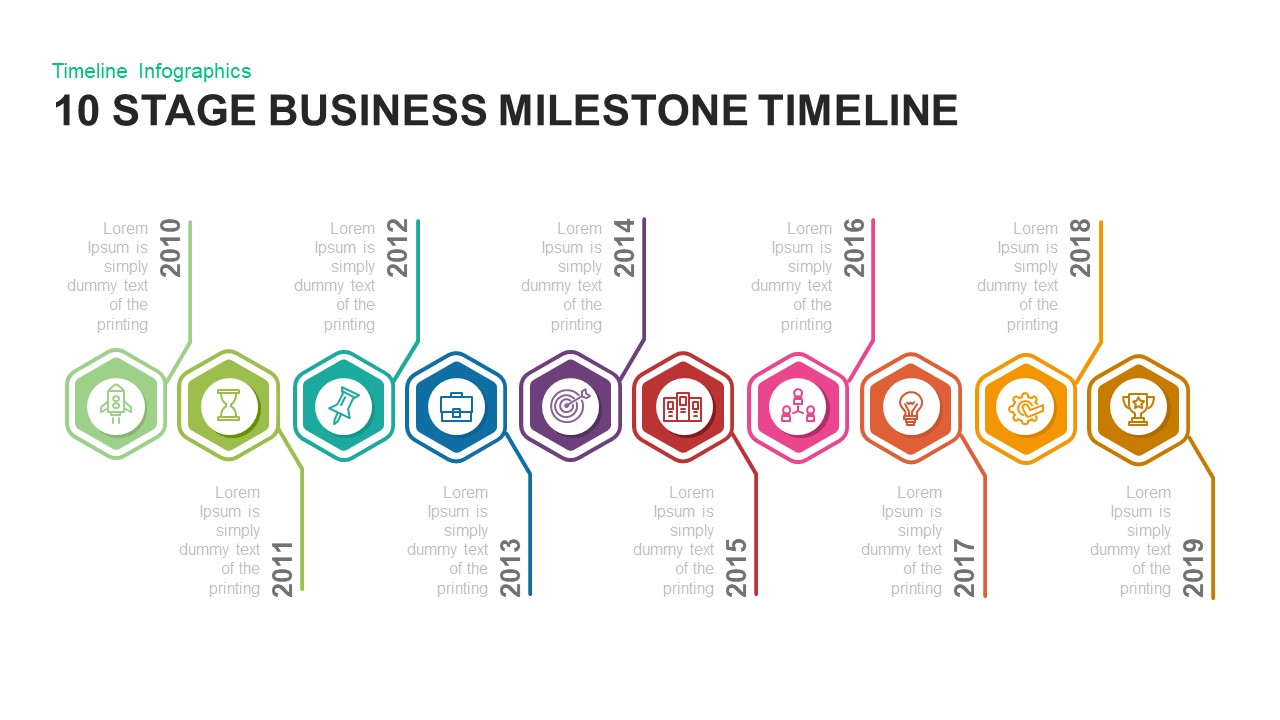
10 Stage Business Milestone Timeline PowerPoint Template for PowerPoint & Google Slides
Timeline
SQ3R Study Strategy Infographic Slides Template for PowerPoint & Google Slides
Business Strategy
Six Double Diamond Infographic Slides Template for PowerPoint & Google Slides
Process
Sales Process Infographic Slides Pack Template for PowerPoint & Google Slides
Process
Casino/Poker Chips Infographic Slides template for PowerPoint & Google Slides
Business Strategy
Agenda Infographic Pack of 2 Slides Template for PowerPoint & Google Slides
Agenda
Quad Chart Infographic Pack of 8 Slides Template for PowerPoint & Google Slides
Comparison Chart
Four Options Infographic Slides Template for PowerPoint & Google Slides
Comparison
Game Plan Infographic Slides Pack Template for PowerPoint & Google Slides
Infographics
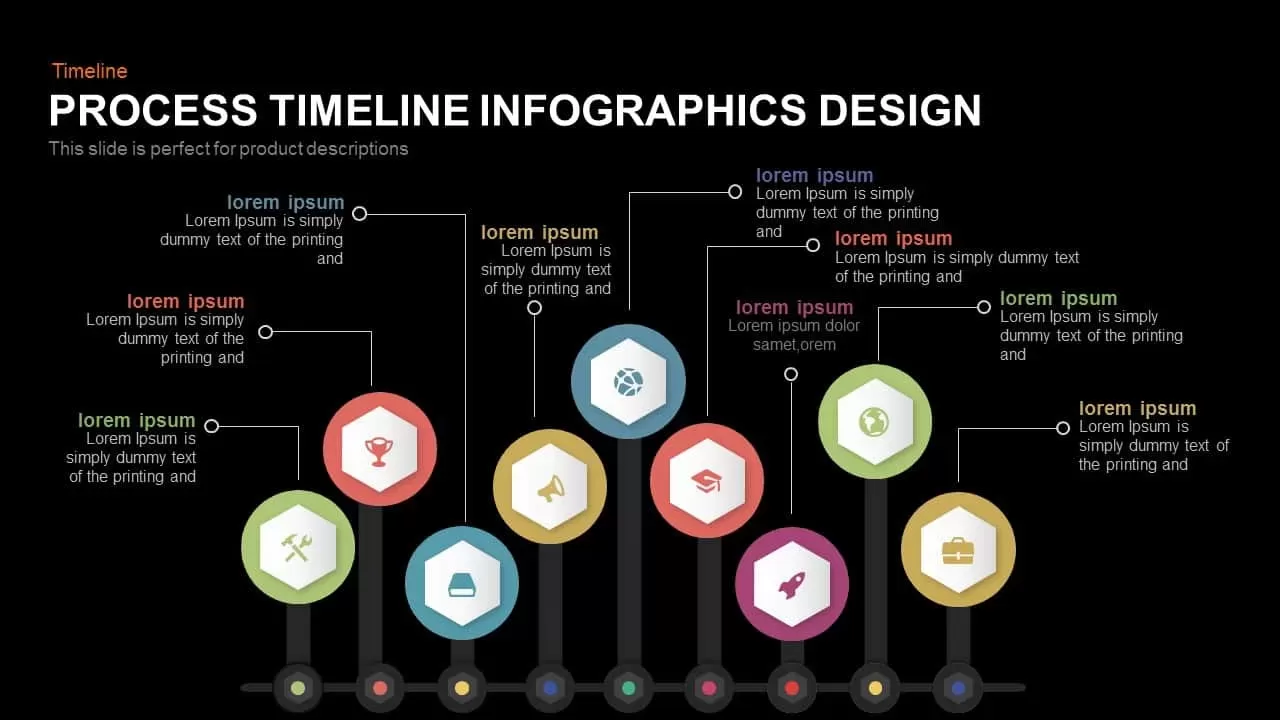
Process Timeline Infographics Design template for PowerPoint & Google Slides
Timeline
Timeline Arrow Infographics Diagram Template for PowerPoint & Google Slides
Timeline
Five-Point Circle Timeline Diagram Template for PowerPoint & Google Slides
Timeline
Curved Road Roadmap Timeline Diagram Template for PowerPoint & Google Slides
Roadmap
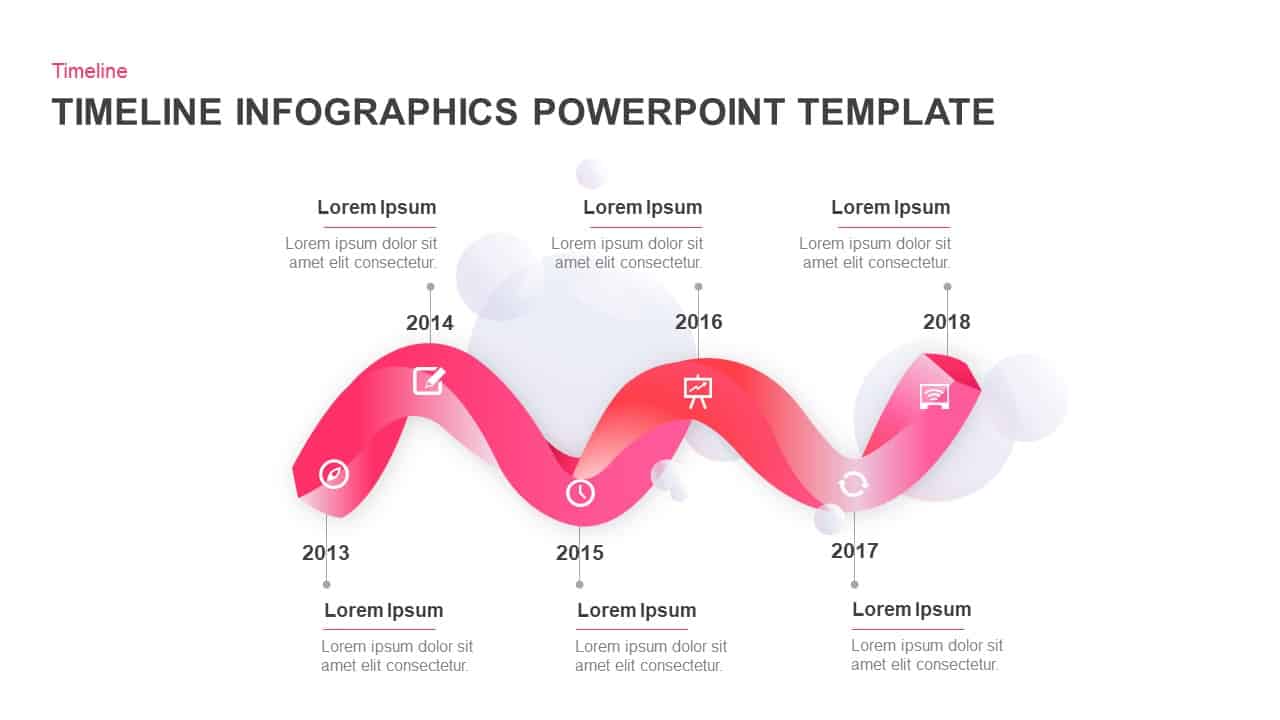
Wavy Ribbon Timeline Infographics Template for PowerPoint & Google Slides
Timeline
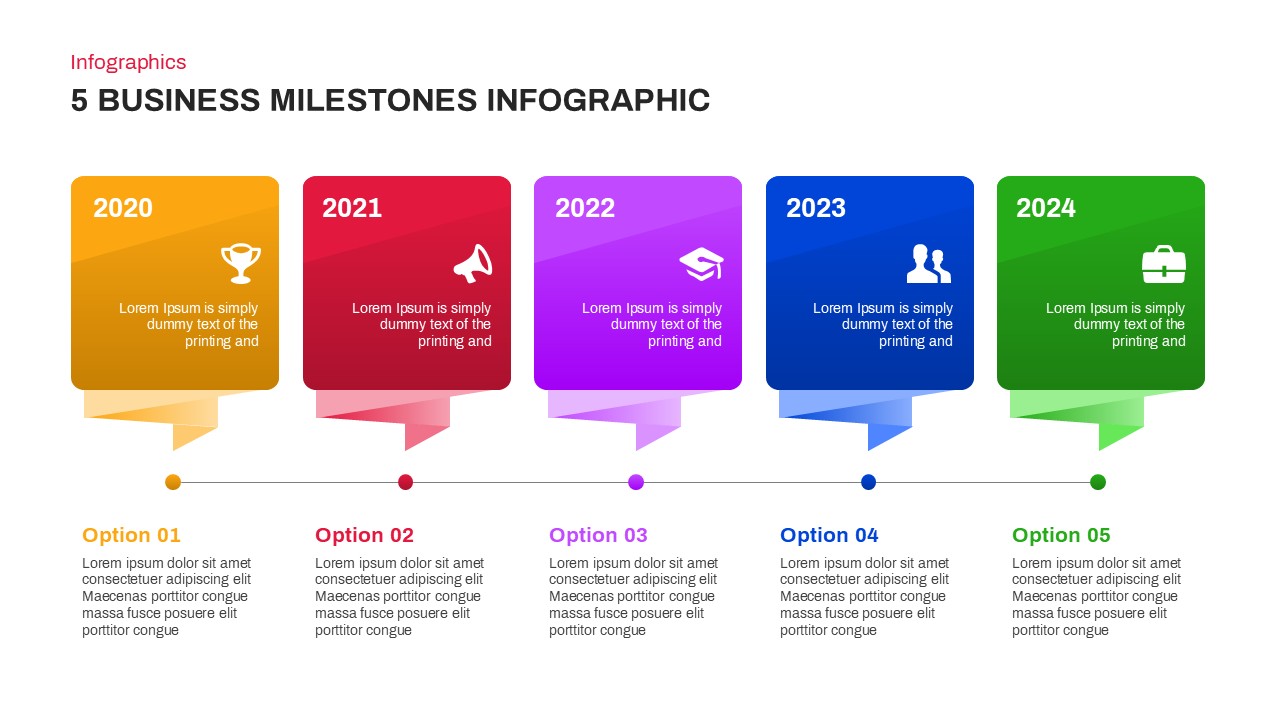
5 Business Milestones Timeline Template for PowerPoint & Google Slides
Timeline
Colorful Five-Year Timeline Layout Template for PowerPoint & Google Slides
Timeline
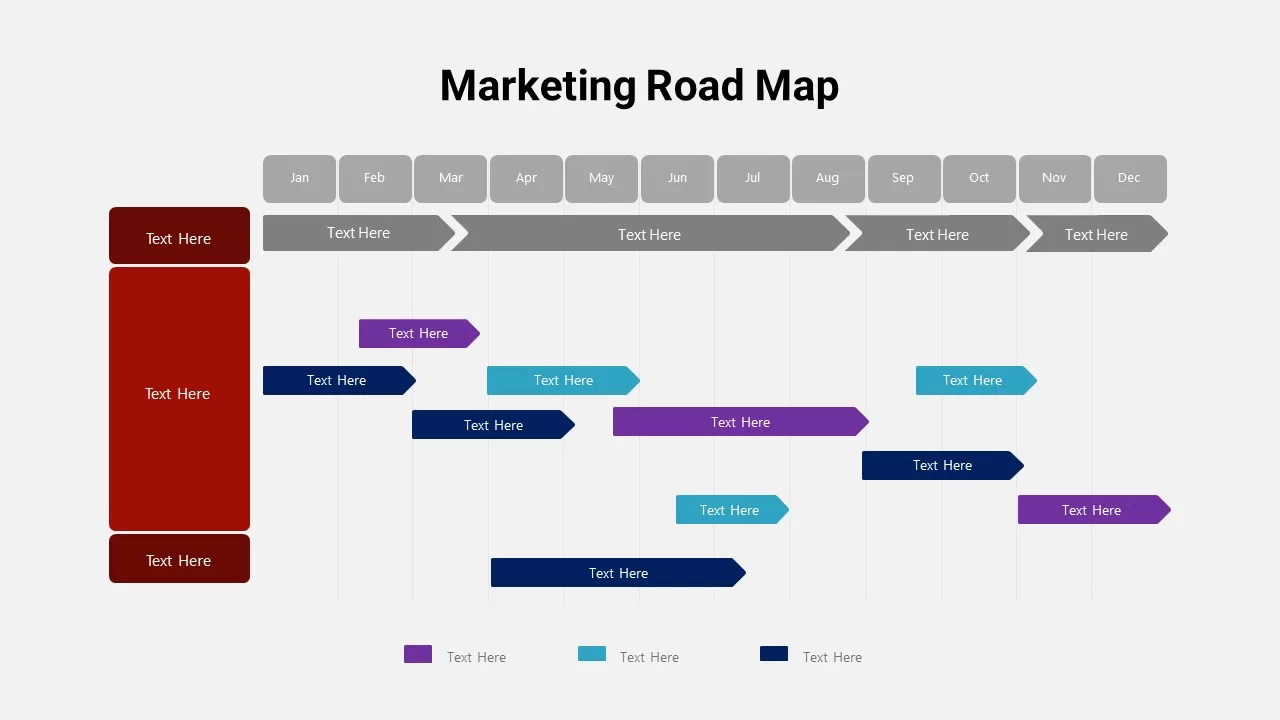
Detailed Marketing Road Map Timeline Template for PowerPoint & Google Slides
Timeline
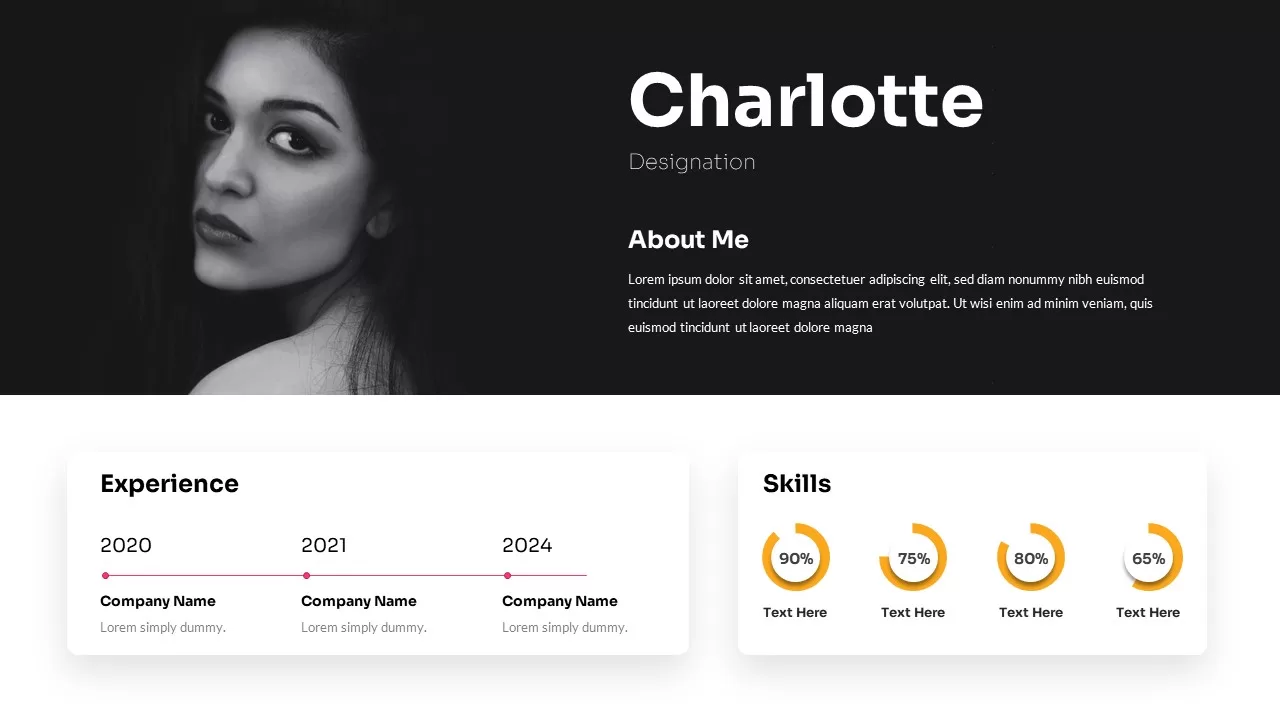
Profile Slide with Timeline & Skills Template for PowerPoint & Google Slides
Our Team
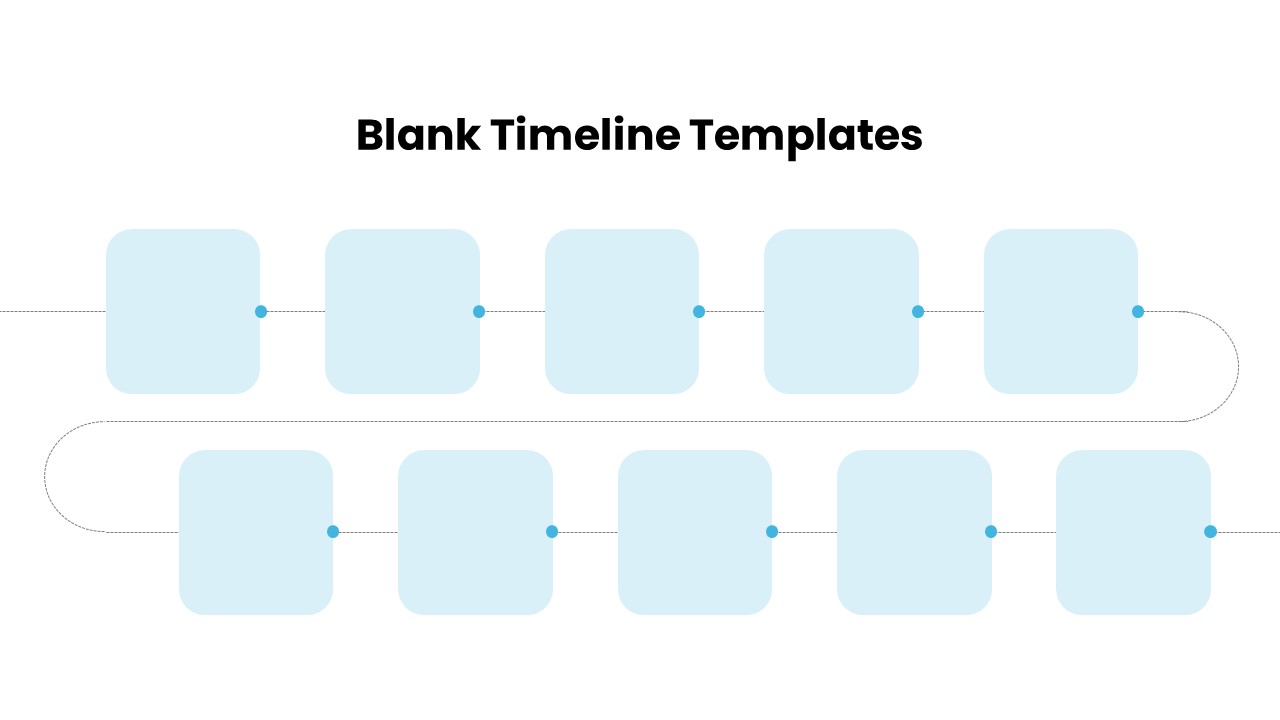
Two-Row Ten-Step Timeline Template for PowerPoint & Google Slides
Timeline
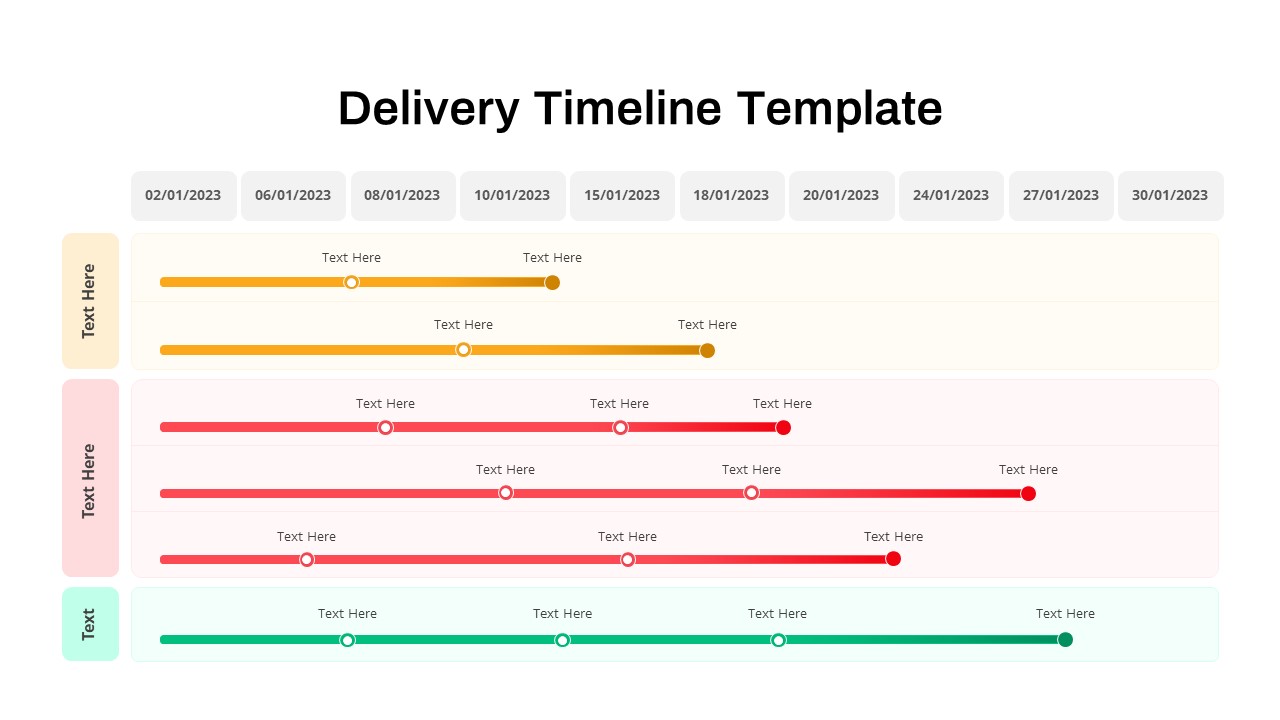
Delivery Timeline Multi-Row Template for PowerPoint & Google Slides
Timeline
Multicolor Alternating Timeline Roadmap Template for PowerPoint & Google Slides
Timeline
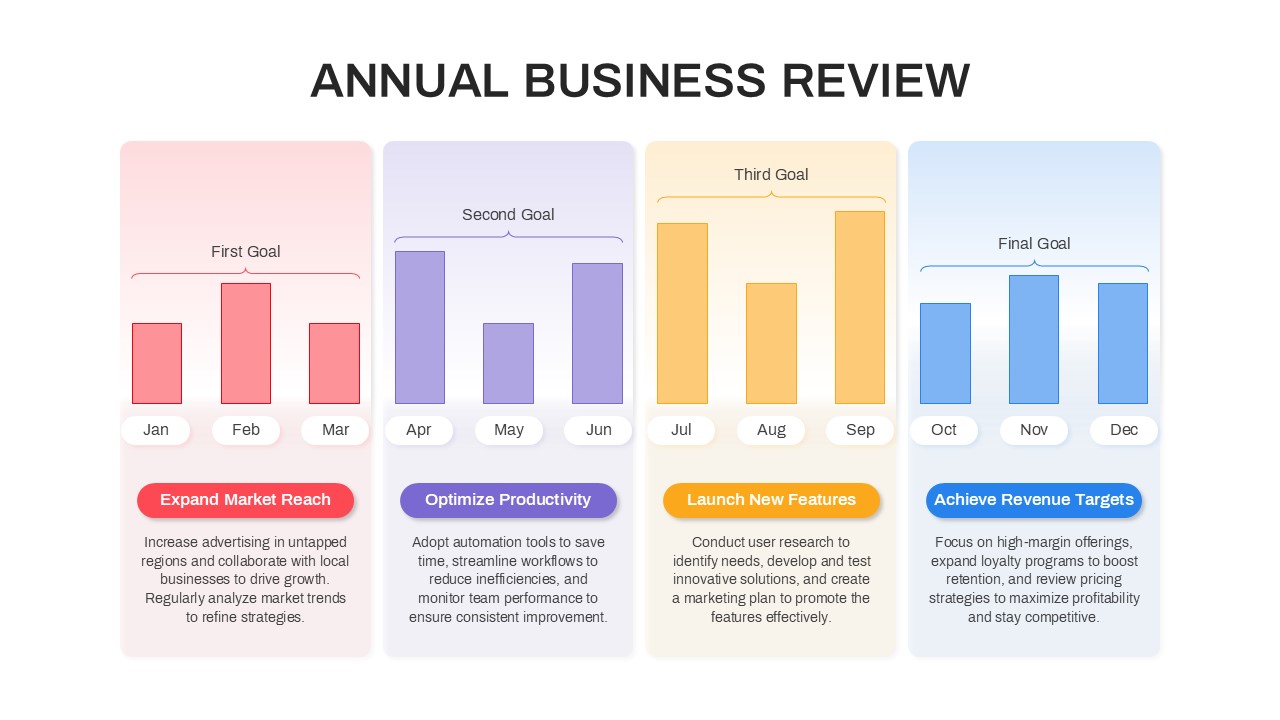
Annual Business Review Timeline Template for PowerPoint & Google Slides
Timeline
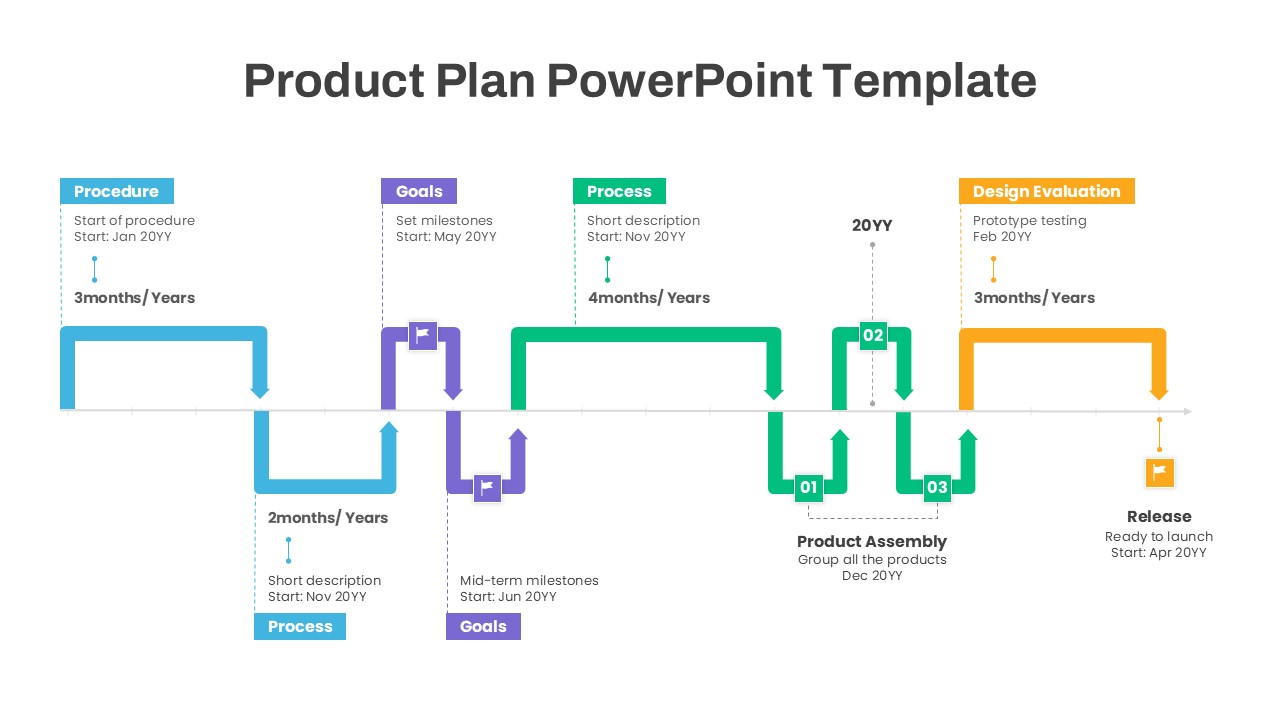
Product Plan Timeline and Milestones Template for PowerPoint & Google Slides
Timeline
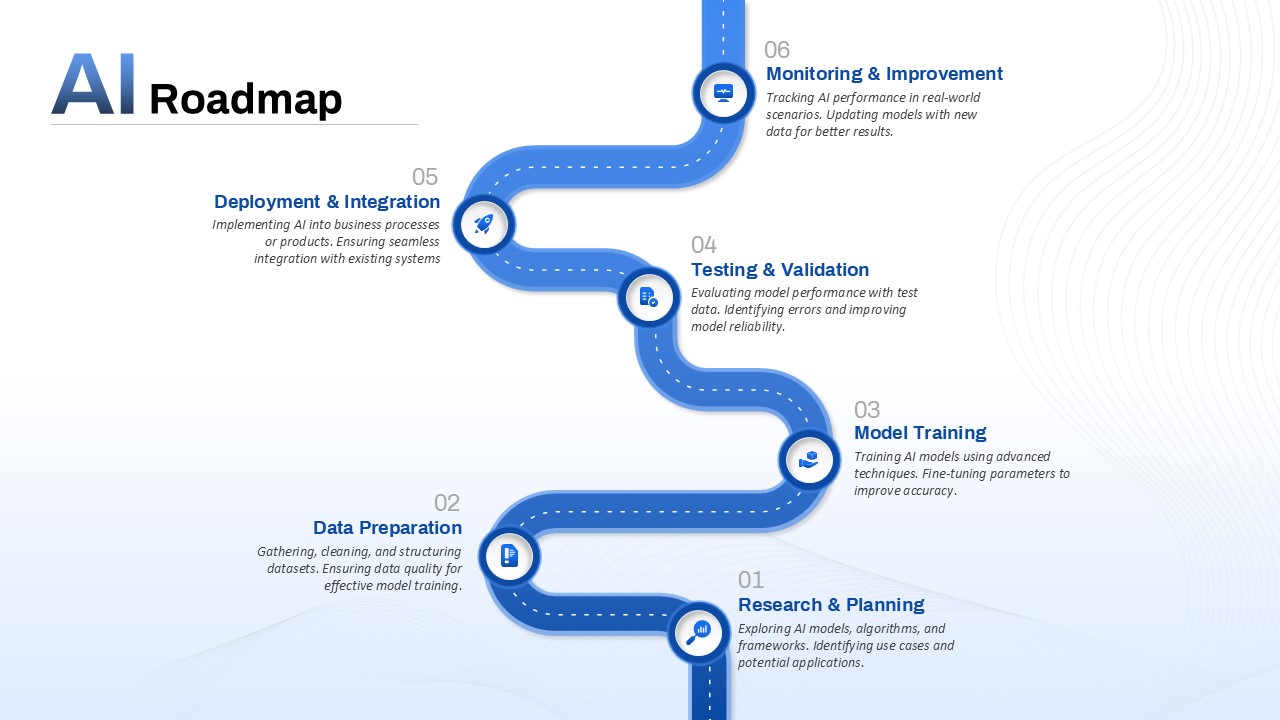
AI Roadmap & Planning Timeline Template for PowerPoint & Google Slides
Roadmap
Social Media Timeline template for PowerPoint & Google Slides
Timeline
Business Growth Story timeline template for PowerPoint & Google Slides
Timeline
Business Launch Timeline Roadmap 5-Phase Template for PowerPoint & Google Slides
Business