Punnett Square Genetic Cross Diagram Template for PowerPoint & Google Slides


Description
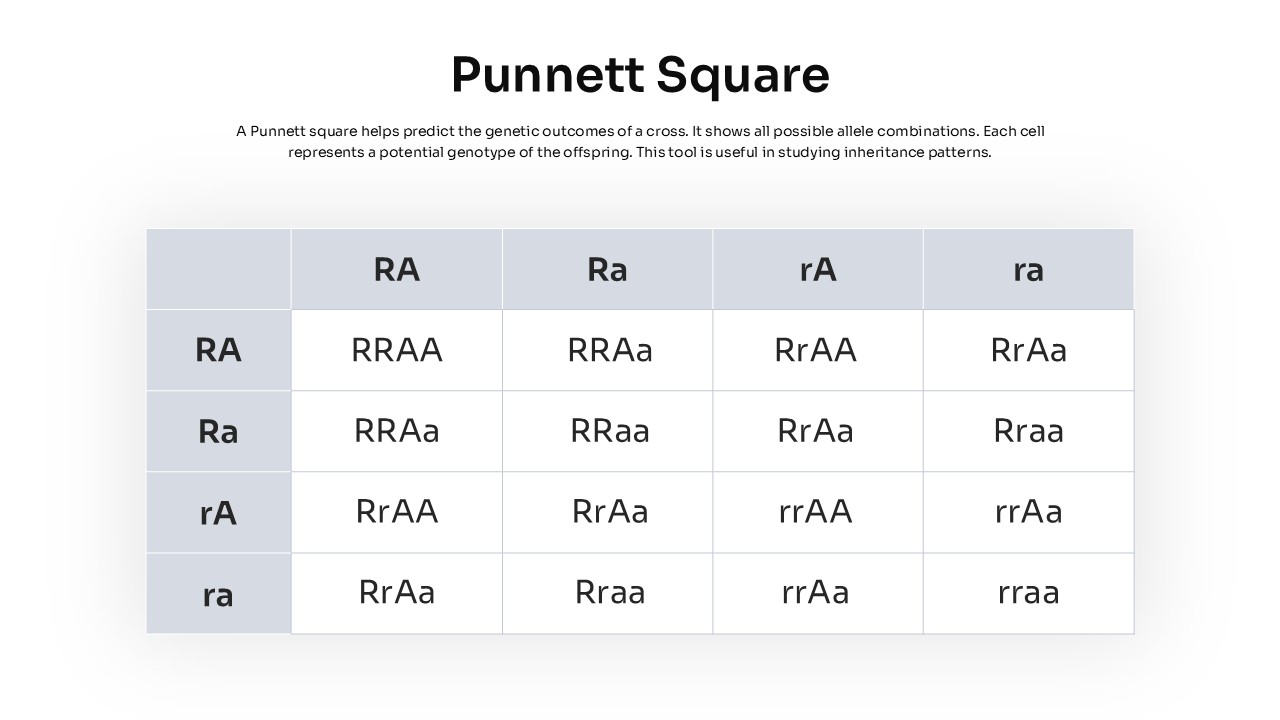
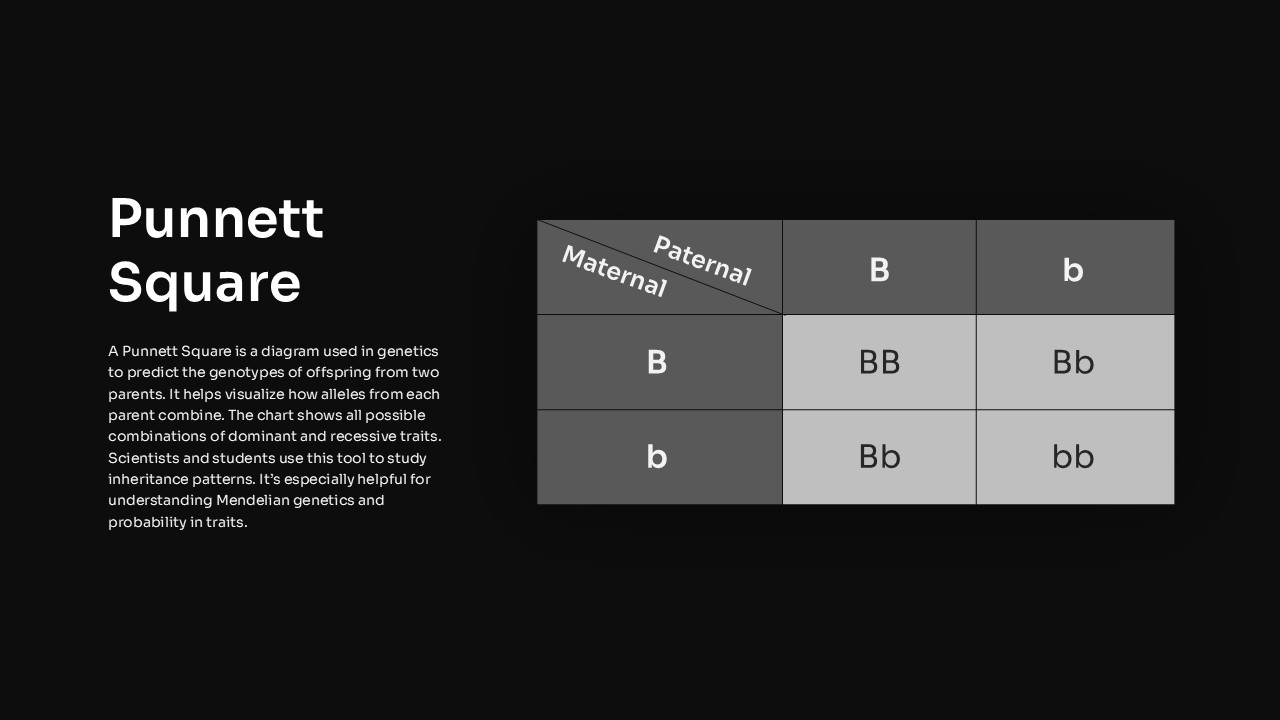
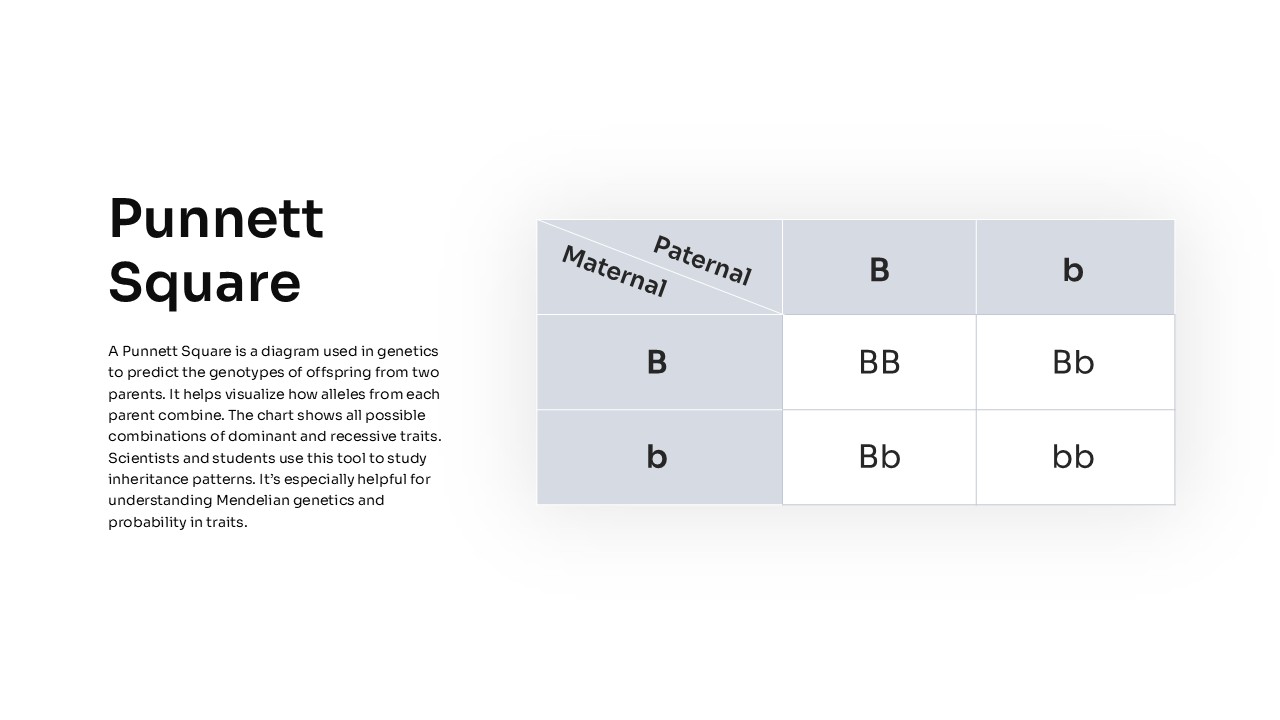
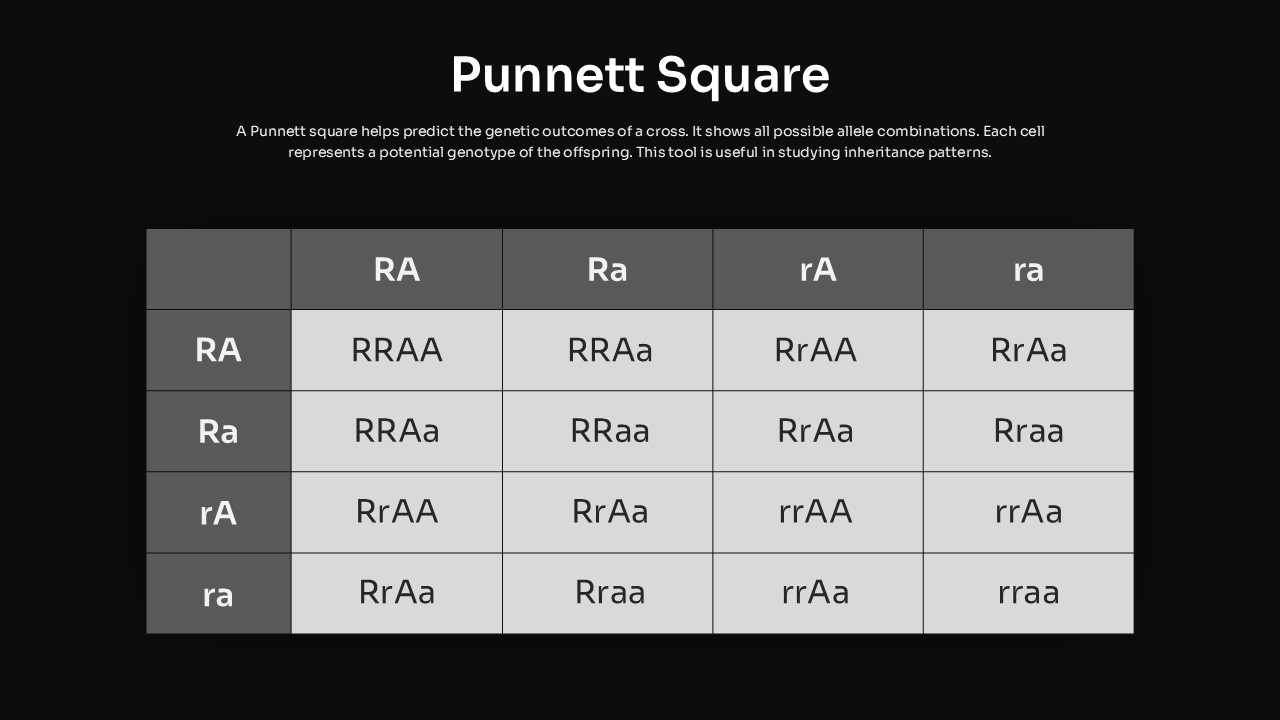
Use this Punnett Square slide to visualize and predict genetic outcomes with clarity and precision. A 4×4 grid displays possible allele combinations between two parental gametes labeled RA, Ra, rA, and ra across both axes. Each cell contains the resulting genotype—RRAA, RRAa, RrAA, RrAa, RRaa, Rraa, rrAA, rrAa, rraa—and can be customized to illustrate monohybrid, dihybrid, or complex crosses. Crisp typography and a neutral palette ensure maximum legibility, while light gray header cells highlight parental alleles against a white background. A concise definition above the grid contextualizes the tool’s purpose, helping audiences grasp inheritance patterns at a glance.
Editable table cells, vector shapes, and text placeholders enable rapid updates directly in PowerPoint and Google Slides. Adjust allele labels, modify genotypes, recolor headers, or resize the grid without losing resolution. Master slide integration maintains stylistic consistency across your deck, minimizing formatting headaches and streamlining version control. The slide’s modular structure supports quick duplication for multi-generation crosses or comparative demonstrations of phenotype probability.
Designed for academic lectures, laboratory presentations, and research reports, this Punnett Square diagram simplifies complex genetic concepts. Educators can use it to teach Mendelian inheritance, demonstrate probability calculations, or guide test preparation. Researchers and students can adapt the grid to analyze linkage, epistasis, or genetic ratios in breeding programs. Whether you are presenting at an academic conference, designing a classroom module, or assembling a study guide, this slide delivers a professional, clean, and versatile solution optimized for both PowerPoint and Google Slides. Its clean layout also enhances audience engagement and facilitates focused discussions on genotype–phenotype relationships.
Who is it for
Biology educators, geneticists, graduate and undergraduate students, laboratory instructors, and researchers who need to illustrate inheritance patterns and genotype probabilities in presentations or academic materials.
Other Uses
Repurpose for probability tables, trait-selection exercises, antigen haplotype mapping, combinatorial experiments in statistics, or any scenario requiring clear visualization of outcome matrices.
Login to download this file

Item ID
SB04849
Related Templates

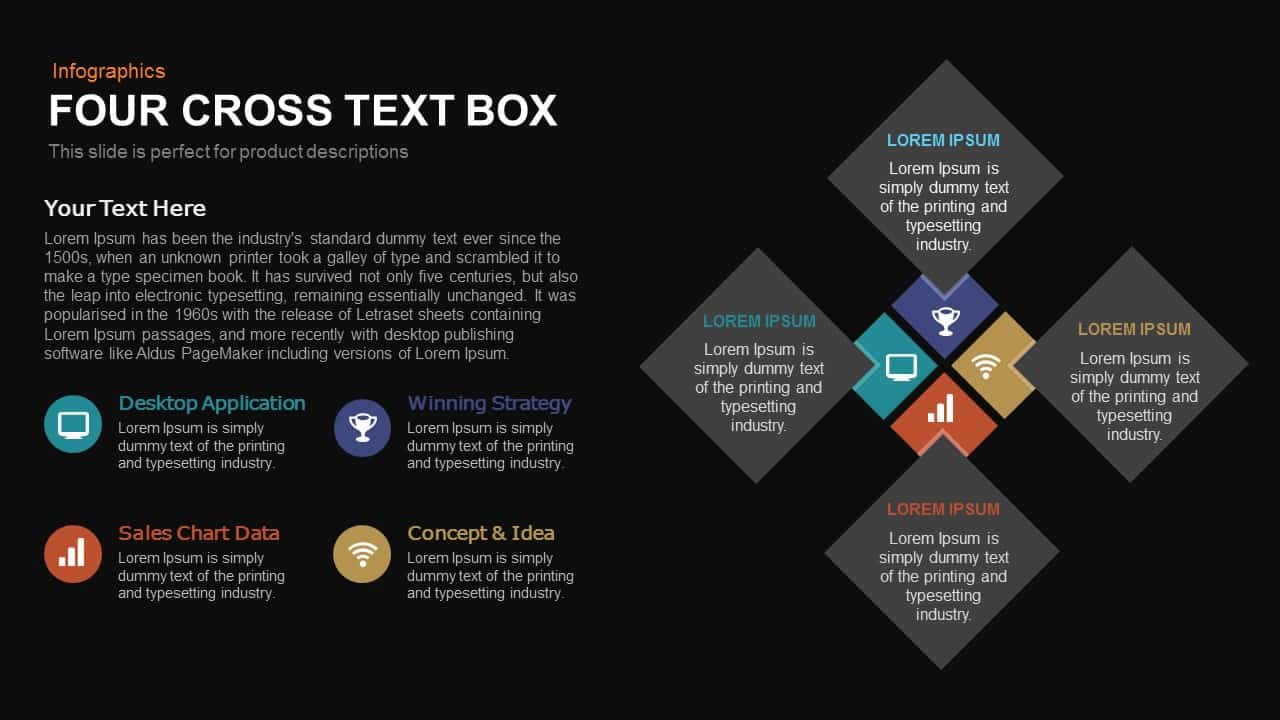
Four-Cross Text Box Diagram Template for PowerPoint & Google Slides
Comparison
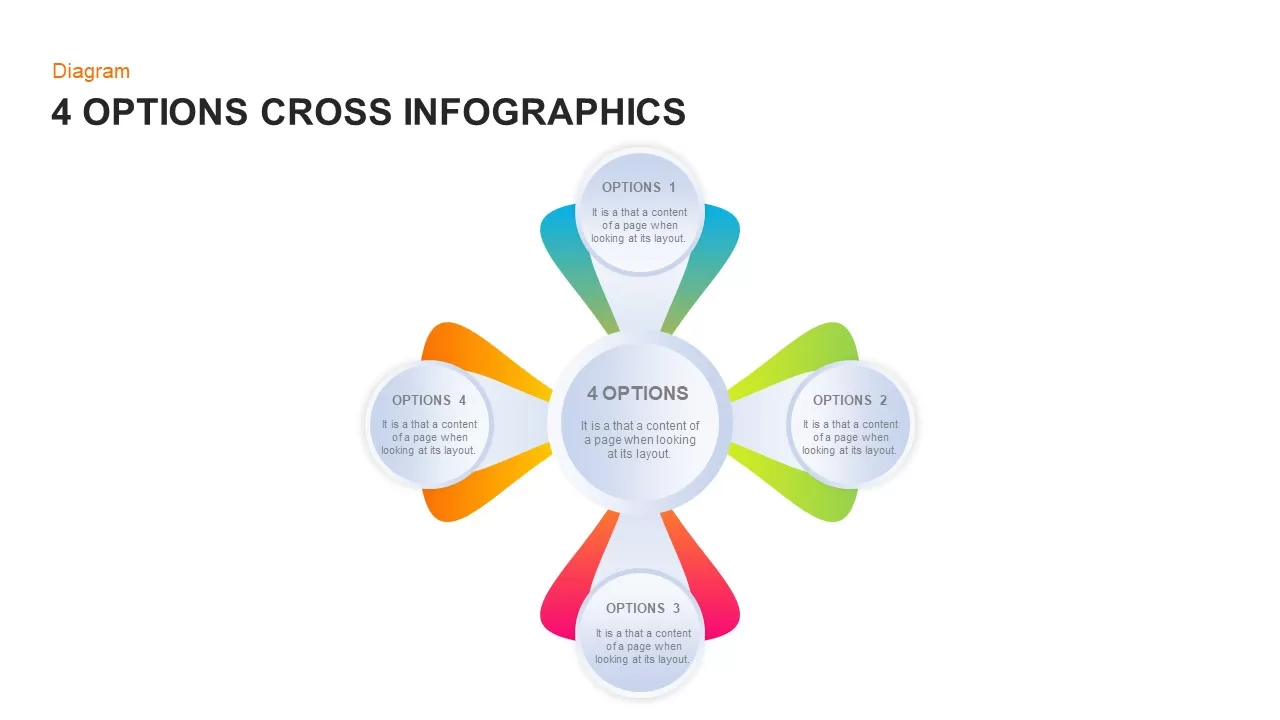
Four-Option Cross Infographic Diagram Template for PowerPoint & Google Slides
Comparison
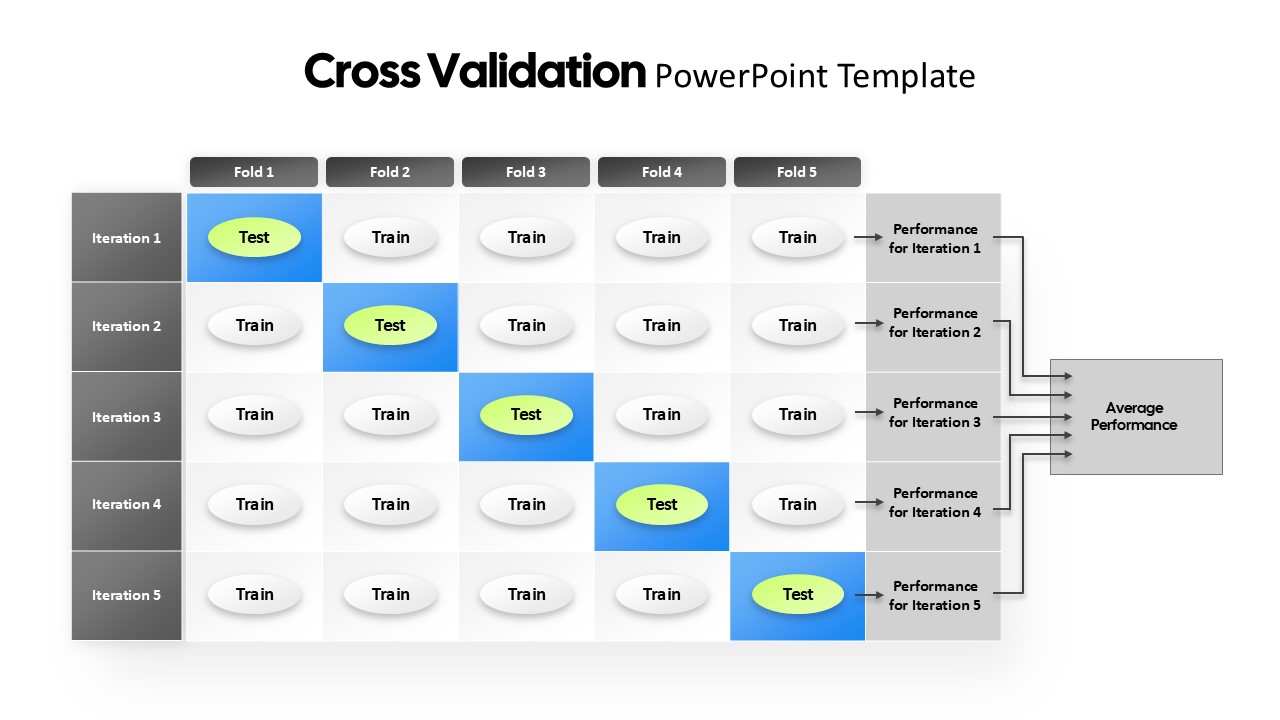
Cross Validation PowerPoint template for PowerPoint & Google Slides
AI
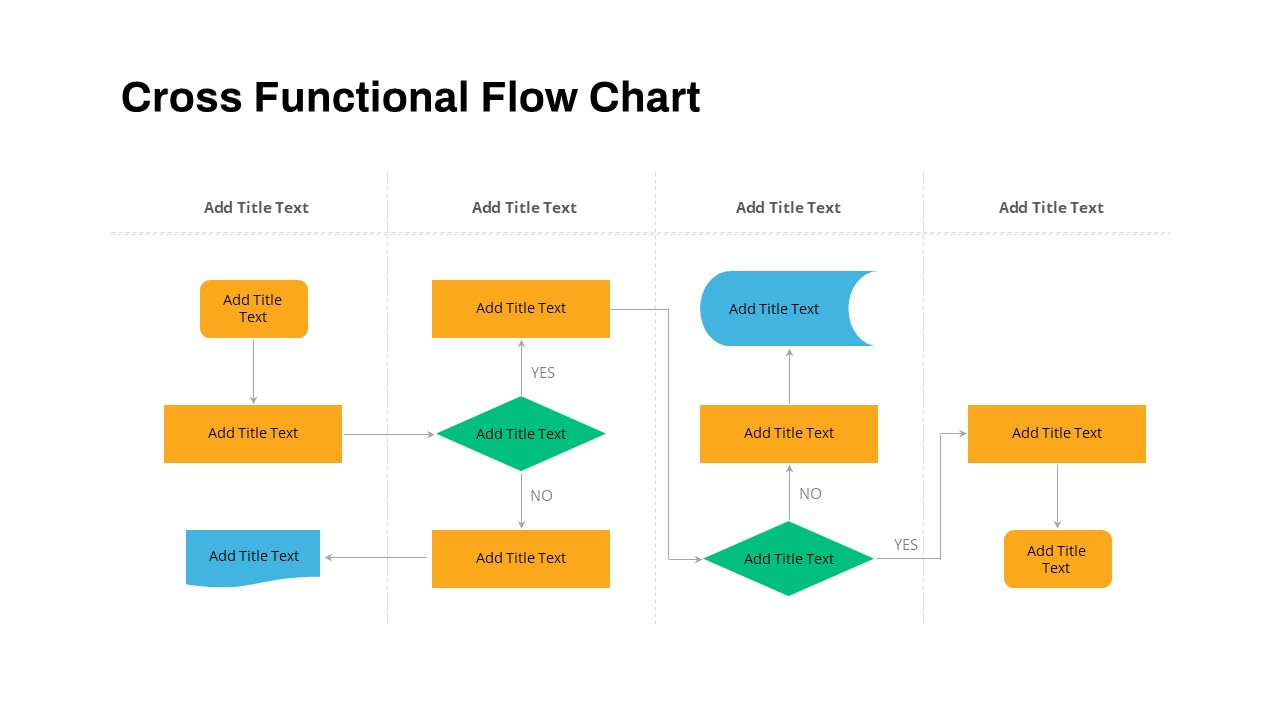
Cross Functional Swimlane Flow Chart Template for PowerPoint & Google Slides
Flow Charts
Cross Sell & Up Sell Strategy Comparison template for PowerPoint & Google Slides
Comparison
Four Square Chart template for PowerPoint & Google Slides
Charts
Business Four Square Chart template for PowerPoint & Google Slides
Business
Four Arrow Square Infographics Template for PowerPoint & Google Slides
Arrow
Square Circulation Infographics Template for PowerPoint & Google Slides
Process

Folded Square Four-Step Process Template for PowerPoint & Google Slides
Process

Green Square Business template for PowerPoint & Google Slides
Company Profile
Snake Diagram Pack of 8 Slides template for PowerPoint & Google Slides
Process
Gear Process Diagram PowerPoint Template for PowerPoint & Google Slides
Process
Sales Process Workflow Funnel Diagram PowerPoint Template for PowerPoint & Google Slides
Funnel
Puzzle Diagram PowerPoint Template for PowerPoint & Google Slides
Process
Transportation Logistics PowerPoint Diagram template for PowerPoint & Google Slides
Process
Emoji Scale PowerPoint Diagram for PowerPoint & Google Slides
Infographics
4 Step Problem Solving PowerPoint Diagram for PowerPoint & Google Slides
Process
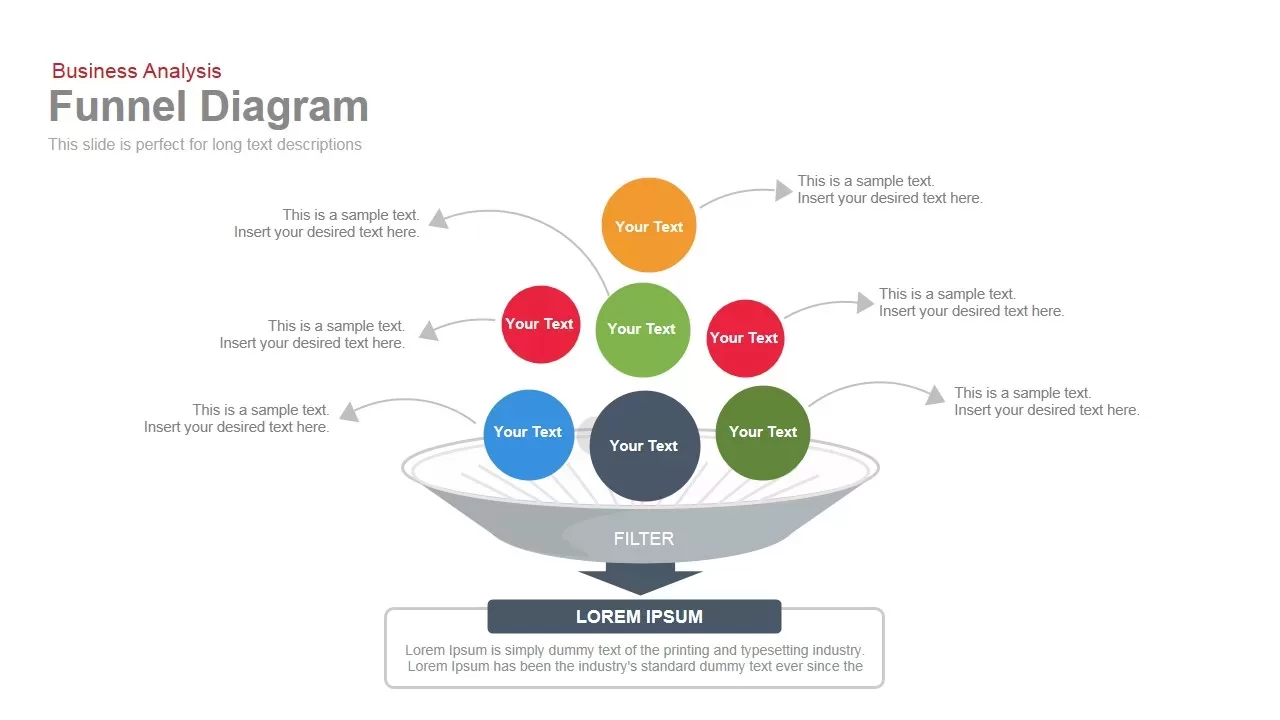
Business Funnel Diagram template for PowerPoint & Google Slides
Funnel
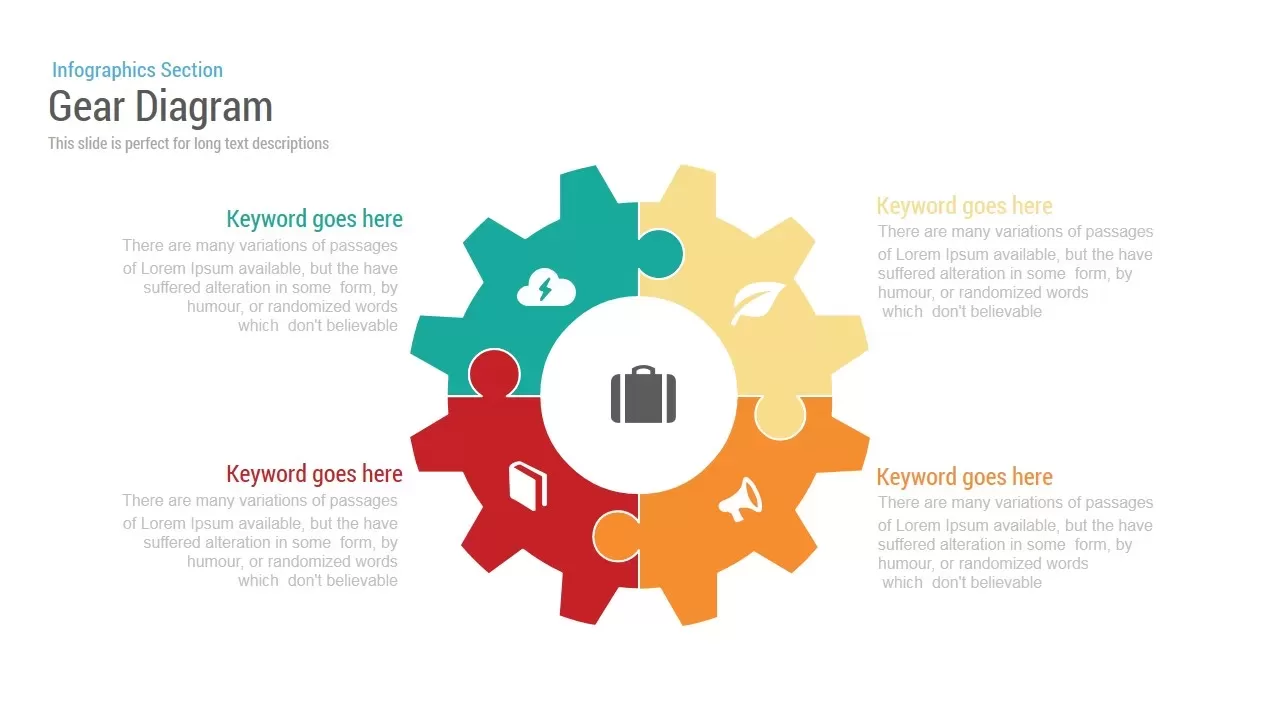
Gear Diagram template for PowerPoint & Google Slides
Process
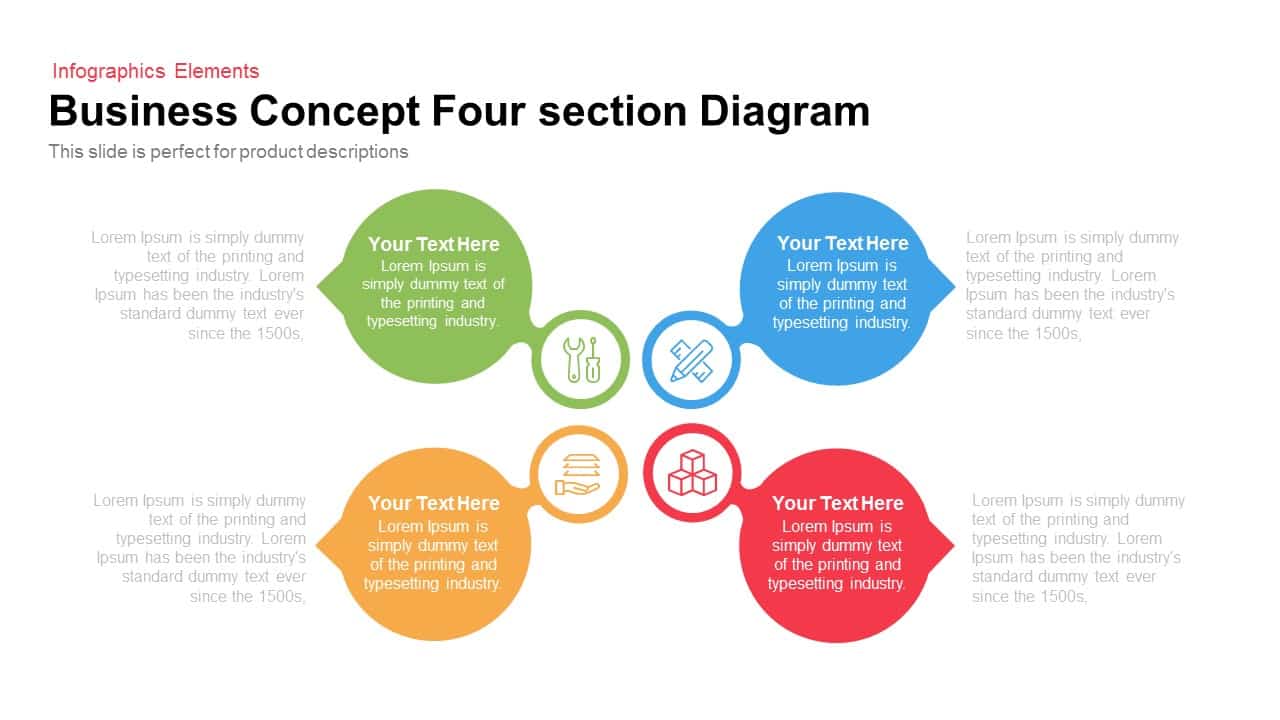
Business Concept 4 section Diagram template for PowerPoint & Google Slides
Infographics
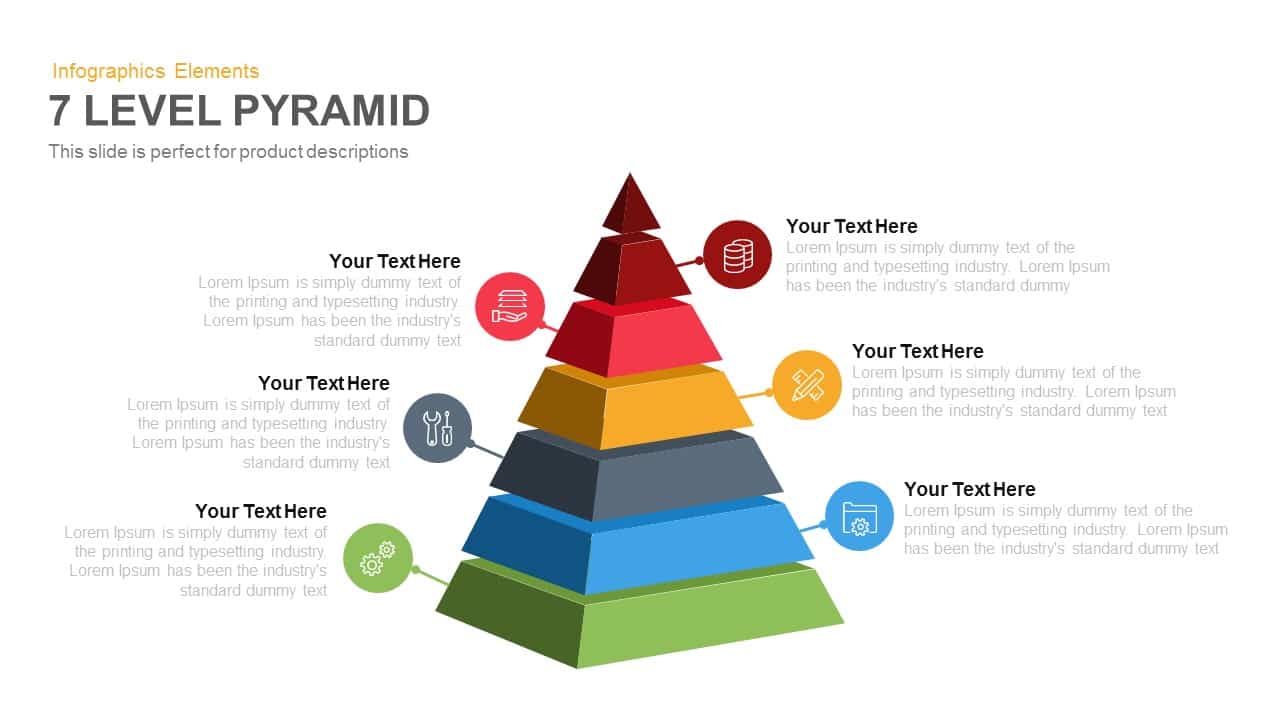
7-Level 3D Pyramid Infographic Diagram Template for PowerPoint & Google Slides
Pyramid
4 Section Pipe Diagram Process Flow Template for PowerPoint & Google Slides
Process
Dynamic Shield Process Flow Diagram template for PowerPoint & Google Slides
Process
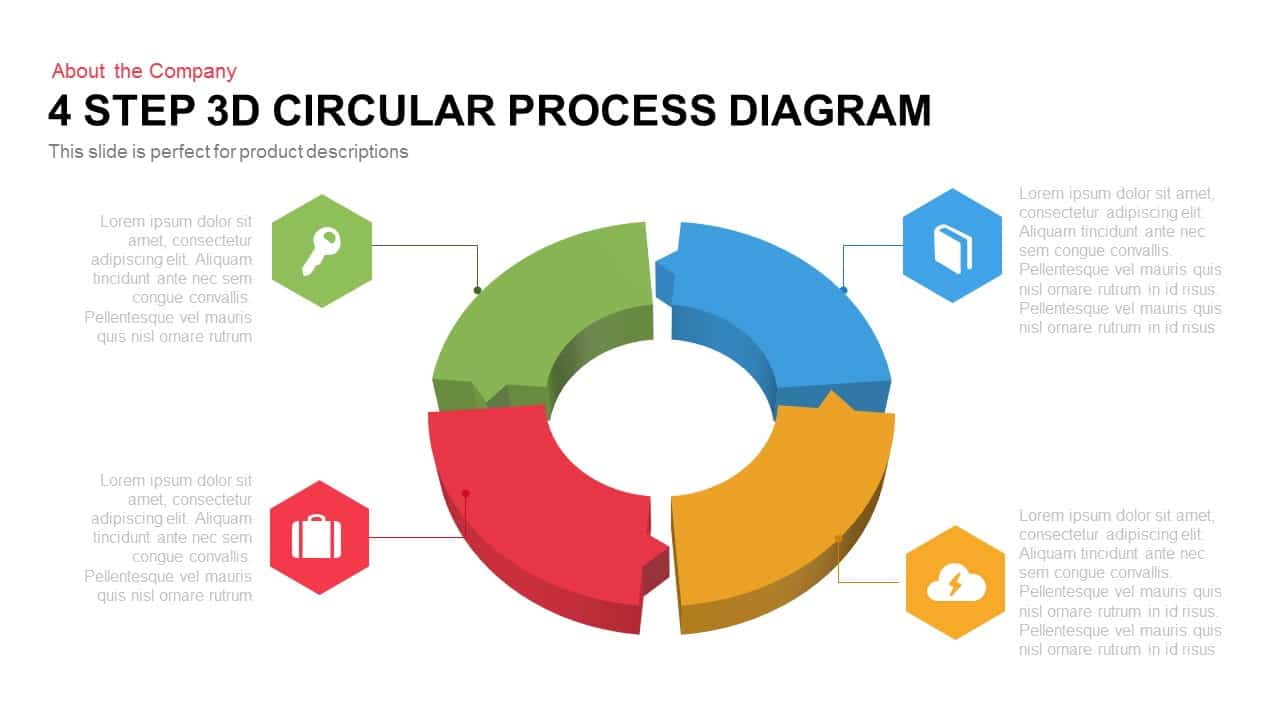
4 Step 3D Circular Process Diagram template for PowerPoint & Google Slides
Process
Success Key Diagram with Donut Chart Template for PowerPoint & Google Slides
Pie/Donut
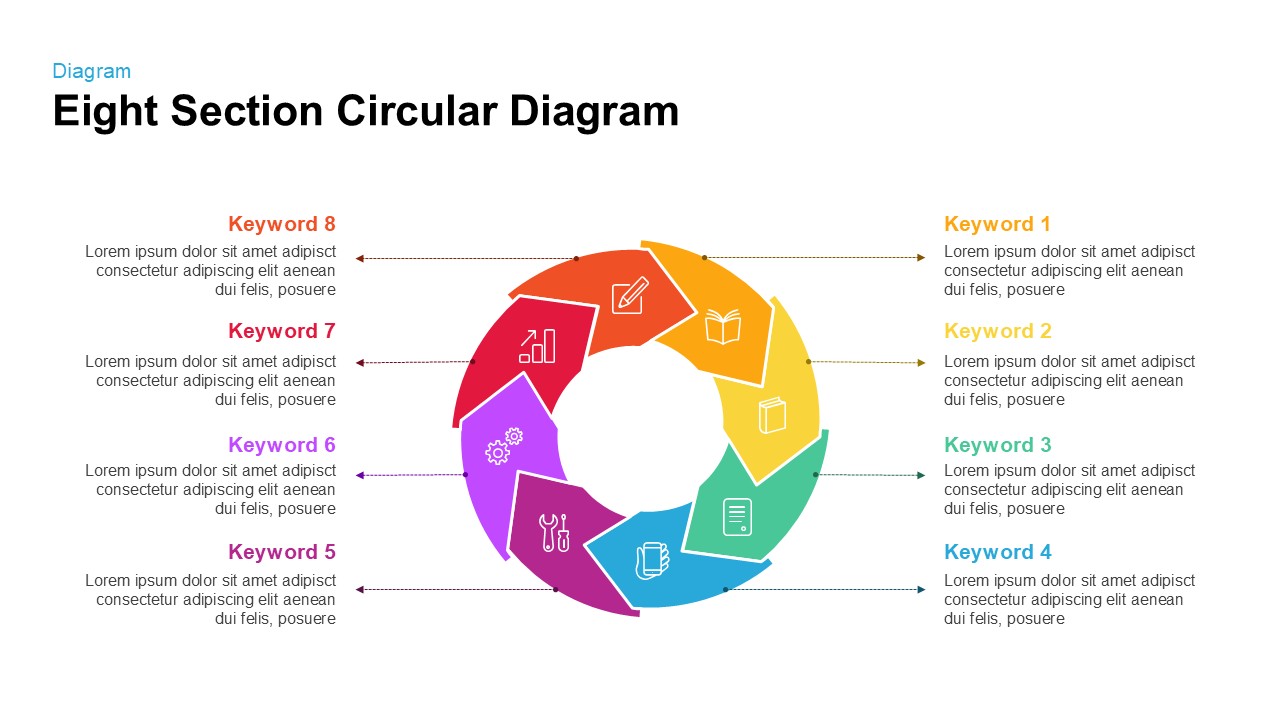
Eight Section Circular Diagram Template for PowerPoint & Google Slides
Circular
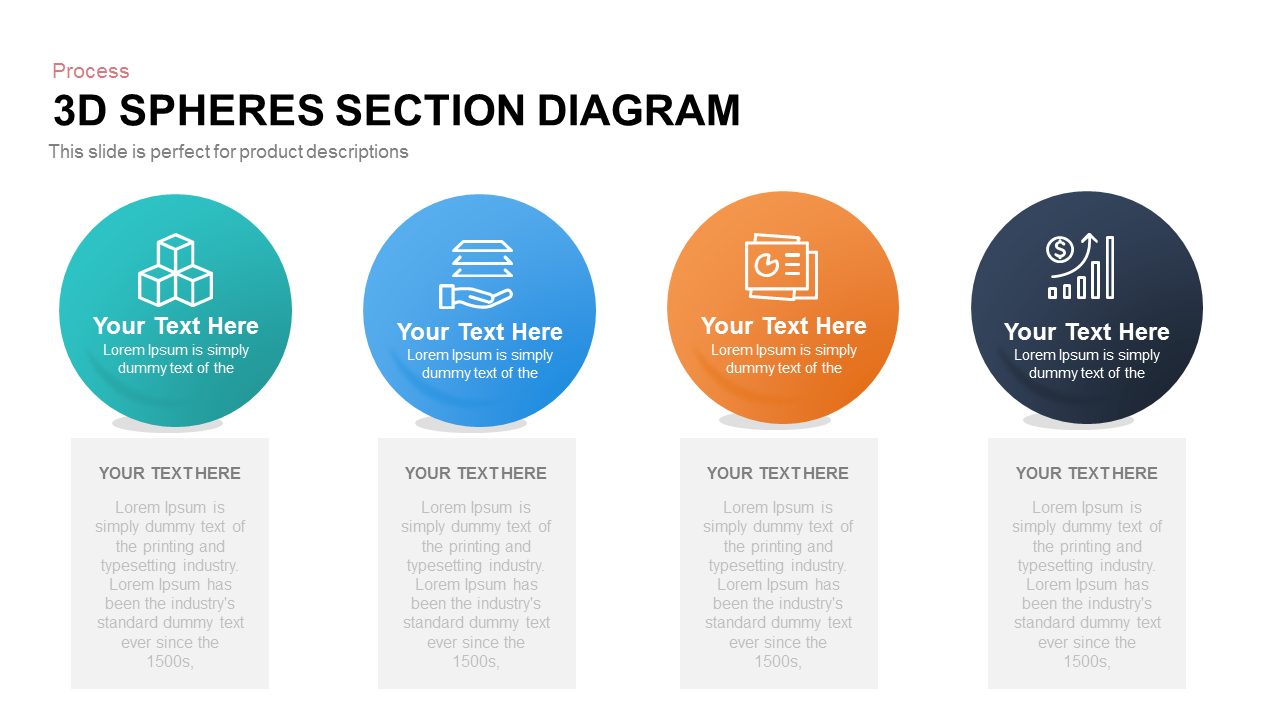
Four-Part 3D Spheres Section Diagram template for PowerPoint & Google Slides
Process

Colorful Five-Stage Relationship Diagram Template for PowerPoint & Google Slides
Process
15-Step Process Flow Diagram Template for PowerPoint & Google Slides
Process
Bulb Puzzle Diagram template for PowerPoint & Google Slides
Process

Four-Circle Venn Process Diagram template for PowerPoint & Google Slides
Process
Hourglass Funnel Diagram Process Template for PowerPoint & Google Slides
Funnel
Professional 5-Stage Pyramid Diagram Template for PowerPoint & Google Slides
Pyramid
Four-Stage Linear Infographic Diagram Template for PowerPoint & Google Slides
Process
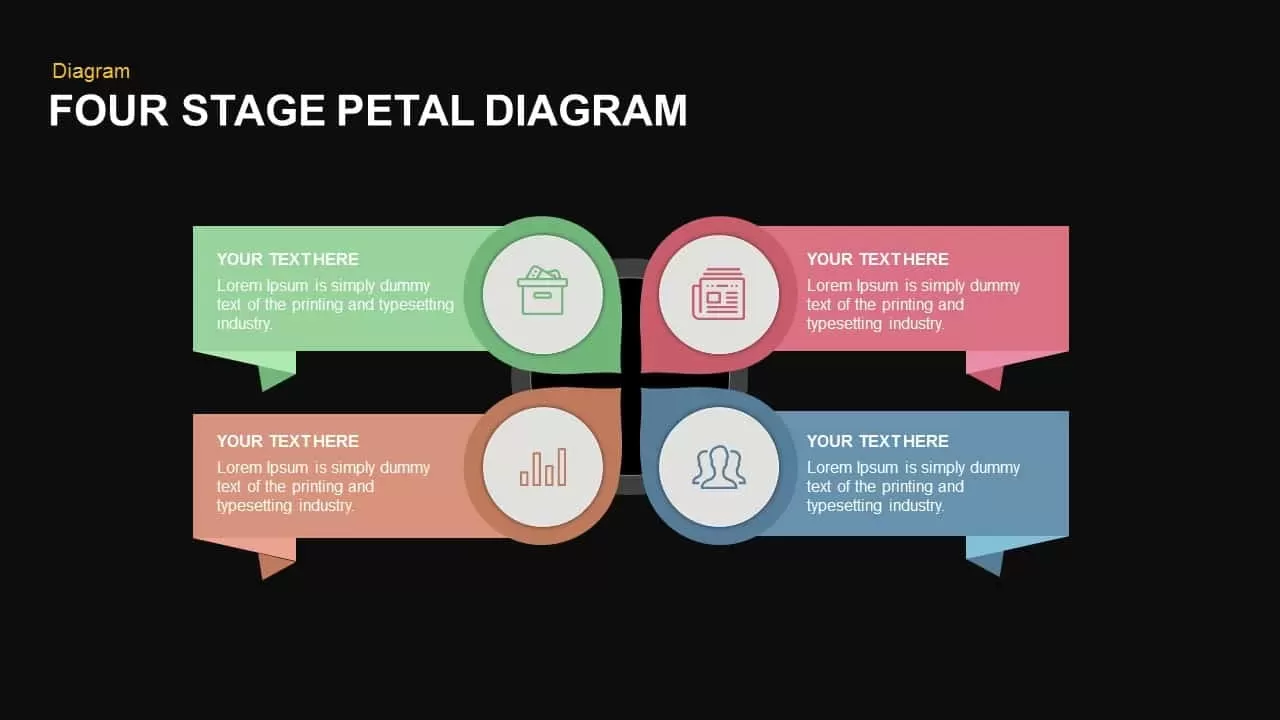
Modern Four-Stage Petal Diagram Template for PowerPoint & Google Slides
Circular
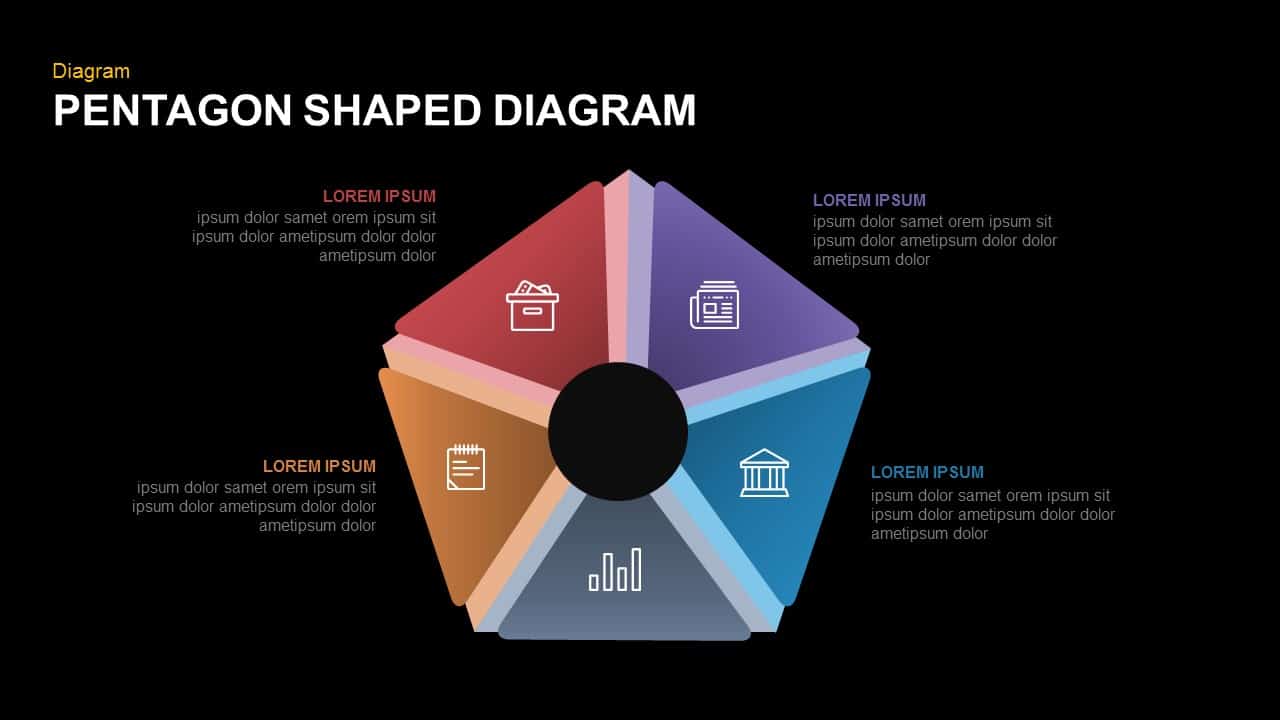
Five-Part Pentagon Shaped Diagram Template for PowerPoint & Google Slides
Process
Professional PESTEL Analysis Diagram Template for PowerPoint & Google Slides
PEST
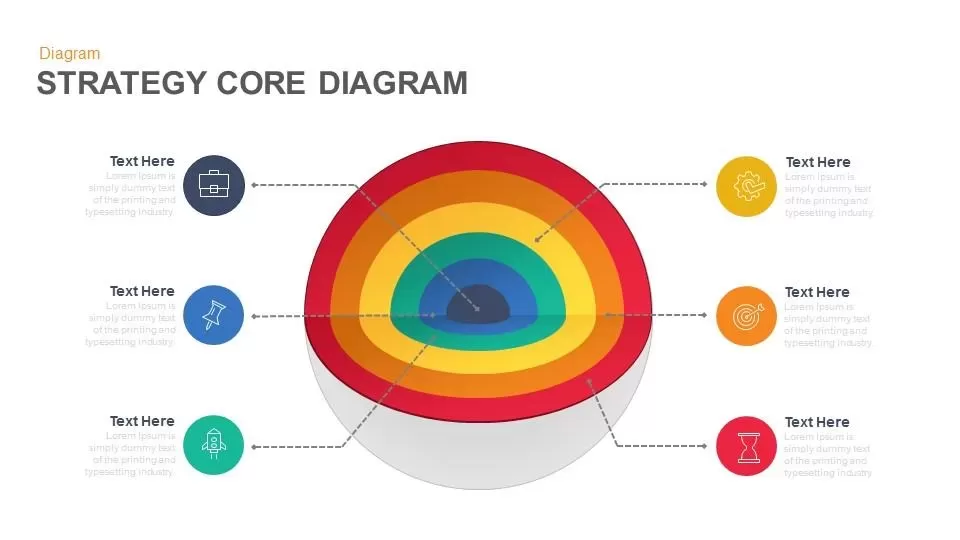
Strategy Core Diagram template for PowerPoint & Google Slides
Process
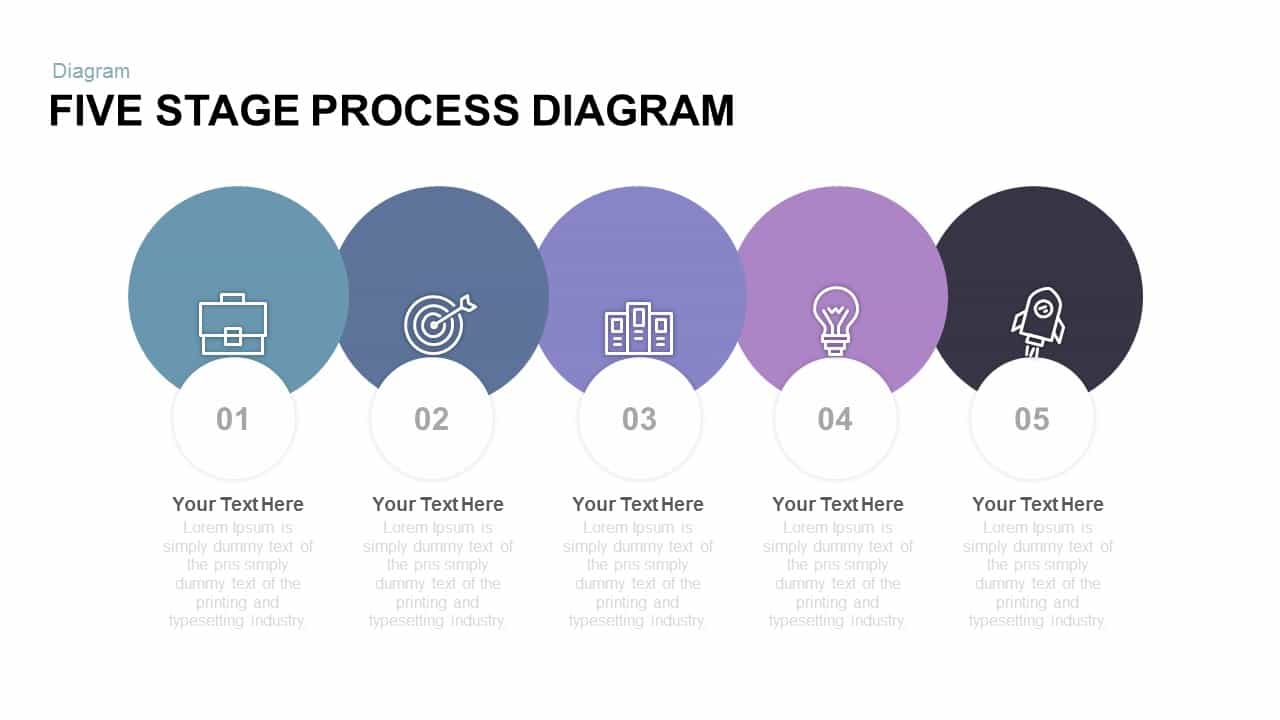
Five Stage Process Diagram template for PowerPoint & Google Slides
Process
Free
Four-Section Arrow Infographic Diagram Template for PowerPoint & Google Slides
Arrow

Ten-Stage Hub and Spoke Process Diagram Template for PowerPoint & Google Slides
Process
Professional Four-Section Layer Diagram Template for PowerPoint & Google Slides
Process
Artificial Intelligence Gear Diagram Template for PowerPoint & Google Slides
Process
Kubler-Ross Change Curve Diagram Template for PowerPoint & Google Slides
Timeline
V-Model Software Development Diagram Template for PowerPoint & Google Slides
Software Development
Gradient Ten-Step Flowchart Diagram Template for PowerPoint & Google Slides
Process
Fishbone Diagram Analysis Template for PowerPoint & Google Slides
Flow Charts
8 Steps Circular Process Diagram Template for PowerPoint & Google Slides
Circular
Five-Stage Circular Process Flow Diagram Template for PowerPoint & Google Slides
Circular
Six Stage Agenda Timeline Diagram template for PowerPoint & Google Slides
Agenda
Mind Mapping Hub and Spoke Diagram Template for PowerPoint & Google Slides
Mind Maps
GROW Coaching Framework Diagram Template for PowerPoint & Google Slides
Process
Communication Channels Diagram Template for PowerPoint & Google Slides
Customer Experience
Technology Services Hub-Spoke Diagram Template for PowerPoint & Google Slides
Information Technology
Colorful Venn Diagram Infographics Template for PowerPoint & Google Slides
Circular
Multi-Style Project Life Cycle Diagram Template for PowerPoint & Google Slides
Process
Supply and Demand Creation Cycle Diagram Template for PowerPoint & Google Slides
Process
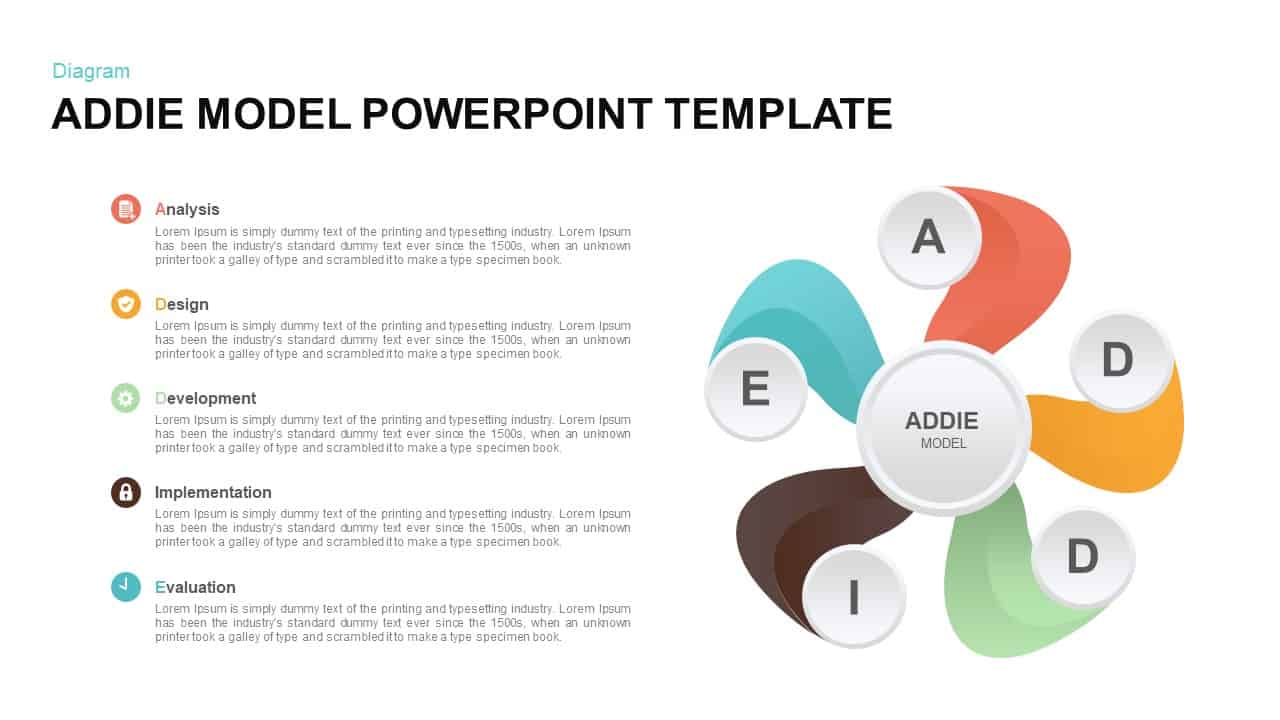
ADDIE Model Hub and Spoke Diagram Template for PowerPoint & Google Slides
Process
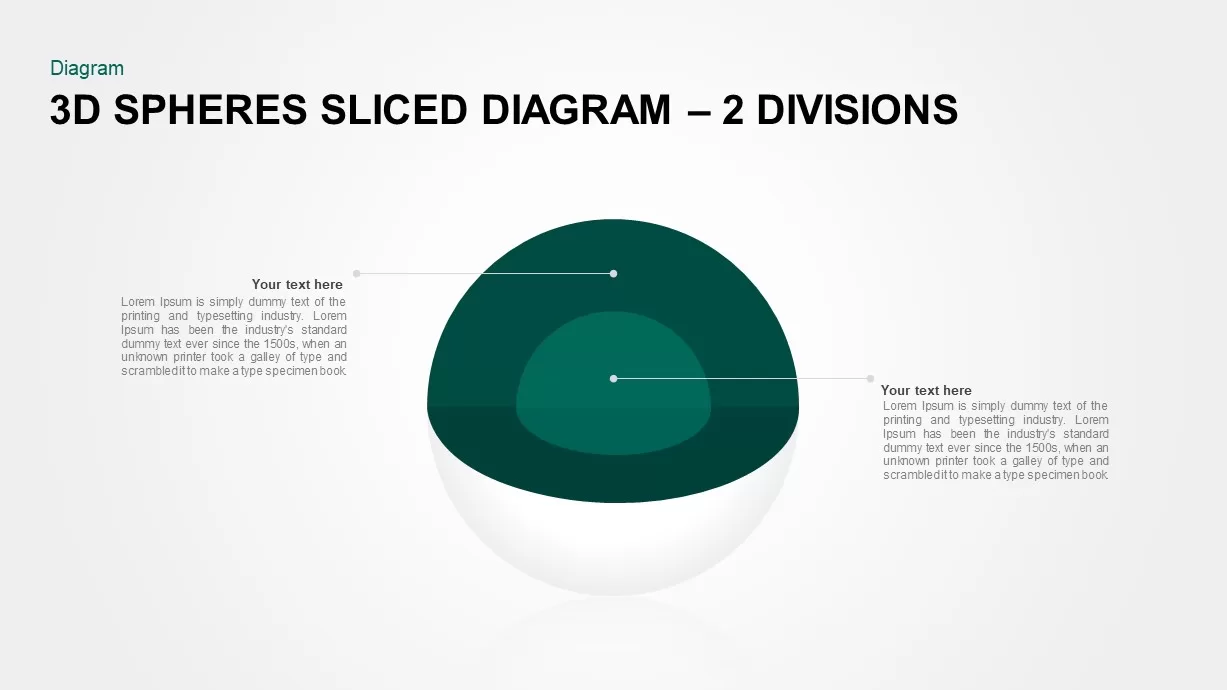
3D Spheres Sliced Diagram – 2 Divisions template for PowerPoint & Google Slides
Infographics
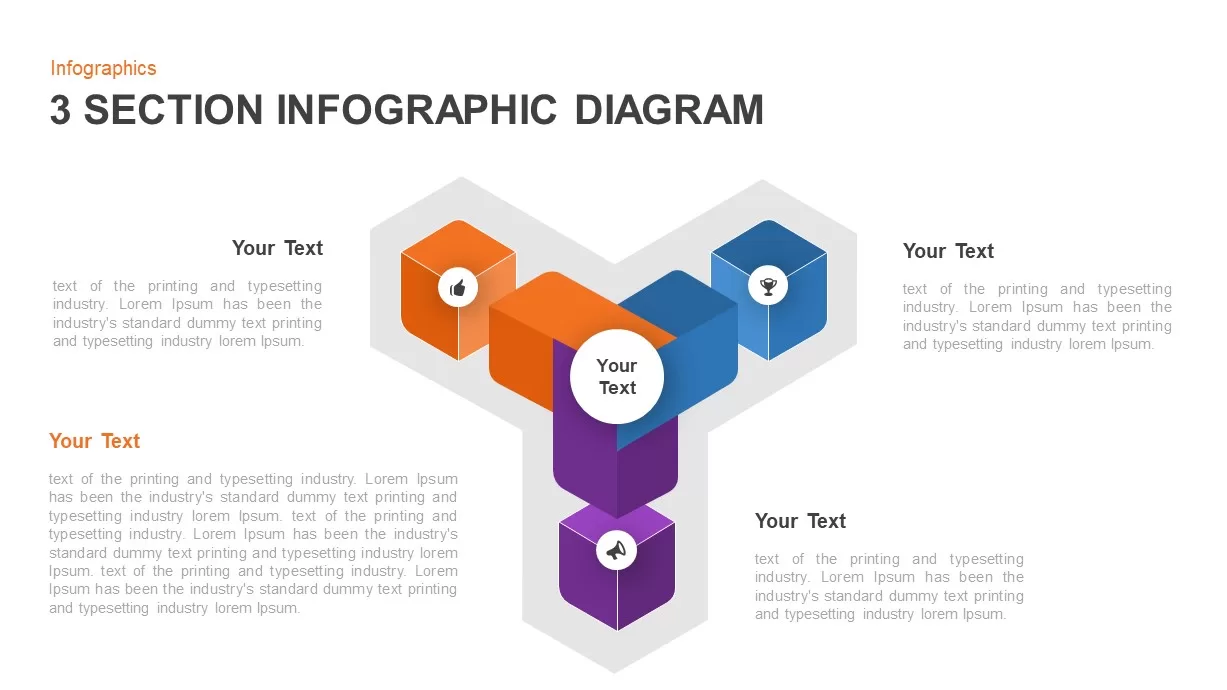
3 Section Infographic Diagram Template for PowerPoint & Google Slides
Process
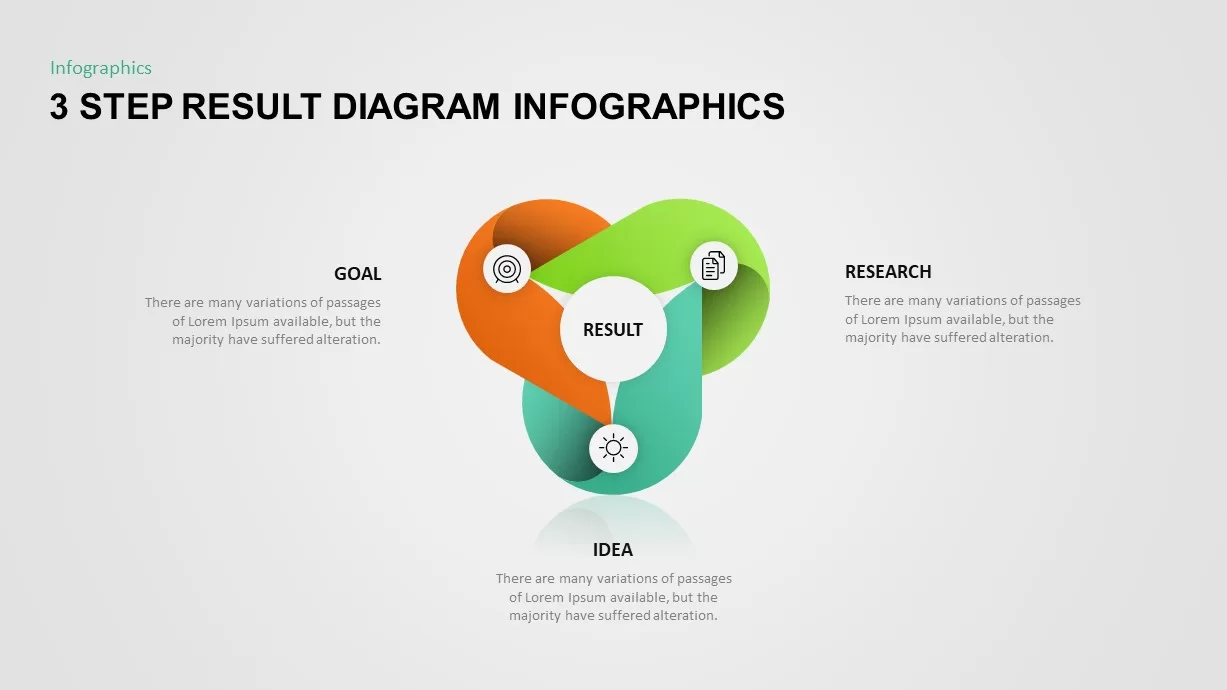
Three-Step Result Diagram Infographic Template for PowerPoint & Google Slides
Process
ITIL Service Lifecycle Circular Diagram Template for PowerPoint & Google Slides
Circular
Sales Funnel Infographic Diagram Template for PowerPoint & Google Slides
Funnel
Capacity Planning Circular Diagram Template for PowerPoint & Google Slides
Circular
Process Flow Diagram template for PowerPoint & Google Slides
Process
Clock Diagram for Time Management Template for PowerPoint & Google Slides
Circular
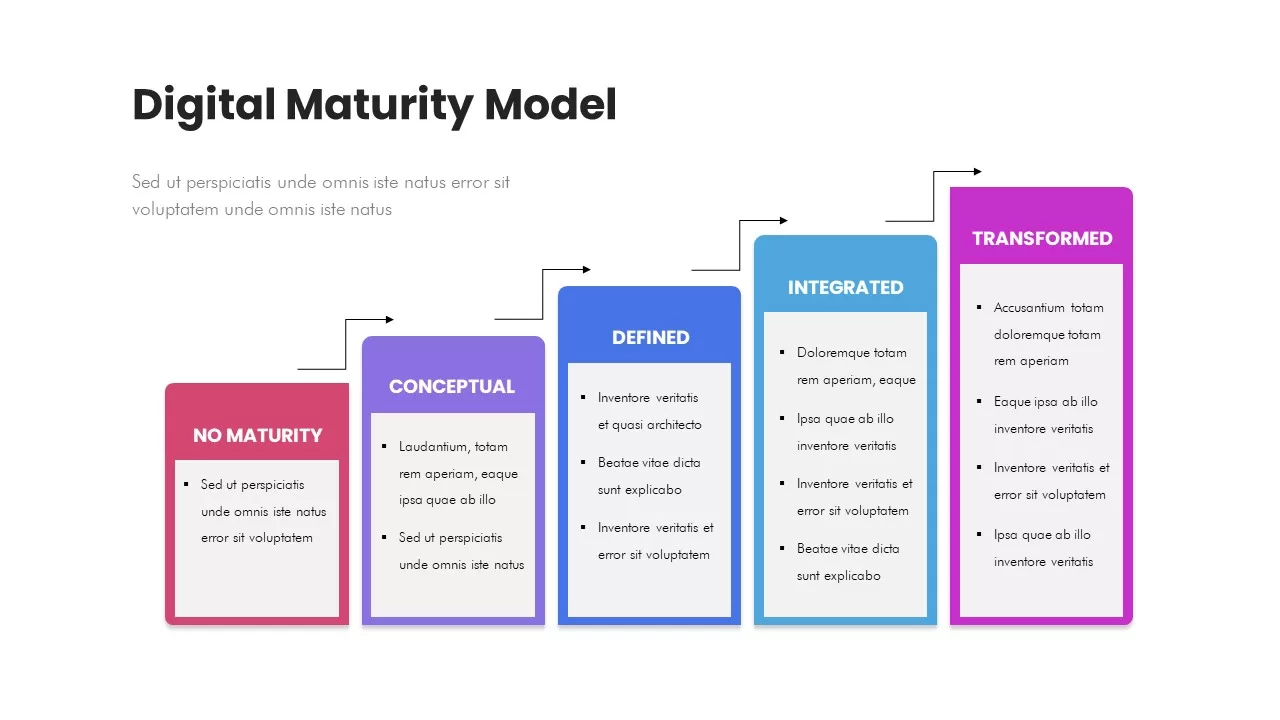
Digital Maturity Model Stages Diagram Template for PowerPoint & Google Slides
Process
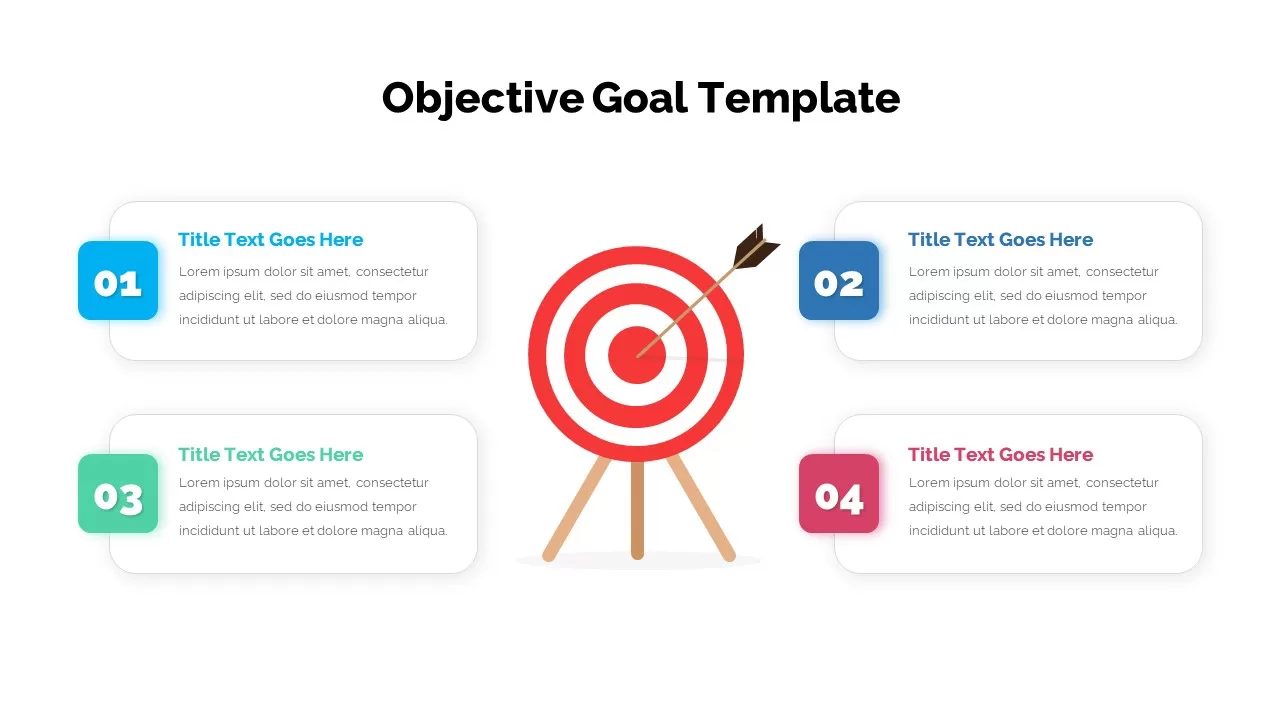
Four-Step Objective Goal Diagram Template for PowerPoint & Google Slides
Goals
Curved Arrow Process Flow Diagram Template for PowerPoint & Google Slides
Arrow
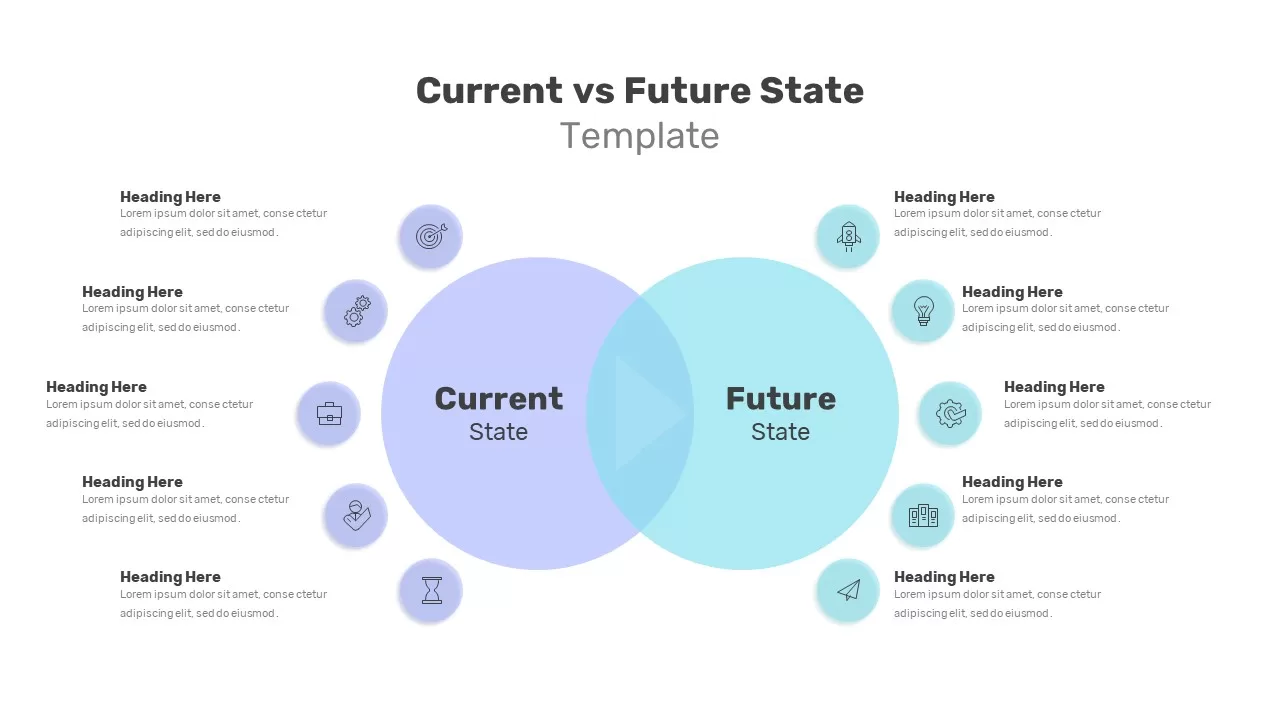
Current vs Future State Venn Diagram Template for PowerPoint & Google Slides
Comparison
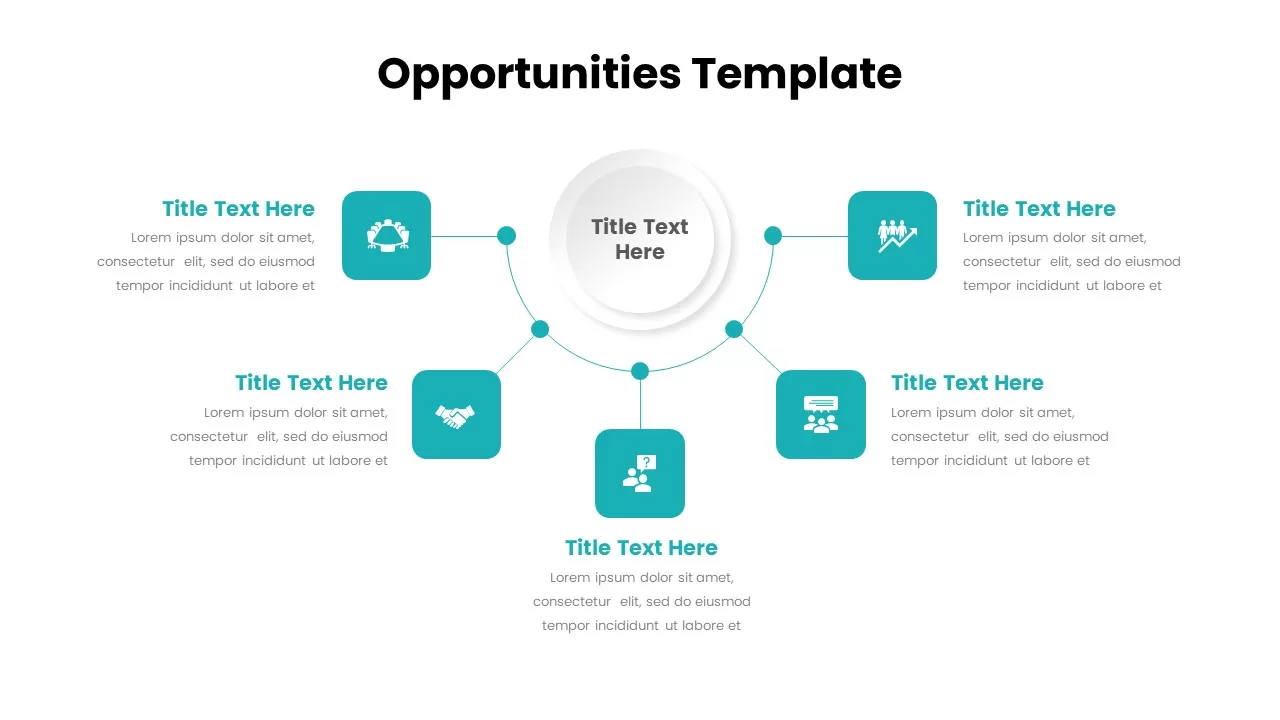
Opportunities Hub-and-Spoke Diagram Template for PowerPoint & Google Slides
Circular
Curved 8Ps of Marketing Diagram Template for PowerPoint & Google Slides
Marketing
Website Use Case Diagram Template for PowerPoint & Google Slides
Software Development
10-Step Circular Diagram Template for PowerPoint & Google Slides
Circular
Growth vs Fixed Mindset Diagram Template for PowerPoint & Google Slides
Comparison
Robotic Conveyor Belt Process Diagram Template for PowerPoint & Google Slides
Process
Pentagon Arrow Process Diagram Template for PowerPoint & Google Slides
Process
Key Takeaway Infographic Keyhole Diagram Template for PowerPoint & Google Slides
Process
Six-Step Business Analysis Diagram template for PowerPoint & Google Slides
Circular
Circular Revenue Generation Diagram Template for PowerPoint & Google Slides
Revenue
Double Funnel Lifecycle Diagram Template for PowerPoint & Google Slides
Funnel
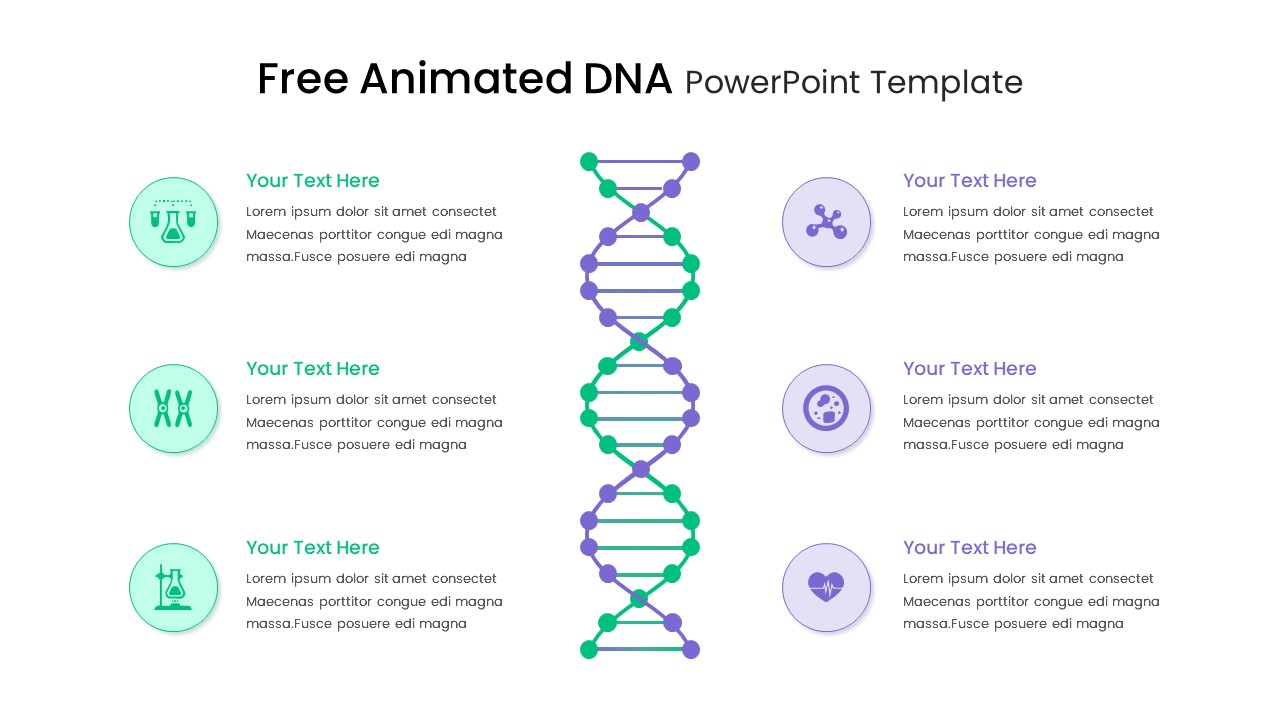
Free Animated DNA Infographic Diagram Template for PowerPoint & Google Slides
Infographics
Free
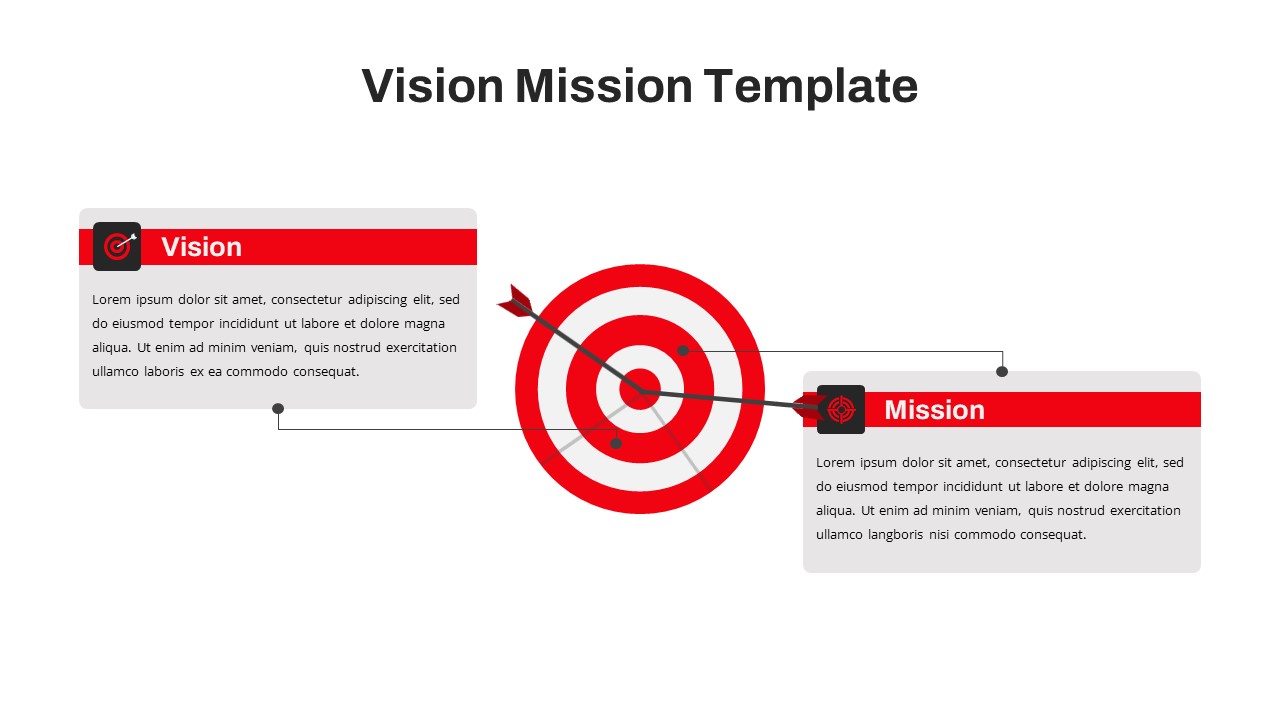
Free Vision and Mission Target Diagram Template for PowerPoint & Google Slides
Vision and Mission
Free
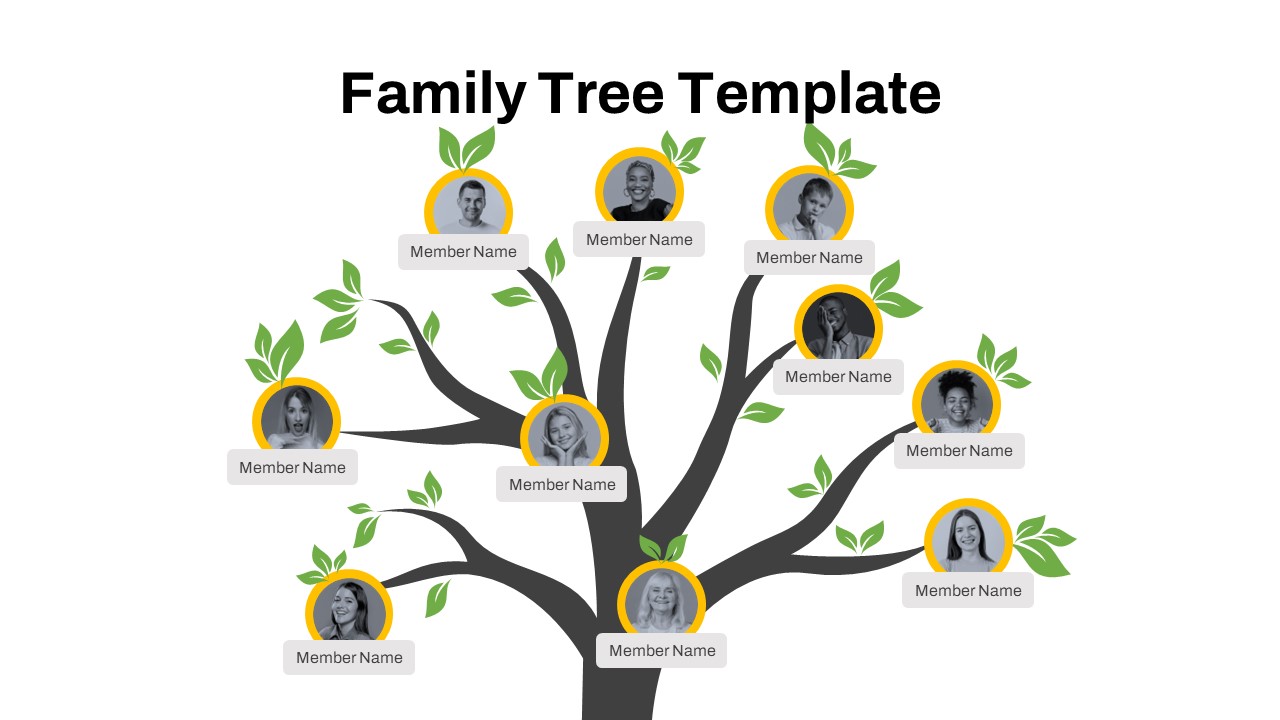
Free Editable Family Tree Genealogy Diagram Template for PowerPoint & Google Slides
Org Chart
Free
Salience Model Venn Diagram Infographic Template for PowerPoint & Google Slides
Circular
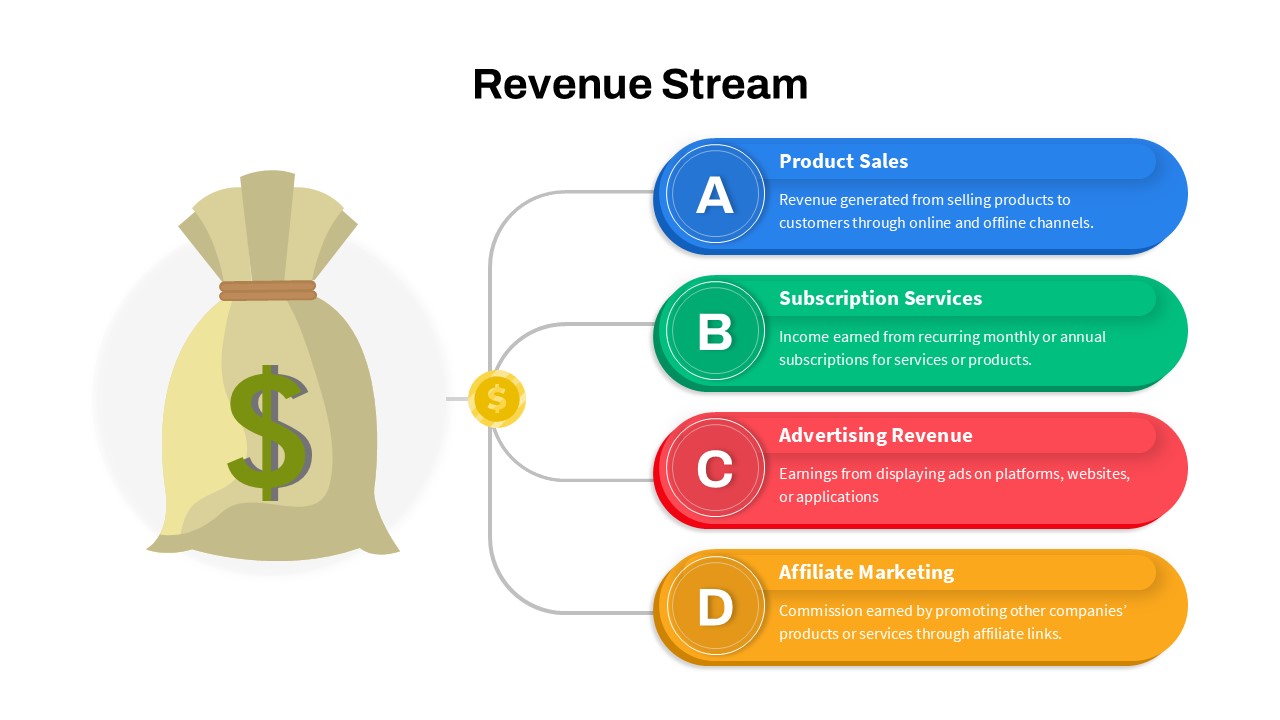
Revenue Streams: Four Channels Diagram Template for PowerPoint & Google Slides
Business Models
Colorful Startup Financing Cycle Diagram Template for PowerPoint & Google Slides
Finance
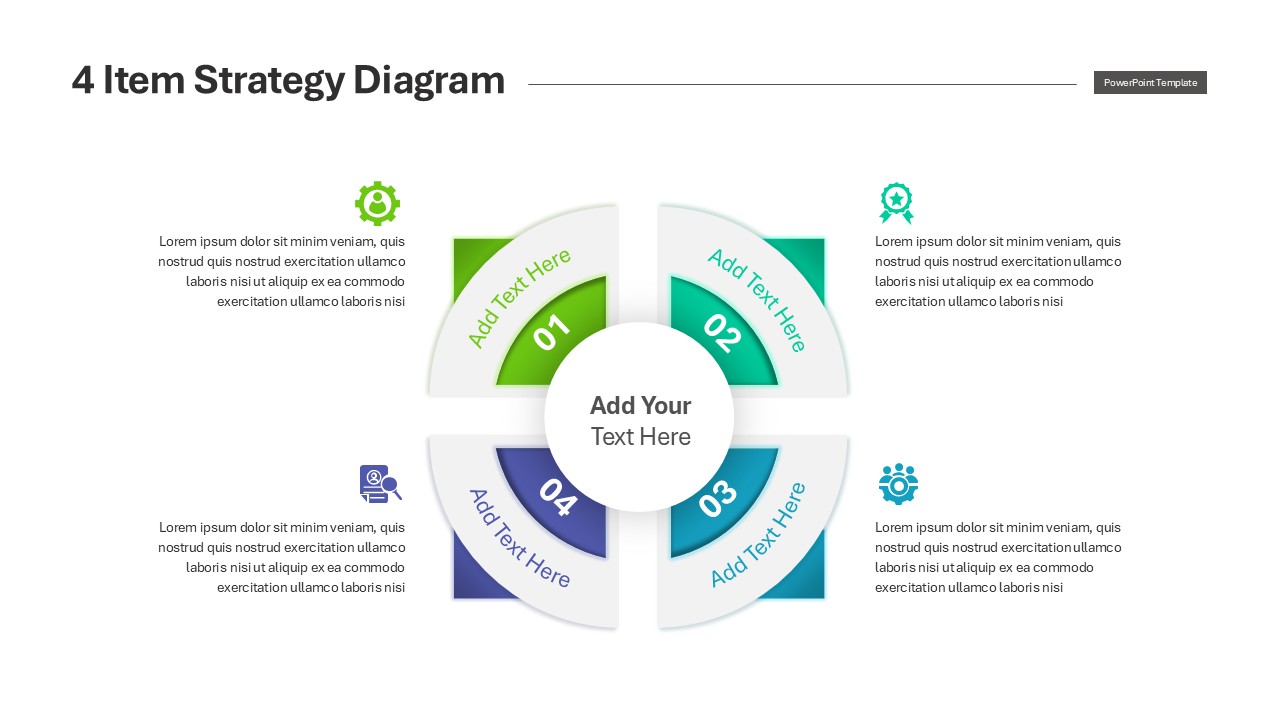
Engaging Four-Option Strategy Diagram Template for PowerPoint & Google Slides
Business Strategy
3Ps Triple Bottom Line Venn Diagram Template for PowerPoint & Google Slides
Circular
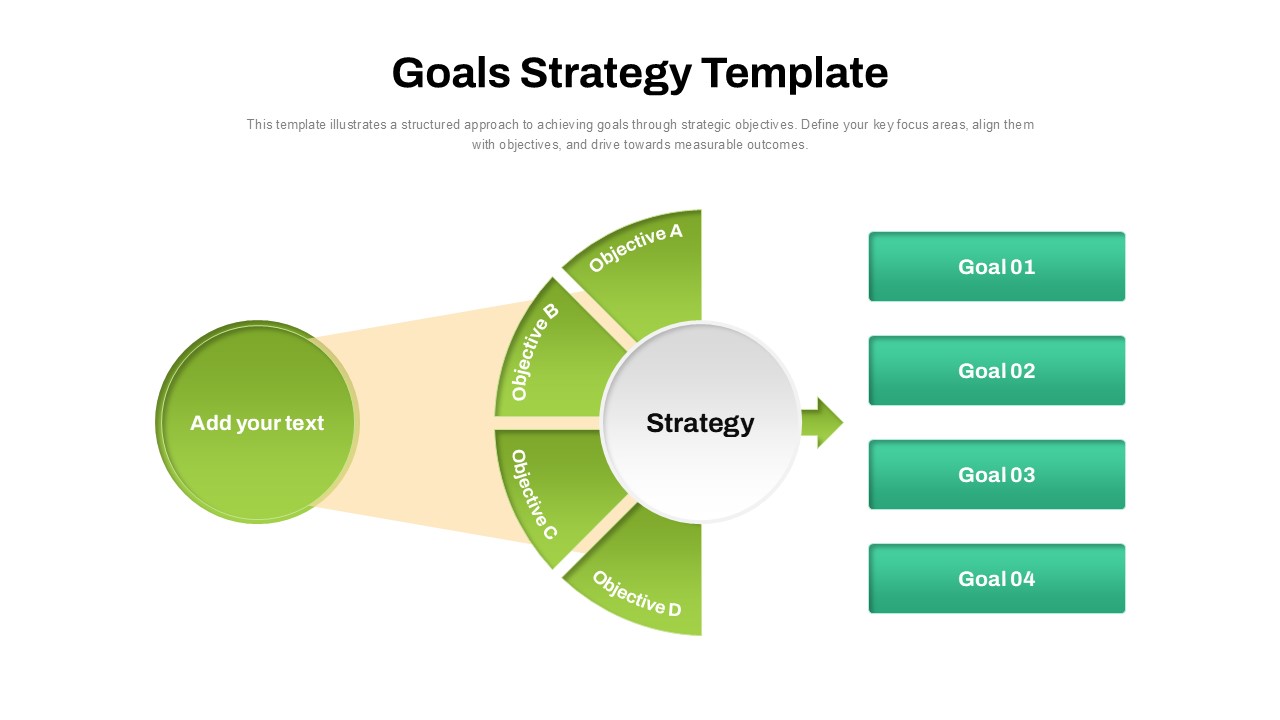
Goals Strategy Semicircle Diagram Template for PowerPoint & Google Slides
Process
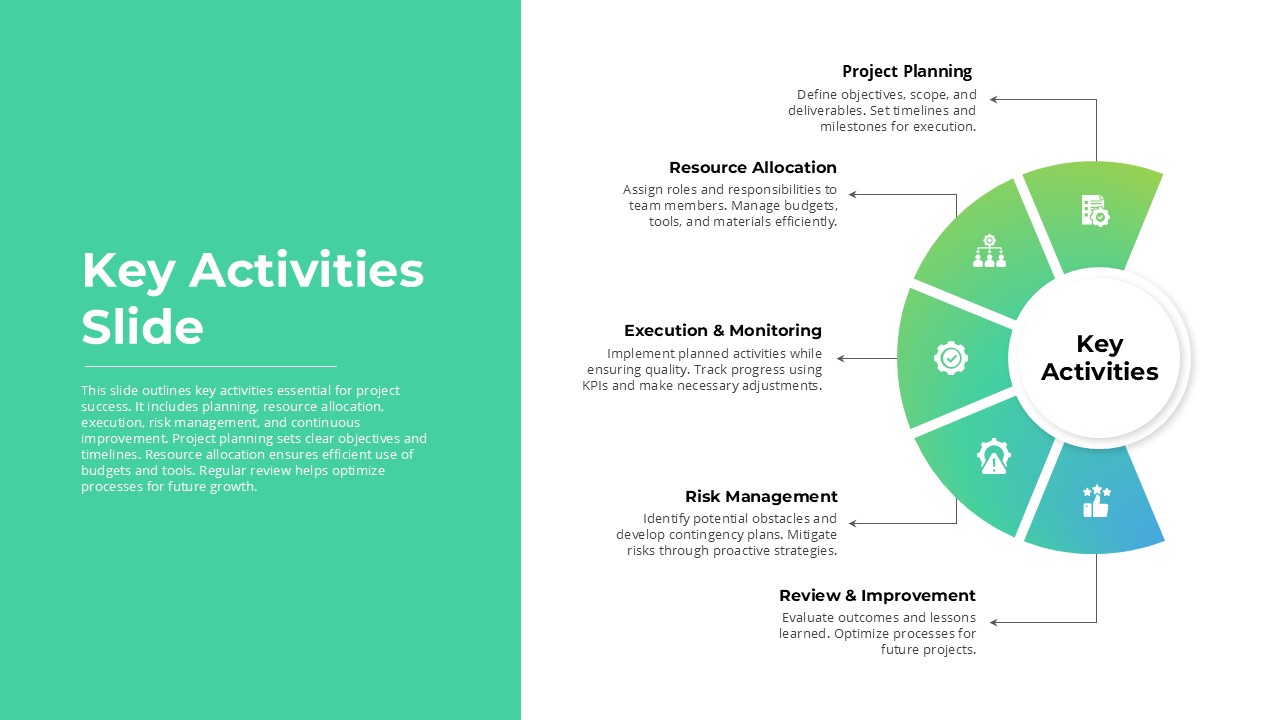
Project Key Activities Circular Diagram Template for PowerPoint & Google Slides
Process
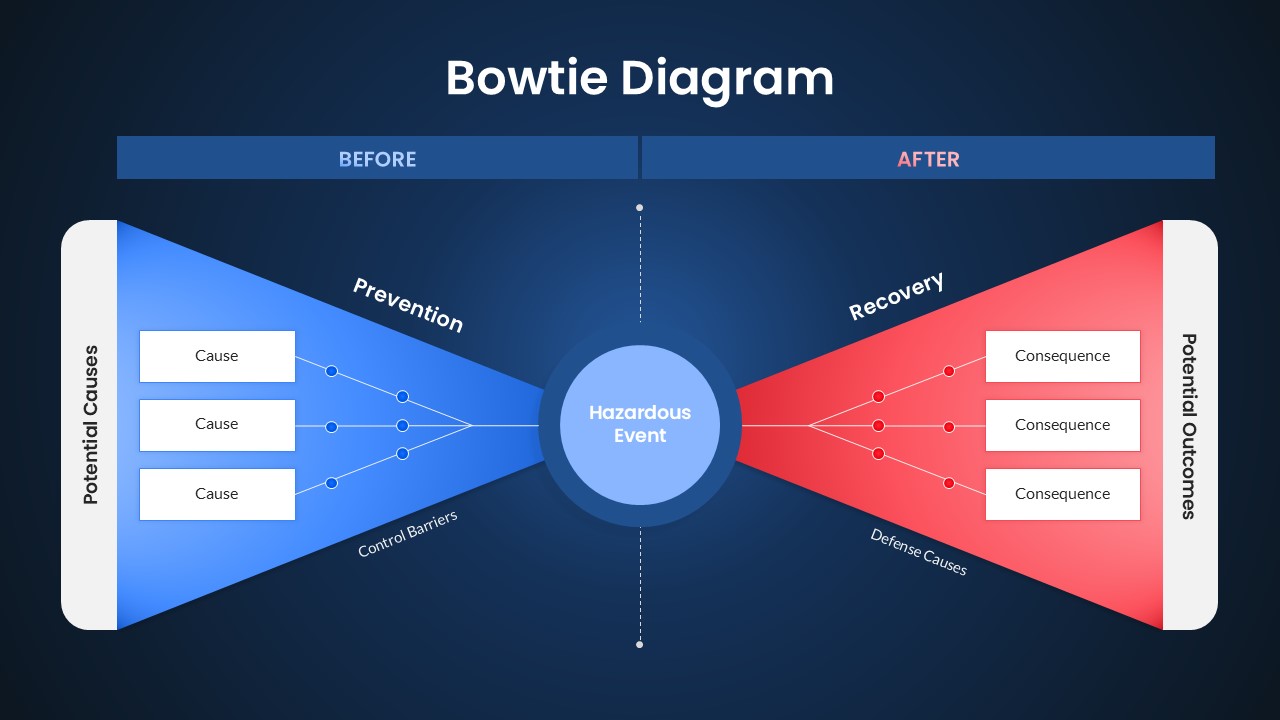
Bowtie Diagram Prevention & Recovery Template for PowerPoint & Google Slides
Decision Tree
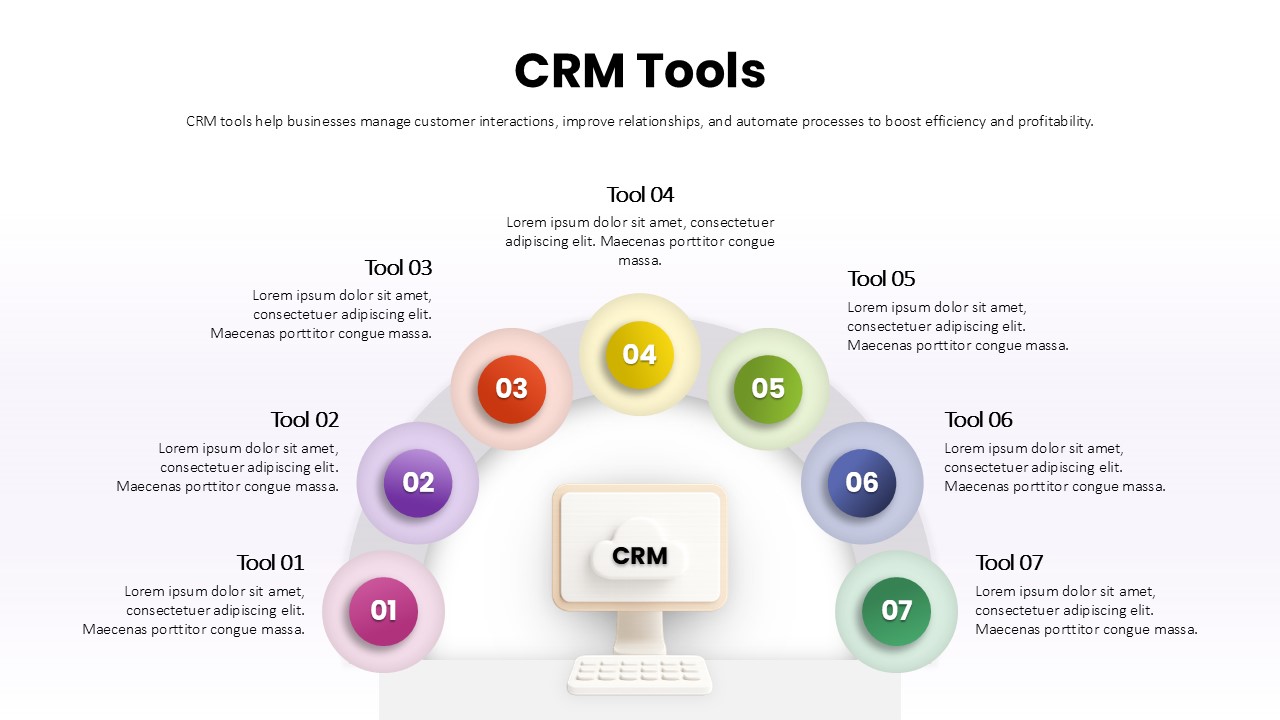
Seven-Part CRM Tools Arc Diagram Template for PowerPoint & Google Slides
Digital Marketing
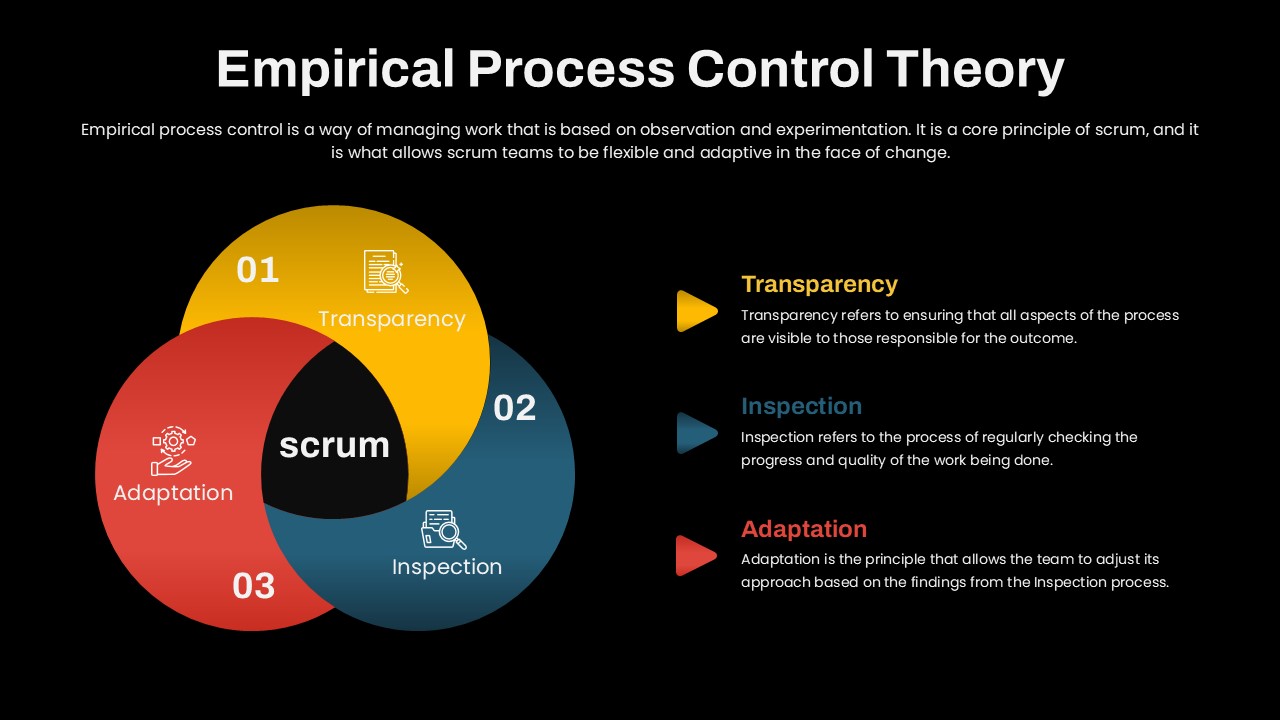
Empirical Process Control Theory Diagram Template for PowerPoint & Google Slides
Circular
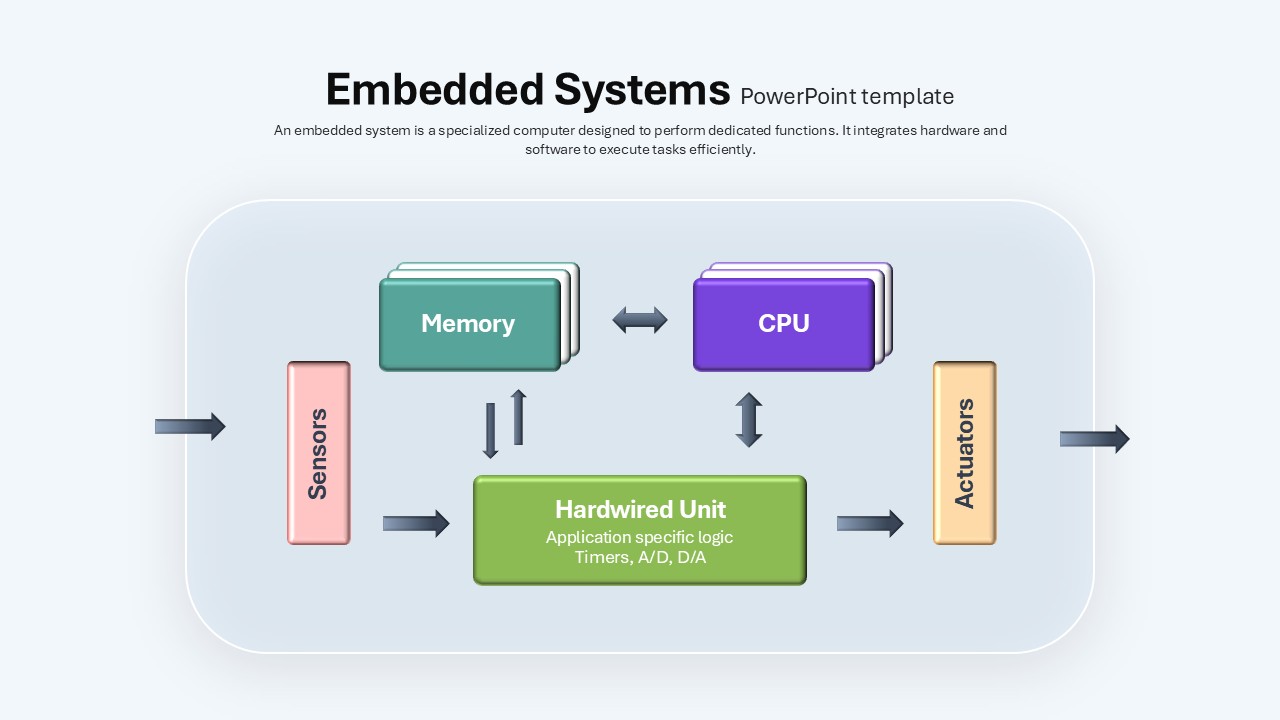
Embedded Systems Architecture Diagram Template for PowerPoint & Google Slides
Software Development
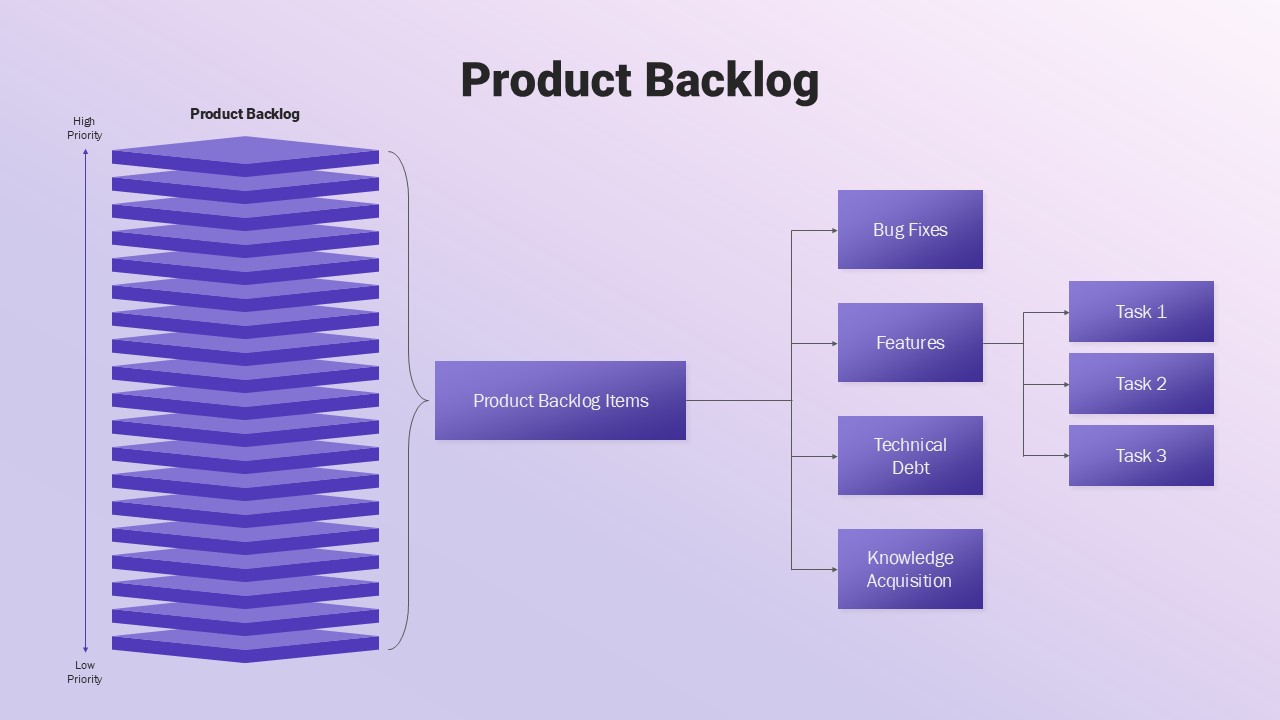
Product Backlog Diagram Template for PowerPoint & Google Slides
Software Development
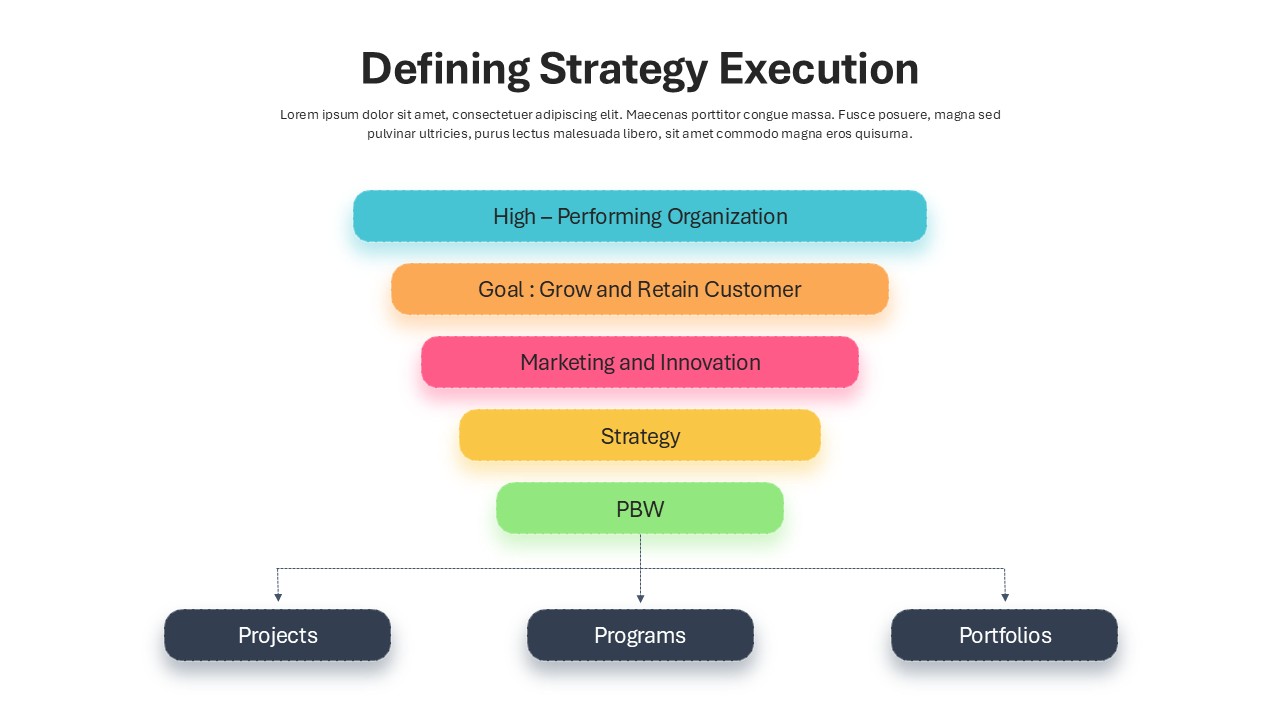
Defining Strategy Execution Diagram Template for PowerPoint & Google Slides
Funnel
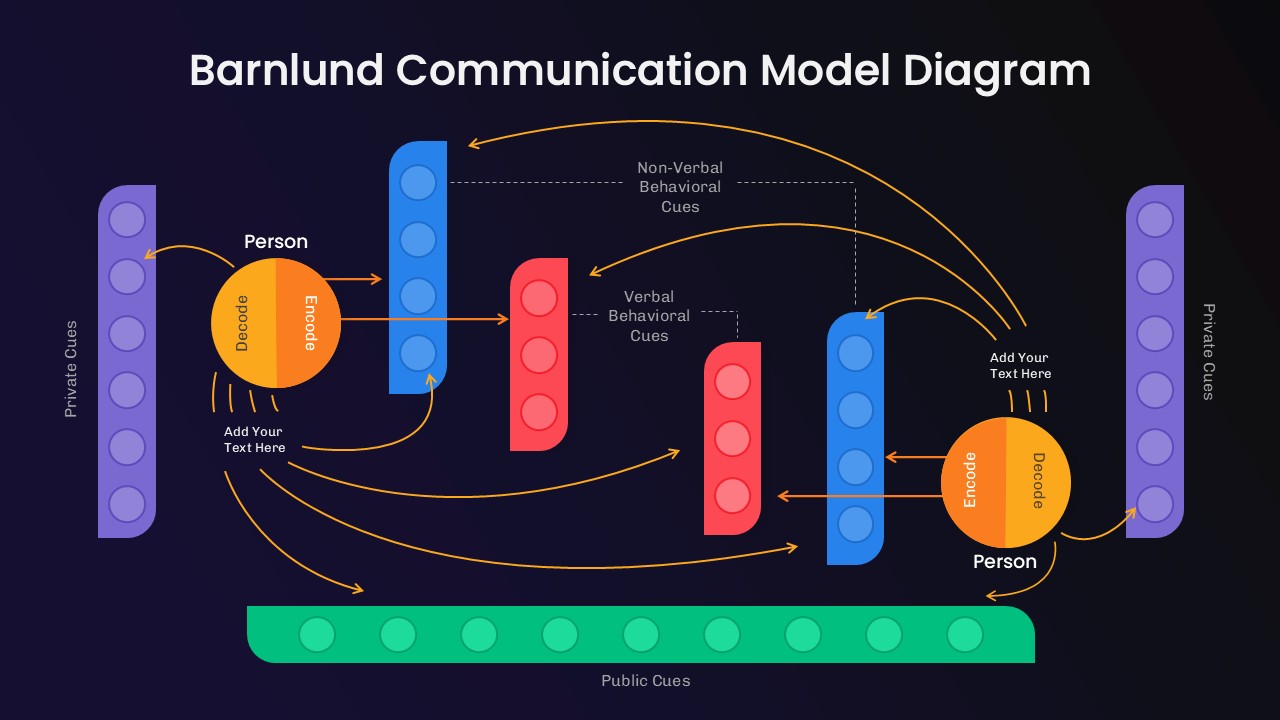
Barnlund Communication Model Diagram Template for PowerPoint & Google Slides
Process
Materiality Assessment Matrix Diagram Template for PowerPoint & Google Slides
Risk Management