Progression Track Milestone Table Template for PowerPoint & Google Slides
Description
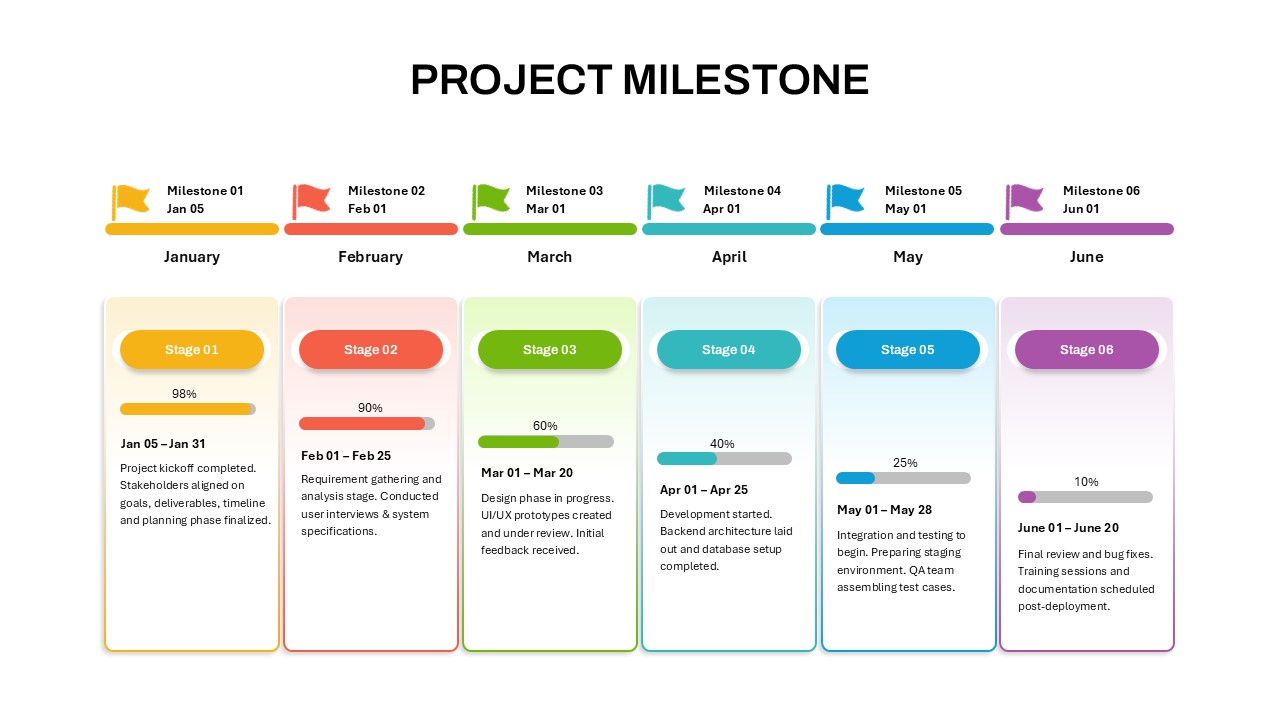
Leverage this progression track milestone table to monitor project scopes, progress percentages, and responsible teams in a clean, tabular format. Four rows delineate distinct project phases—Initial Planning, Design & Prototyping, Development & Integration, and Testing & Deployment—with each scope label highlighted in a bold accent color. The central “Progress” column features editable circular progress charts that visually represent completion percentages (80%, 50%, 40%, 70%), enabling audiences to gauge status at a glance. Adjacent description fields provide concise summaries of deliverables and current activities, while the “Person Responsible” column assigns ownership to roles like Project Manager, UX/UI Designer, Lead Developer, and QA Lead.
Built on fully editable master slides and vector shapes, this template allows you to swap out progress charts, adjust color palettes, update scope titles, or replace role labels in seconds—no design skills required. Theme compatibility ensures that custom corporate fonts, logos, and color schemes propagate seamlessly across both PowerPoint and Google Slides. Intuitive placeholder guides and snap-to-grid alignment guarantee consistent spacing, even when you resize elements or extend the table for additional milestones. Subtle drop shadows and a modern flat aesthetic keep the focus on your data, while high-resolution exports maintain sharpness on large screens and printed materials.
Use built-in animation presets to introduce each row sequentially, guiding viewers through milestones in a narrative flow. Whether you’re presenting quarterly reviews, stakeholder updates, or project kickoff agendas, this progression track table streamlines your workflow and enhances audience understanding by turning complex timelines into an easy-to-follow visual dashboard.
Who is it for
Project managers, product owners, program directors, business analysts, and team leads who need a clear, professional slide to report status updates, assign responsibilities, and drive accountability.
Other Uses
Repurpose this template for sprint planning summaries, phase-gate reviews, resource allocation tables, training progress trackers, or any scenario requiring structured milestone visualization.
Login to download this file

Item ID
SB04796
Related Templates

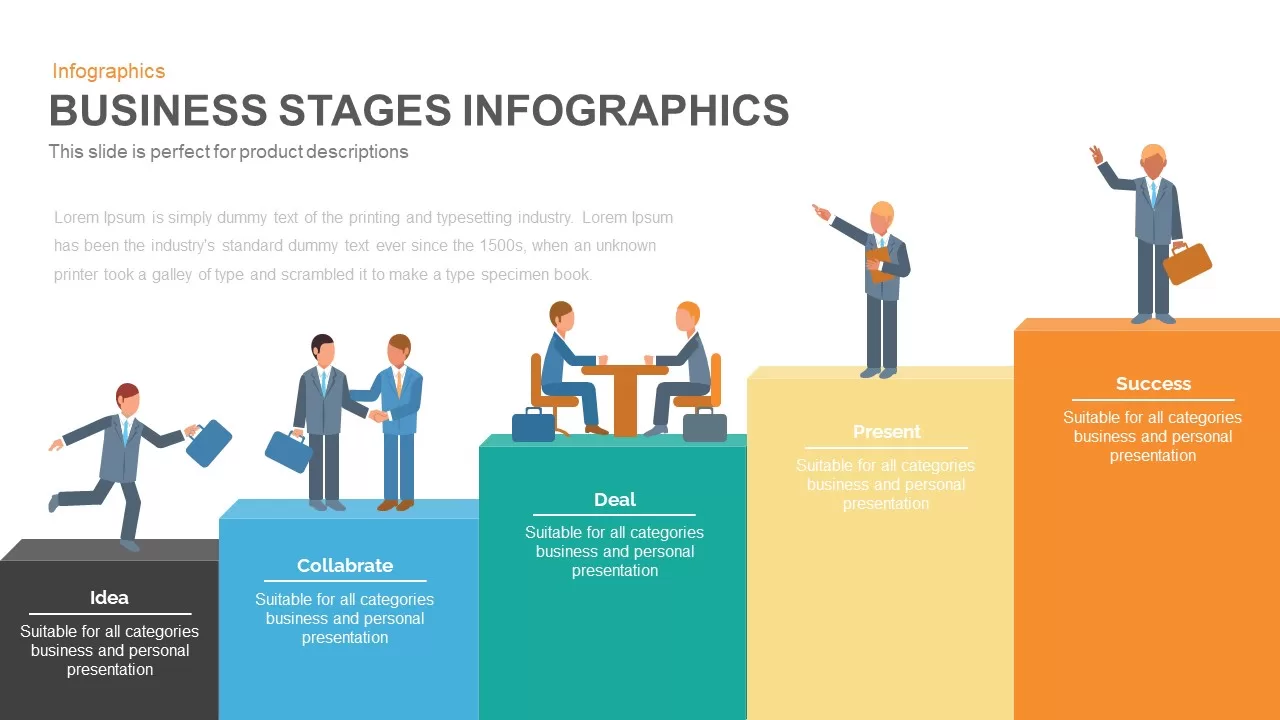
Business Stages Progression Infographic template for PowerPoint & Google Slides
Process
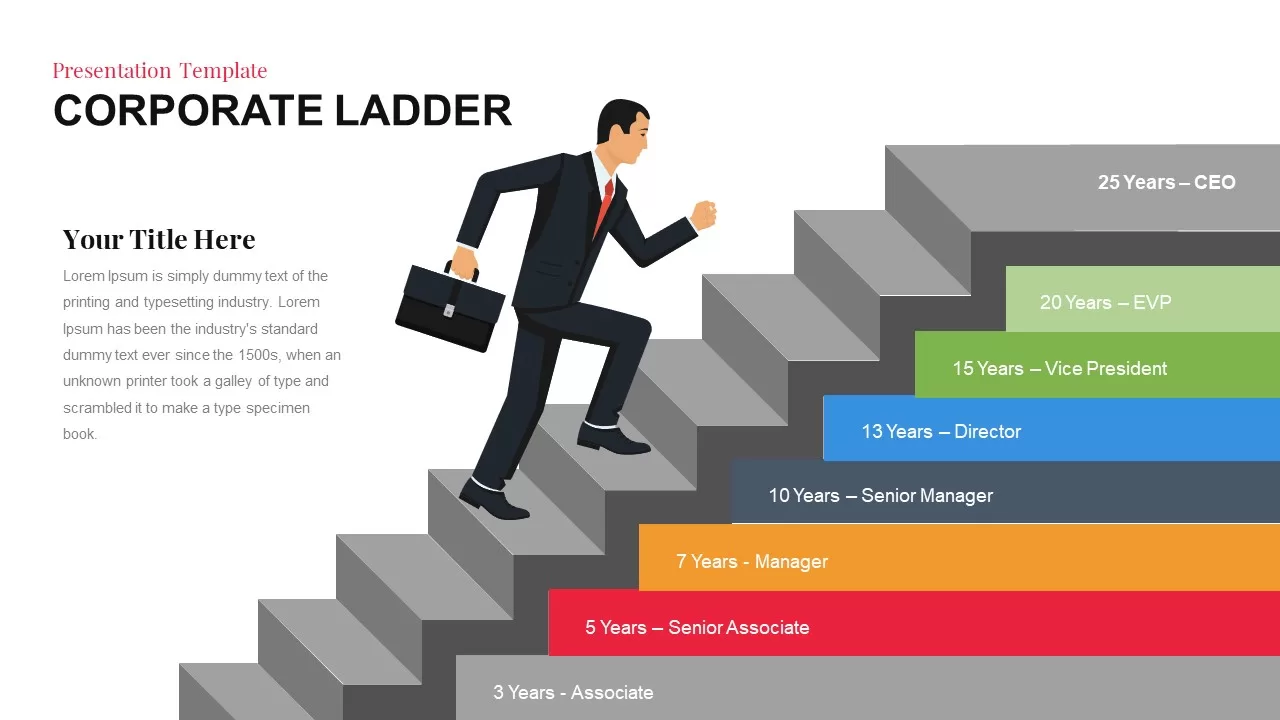
Corporate Ladder Career Progression Template for PowerPoint & Google Slides
Timeline
Curved Arrow Progression template for PowerPoint & Google Slides
Process
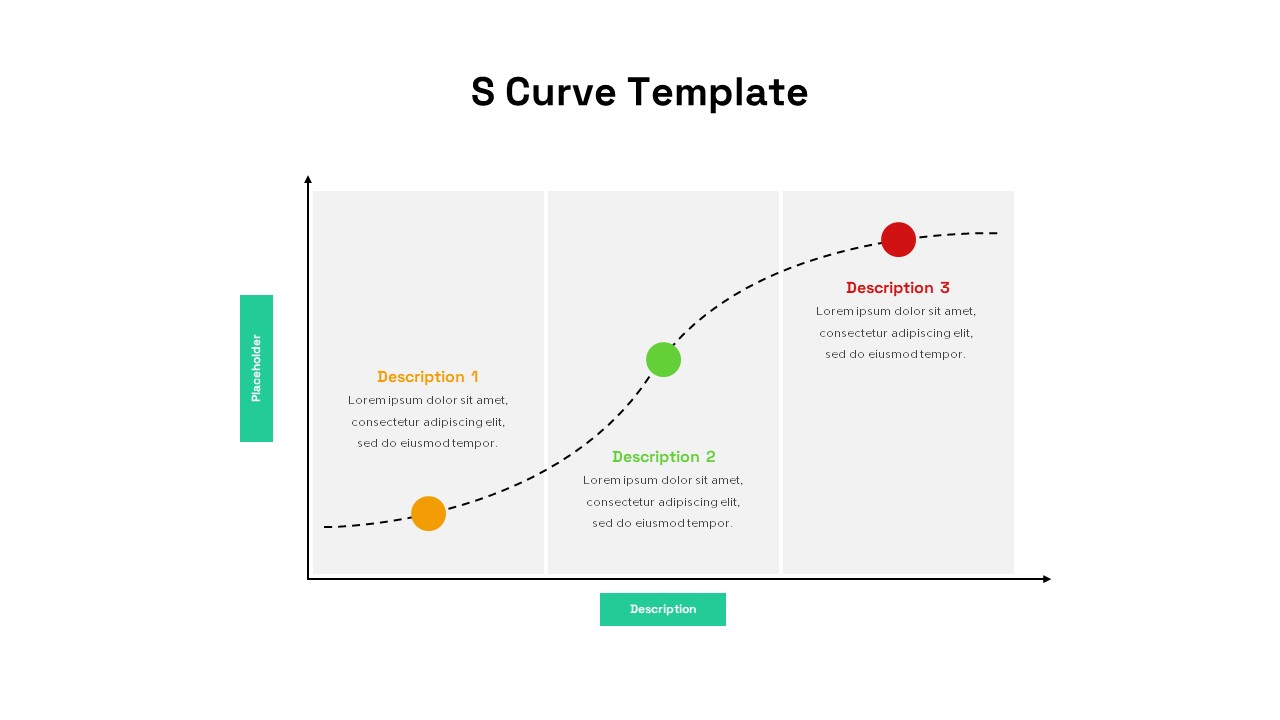
S-Curve Progression Framework Diagram Template for PowerPoint & Google Slides
Charts
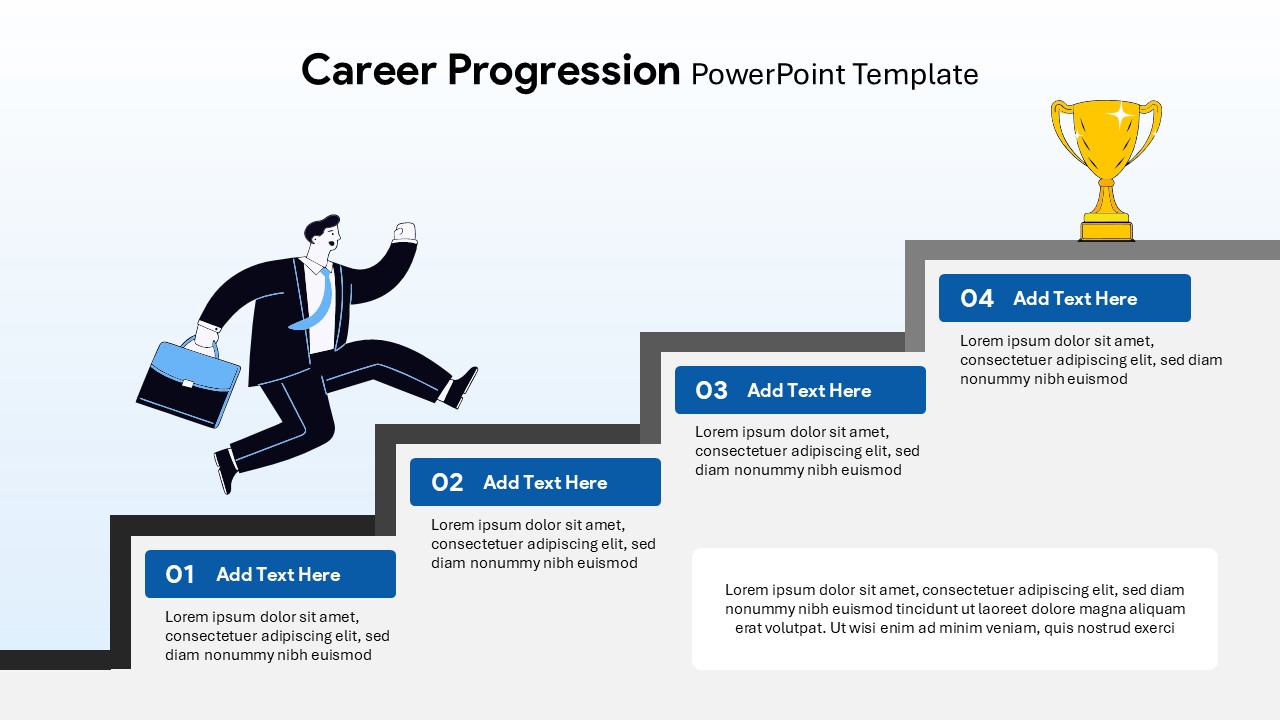
Career Progression Steps Template for PowerPoint & Google Slides
Employee Performance
Looping Roadmap Milestone Slides Template for PowerPoint & Google Slides
Roadmap
10 Stage Business Milestone Timeline PowerPoint Template for PowerPoint & Google Slides
Timeline
Business Target Milestone Roadmap Template for PowerPoint & Google Slides
Roadmap
Target Achievement Milestone Curve Template for PowerPoint & Google Slides
Roadmap
3D Milestone Roadmap Staircase Diagram Template for PowerPoint & Google Slides
Timeline
Milestone Timeline with Year Markers Template for PowerPoint & Google Slides
Timeline
Multi-Color Milestone Timeline Layout Template for PowerPoint & Google Slides
Timeline
Three-Year Vertical Milestone Timeline Template for PowerPoint & Google Slides
Timeline
Interactive Milestone Timeline Template for PowerPoint & Google Slides
Timeline
Professional Milestone Timeline Chart Template for PowerPoint & Google Slides
Timeline
Progress Bar and Milestone Visualization Template for PowerPoint & Google Slides
Timeline
Free Multicolor Five-Stage Milestone Timeline Template for PowerPoint & Google Slides
Timeline
Free
Animated Multi-Milestone Roadmap Template for PowerPoint & Google Slides
Roadmap
Milestone Progress template for PowerPoint & Google Slides
Business Plan
Project Milestone Timeline Infographic Template for PowerPoint & Google Slides
Timeline
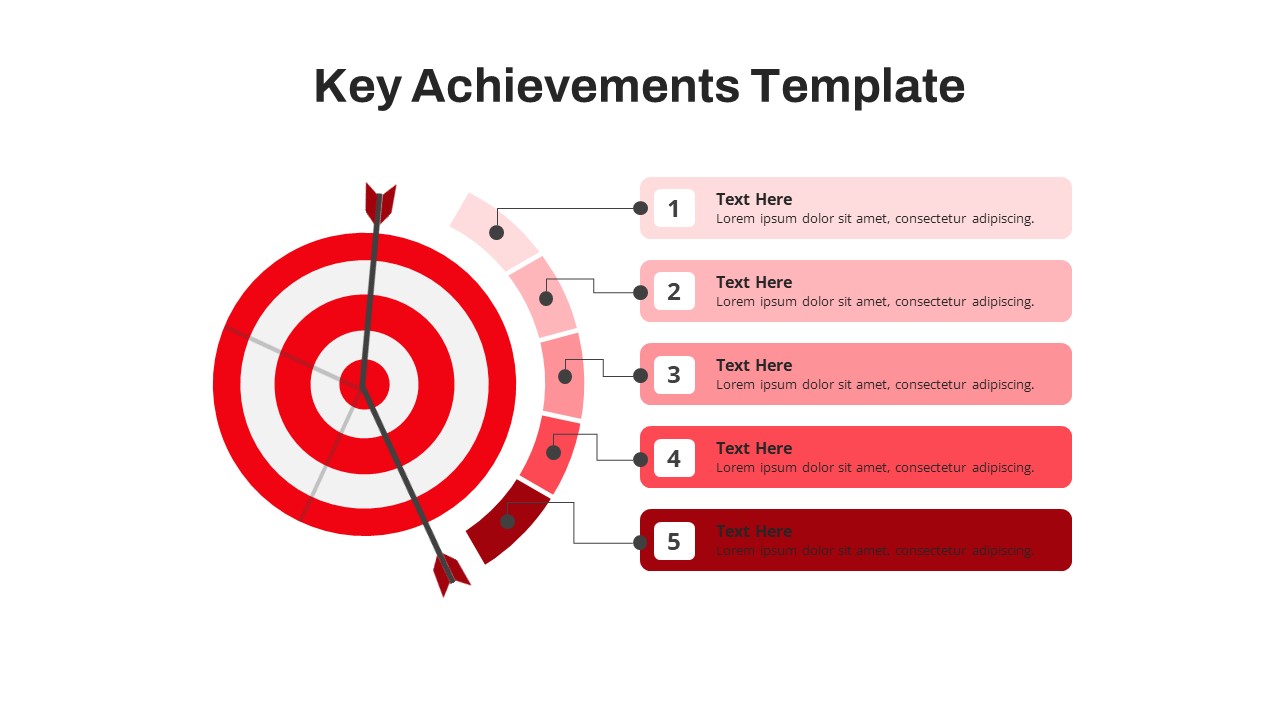
Free Target Milestone Achievements Slide for PowerPoint & Google Slides
Accomplishment
Free
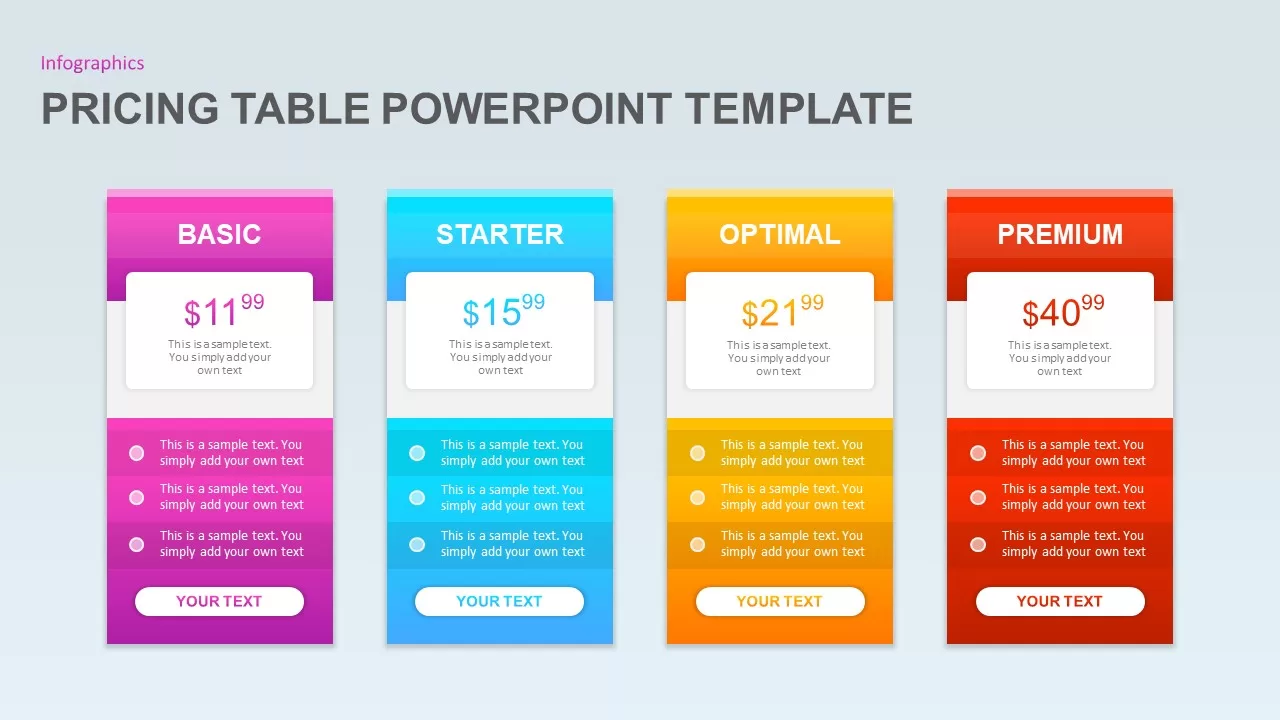
Pricing Table PowerPoint Template for PowerPoint & Google Slides
Infographics
Simple Comparison Table Template for PowerPoint & Google Slides
Comparison
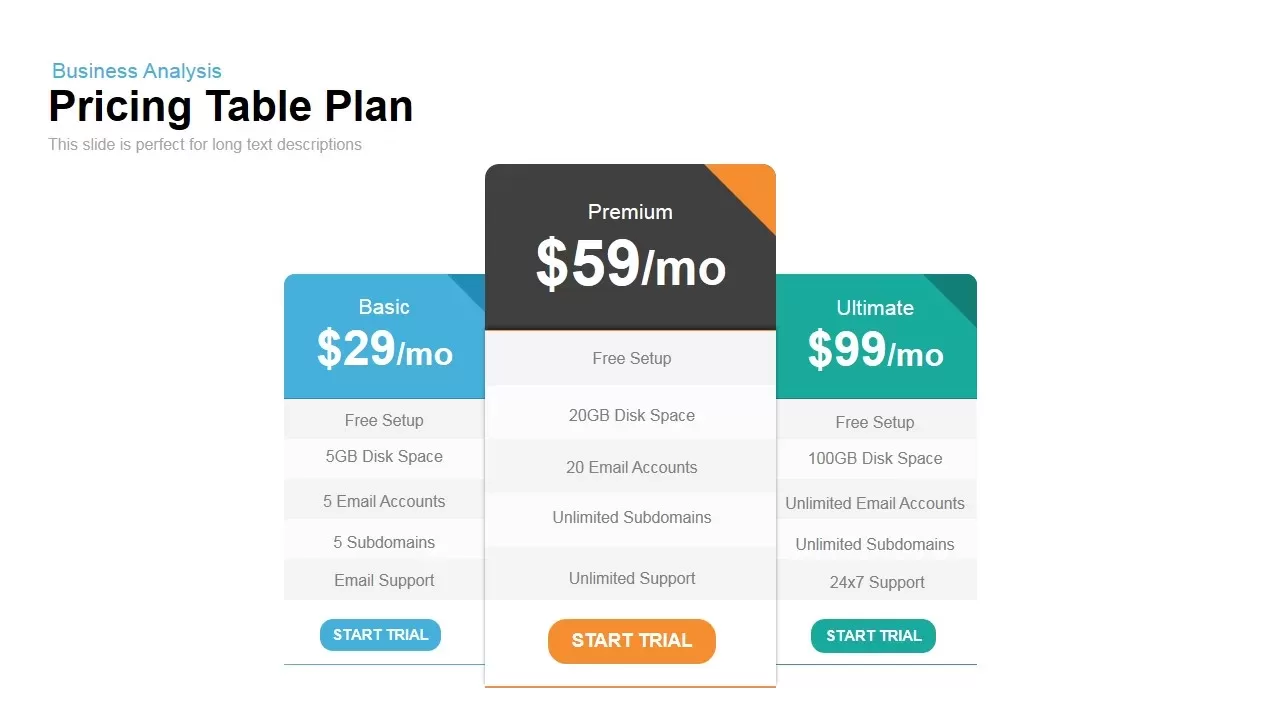
Three-Tier Pricing Table Slide Template for PowerPoint & Google Slides
Comparison
Four-Tier Pricing Comparison Table Template for PowerPoint & Google Slides
Comparison
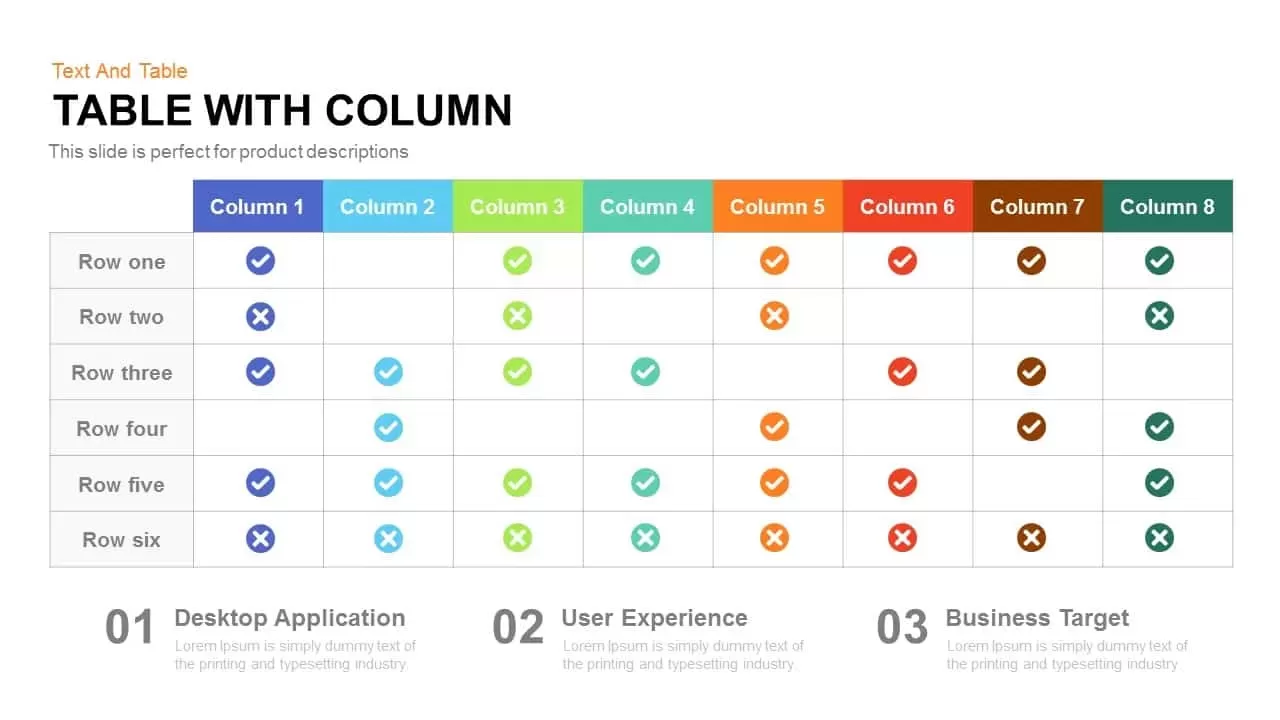
Table with Columns template for PowerPoint & Google Slides
Comparison Chart
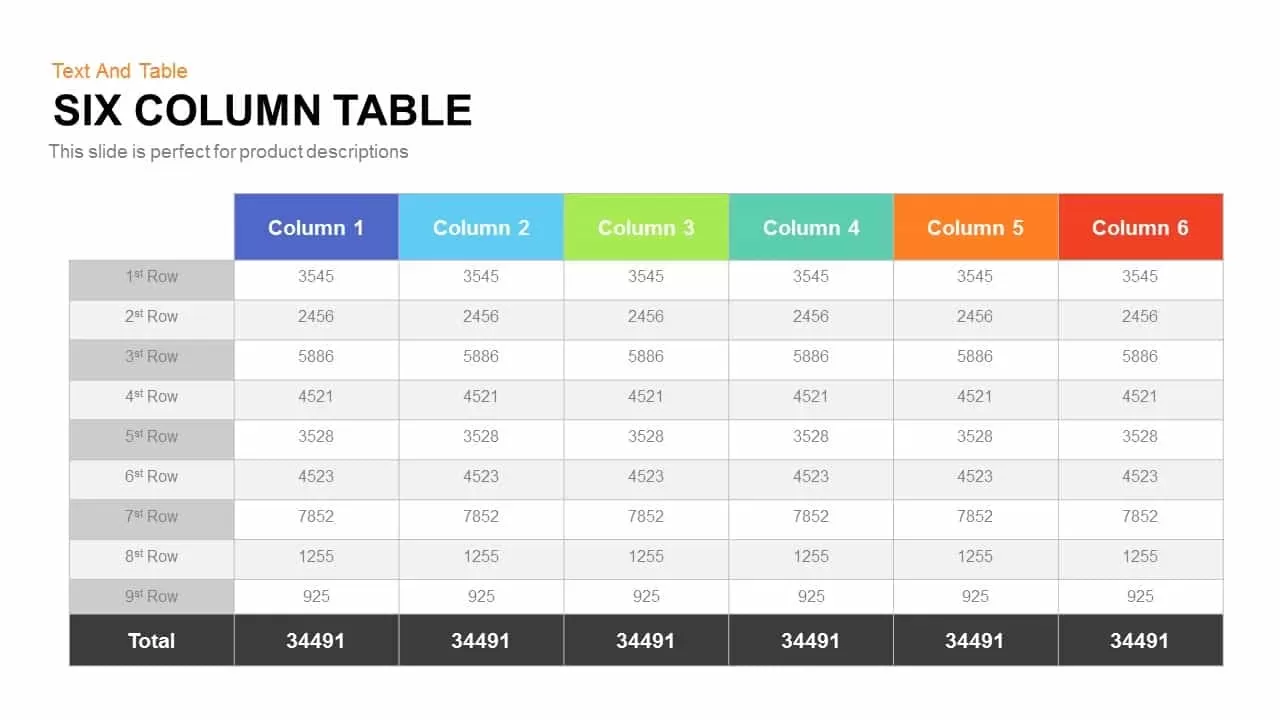
Six Column Table template for PowerPoint & Google Slides
Table
Four-Plan Pricing Table Comparison Template for PowerPoint & Google Slides
Comparison

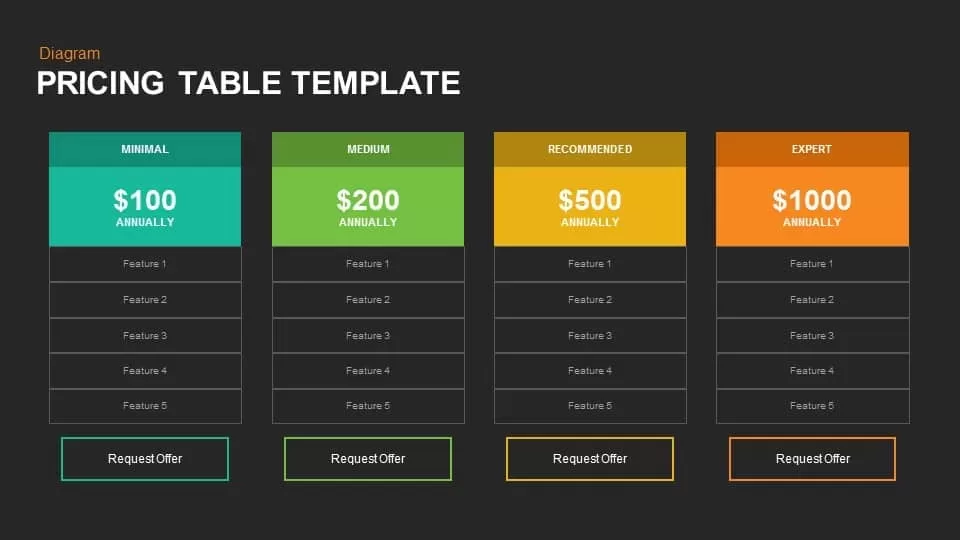
Pricing Table Template for PowerPoint & Google Slides
Business Proposal
Dynamic Multicolor Comparison Table Template for PowerPoint & Google Slides
Comparison
Puzzle-Style SWOT Analysis Table Diagram Template for PowerPoint & Google Slides
SWOT

Comparison Pricing Table Infographic Template for PowerPoint & Google Slides
Comparison Chart
PESTLE Analysis Table Layout Diagram Template for PowerPoint & Google Slides
PEST
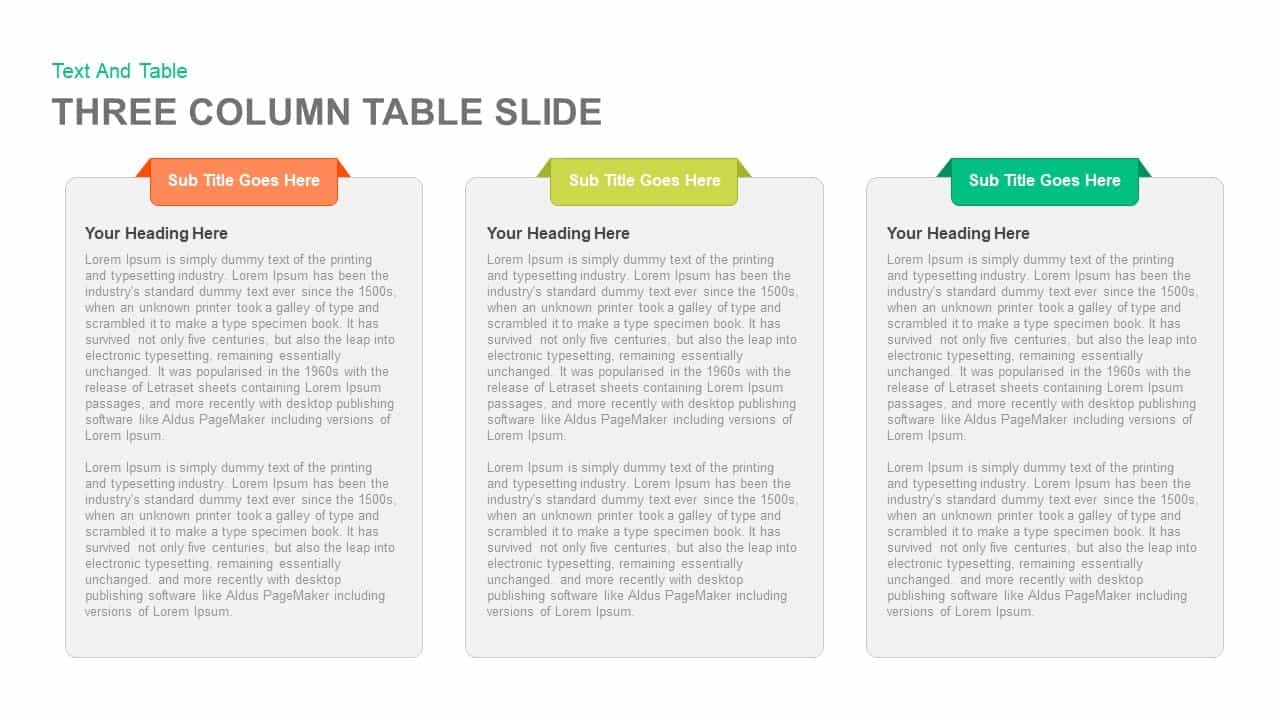
Clean Three-Four Column Table Slide Template for PowerPoint & Google Slides
Business Report
Five-Option Text Boxes Table Comparison Template for PowerPoint & Google Slides
Business Report
Four-Stage Business Planning Table Template for PowerPoint & Google Slides
Business Plan
30 60 90 Day Plan Matrix Table Template for PowerPoint & Google Slides
Timeline
30-60-90 Business Plan Table Template for PowerPoint & Google Slides
Timeline
Table of Contents Presentation template for PowerPoint & Google Slides
Agenda
Six-Step Color-Coded Table of Contents Template for PowerPoint & Google Slides
Agenda
Table of Contents Infographic Slide template for PowerPoint & Google Slides
Agenda
Six-Step Table of Contents Infographic Template for PowerPoint & Google Slides
Agenda
Eight-Step Colorful Table of Contents Template for PowerPoint & Google Slides
Infographics
Four-Section Table of Contents Template for PowerPoint & Google Slides
Agenda
Four-Part Table of Contents Infographic Template for PowerPoint & Google Slides
Agenda
Five-Step Table of Contents Presentation Template for PowerPoint & Google Slides
Agenda
Four-Step Numbered Table of Contents Template for PowerPoint & Google Slides
Agenda
Four-Step Table of Contents Presentation Template for PowerPoint & Google Slides
Agenda
Chevron Table of Contents Presentation Template for PowerPoint & Google Slides
Agenda
Four-Step Agenda Table of Contents Template for PowerPoint & Google Slides
Agenda
Modern Four-Step Table of Contents Template for PowerPoint & Google Slides
Agenda
Four-Step Strategic Table of Contents Template for PowerPoint & Google Slides
Agenda
Table of Contents Infographics template for PowerPoint & Google Slides
Company Profile
Income Statement Overview Table Template for PowerPoint & Google Slides
Finance
Project Status Dashboard Table Template for PowerPoint & Google Slides
Project Status
Project Status Table Template for PowerPoint & Google Slides
Project Status
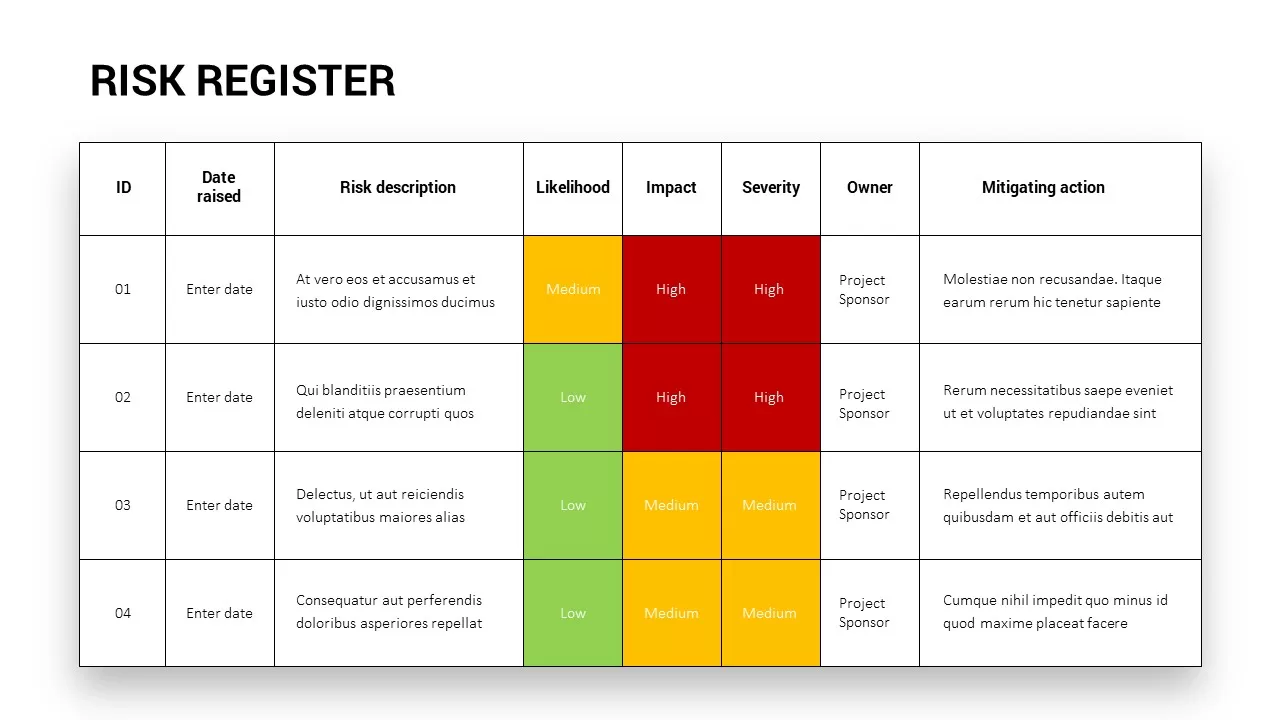
Comprehensive Risk Register Table Template for PowerPoint & Google Slides
Risk Management
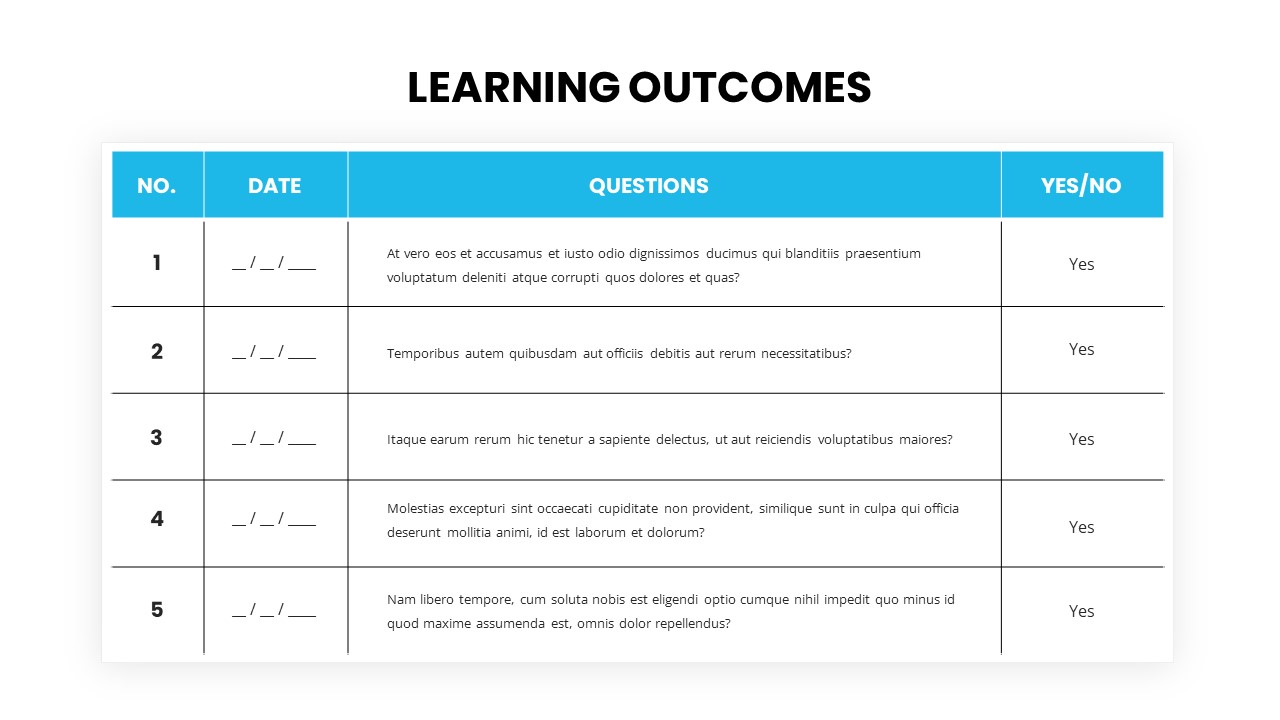
Learning Outcomes table template for PowerPoint & Google Slides
Charts
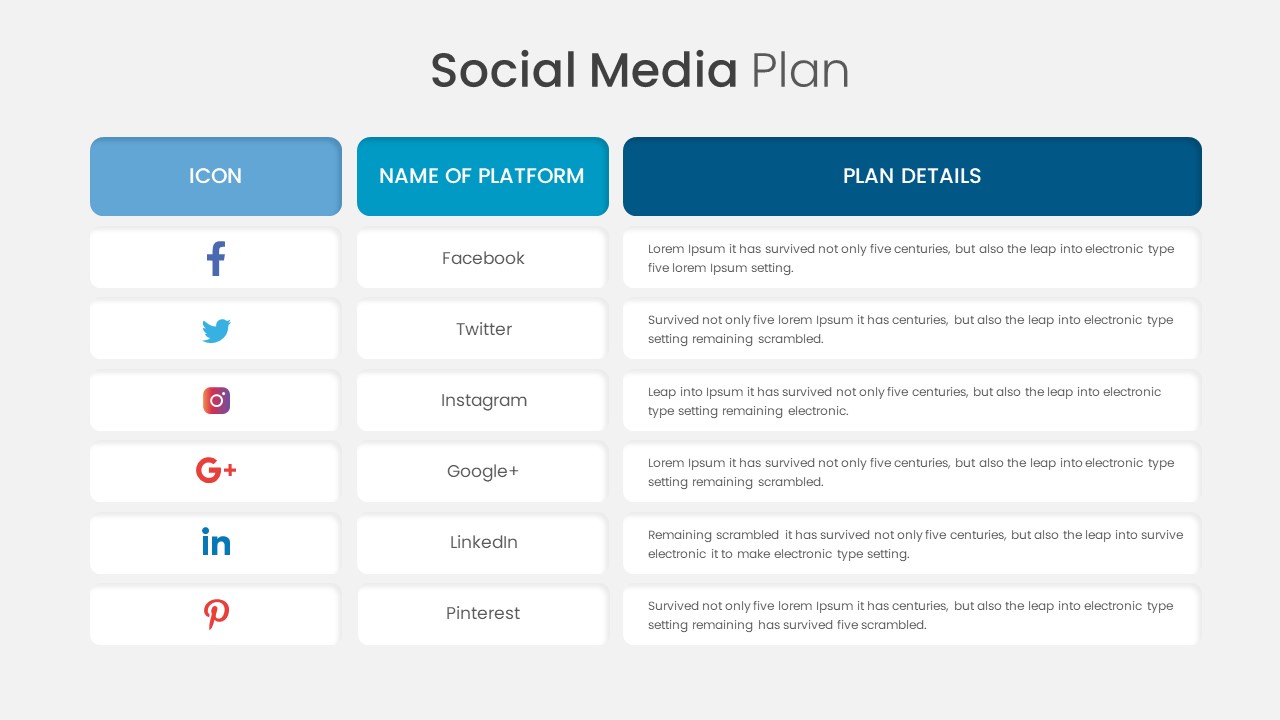
Social Media Plan Table Slide Deck Template for PowerPoint & Google Slides
Process
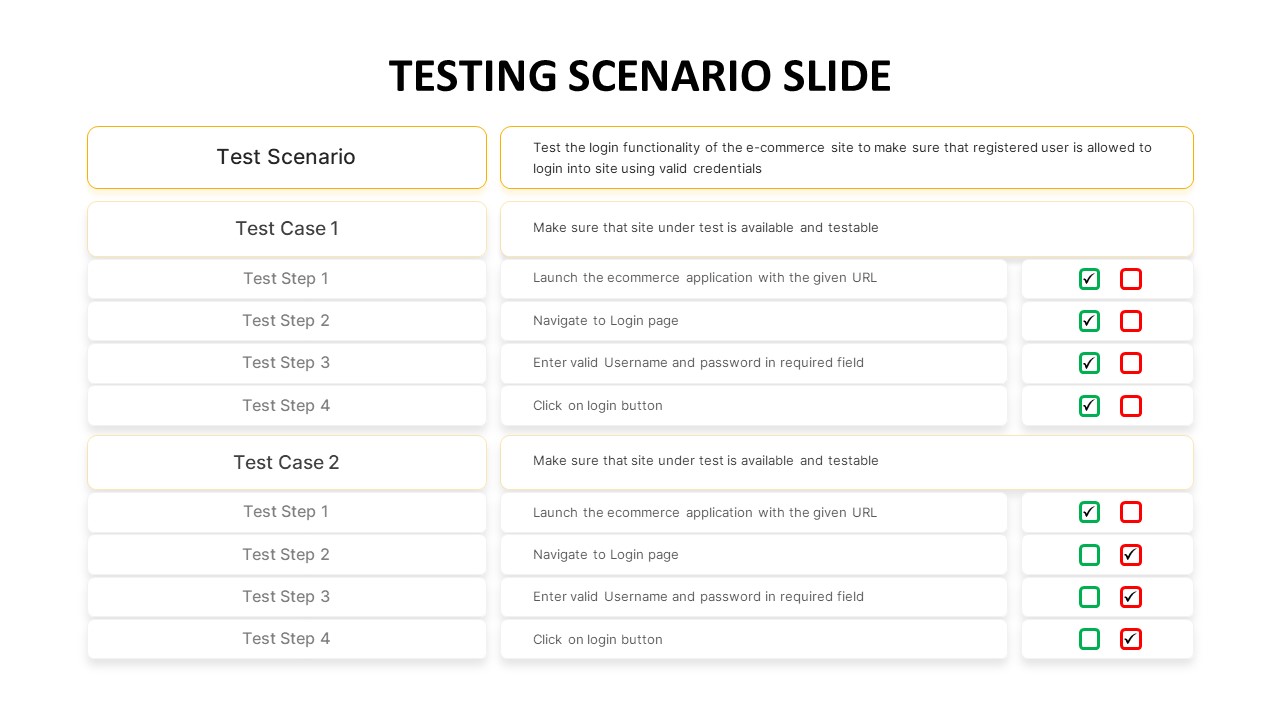
Testing Scenario Table Template for PowerPoint & Google Slides
Business Requirements
Comprehensive Resource Planning Table Template for PowerPoint & Google Slides
Project
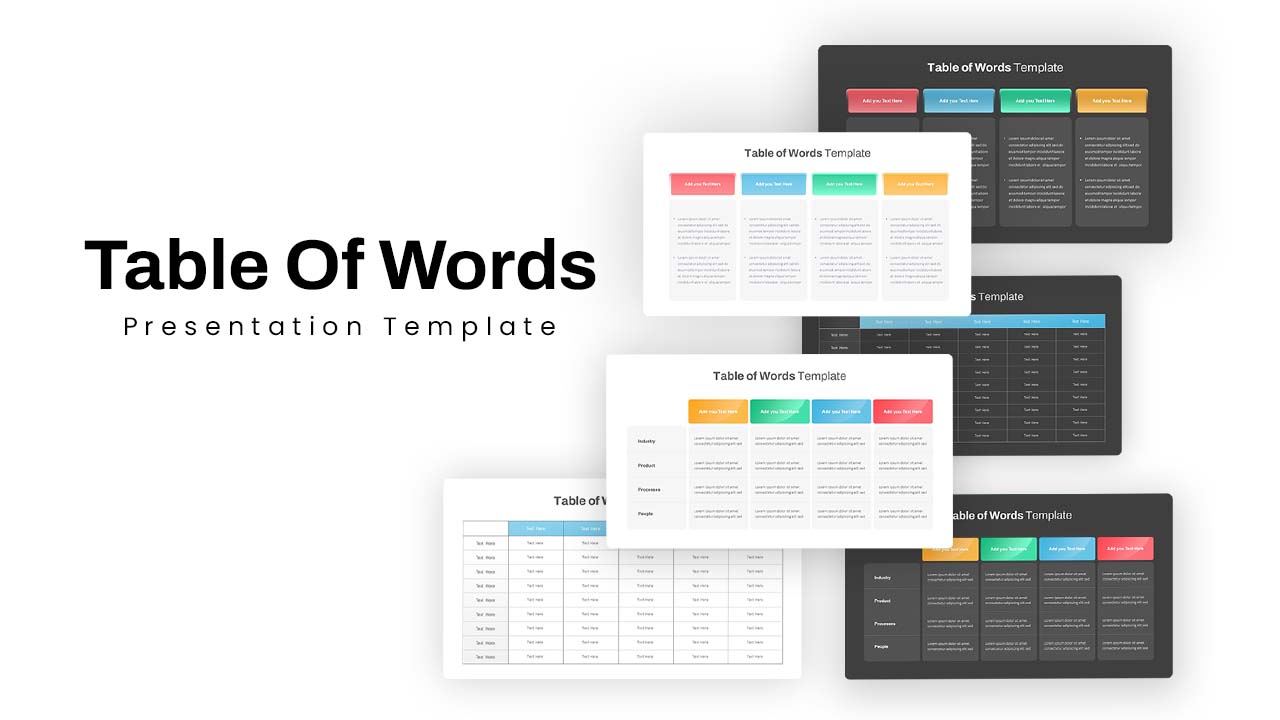
Versatile Table of Words Layout Template for PowerPoint & Google Slides
Table
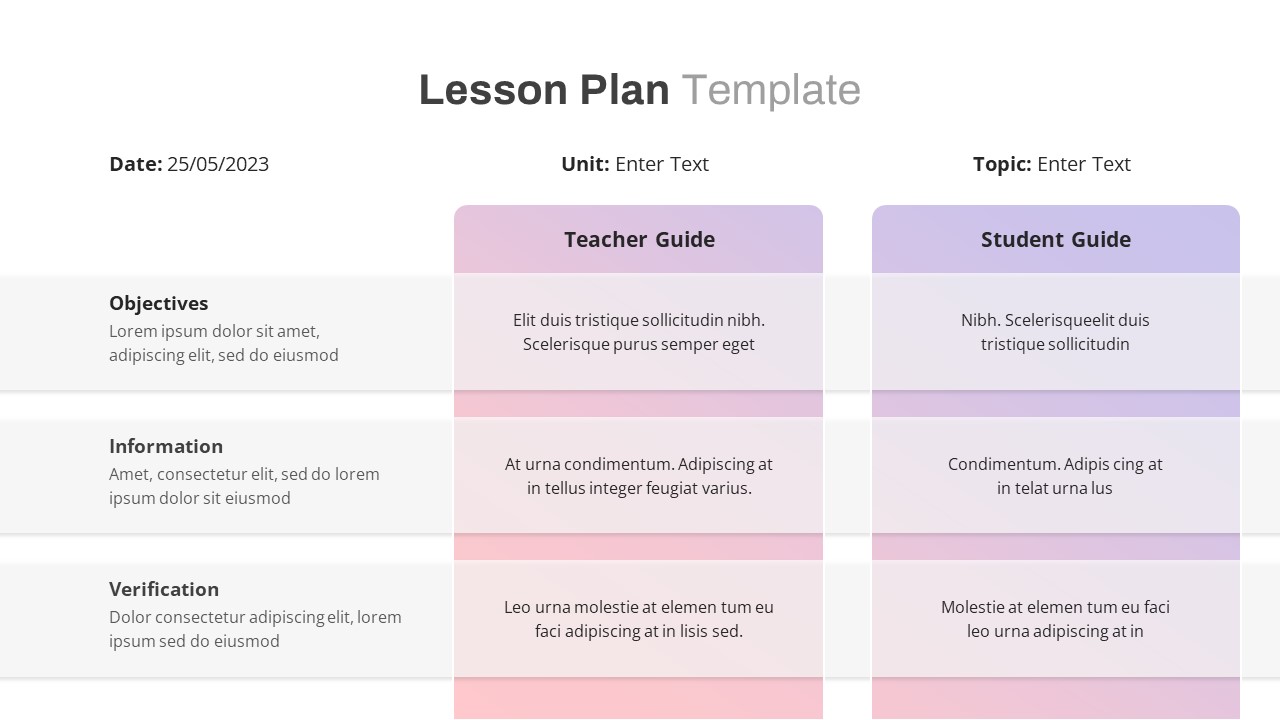
Free Lesson Plan Table Slide Template for PowerPoint & Google Slides
Agenda
Free
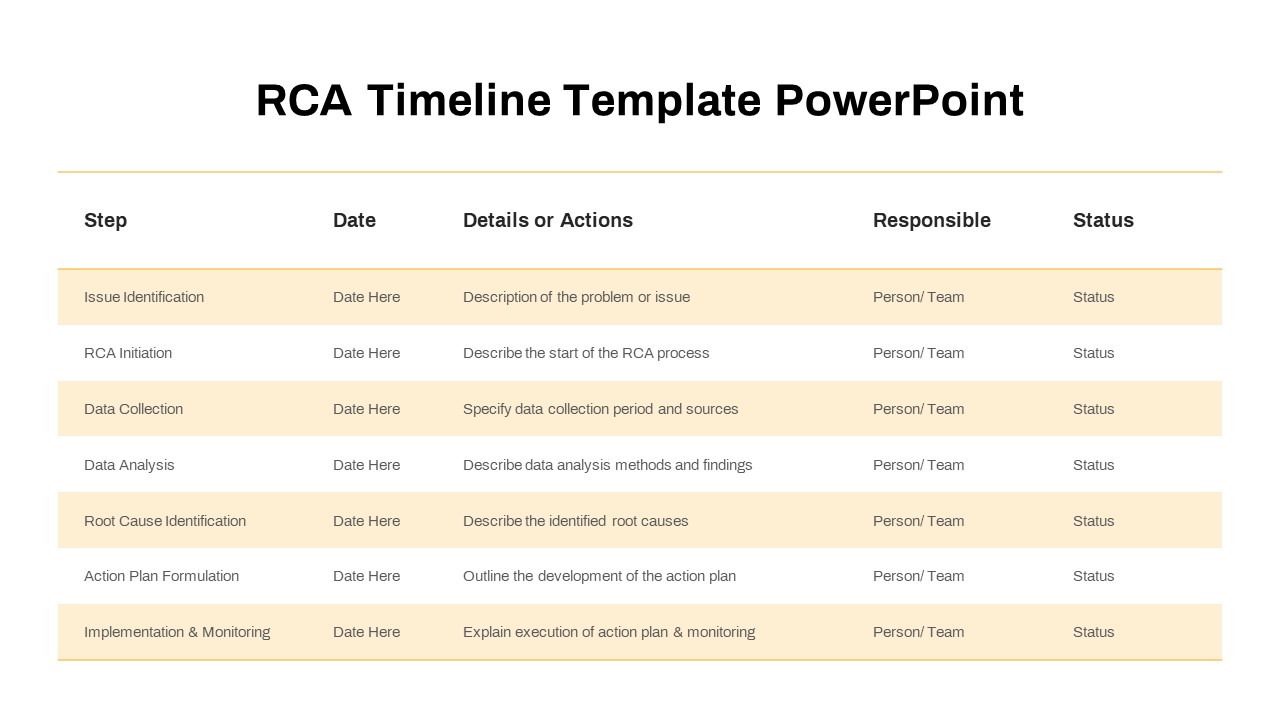
RCA Process Timeline Table Slide Template for PowerPoint & Google Slides
Timeline
Free Minimal Multi-Color Table of Contents Template for PowerPoint & Google Slides
Agenda
Free
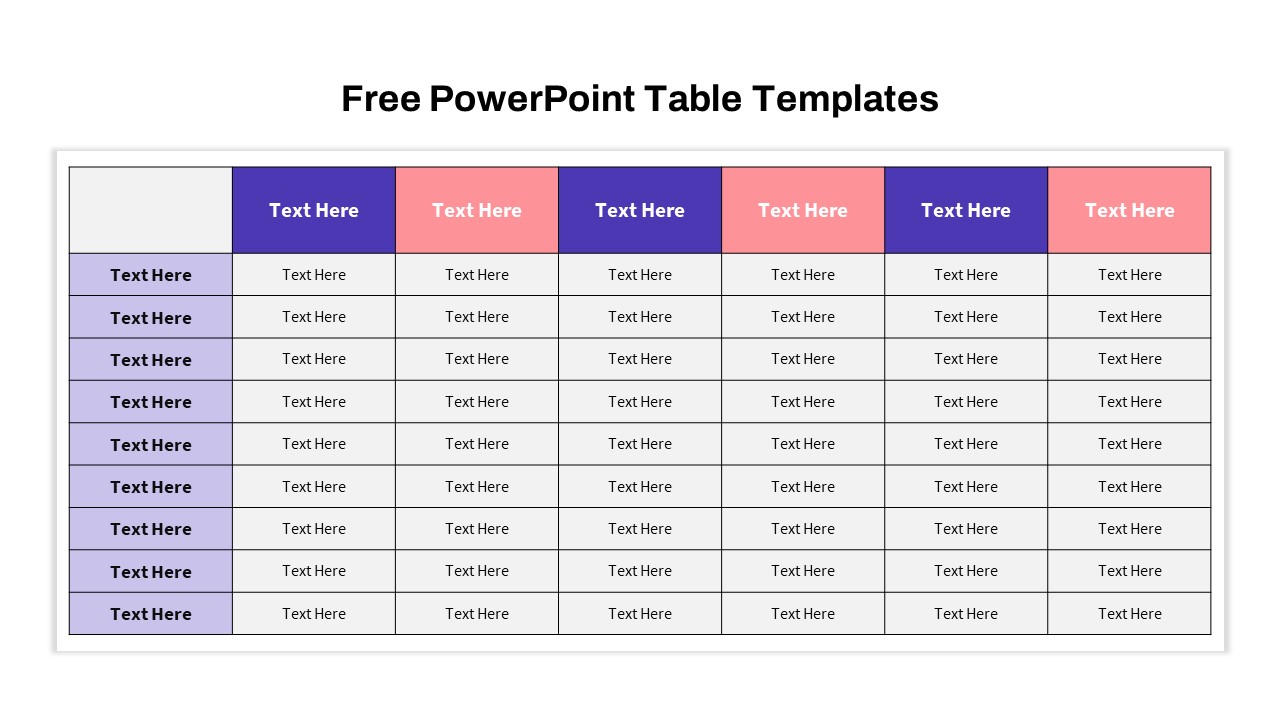
Free Versatile Table Collection Template for PowerPoint & Google Slides
Pitch Deck
Free
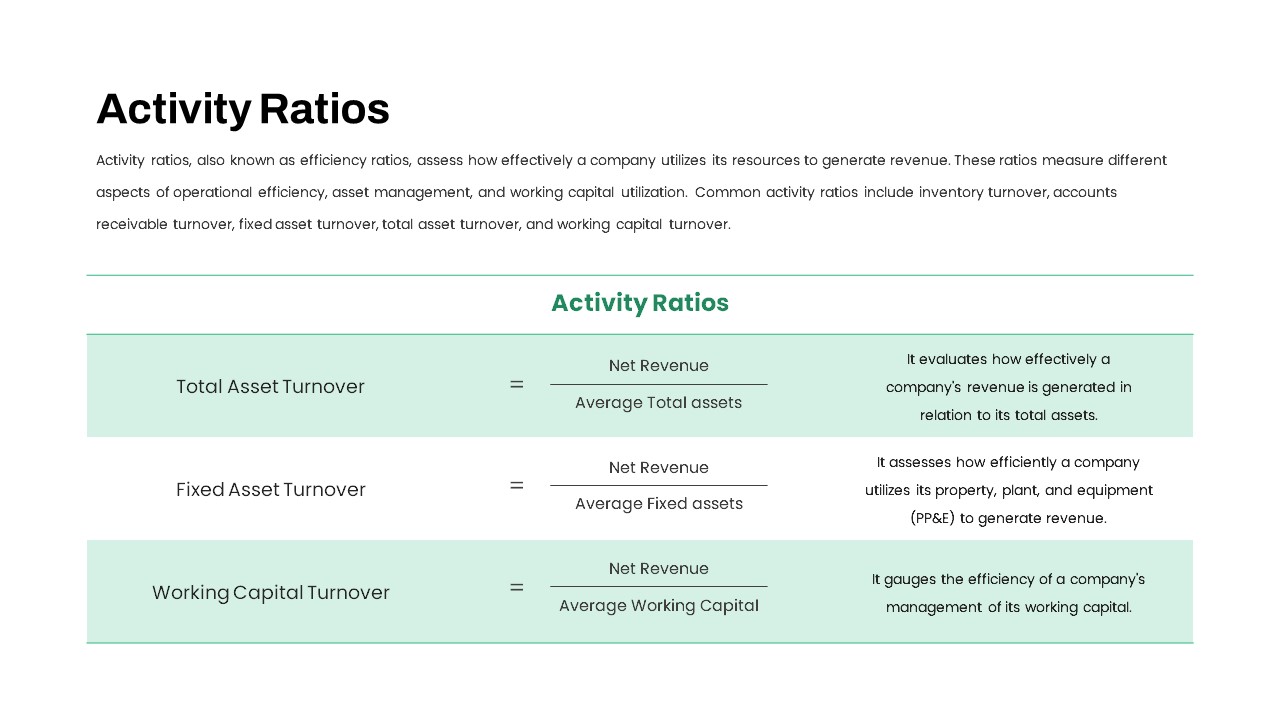
Activity Ratios Formula Table Slide Template for PowerPoint & Google Slides
Comparison Chart
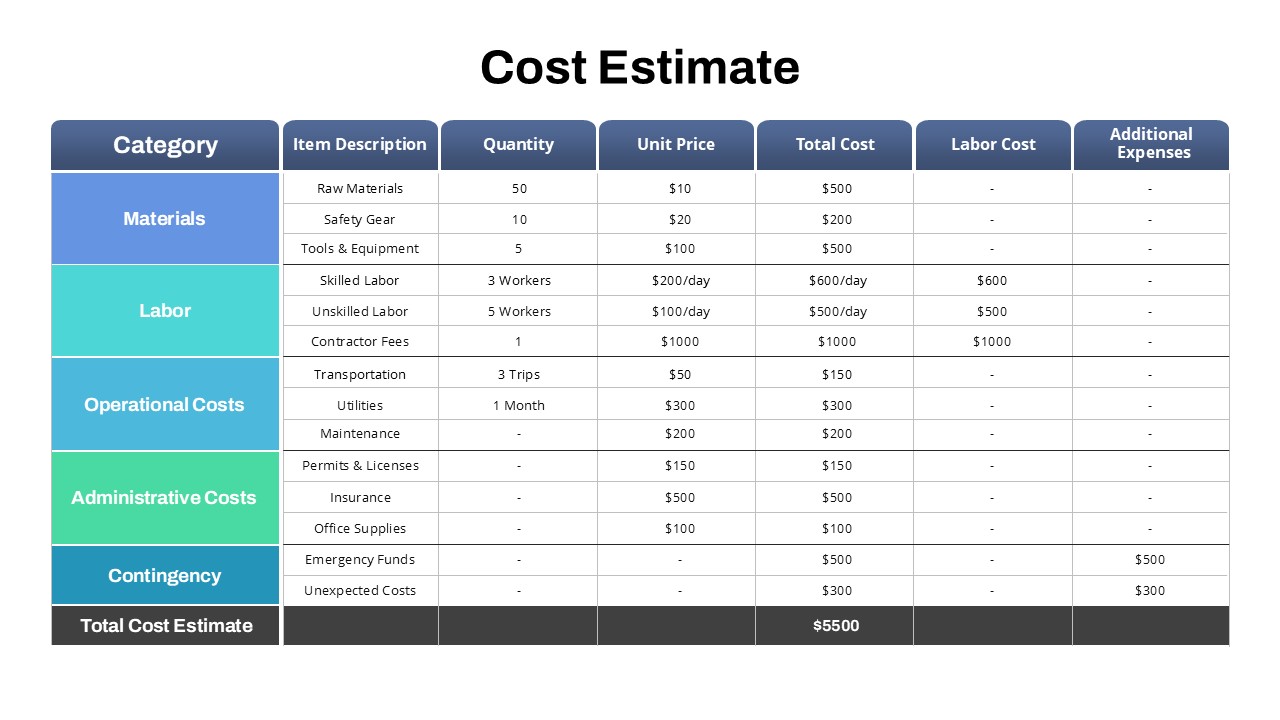
Project Detailed Cost Estimate Table Template for PowerPoint & Google Slides
Project
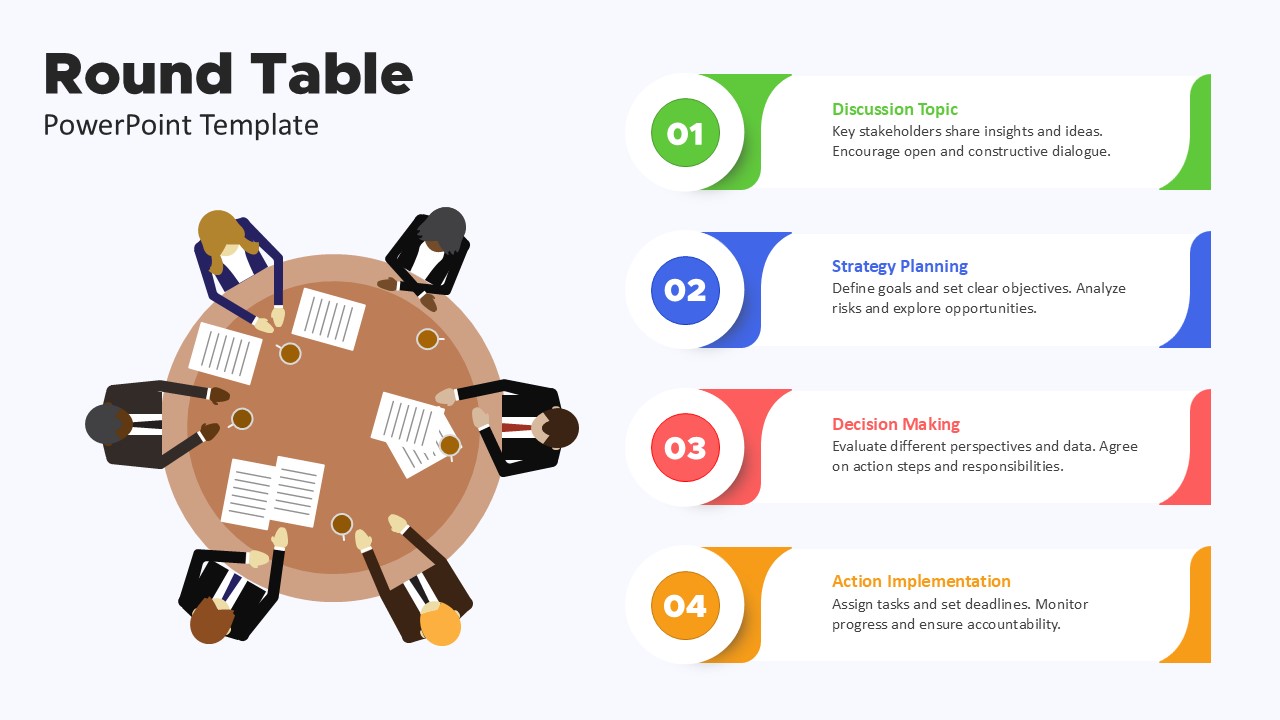
Title: Round Table Meeting Discussion Process Template for PowerPoint & Google Slides
Process
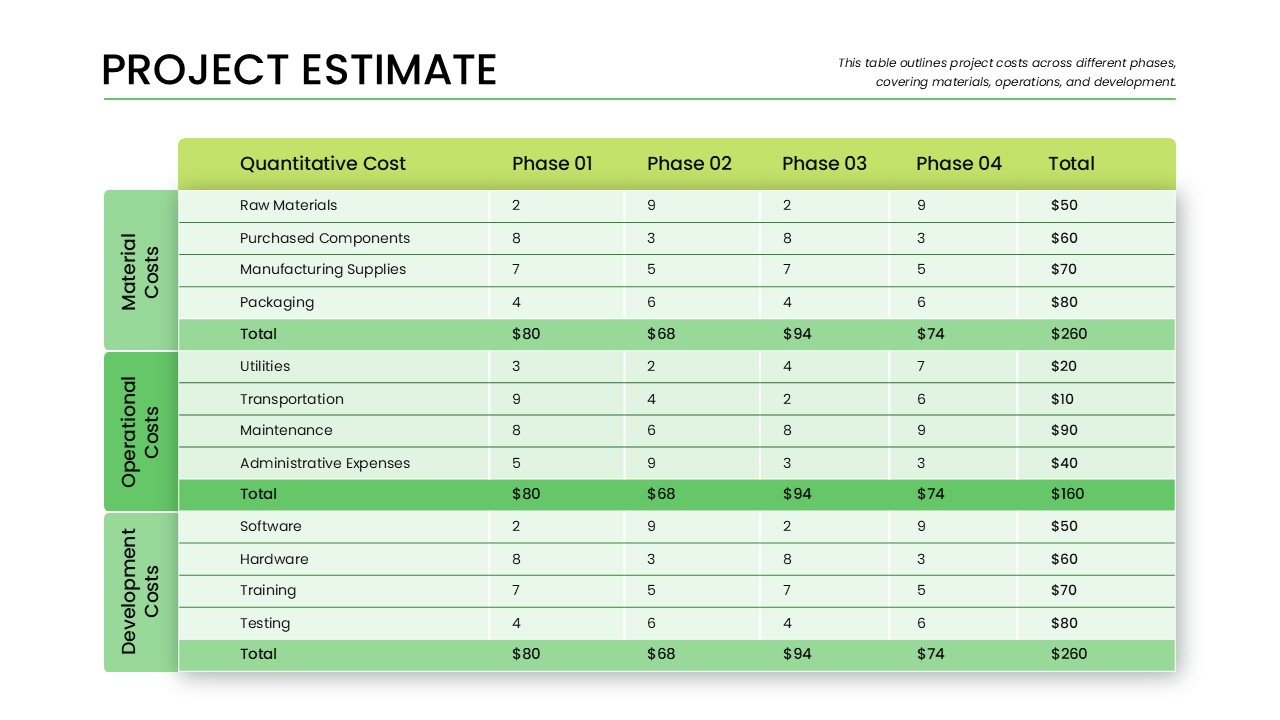
Phase-Wise Project Estimate Table Template for PowerPoint & Google Slides
Business Report
Professional Table of Organization Chart Template for PowerPoint & Google Slides
Org Chart
Two-Option Bar Chart Comparison Table Template for PowerPoint & Google Slides
Comparison
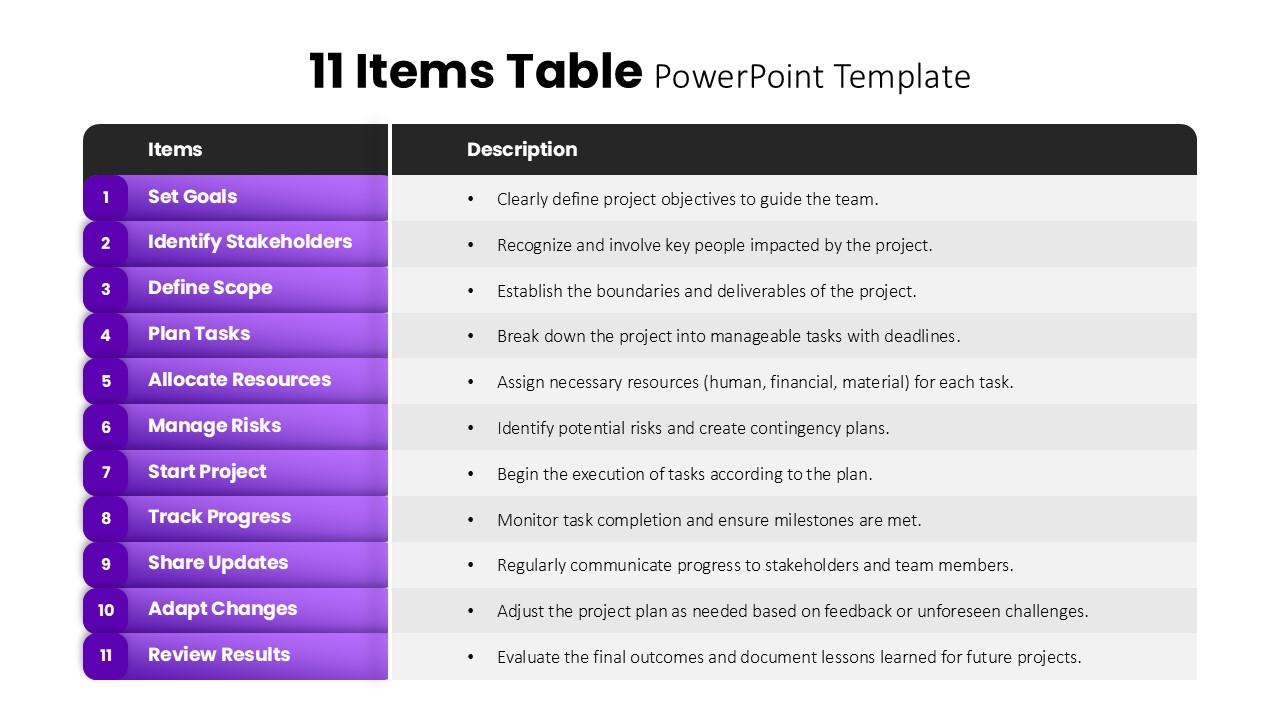
11 Items Table Project Planning Steps template for PowerPoint & Google Slides
Business
Product Feature Comparison Table Template for PowerPoint & Google Slides
Comparison Chart
Sales Growth Comparison Chart & Table Template for PowerPoint & Google Slides
Bar/Column
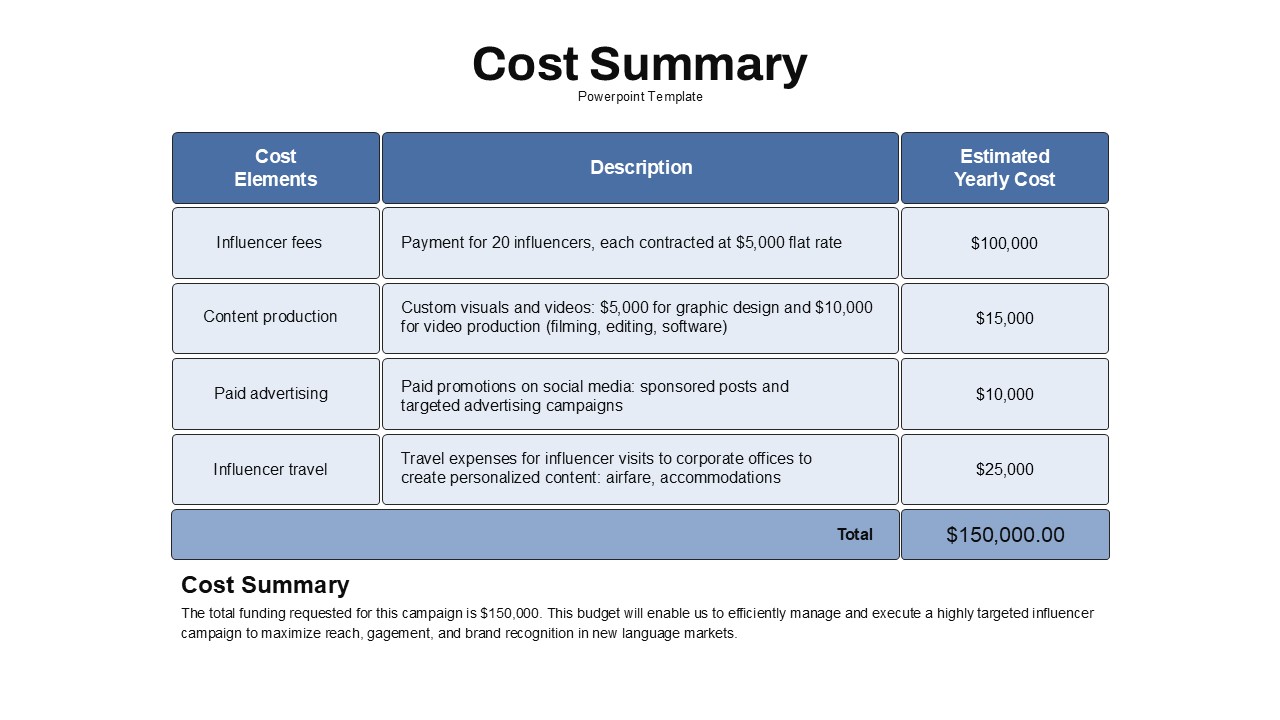
Cost Summary Table Template for PowerPoint & Google Slides
Business Report
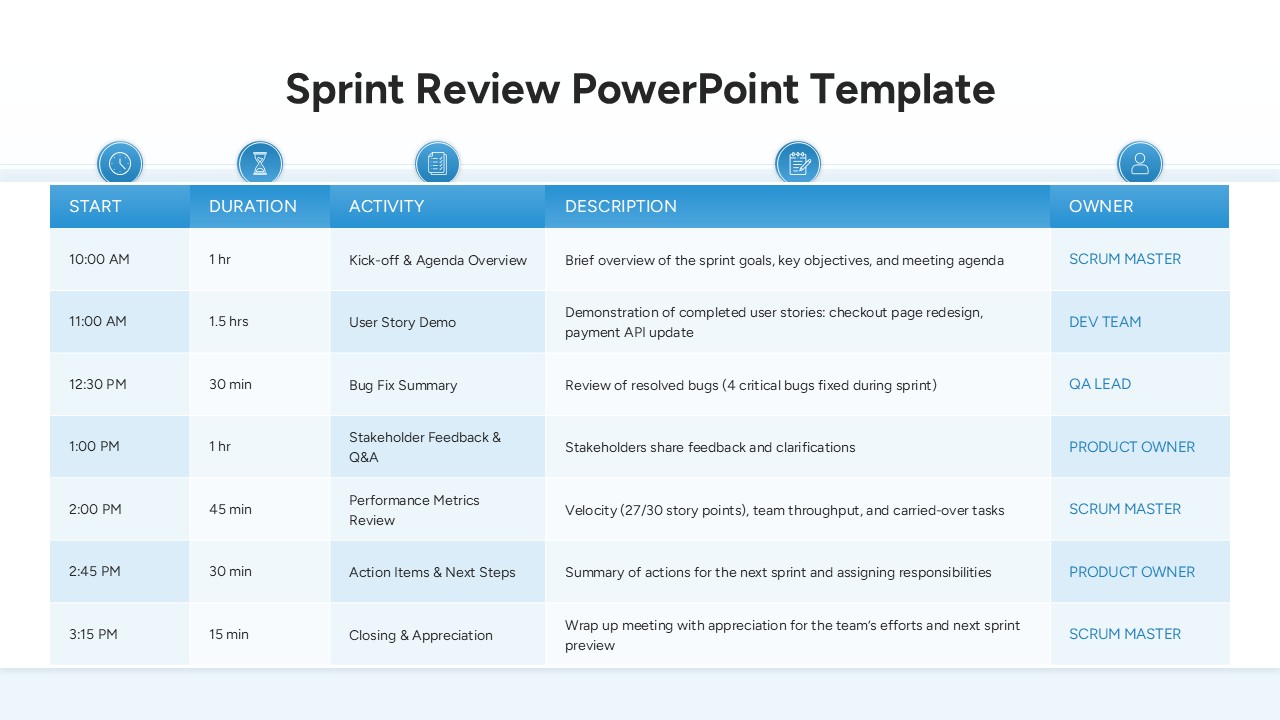
Sprint Review Meeting Agenda Table Template for PowerPoint & Google Slides
Agenda
Project Tracking Dashboard Table Template for PowerPoint & Google Slides
Project Status
Action Items Management Dashboard Table Template for PowerPoint & Google Slides
Project Status
Comprehensive Action Tracker Table Template for PowerPoint & Google Slides
Business
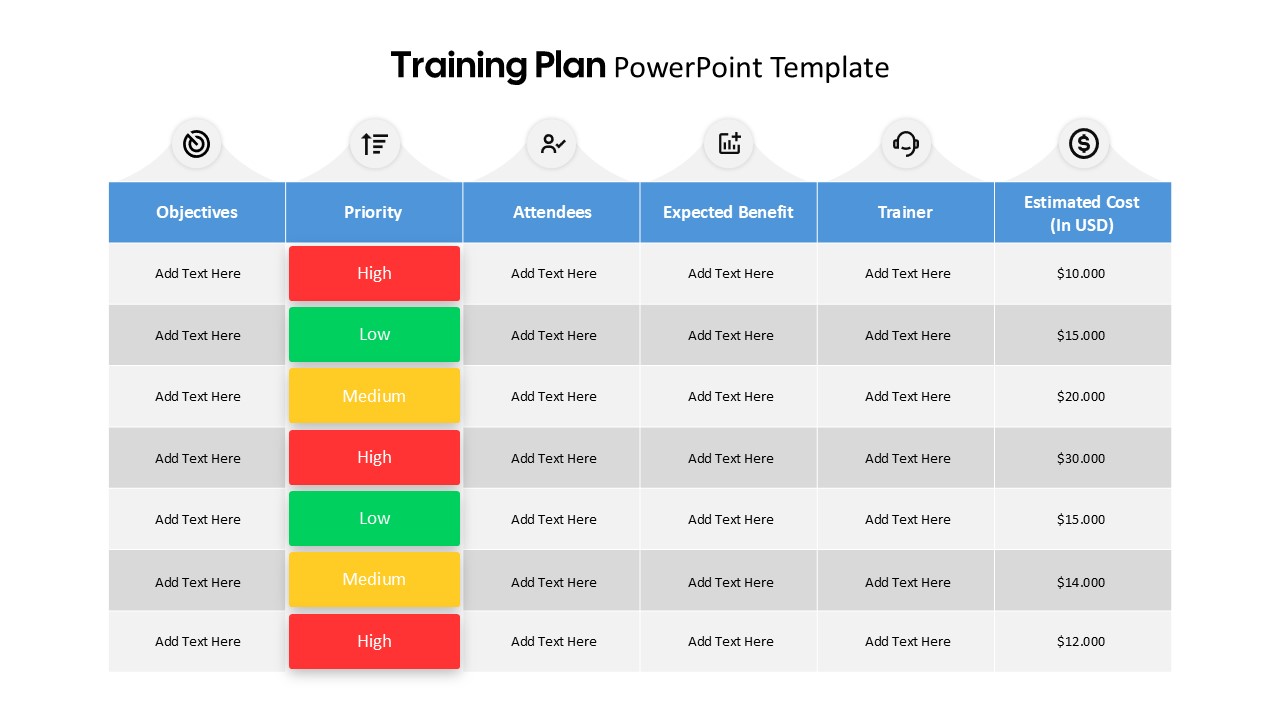
Training Plan Table Layout Template for PowerPoint & Google Slides
Employee Performance
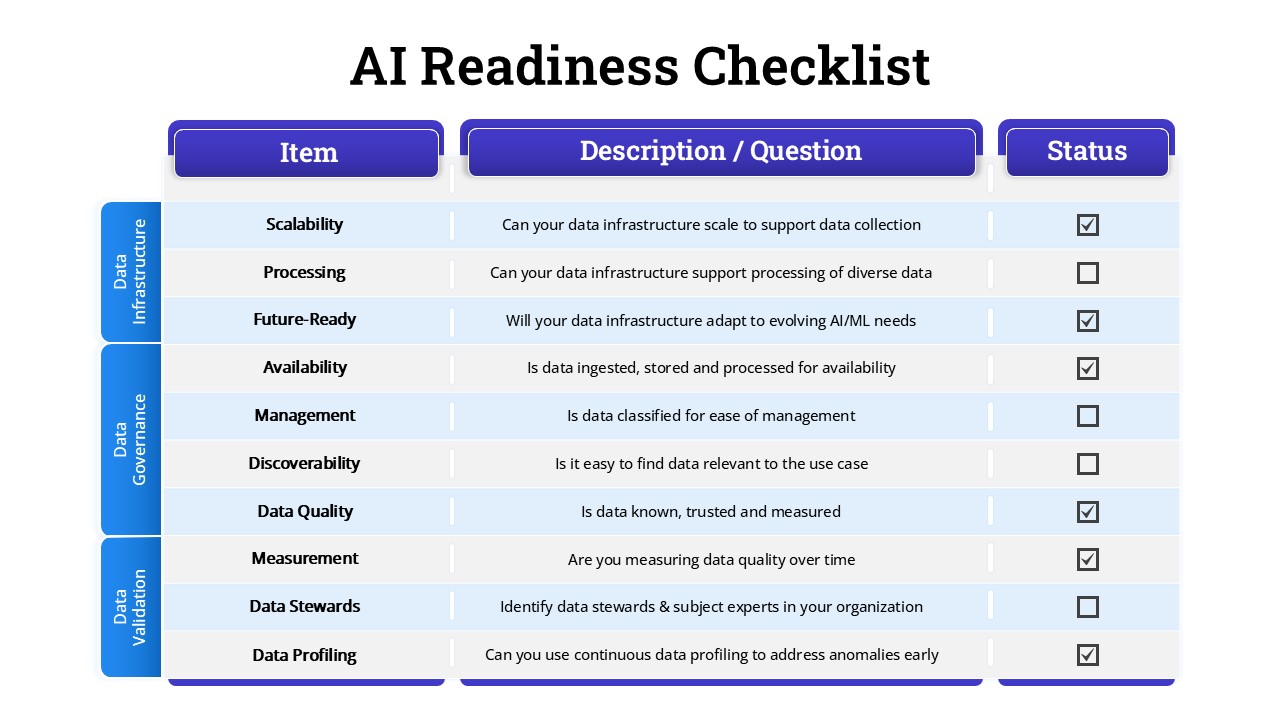
AI Readiness Checklist Table Slide Template for PowerPoint & Google Slides
Process
Business Data Table Template for PowerPoint & Google Slides
Table
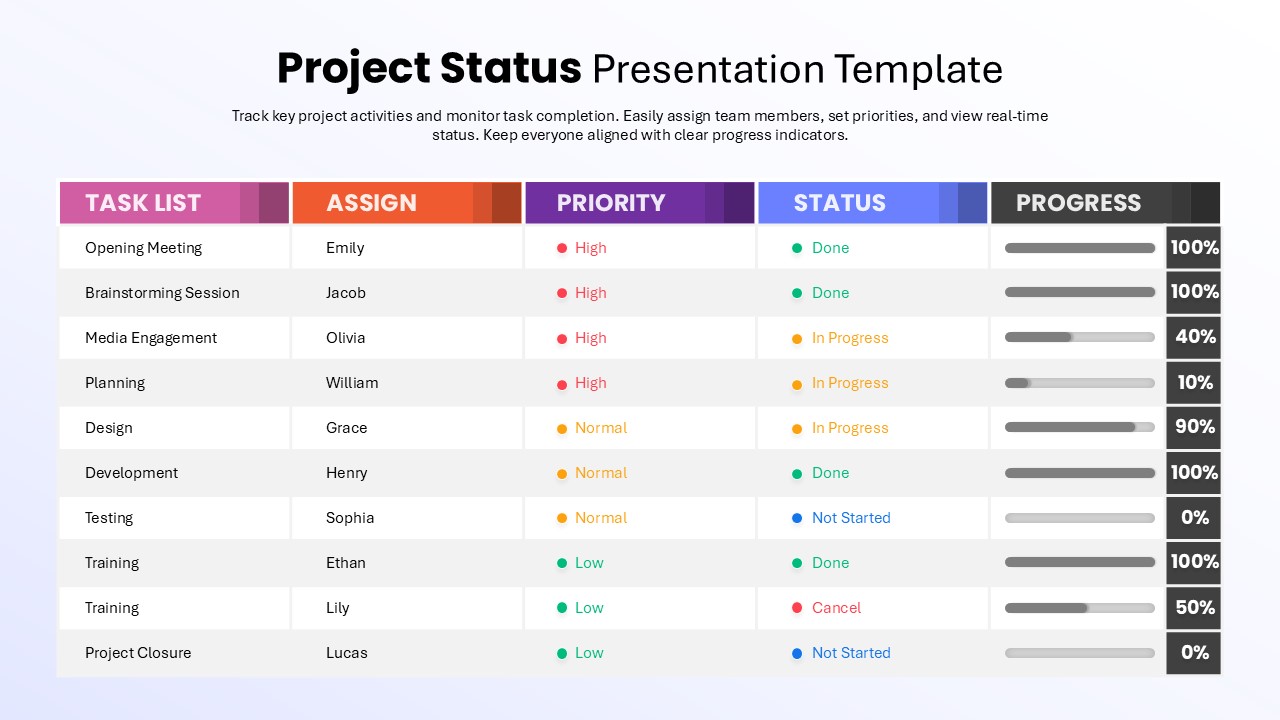
Dynamic Project Status Tracking Table Template for PowerPoint & Google Slides
Project Status
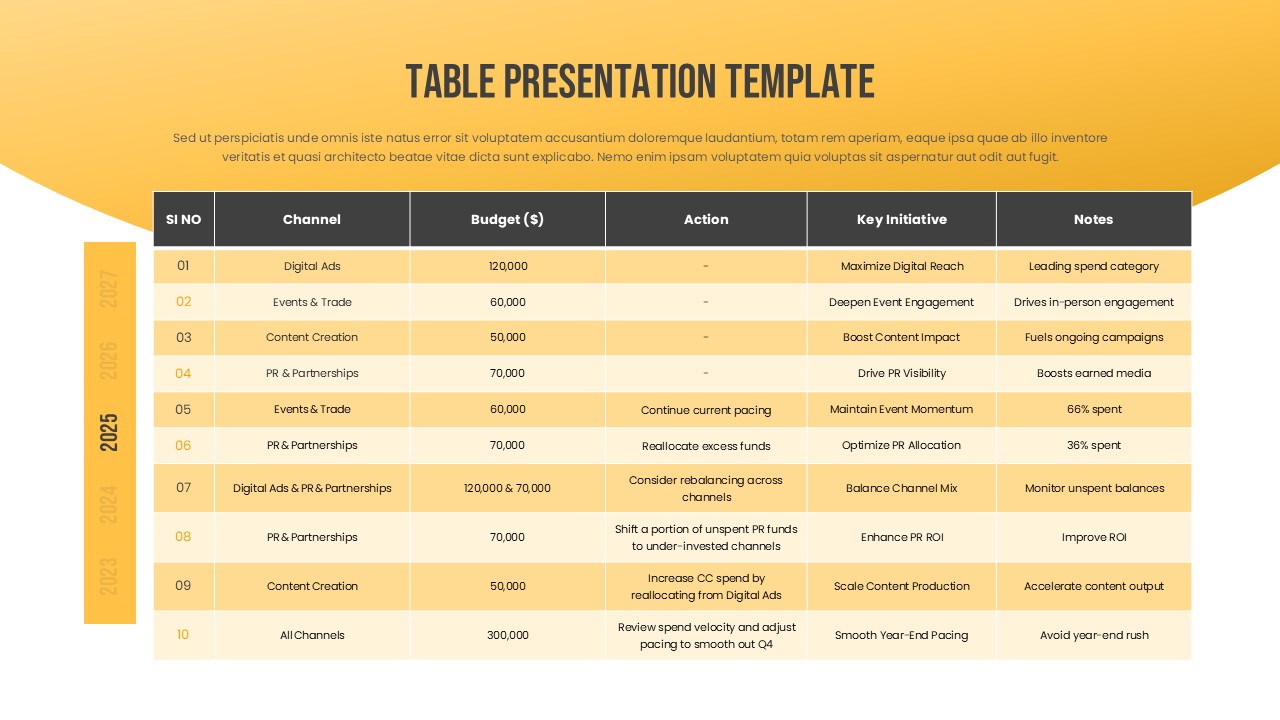
Multi-Column Table Presentation Template for PowerPoint & Google Slides
Table
Comparison Table Presentation Template for PowerPoint & Google Slides
Table
Marketing Budget Table Template for PowerPoint & Google Slides
Business
Project Status Update Dashboard Table Template for PowerPoint & Google Slides
Project Status
Six-Row Multi-Column Table Presentation Template for PowerPoint & Google Slides
Table
Colorful Comparison Table Presentation Template for PowerPoint & Google Slides
Table
Colorful Four-Column Table Layout Template for PowerPoint & Google Slides
Table
Colorful Business Data Comparison Table Template for PowerPoint & Google Slides
Table
Five Column Comparison Table Layout Template for PowerPoint & Google Slides
Comparison
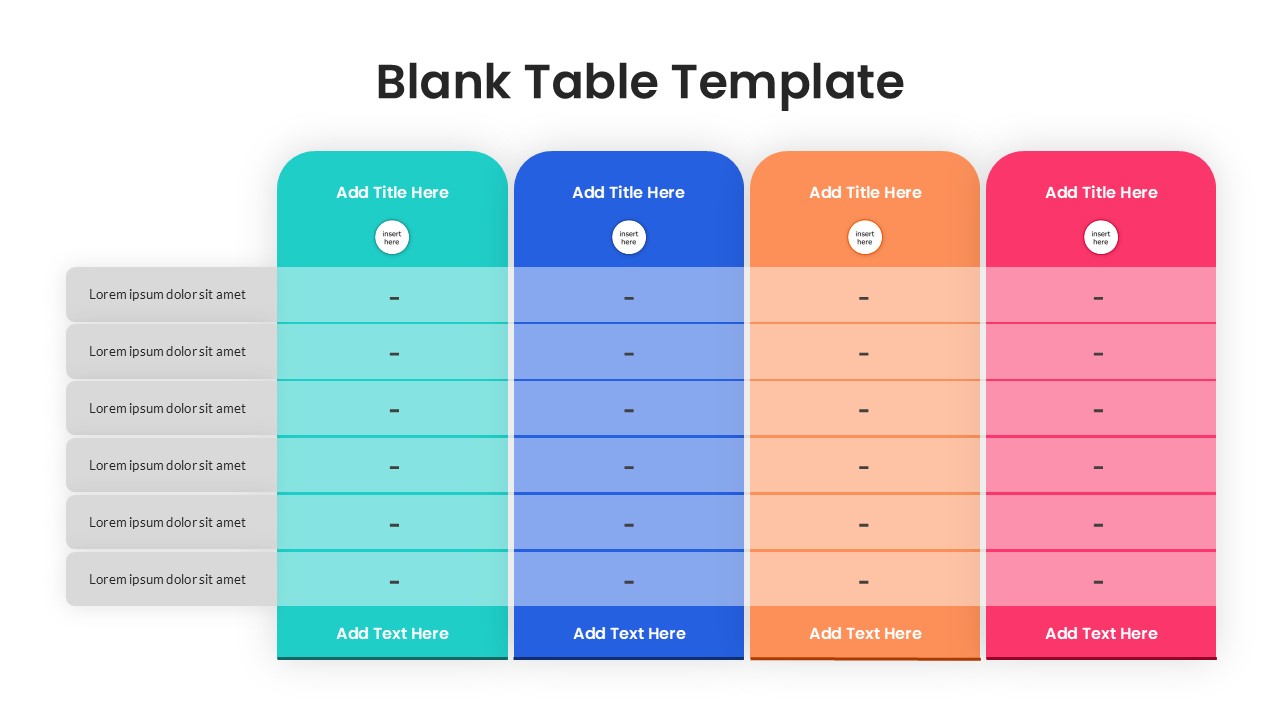
Blank Table Template for PowerPoint & Google Slides
Table
Two-Column Table Presentation Template for PowerPoint & Google Slides
Table
Six Column Data Table Template for PowerPoint & Google Slides
Table
Colorful Table Presentation Template for PowerPoint & Google Slides
Table
Pros and Cons Comparison Table Template for PowerPoint & Google Slides
Comparison Chart
Creative Table Template for PowerPoint & Google Slides
Table
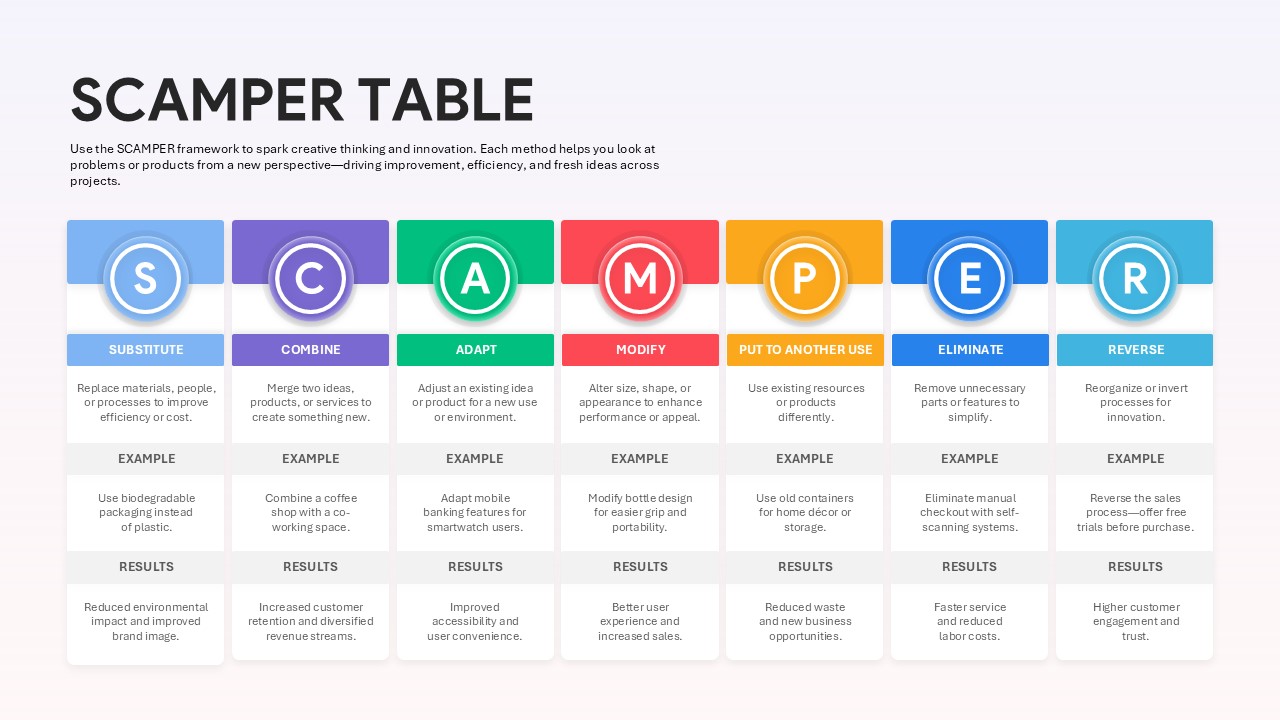
Scamper Table Template for PowerPoint & Google Slides
Table