Process Improvement Metaphor Diagram Template for PowerPoint & Google Slides
Description
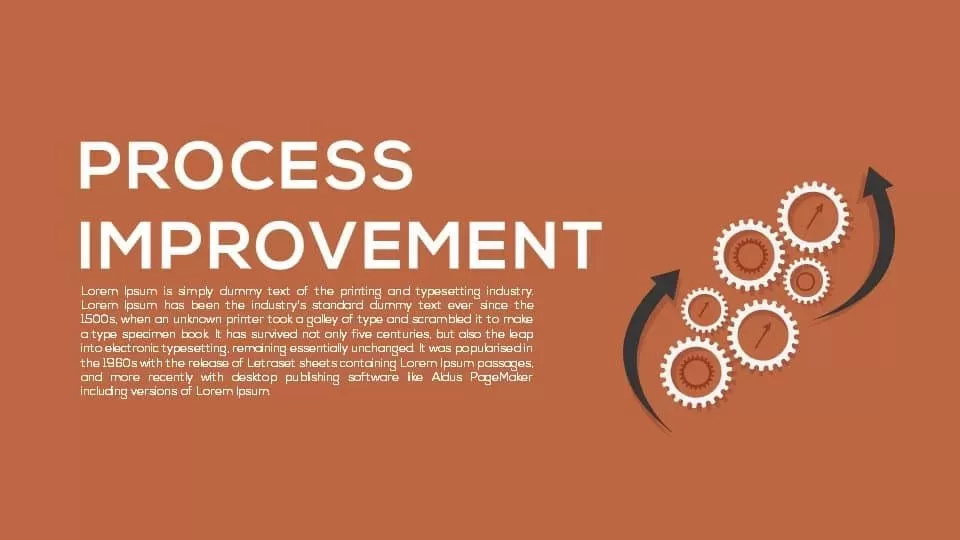
Leverage this dynamic improvement metaphor slide to depict incremental progress, performance gains, or KPI uplifts with professional polish. A series of ascending bars sits beneath a bold, 45° growth arrow, symbolizing upward momentum from baseline to peak performance. Each bar is color‐coded—from muted gray for starting metrics to vibrant green for target goals—and includes an embedded icon and editable text placeholder for contextual insights. Built entirely with crisp vector shapes on master slides, the design ensures seamless scalability, allowing you to adjust bar widths, swap arrow styles, or modify color gradients without loss of fidelity. Precision snap-to-grid alignment guides and optional drop shadows maintain visual balance and depth, enhancing readability even in data-rich presentations.
Engineered for rapid customization, the template features intuitive placeholders for headlines and descriptions, as well as an embedded library of over 50 vector icons to illustrate each stage meaningfully. You can easily apply corporate brand palettes or gradient fills via the master layout, ensuring consistent styling across your deck. The modular bar framework supports expansion or contraction beyond the default five stages—simply duplicate or remove bars to match your process or reporting requirements.
Optimized for both PowerPoint and Google Slides, this slide preserves high-definition clarity across devices and supports collaborative cloud-based editing. Whether you’re mapping quarterly revenue growth, illustrating process optimizations, or showcasing learning-curve advancements, this Improvement Growth Arrow Metaphor slide transforms complex data into a clear, engaging narrative that drives stakeholder alignment.
The slide also includes optional data callouts and percentage markers to highlight KPIs alongside each bar, supporting data-driven dialogues during board reviews or executive updates. Its adaptable layout can also serve as a performance dashboard, change management tracker, or training progress monitor, making it a versatile asset across functions.
Who is it for
Business analysts, project managers, marketing strategists, operations leads, and data teams will benefit from this slide when presenting performance improvements, process metrics, or strategic roadmaps.
Other Uses
Beyond KPI reporting, repurpose this slide for sales pipeline illustrations, risk mitigation plans, compliance checklists, year-over-year comparisons, or training progress trackers to engage audiences and clarify upward trends.
Login to download this file

Item ID
SB00544
Related Templates

Improvement Growth Arrow Metaphor Template for PowerPoint & Google Slides
Bar/Column

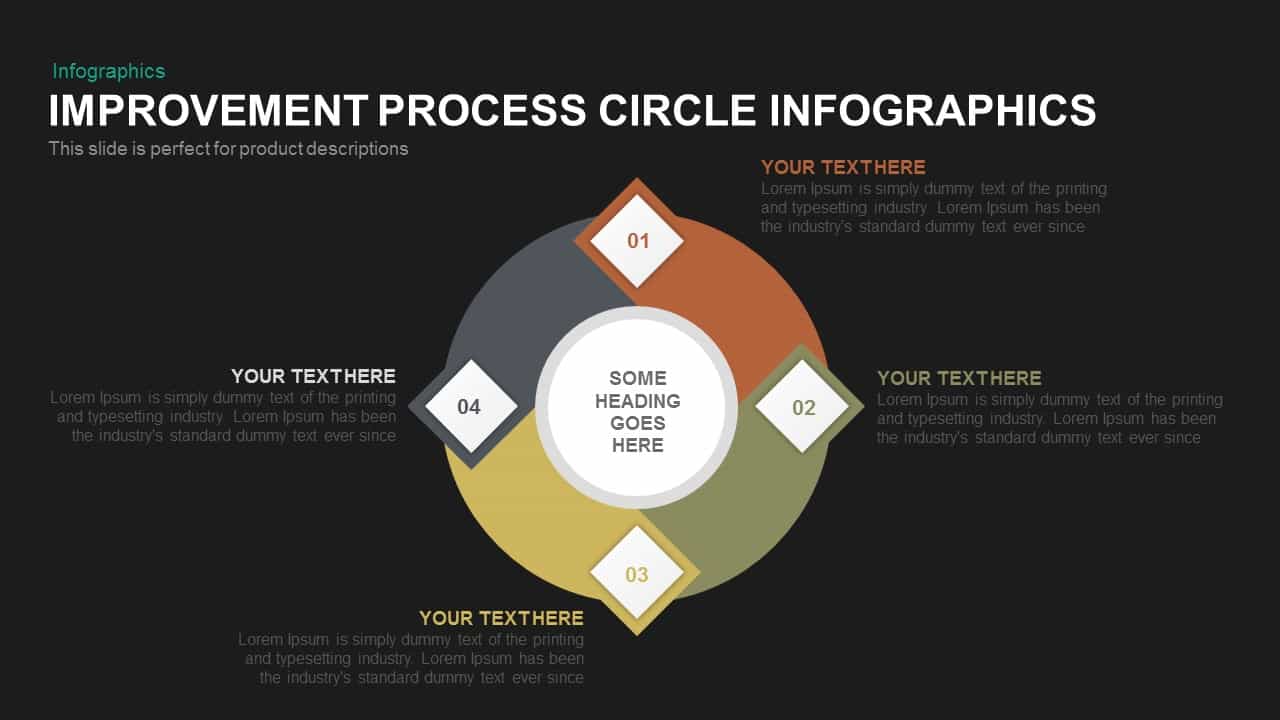
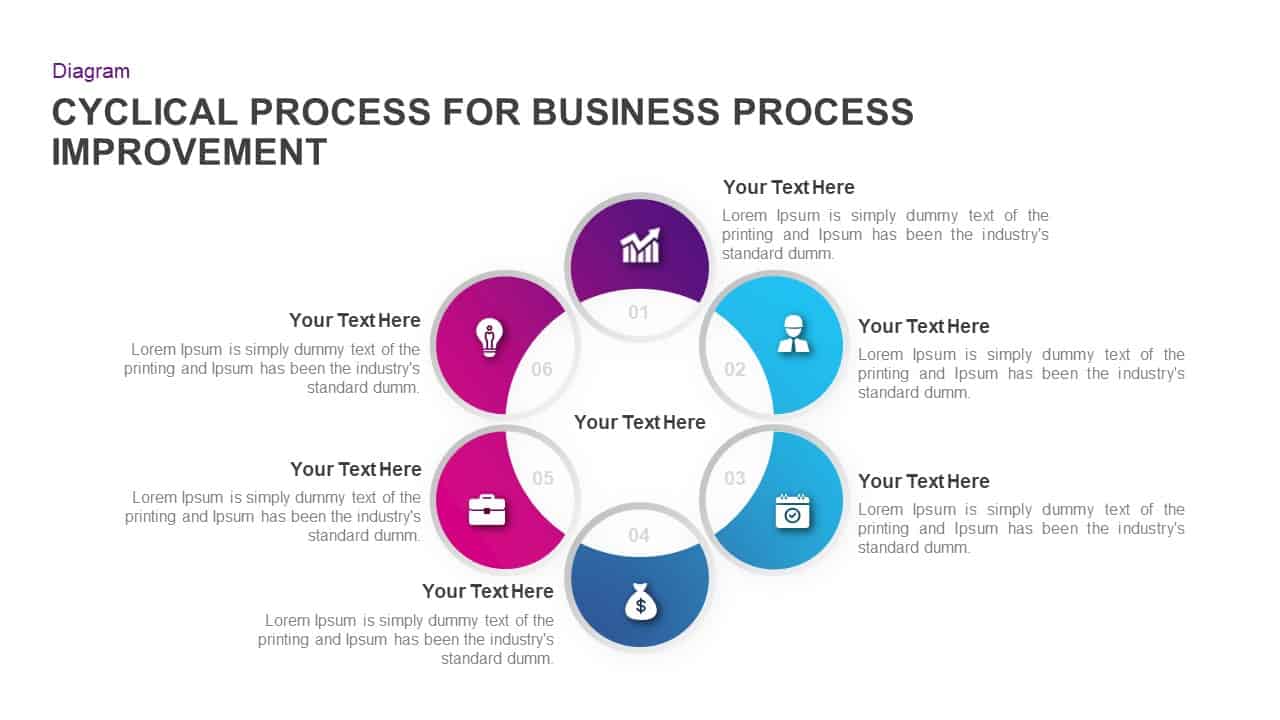
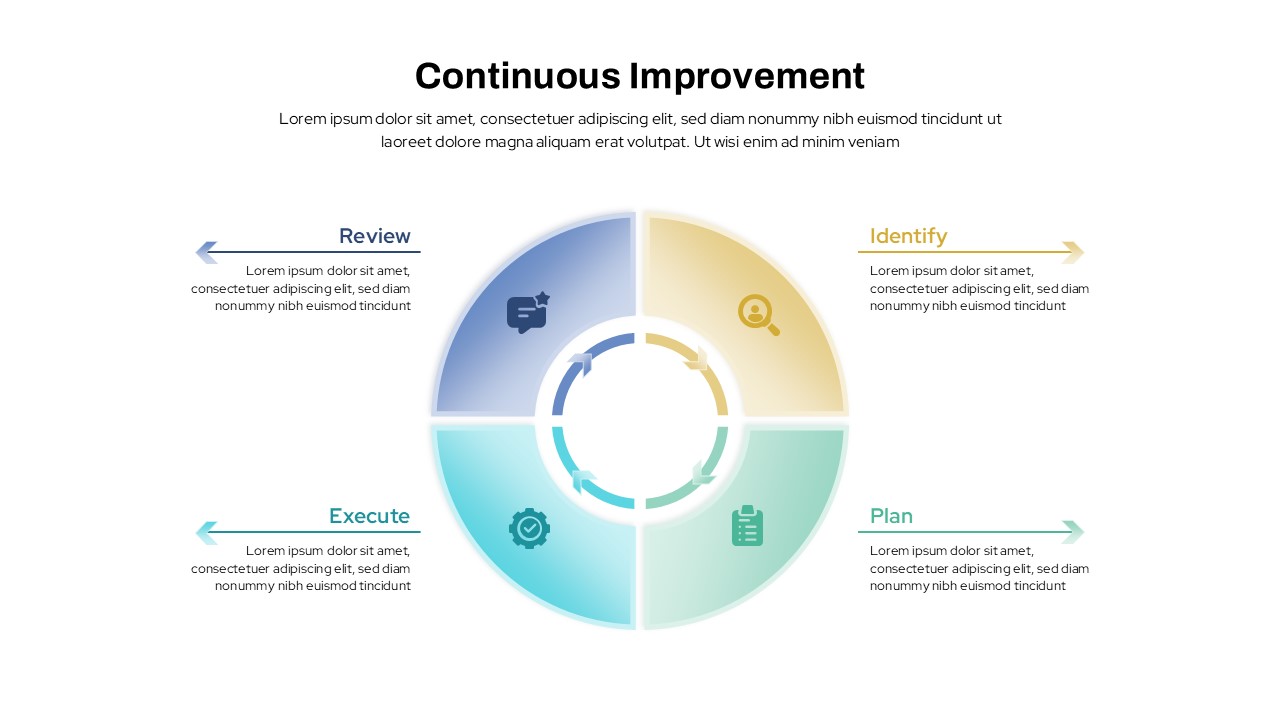
Circular Improvement Process Diagram Template for PowerPoint & Google Slides
Process
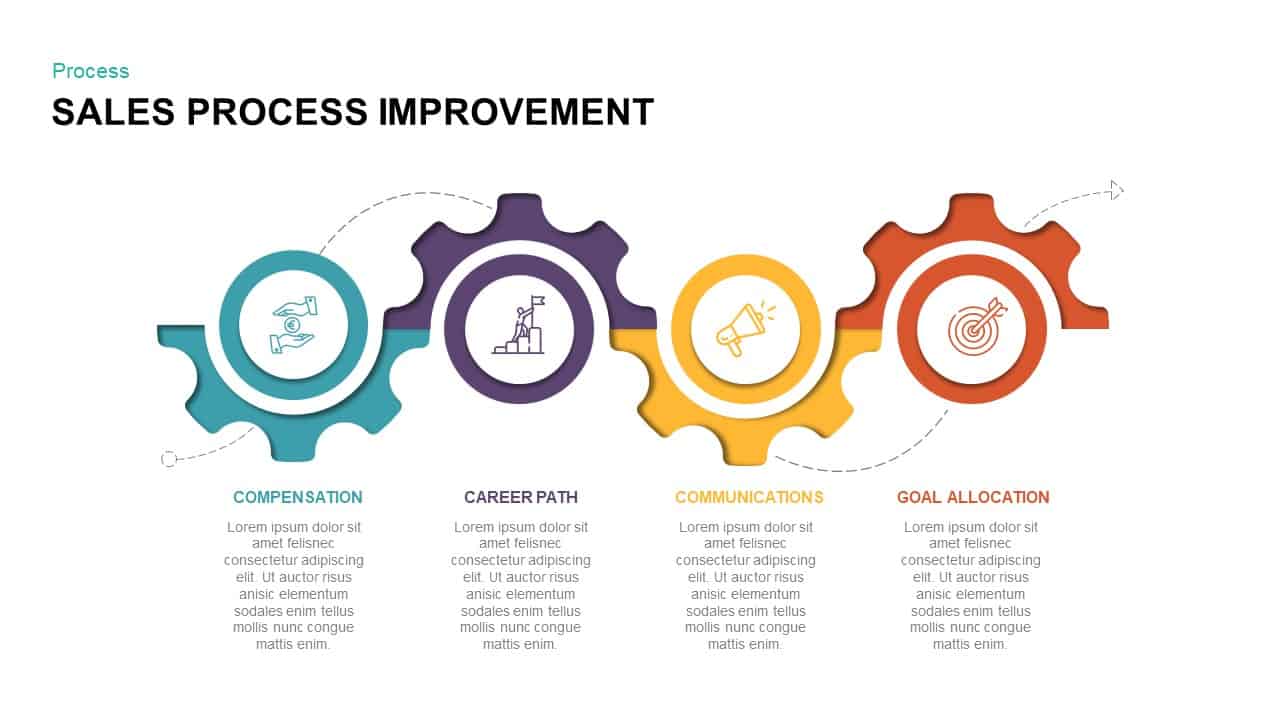
Sales Process Improvement Gear Diagram Template for PowerPoint & Google Slides
Process
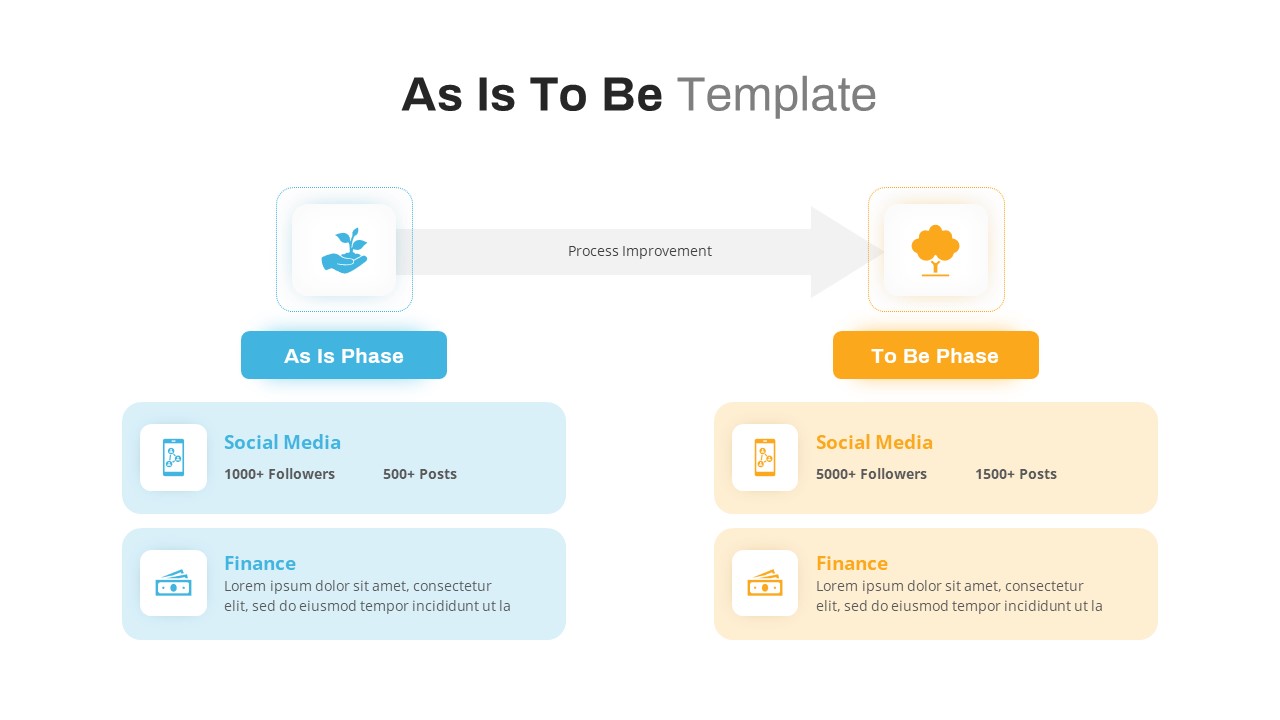
As Is to Be Process Improvement Diagram Template for PowerPoint & Google Slides
Business Strategy
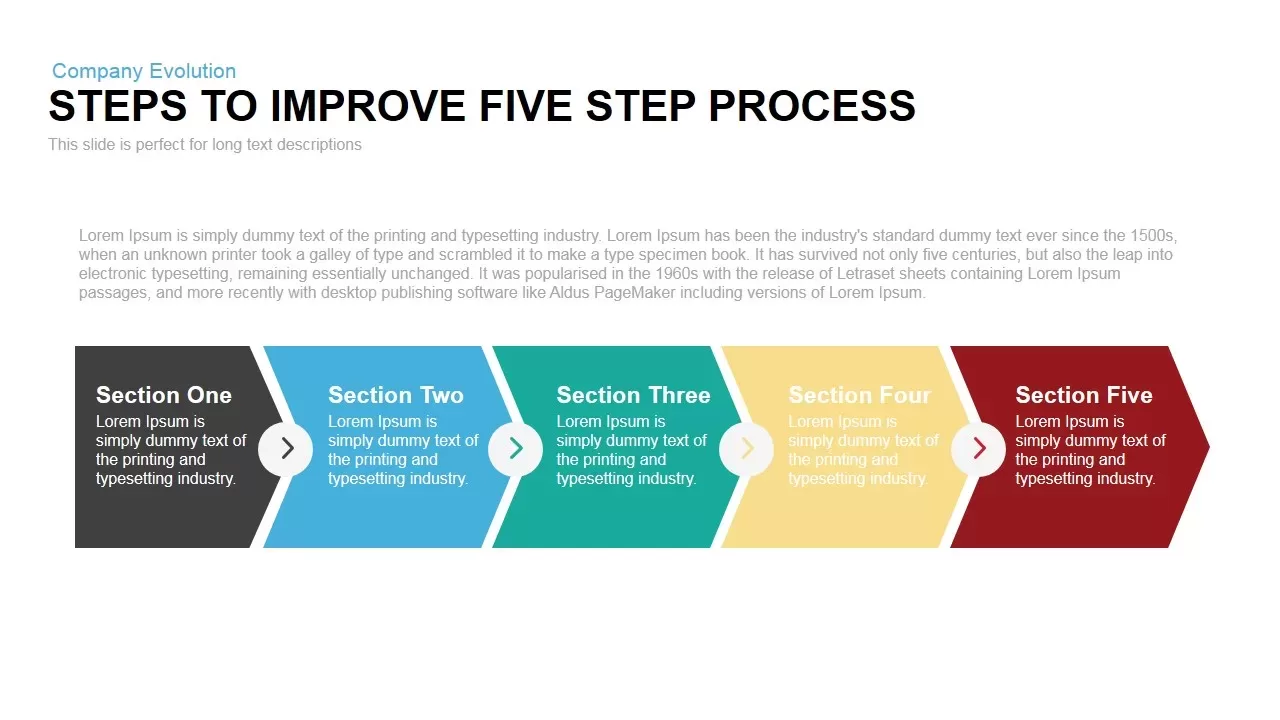
Five-Step Process Improvement Template for PowerPoint & Google Slides
Process

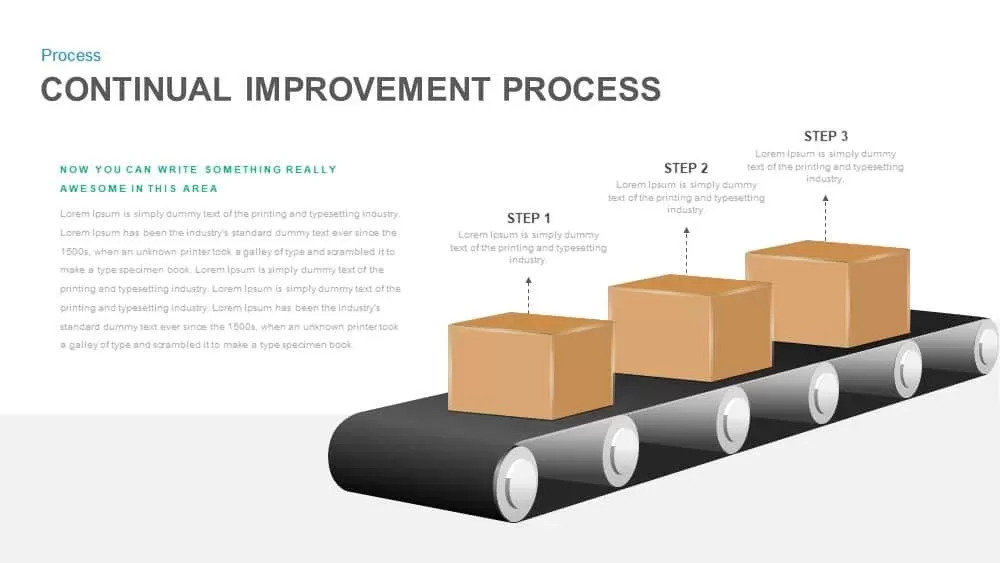
Continual Improvement Process Conveyor Template for PowerPoint & Google Slides
Process
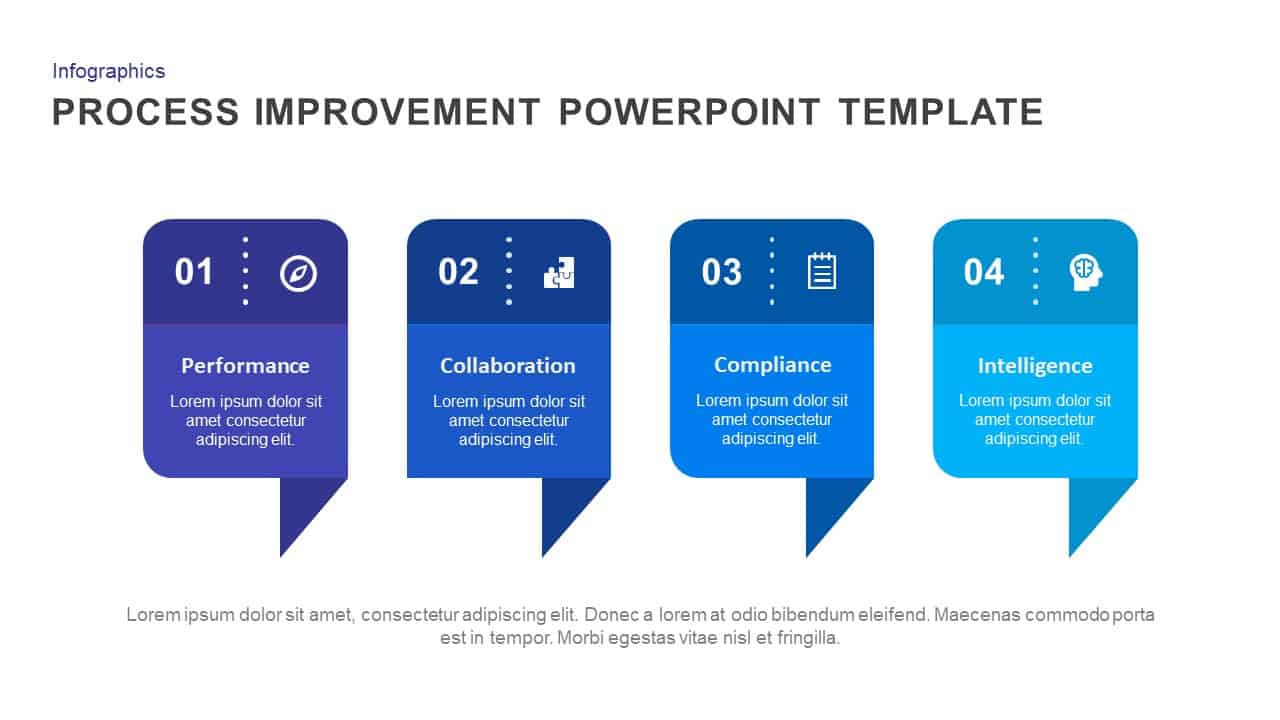
Process Improvement template for PowerPoint & Google Slides
Process
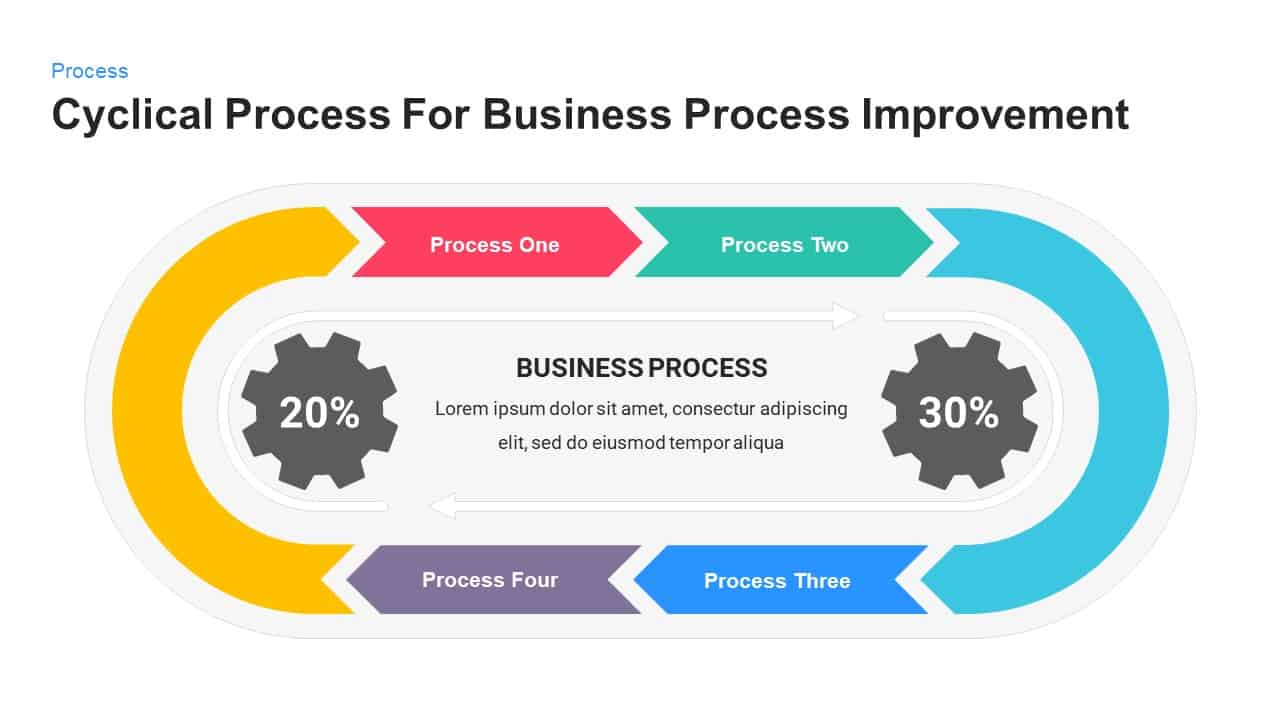
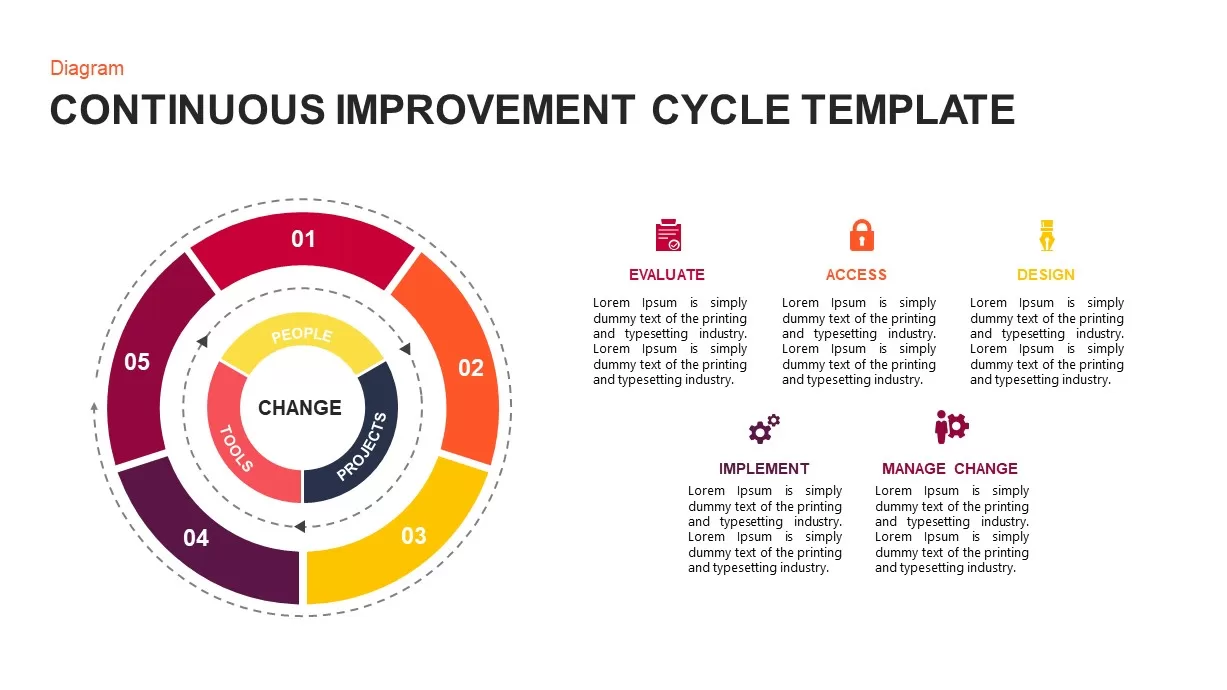
Business Process Improvement Cycle Template for PowerPoint & Google Slides
Process
Business Process Improvement Cycle Template for PowerPoint & Google Slides
Circular

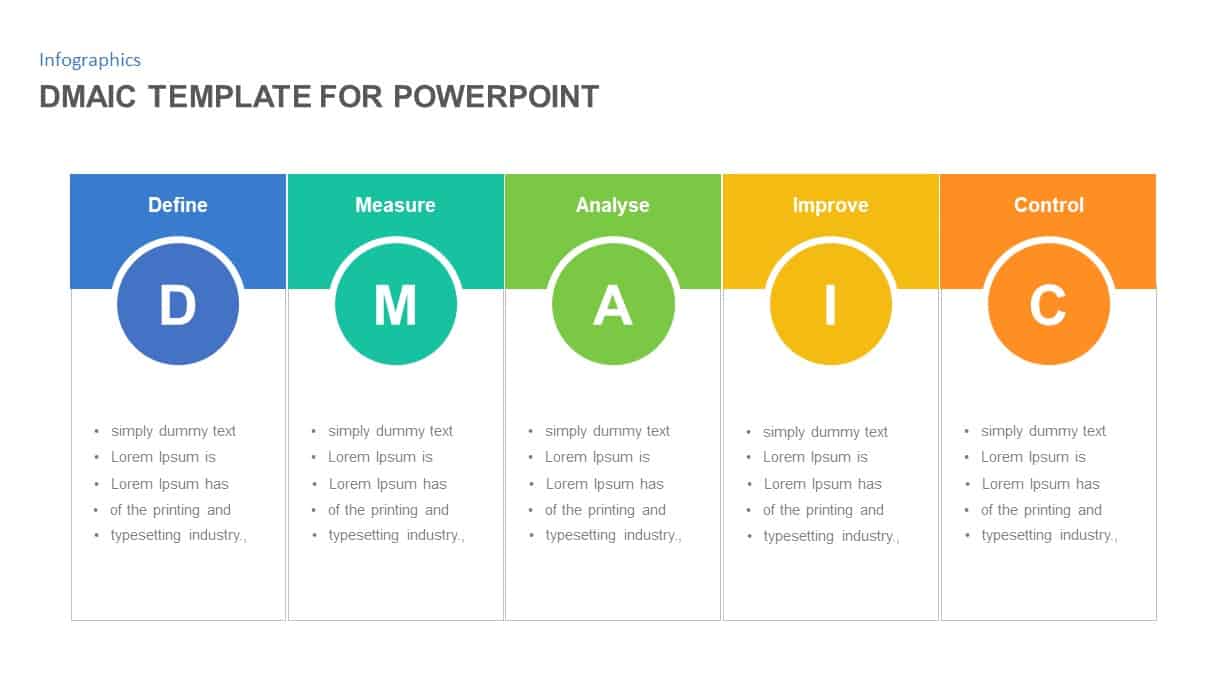
DMAIC Process Improvement Infographic Template for PowerPoint & Google Slides
Process
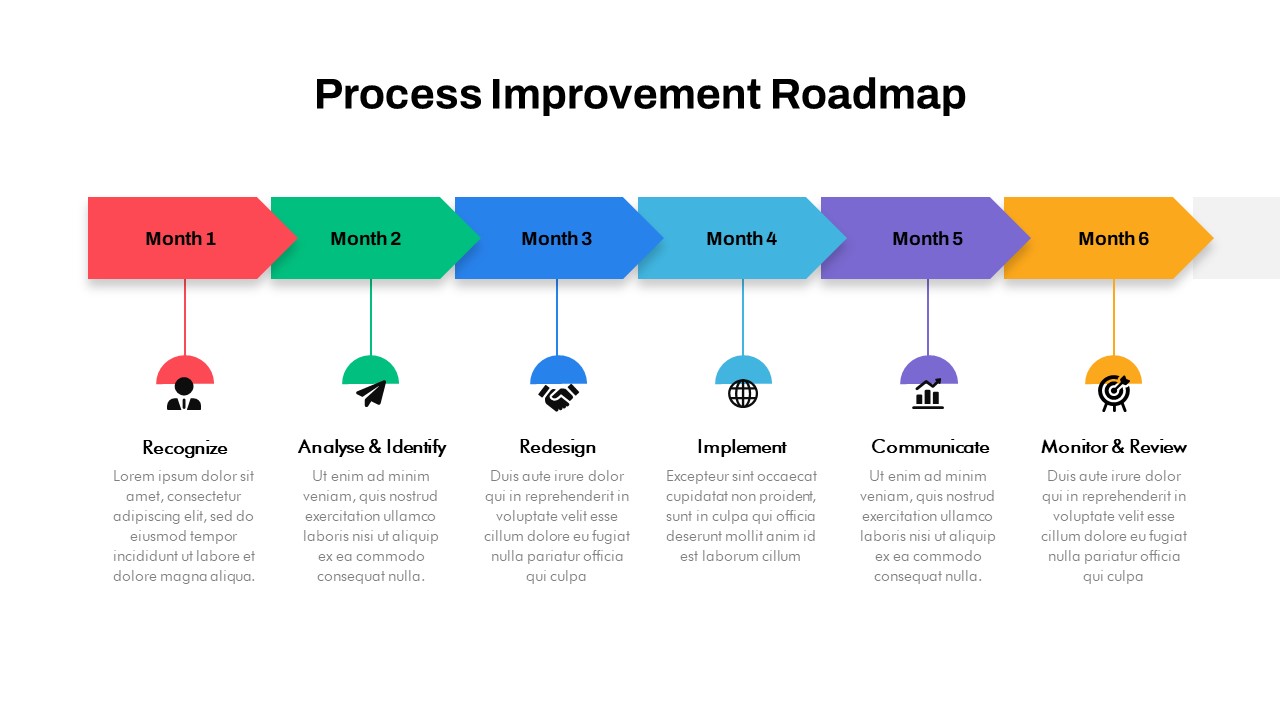
Process improvement roadmap template for PowerPoint & Google Slides
Process
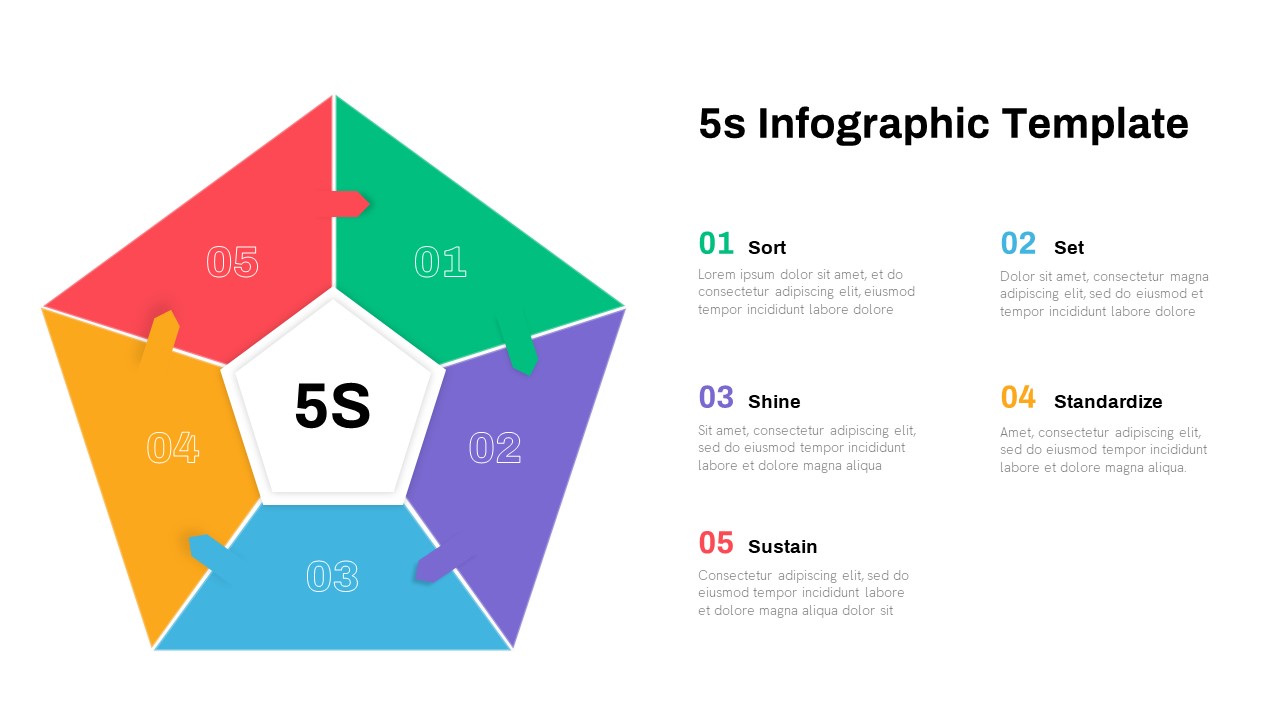
5S Lean Process Improvement Infographic Template for PowerPoint & Google Slides
Business Strategy
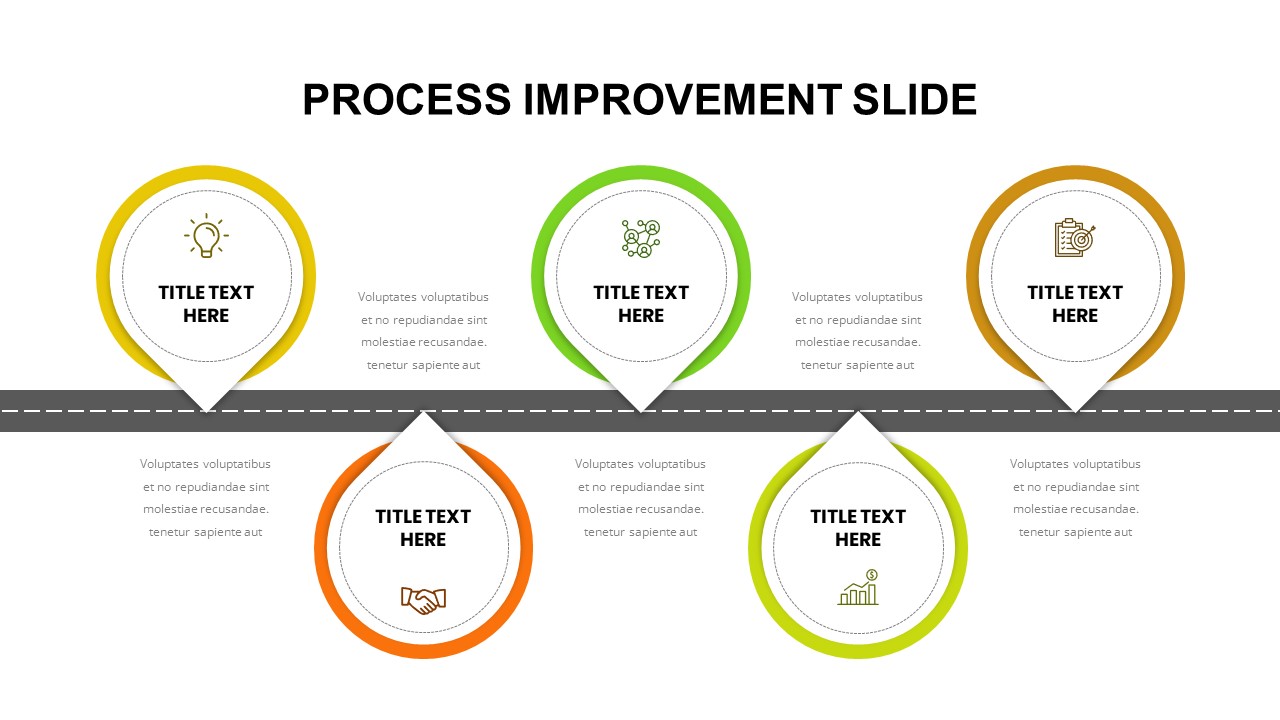
Process Improvement Roadmap Template for PowerPoint & Google Slides
Infographics
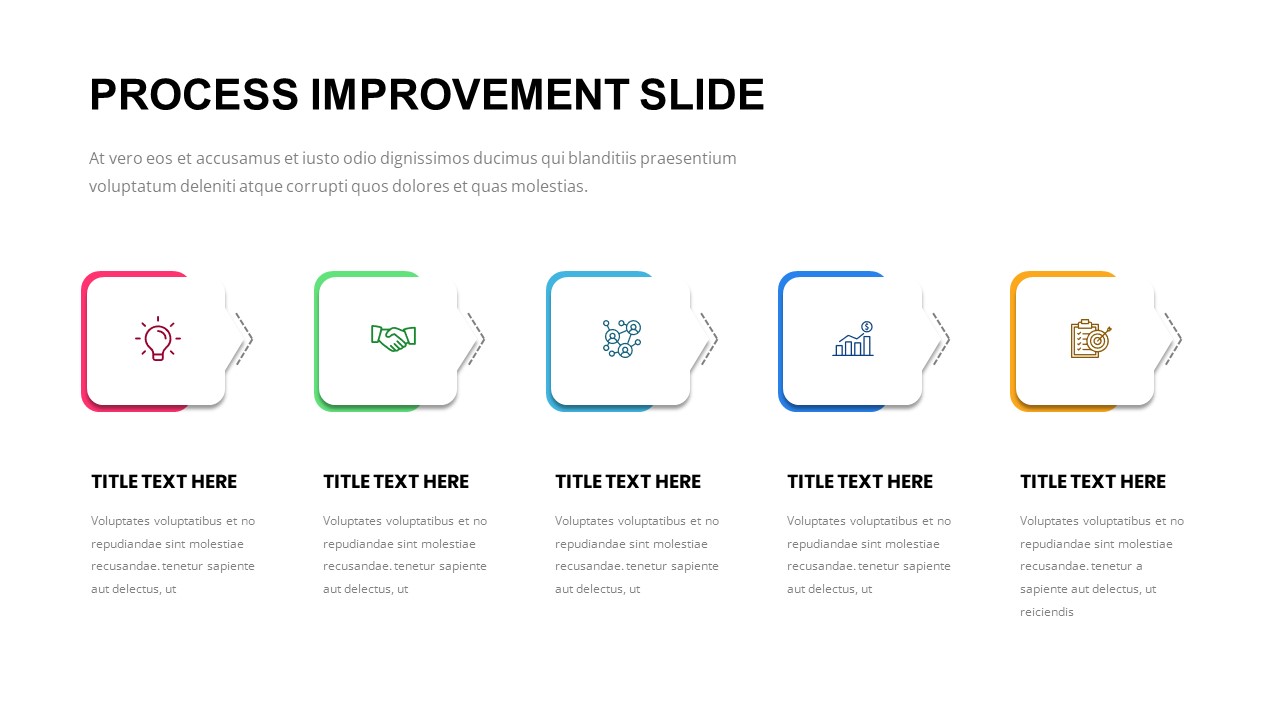
Process Improvement Slide for PowerPoint & Google Slides
Business Proposal
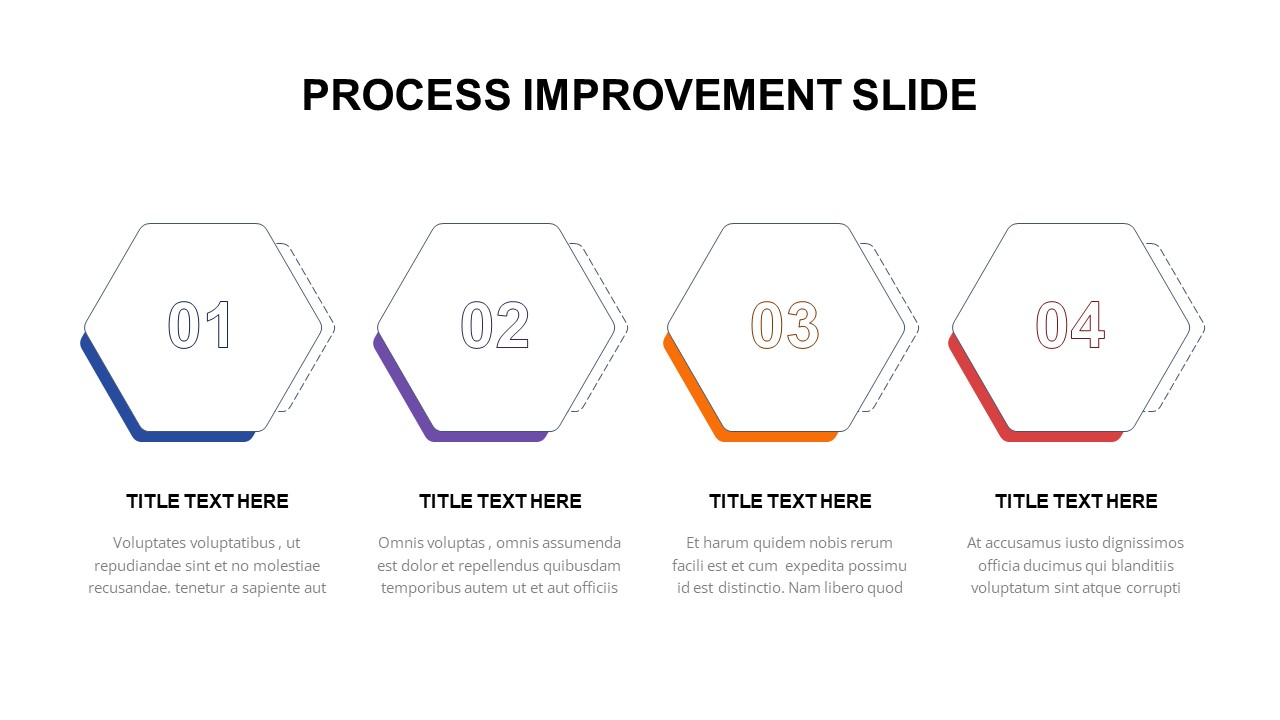
4 Step Process Improvement for PowerPoint & Google Slides
Process
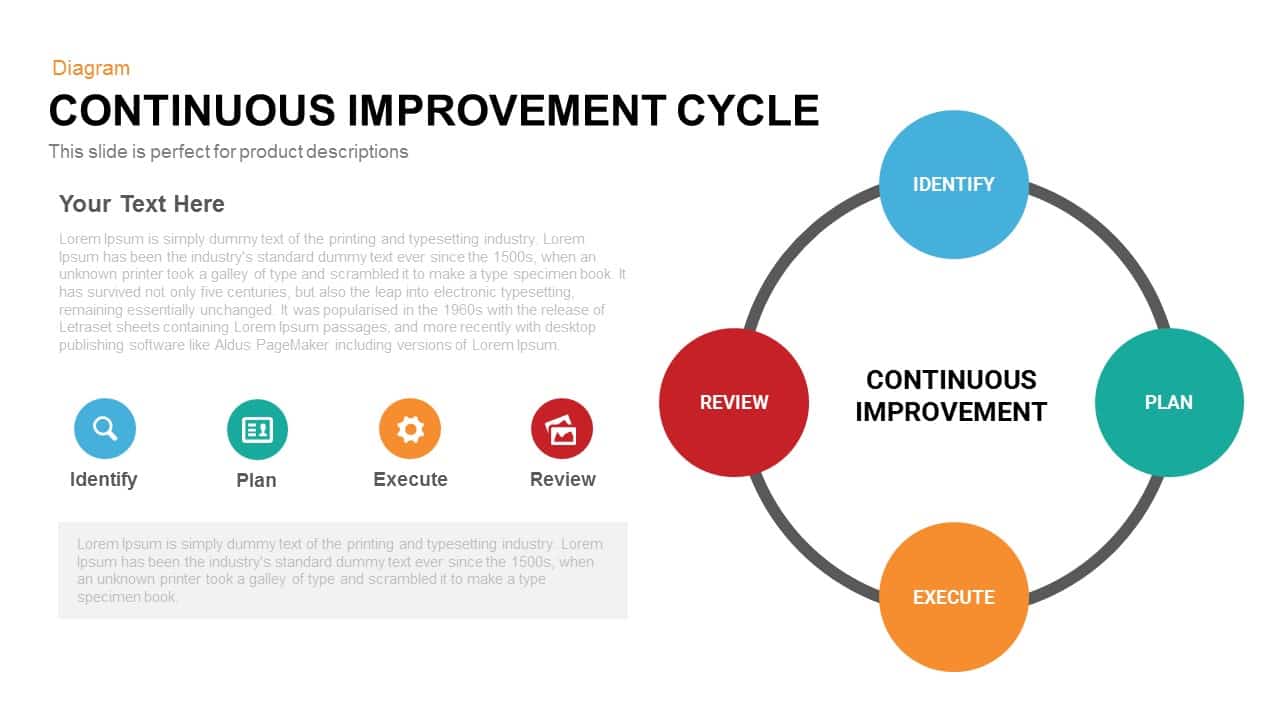
Continuous Improvement Cycle Diagram Template for PowerPoint & Google Slides
Circular
Continuous Improvement Cycle Diagram Template for PowerPoint & Google Slides
Process
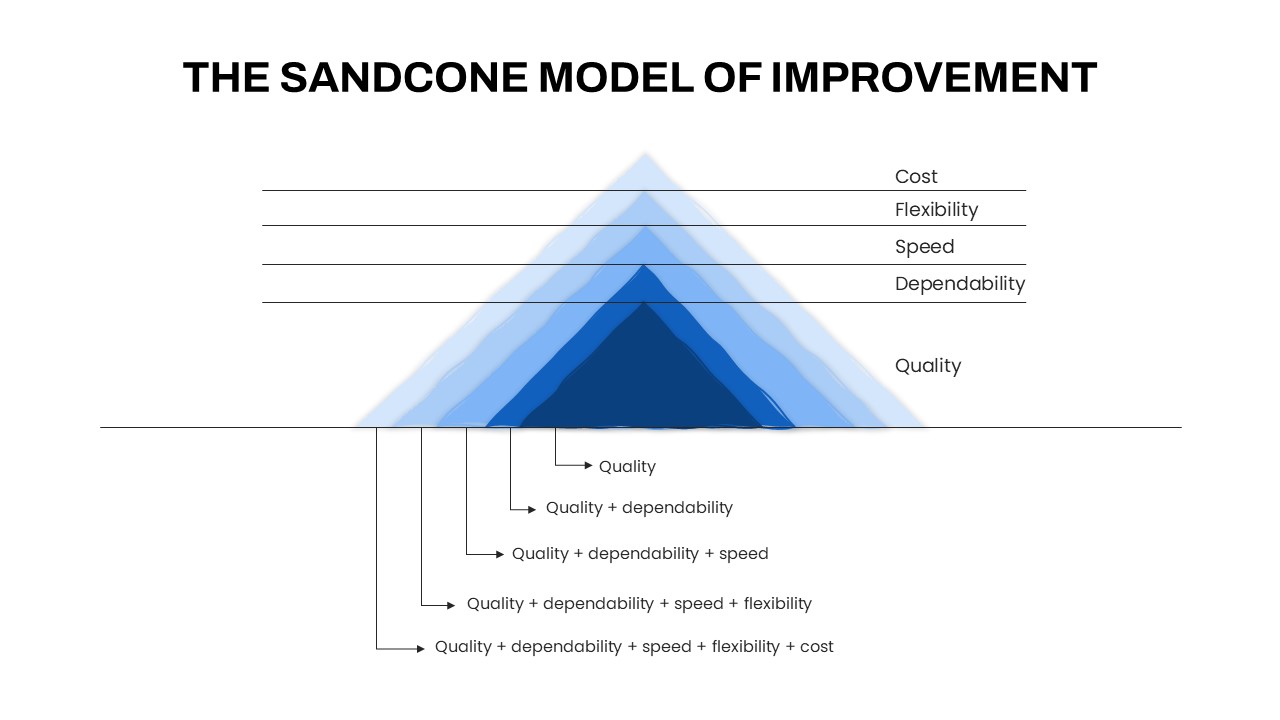
Sandcone Model of Improvement Diagram Template for PowerPoint & Google Slides
Pyramid
Continuous Improvement Cycle Diagram Template for PowerPoint & Google Slides
Process
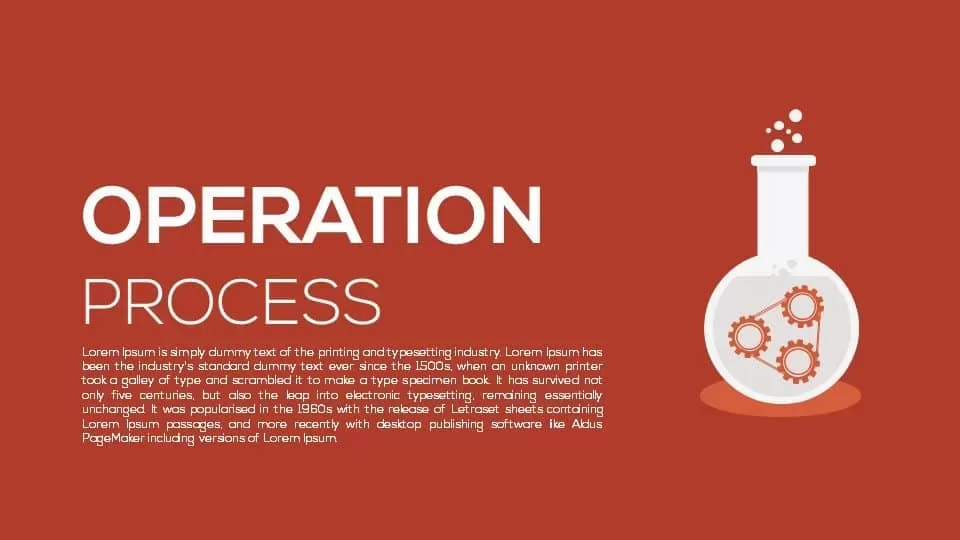
Operation Process Metaphor Diagram Template for PowerPoint & Google Slides
Process
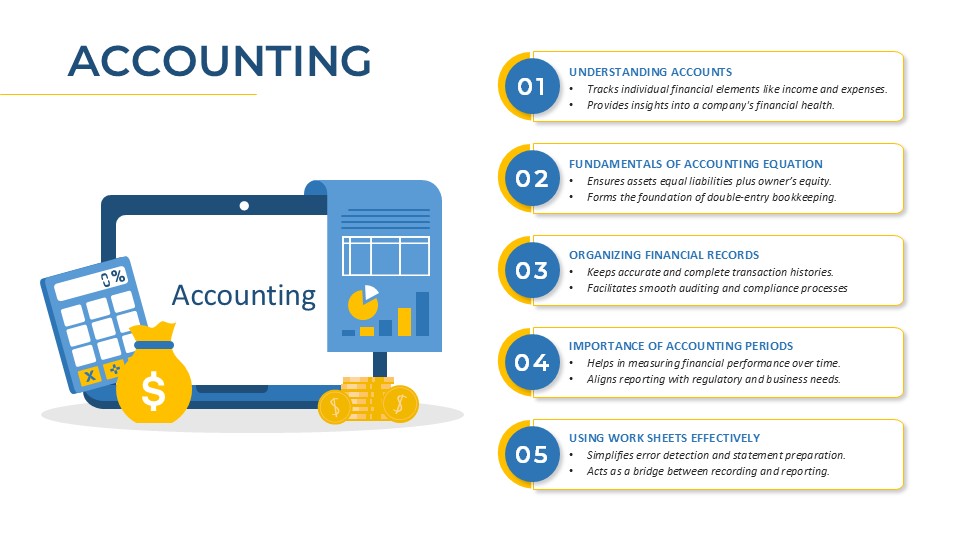
Accounting Process Metaphor Diagram Template for PowerPoint & Google Slides
Accounting
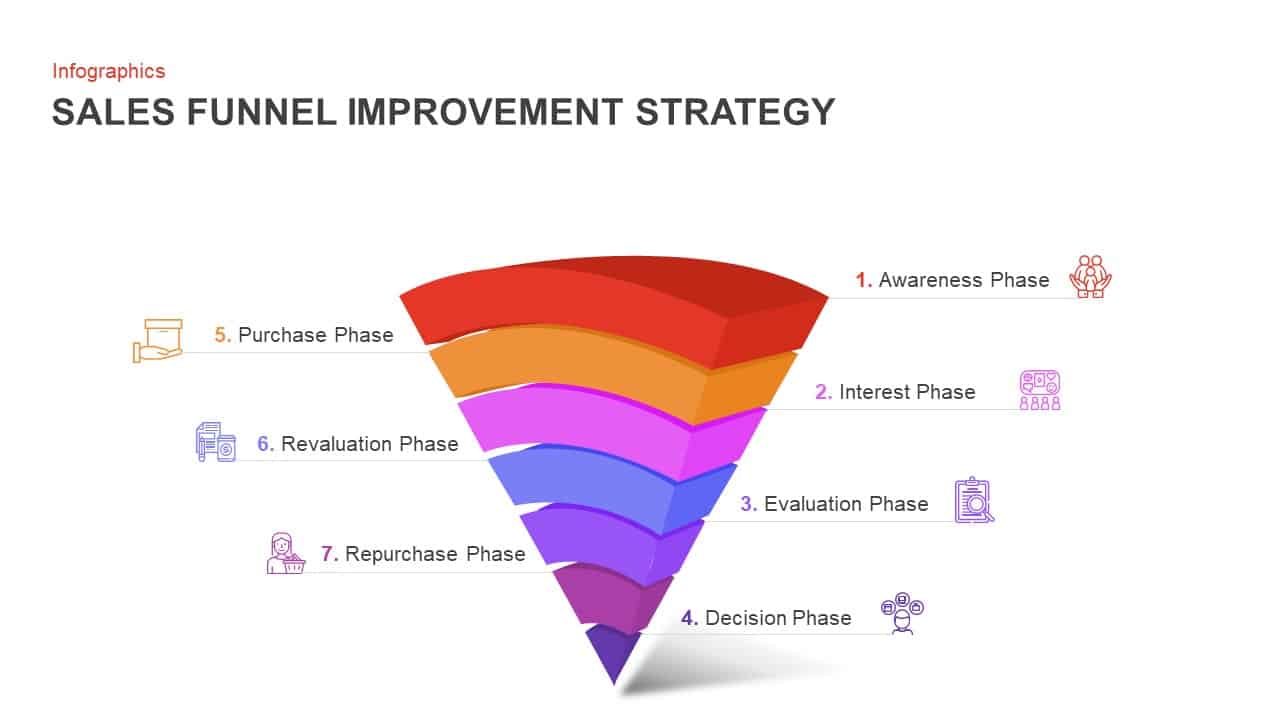
7-Step Sales Funnel Improvement Strategy Template for PowerPoint & Google Slides
Infographics
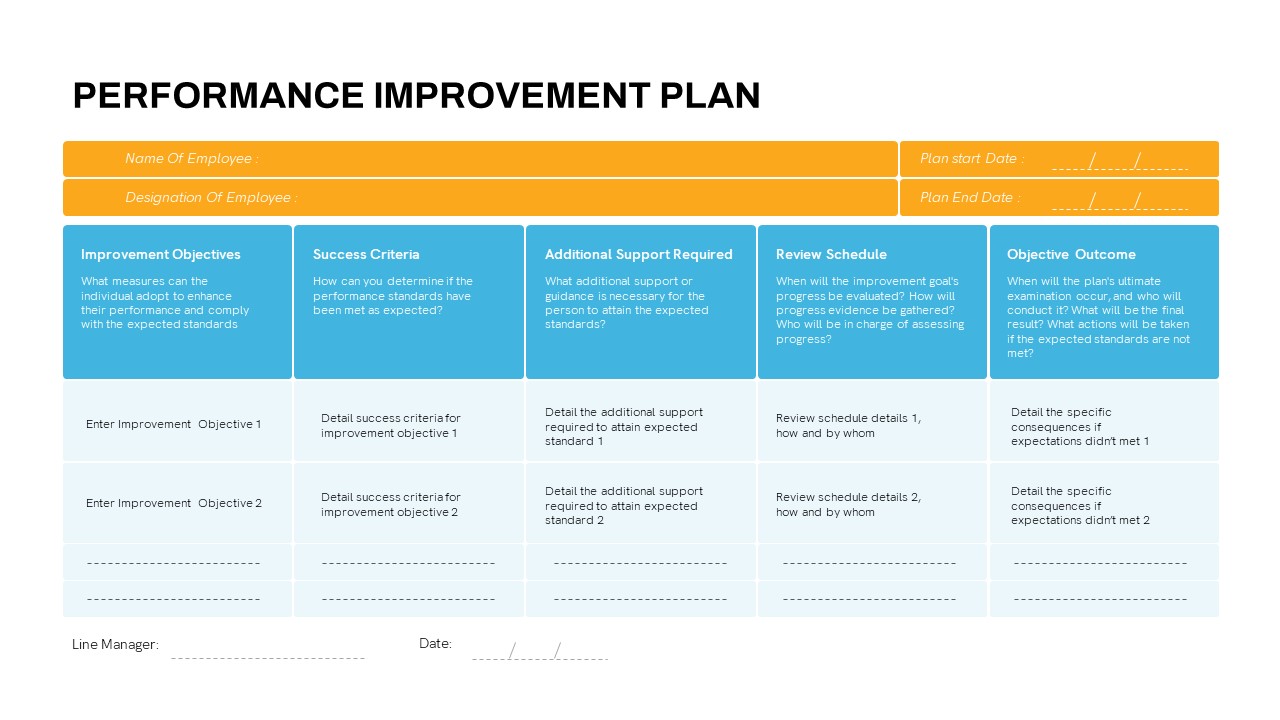
Detailed Performance Improvement Plan Template for PowerPoint & Google Slides
Employee Performance
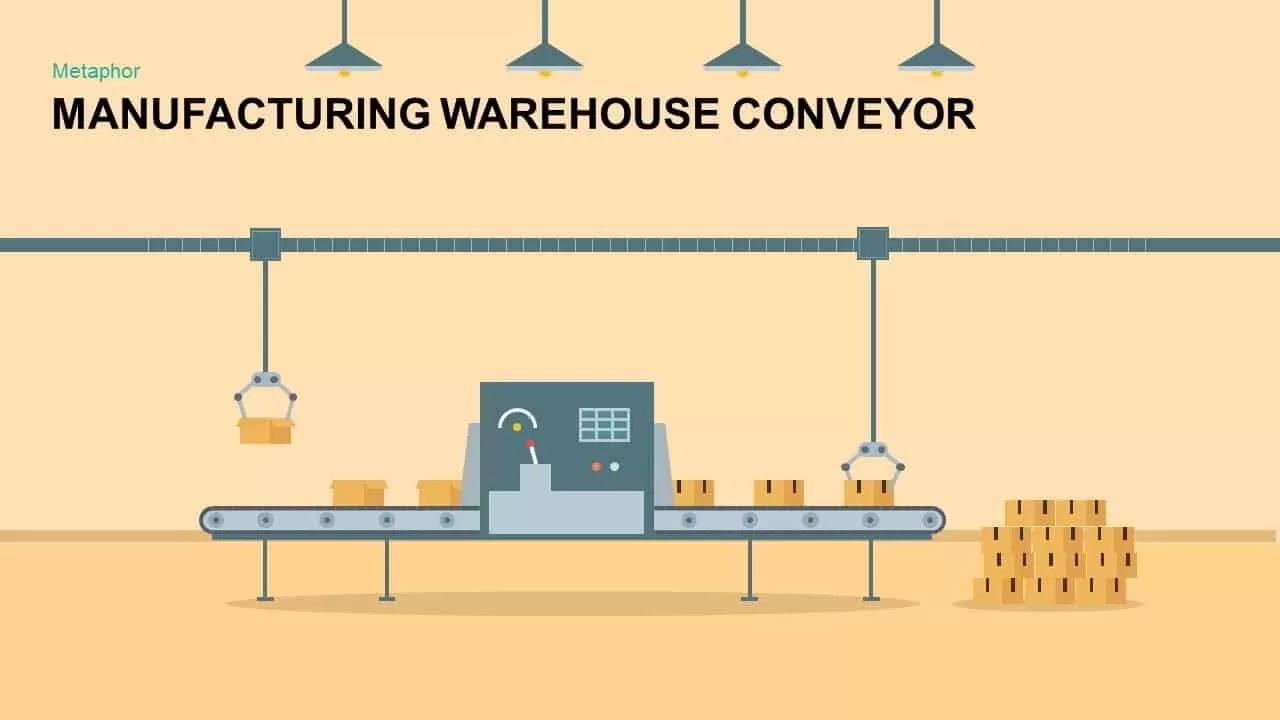
Warehouse Conveyor Process Metaphor Template for PowerPoint & Google Slides
Process

Strength Metaphor Dumbbell Diagram Template for PowerPoint & Google Slides
Accomplishment
Professional Security Metaphor Diagram Template for PowerPoint & Google Slides
Information Technology
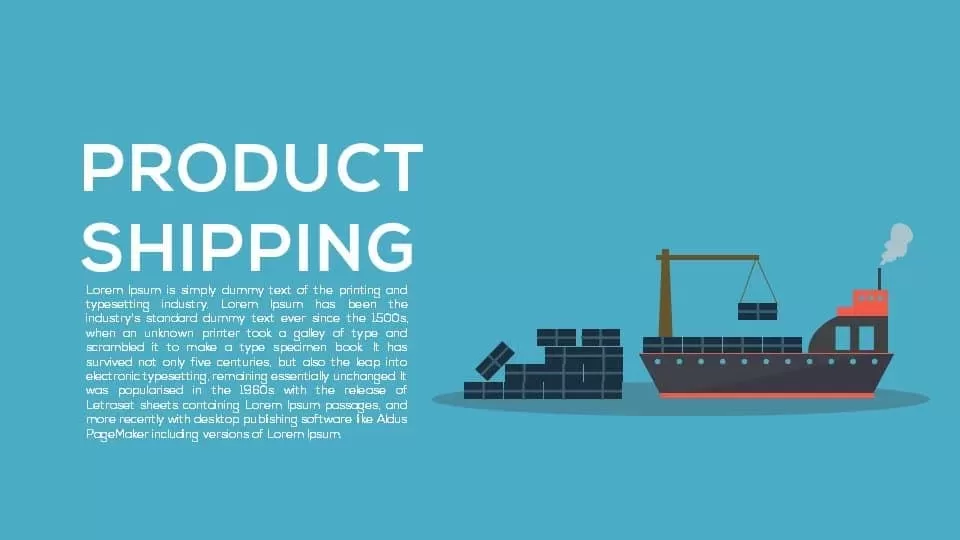
Product Shipping Metaphor Diagram Template for PowerPoint & Google Slides
Process
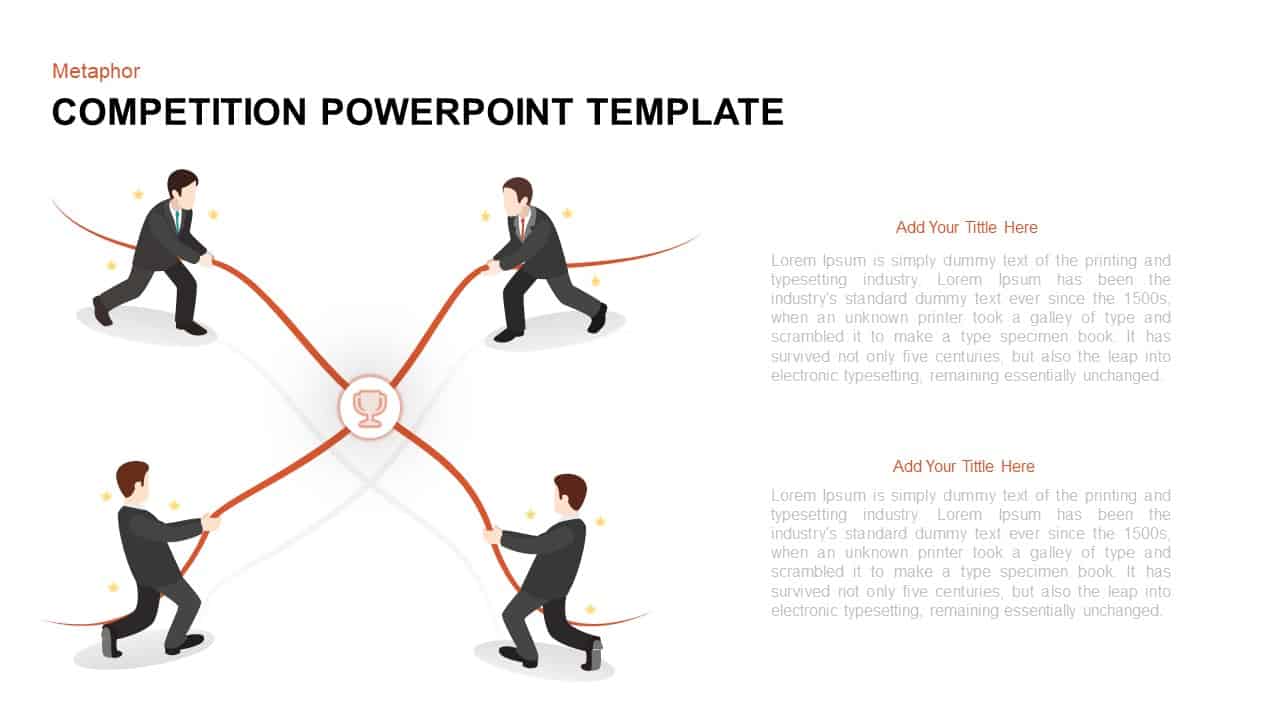
Competition Metaphor Podium Diagram Template for PowerPoint & Google Slides
Business
Cyber Security Metaphor Diagram Template for PowerPoint & Google Slides
Risk Management
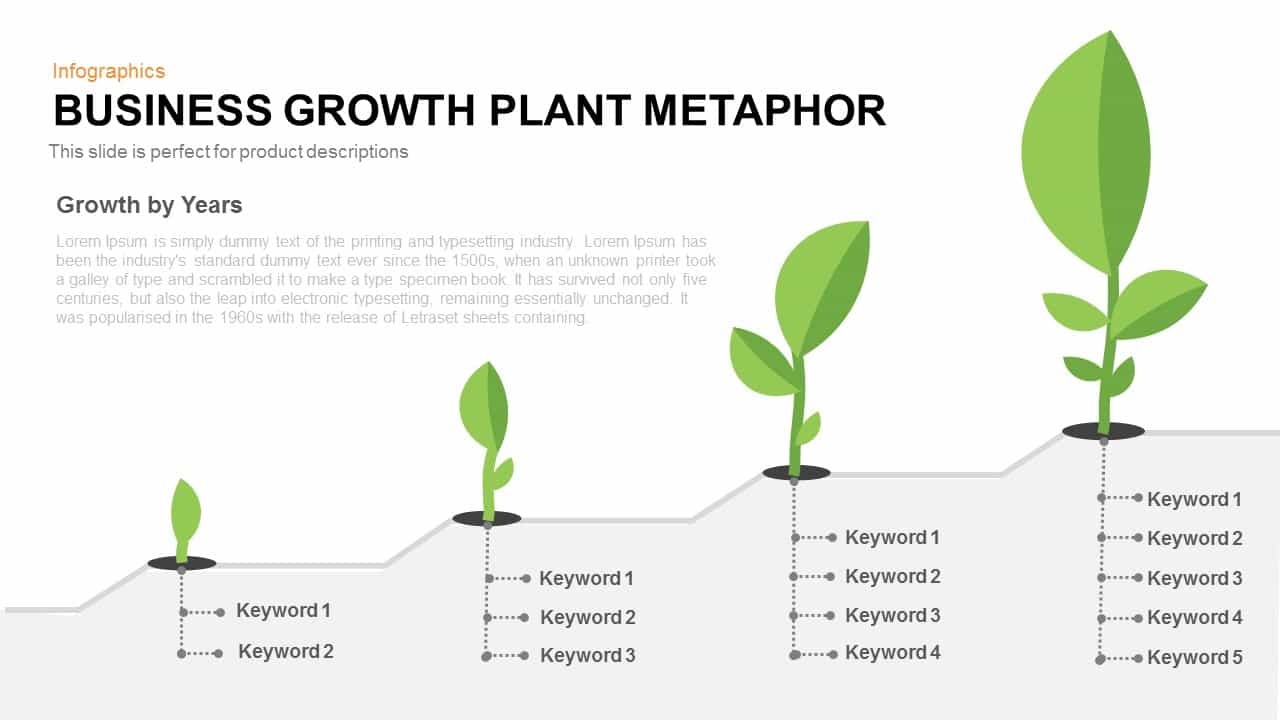
Business Growth Plant Metaphor Timeline Template for PowerPoint & Google Slides
Business Strategy
Discover Metaphor Concept Slide Template for PowerPoint & Google Slides
Infographics
Teamwork Puzzle Metaphor Slide Template for PowerPoint & Google Slides
Our Team
Read Metaphor Concept Illustration Slide Template for PowerPoint & Google Slides
Infographics
Metaphor Light Bulb Idea Concept Template for PowerPoint & Google Slides
Infographics
Leadership Metaphor Presentation Slide Template for PowerPoint & Google Slides
Leadership
Megaphone Communication Metaphor Template for PowerPoint & Google Slides
Advertising
Metaphor Multitasking Illustration Template for PowerPoint & Google Slides
Business
Metaphor Knowledge Illustration Slide Template for PowerPoint & Google Slides
Infographics
Rebuild Brick Wall Metaphor Slide Template for PowerPoint & Google Slides
Infographics
Efficiency KPI Dashboard Metaphor Template for PowerPoint & Google Slides
Infographics
Destination Roadmap Pin Metaphor Template for PowerPoint & Google Slides
Roadmap
Metaphor Speed Template for PowerPoint & Google Slides
Process
Scale Metaphor Metrics Comparison Template for PowerPoint & Google Slides
Charts
Key Metaphor Infographic Slide Template for PowerPoint & Google Slides
Process
Mustard and Navy Balance Scale Metaphor Template for PowerPoint & Google Slides
Comparison
Shield Metaphor Security and Protection Template for PowerPoint & Google Slides
Risk Management
Magnifying Glass Research Metaphor Template for PowerPoint & Google Slides
Process
Business Opportunity Metaphor Slide Template for PowerPoint & Google Slides
Opportunities Challenges
Productivity Metaphor Clock Icon Template for PowerPoint & Google Slides
Graphics
Explore Binoculars Metaphor Slide Template for PowerPoint & Google Slides
Process
Guide Metaphor Navigation Infographic Template for PowerPoint & Google Slides
Process
Office Workspace Metaphor Slide Template for PowerPoint & Google Slides
Business Proposal
Navigation Compass Metaphor Slide Template for PowerPoint & Google Slides
Vision and Mission
Deadline Metaphor Timeline & Hourglass Template for PowerPoint & Google Slides
Project
Planning Metaphor Flowchart Slide Template for PowerPoint & Google Slides
Process
News Metaphor Media Communication Slide Template for PowerPoint & Google Slides
Business Report
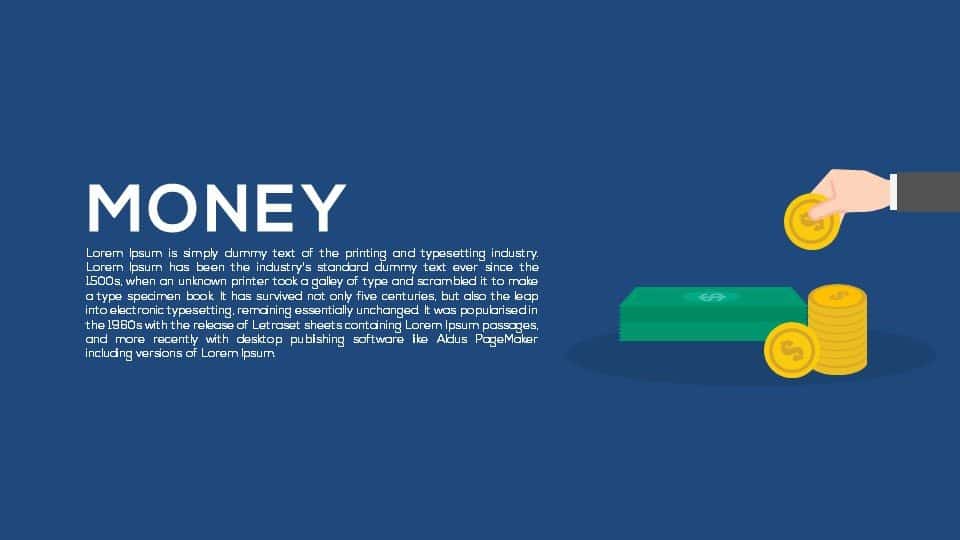
Money Metaphor Financial Overview Template for PowerPoint & Google Slides
Finance
Dual Percentage Comparison Metaphor Template for PowerPoint & Google Slides
Comparison
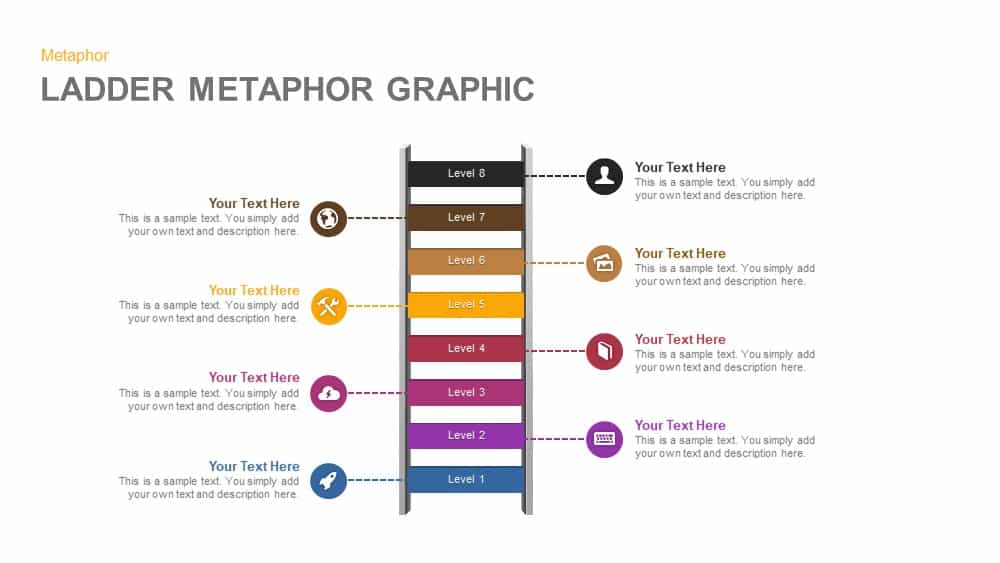
Eight-Level Ladder Metaphor Graphic Template for PowerPoint & Google Slides
Process
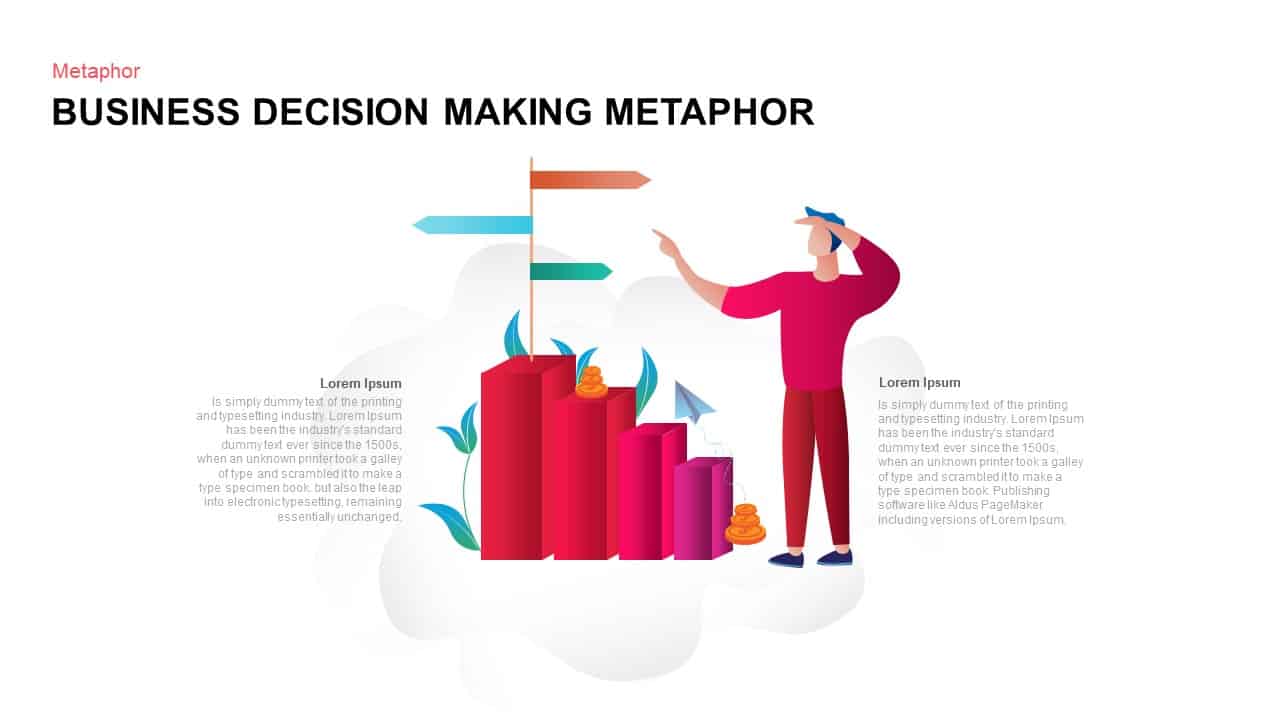
Business Decision-Making Metaphor Template for PowerPoint & Google Slides
Leadership
Developer Icons Metaphor Slide Template for PowerPoint & Google Slides
Software Development
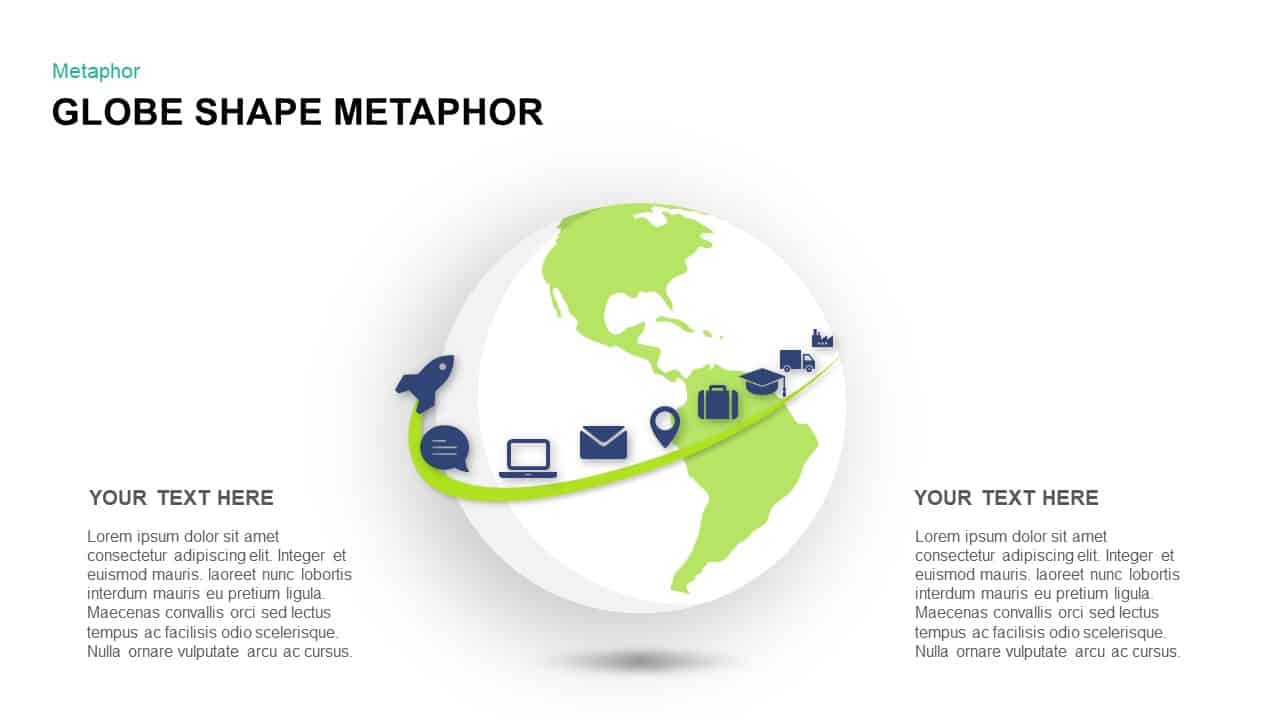
Global Business Pathway Metaphor Template for PowerPoint & Google Slides
Opportunities Challenges

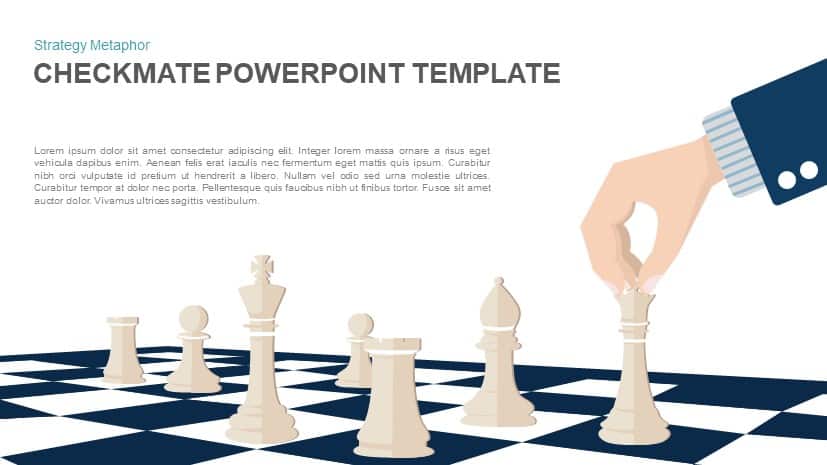
Checkmate Strategy Chess Metaphor Template for PowerPoint & Google Slides
Opportunities Challenges
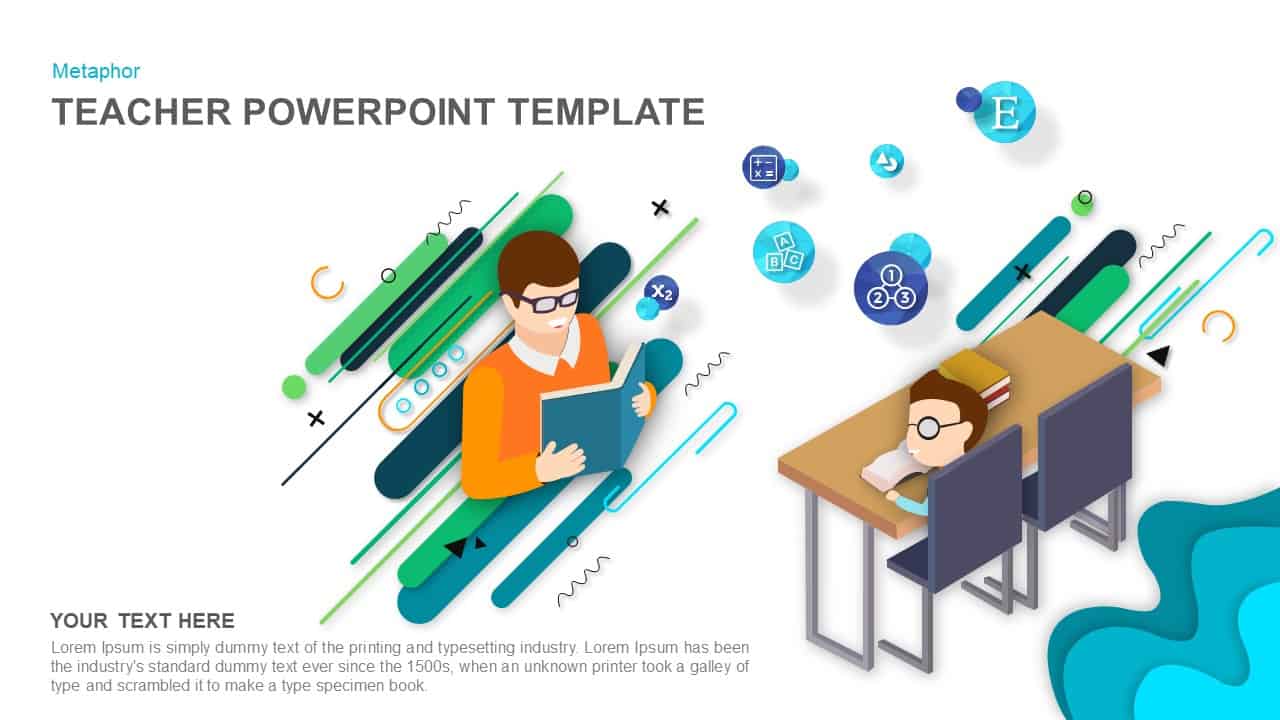
Teacher Illustration Metaphor Slide Template for PowerPoint & Google Slides
Process
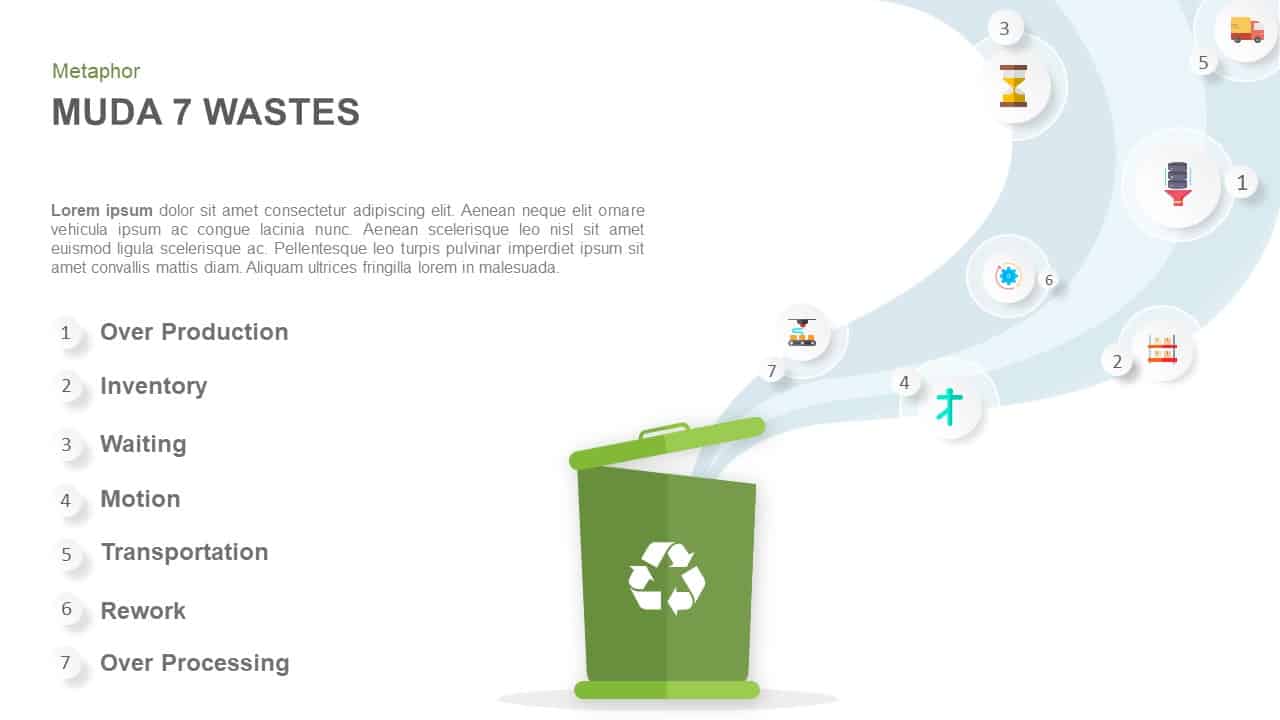
Muda 7 Wastes Recycling Bin Metaphor Template for PowerPoint & Google Slides
Process

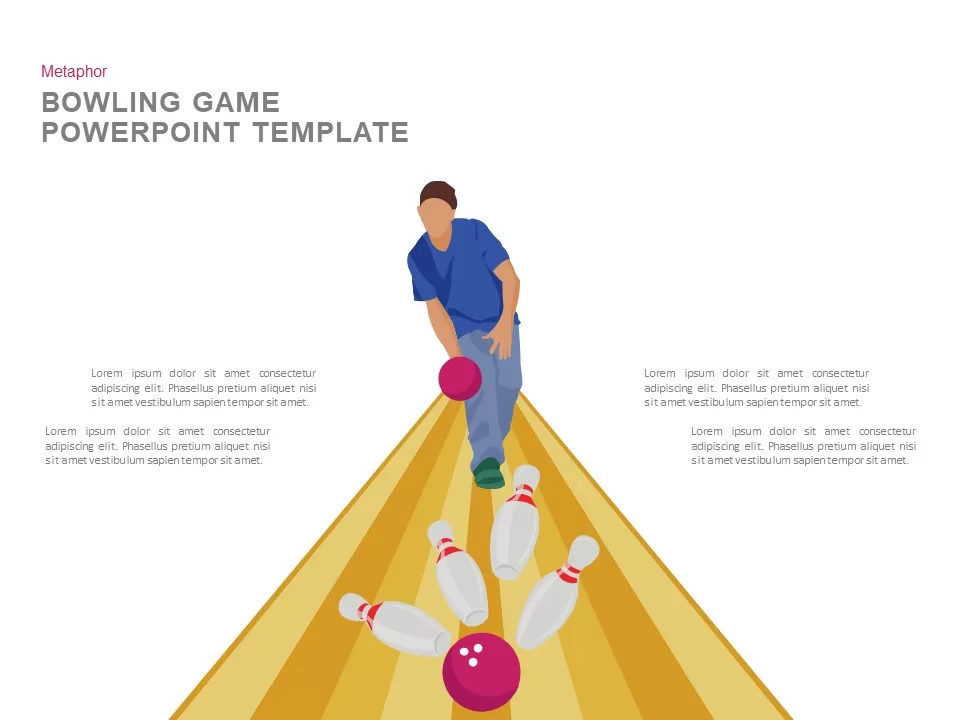
Bowling Game Illustration Metaphor Template for PowerPoint & Google Slides
Process
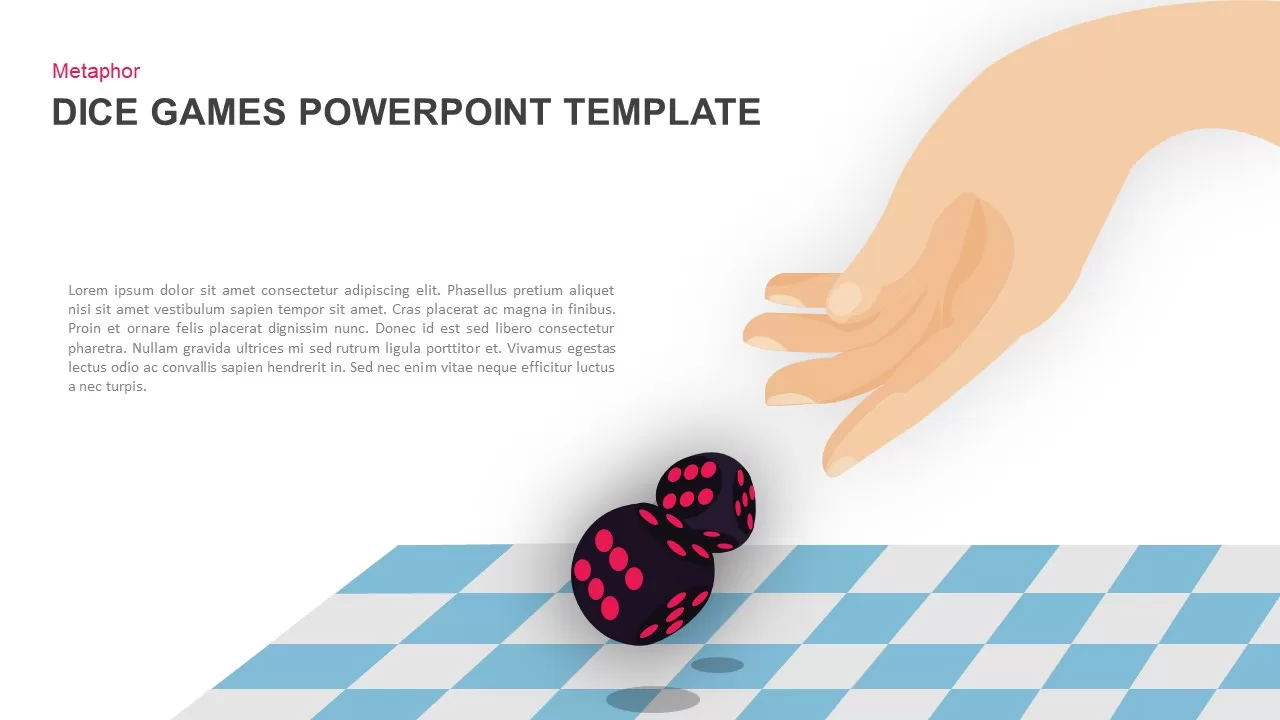
Dice Game Throwing Metaphor Slide Template for PowerPoint & Google Slides
Process
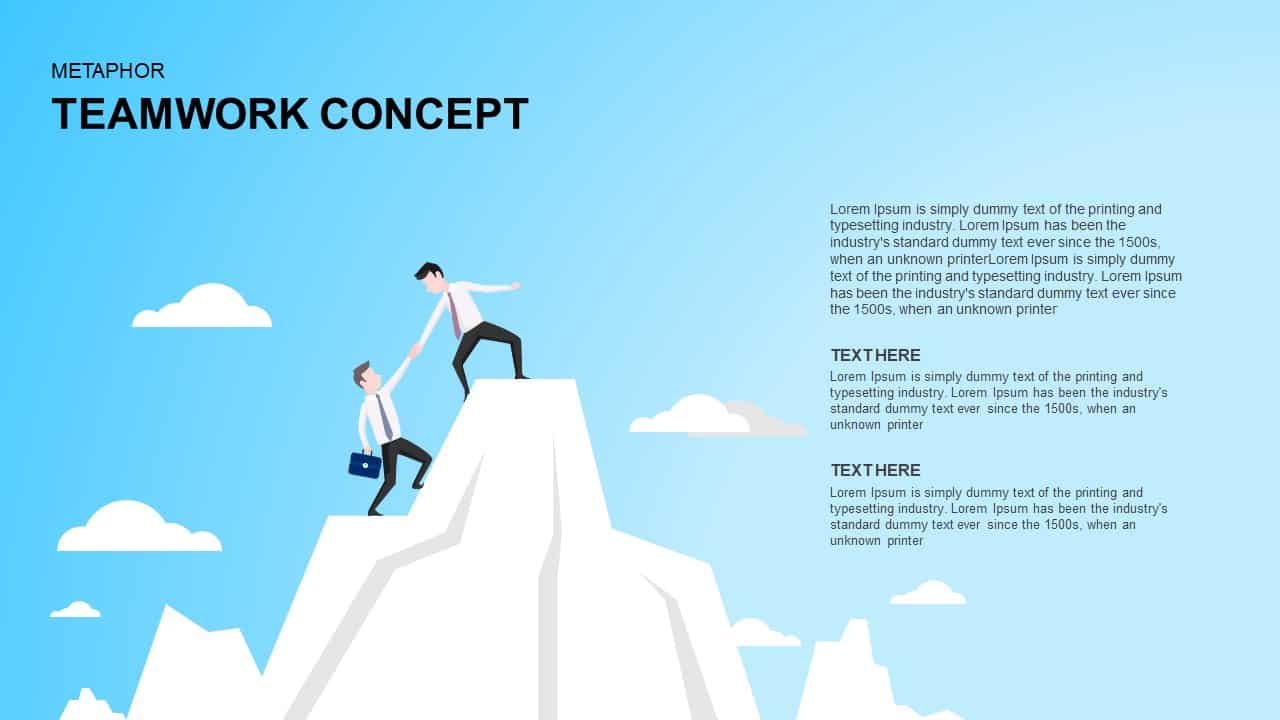
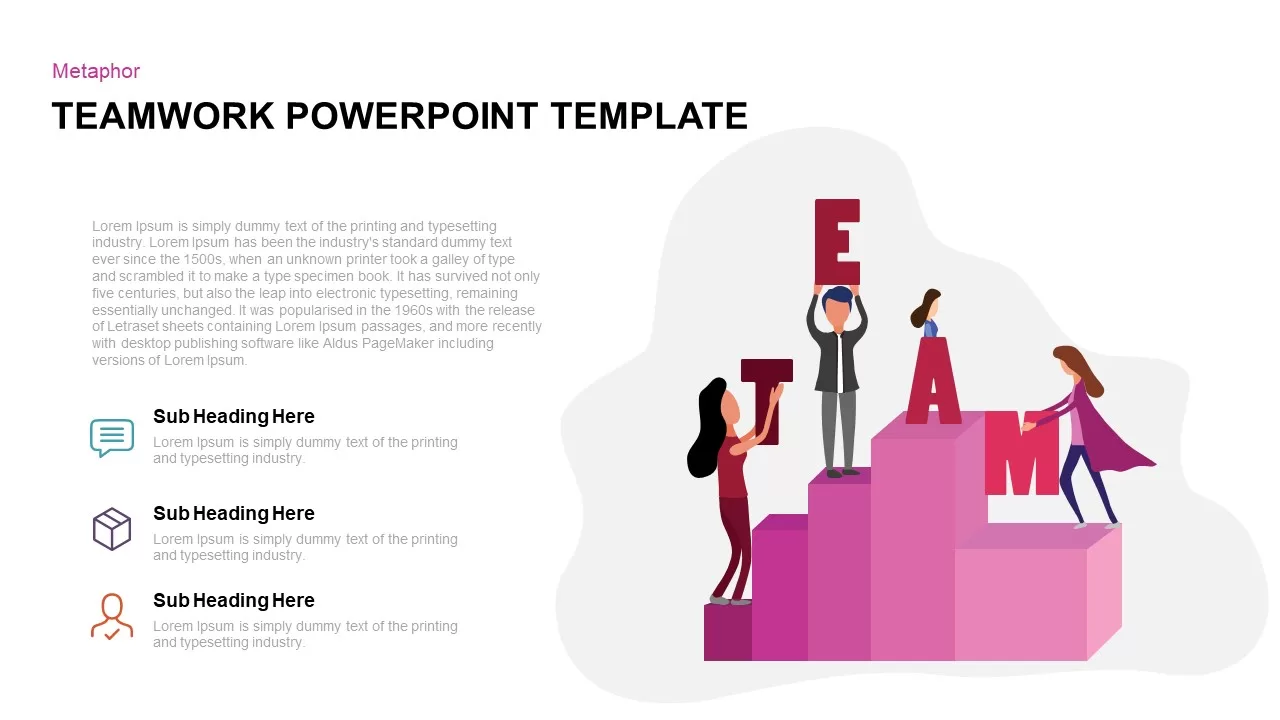
Teamwork Concept Metaphor Template for PowerPoint & Google Slides
Leadership
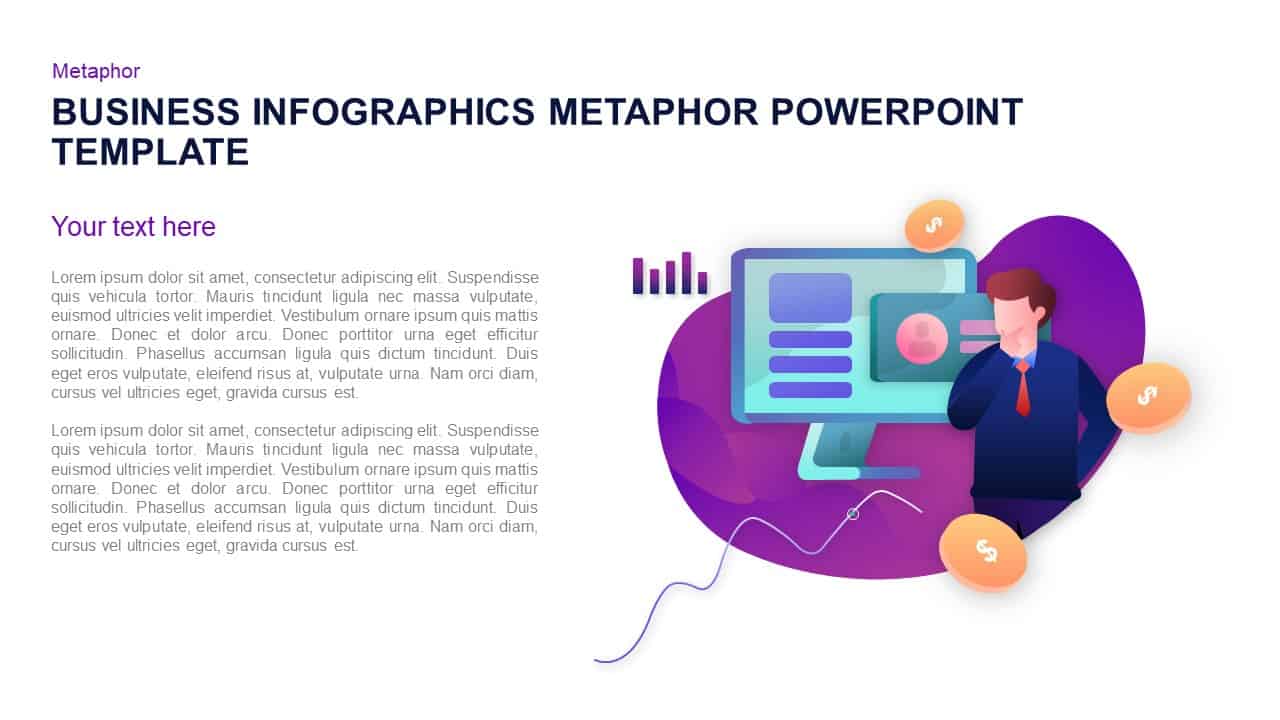
Business Growth Infographic Metaphor Template for PowerPoint & Google Slides
Revenue
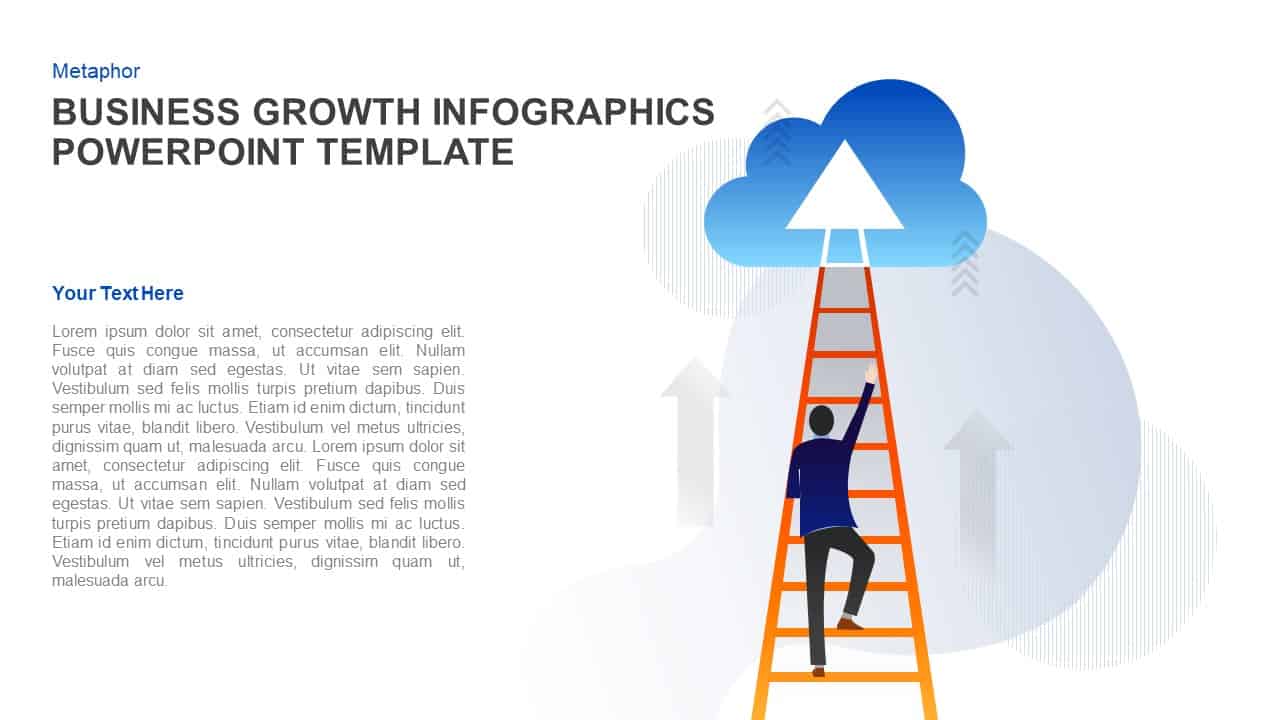
Business Growth Ladder to Cloud Metaphor Template for PowerPoint & Google Slides
Vision and Mission
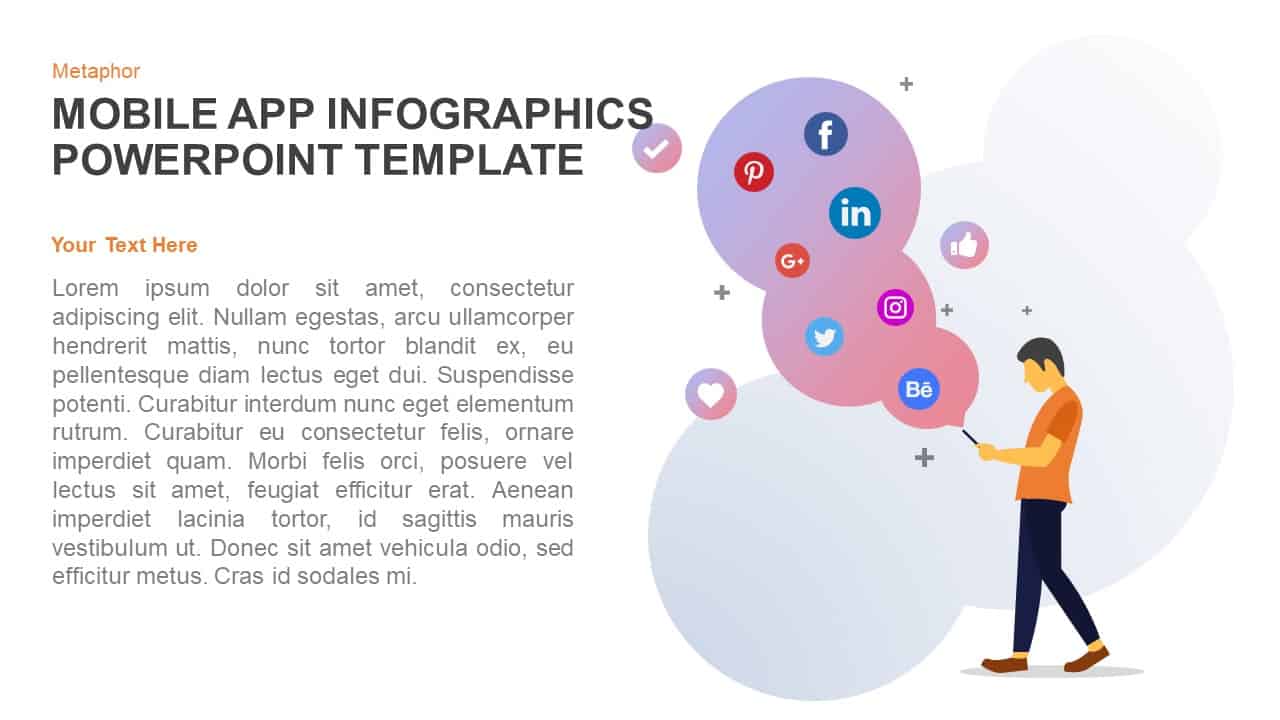
Mobile App Social Media Metaphor Template for PowerPoint & Google Slides
Infographics
Competitive Tug-of-War Metaphor Template for PowerPoint & Google Slides
Business Strategy
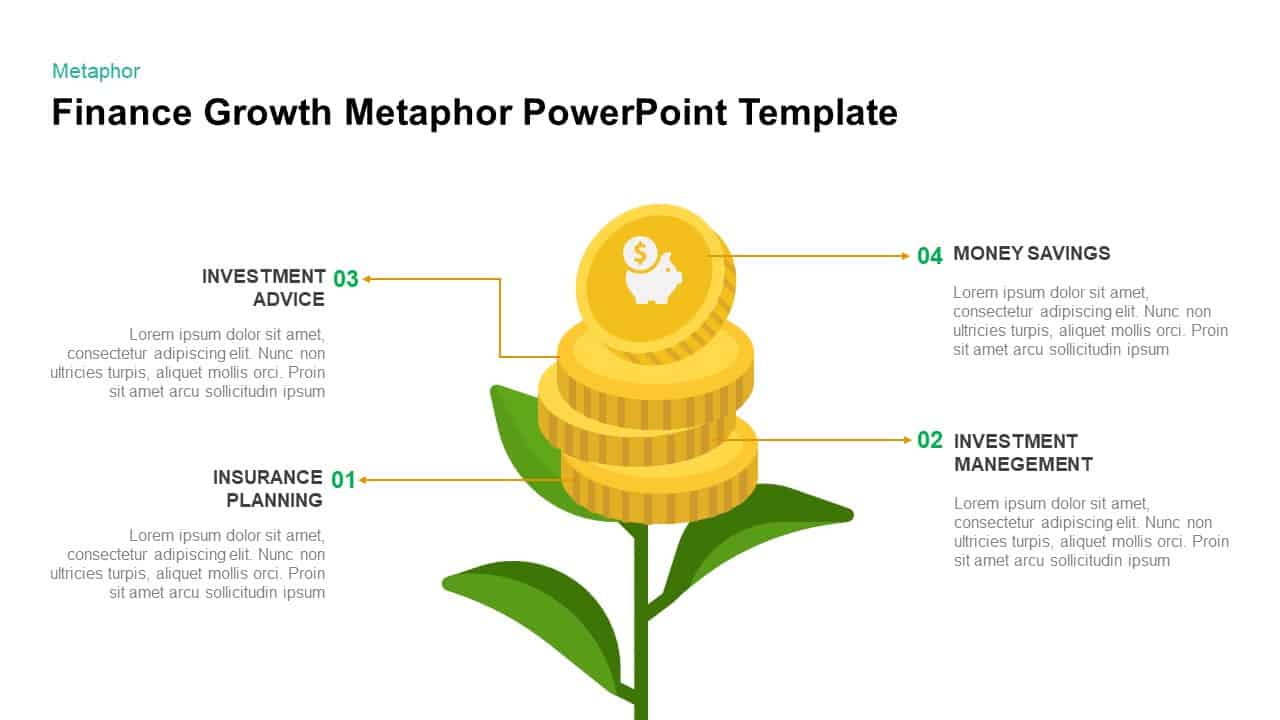
Finance Growth Plant Metaphor Slide Template for PowerPoint & Google Slides
Finance
Collaborative Teamwork Metaphor Illustration Template for PowerPoint & Google Slides
Leadership
Business Decision Making Metaphor Template for PowerPoint & Google Slides
Arrow
Social Media Metaphor Illustration Template for PowerPoint & Google Slides
Digital Marketing
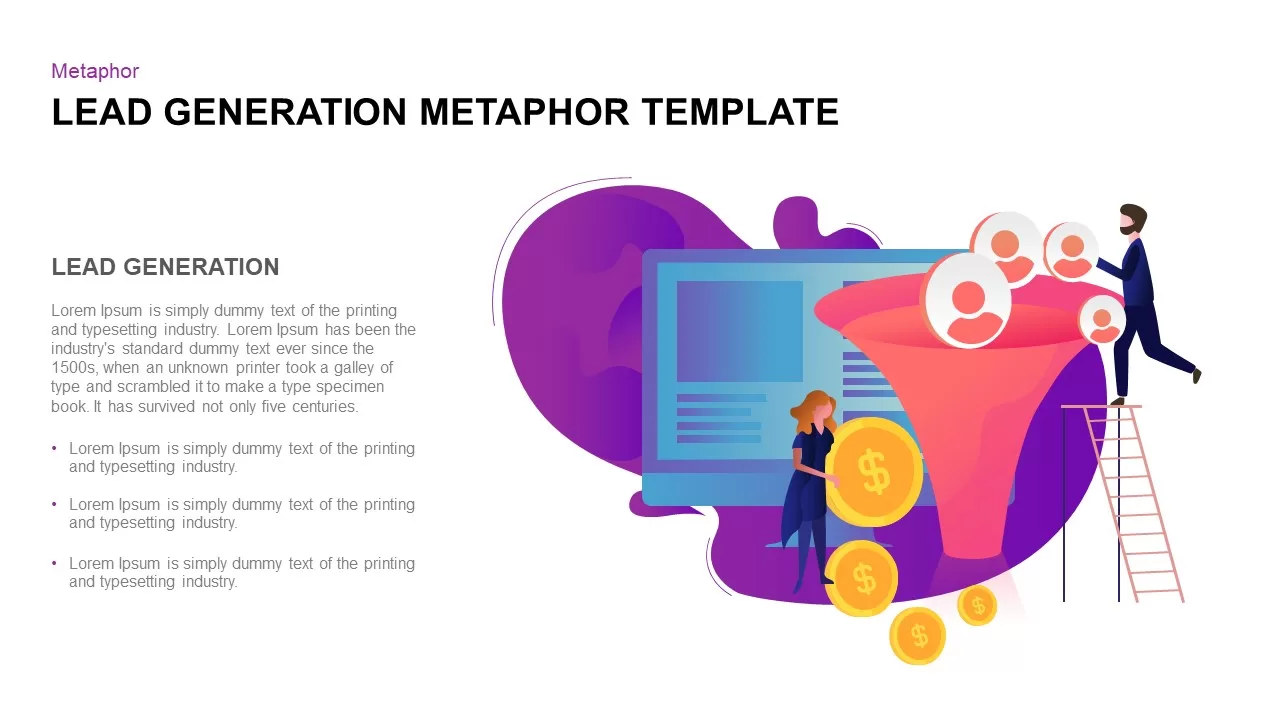
Lead Generation Funnel Metaphor Template for PowerPoint & Google Slides
Marketing Funnel
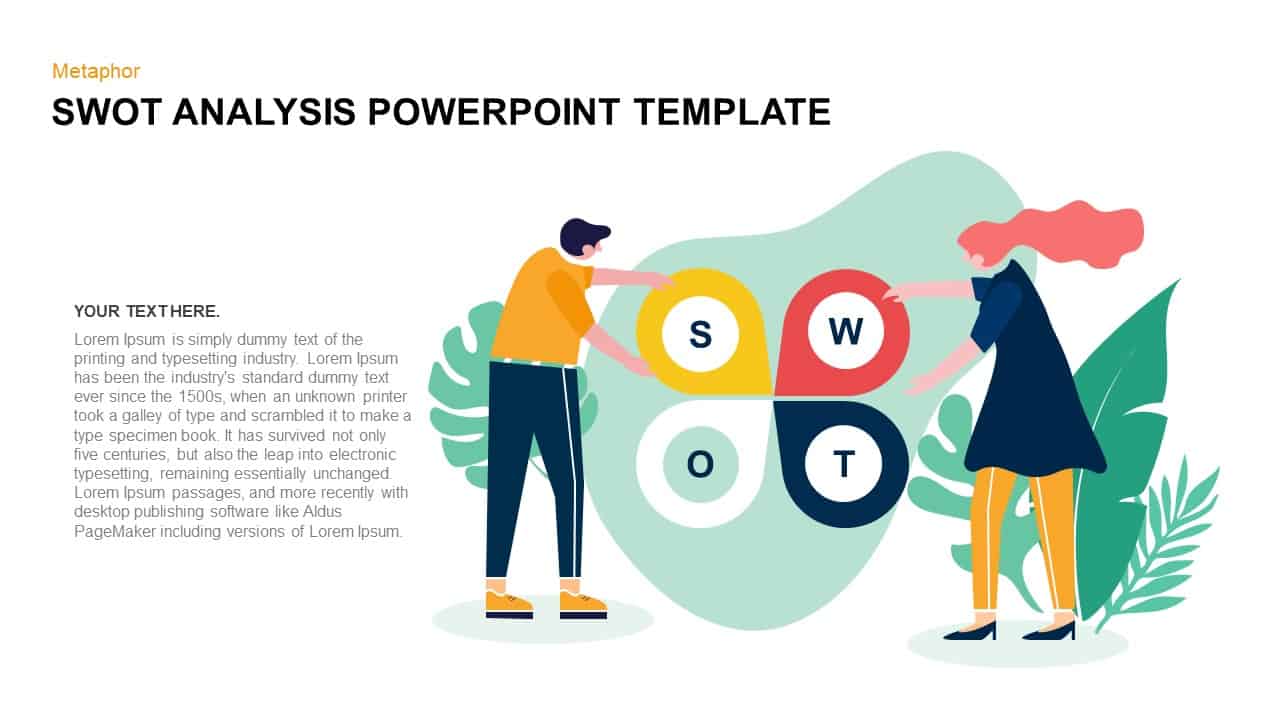
SWOT Analysis Metaphor Illustration Template for PowerPoint & Google Slides
SWOT
Vibrant Digital Marketing Metaphor Template for PowerPoint & Google Slides
Advertising
Collaborative Teamwork Metaphor Slide Template for PowerPoint & Google Slides
Our Team
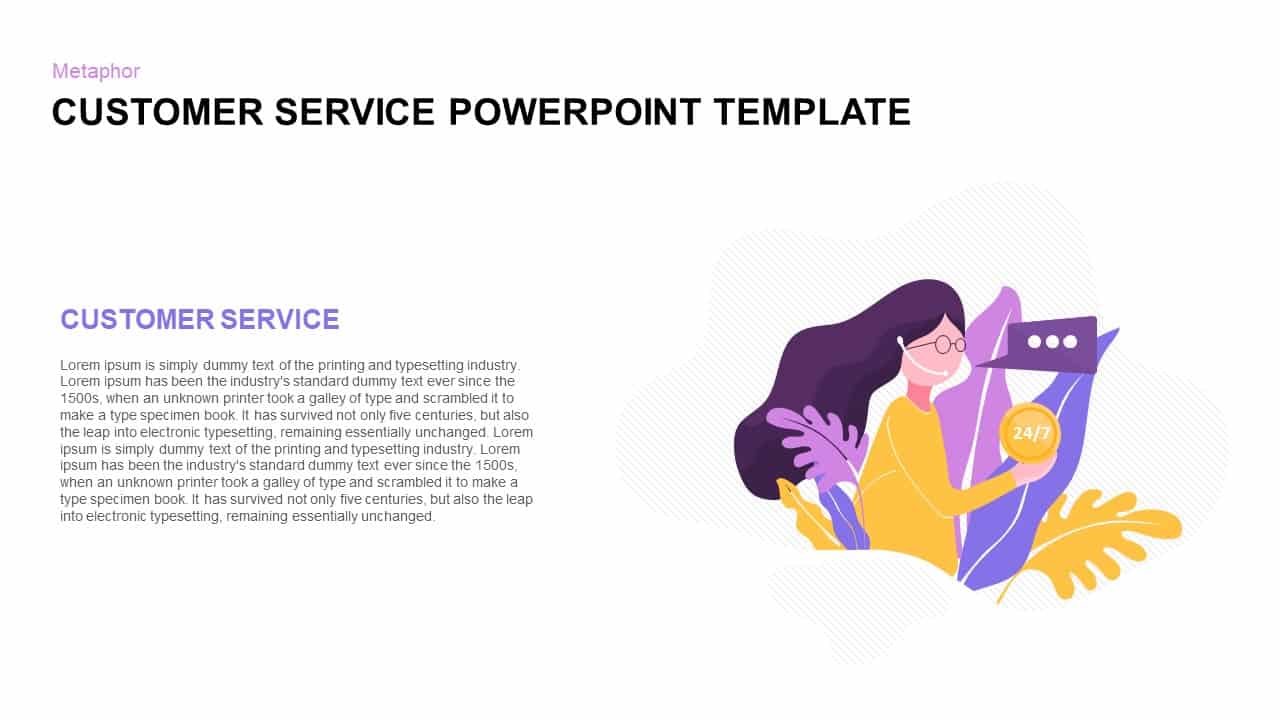
Customer Service Metaphor Infographic Template for PowerPoint & Google Slides
Customer Experience
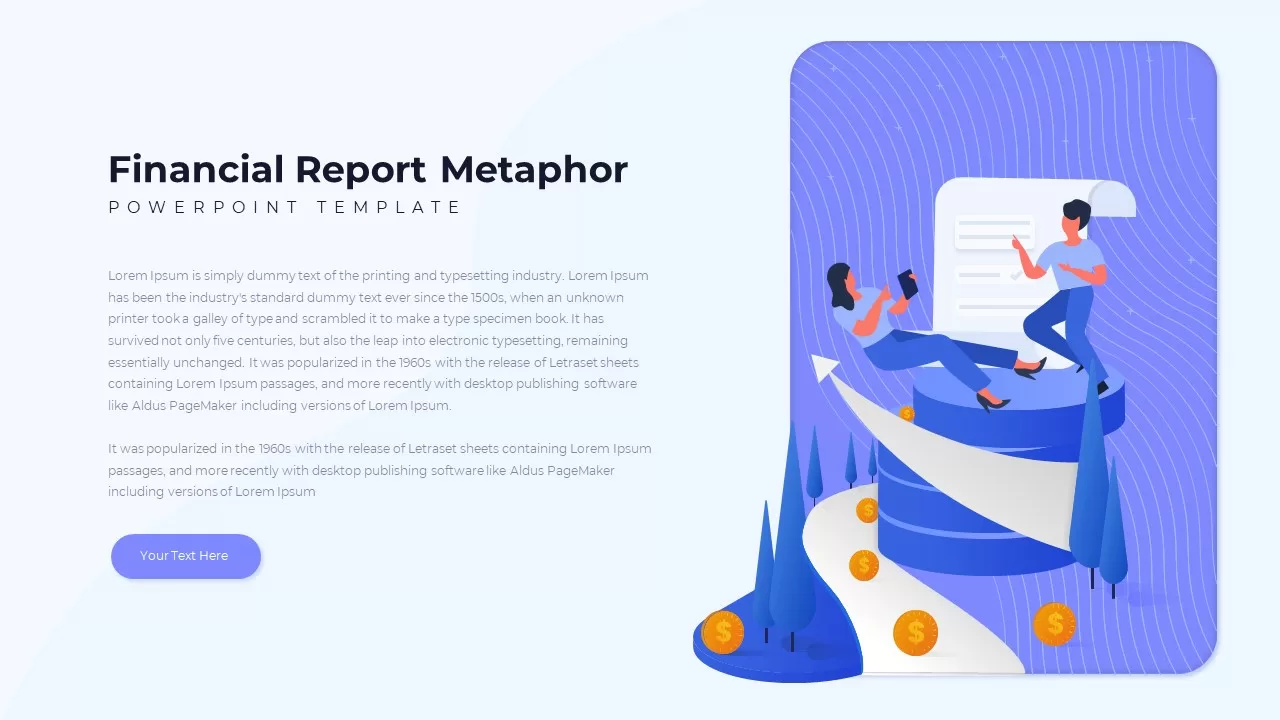
Financial Report Metaphor Illustration Template for PowerPoint & Google Slides
Finance
Business Growth Metaphor Chart Template for PowerPoint & Google Slides
Business
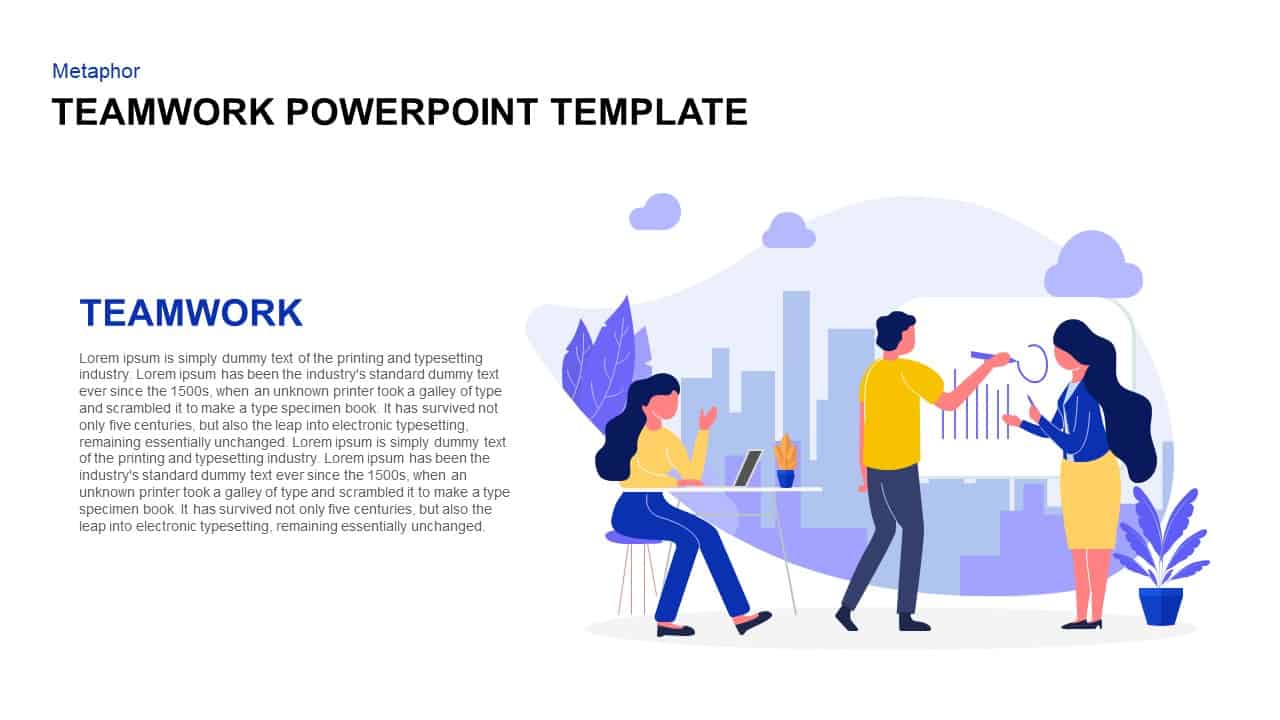
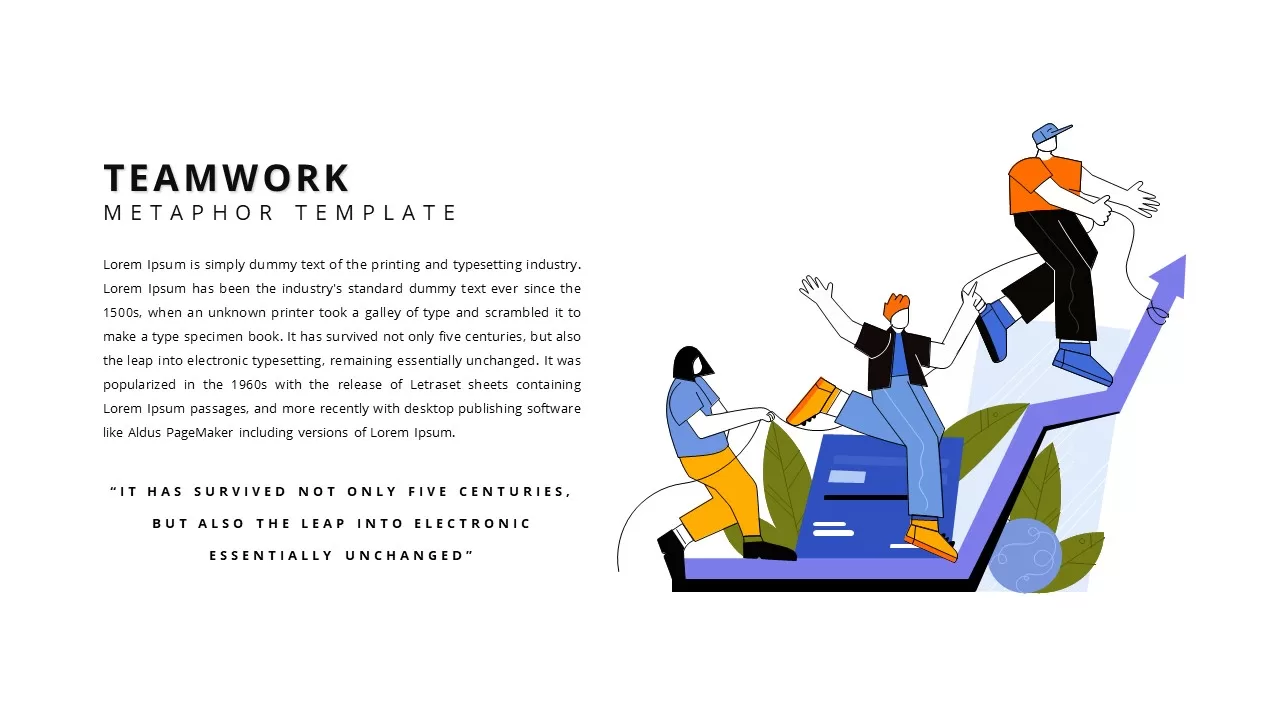
Teamwork Metaphor Illustration Template for PowerPoint & Google Slides
Leadership
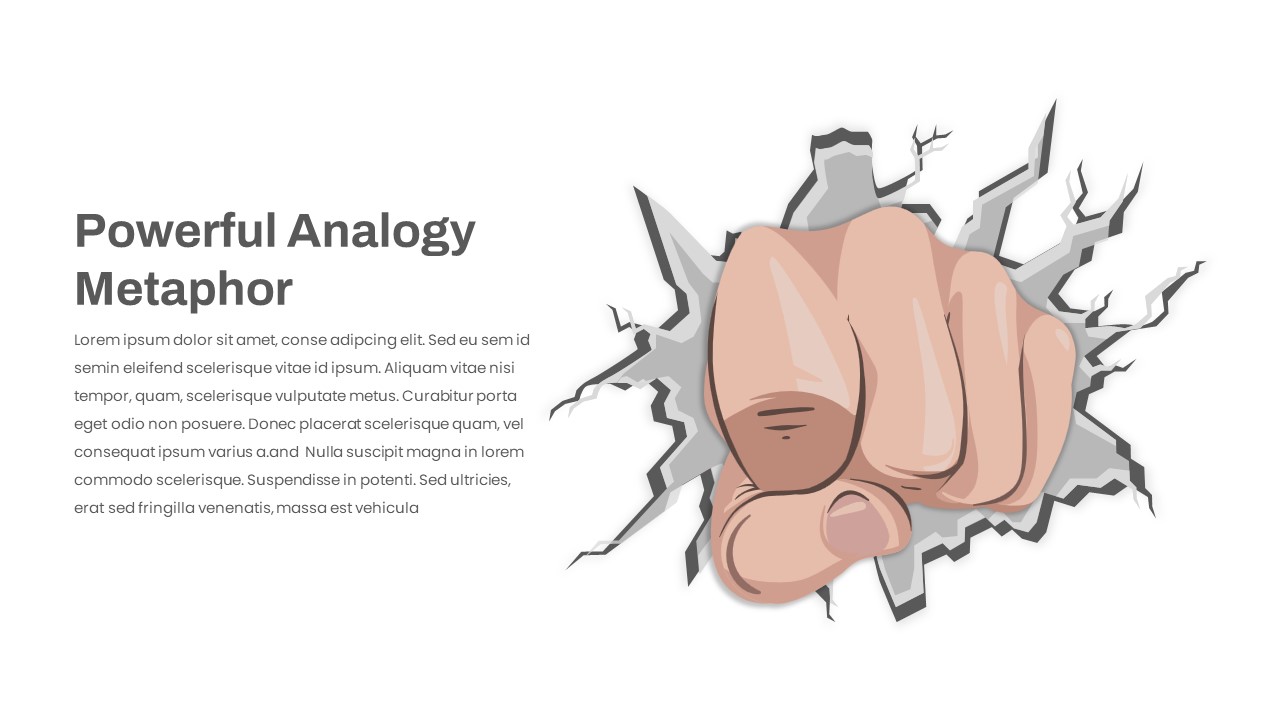
Creative Power Analogy Metaphor Slide Template for PowerPoint & Google Slides
Leadership
Powerful Visual Metaphor Analogy Slide Template for PowerPoint & Google Slides
Opportunities Challenges
Relay Race Metaphor for PowerPoint & Google Slides
Accomplishment
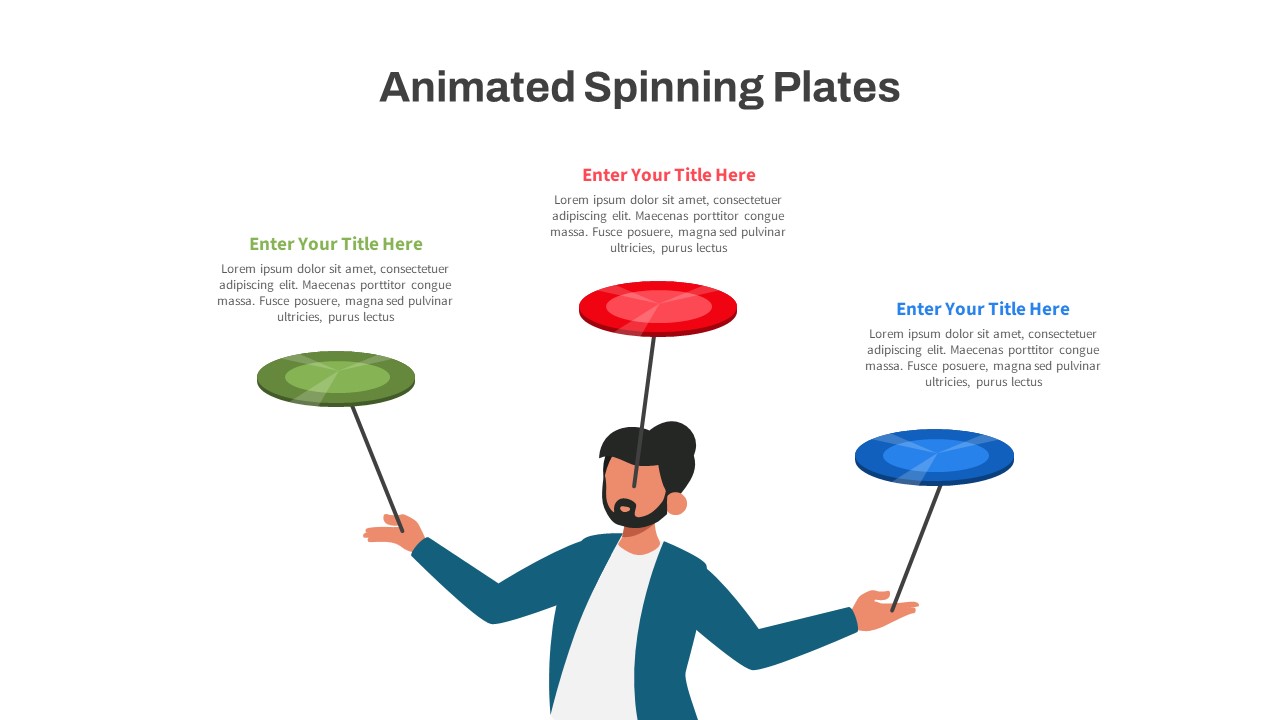
Animated Spinning Plates Metaphor Slide for PowerPoint & Google Slides
Infographics
Metaphor Partnership PowerPoint Template and Keynote Template
Opportunities Challenges
Gear Process Diagram PowerPoint Template for PowerPoint & Google Slides
Process
Sales Process Workflow Funnel Diagram PowerPoint Template for PowerPoint & Google Slides
Funnel
3D Sphere Arrow Process Diagram template for PowerPoint & Google Slides
Arrow
3D Shape Linear Process Flow Diagram Template for PowerPoint & Google Slides
Process
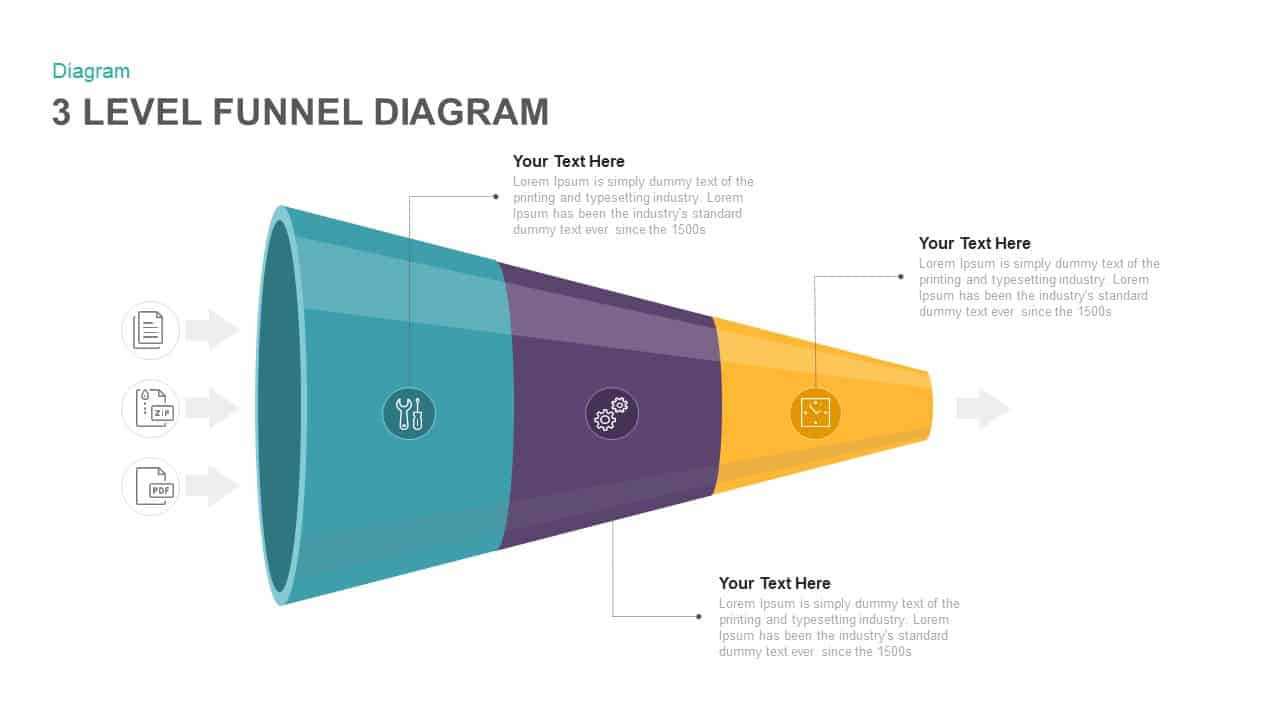
Three Level Funnel Process Diagram Template for PowerPoint & Google Slides
Funnel
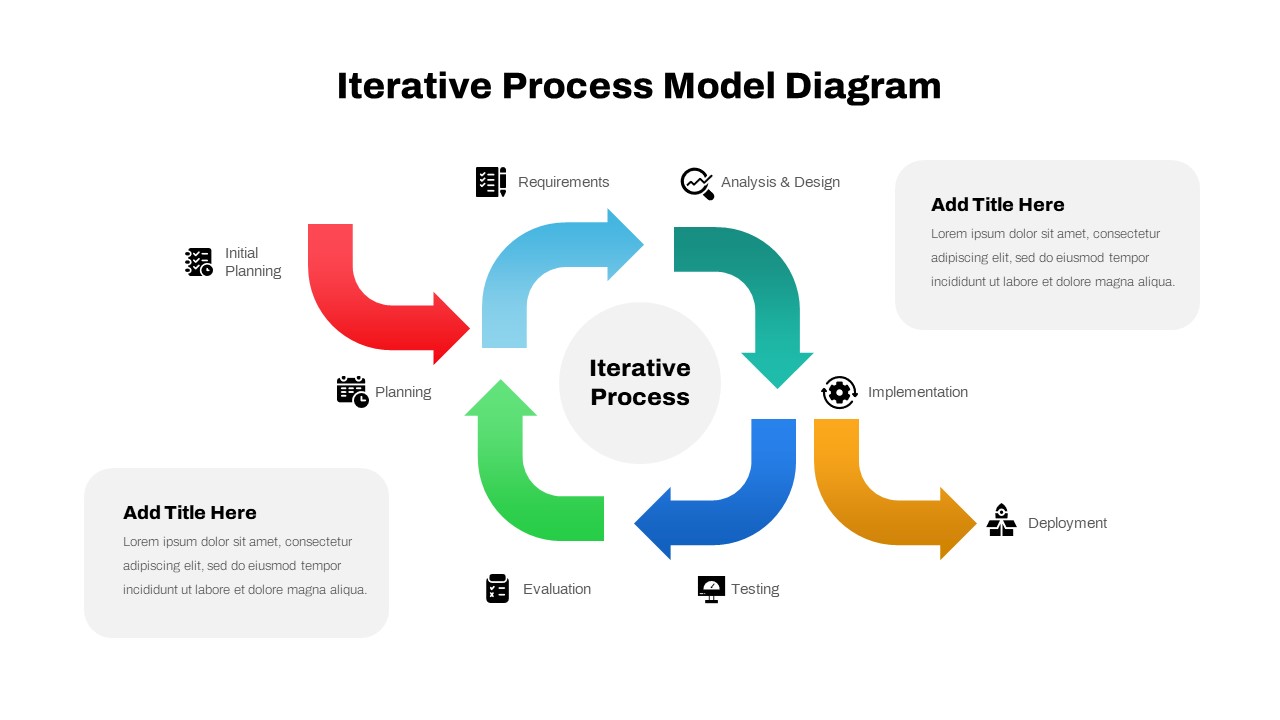
Iterative Process Model Diagram Template for PowerPoint & Google Slides
Process
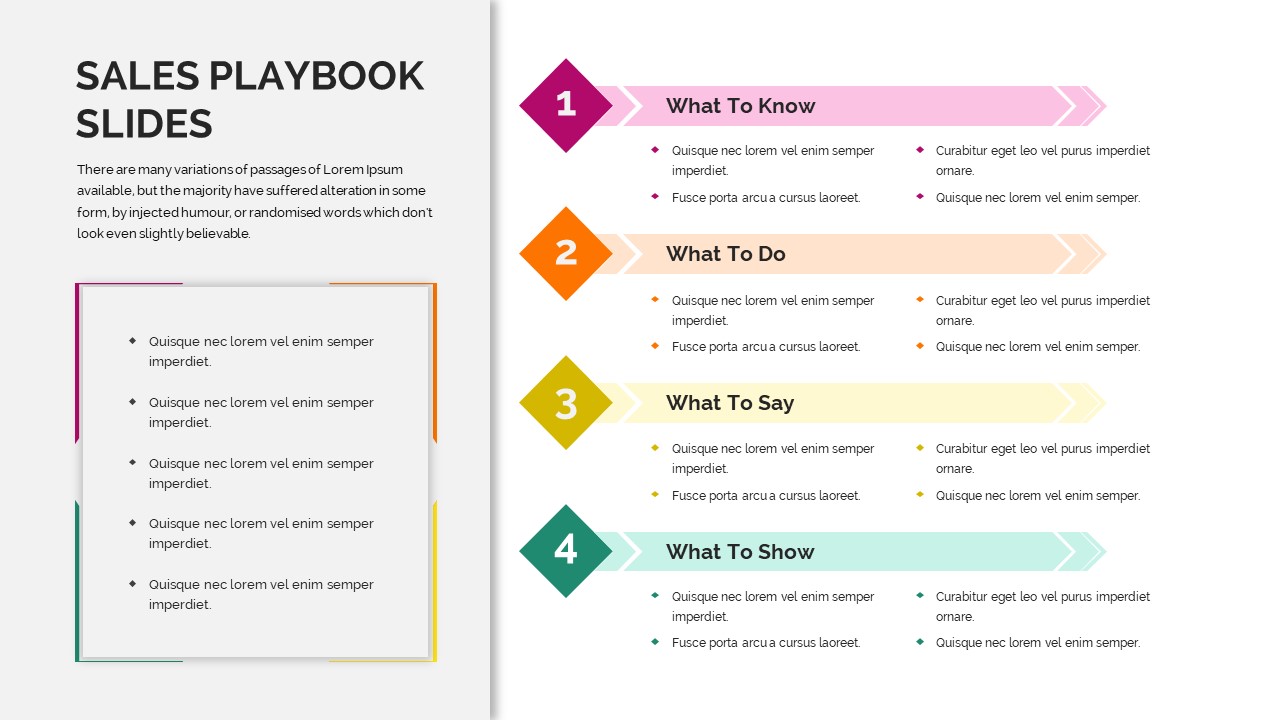
Sales Playbook Process Steps Diagram Template for PowerPoint & Google Slides
Marketing
Simple Flowchart Process Diagram Template for PowerPoint & Google Slides
Flow Charts
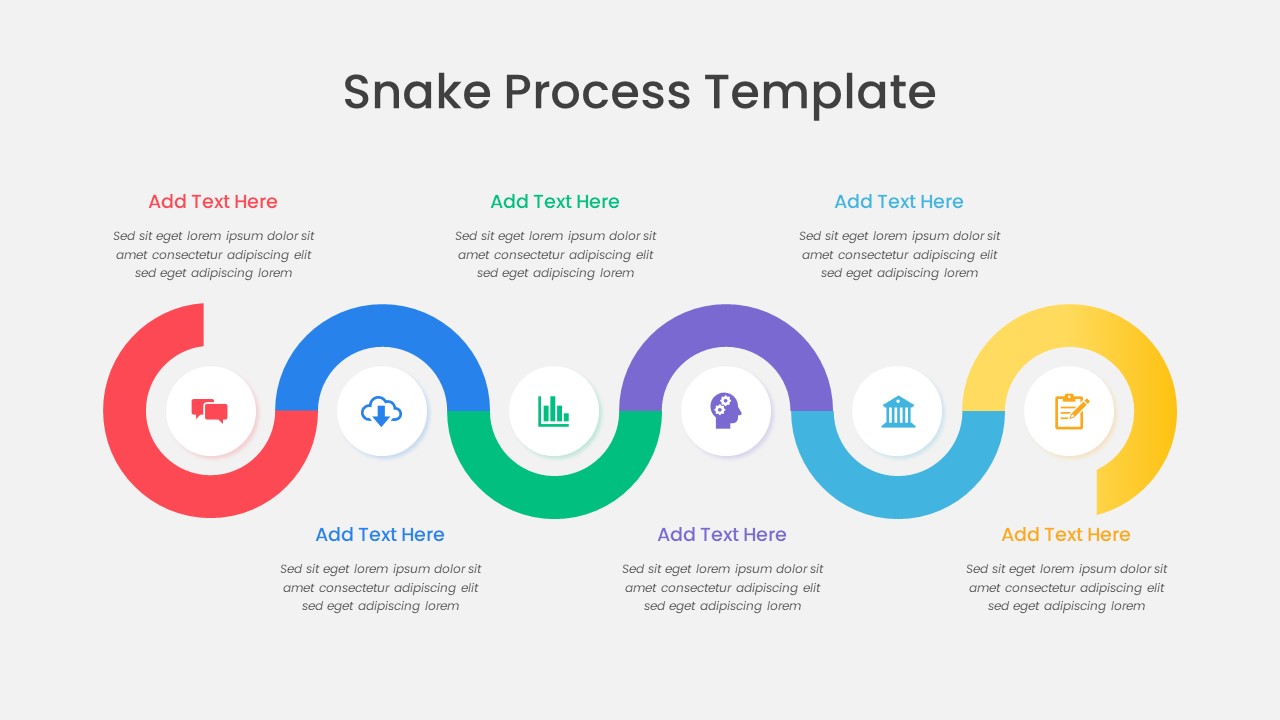
Colorful Snake Process Diagram Template for PowerPoint & Google Slides
Process
Bottleneck Process Analysis Diagram Template for PowerPoint & Google Slides
Process
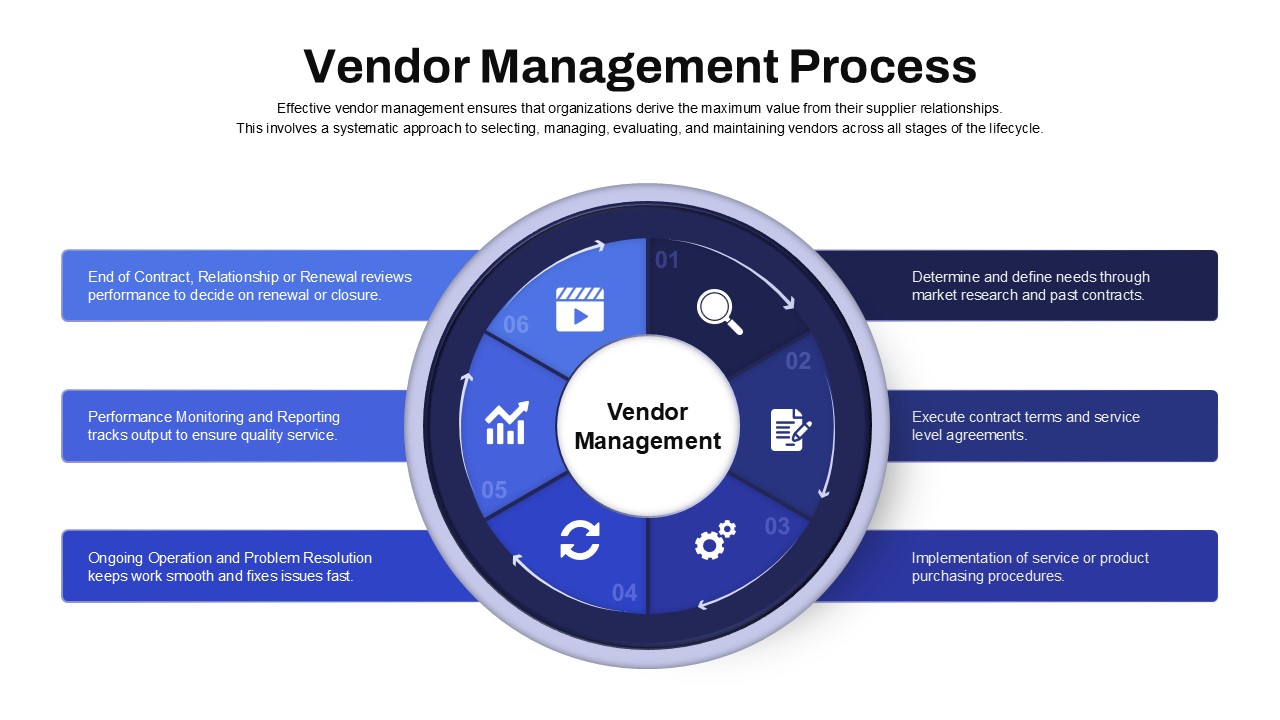
Vendor Management Process Diagram Template for PowerPoint & Google Slides
Process