Problem Solving Process Diagram Template for PowerPoint & Google Slides
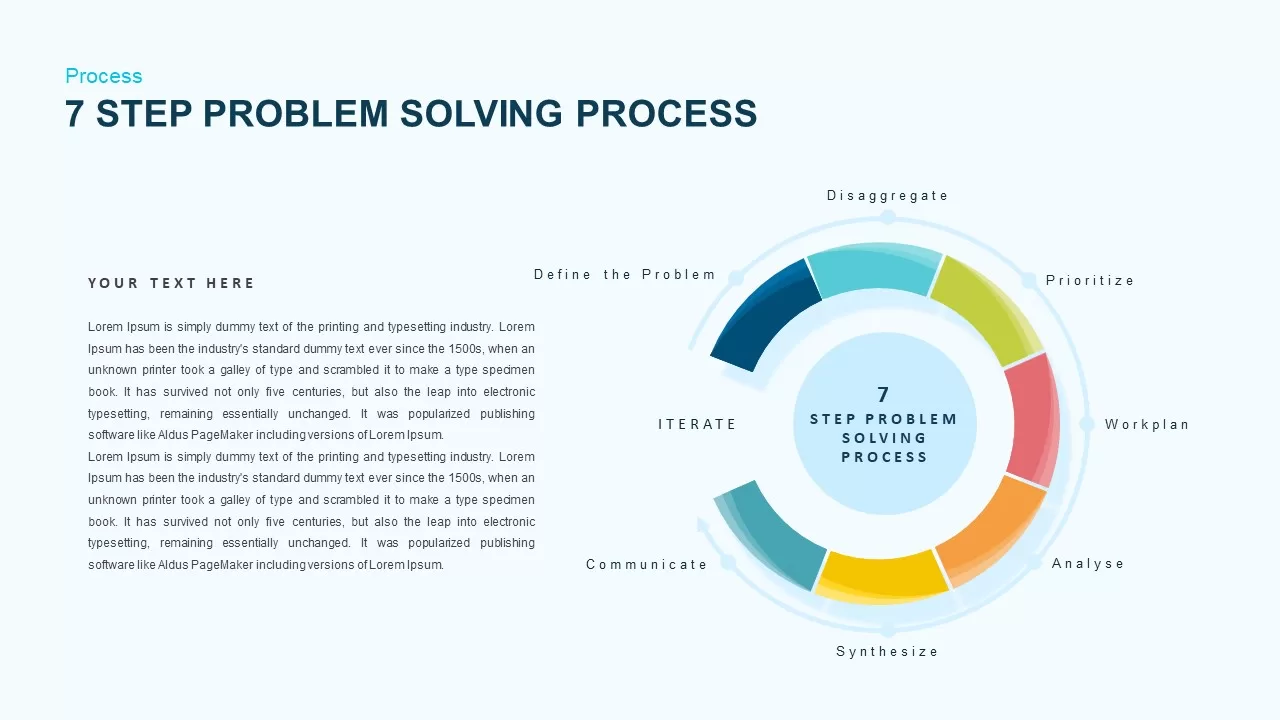
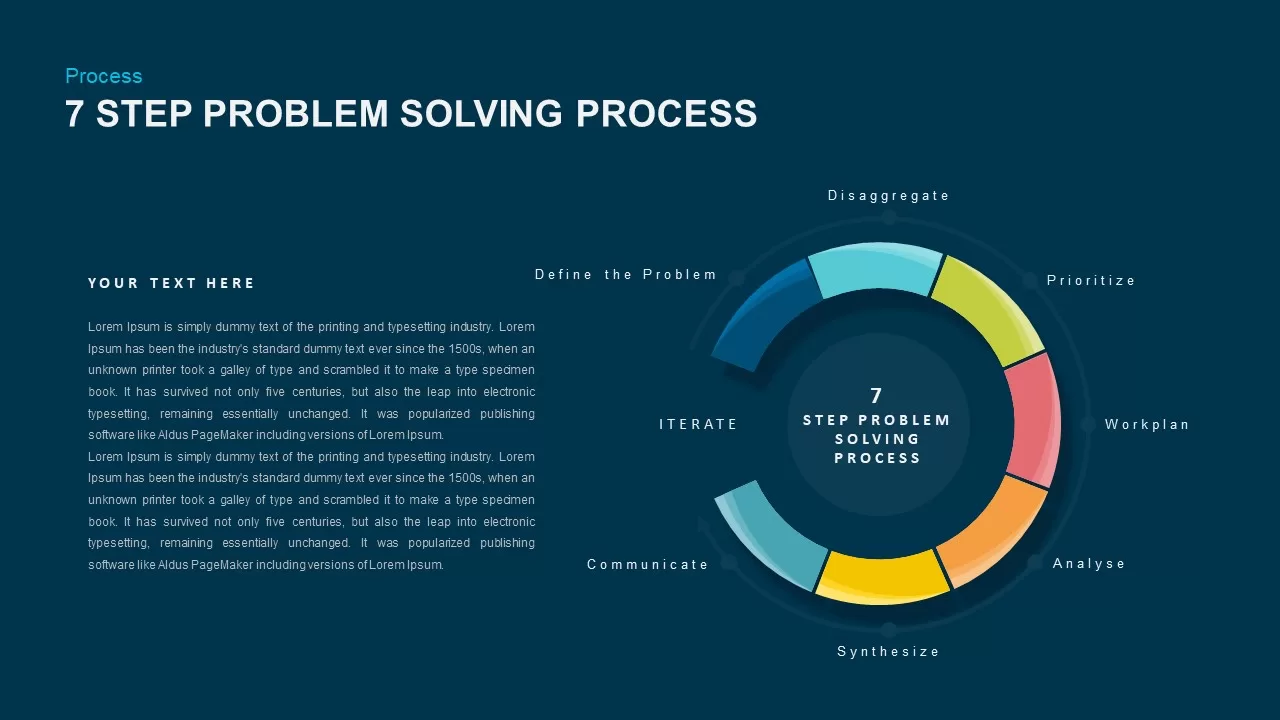

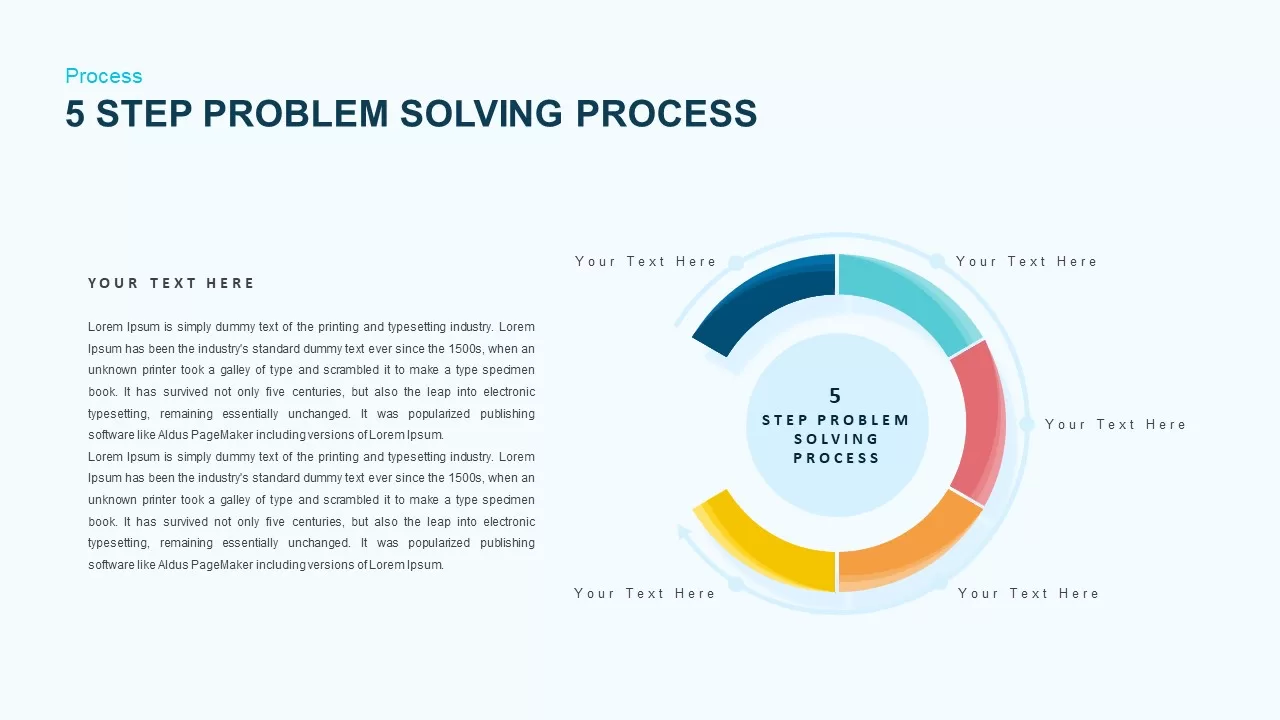


Leverage this problem solving process diagram to guide teams through every phase of structured resolution—from defining the problem and disaggregating issues to analyzing, synthesizing, work-planning, prioritizing, and iterating solutions. The radial donut layout uses seven distinct gradient-filled segments in vibrant hues, each paired with a text placeholder for step titles and descriptions. A central circle highlights the overall framework, while an outer halo of connector dots reinforces continuity and flow. Built on editable master slides for PowerPoint and Google Slides, this infographic empowers you to swap colors, adjust segment order, update labels, or hide unused segments with just a few clicks.
All graphics are vector-based, ensuring crisp, high-resolution output across devices and print formats. The modern sans-serif typography, generous white space, and subtle drop shadows deliver a polished, professional aesthetic. Whether you’re presenting in boardrooms, at client workshops, or during training sessions, this diagram reduces cognitive load by visualizing complex processes in an intuitive, memorable format. Use it to accelerate decision-making, align stakeholders, and track project milestones as you move from problem identification to solution implementation and continuous improvement.
Who is it for
Consultants, business analysts, project managers, and strategy facilitators will find this template invaluable for process audits, root-cause analyses, design sprints, and operational reviews that require a clear, repeatable problem solving methodology.
Other Uses
Beyond traditional problem solving, repurpose this radial diagram for agile retrospectives, product development lifecycles, change-management roadmaps, innovation pipelines, or any multi-stage framework that benefits from a cyclical, visual approach.
Login to download this file

Item ID
SB02024
Related Templates

4 Step Problem Solving PowerPoint Diagram for PowerPoint & Google Slides
Process

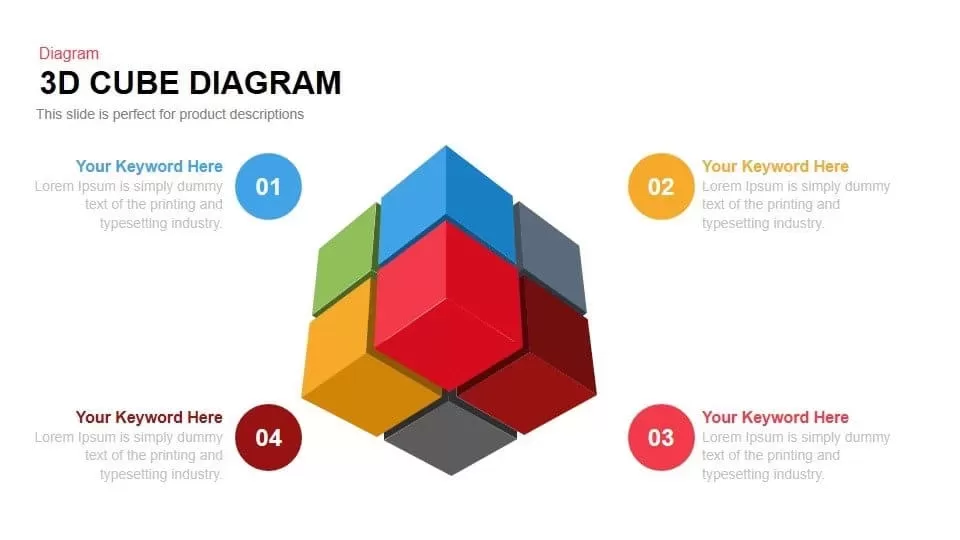
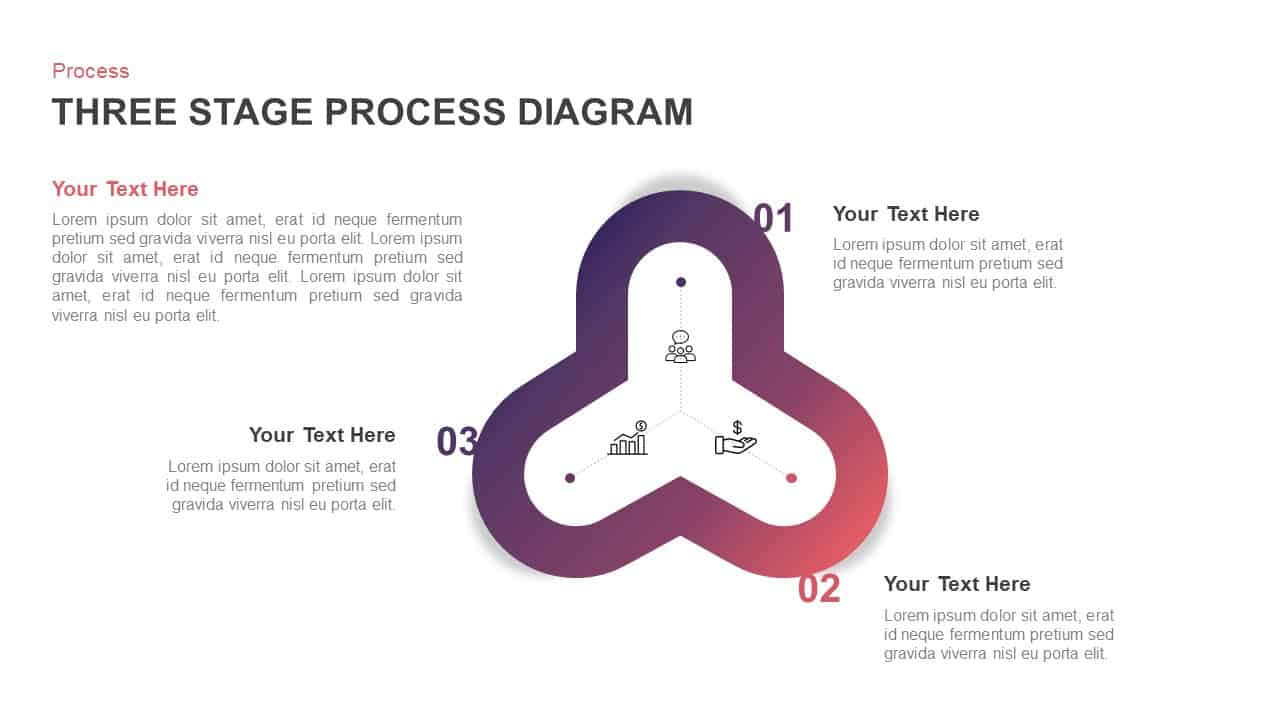
3D Cube Problem-Solving Diagram Template for PowerPoint & Google Slides
Process

Problem Solving Concept Diagram Template for PowerPoint & Google Slides
Infographics
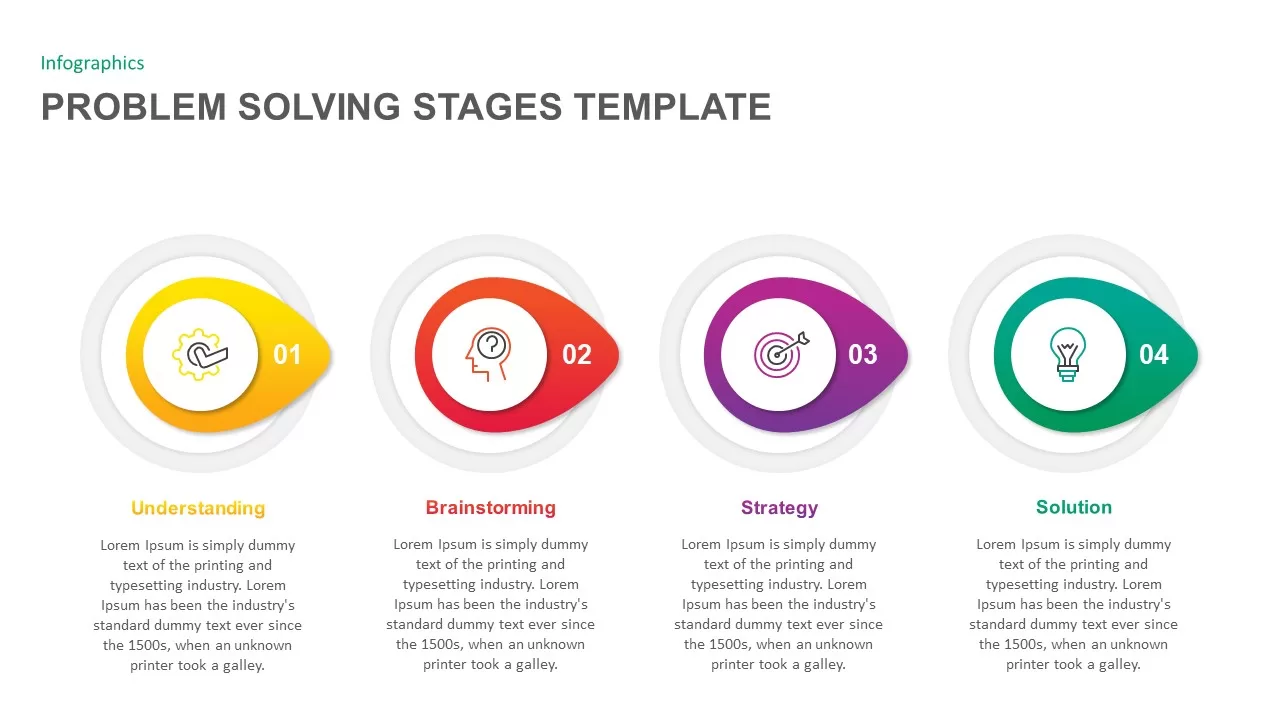
Problem Solving Stages Template for PowerPoint & Google Slides
Infographics
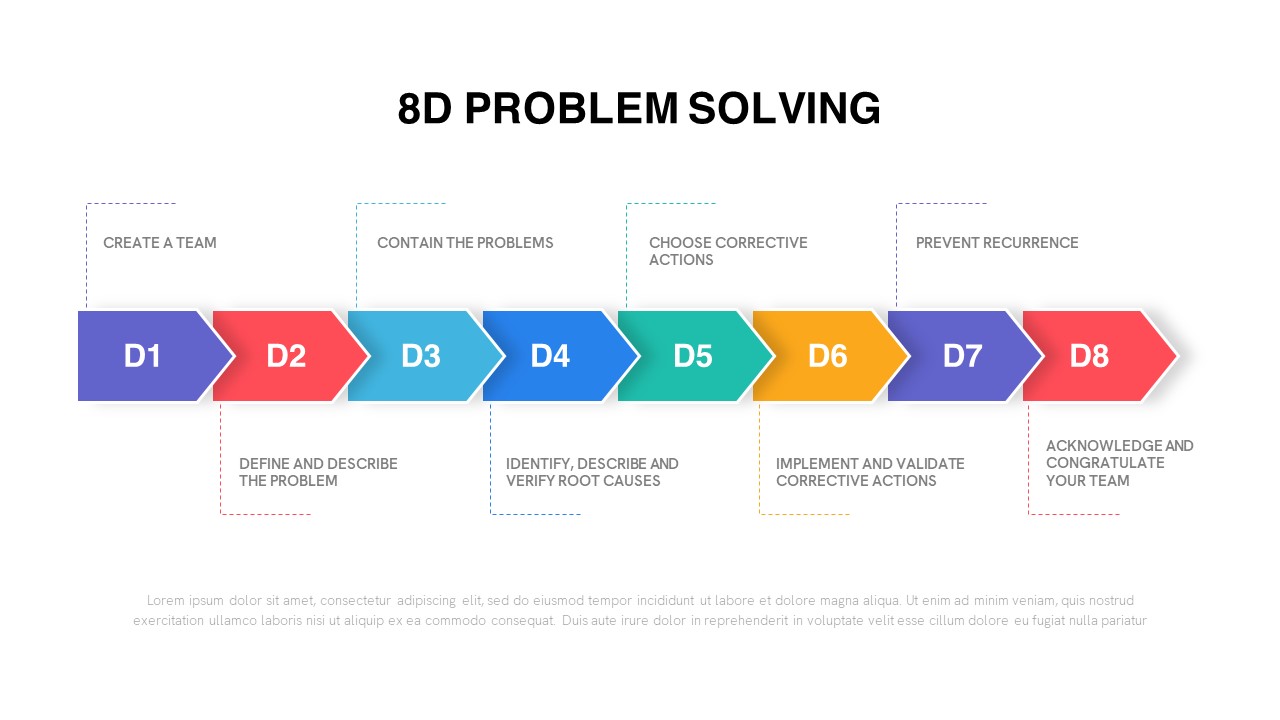
Quality Control 8D Problem Solving Template for PowerPoint & Google Slides
Business Strategy
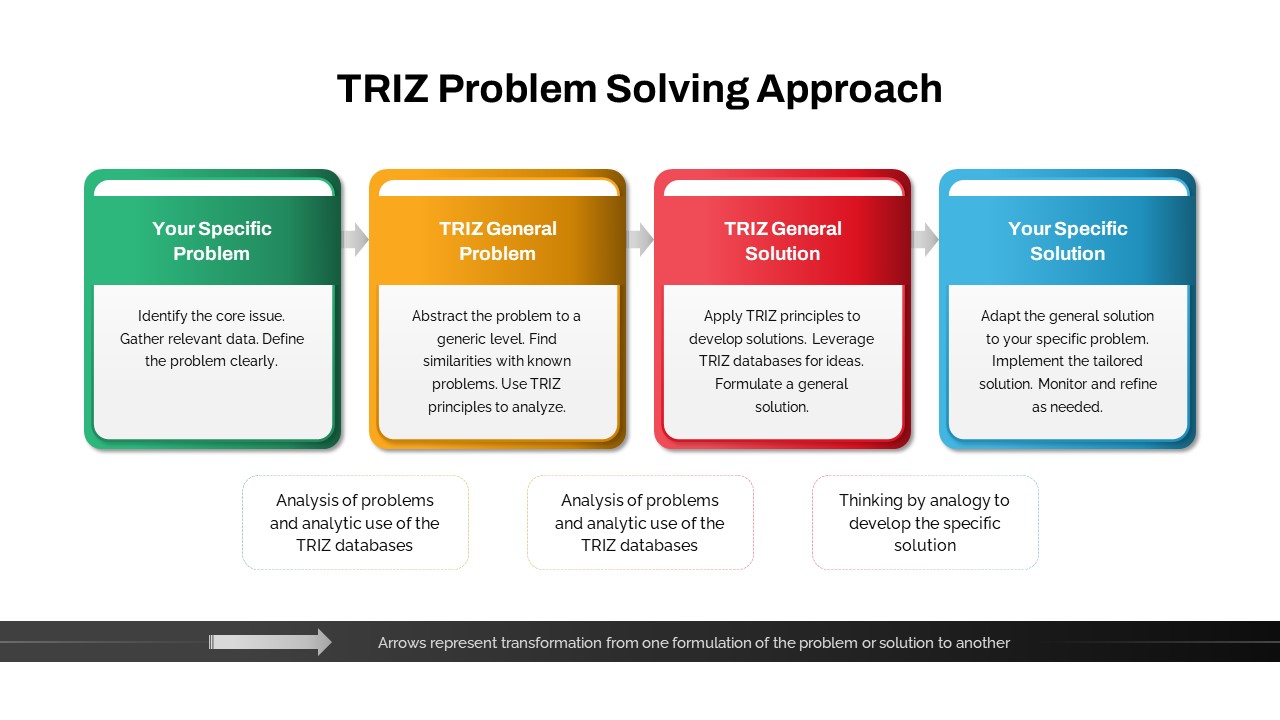
TRIZ Four-Stage Problem Solving Approach Template for PowerPoint & Google Slides
Process
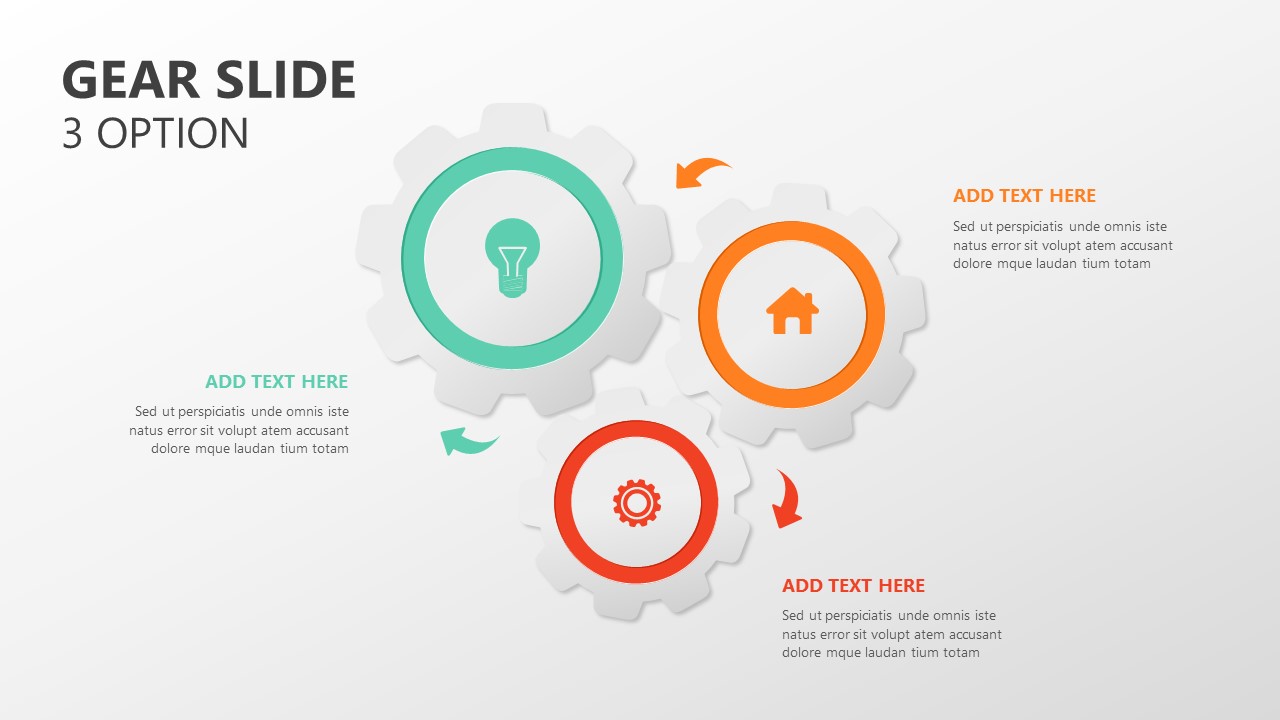
Gear Process Diagram PowerPoint Template for PowerPoint & Google Slides
Process
Sales Process Workflow Funnel Diagram PowerPoint Template for PowerPoint & Google Slides
Funnel
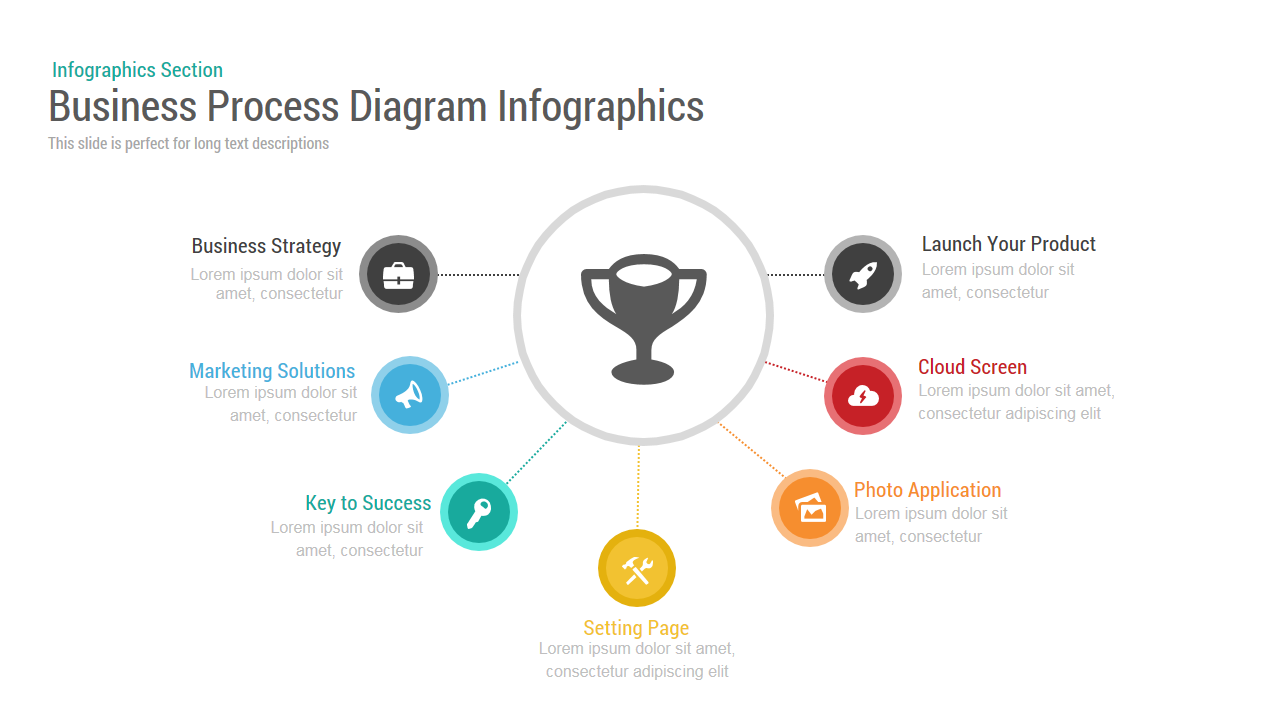
Business Process Diagram template for PowerPoint & Google Slides
Process
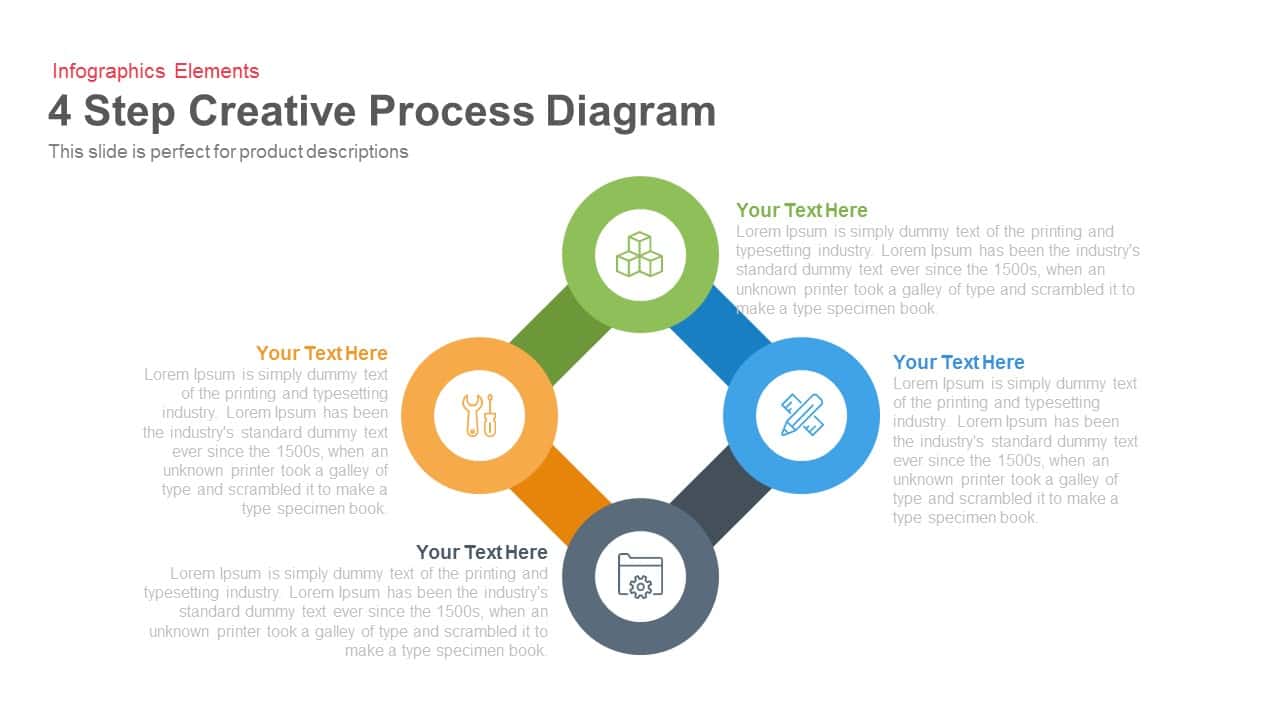
4 Step Creative Process Diagram Template for PowerPoint & Google Slides
Infographics
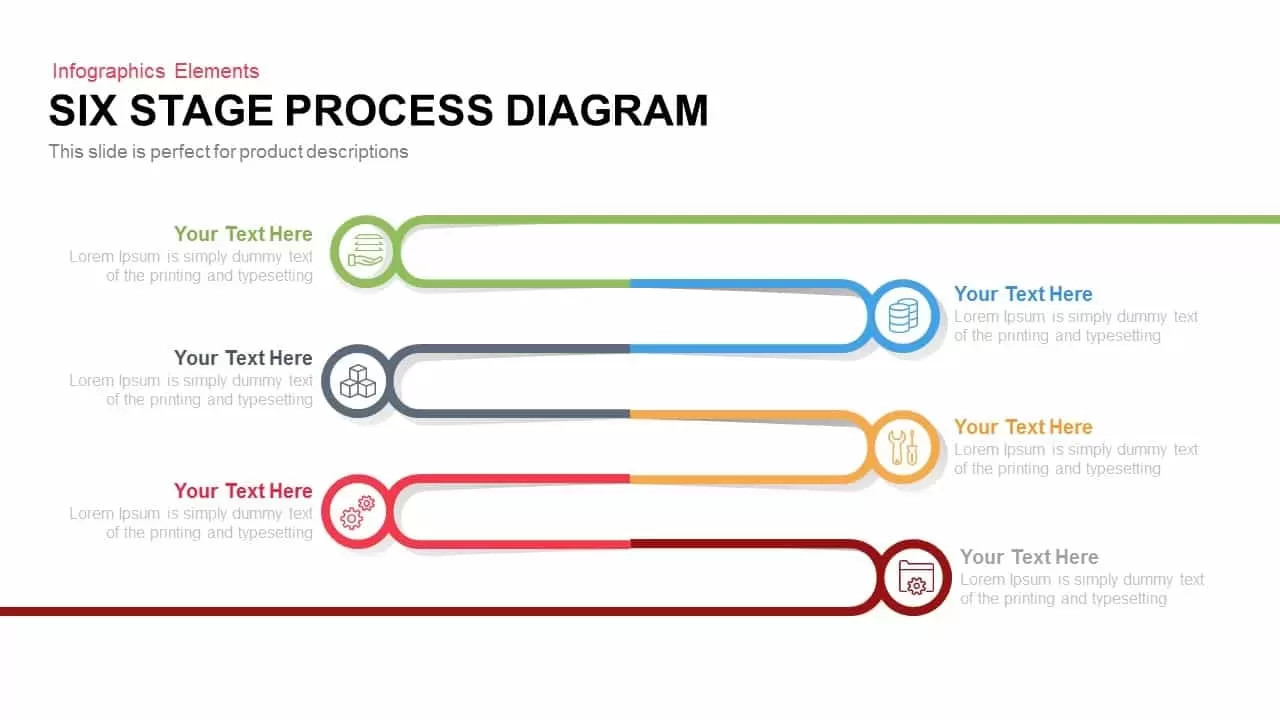
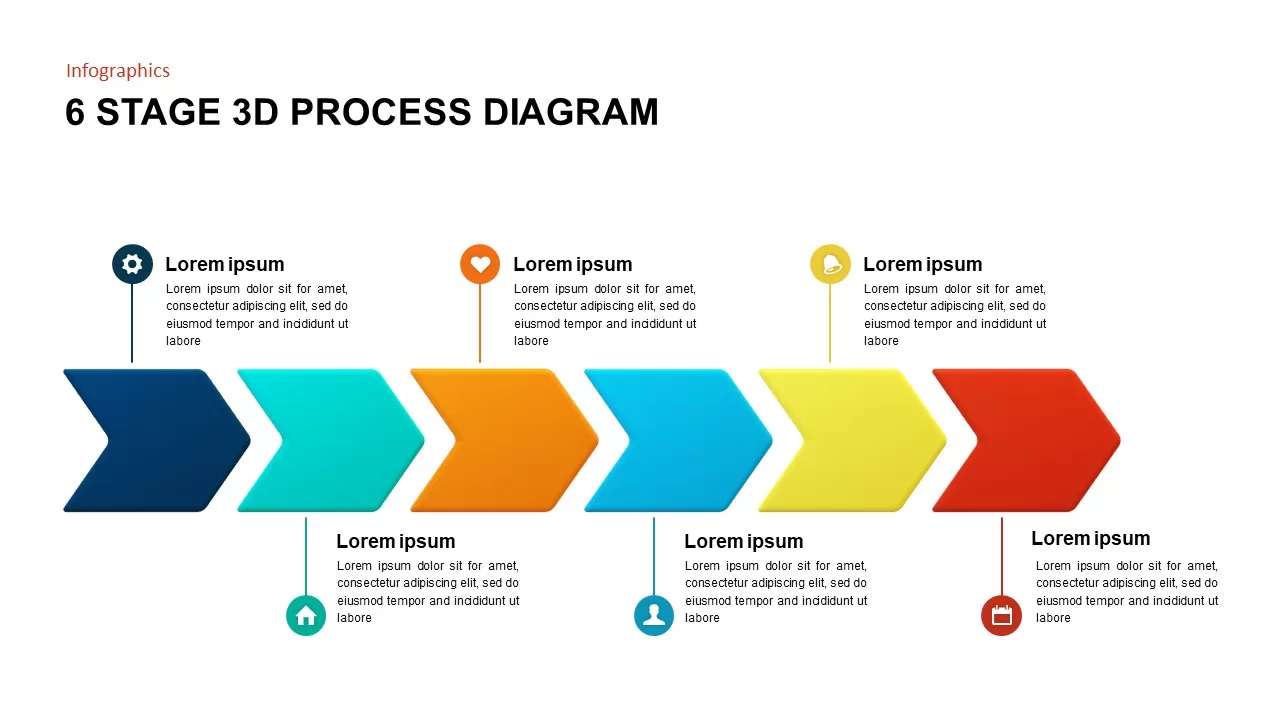
6 Stage Process Diagram Infographic Template for PowerPoint & Google Slides
Process
4 Section Pipe Diagram Process Flow Template for PowerPoint & Google Slides
Process
Dynamic Shield Process Flow Diagram template for PowerPoint & Google Slides
Process
Six Arrow Radial Process Diagram template for PowerPoint & Google Slides
Infographics
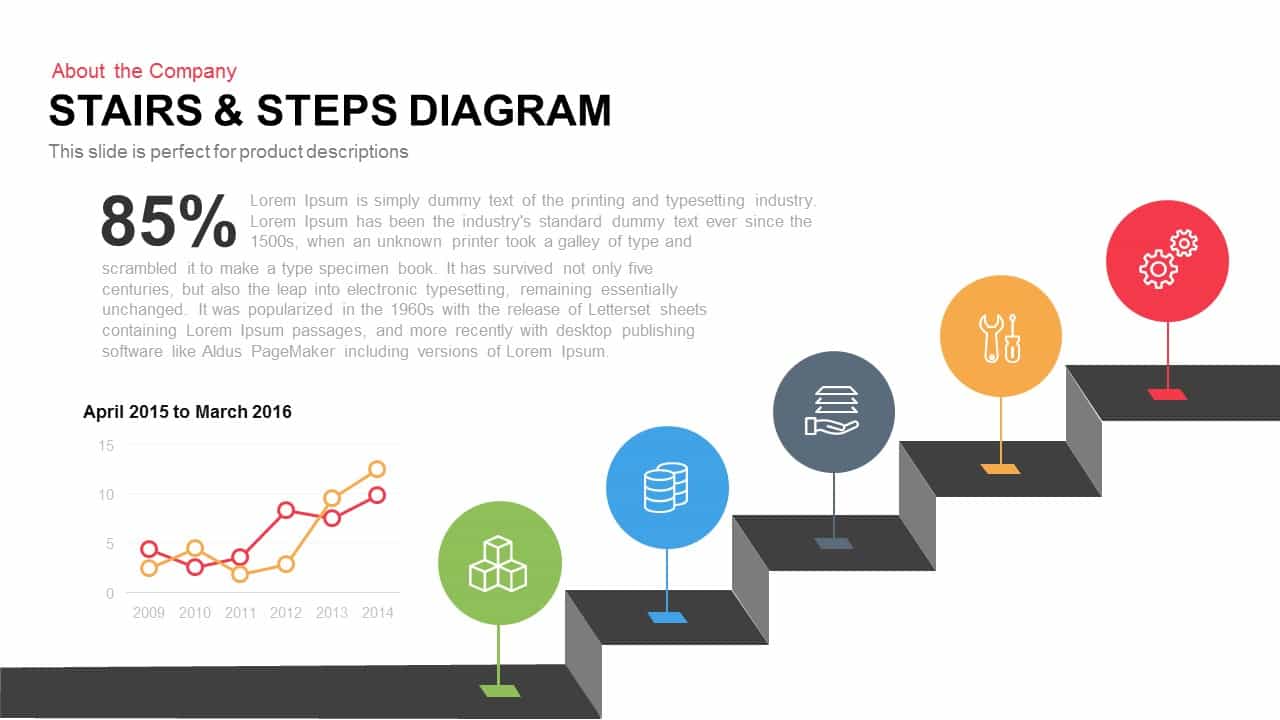
Stairs & Steps Process Diagram template for PowerPoint & Google Slides
Process
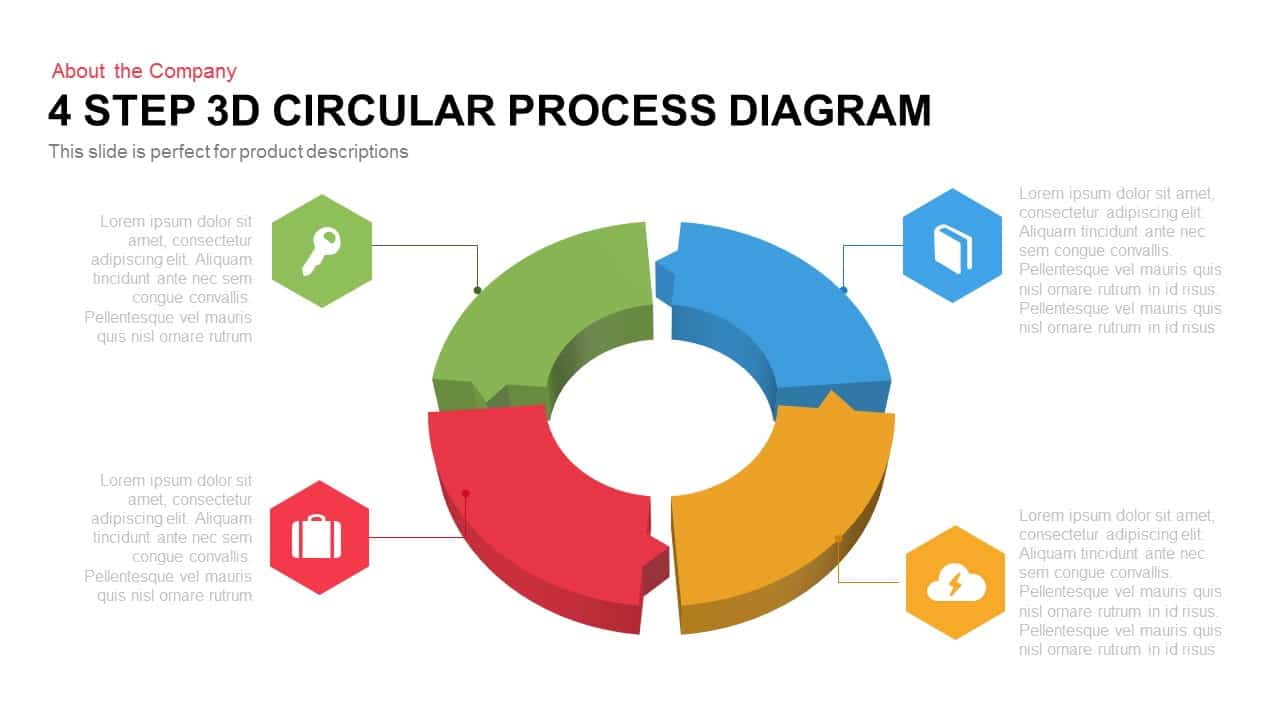
4 Step 3D Circular Process Diagram template for PowerPoint & Google Slides
Process
Three-Section Fishbone Process Diagram template for PowerPoint & Google Slides
Process
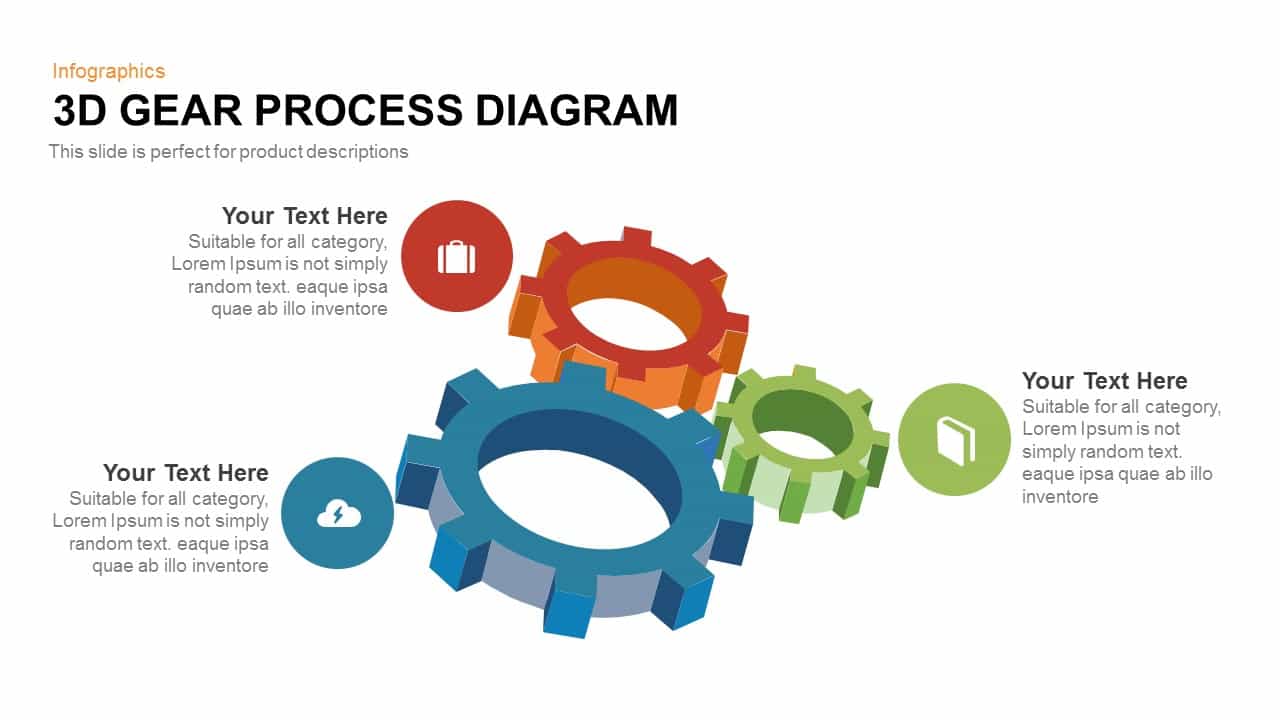
Professional 3D Gear Process Diagram Template for PowerPoint & Google Slides
Process
Arrow Process Diagram Template for PowerPoint & Google Slides
Process
3D Sphere Arrow Process Diagram template for PowerPoint & Google Slides
Arrow

15-Step Process Flow Diagram Template for PowerPoint & Google Slides
Process
3D Shape Linear Process Flow Diagram Template for PowerPoint & Google Slides
Process
Roadmap Six-Step Process Diagram Template for PowerPoint & Google Slides
Roadmap
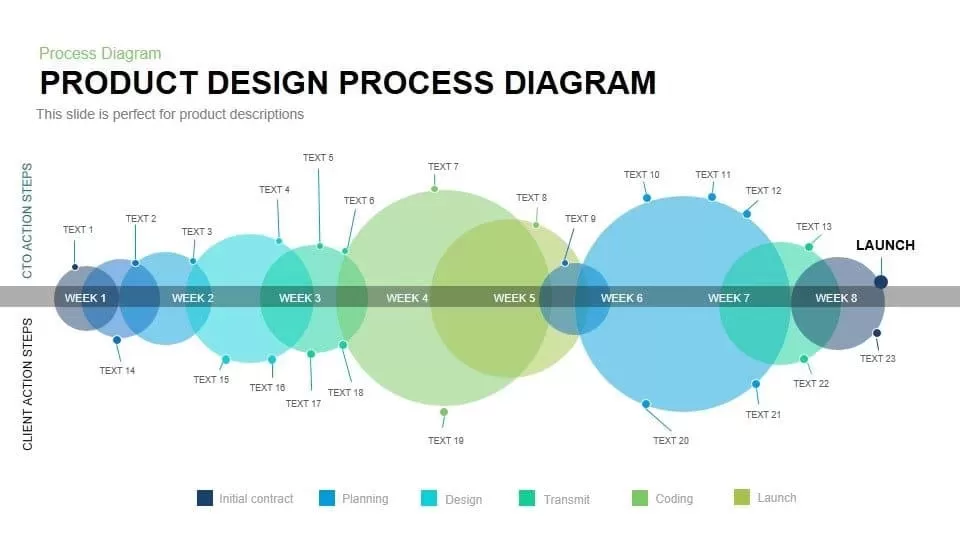
Product Design Process Diagram Template for PowerPoint & Google Slides
Timeline
Four-Circle Venn Process Diagram template for PowerPoint & Google Slides
Process
Linear Process Flow Circles Diagram Template for PowerPoint & Google Slides
Process
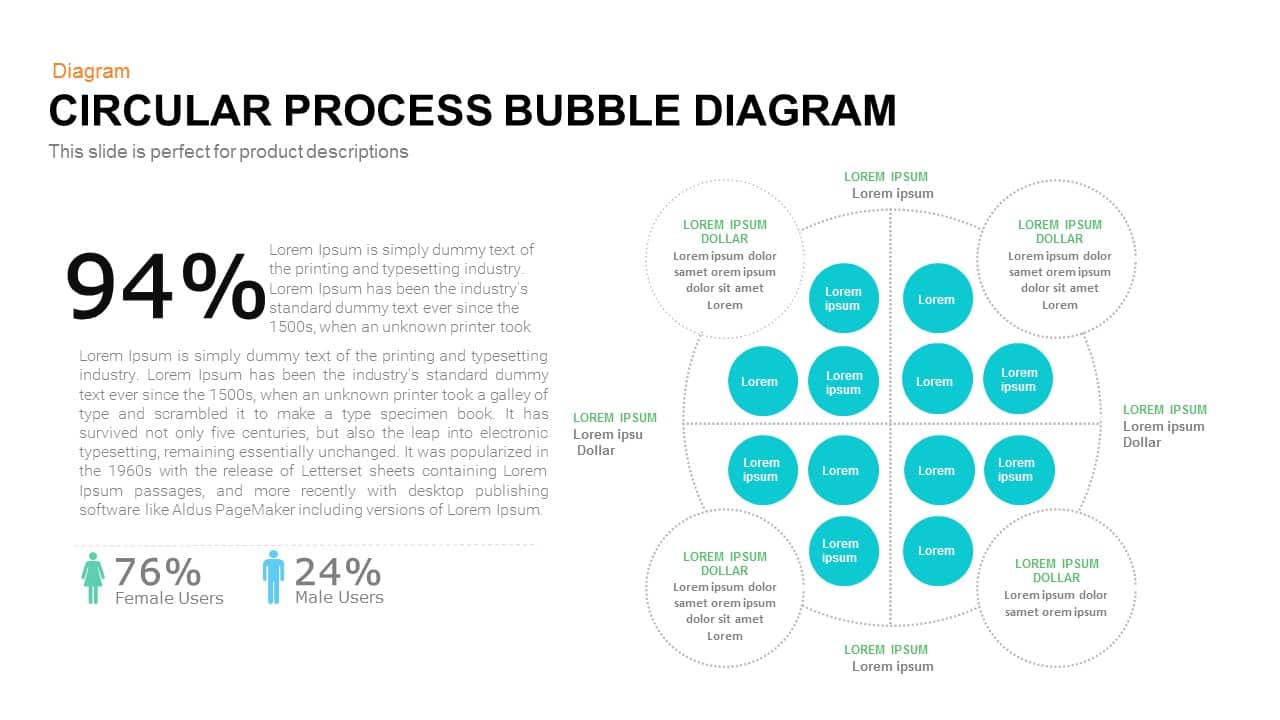
Bubble Circular Process Diagram Template for PowerPoint & Google Slides
Process
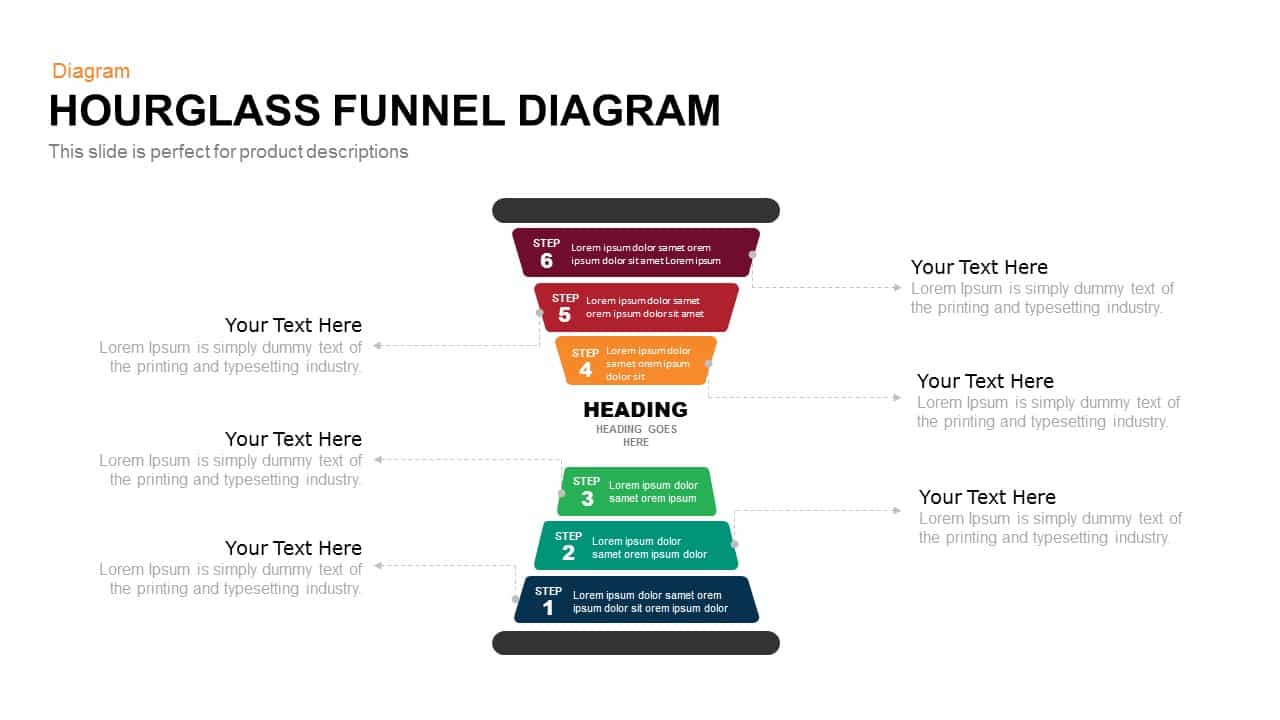
Hourglass Funnel Diagram Process Template for PowerPoint & Google Slides
Funnel
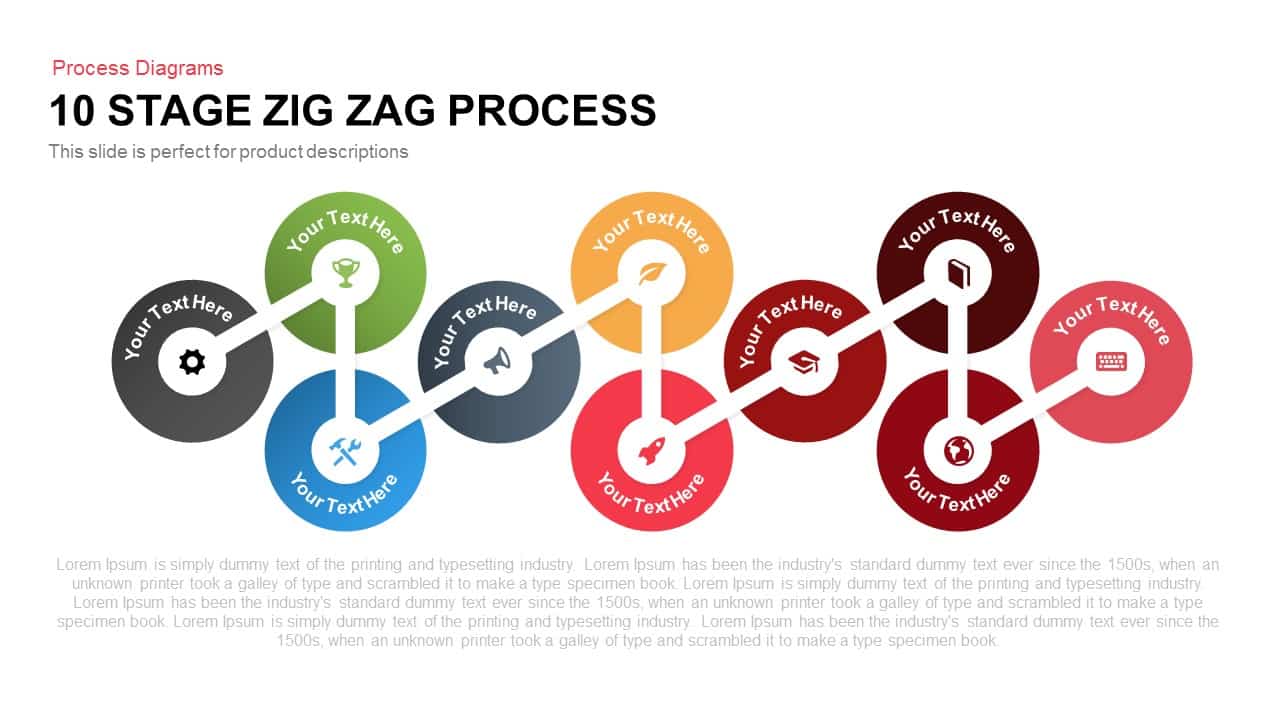
Ten-Stage Zig-Zag Process Diagram Template for PowerPoint & Google Slides
Process
Six-Stage Zig-Zag Process Flow Diagram Template for PowerPoint & Google Slides
Process
Process Improvement Metaphor Diagram Template for PowerPoint & Google Slides
Process
Vertical Business Process Flow Diagram Template for PowerPoint & Google Slides
Process
Engaging Five-Stage Process Diagram Template for PowerPoint & Google Slides
Process
Circular Improvement Process Diagram Template for PowerPoint & Google Slides
Process
8 Steps Arrow Process Diagram template for PowerPoint & Google Slides
Process
Five Stage Process Diagram template for PowerPoint & Google Slides
Process
Free

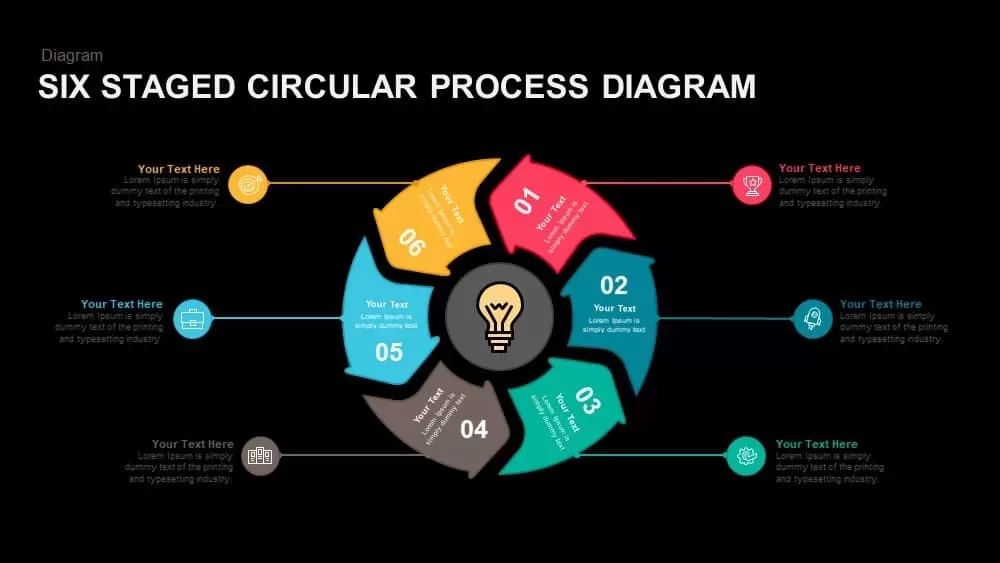
Six-Stage Circular Process Diagram Template for PowerPoint & Google Slides
Process
Five-Stage Cyclic Process Arrow Diagram Template for PowerPoint & Google Slides
Process
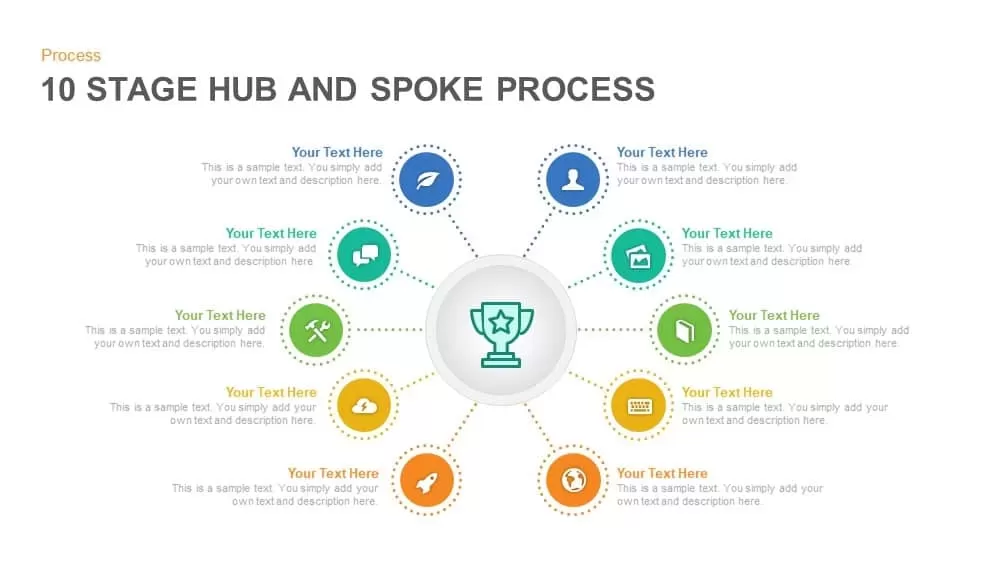
Ten-Stage Hub and Spoke Process Diagram Template for PowerPoint & Google Slides
Process
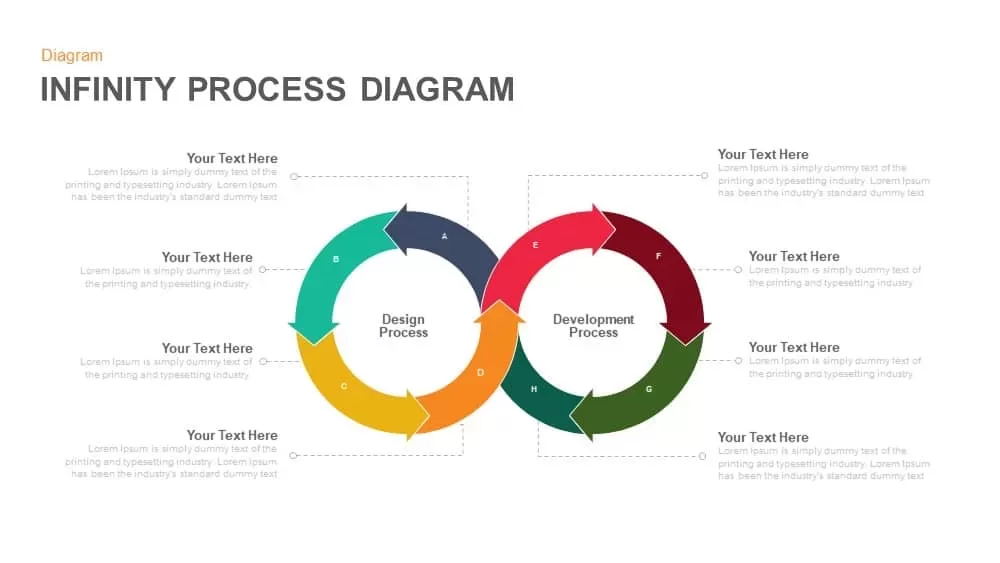
Infinity Process Diagram Template for PowerPoint & Google Slides
Process
12-Stage Zig Zag Process Diagram Template for PowerPoint & Google Slides
Process
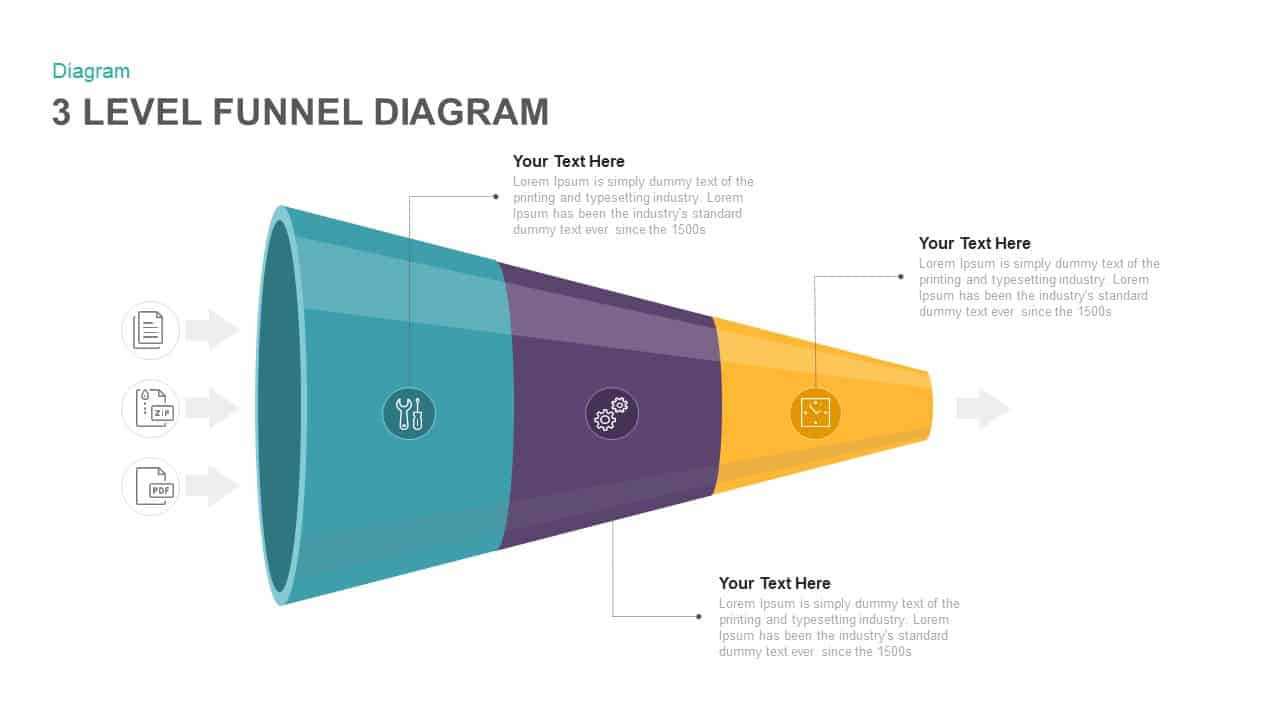
Three Level Funnel Process Diagram Template for PowerPoint & Google Slides
Funnel
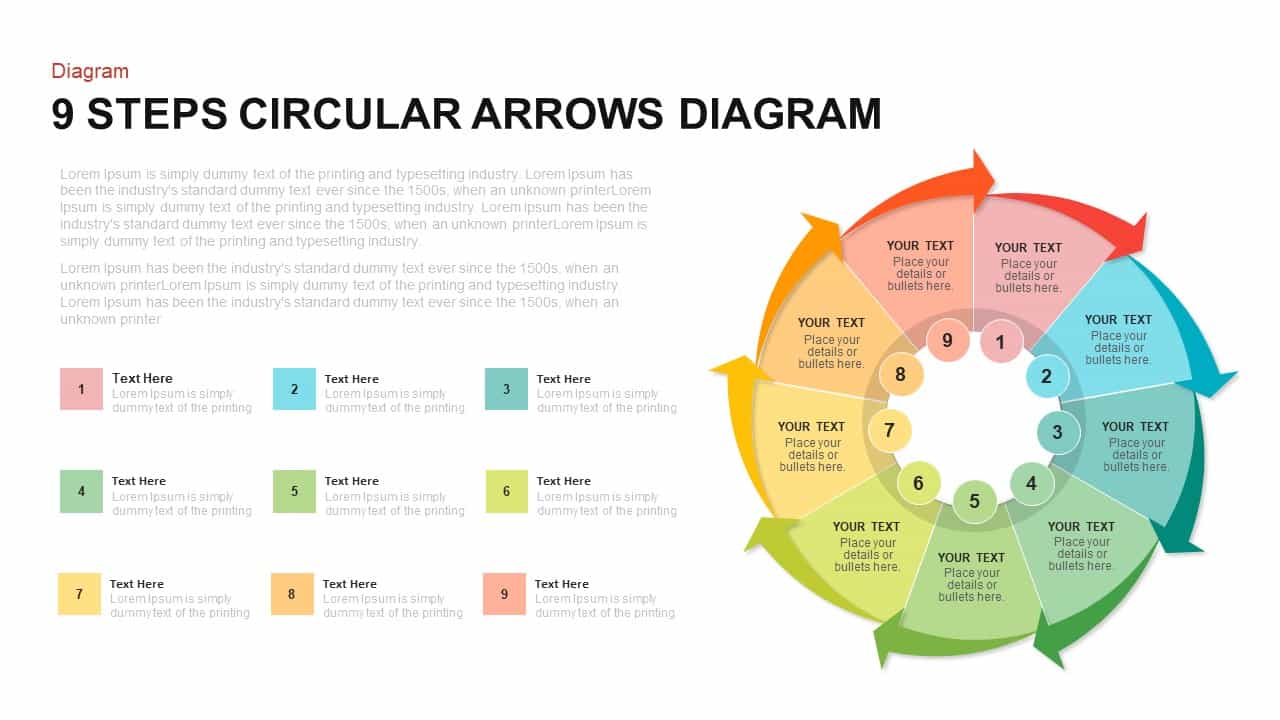
9-Step Circular Arrows Process Diagram Template for PowerPoint & Google Slides
Process
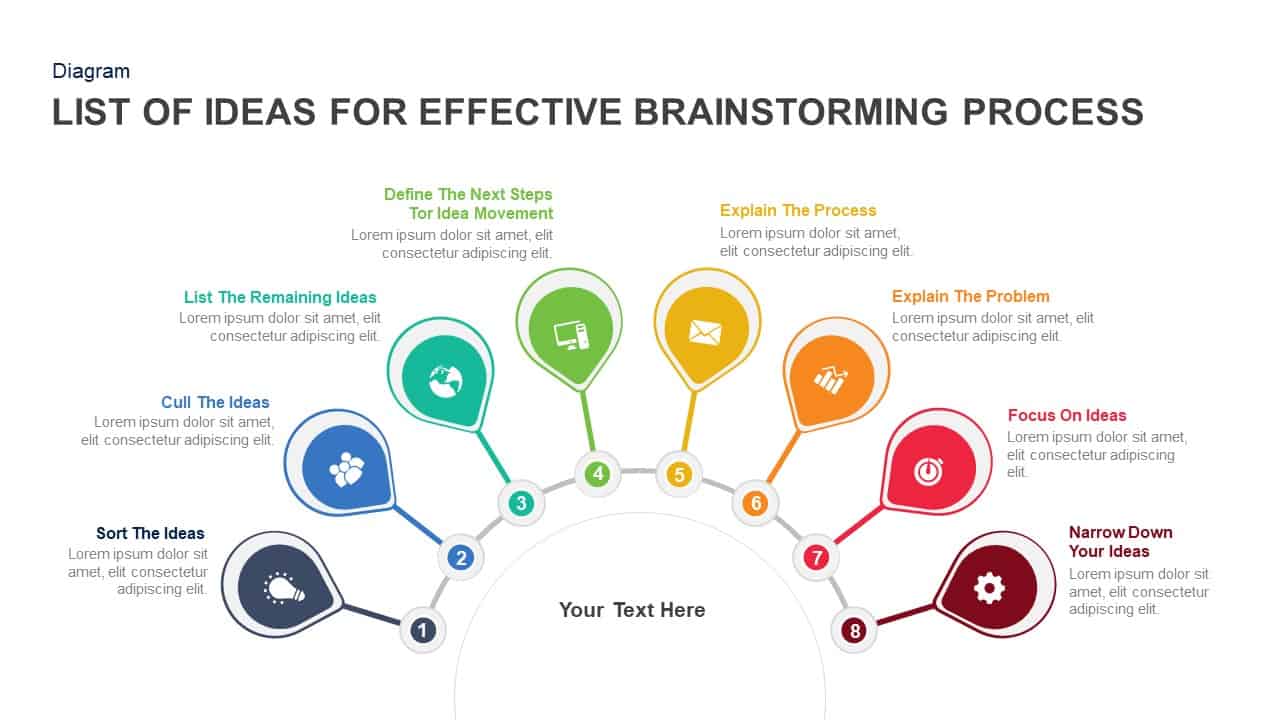
Eight-Step Brainstorming Process Diagram Template for PowerPoint & Google Slides
Process
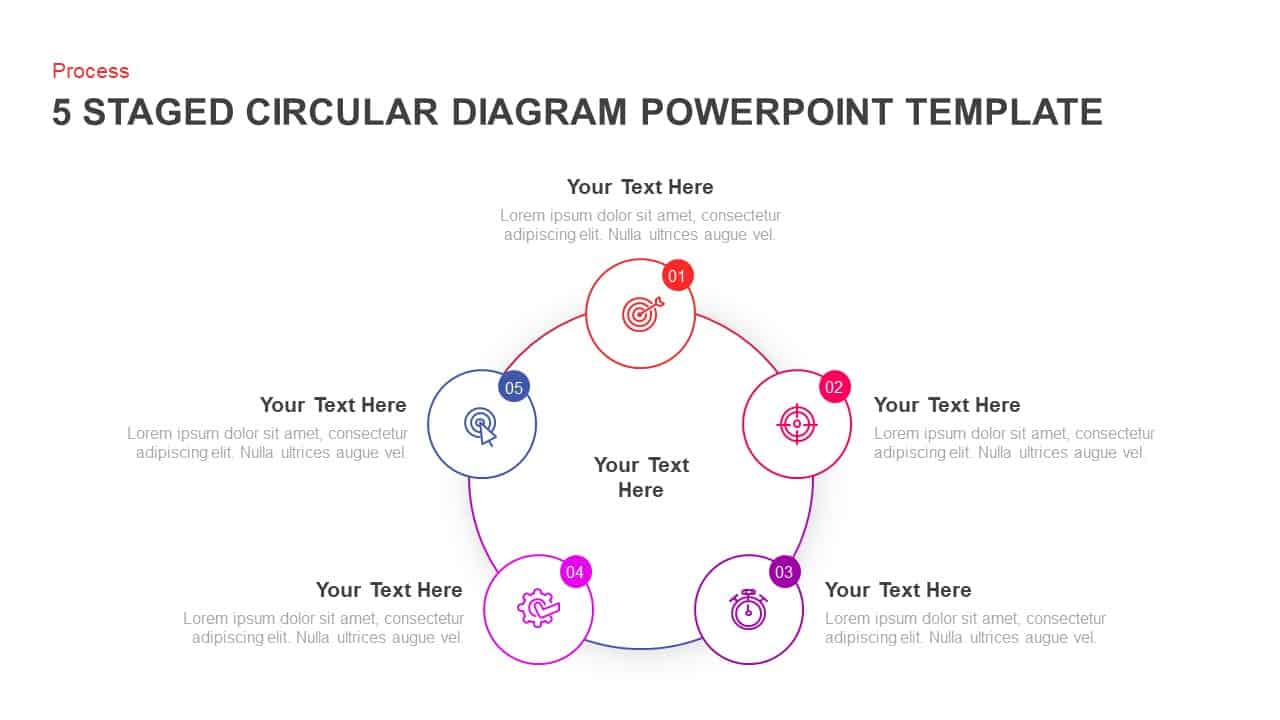
Five-Stage Process Diagram Template for PowerPoint & Google Slides
Process
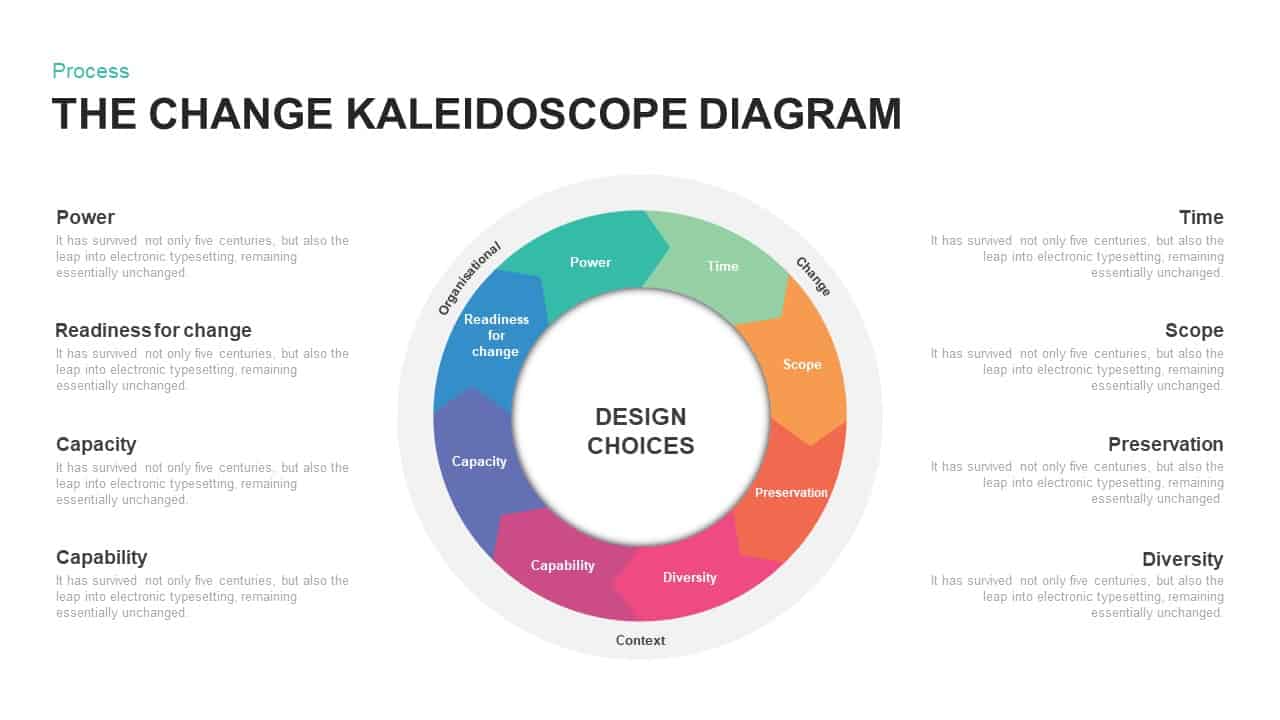
Change Kaleidoscope Process Diagram Template for PowerPoint & Google Slides
Circular
Five Stage Linear Process Flow Diagram Template for PowerPoint & Google Slides
Process
Five-Stage Linear Process Flow Diagram Template for PowerPoint & Google Slides
Process
Five-Stage Circular Process Diagram Template for PowerPoint & Google Slides
Circular
Four-Stage Gear Process Diagram Template for PowerPoint & Google Slides
Process
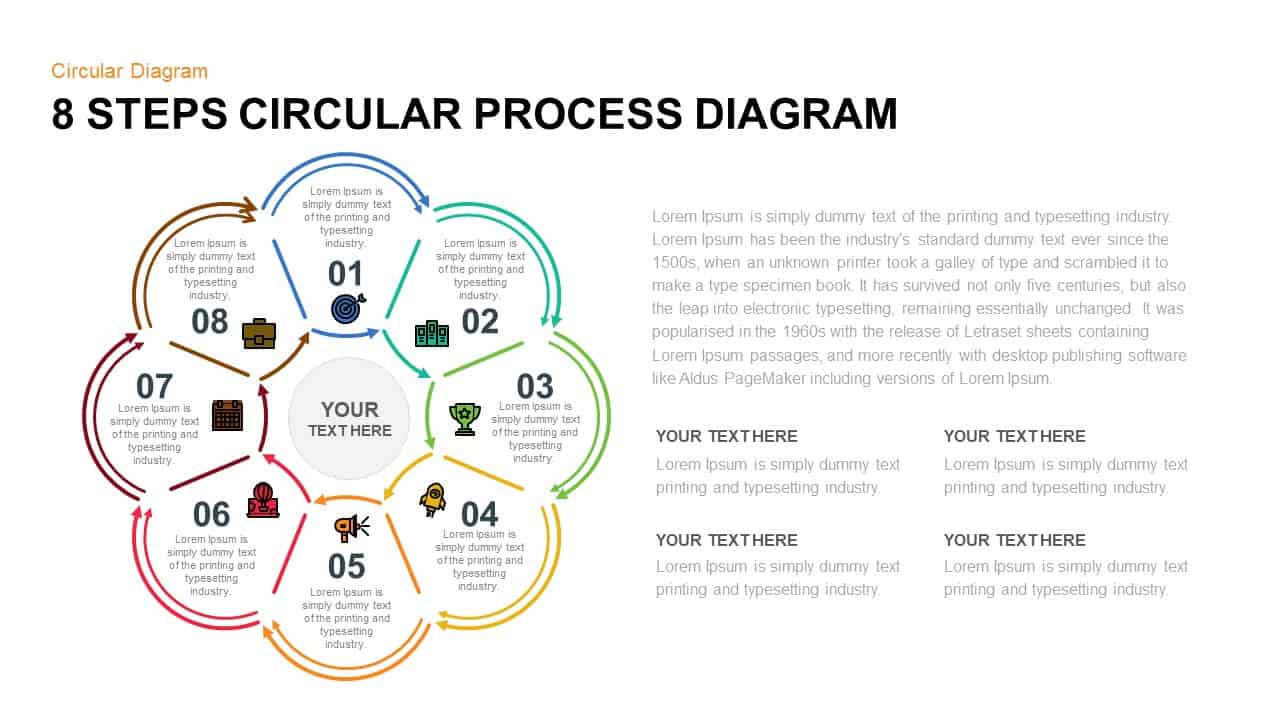
8 Steps Circular Process Diagram Template for PowerPoint & Google Slides
Circular
Four-Stage Cycle Process Diagram Template for PowerPoint & Google Slides
Process
Five-Stage Circular Process Flow Diagram Template for PowerPoint & Google Slides
Circular
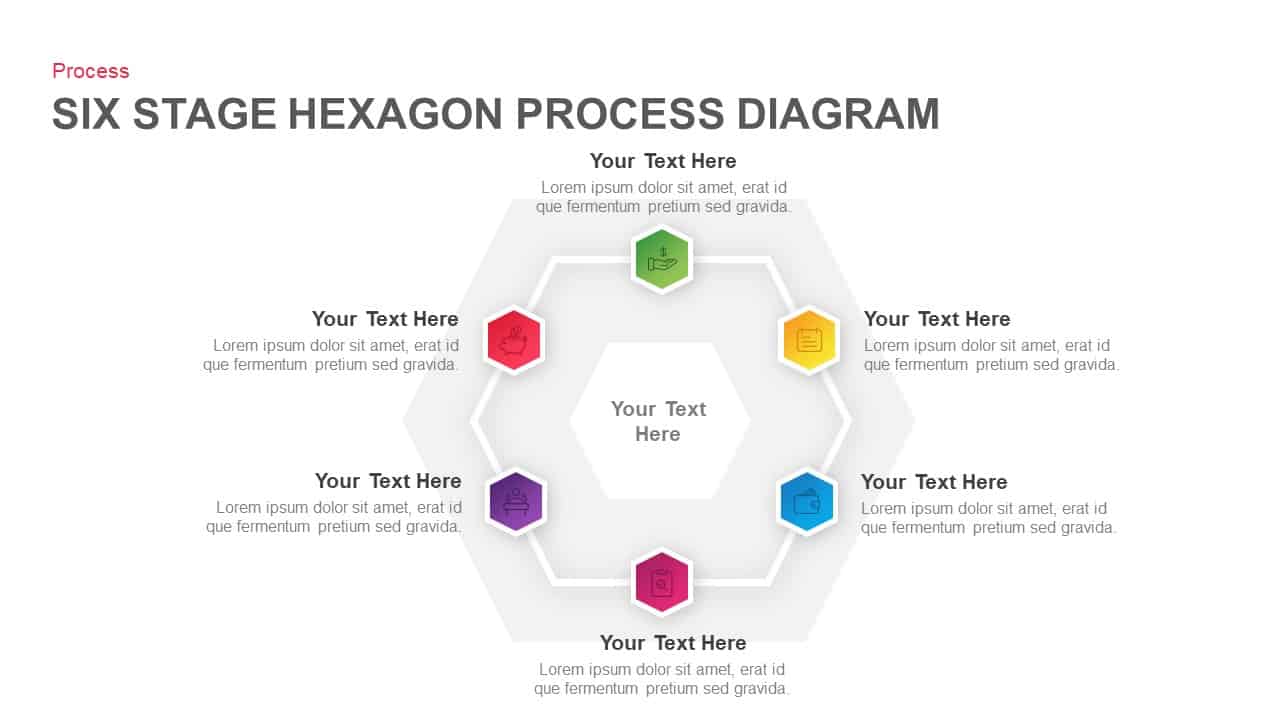
Six Stage Hexagon Process Diagram Template for PowerPoint & Google Slides
Process
5-Stage Gear Process Flow Diagram Template for PowerPoint & Google Slides
Process
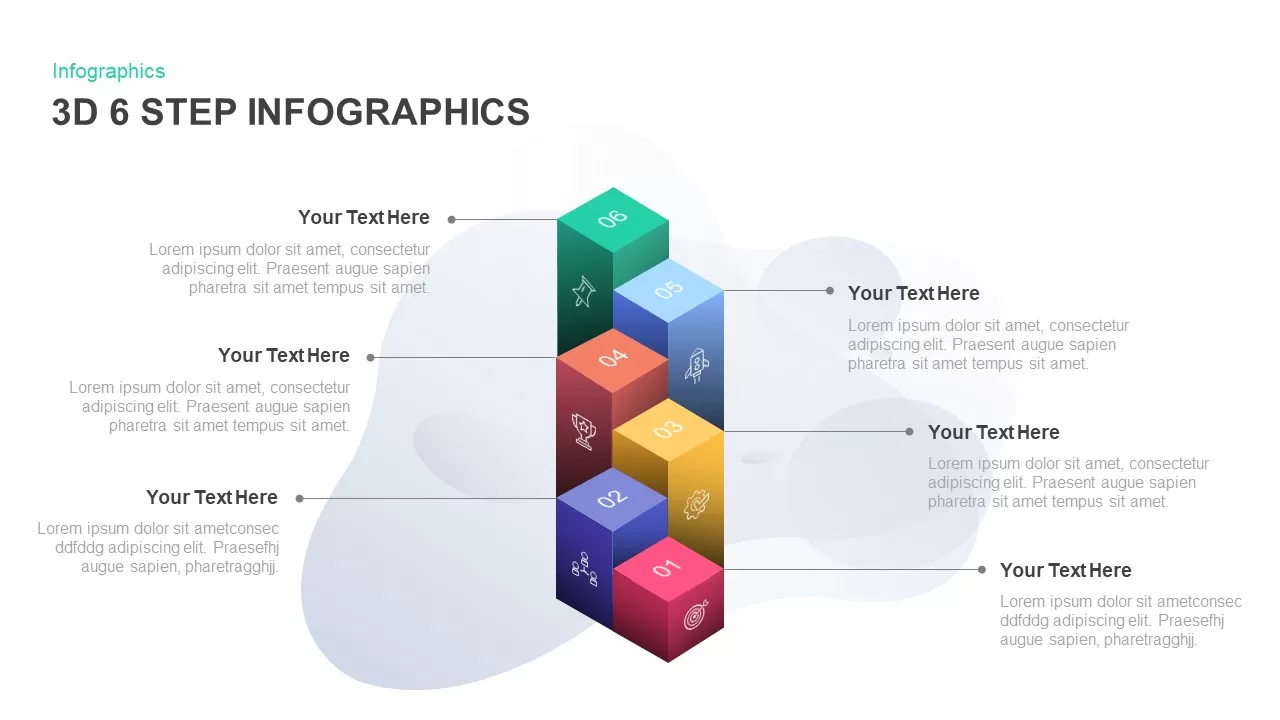
3D 6-Step Infographics Process Diagram Template for PowerPoint & Google Slides
Infographics
Four-Stage Linear Process Flow Diagram Template for PowerPoint & Google Slides
Process
5-Stage Linear Process Flow Diagram Template for PowerPoint & Google Slides
Process
Five-Stage Process Flow Diagram Template for PowerPoint & Google Slides
Process
7 Stage Linear Process Flow Diagram Template for PowerPoint & Google Slides
Process
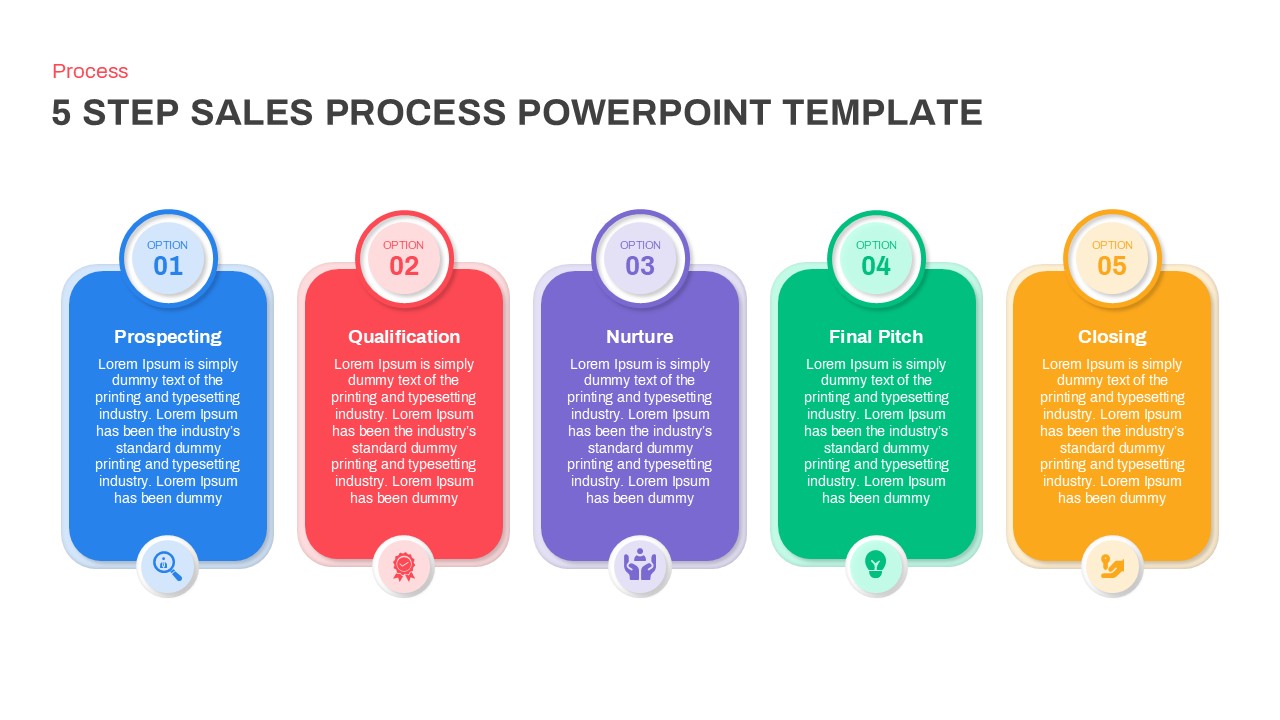
Modern 5-Step Sales Process Diagram Template for PowerPoint & Google Slides
Process
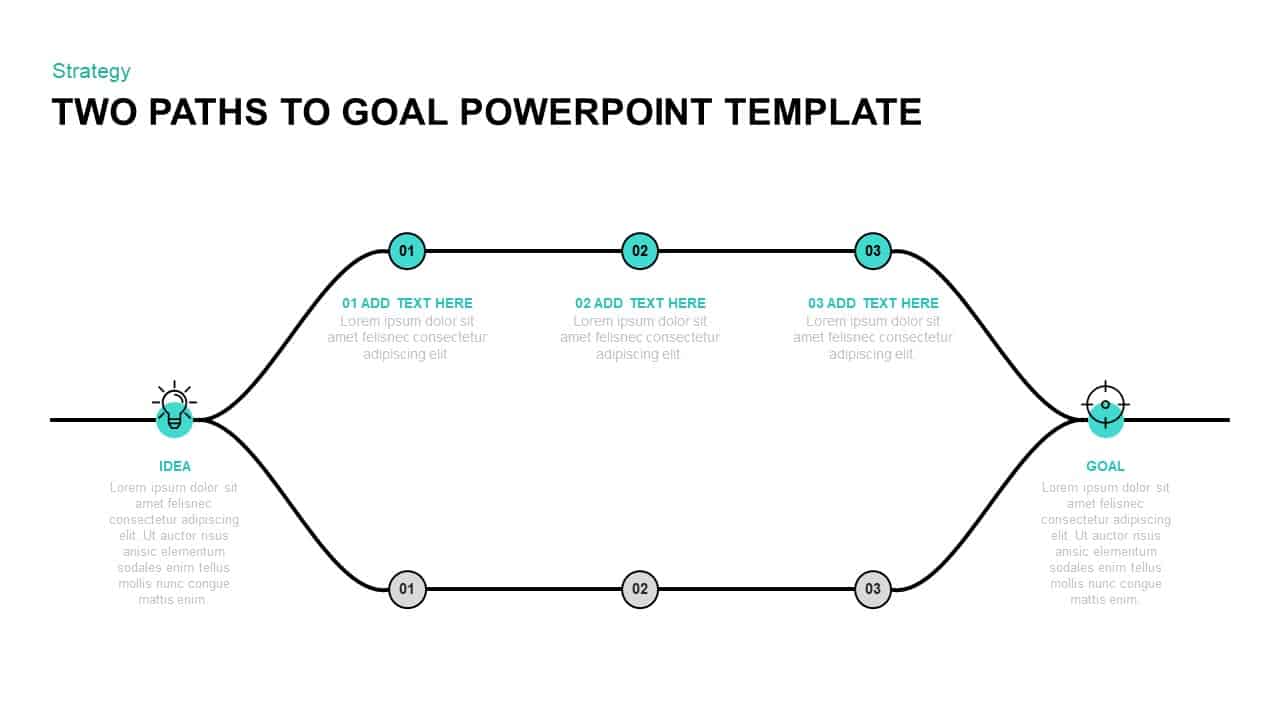
Two-Path Idea-to-Goal Process Diagram Template for PowerPoint & Google Slides
Infographics
6-Step Circular Process Flow Diagram Template for PowerPoint & Google Slides
Process
Three-Stage Loop Process Diagram Template for PowerPoint & Google Slides
Process
4-Stage Linear Process Flow Diagram Template for PowerPoint & Google Slides
Process
4-Step Linear Process Flow Diagram Template for PowerPoint & Google Slides
Process
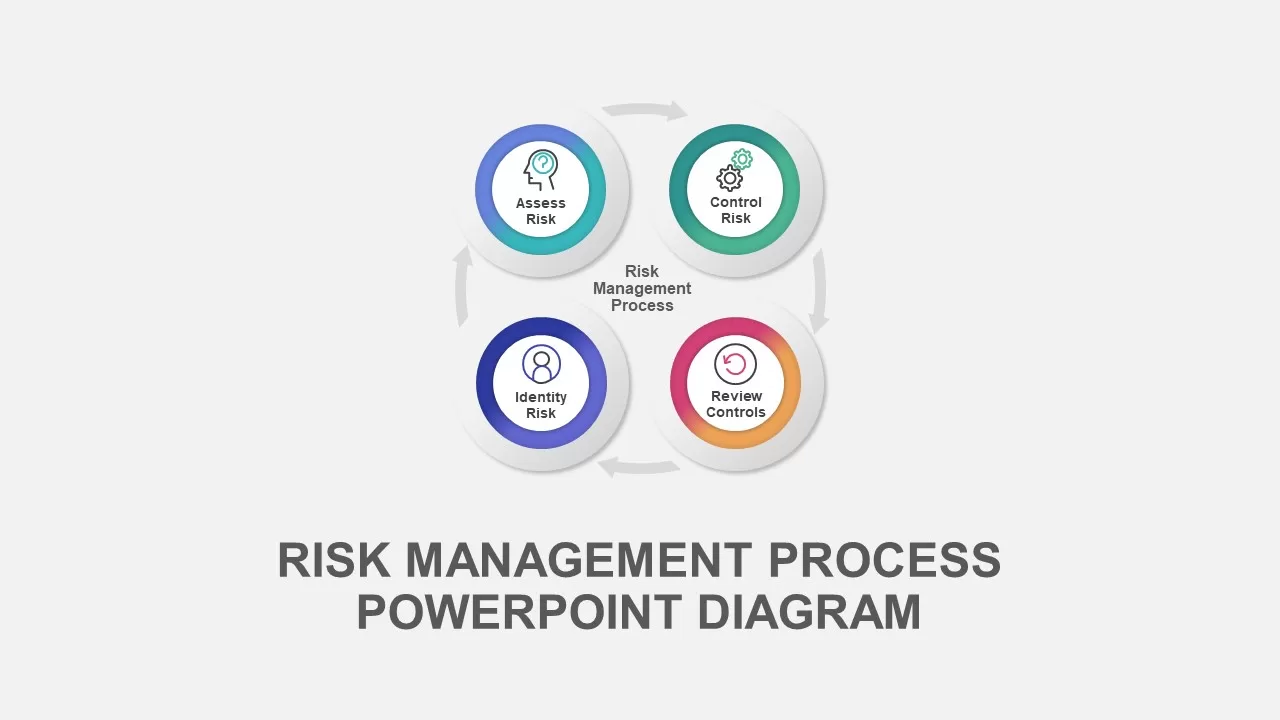
Risk Management Process Diagram Template for PowerPoint & Google Slides
Risk Management
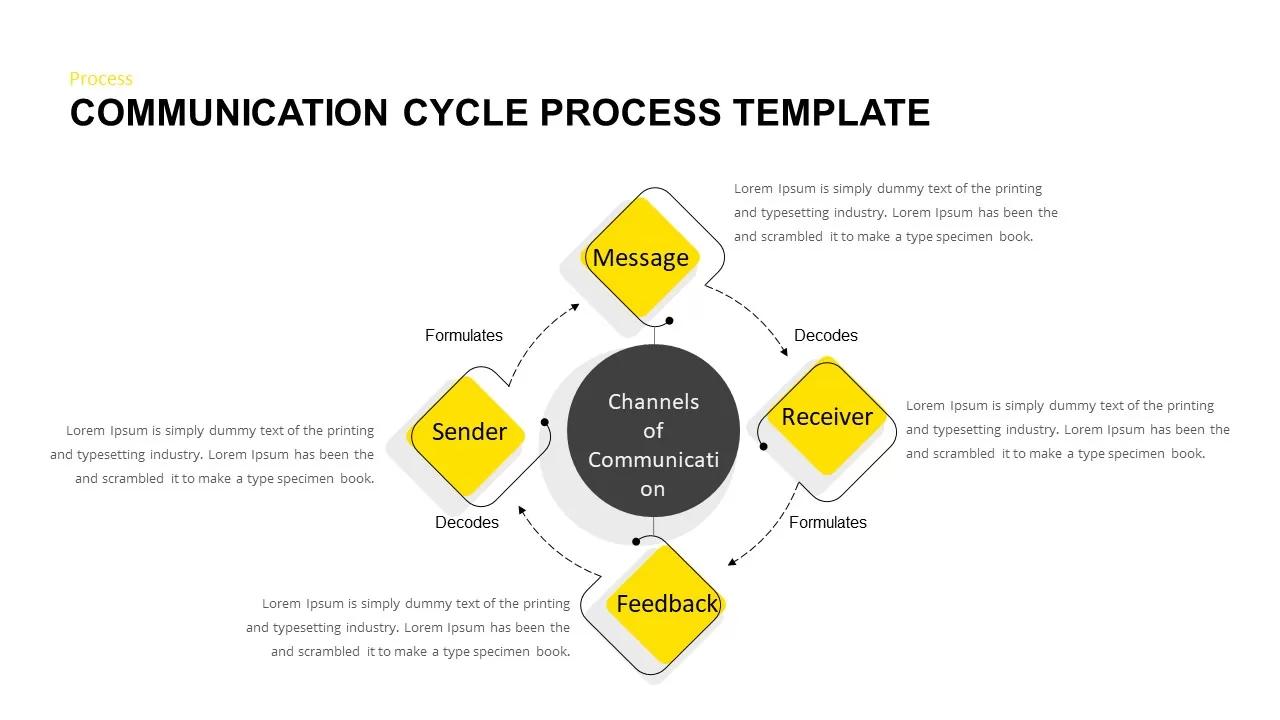
Communication Cycle Process Diagram template for PowerPoint & Google Slides
Business
Fishbone Process Diagram template for PowerPoint & Google Slides
Infographics
Animated Six-Stage 3D Process Diagram Template for PowerPoint & Google Slides
Arrow
Minimal Process Flow Diagram Infographic Template for PowerPoint & Google Slides
Process
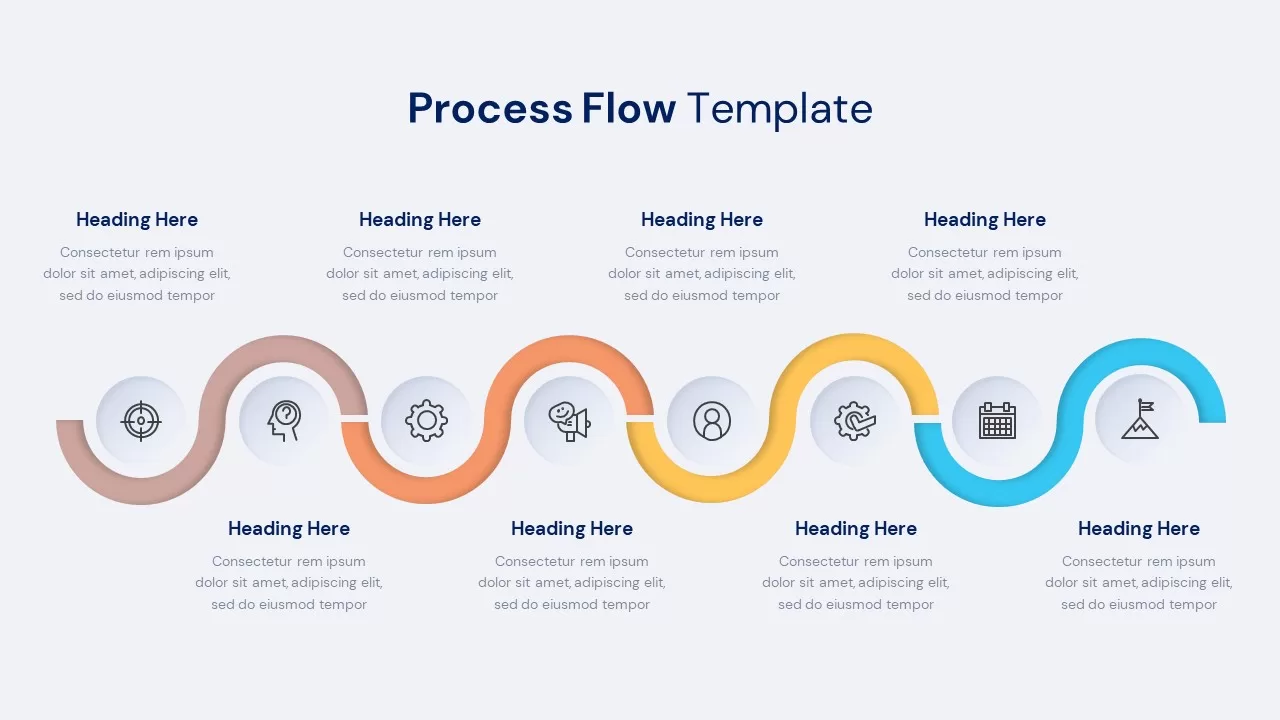
Process Flow Diagram template for PowerPoint & Google Slides
Process
Curved Arrow Process Flow Diagram Template for PowerPoint & Google Slides
Arrow
Circular Arrow Process Diagram Template for PowerPoint & Google Slides
Circular
Chain Link Process Infographic Diagram Template for PowerPoint & Google Slides
Process
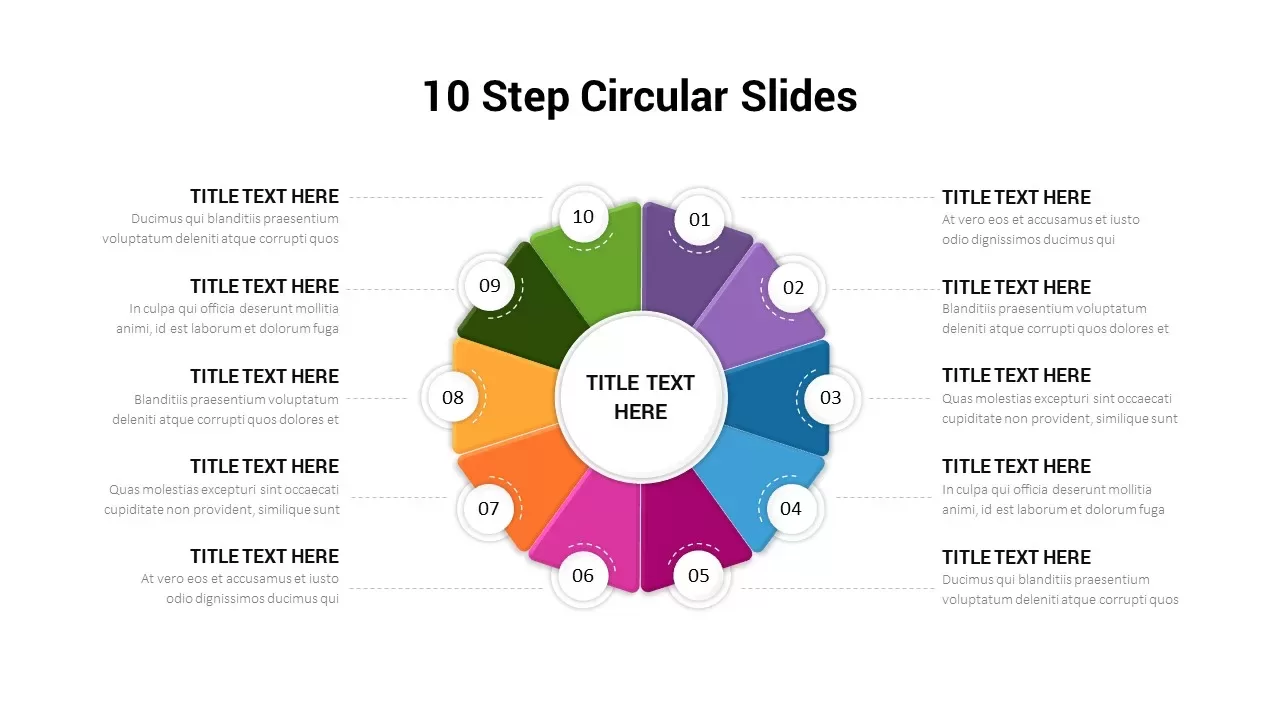
10-Step Circular Process Diagram Template for PowerPoint & Google Slides
Process
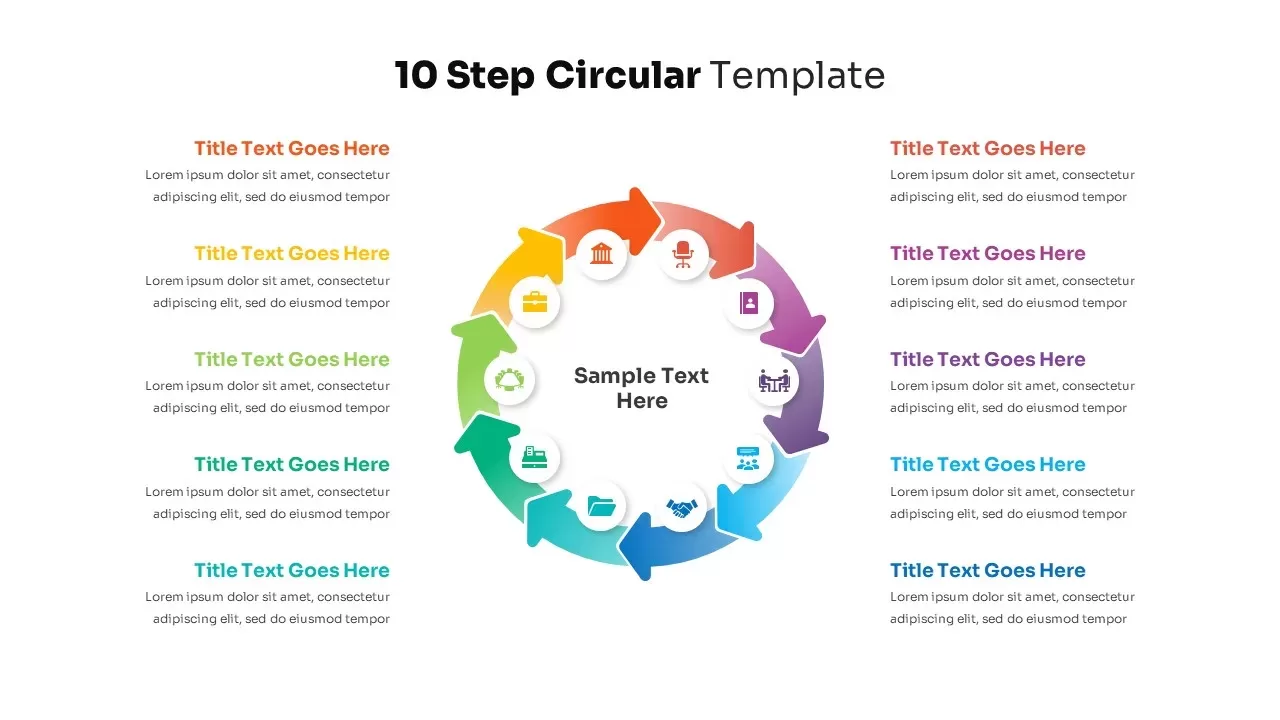
10-Step Circular Process Diagram Template for PowerPoint & Google Slides
Process
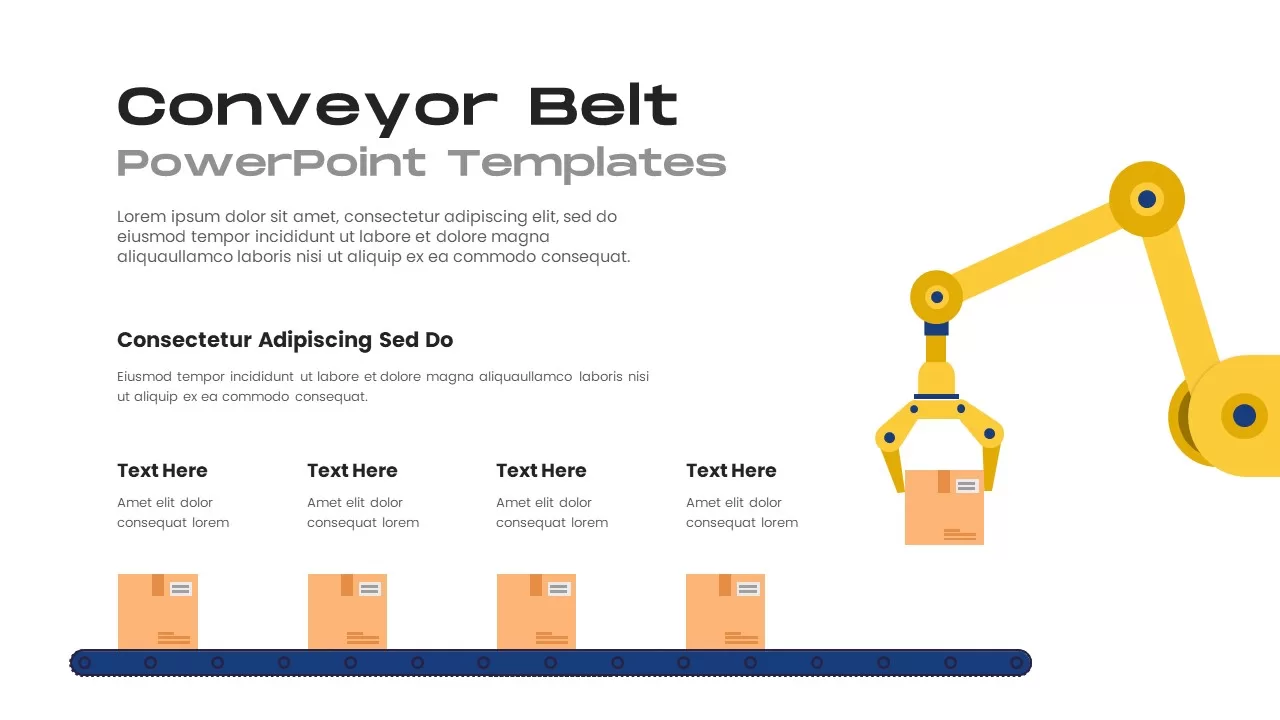
Robotic Conveyor Belt Process Diagram Template for PowerPoint & Google Slides
Process
Pentagon Arrow Process Diagram Template for PowerPoint & Google Slides
Process
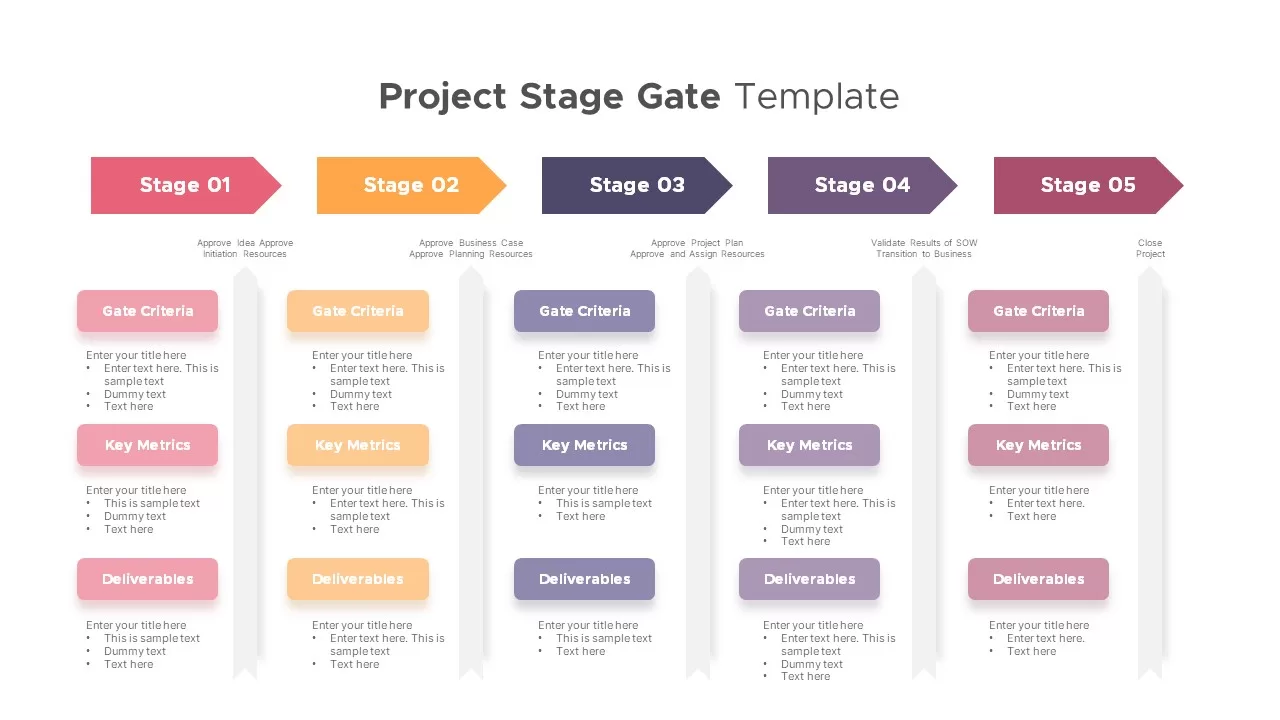
Project Stage Gate Process Diagram Template for PowerPoint & Google Slides
Process
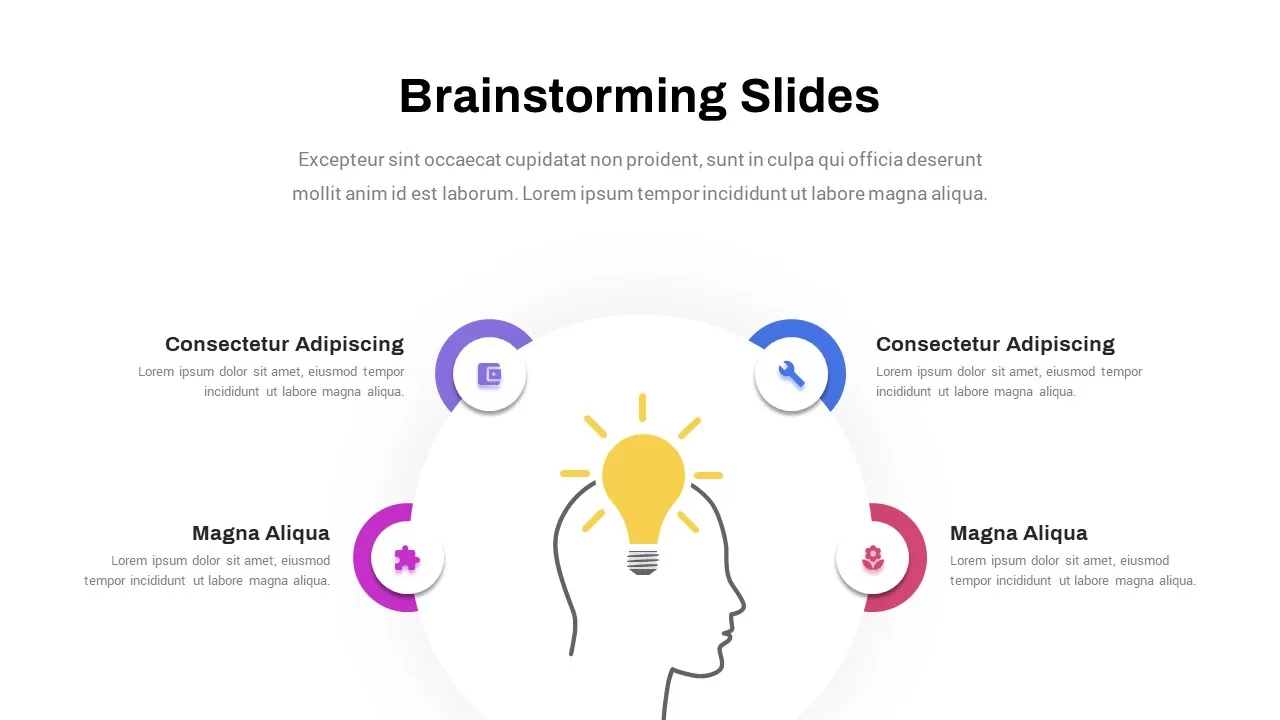
Creative Brainstorming Process Diagram Template for PowerPoint & Google Slides
Process
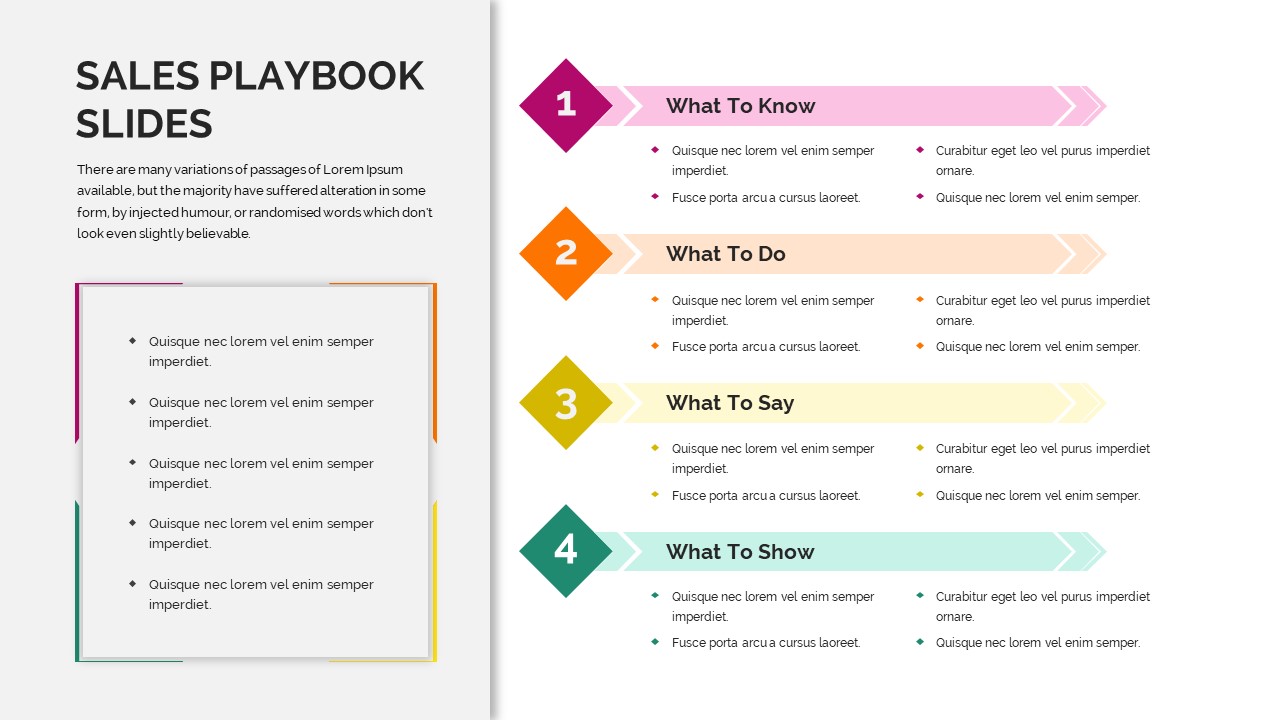
Sales Playbook Process Steps Diagram Template for PowerPoint & Google Slides
Marketing
Gear Process Diagram Template for PowerPoint & Google Slides
Process
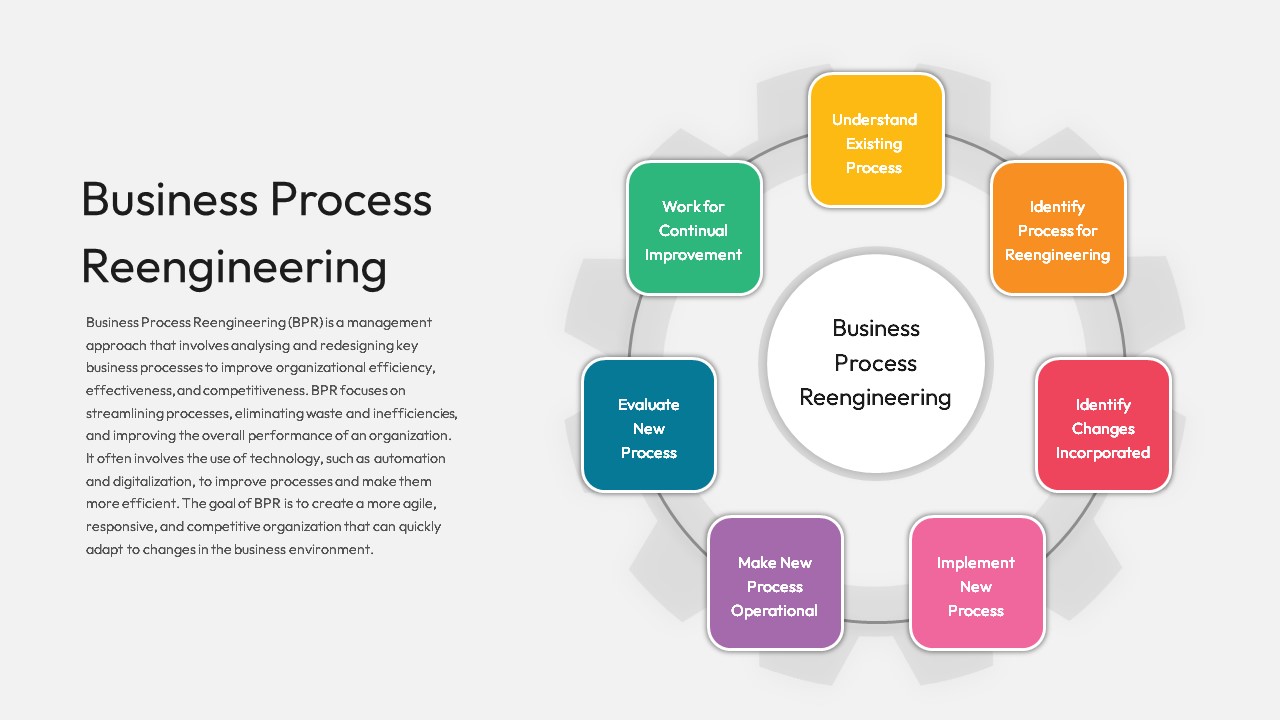
Business Process Reengineering Diagram Template for PowerPoint & Google Slides
Circular
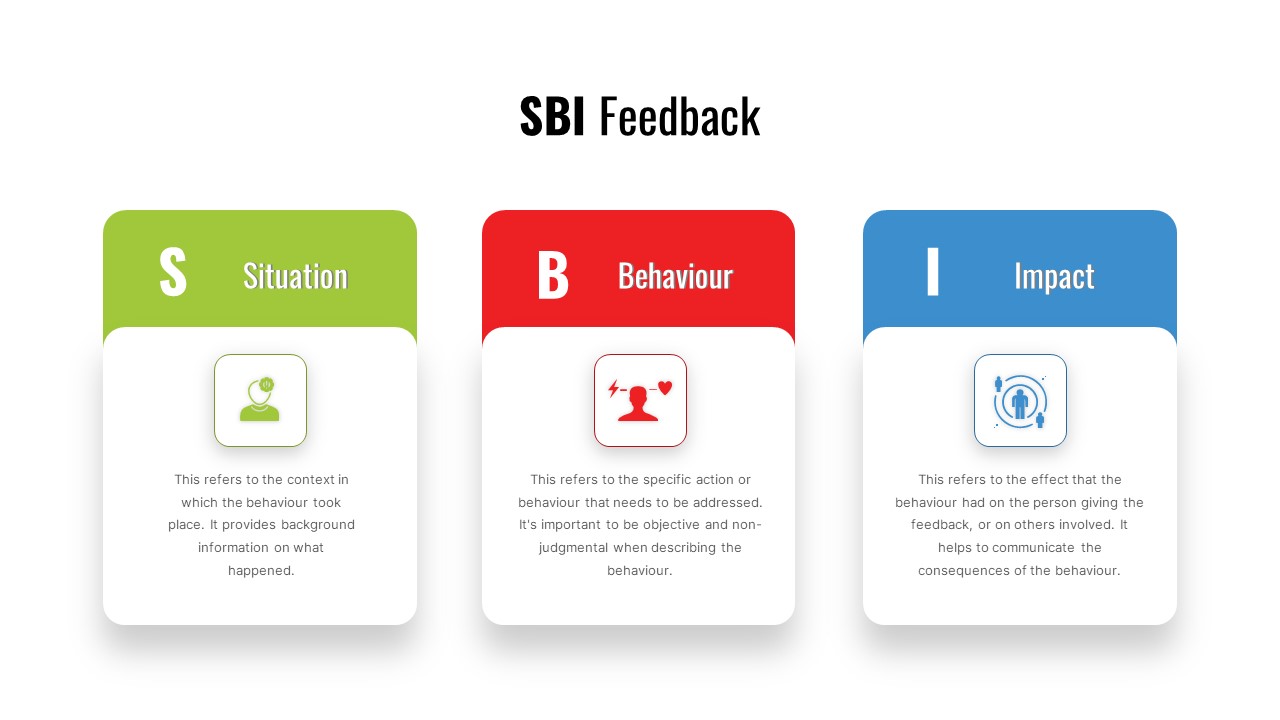
SBI Feedback Model Process Diagram Template for PowerPoint & Google Slides
Process
Simple Flowchart Process Diagram Template for PowerPoint & Google Slides
Flow Charts
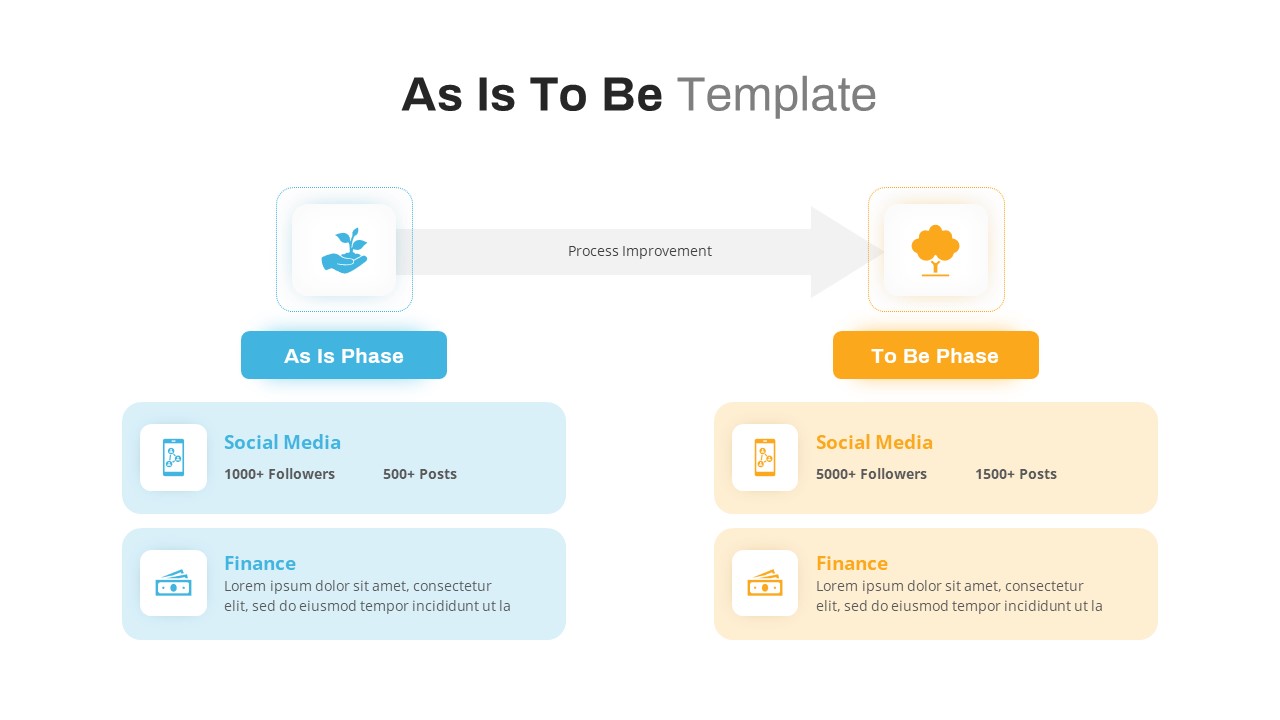
As Is to Be Process Improvement Diagram Template for PowerPoint & Google Slides
Business Strategy
Colorful Snake Process Diagram Template for PowerPoint & Google Slides
Process
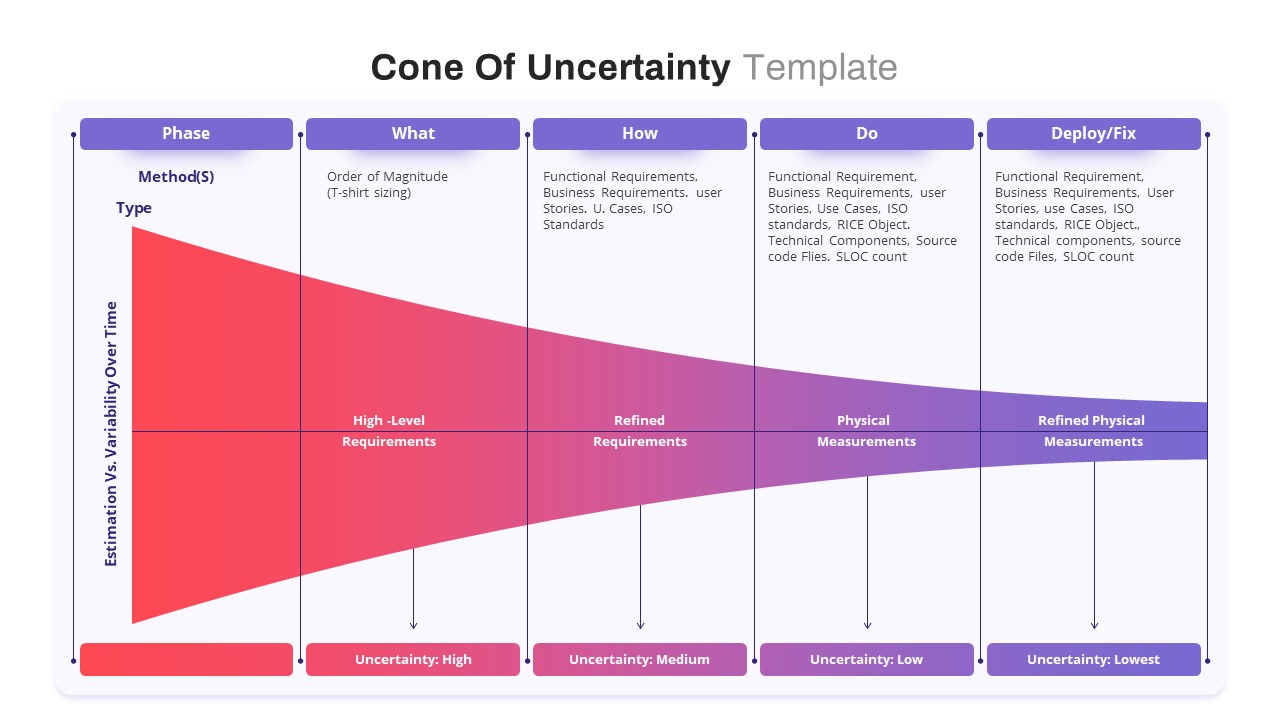
Cone of Uncertainty Process Diagram Template for PowerPoint & Google Slides
Process
Value Creation Framework Process Diagram Template for PowerPoint & Google Slides
Business Plan
Capital Investments Process Flow Diagram Template for PowerPoint & Google Slides
Process
Order to Cash Process Flow Diagram Template for PowerPoint & Google Slides
Process
Bottleneck Process Analysis Diagram Template for PowerPoint & Google Slides
Process
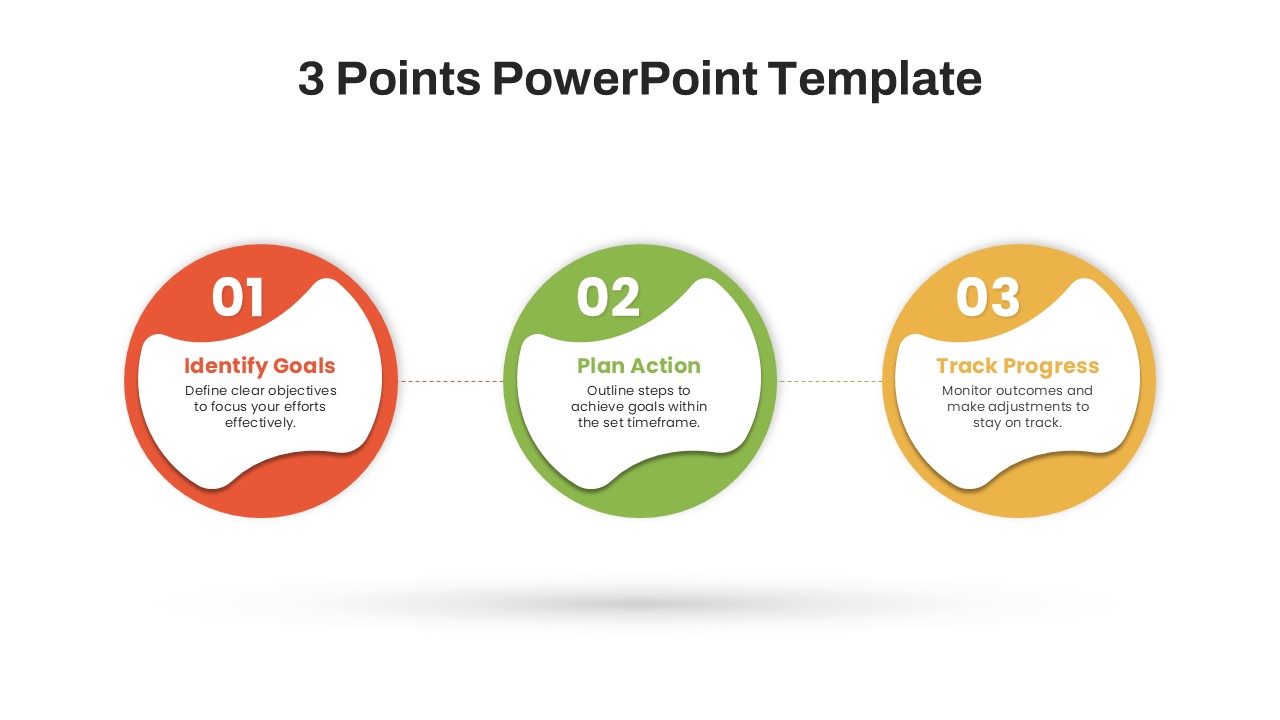
Modern Three-Point Process Diagram Template for PowerPoint & Google Slides
Process
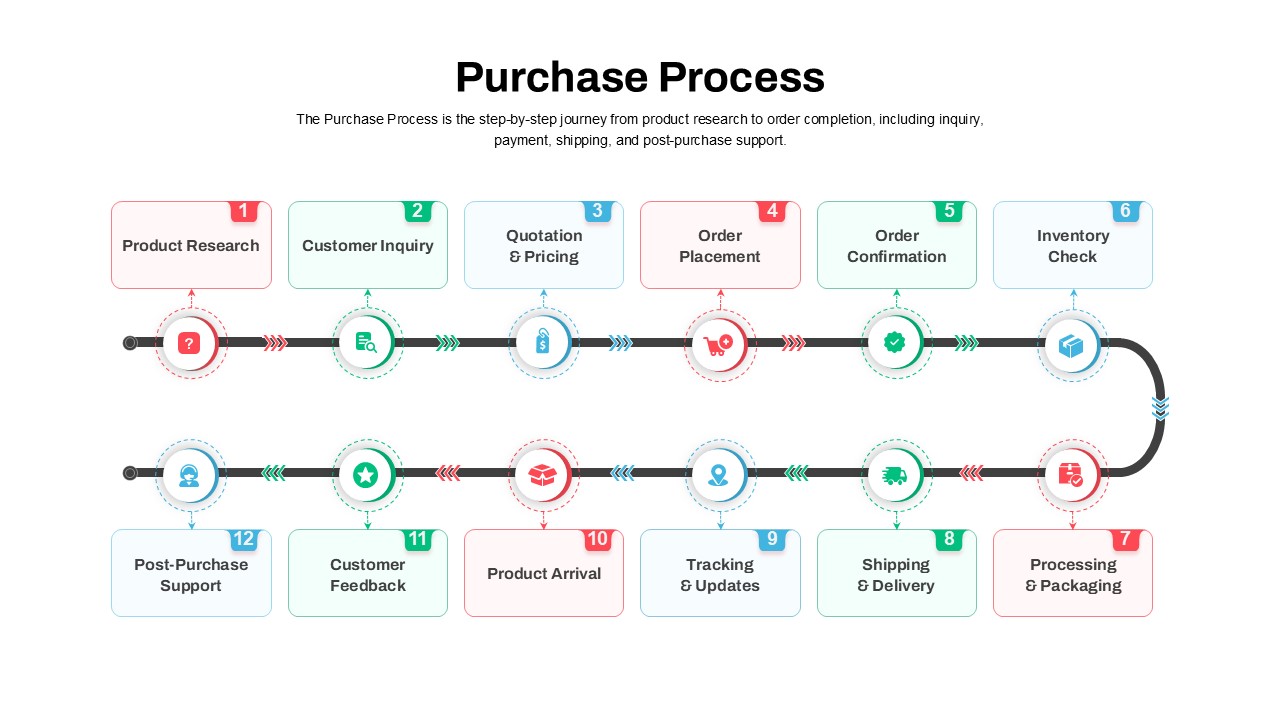
Streamlined Purchase Process Diagram Template for PowerPoint & Google Slides
Timeline
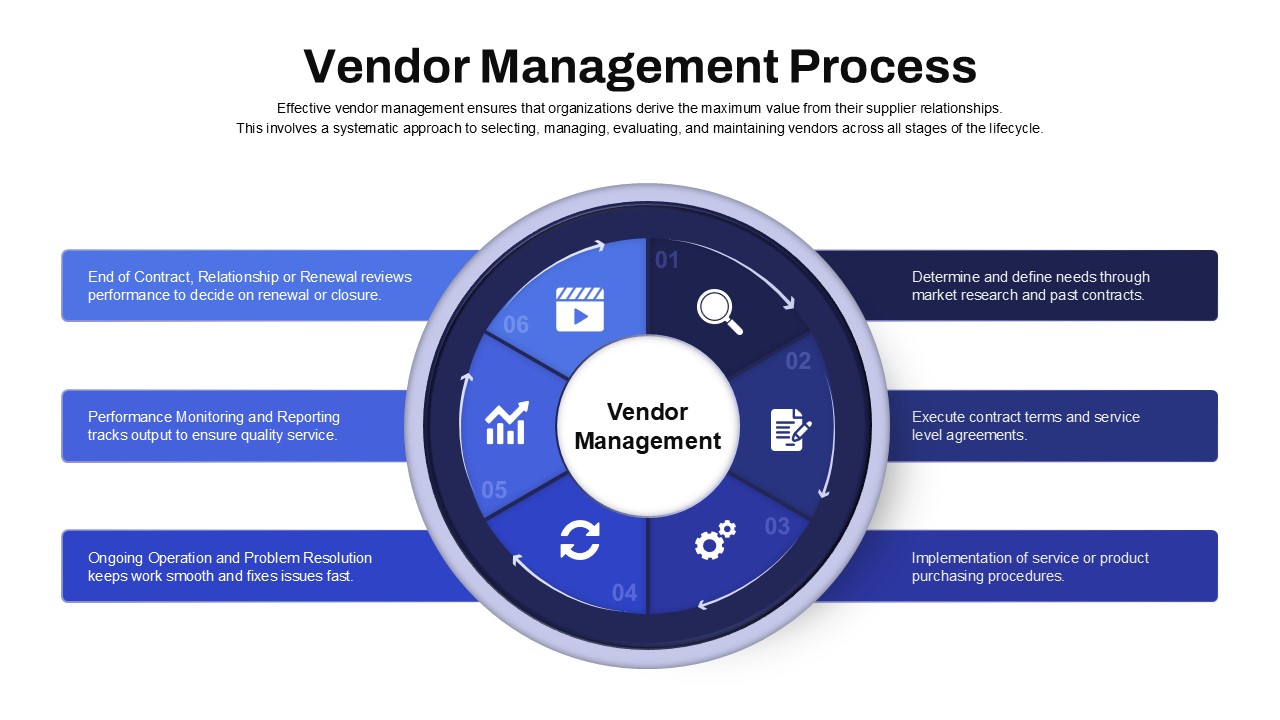
Vendor Management Process Diagram Template for PowerPoint & Google Slides
Process
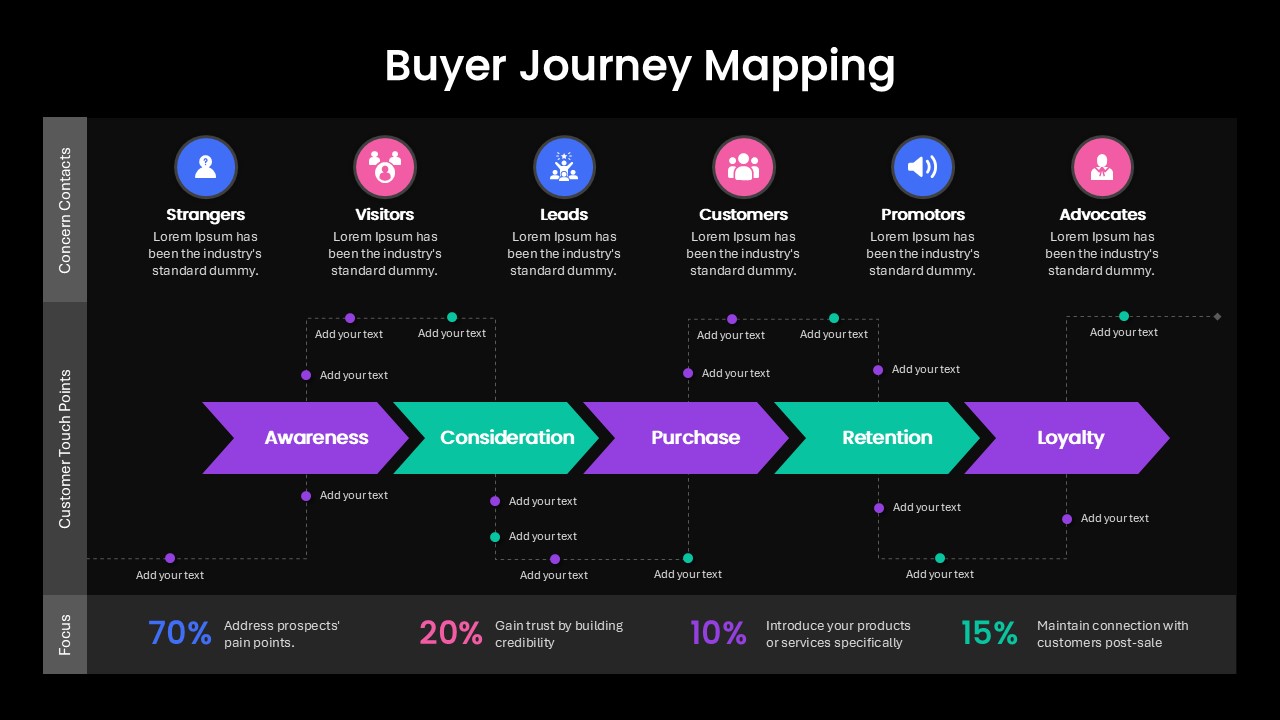
Buyer Journey Mapping Process Diagram Template for PowerPoint & Google Slides
Process
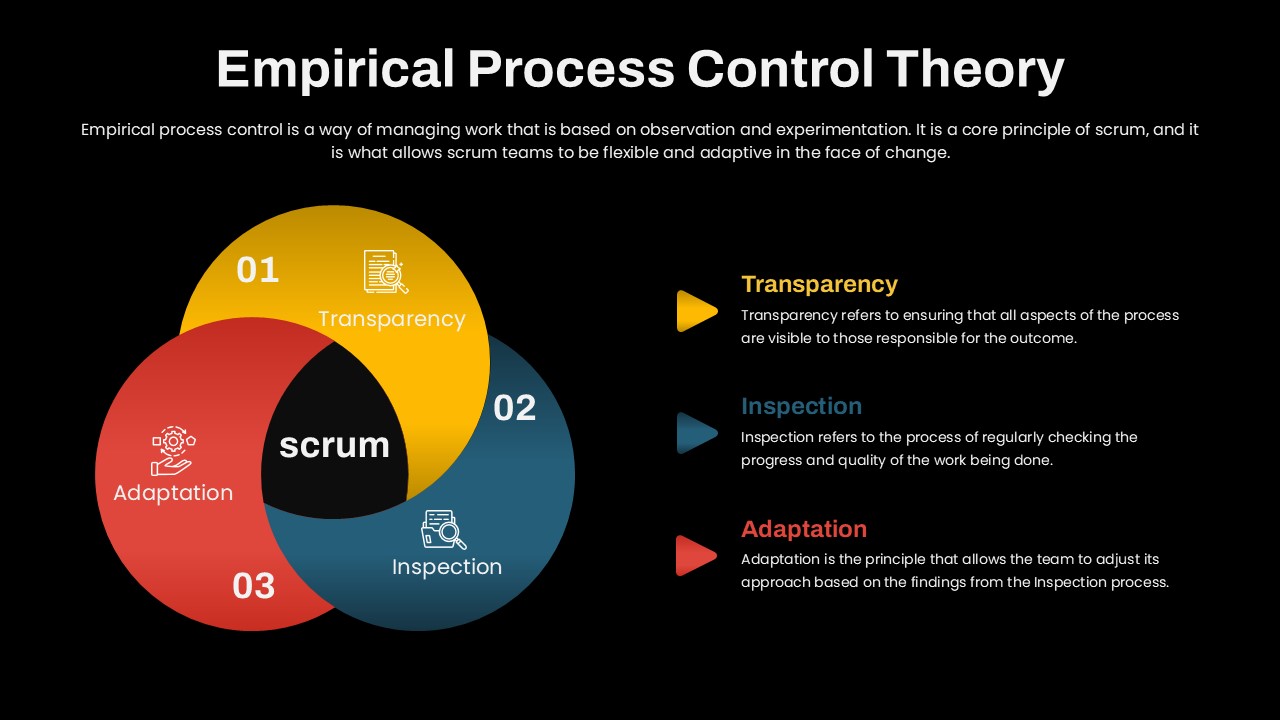
Empirical Process Control Theory Diagram Template for PowerPoint & Google Slides
Circular
Resume Screening Process Flow Diagram Template for PowerPoint & Google Slides
Process
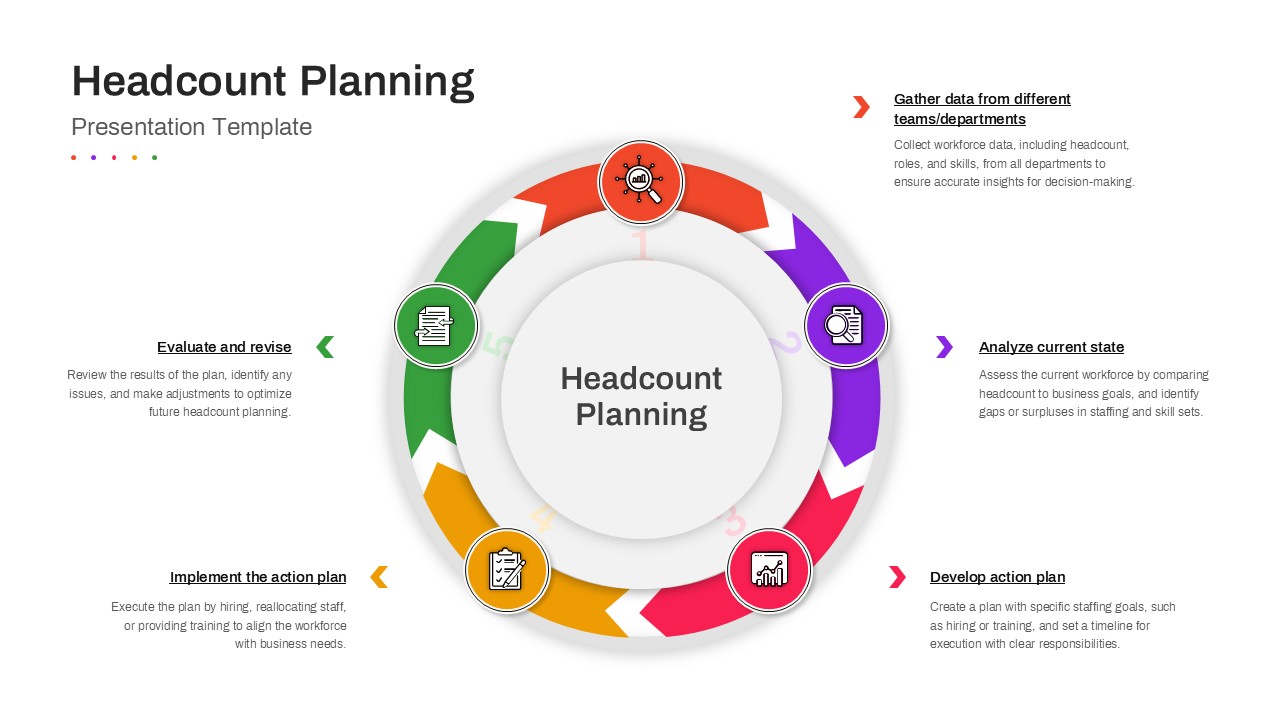
Headcount Planning Circular Process Diagram Template for PowerPoint & Google Slides
HR