Pipe Water Infographics Flow Diagram Template for PowerPoint & Google Slides
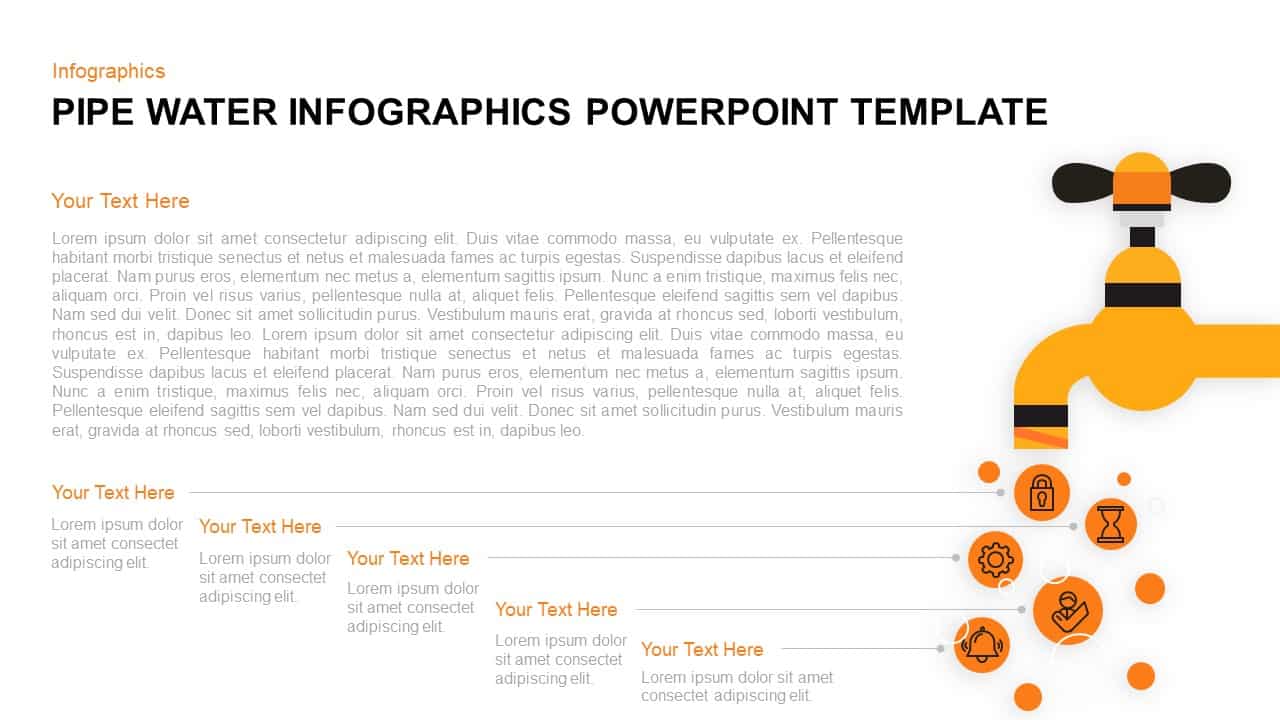
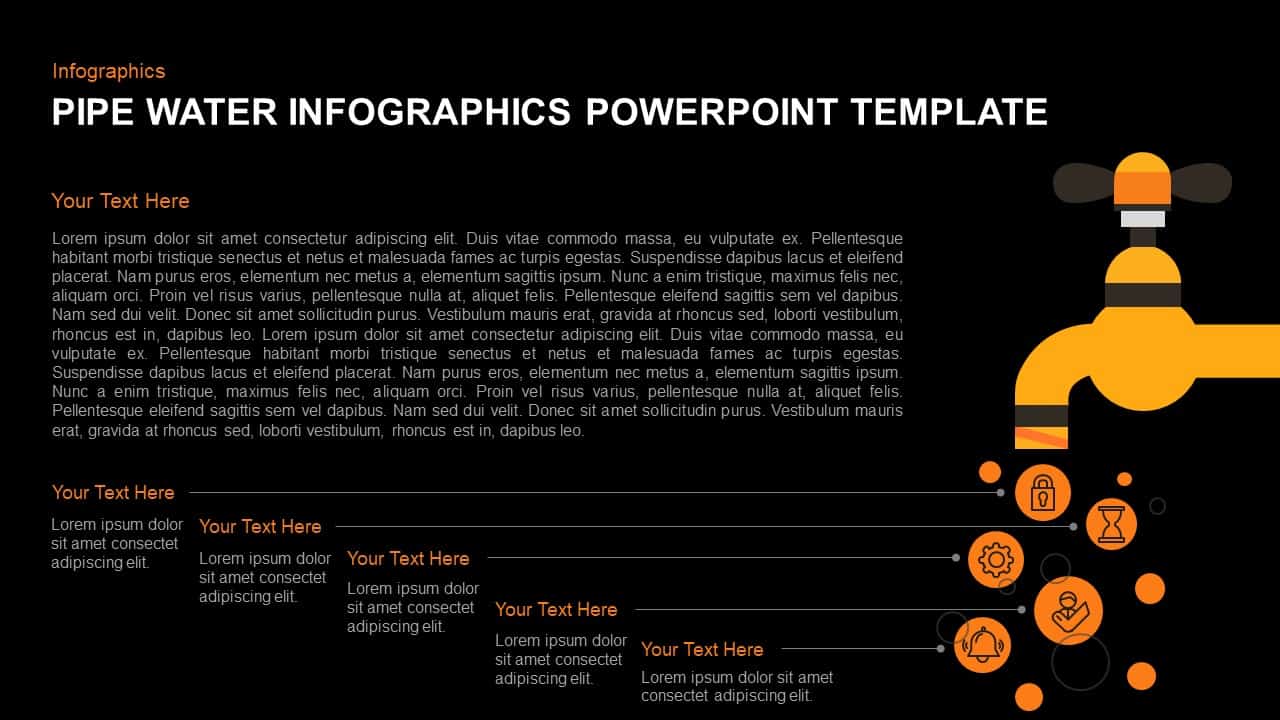

Transform complex process flows into an intuitive visual narrative with this pipe water infographics slide. Centered around a bold orange pipe and faucet graphic, five circular data icons cascade below, each linked by dotted connector lines to editable text fields. Represent key metrics such as security, timing, operations, user engagement, and support with minimalist icons housed in vibrant orange circles. A large paragraph placeholder on the left offers space for detailed context or analysis, while five concise callouts at the bottom align directly with each data icon, ensuring clear attribution of insights.
Every element is vector-based and built into master slides for seamless customization. Adjust pipe color, swap icons, resize data blobs, or reposition connectors in seconds to align with brand guidelines or presentation themes. The flat design aesthetic, paired with crisp sans-serif typography and ample white space, maintains professional polish and readability on any display. Subtle drop shadows add depth without clutter, guiding viewer attention from the main graphic to supporting details. Fully compatible with both PowerPoint and Google Slides, this template preserves formatting consistency and eliminates version control issues.
Use this slide to illustrate pipeline workflows, data distributions, or step-by-step procedures in areas like network infrastructure, supply chain management, or service delivery. Duplicate icon callouts to expand beyond five data points, or recolor the pipe and circles for thematic variation. The combination of thematic illustration and data callouts ensures audiences quickly grasp both the process framework and the underlying metrics.
Who is it for
Operations managers, IT professionals, and supply chain analysts will leverage this slide to map workflows, highlight performance metrics, and communicate process efficiency. Marketing strategists and product teams can also adopt the visual metaphor to demonstrate campaign funnels or customer touchpoints.
Other Uses
Beyond technical flows, repurpose this infographic for financial pipelines, resource allocation schemes, or risk management frameworks. Swap icons to represent sales stages, project milestones, or training modules, and adjust color schemes to match corporate branding or event themes.
Login to download this file

Item ID
SB01120
Related Templates

Free Water Relics Water Park Presentation Template for PowerPoint & Google Slides
Pitch Deck
Free
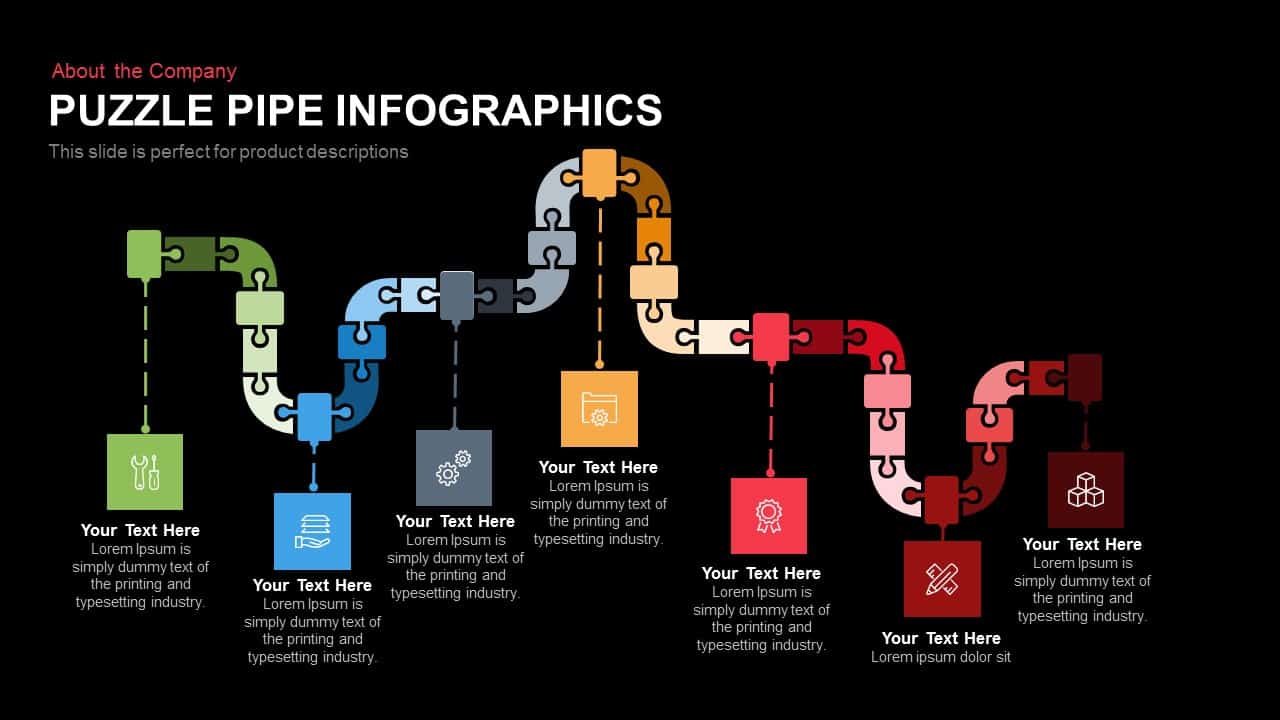
Puzzle Pipe Infographics Process Flow Template for PowerPoint & Google Slides
Process
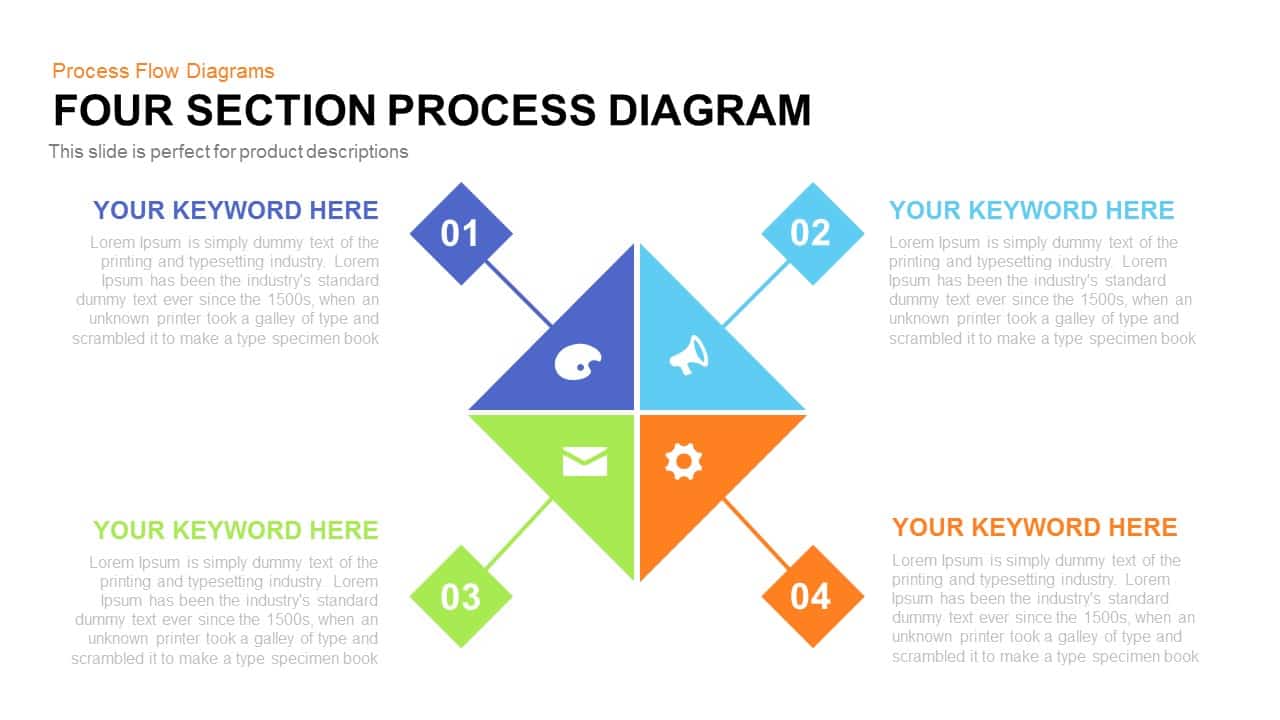
4 Section Pipe Diagram Process Flow Template for PowerPoint & Google Slides
Process
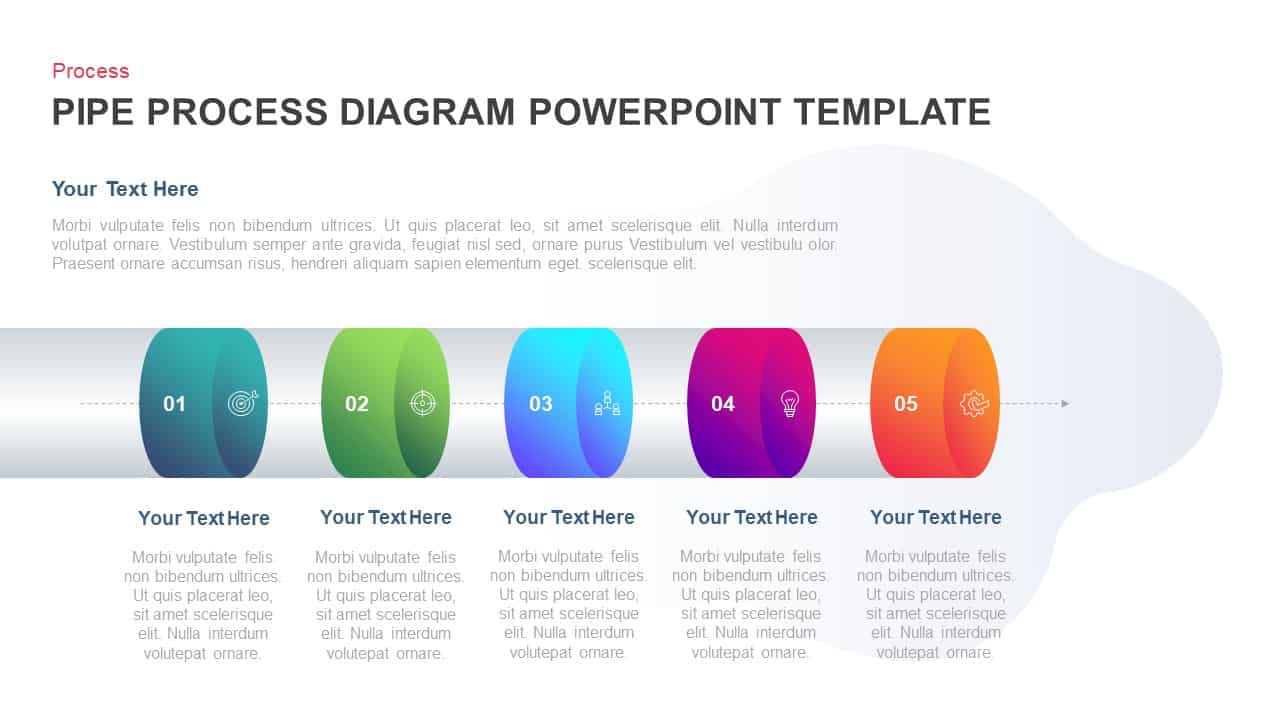
Five-Stage Pipe Process Diagram Template for PowerPoint & Google Slides
Process
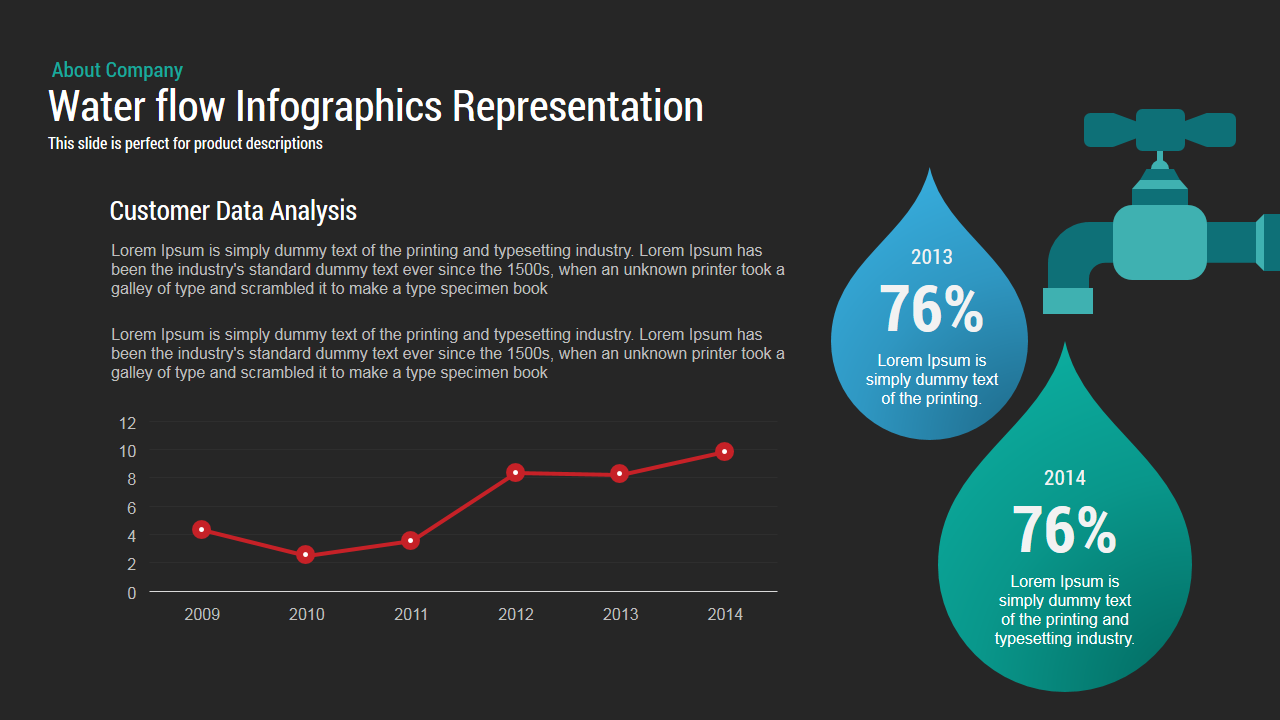
Water Flow template for PowerPoint & Google Slides
Infographics
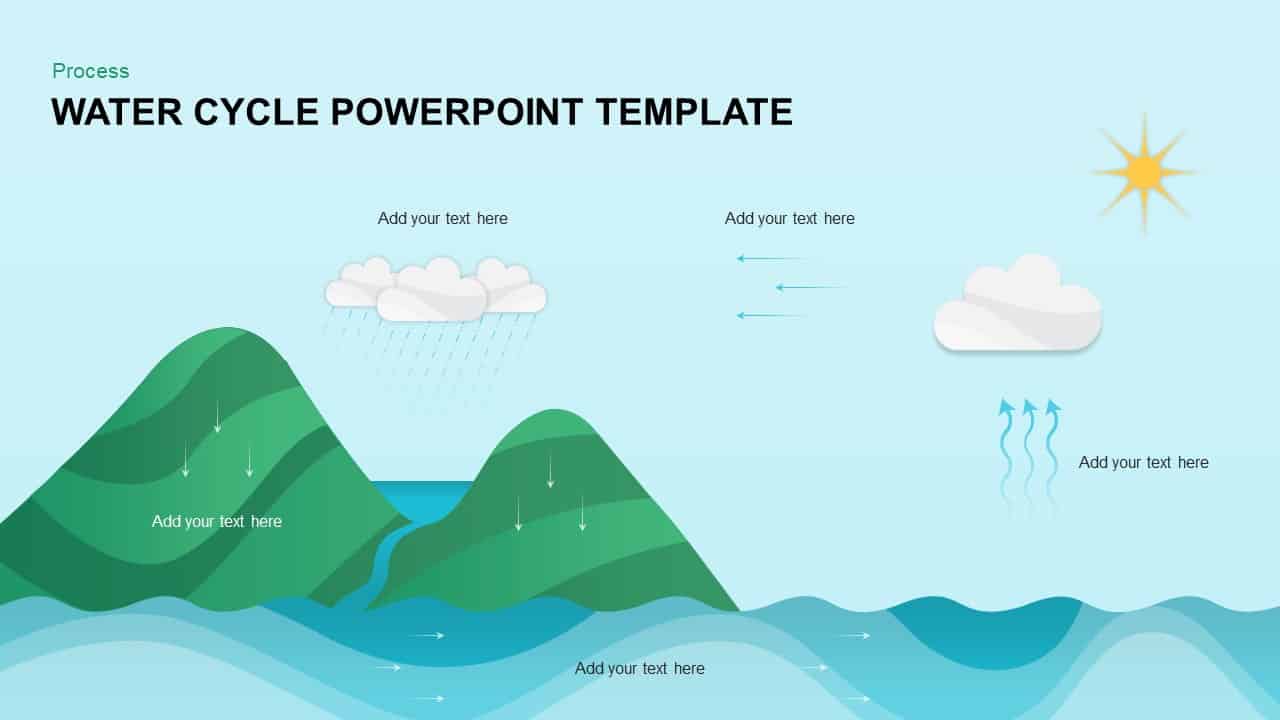
Water Cycle Process Infographic Template for PowerPoint & Google Slides
Process
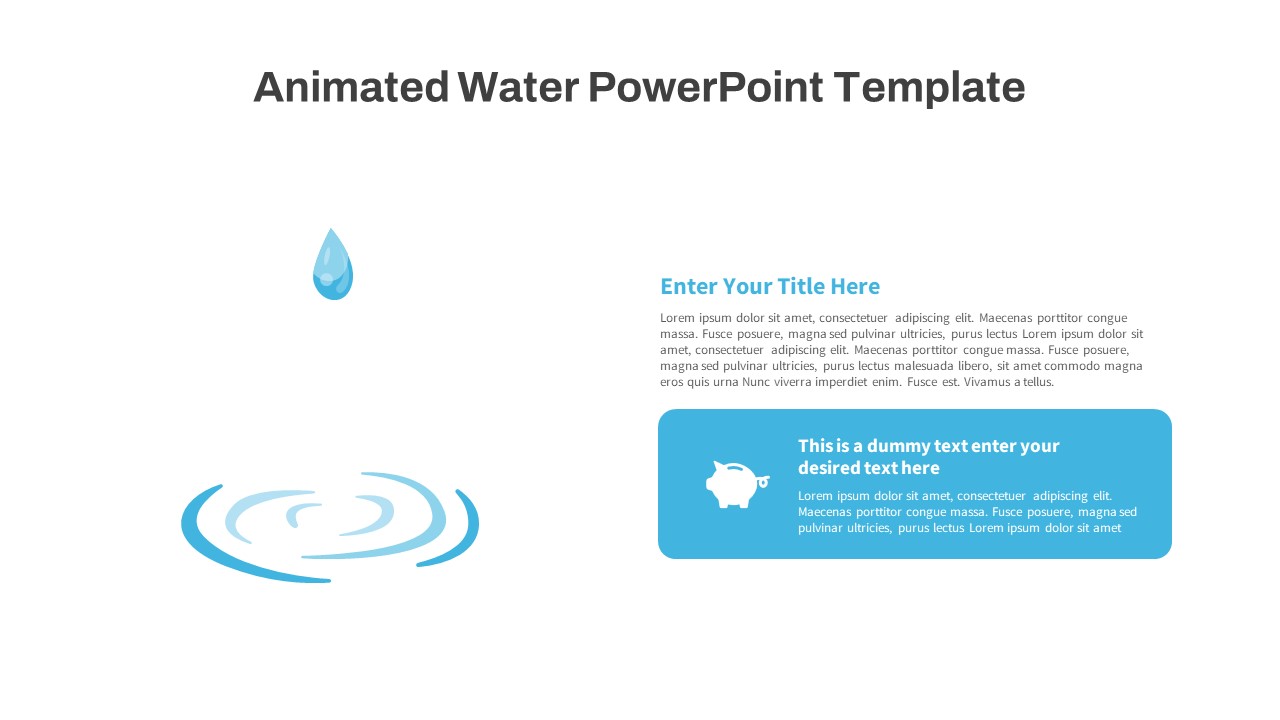
Animated Water Drop Ripple Infographic Template for PowerPoint & Google Slides
Graphics
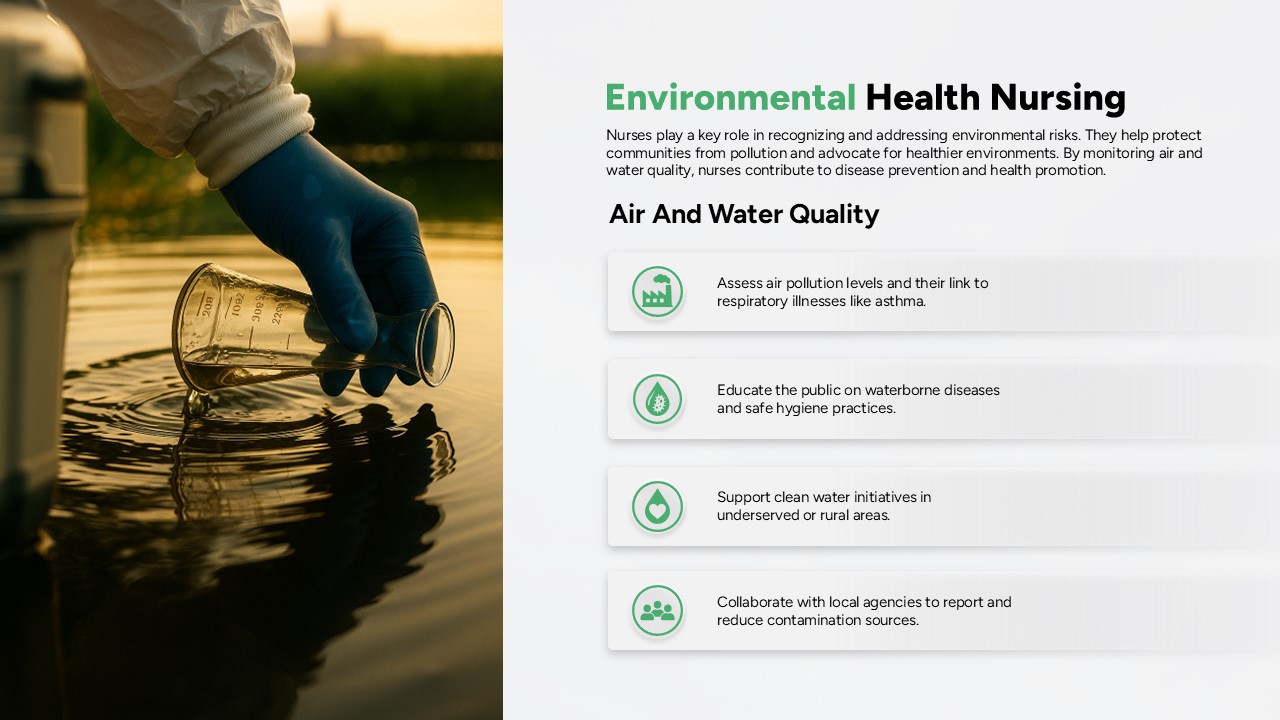
Environmental Nursing Health: Air & Water Template for PowerPoint & Google Slides
Nursing
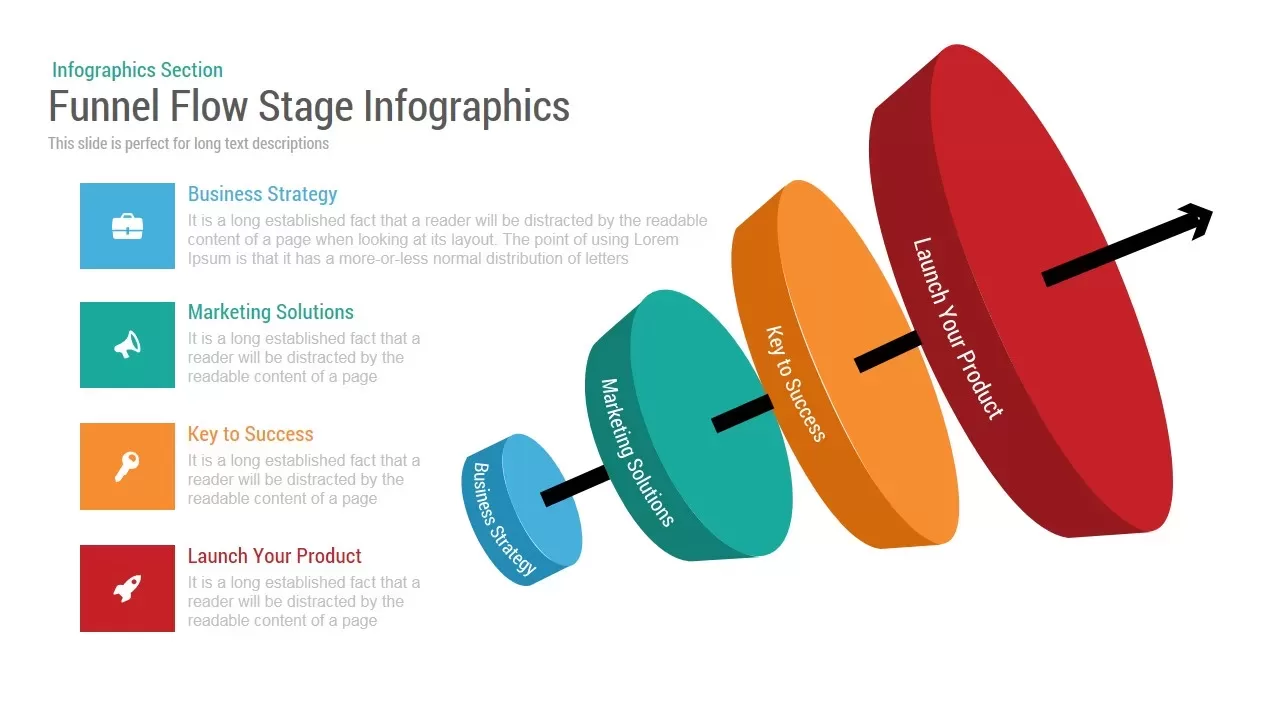
Funnel Flow Stage Infographics template for PowerPoint & Google Slides
Funnel
3D Arrow Infographics Circular Flow Template for PowerPoint & Google Slides
Arrow
5-Stage Arrow Infographics Process Flow Template for PowerPoint & Google Slides
Arrow

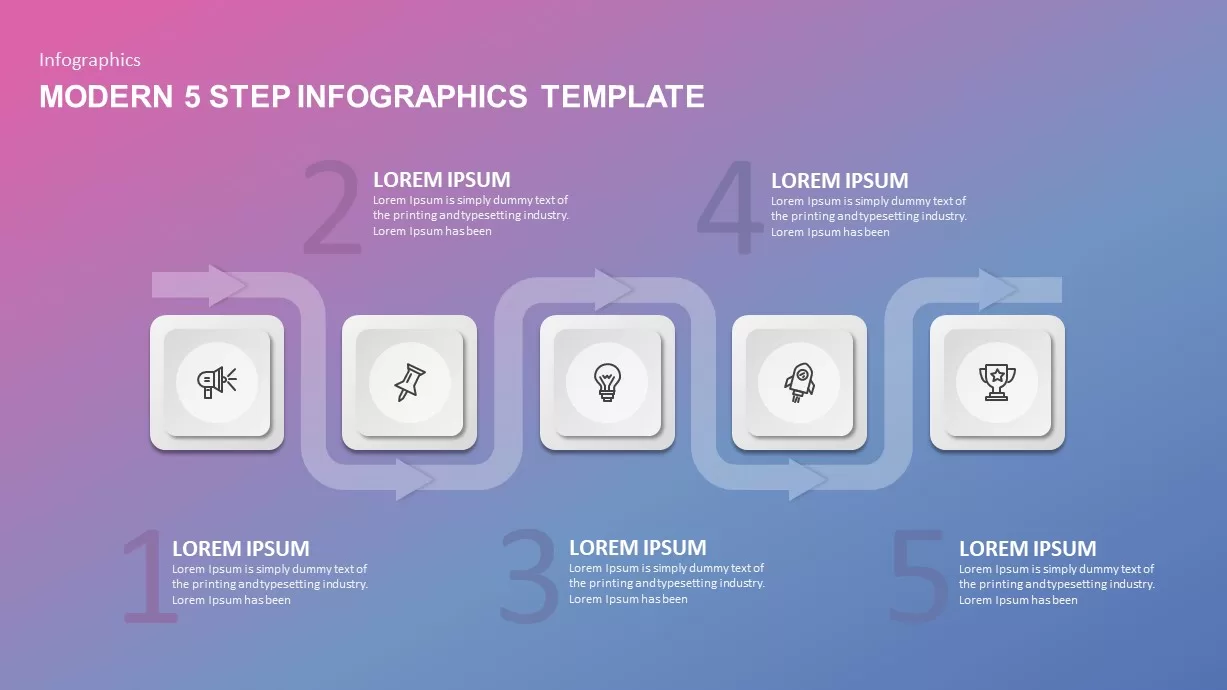
Modern 5-Step Flow Infographics Template for PowerPoint & Google Slides
Process

Free Colorful Process Flow Infographics Template for PowerPoint & Google Slides
Process
Free
Colorful Process Flow Infographics Template for PowerPoint & Google Slides
Process

DevOps Infographics & Process Flow Template for PowerPoint & Google Slides
Information Technology
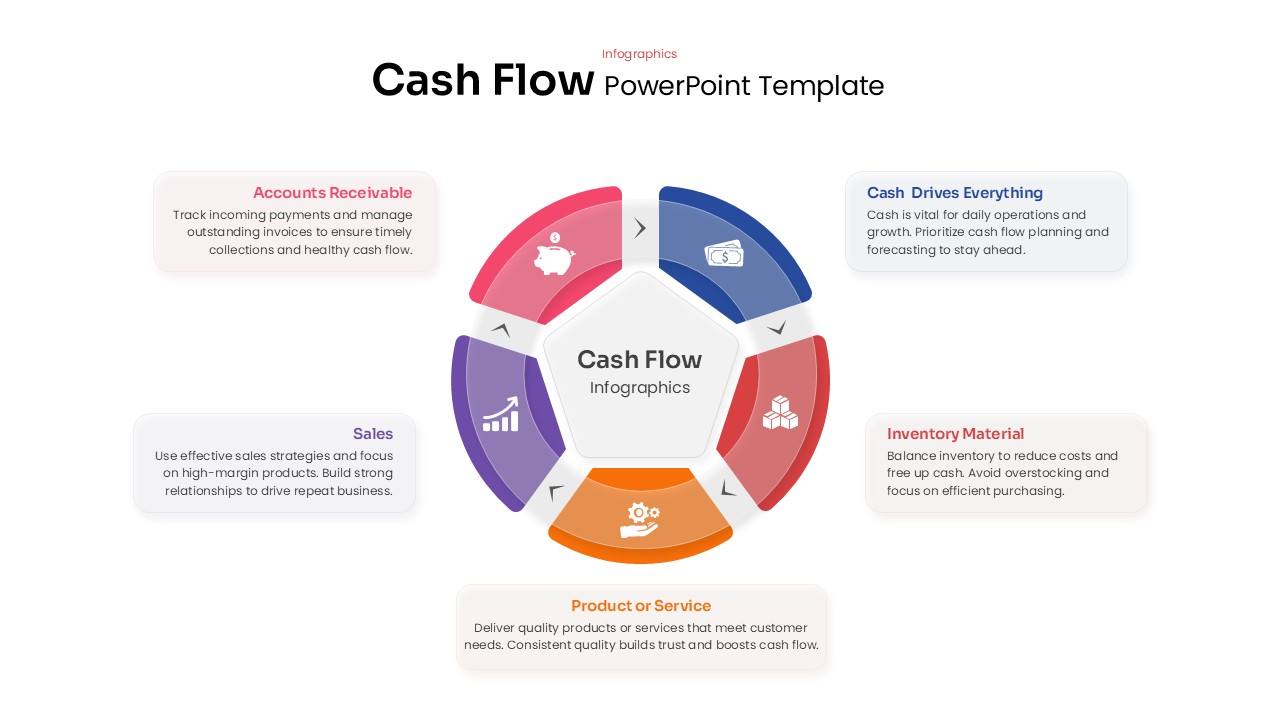
Cash Flow Infographics template for PowerPoint & Google Slides
Business
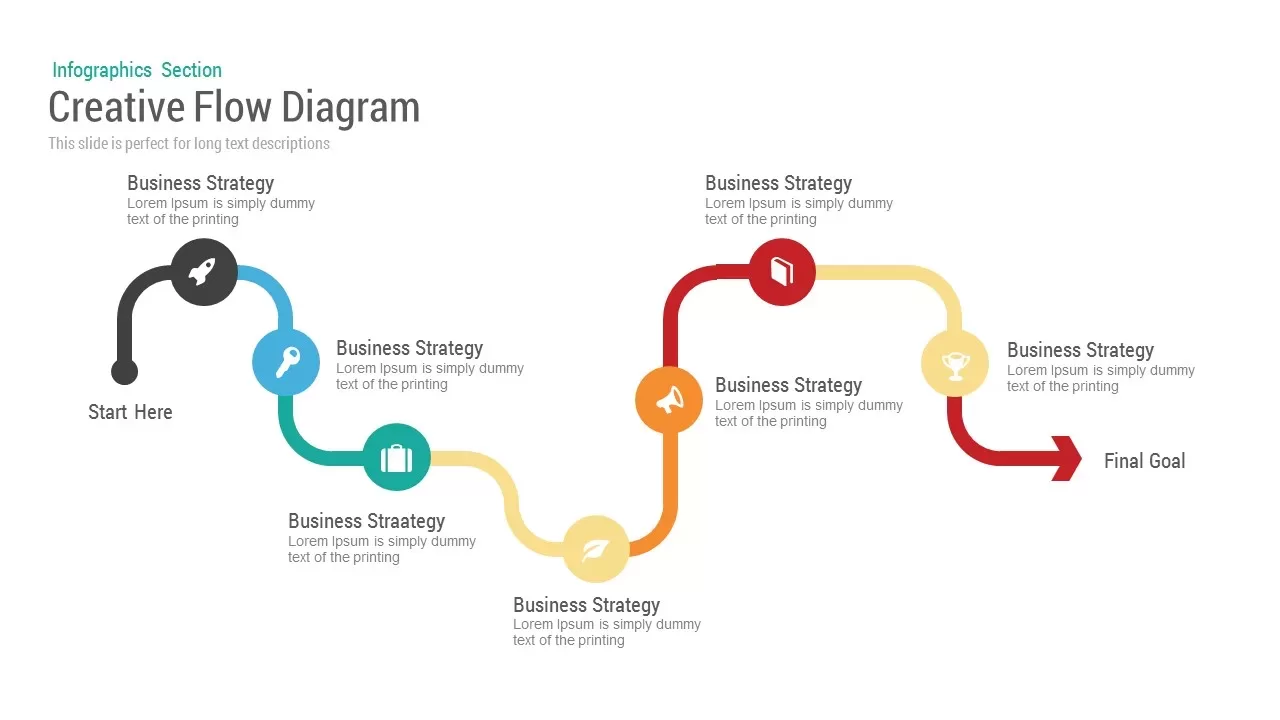
Creative flow diagram template for PowerPoint & Google Slides
Process
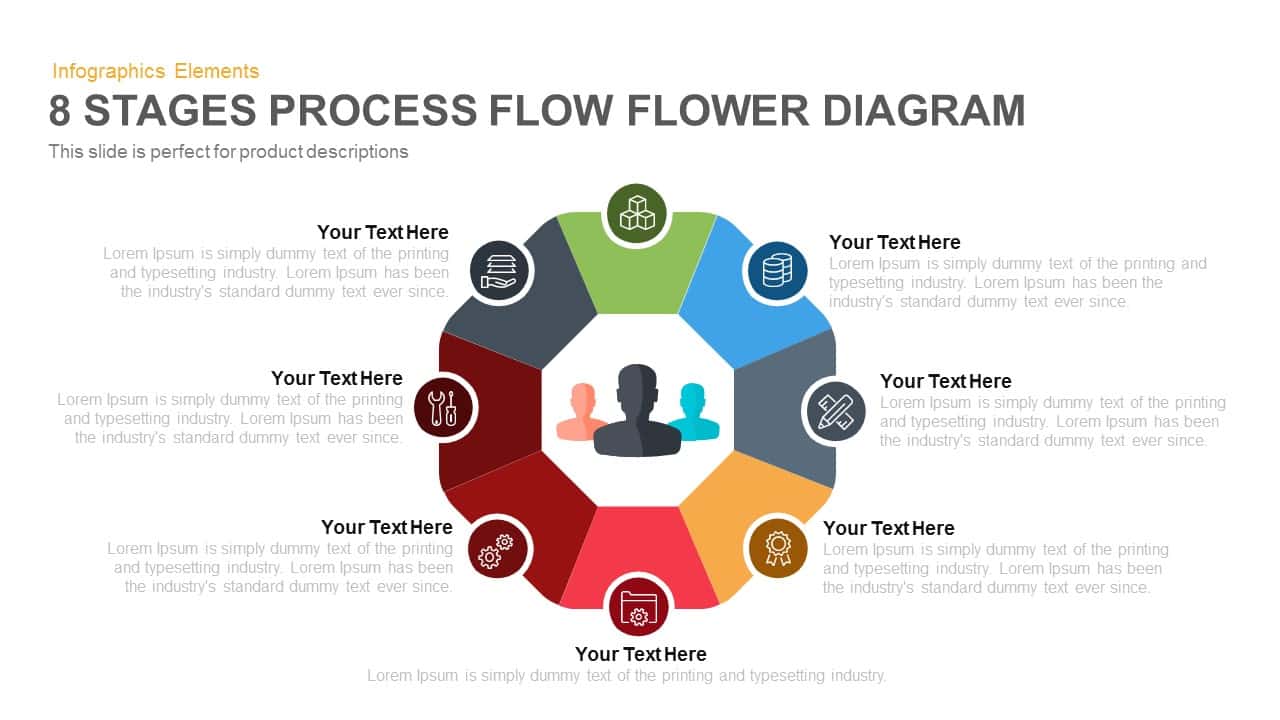
8-Stage Process Flow Flower Diagram Template for PowerPoint & Google Slides
Infographics
Circular Flow Diagram Template for PowerPoint & Google Slides
Infographics
Dynamic Shield Process Flow Diagram template for PowerPoint & Google Slides
Process
Six Hexagon Stages Process Flow Diagram Template for PowerPoint & Google Slides
Process
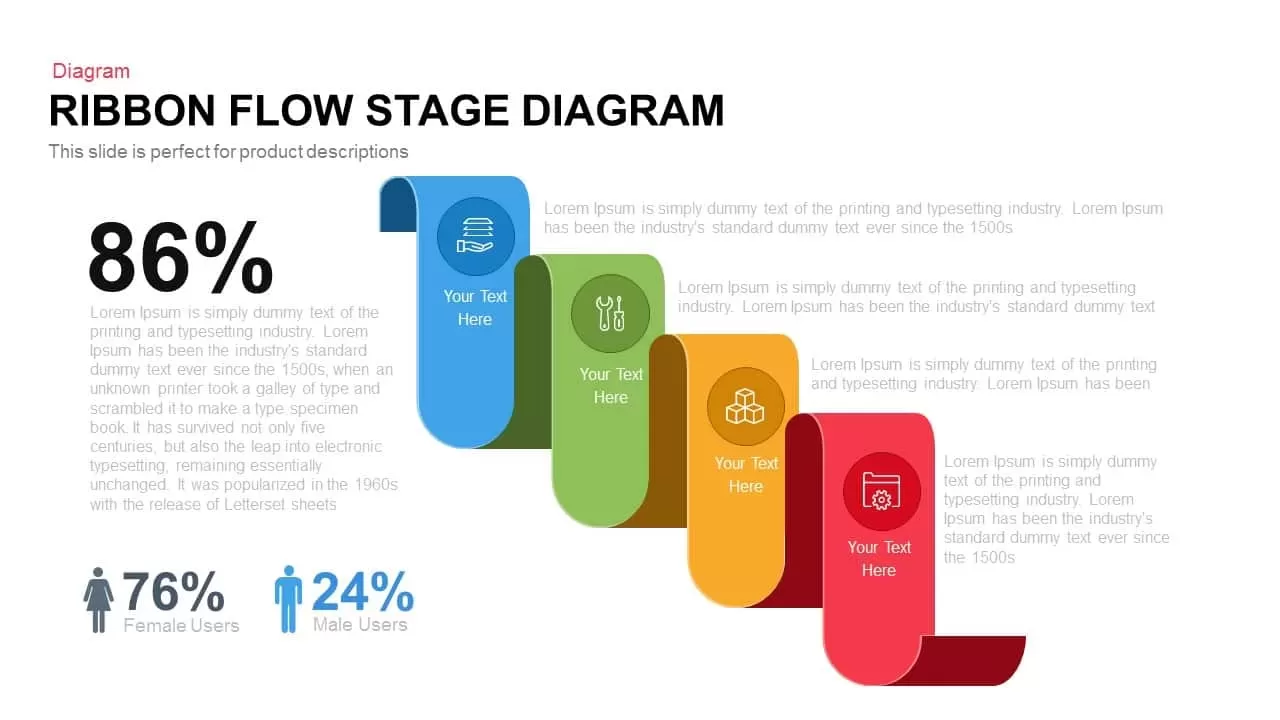
Ribbon Flow Diagram template for PowerPoint & Google Slides
Process
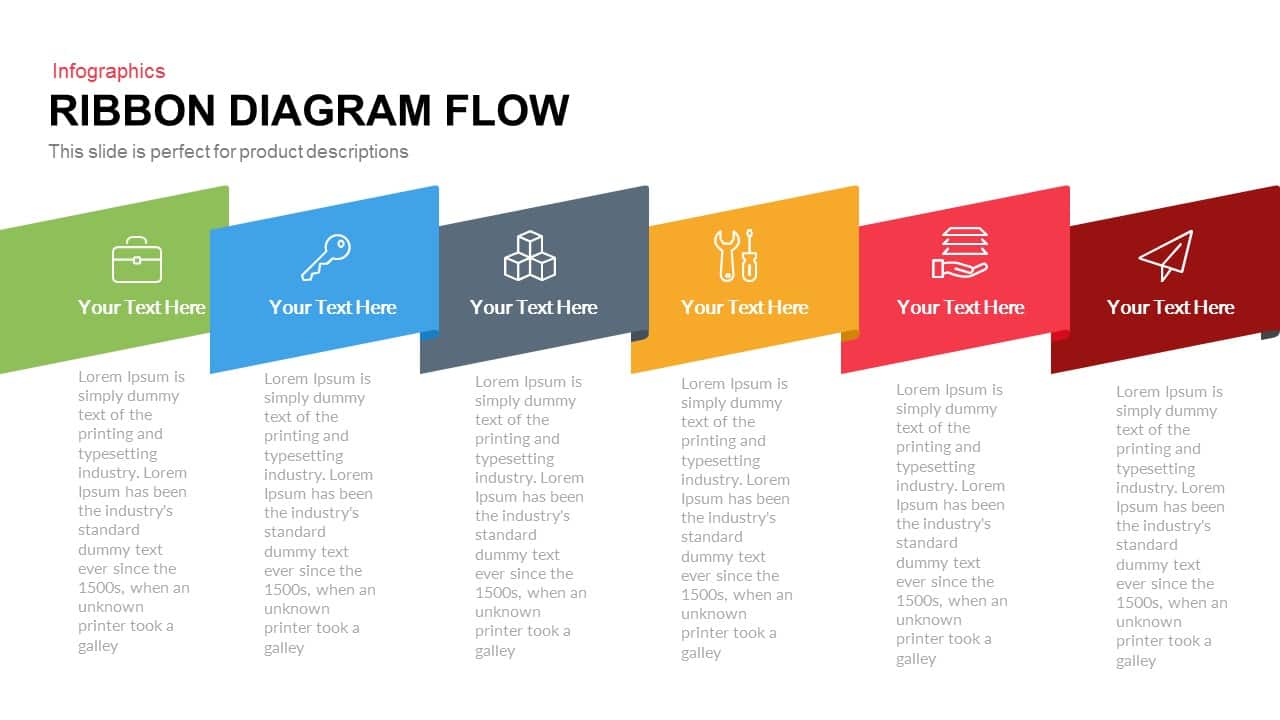
Ribbon Diagram Flow template for PowerPoint & Google Slides
Process
Process Flow Diagram template for PowerPoint & Google Slides
Infographics

15-Step Process Flow Diagram Template for PowerPoint & Google Slides
Process
3D Shape Linear Process Flow Diagram Template for PowerPoint & Google Slides
Process
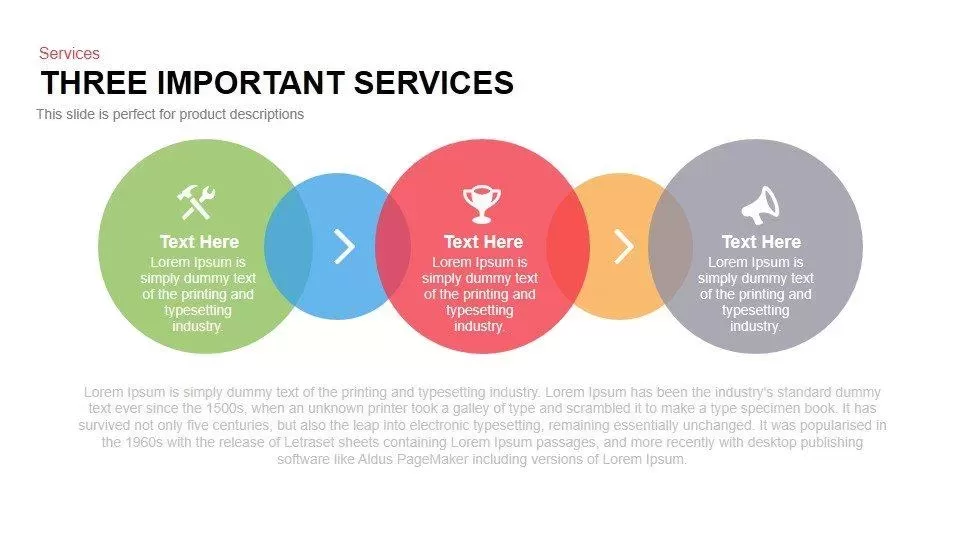
Three Important Services Flow Diagram Template for PowerPoint & Google Slides
Process
Linear Process Flow Circles Diagram Template for PowerPoint & Google Slides
Process
Six-Stage Zig-Zag Process Flow Diagram Template for PowerPoint & Google Slides
Process
Vertical Business Process Flow Diagram Template for PowerPoint & Google Slides
Process
Six-Sided Shutter Diagram Process Flow Template for PowerPoint & Google Slides
Process
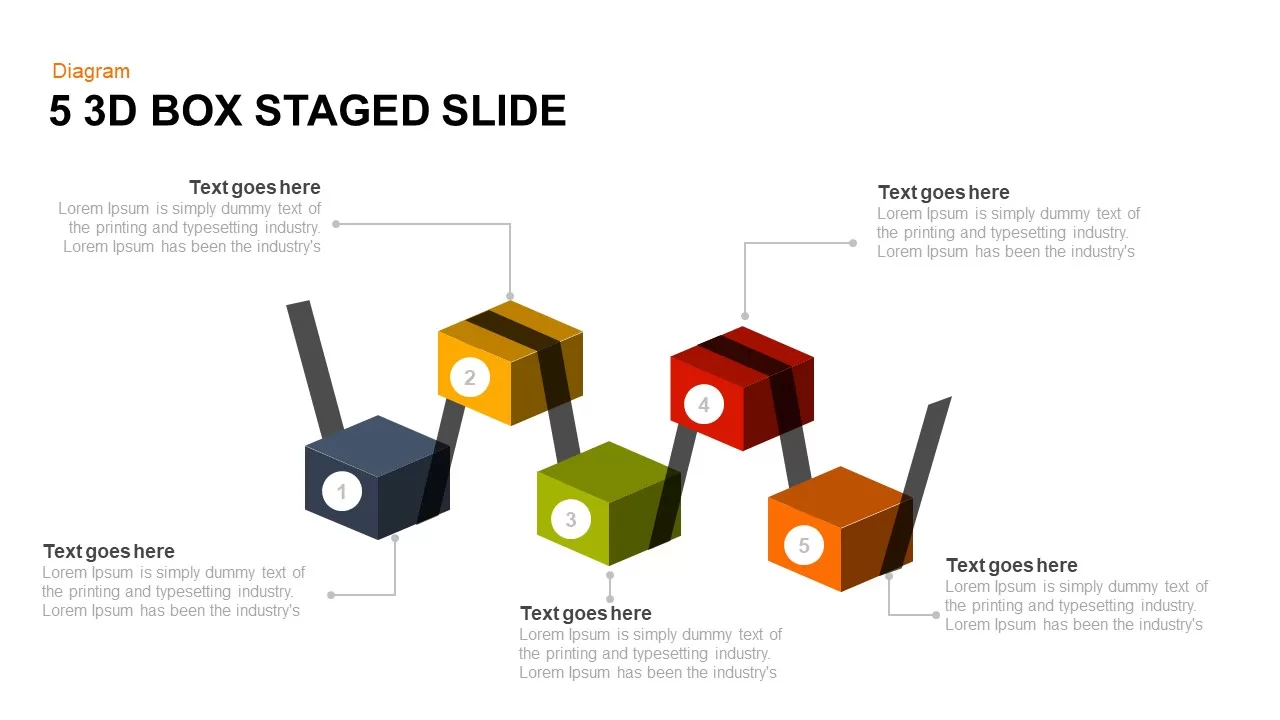
Five-Stage 3D Box Flow Diagram Template for PowerPoint & Google Slides
Process
10 Stages Business Flow Process Diagram template for PowerPoint & Google Slides
Business
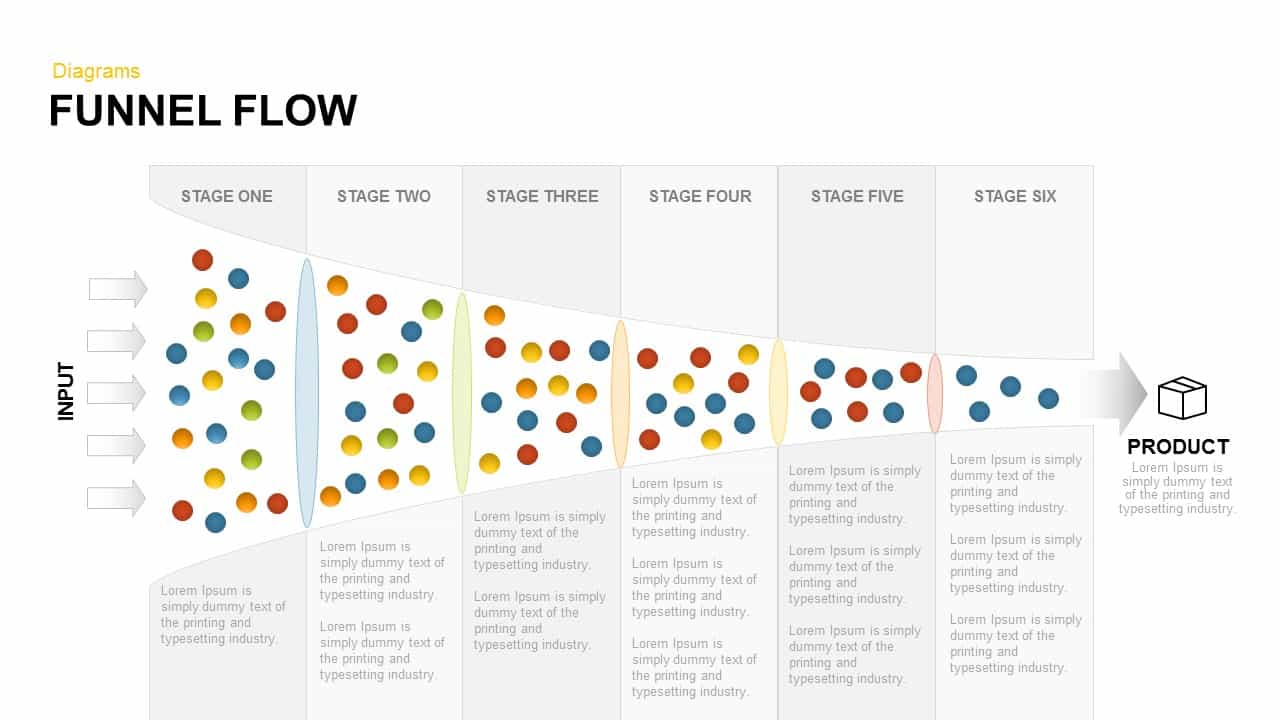
Funnel Flow Diagram template for PowerPoint & Google Slides
Funnel
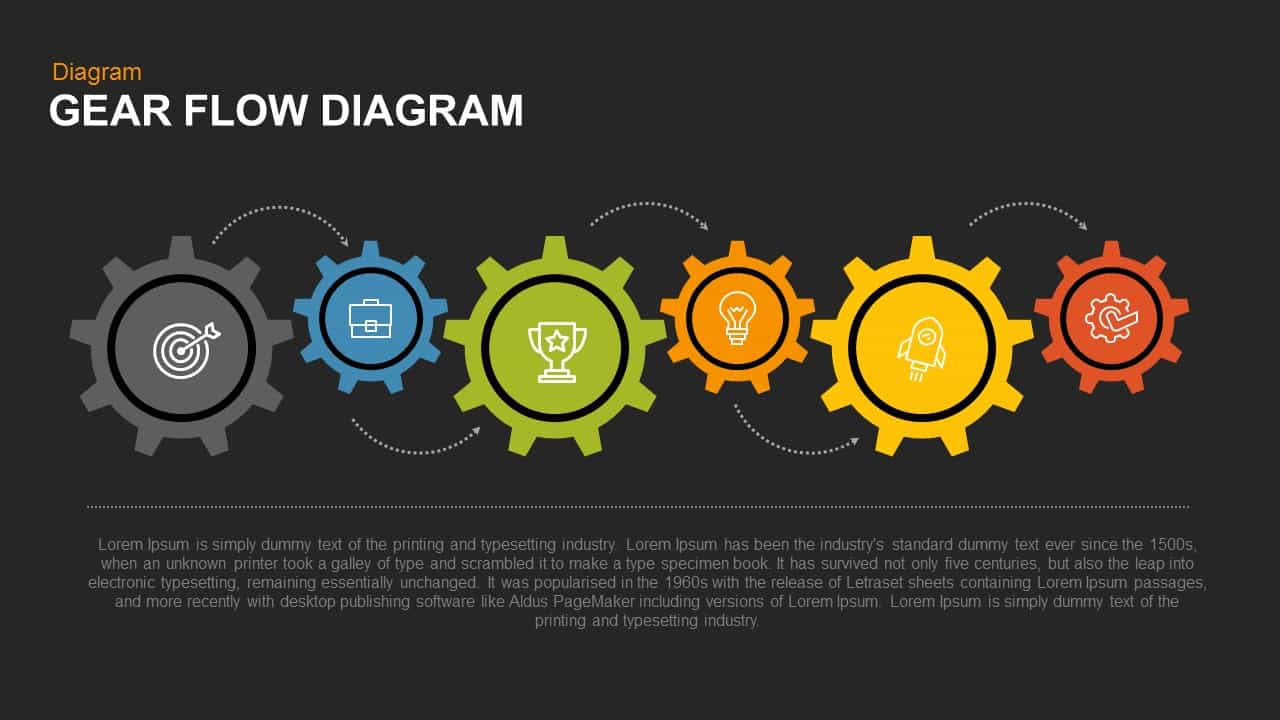
Gear Flow Diagram template for PowerPoint & Google Slides
Process

Eight-Stage Radial Process Flow Diagram Template for PowerPoint & Google Slides
Process
Four-Plus Process Flow Diagram Template for PowerPoint & Google Slides
Process
4 Step Revenue Growth Flow Diagram Template for PowerPoint & Google Slides
Process
Five Stage Linear Process Flow Diagram Template for PowerPoint & Google Slides
Process
Five-Stage Linear Process Flow Diagram Template for PowerPoint & Google Slides
Process
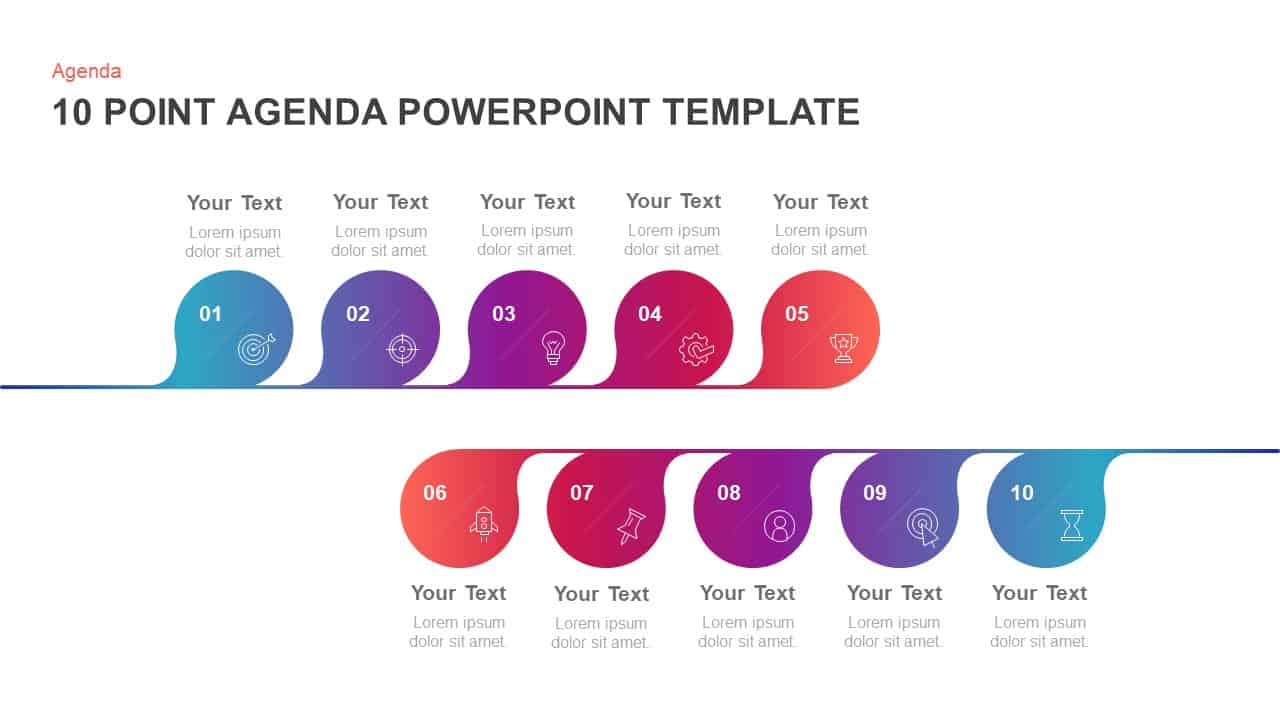
10-Point Gradient Agenda Flow Diagram Template for PowerPoint & Google Slides
Agenda
Five-Stage Agenda Flow Diagram Template for PowerPoint & Google Slides
Agenda
Six-Step Hexagon Process Flow Diagram Template for PowerPoint & Google Slides
Process
Five-Stage Circular Process Flow Diagram Template for PowerPoint & Google Slides
Circular
Five-Stage Circular Flow Diagram Template for PowerPoint & Google Slides
Circular
5-Stage Gear Process Flow Diagram Template for PowerPoint & Google Slides
Process
3D Seven-Stage Process Flow Diagram Template for PowerPoint & Google Slides
Process
Four-Stage Linear Process Flow Diagram Template for PowerPoint & Google Slides
Process
Four-Stage Circular Flow Diagram Template for PowerPoint & Google Slides
Circular
5-Stage Linear Process Flow Diagram Template for PowerPoint & Google Slides
Process
5 Stage Linear Process Flow Diagram Template for PowerPoint & Google Slides
Process
Five-Stage Process Flow Diagram Template for PowerPoint & Google Slides
Process
4 Stage Linear Process Flow Diagram Template for PowerPoint & Google Slides
Process
7 Stage Linear Process Flow Diagram Template for PowerPoint & Google Slides
Process
8 Step Circular Process Flow Diagram Template for PowerPoint & Google Slides
Process
4 Stage Linear Process Flow Diagram Template for PowerPoint & Google Slides
Process
6-Step Business Process Flow Diagram Template for PowerPoint & Google Slides
Process
6-Step Circular Process Flow Diagram Template for PowerPoint & Google Slides
Process
Six-Stage Circular Flow Diagram Template for PowerPoint & Google Slides
Circular
Five Stage Puzzle Flow Diagram Template for PowerPoint & Google Slides
Process
4-Stage Linear Process Flow Diagram Template for PowerPoint & Google Slides
Process
Financial Agreement Signing Flow Diagram Template for PowerPoint & Google Slides
Process
4-Step Linear Process Flow Diagram Template for PowerPoint & Google Slides
Process
Vertical Split Flow Chart Diagram Template for PowerPoint & Google Slides
Flow Charts
Business Process Management Flow Diagram Template for PowerPoint & Google Slides
Process
Colorful 8-Stage Droplet Process Flow Diagram Template for PowerPoint & Google Slides
Process
Flow Chart Diagram Template for PowerPoint & Google Slides
Flow Charts
Minimal Process Flow Diagram Infographic Template for PowerPoint & Google Slides
Process
Flow Chart Diagram template for PowerPoint & Google Slides
Flow Charts
Process Flow Diagram template for PowerPoint & Google Slides
Process
Free Circular Multi-Step Flow Chart Diagram Template for PowerPoint & Google Slides
Flow Charts
Free
Curved Arrow Process Flow Diagram Template for PowerPoint & Google Slides
Process
Curved Arrow Process Flow Diagram Template for PowerPoint & Google Slides
Arrow
Curved Arrow Flow Diagram template for PowerPoint & Google Slides
Business
3D Conveyor Belt Process Flow Diagram Template for PowerPoint & Google Slides
Process
E-Waste Management Process Flow Diagram Template for PowerPoint & Google Slides
Process
Comprehensive Process Flow Diagram Template for PowerPoint & Google Slides
Process
Animated Gears Process Flow Diagram Template for PowerPoint & Google Slides
Process
Advanced Data Flow Diagram Pack Template for PowerPoint & Google Slides
Flow Charts
Capital Investments Process Flow Diagram Template for PowerPoint & Google Slides
Process
Order to Cash Process Flow Diagram Template for PowerPoint & Google Slides
Process
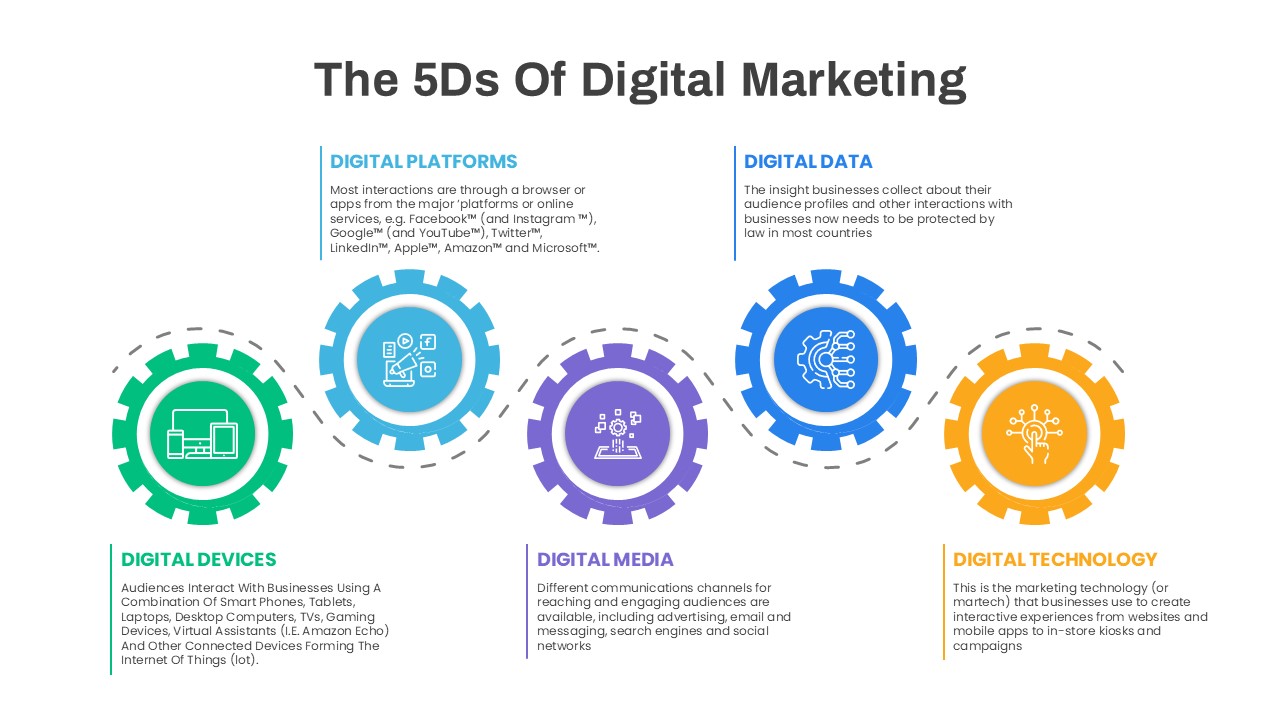
5D Digital Marketing Flow Diagram Template for PowerPoint & Google Slides
Digital Marketing
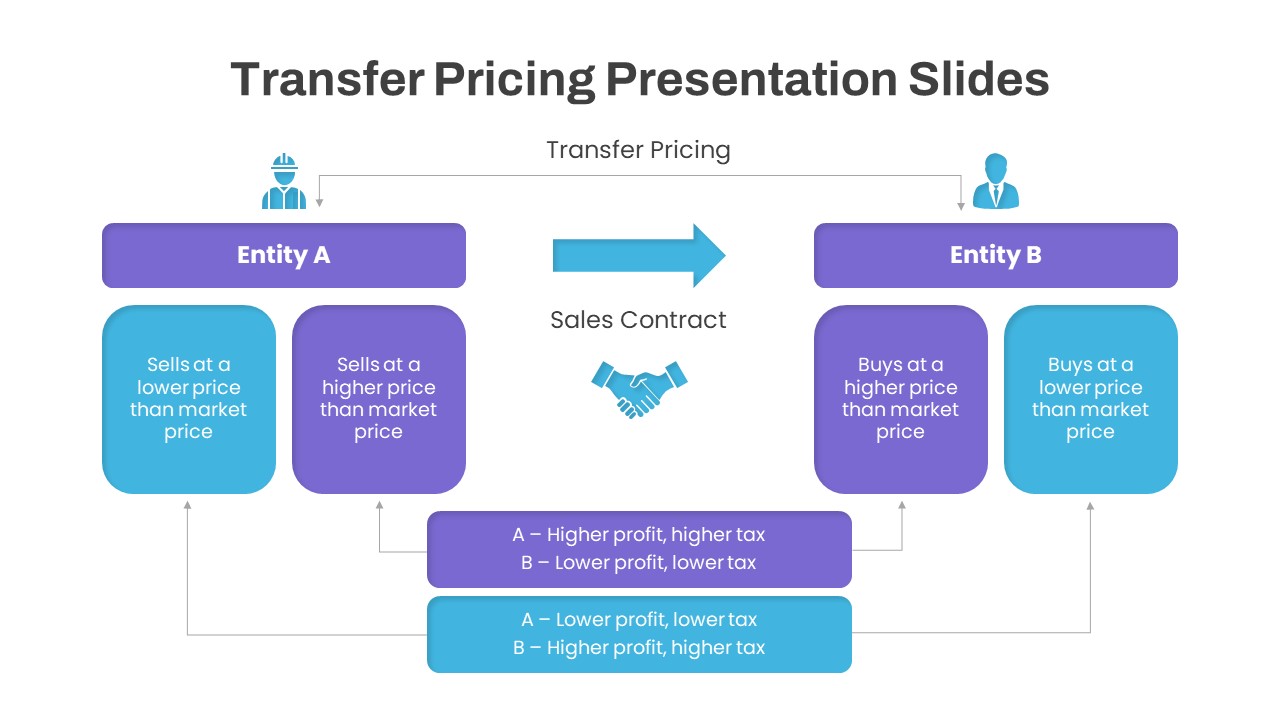
Dynamic Transfer Pricing Flow Diagram Template for PowerPoint & Google Slides
Finance
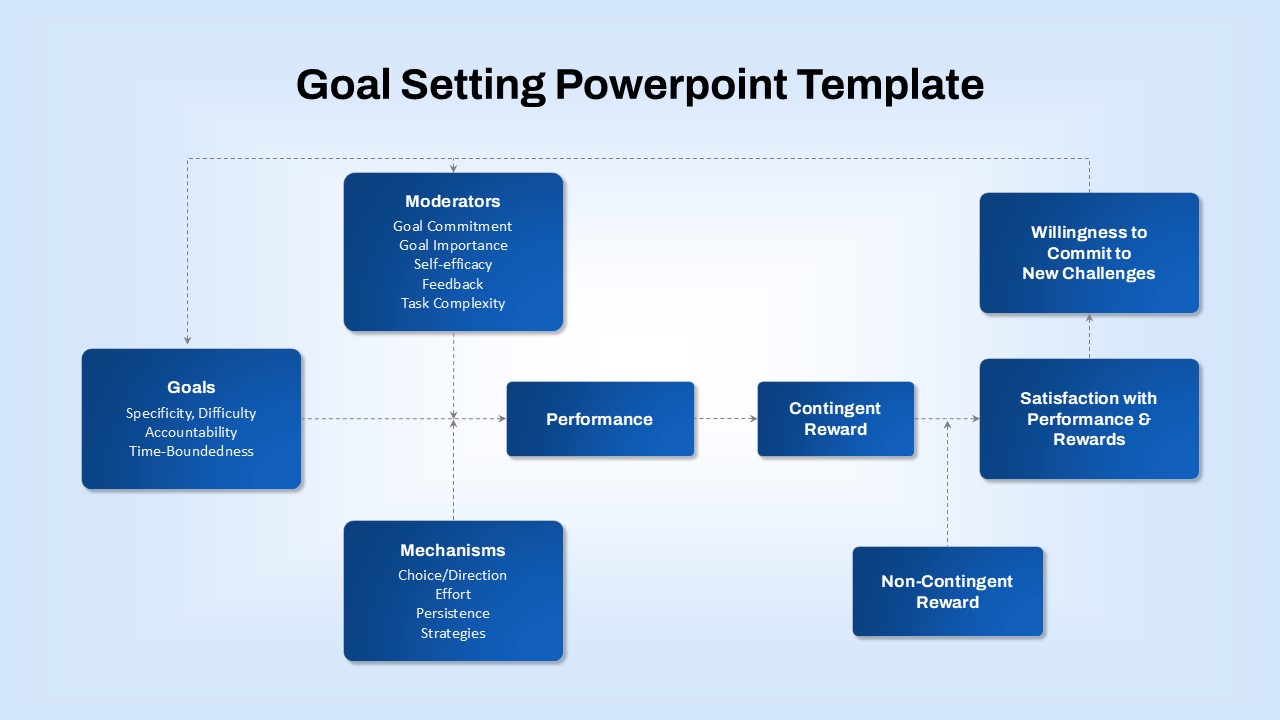
Goal-Setting Process Flow Diagram Template for PowerPoint & Google Slides
Goals
Semi-Supervised Learning Flow Diagram Template for PowerPoint & Google Slides
Machine Learning
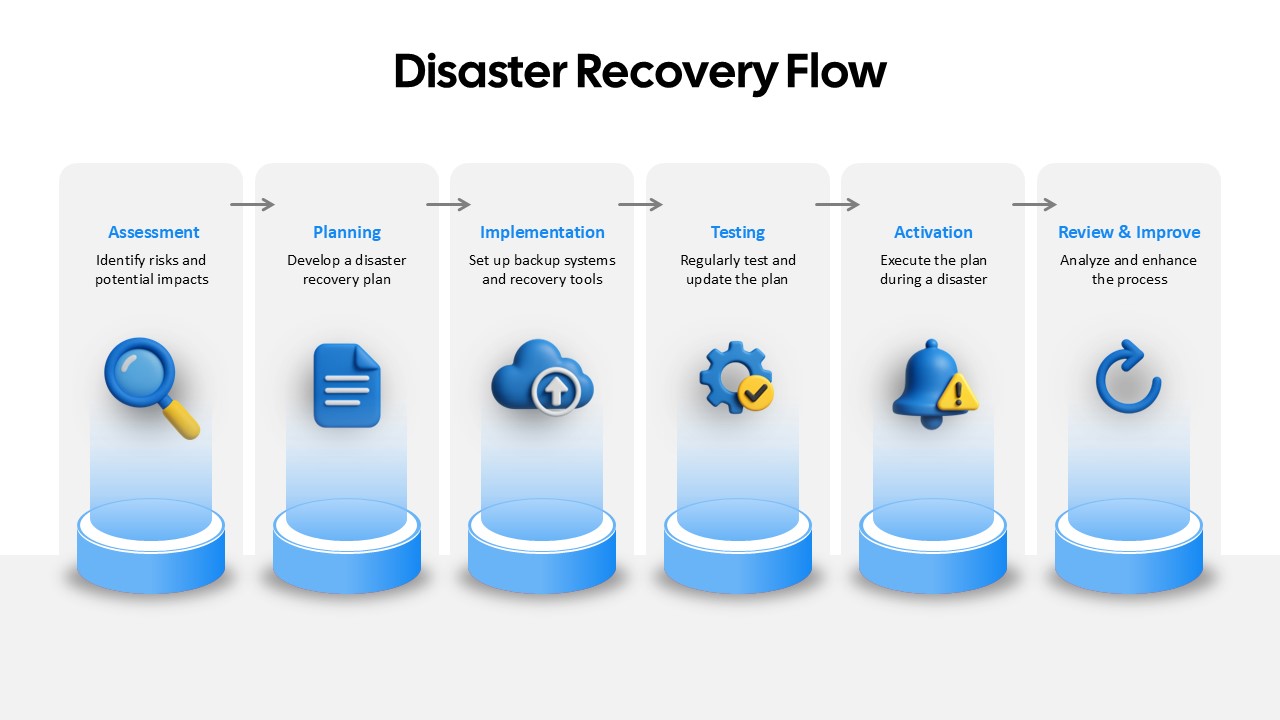
Disaster Recovery Flow Diagram Template for PowerPoint & Google Slides
Process
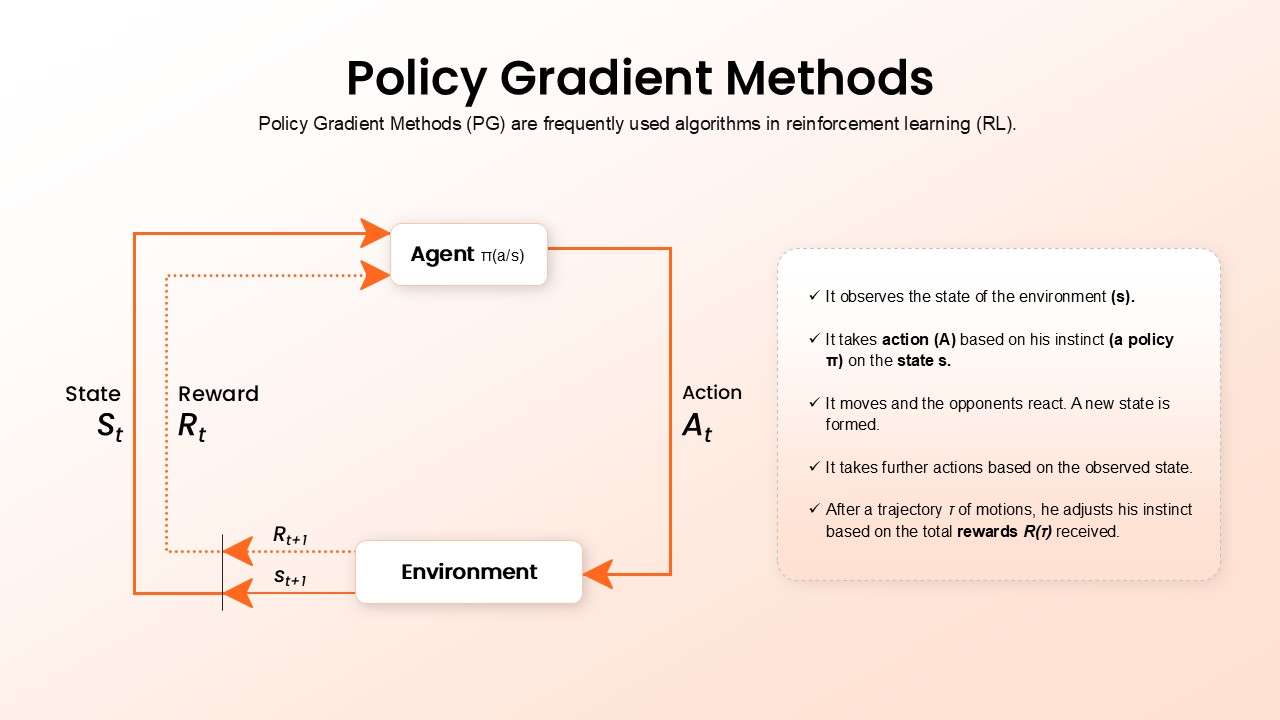
Policy Gradient Methods Flow Diagram Template for PowerPoint & Google Slides
AI
Resume Screening Process Flow Diagram Template for PowerPoint & Google Slides
Process
Q-Learning Process Flow Diagram Template for PowerPoint & Google Slides
Process
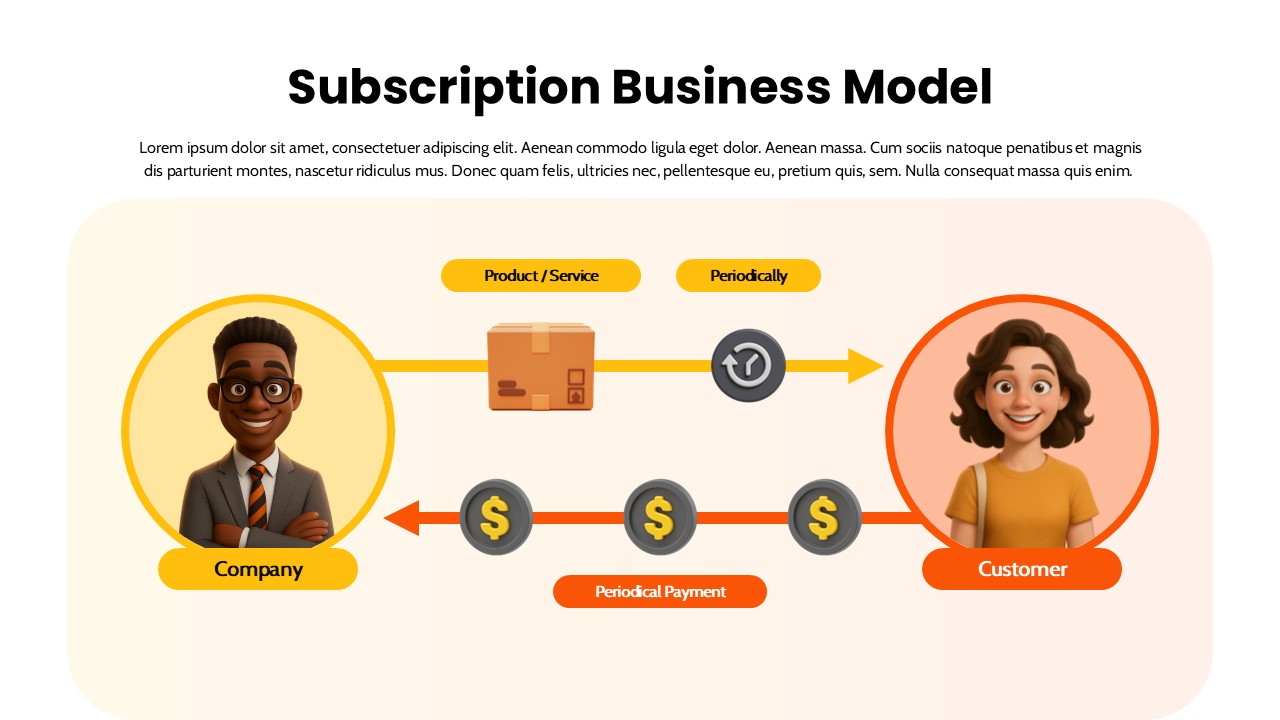
Subscription Business Model Flow Diagram Template for PowerPoint & Google Slides
Business Models
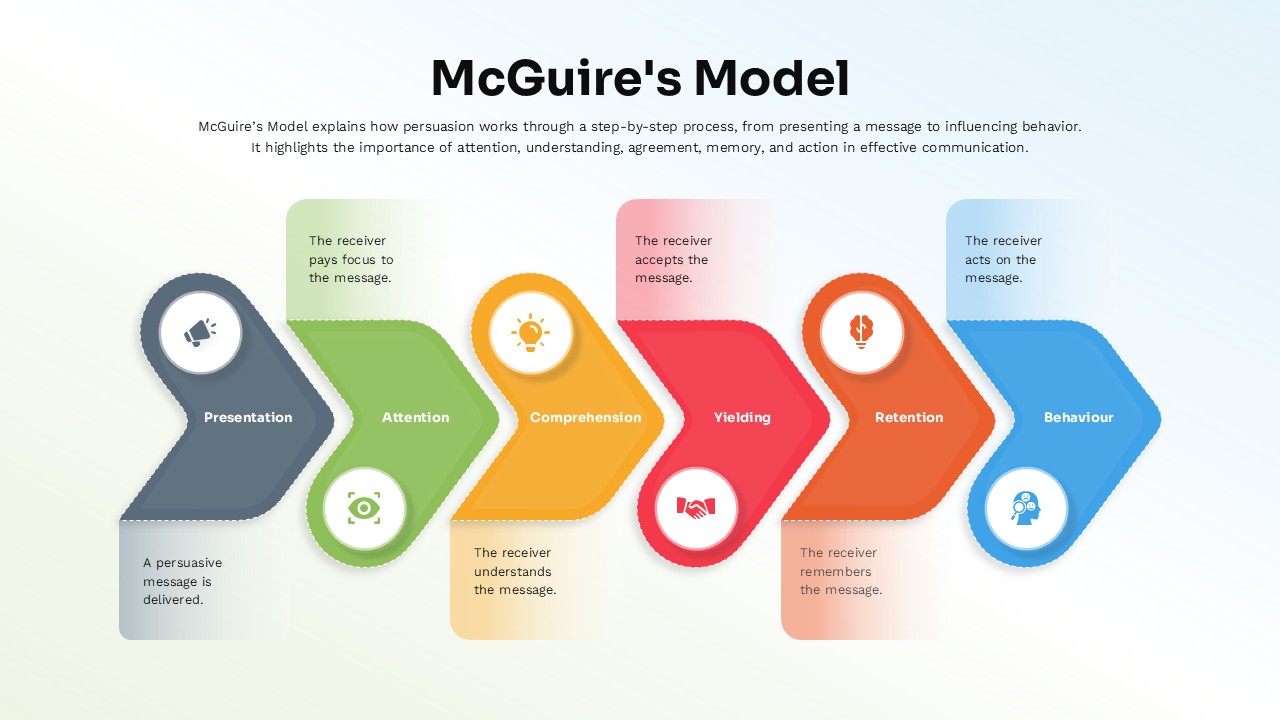
McGuire’s Persuasion Process Flow Diagram Template for PowerPoint & Google Slides
Marketing
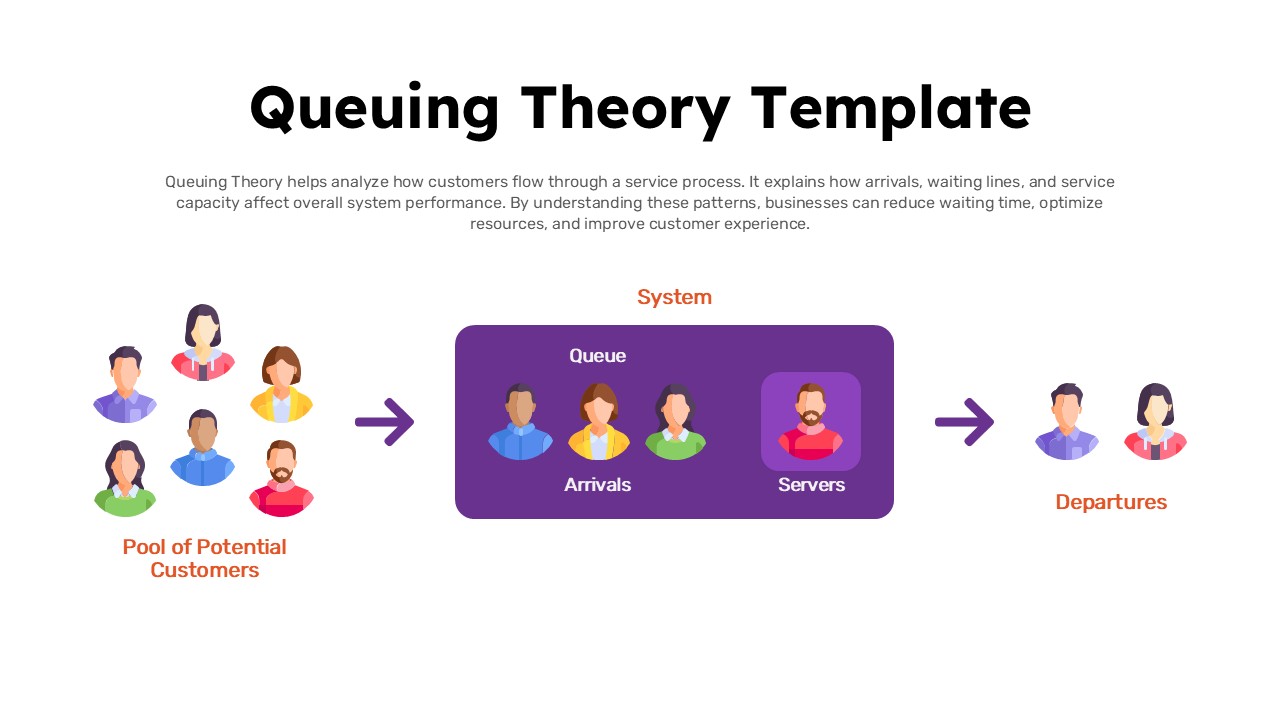
Queuing Theory System Flow Diagram Template for PowerPoint & Google Slides
Process
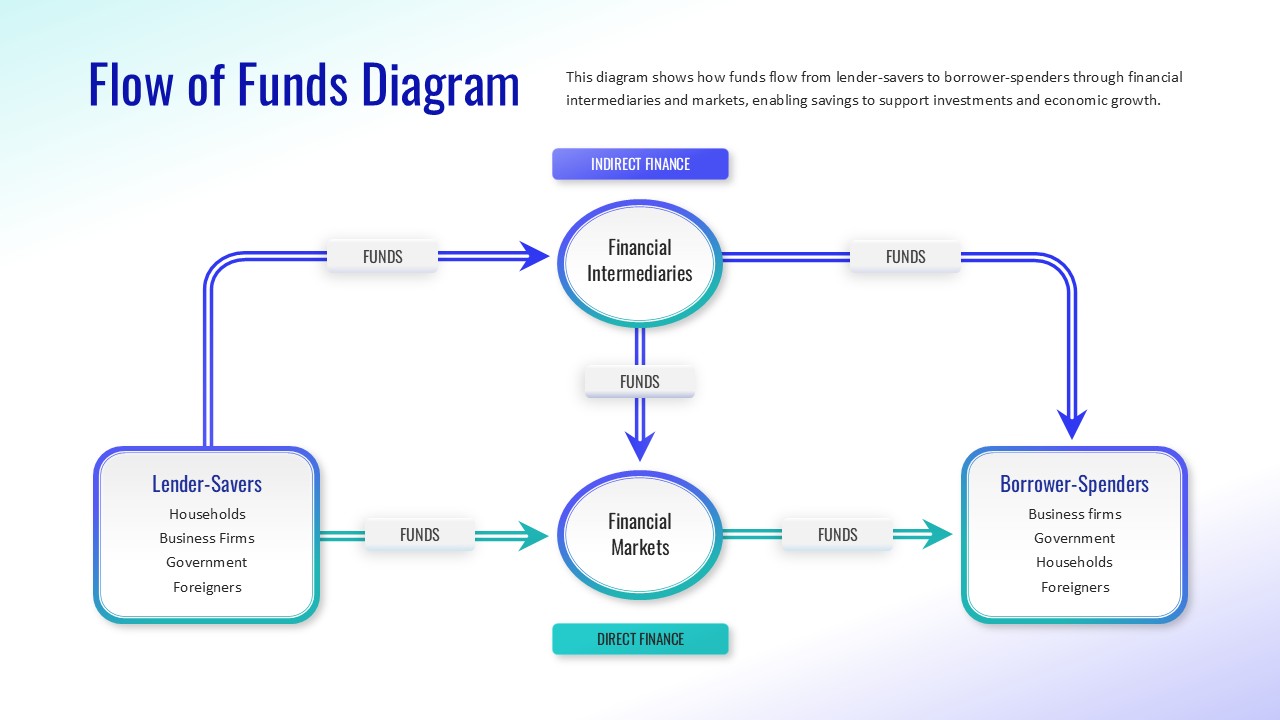
Flow of Funds Financial System Diagram Template for PowerPoint & Google Slides
Finance
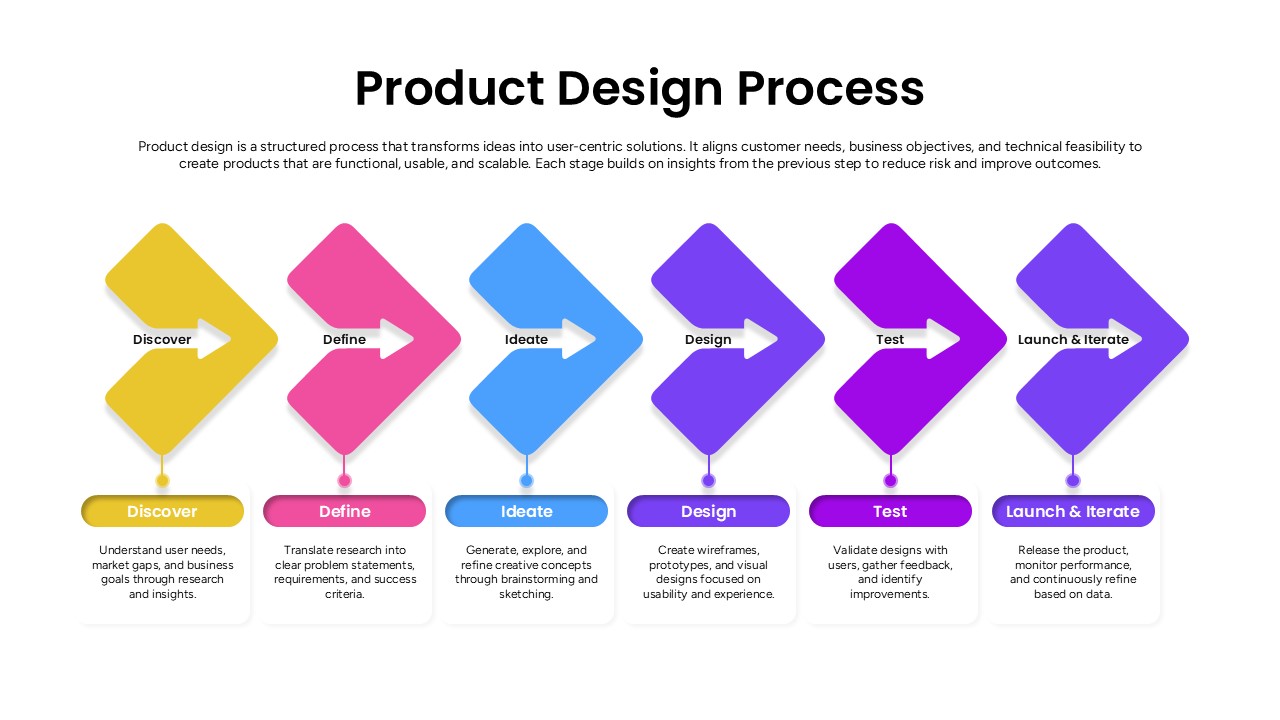
Product Design Process Flow Diagram Template for PowerPoint & Google Slides
Process
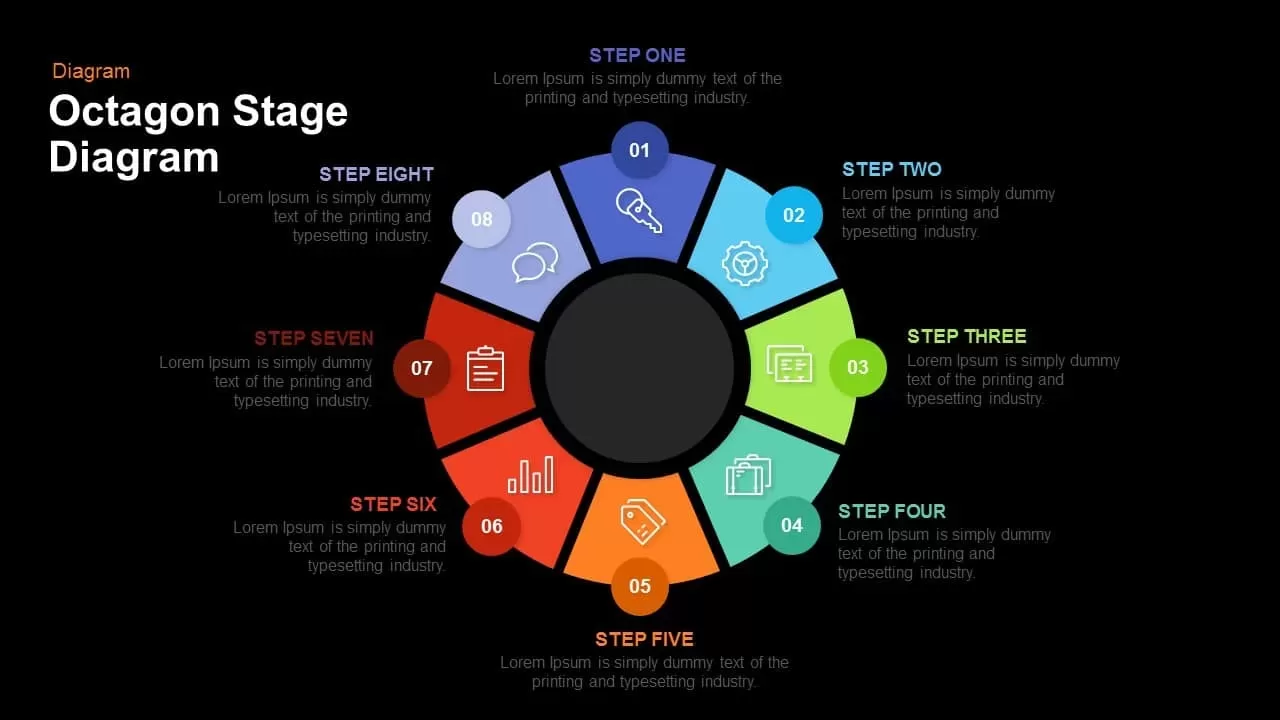
Octagon Stage Process Flow Diagram for PowerPoint & Google Slides
Process
Five Circular Flow Arrow Diagram for PowerPoint & Google Slides
Arrow
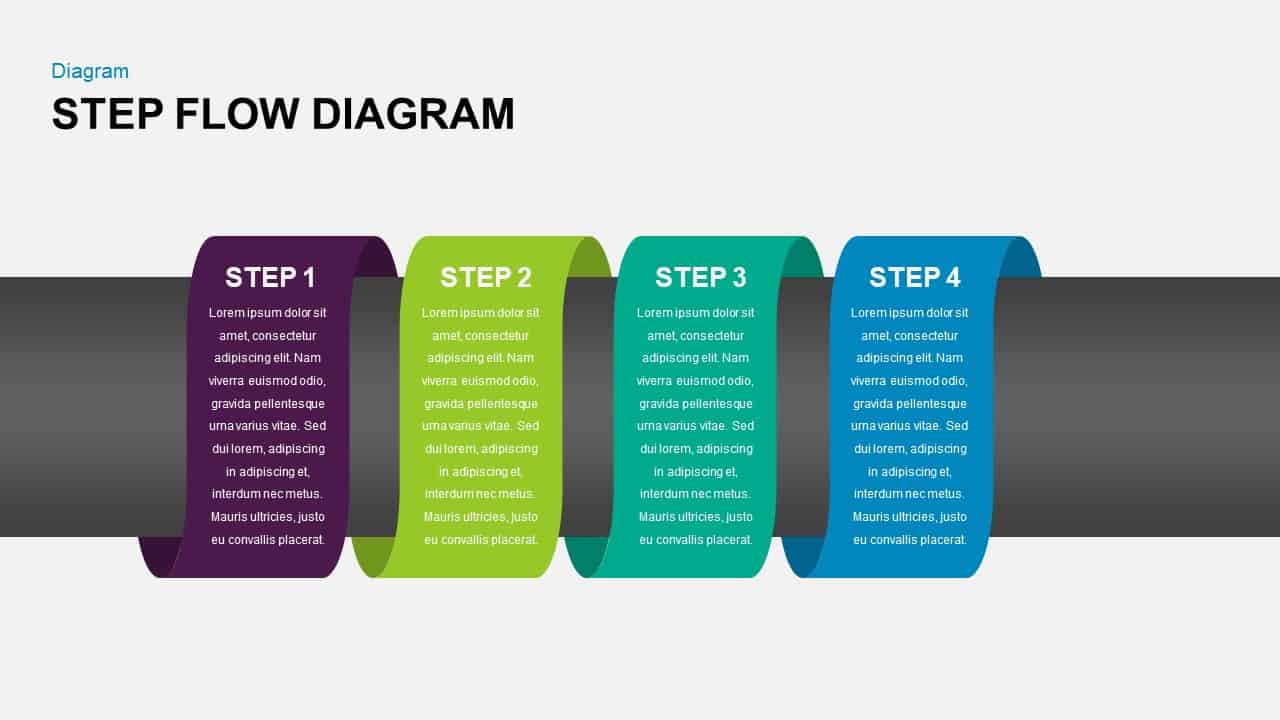
Step Flow Diagram for PowerPoint & Google Slides
Process
8 Step Linear Process Flow Diagram for PowerPoint & Google Slides
Process
5 Step Process Flow Diagram for PowerPoint & Google Slides
Process
Color-Coded SIPOC Diagram with Process Flow for PowerPoint & Google Slides
Process