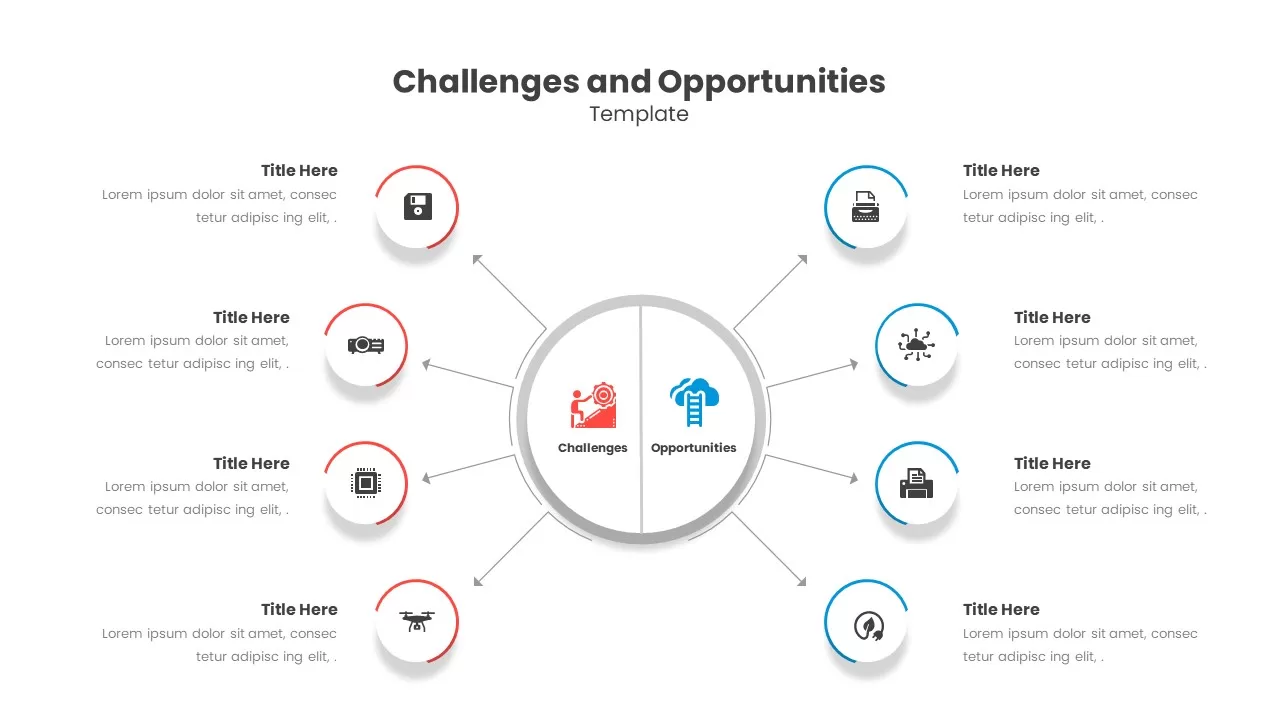
Opportunities Quadrant Diagram Template for PowerPoint & Google Slides


Description
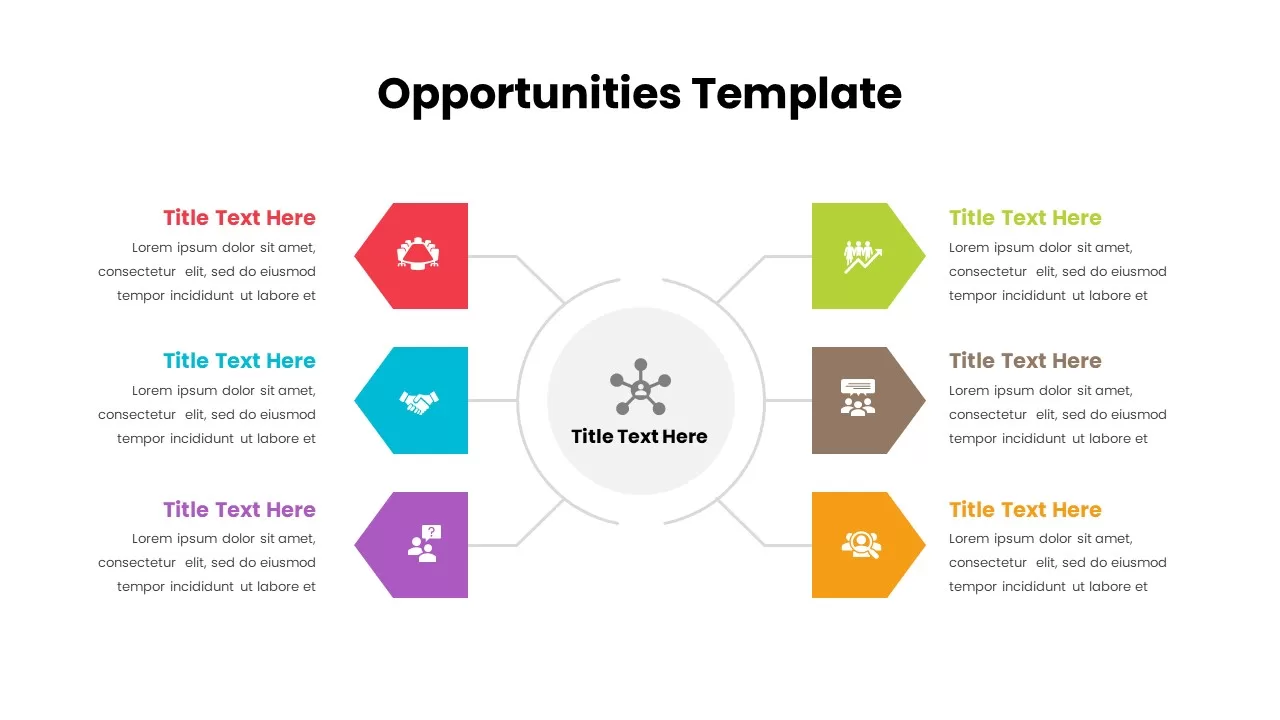
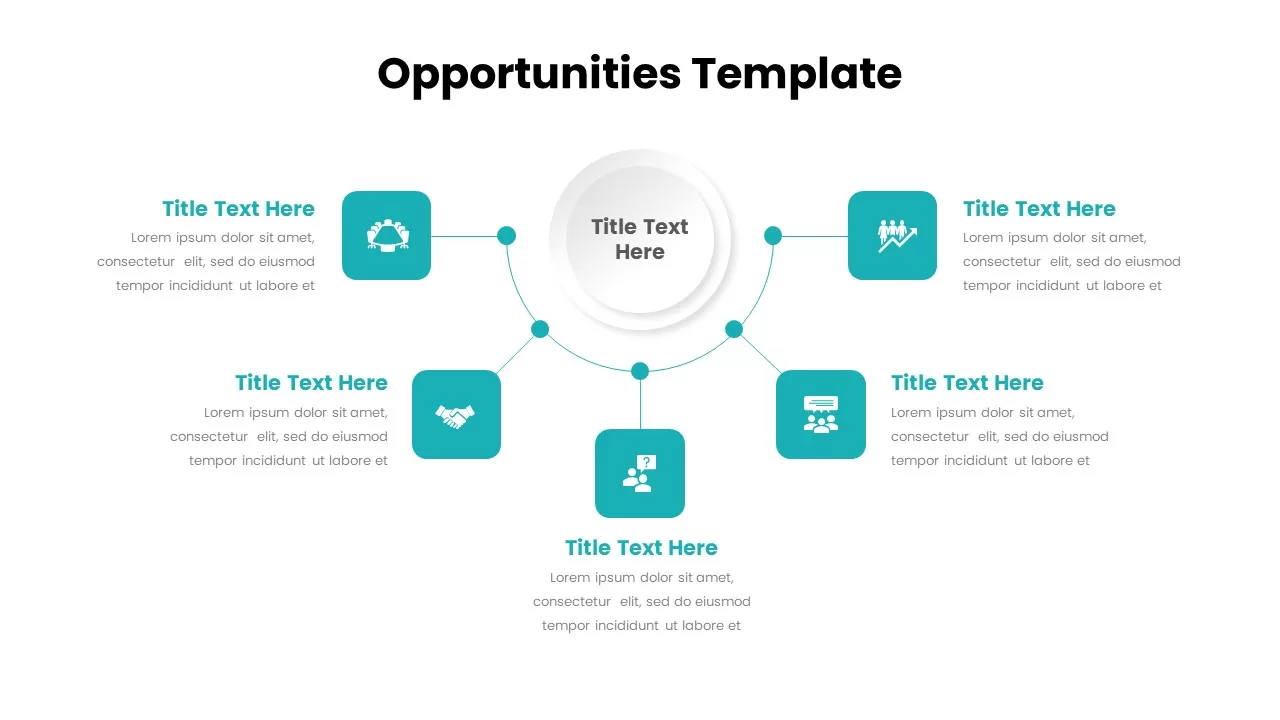
Use this radial quadrant diagram slide to map and compare four strategic opportunity areas in PowerPoint & Google Slides. A multi-layered circular hub anchors the layout, while four color-coded arrow-shaped callouts—two on each side—point outward along horizontal and vertical axes. Each callout features a square icon placeholder, a bold title area, and a supporting text block for concise descriptions. Subtle connector lines guide the viewer’s eye from the hub to each node, reinforcing relationships without clutter. Built on fully editable slide masters with vector shapes, this template lets you swap icons, adjust arrow shapes, reposition callouts, and modify color accents in seconds to align with your brand identity. Ample white space and clean typography ensure readability across in-person presentations and virtual meetings, while subtle drop shadows add a professional, polished aesthetic. Whether you’re facilitating a strategy session, conducting a market analysis, or outlining product growth paths, this design brings clarity to complex information and fosters engaging discussions. The central hub can be resized or recolored to emphasize different core themes, and additional callouts can be added for extended frameworks or future roadmap elements, making this slide a versatile asset for agile and executive-level presentations.
Master theme controls allow global updates to fonts, color themes, and connector styles, ensuring consistency across all deck slides with a single click. Optional built-in animation placeholders help you reveal each quadrant sequentially, pacing discussions and maintaining audience focus. Fully scalable on any device, this slide guarantees pixel-perfect clarity on desktop, tablet, or mobile platforms, eliminating resolution or formatting issues during stakeholder briefings.
Who is it for
Product Managers, Strategy Leads, Marketing Directors, and Business Analysts will benefit from this template when brainstorming growth opportunities, presenting market insights, or aligning stakeholders on strategic priorities. Consultants and executive teams can also leverage it for interactive workshops.
Other Uses
Beyond opportunity mapping, repurpose this layout for risk assessments, input-output frameworks, ecosystem overviews, or customer journey stages. Duplicate arrow callouts to illustrate additional dimensions, adjust hub labels for timeline markers, or invert axes for threat-vs-solution analyses—expanding versatility across project needs.
Login to download this file

Item ID
SB02850
Related Templates

Opportunities Hub-and-Spoke Comparison Diagram Template for PowerPoint & Google Slides
Opportunities Challenges
Opportunities Hub-and-Spoke Diagram Template for PowerPoint & Google Slides
Circular
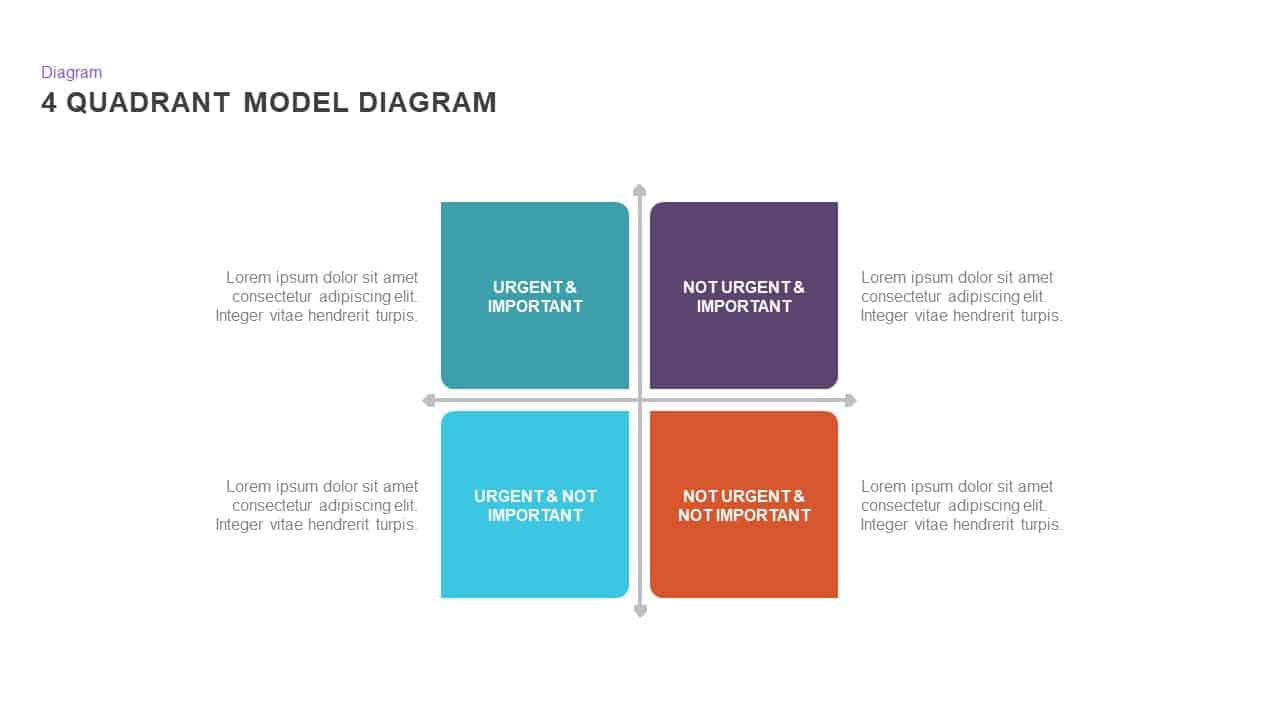
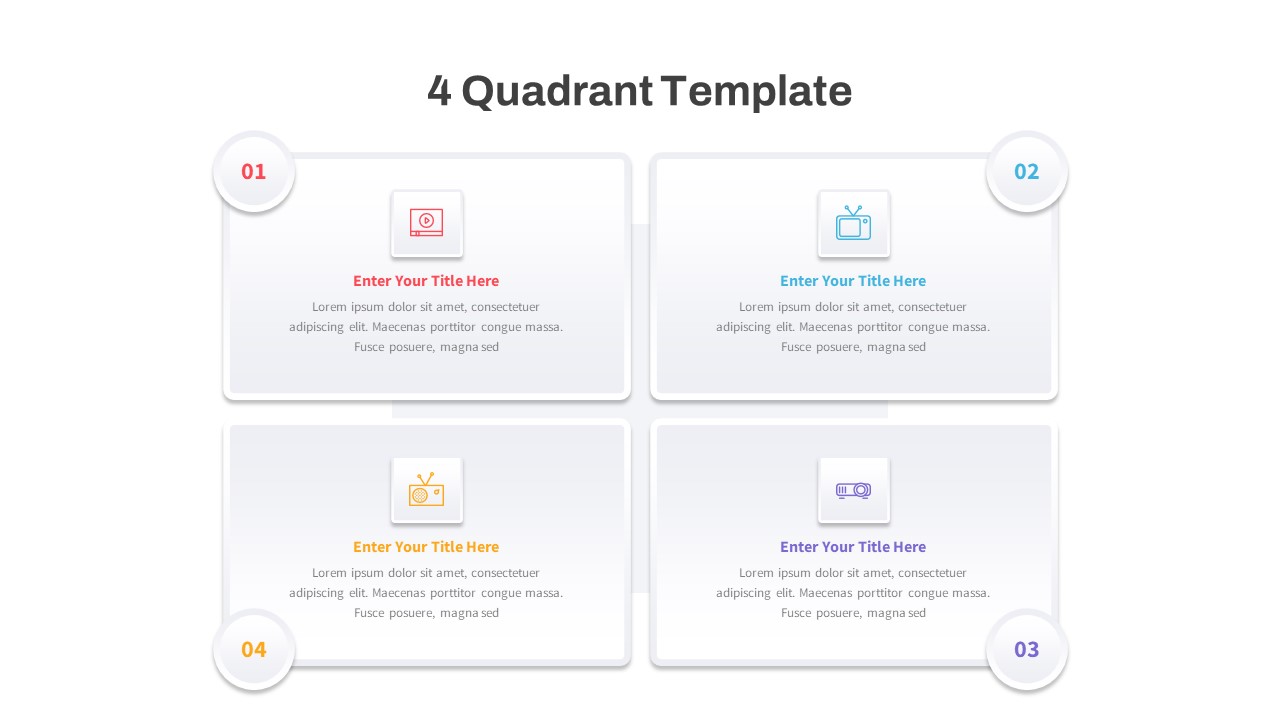
4 Quadrant Model Diagram template for PowerPoint & Google Slides
Process
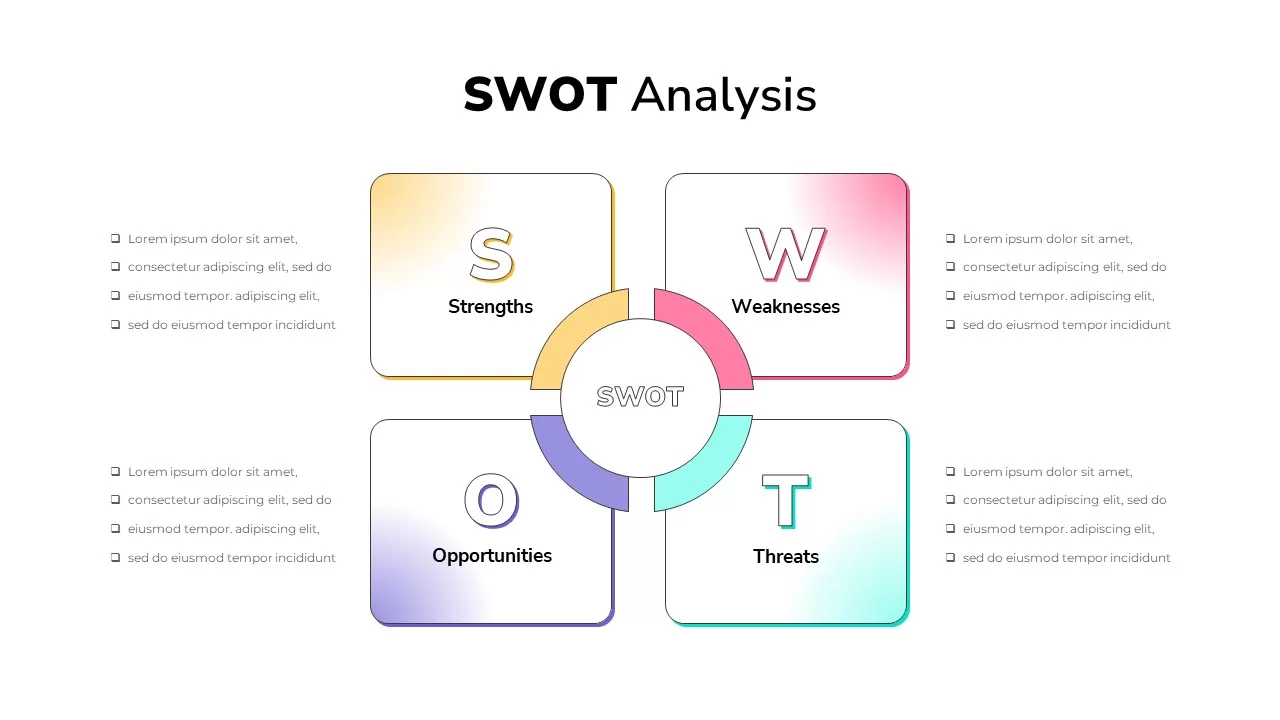
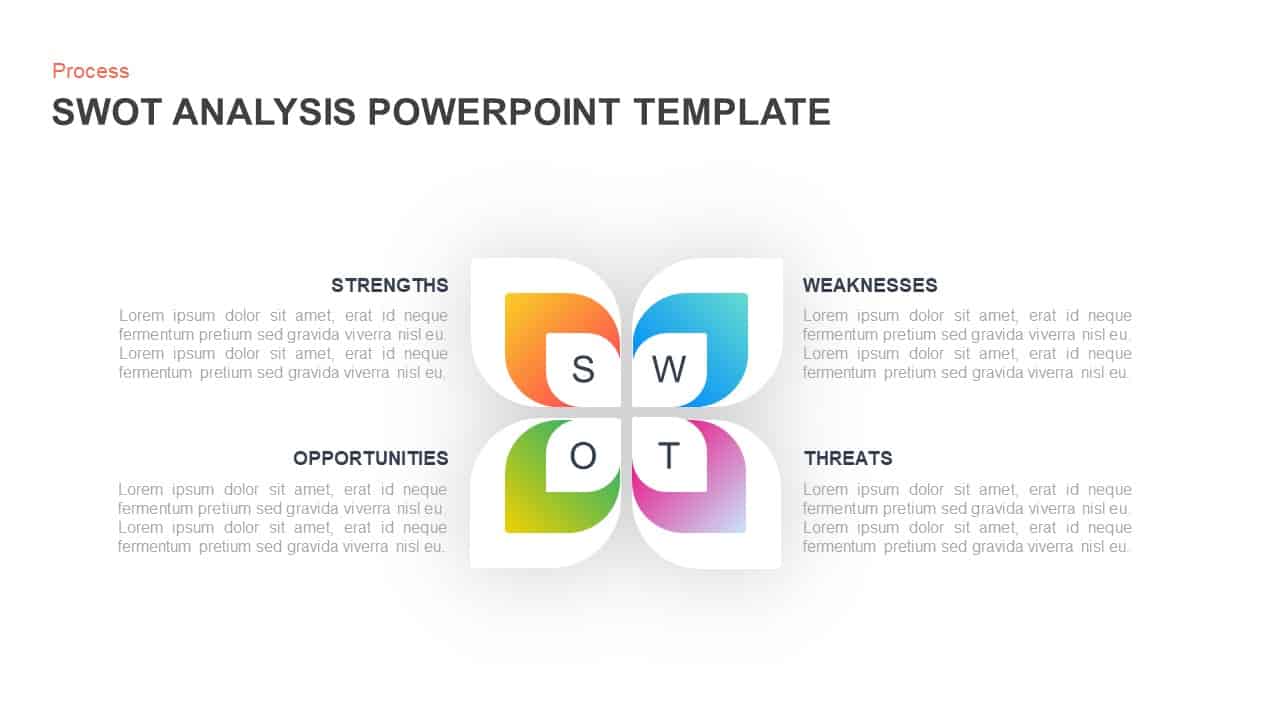
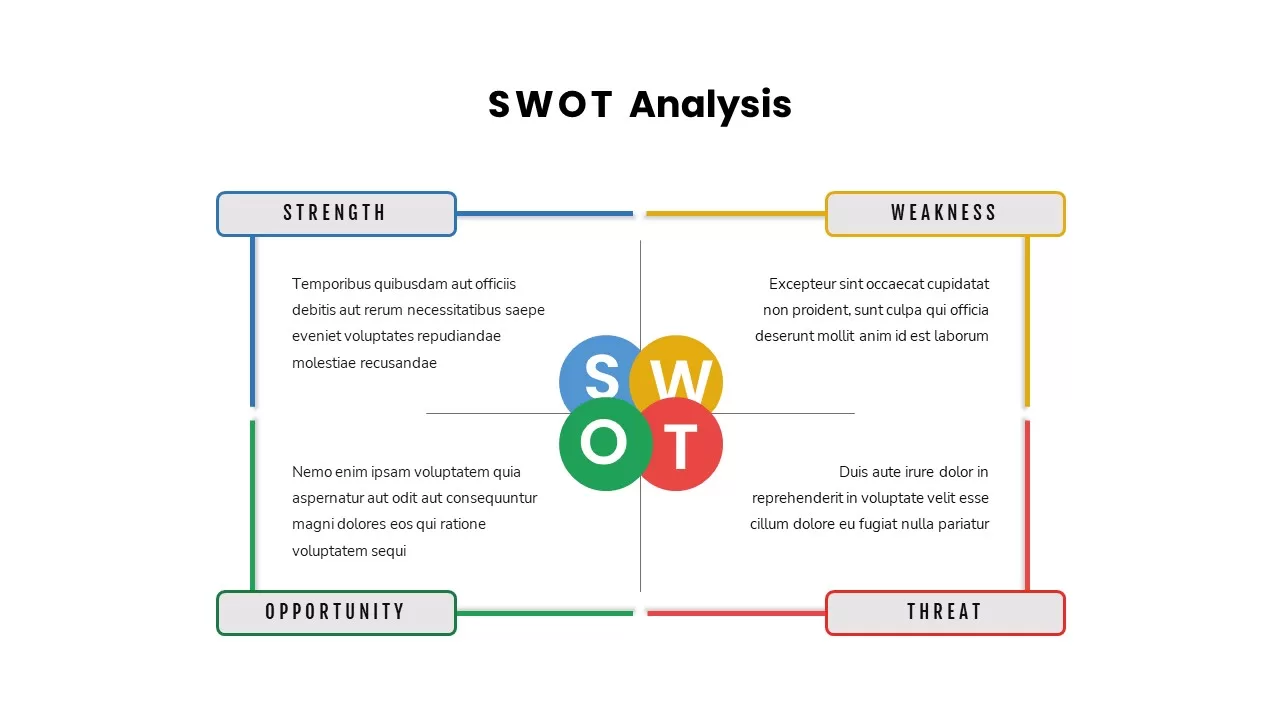
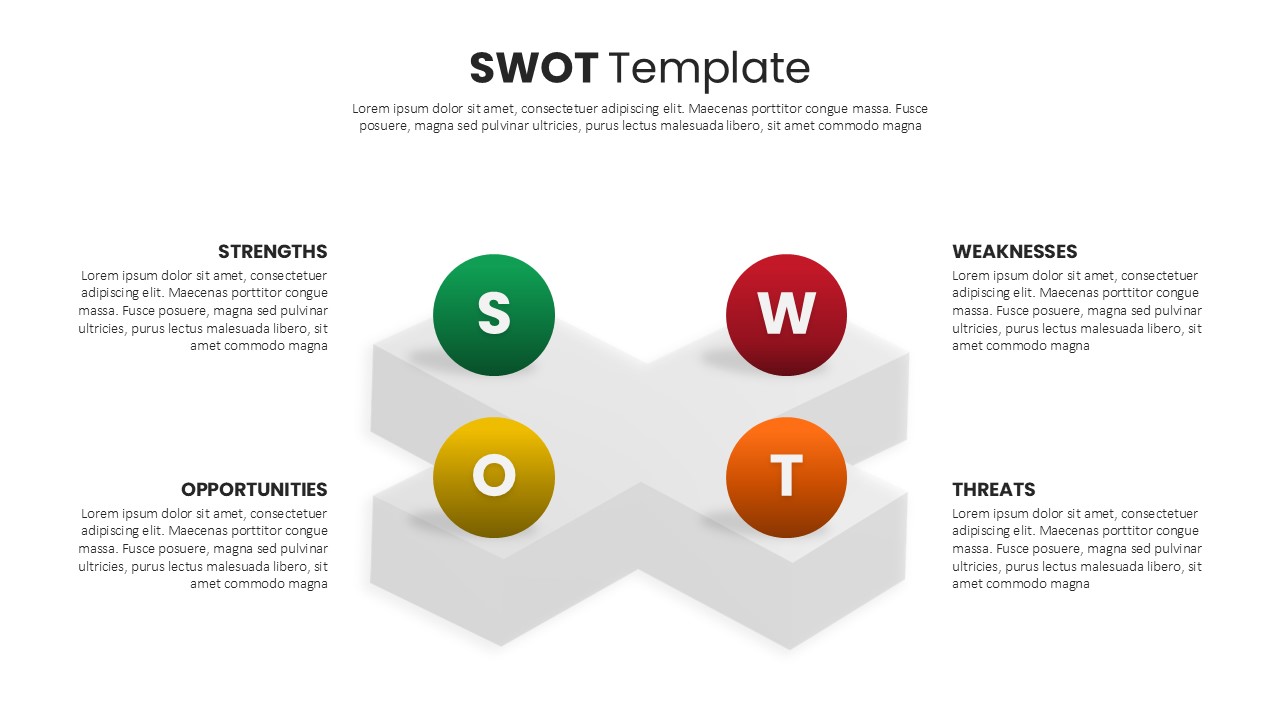
Four-Quadrant SWOT Analysis Diagram Template for PowerPoint & Google Slides
SWOT

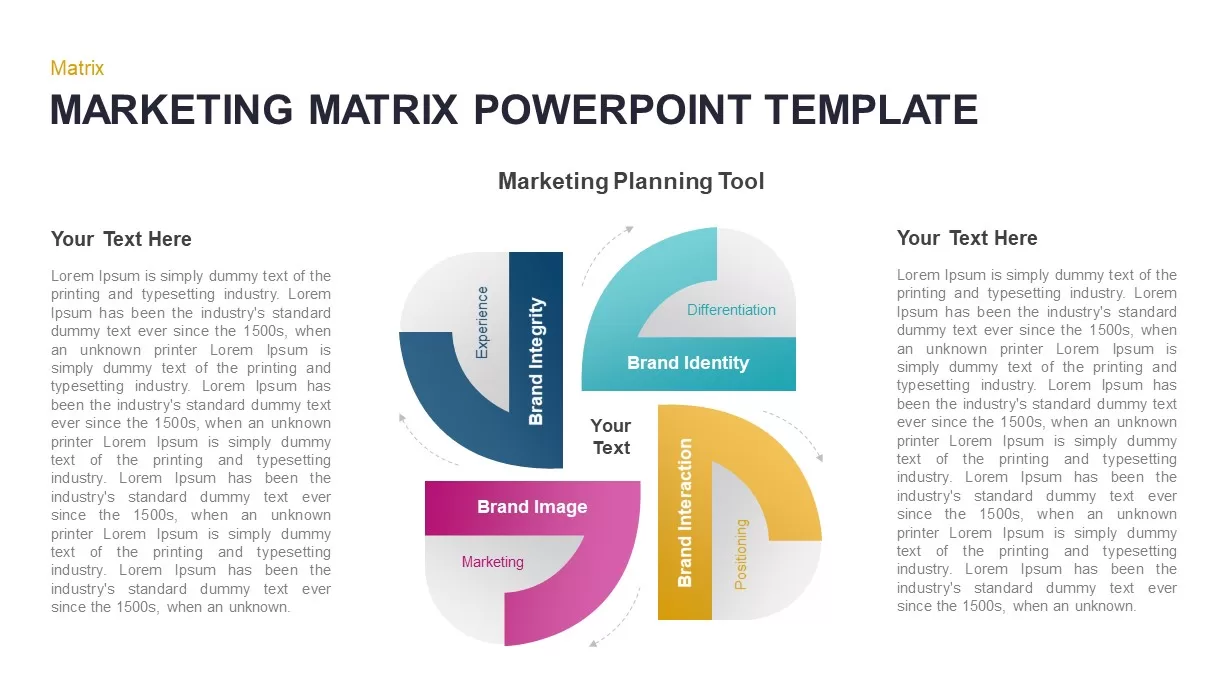
Marketing Matrix Brand Quadrant Diagram Template for PowerPoint & Google Slides
Process
Gradient SWOT Quadrant Diagram Template for PowerPoint & Google Slides
SWOT
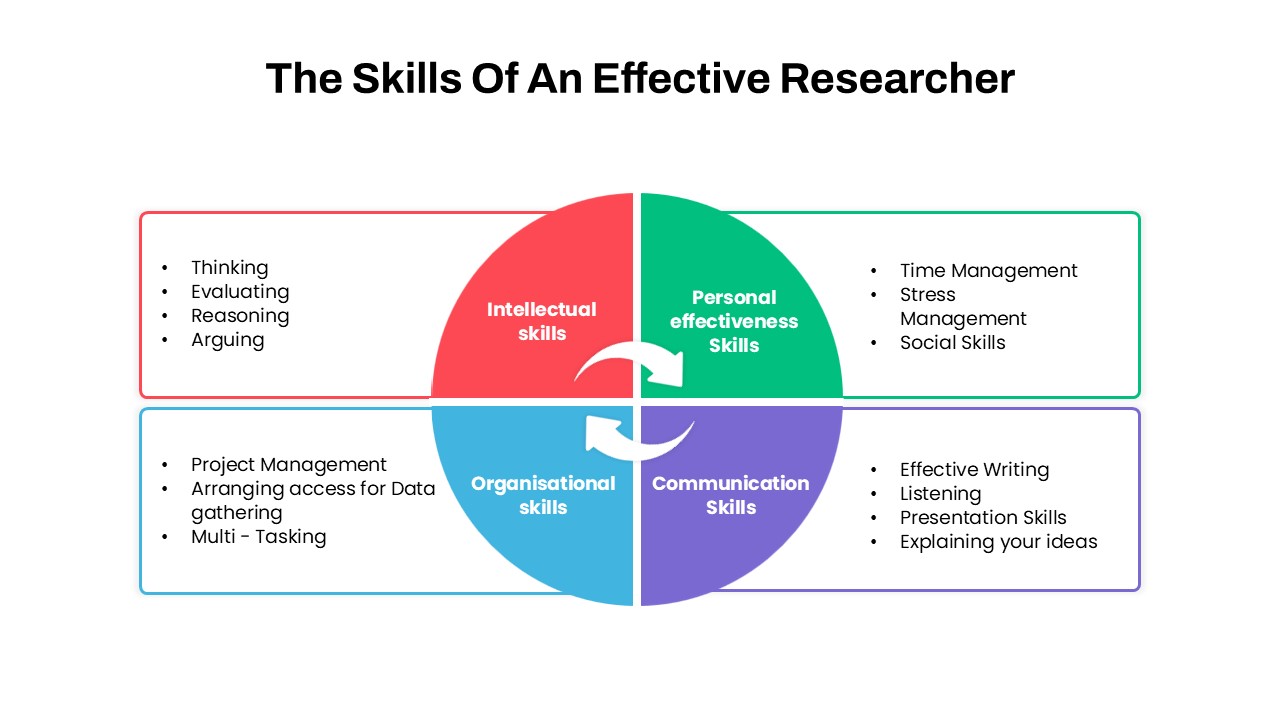
Researcher Skills Quadrant Diagram Template for PowerPoint & Google Slides
Circular
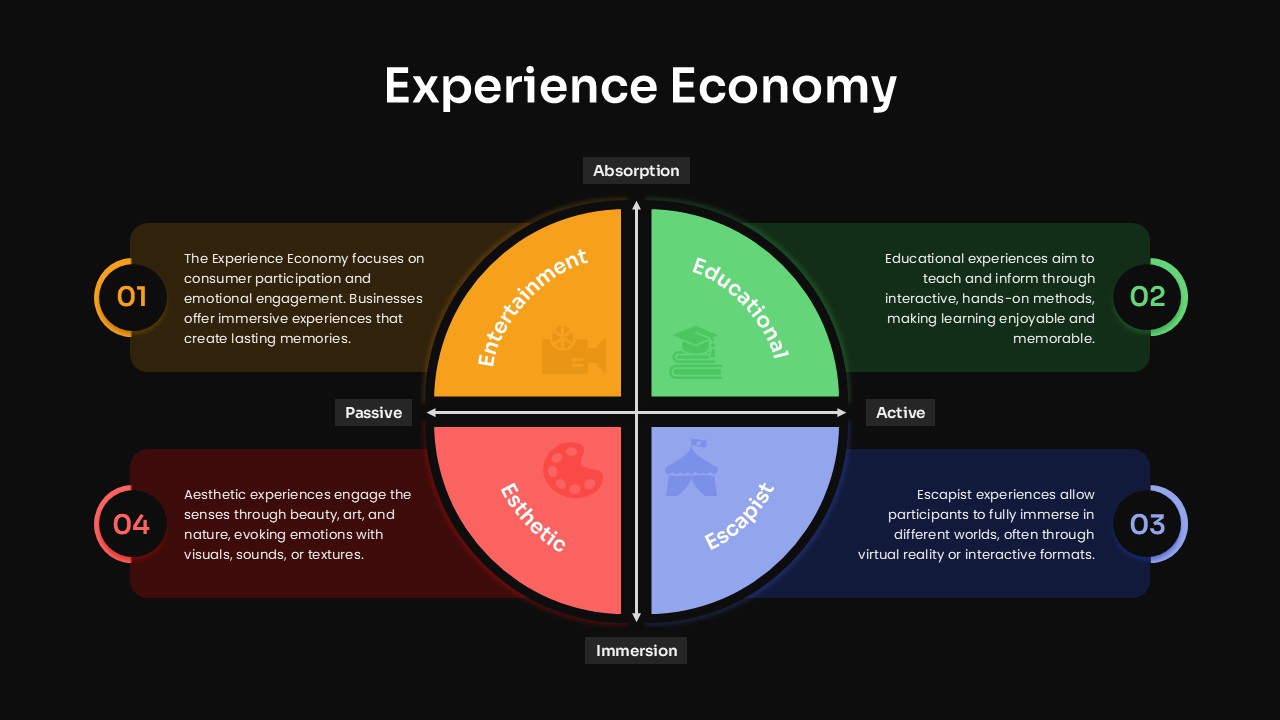
Experience Economy Quadrant Diagram Template for PowerPoint & Google Slides
Circular
Challenges & Opportunities Hub-Spoke Template for PowerPoint & Google Slides
Circular
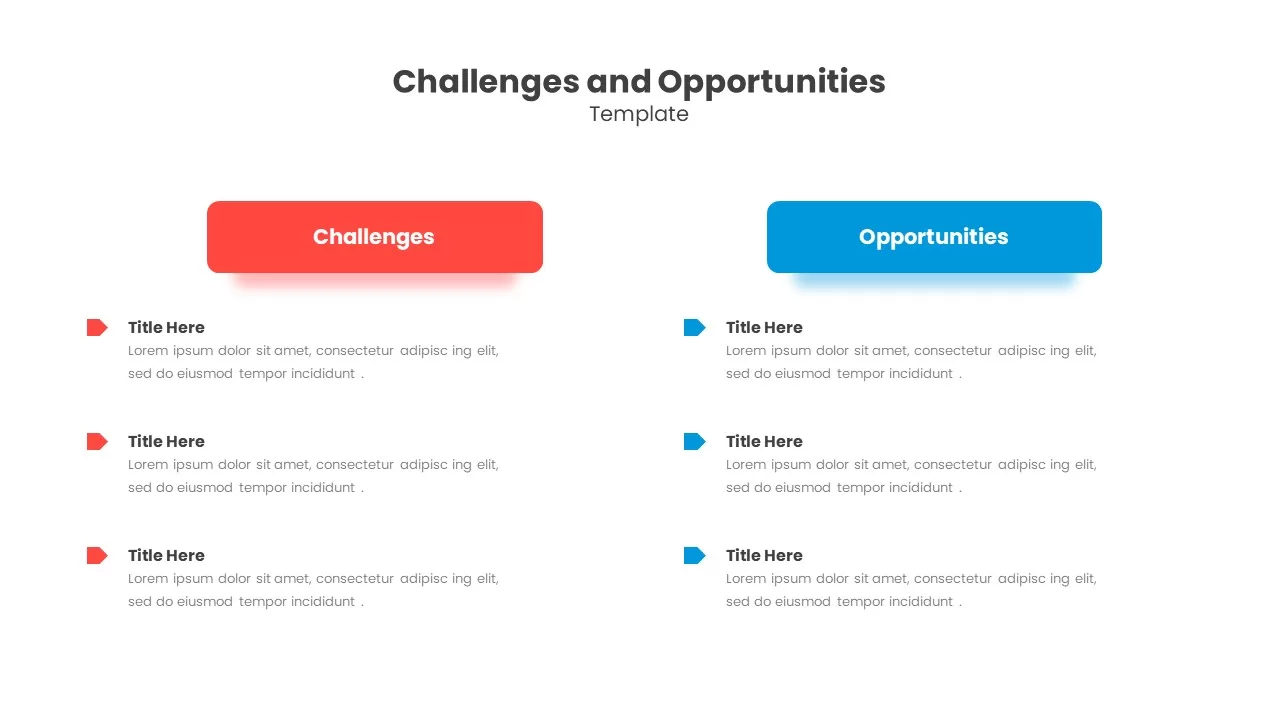
Challenges & Opportunities Comparison Template for PowerPoint & Google Slides
Opportunities Challenges
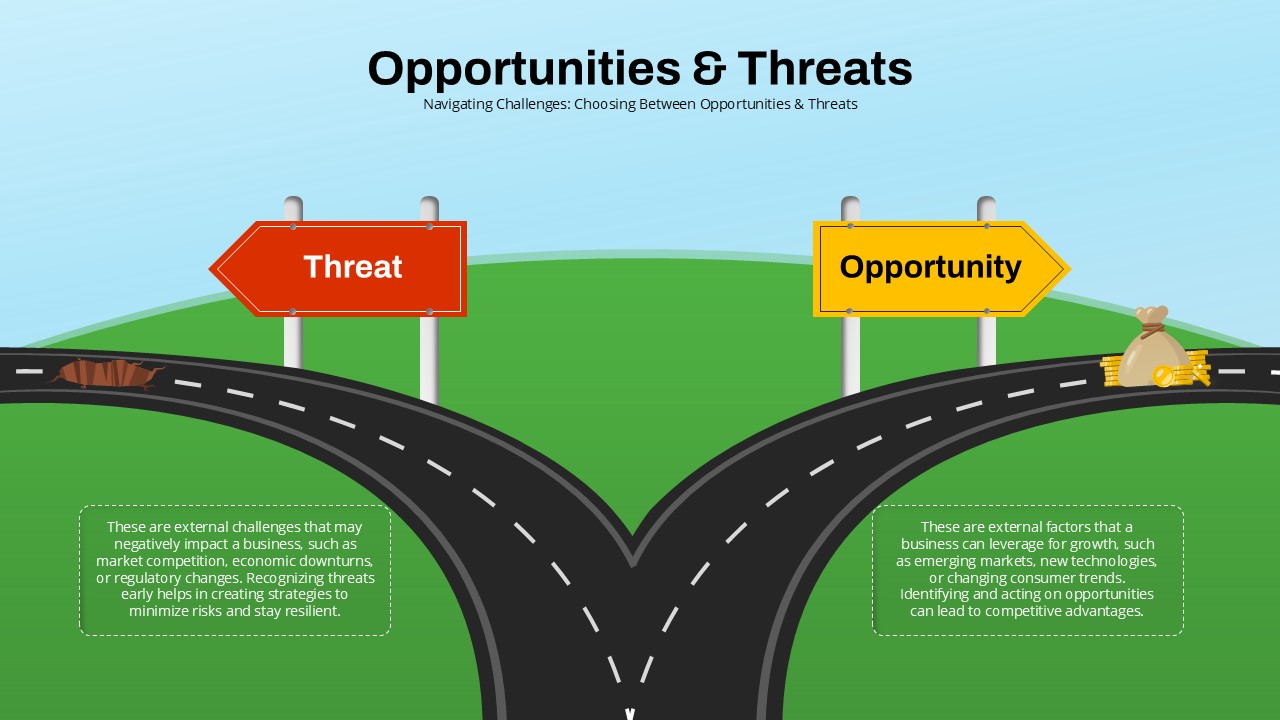
Opportunities & Threats Decision Roadmap Template for PowerPoint & Google Slides
Comparison
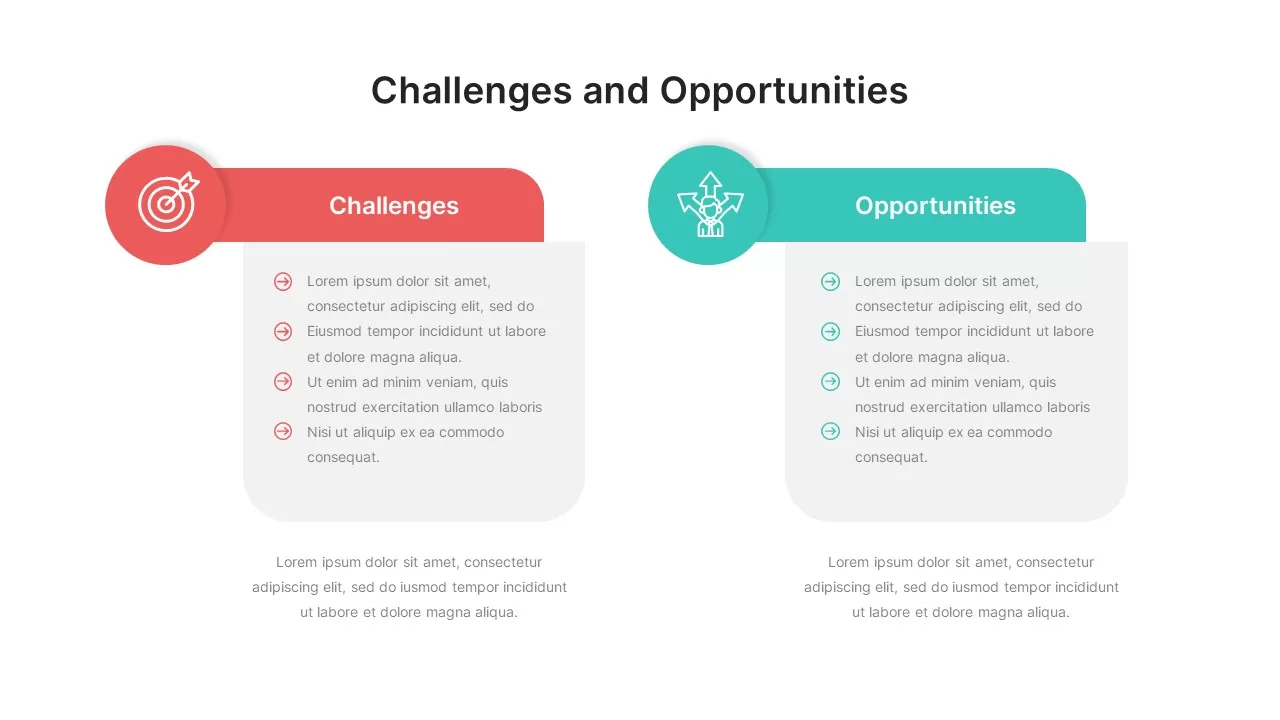
Challenges and Opportunities Comparison Slide for PowerPoint & Google Slides
Opportunities Challenges
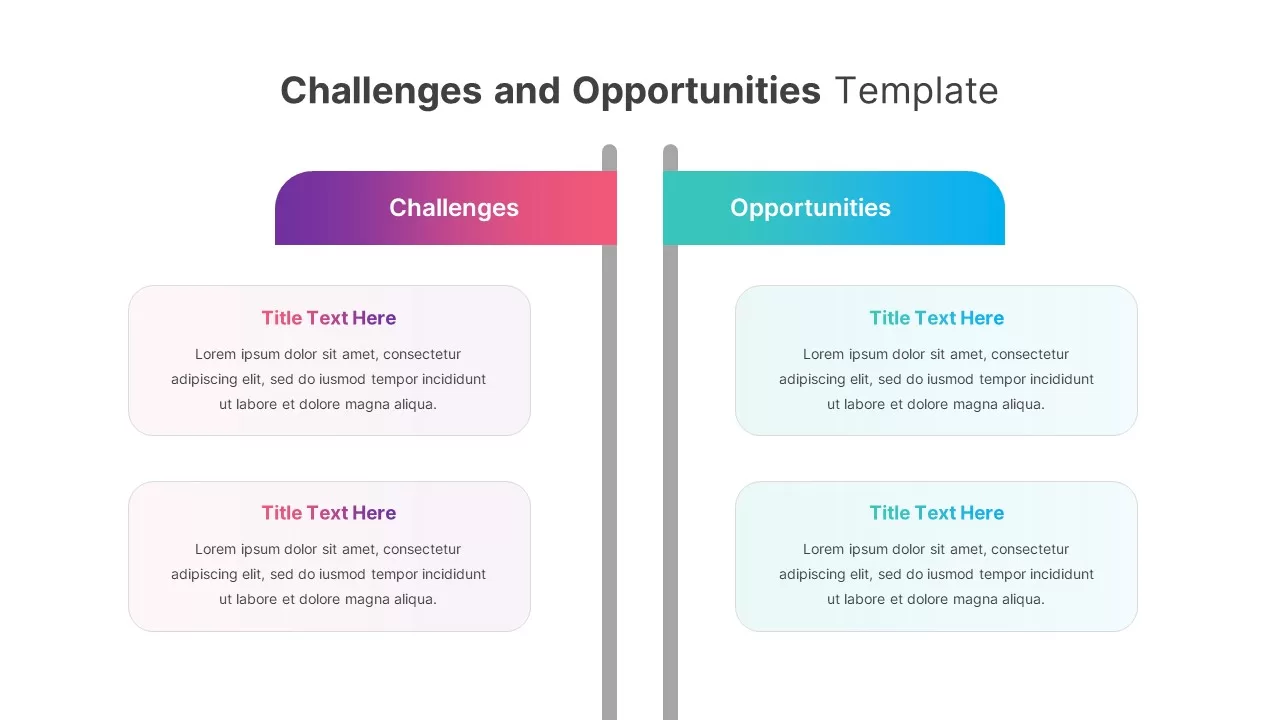
Gradient Challenges and Opportunities Slide for PowerPoint & Google Slides
Opportunities Challenges
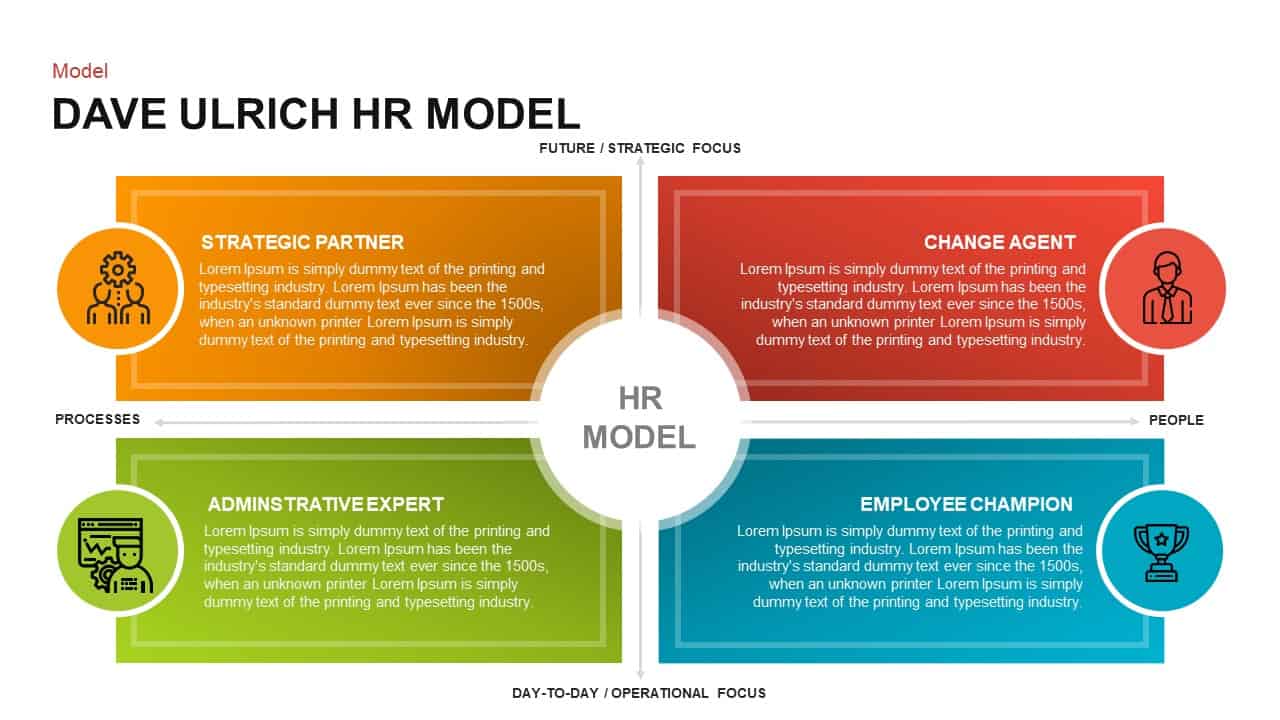
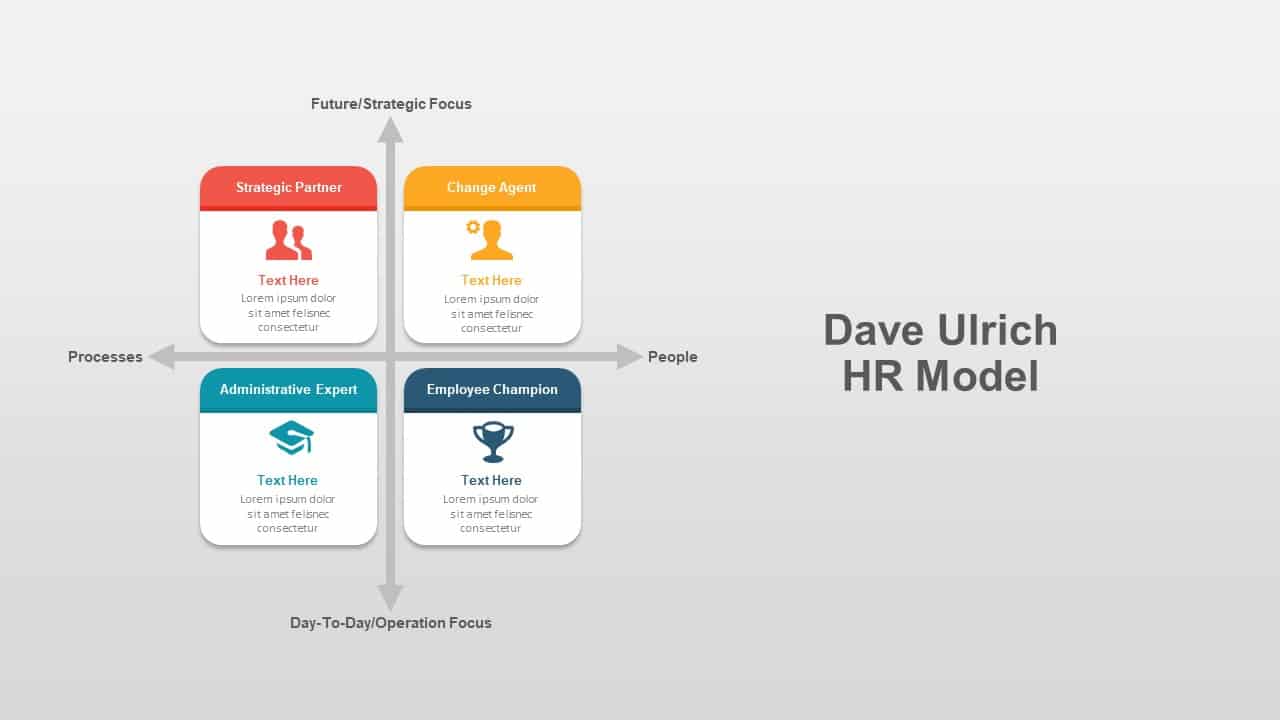
Dave Ulrich Strategic HR Model Quadrant Template for PowerPoint & Google Slides
Employee Performance
Gradient Petal SWOT Analysis Quadrant Template for PowerPoint & Google Slides
SWOT
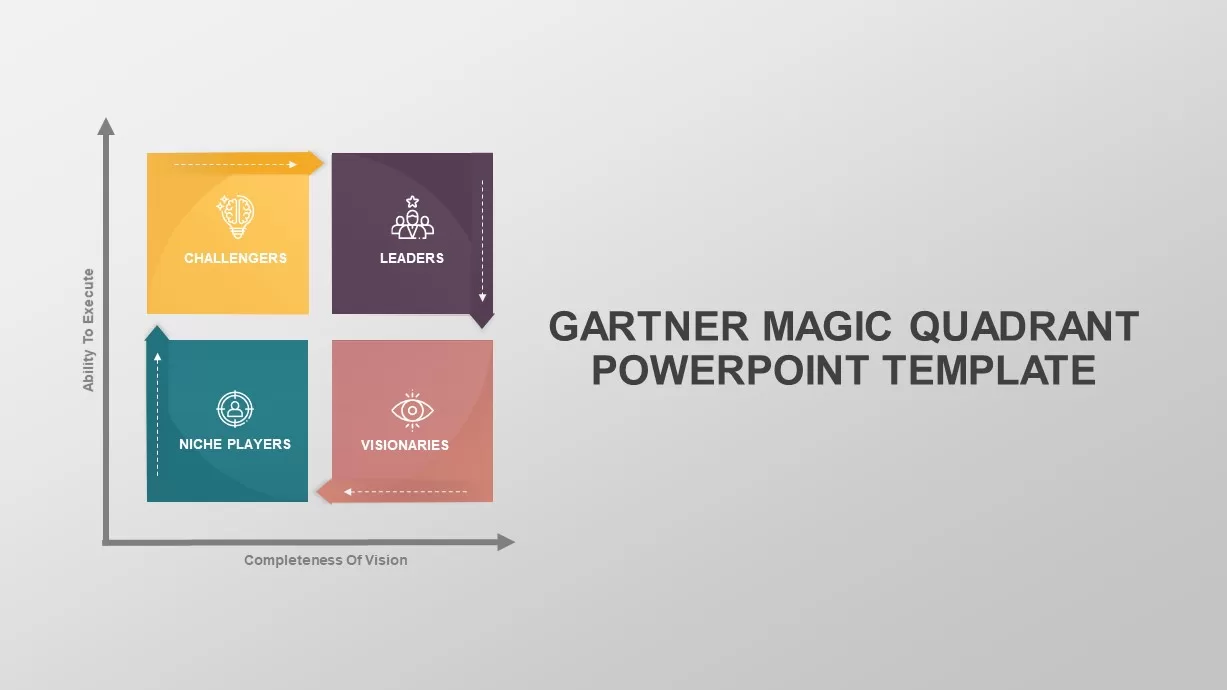
Gartner Magic Quadrant Analysis Template for PowerPoint & Google Slides
Business
Editable Four-Quadrant TOWS Matrix Template for PowerPoint & Google Slides
Opportunities Challenges
Modern Colorful SWOT Quadrant Analysis Template for PowerPoint & Google Slides
SWOT
Colorful SWOT Analysis Quadrant Template for PowerPoint & Google Slides
SWOT
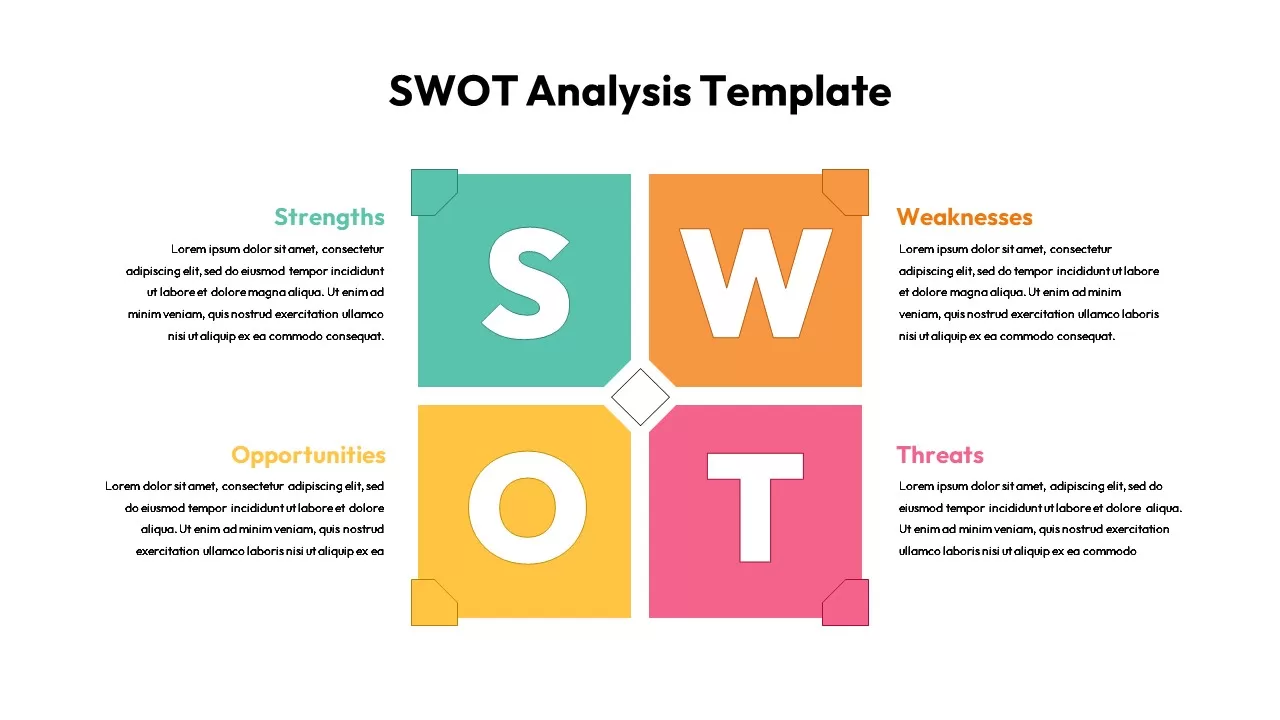
SWOT Analysis Quadrant template for PowerPoint & Google Slides
Business Strategy
SWOT Analysis Quadrant template for PowerPoint & Google Slides
Business Strategy
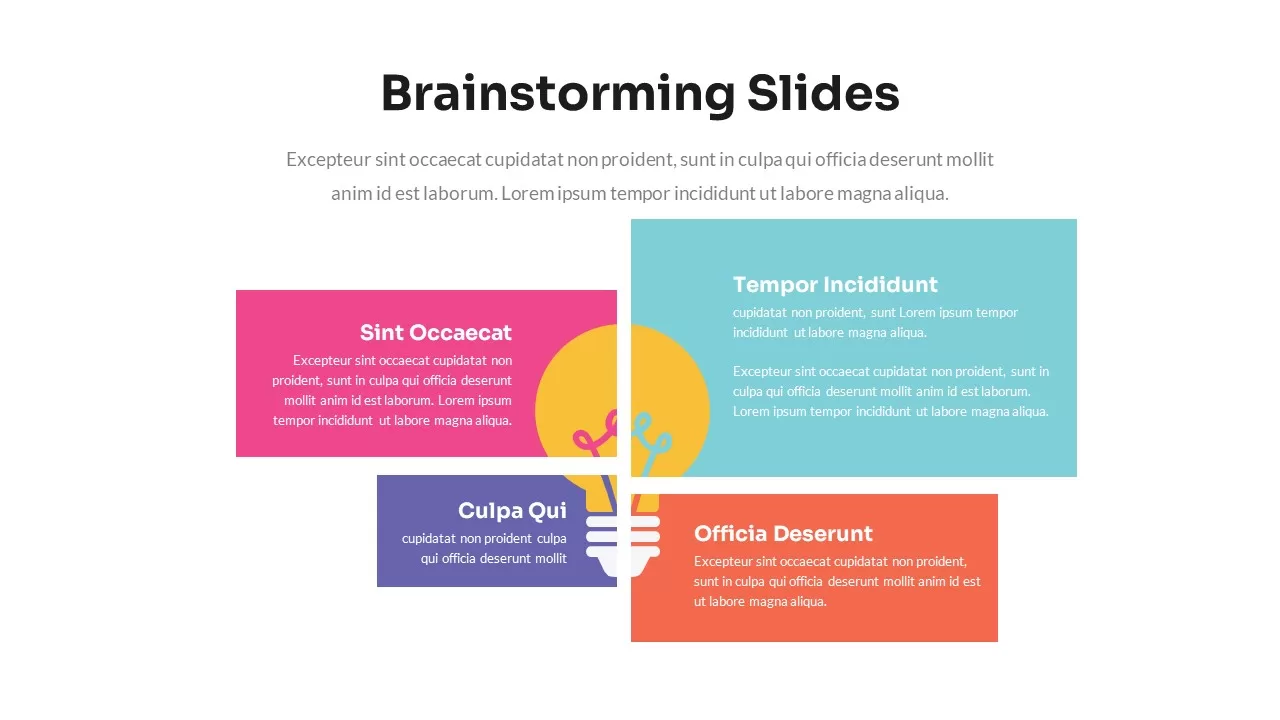
Modern Brainstorming Quadrant Slide Template for PowerPoint & Google Slides
Business Strategy
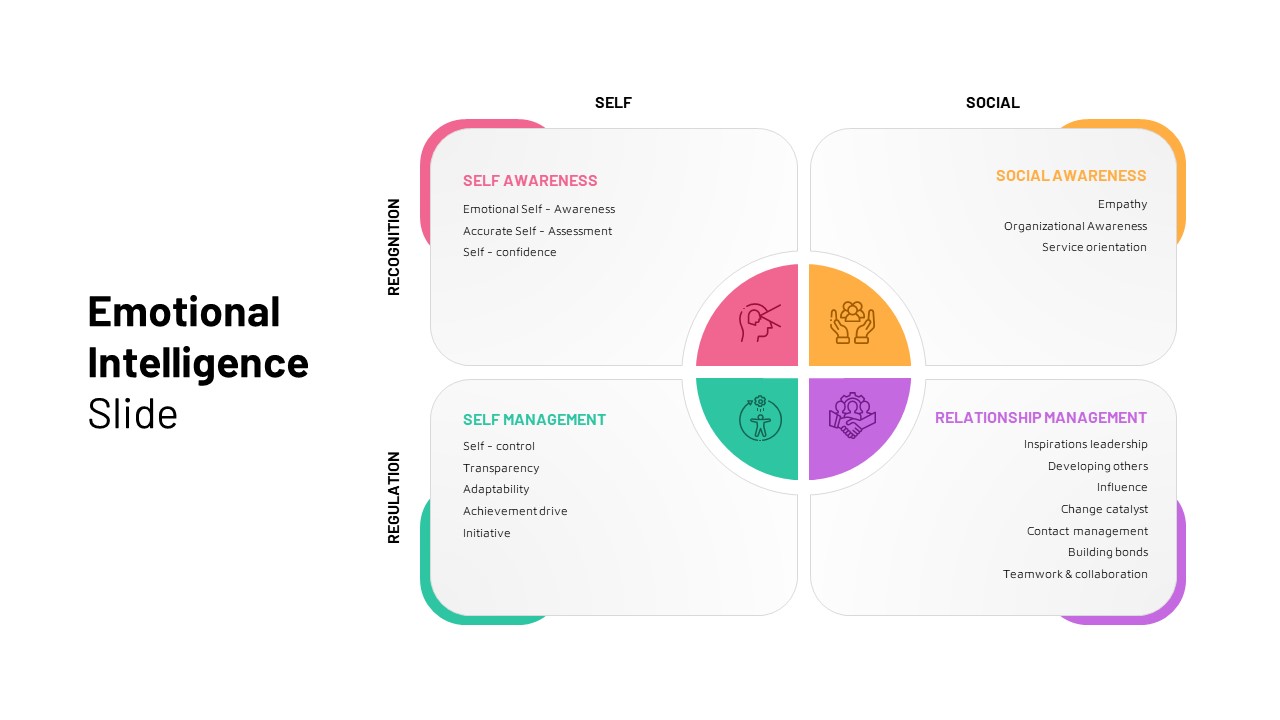
Emotional Intelligence Quadrant Template for PowerPoint & Google Slides
Circular
Four Quadrant Scatter Chart Analysis Template for PowerPoint & Google Slides
Comparison Chart
Free 4 Quadrant Template for PowerPoint & Google Slides
Business
Free
Free Balanced Scorecard Quadrant KPI Layout Template for PowerPoint & Google Slides
Employee Performance
Free
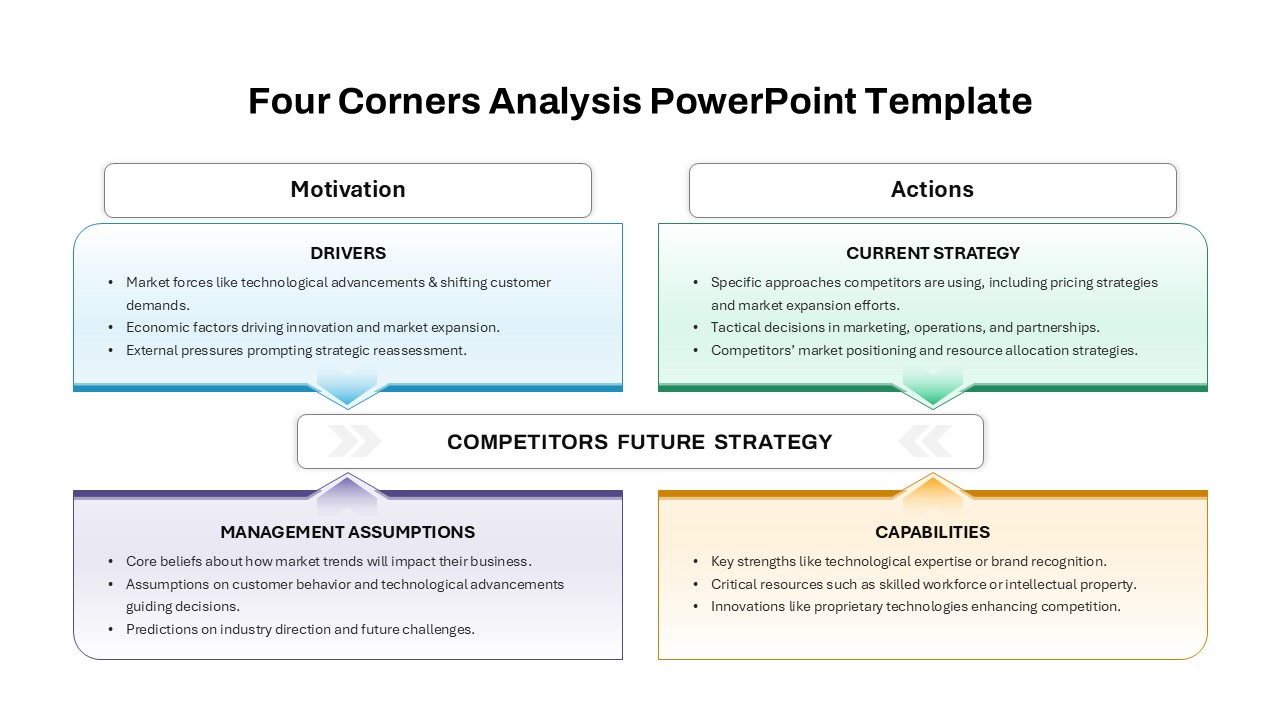
Four-Corners Strategic Analysis Quadrant Template for PowerPoint & Google Slides
SWOT
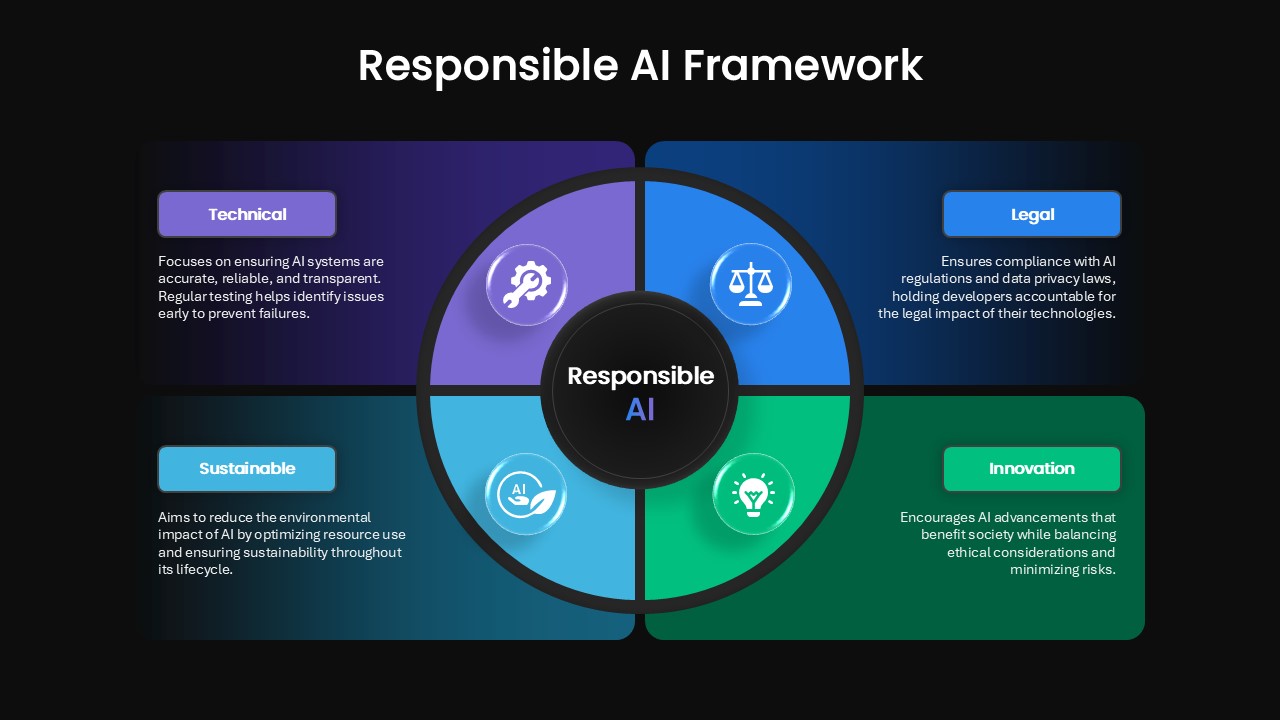
Four-Quadrant Responsible AI Framework Template for PowerPoint & Google Slides
Circular
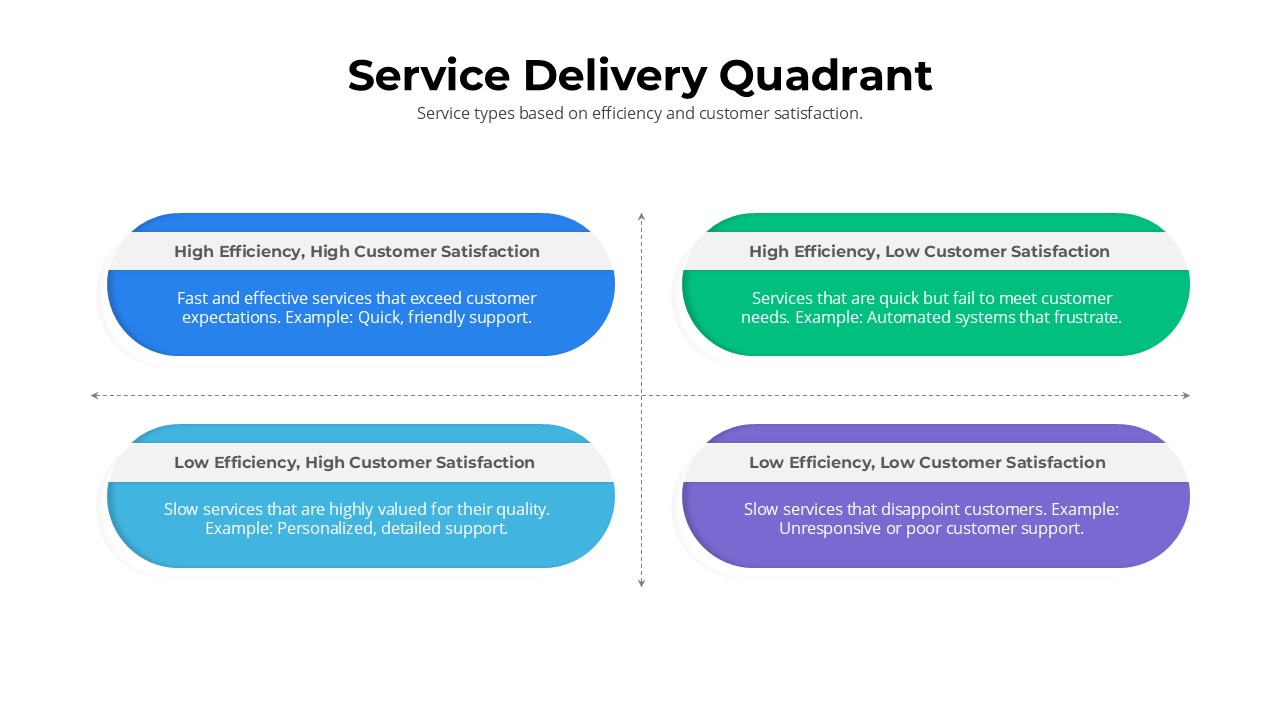
Service Delivery Quadrant Slide Template for PowerPoint & Google Slides
Comparison
Colorful SWOT Analysis Quadrant Template for PowerPoint & Google Slides
SWOT
Multi Color SWOT Analysis Quadrant Template for PowerPoint & Google Slides
SWOT
3D Quadrant SWOT Analysis Template for PowerPoint & Google Slides
SWOT
Dave Ulrich HR Model 4-Quadrant Slide Deck for PowerPoint & Google Slides
HR
Snake Diagram Pack of 8 Slides template for PowerPoint & Google Slides
Process
Gear Process Diagram PowerPoint Template for PowerPoint & Google Slides
Process
Sales Process Workflow Funnel Diagram PowerPoint Template for PowerPoint & Google Slides
Funnel
Puzzle Diagram PowerPoint Template for PowerPoint & Google Slides
Process
Transportation Logistics PowerPoint Diagram template for PowerPoint & Google Slides
Process
Emoji Scale PowerPoint Diagram for PowerPoint & Google Slides
Infographics
4 Step Problem Solving PowerPoint Diagram for PowerPoint & Google Slides
Process
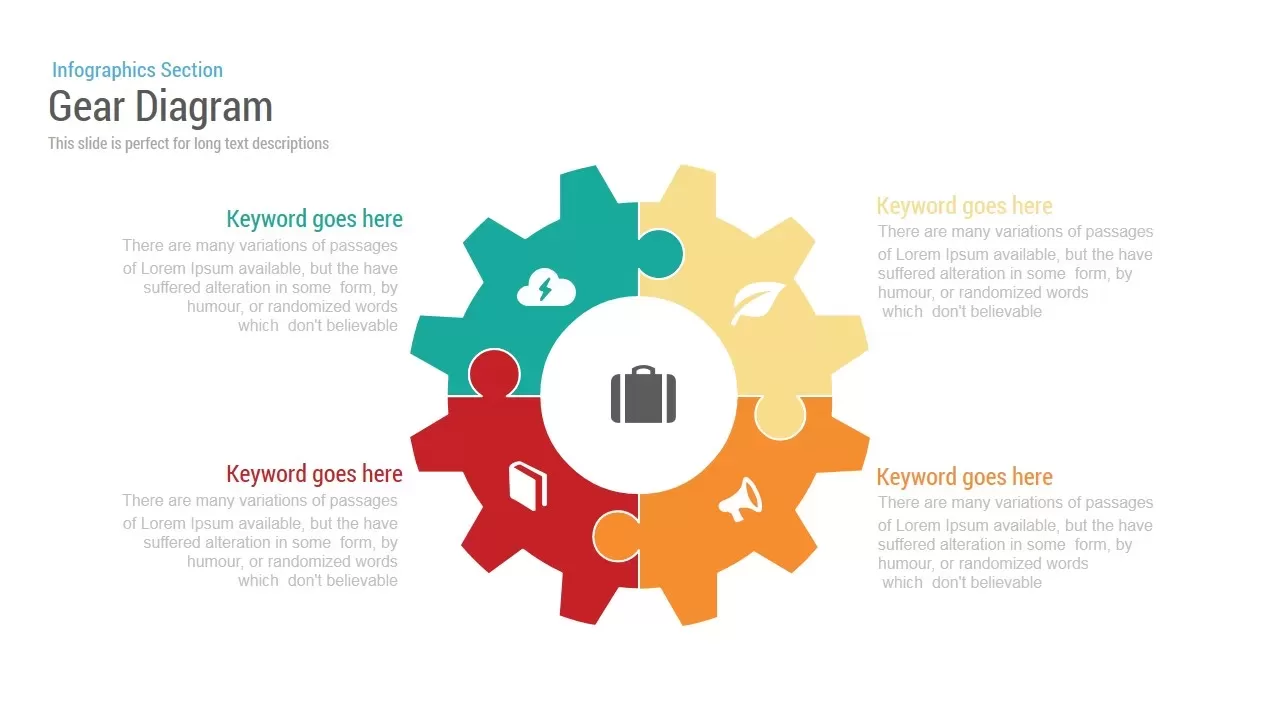
Gear Diagram template for PowerPoint & Google Slides
Process
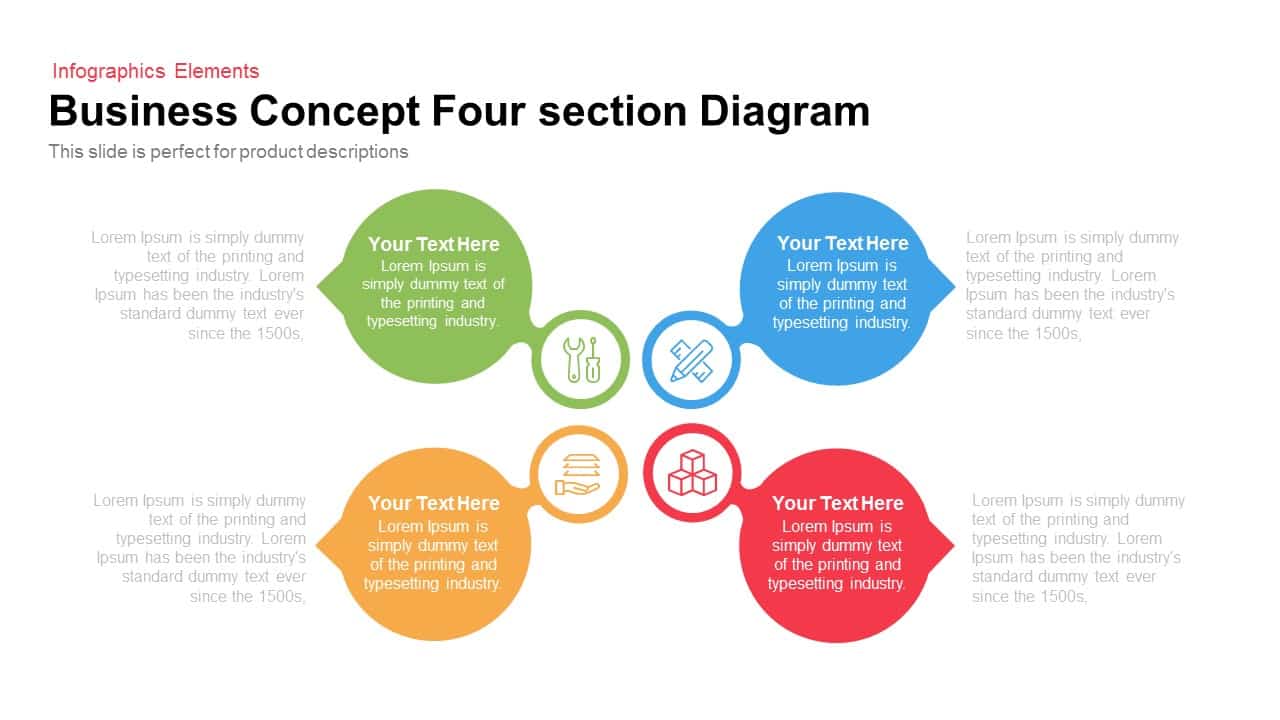
Business Concept 4 section Diagram template for PowerPoint & Google Slides
Infographics
4 Section Pipe Diagram Process Flow Template for PowerPoint & Google Slides
Process
Dynamic Shield Process Flow Diagram template for PowerPoint & Google Slides
Process
Success Key Diagram with Donut Chart Template for PowerPoint & Google Slides
Pie/Donut
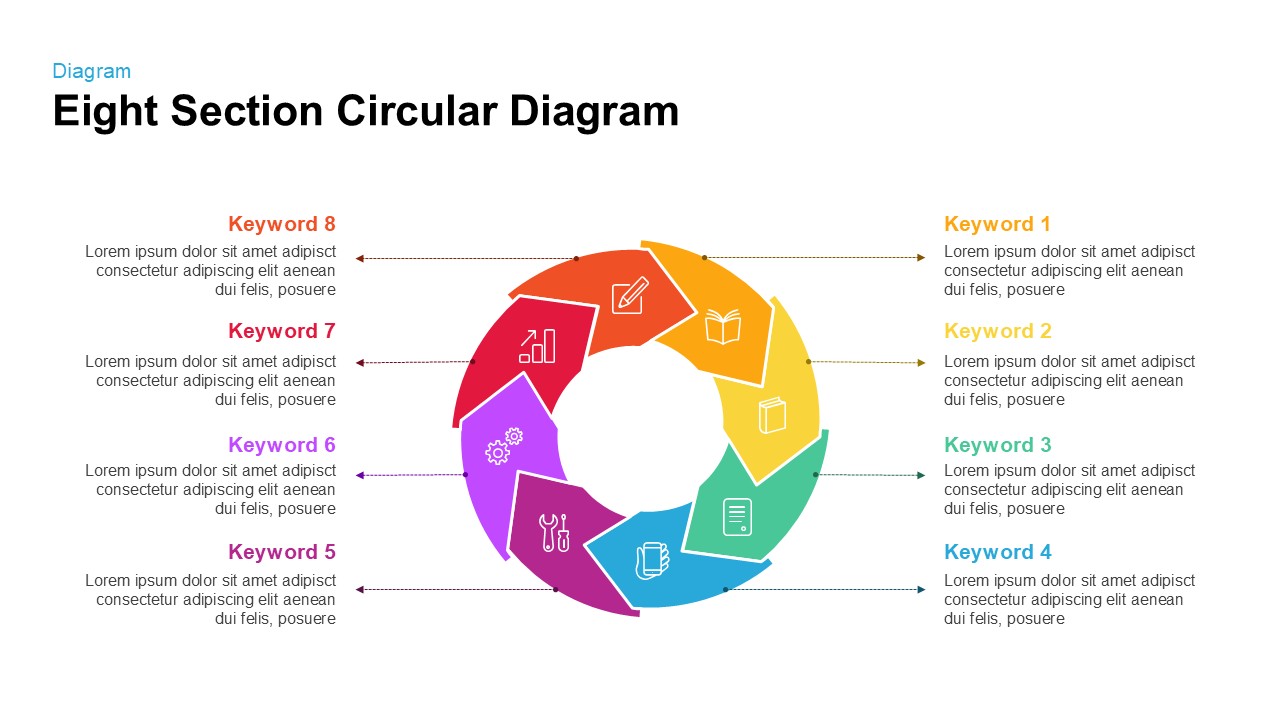
Eight Section Circular Diagram Template for PowerPoint & Google Slides
Circular
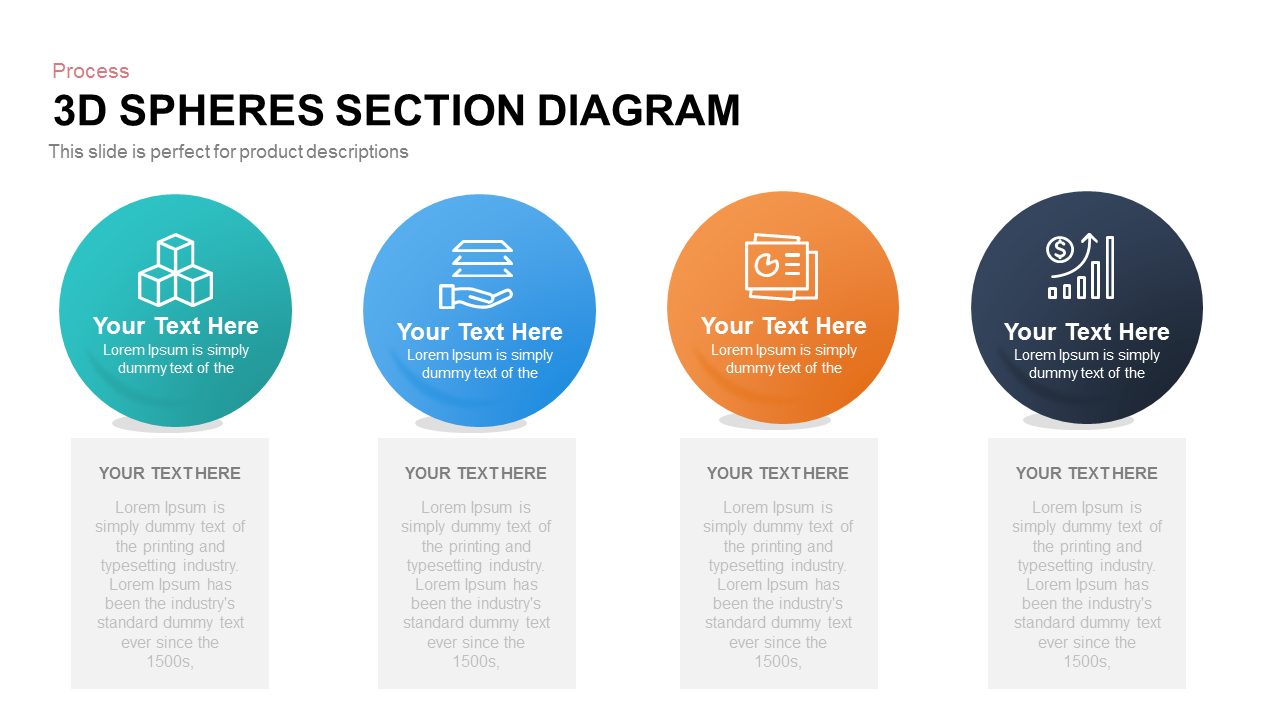
Four-Part 3D Spheres Section Diagram template for PowerPoint & Google Slides
Process

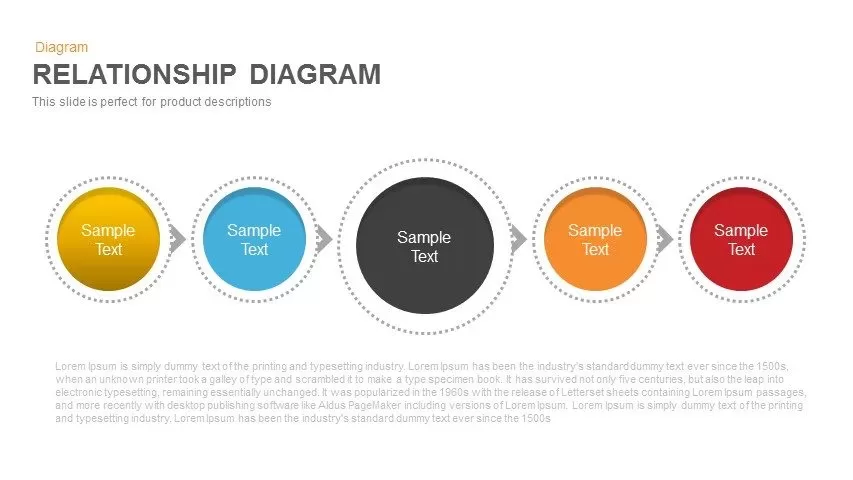
Colorful Five-Stage Relationship Diagram Template for PowerPoint & Google Slides
Process
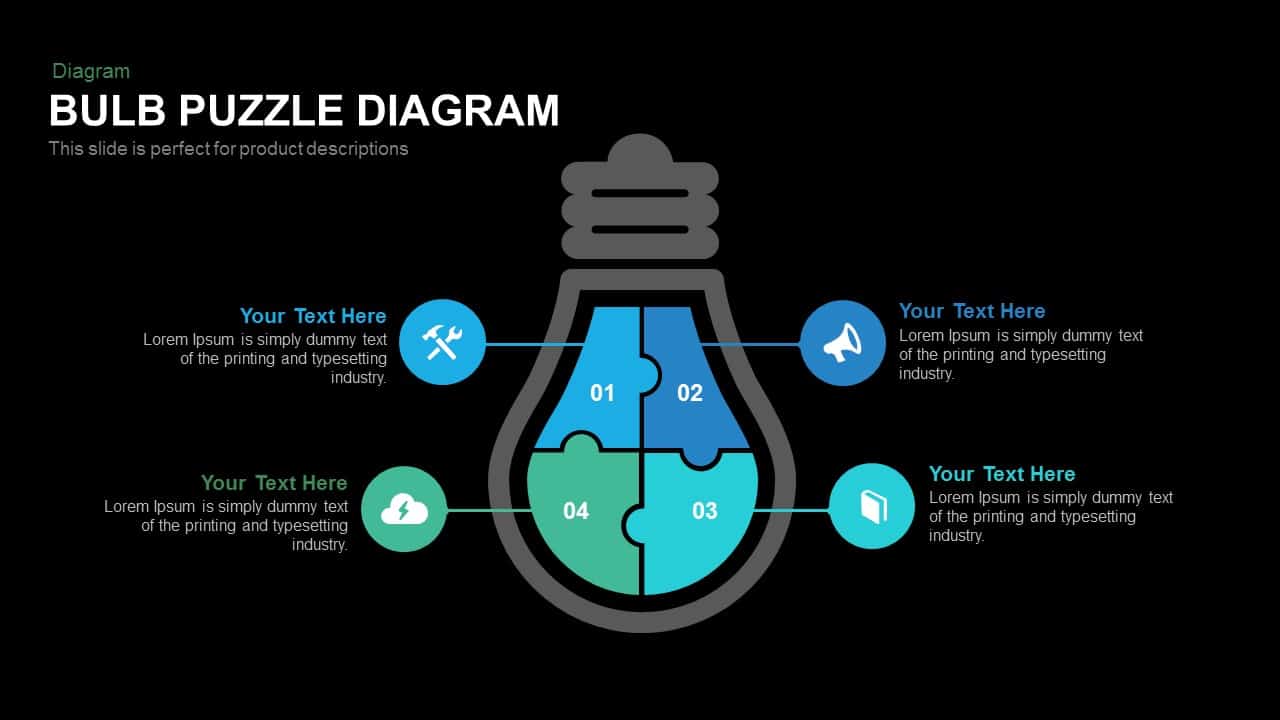
Bulb Puzzle Diagram template for PowerPoint & Google Slides
Process
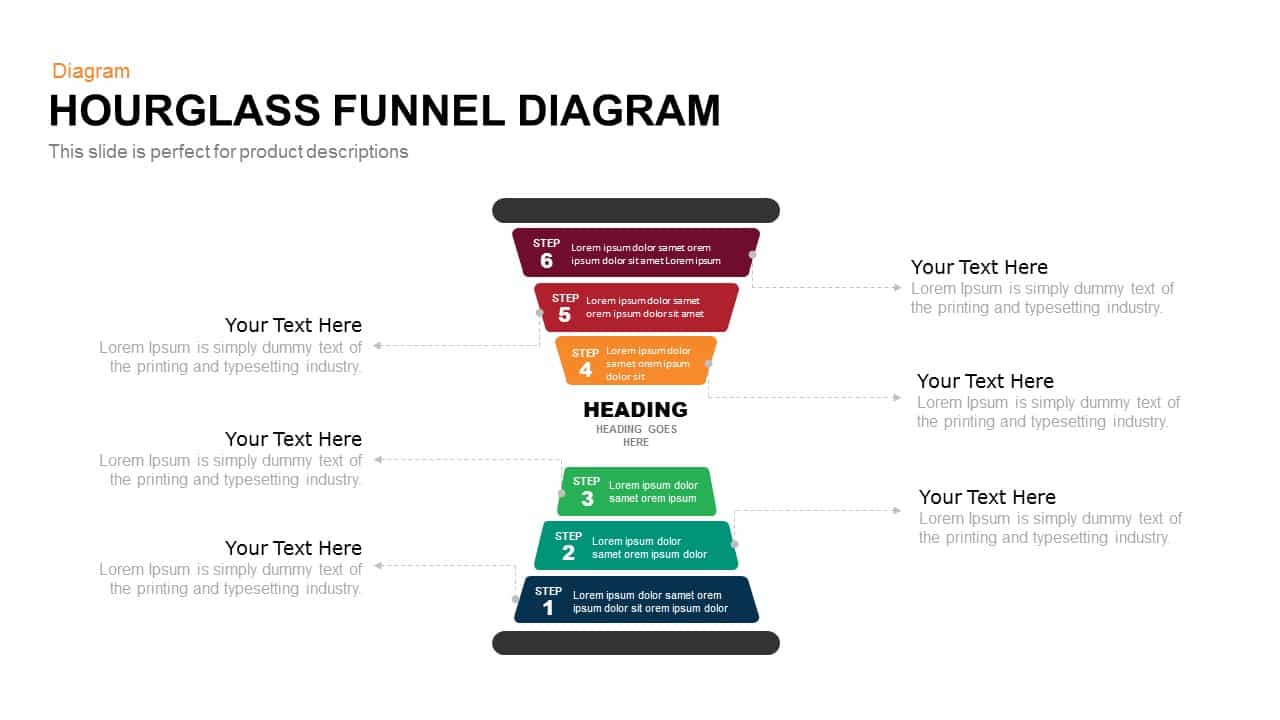
Hourglass Funnel Diagram Process Template for PowerPoint & Google Slides
Funnel
Professional 5-Stage Pyramid Diagram Template for PowerPoint & Google Slides
Pyramid
Four-Stage Linear Infographic Diagram Template for PowerPoint & Google Slides
Process
Modern Four-Stage Petal Diagram Template for PowerPoint & Google Slides
Circular
Five-Part Pentagon Shaped Diagram Template for PowerPoint & Google Slides
Process
Professional PESTEL Analysis Diagram Template for PowerPoint & Google Slides
PEST

Strategy Core Diagram template for PowerPoint & Google Slides
Process
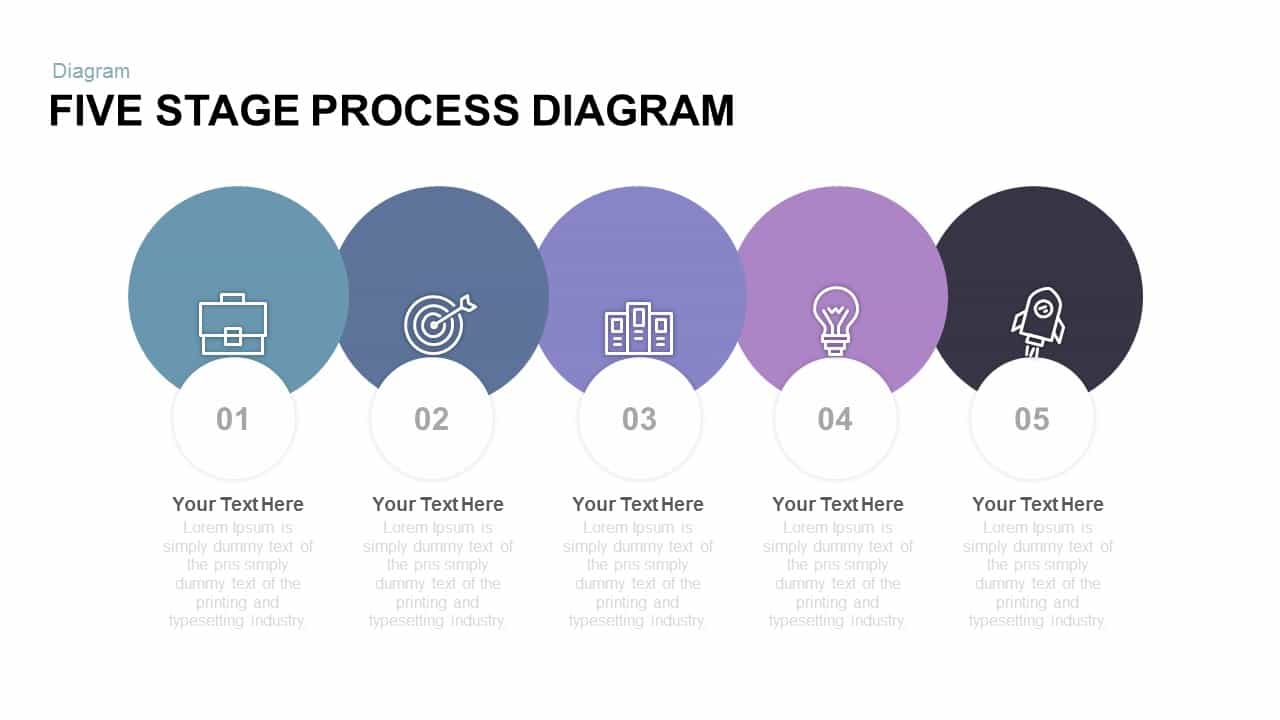
Five Stage Process Diagram template for PowerPoint & Google Slides
Process
Free
Four-Section Arrow Infographic Diagram Template for PowerPoint & Google Slides
Arrow

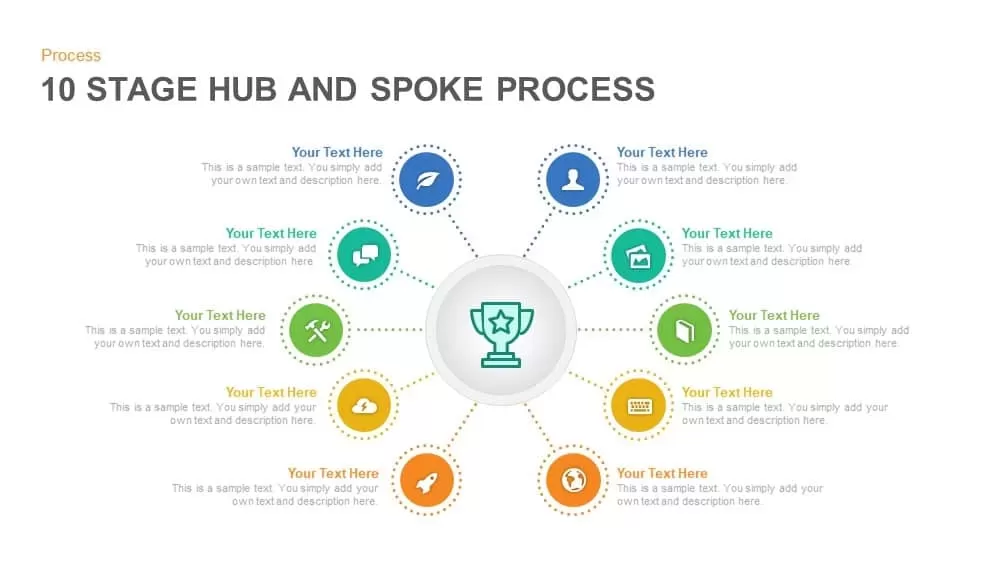
Ten-Stage Hub and Spoke Process Diagram Template for PowerPoint & Google Slides
Process
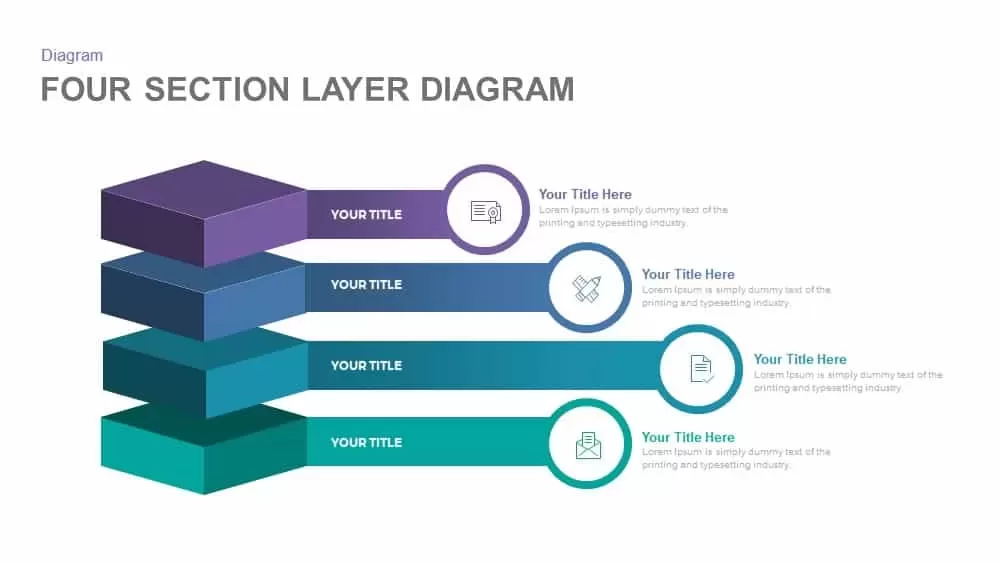
Professional Four-Section Layer Diagram Template for PowerPoint & Google Slides
Process
Artificial Intelligence Gear Diagram Template for PowerPoint & Google Slides
Process
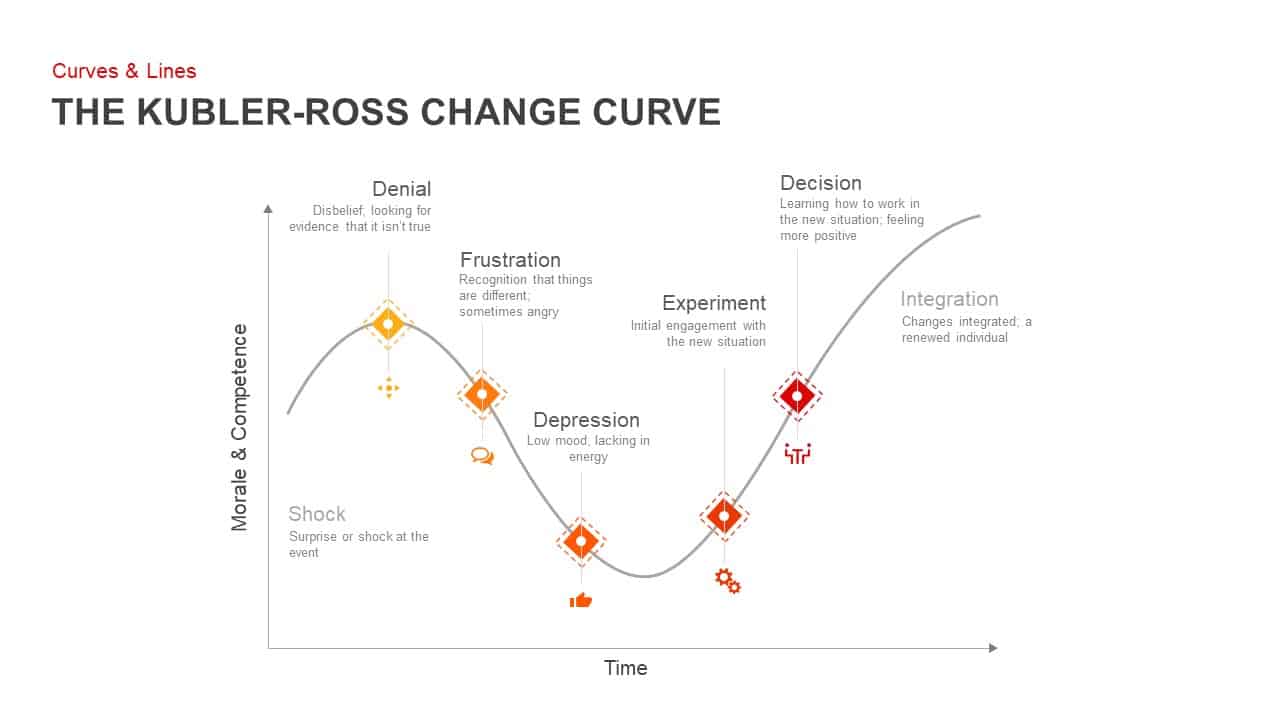
Kubler-Ross Change Curve Diagram Template for PowerPoint & Google Slides
Timeline
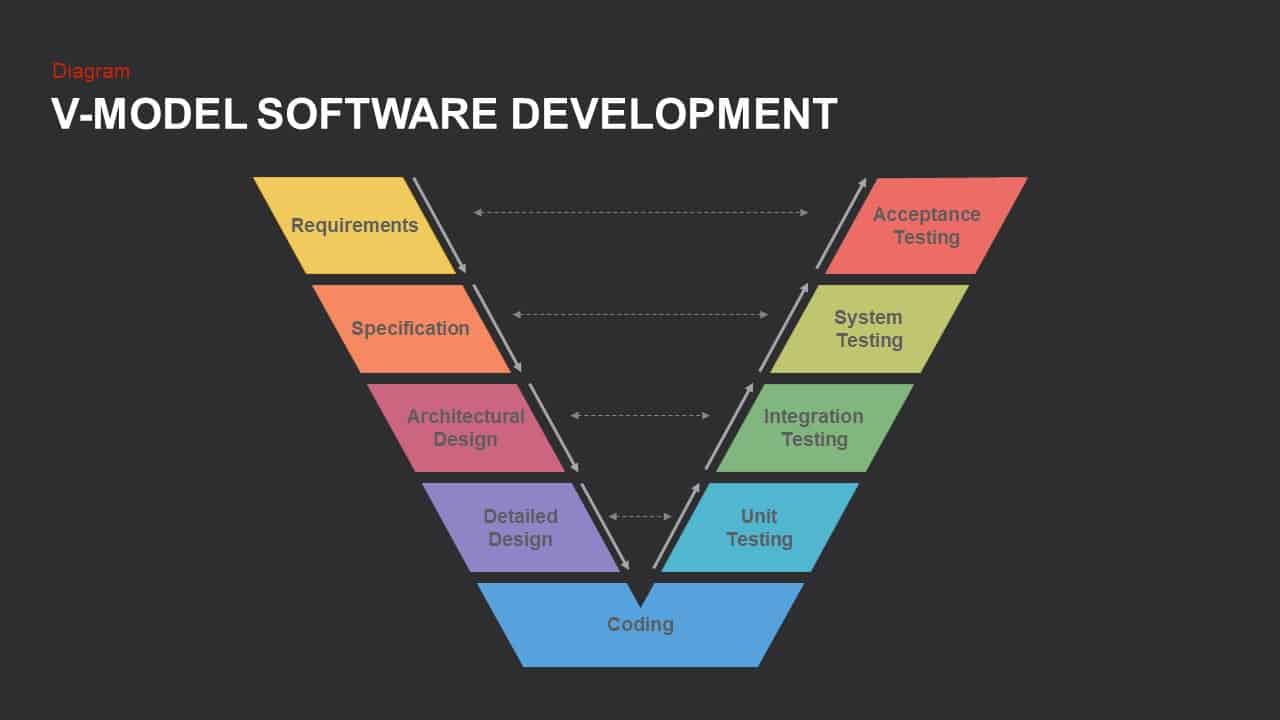
V-Model Software Development Diagram Template for PowerPoint & Google Slides
Software Development
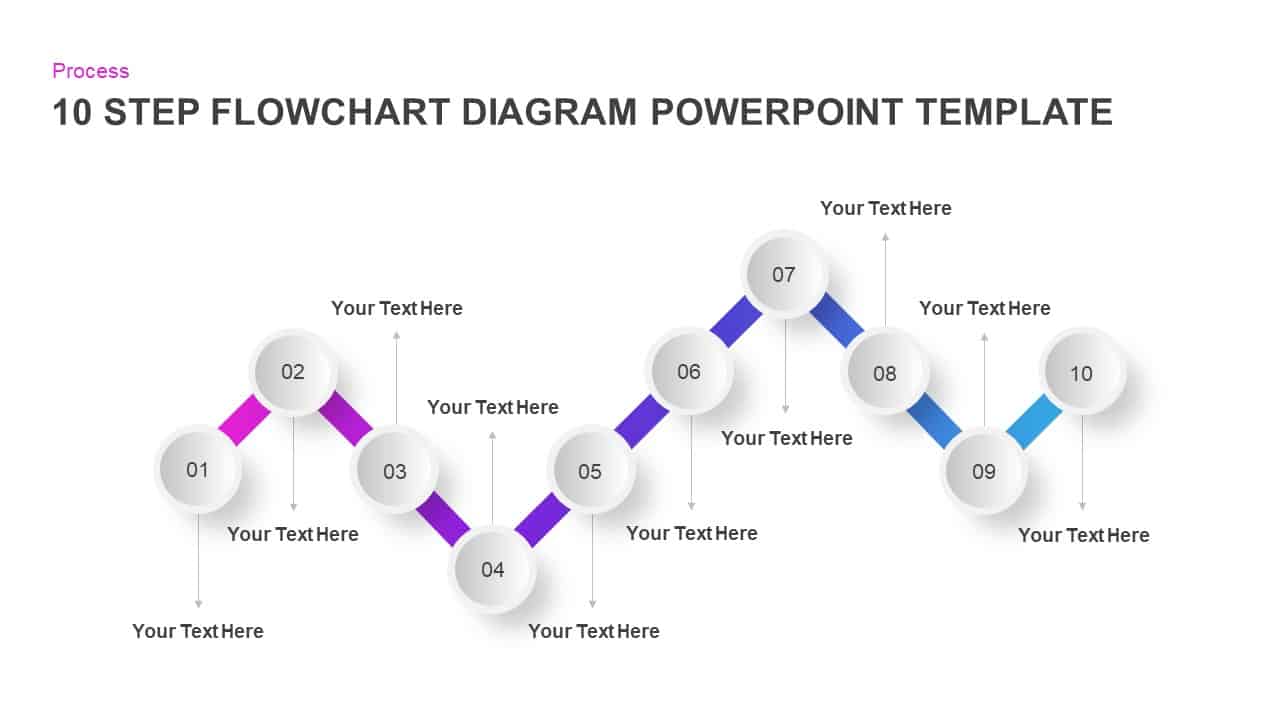
Gradient Ten-Step Flowchart Diagram Template for PowerPoint & Google Slides
Process
Fishbone Diagram Analysis Template for PowerPoint & Google Slides
Flow Charts
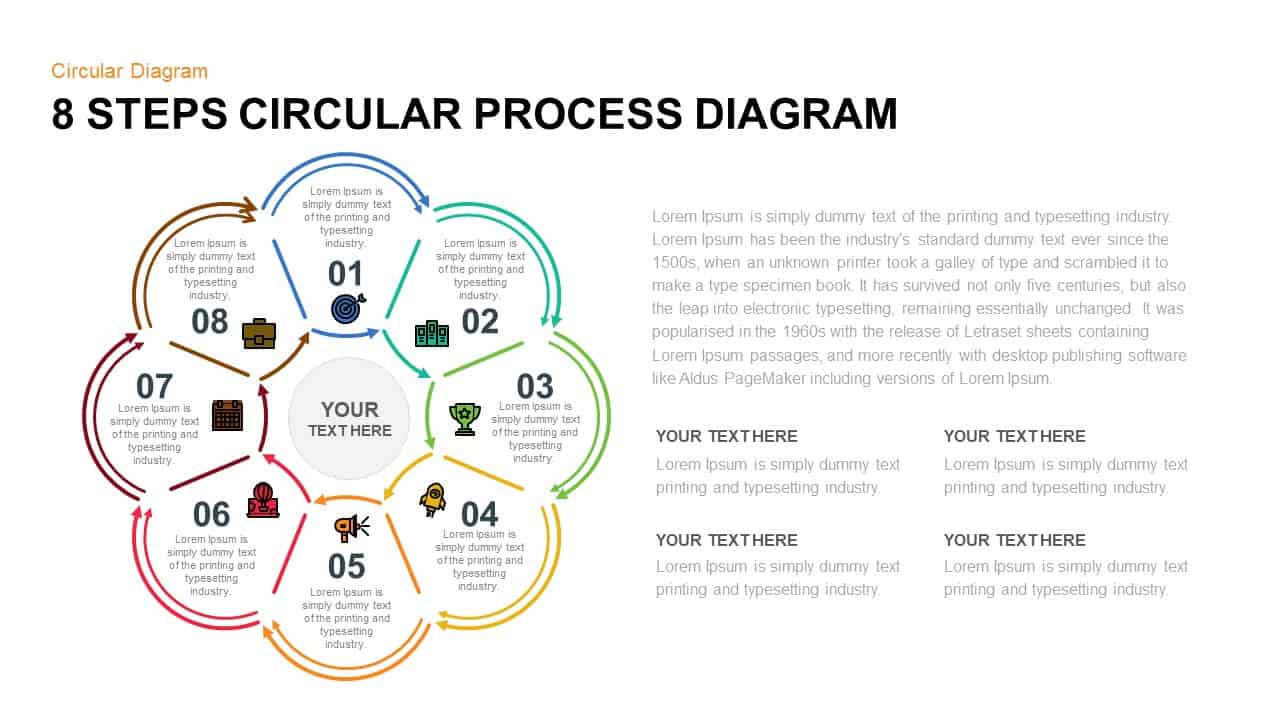
8 Steps Circular Process Diagram Template for PowerPoint & Google Slides
Circular
Five-Stage Circular Process Flow Diagram Template for PowerPoint & Google Slides
Circular
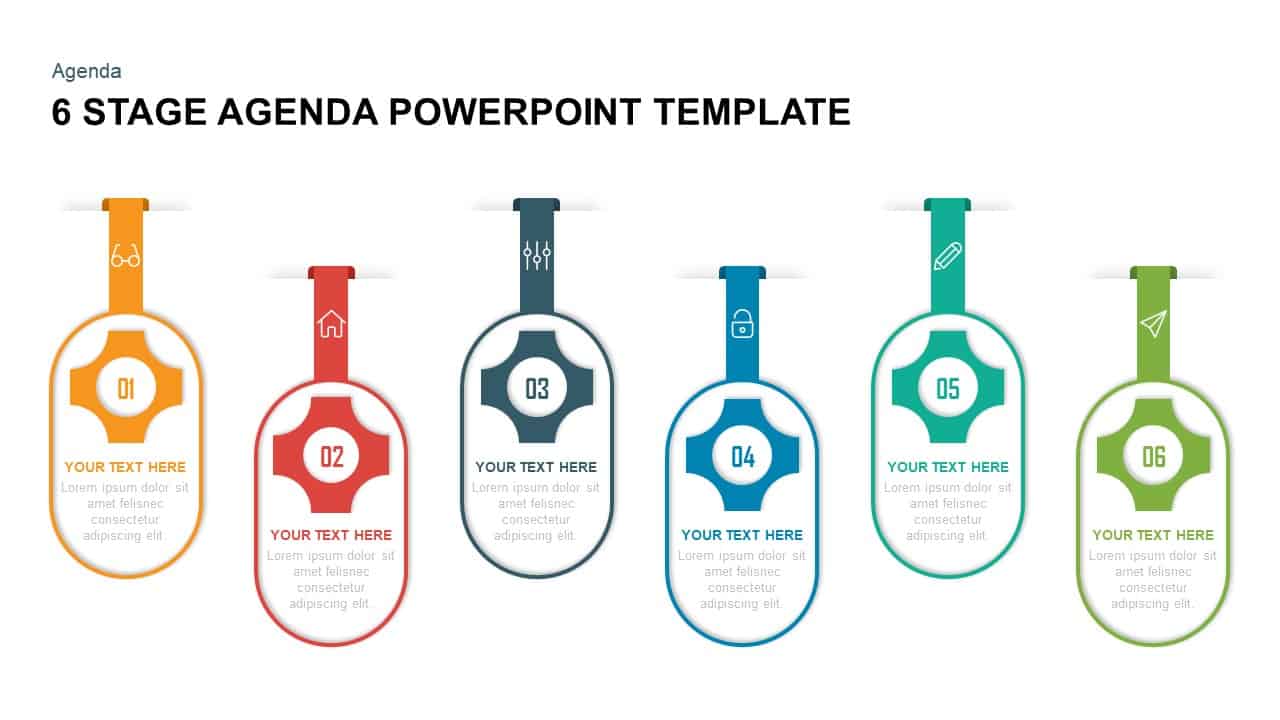
Six Stage Agenda Timeline Diagram template for PowerPoint & Google Slides
Agenda
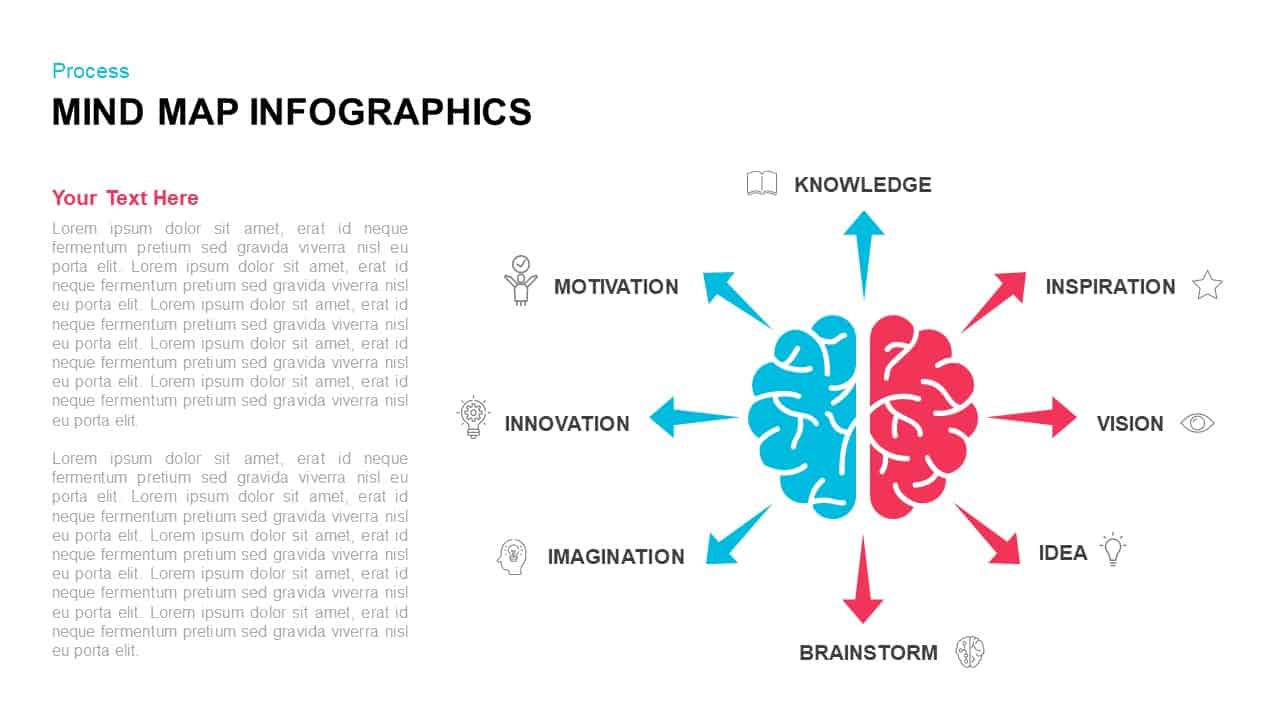
Mind Mapping Hub and Spoke Diagram Template for PowerPoint & Google Slides
Mind Maps
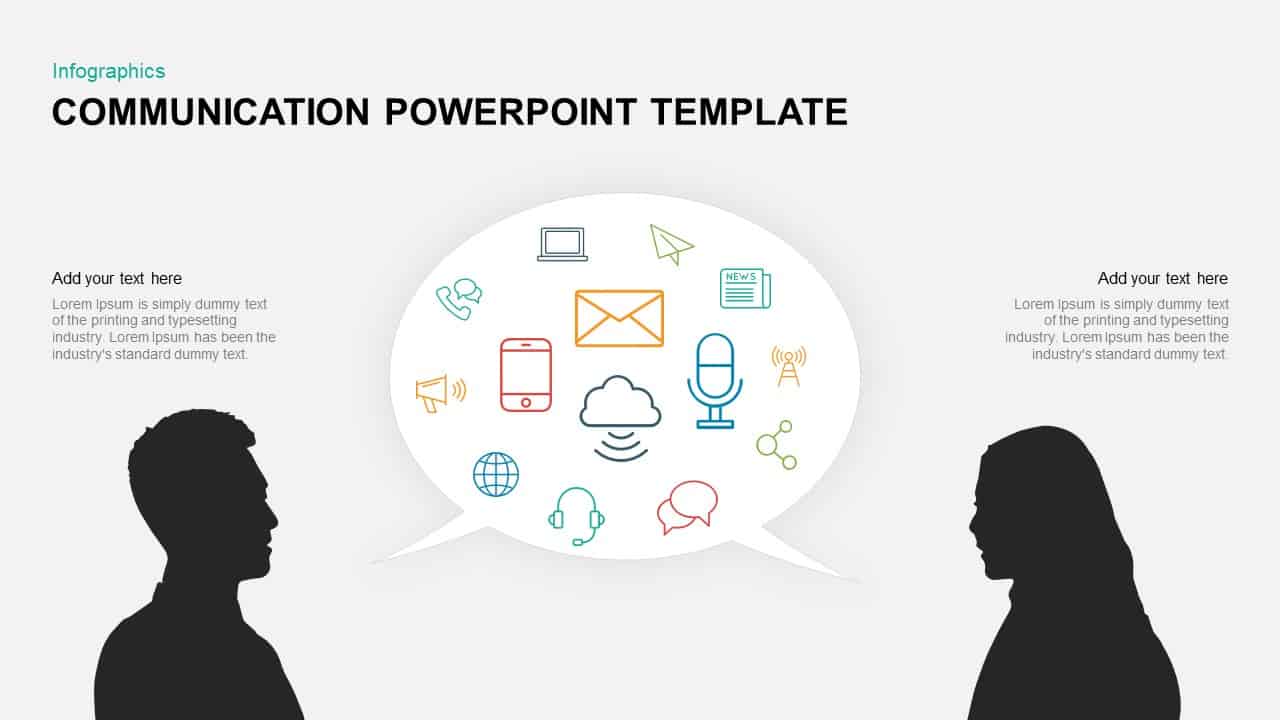
Communication Channels Diagram Template for PowerPoint & Google Slides
Customer Experience
Colorful Venn Diagram Infographics Template for PowerPoint & Google Slides
Circular
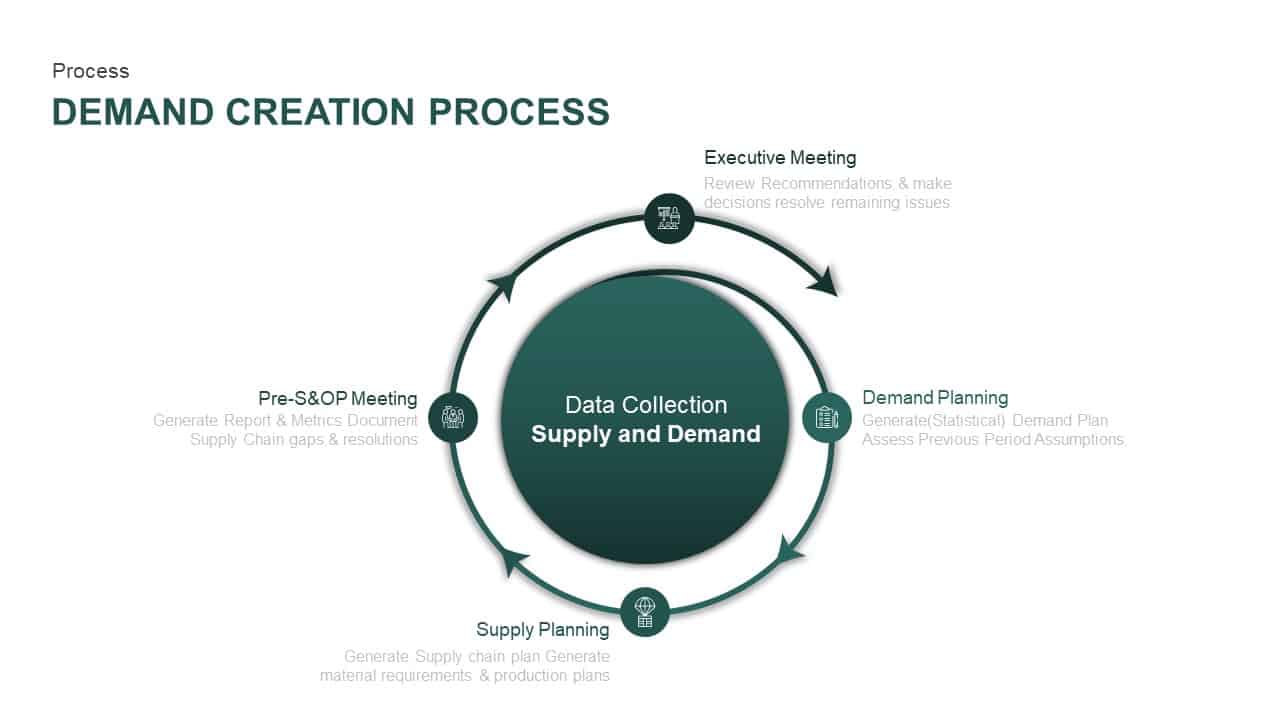
Supply and Demand Creation Cycle Diagram Template for PowerPoint & Google Slides
Process
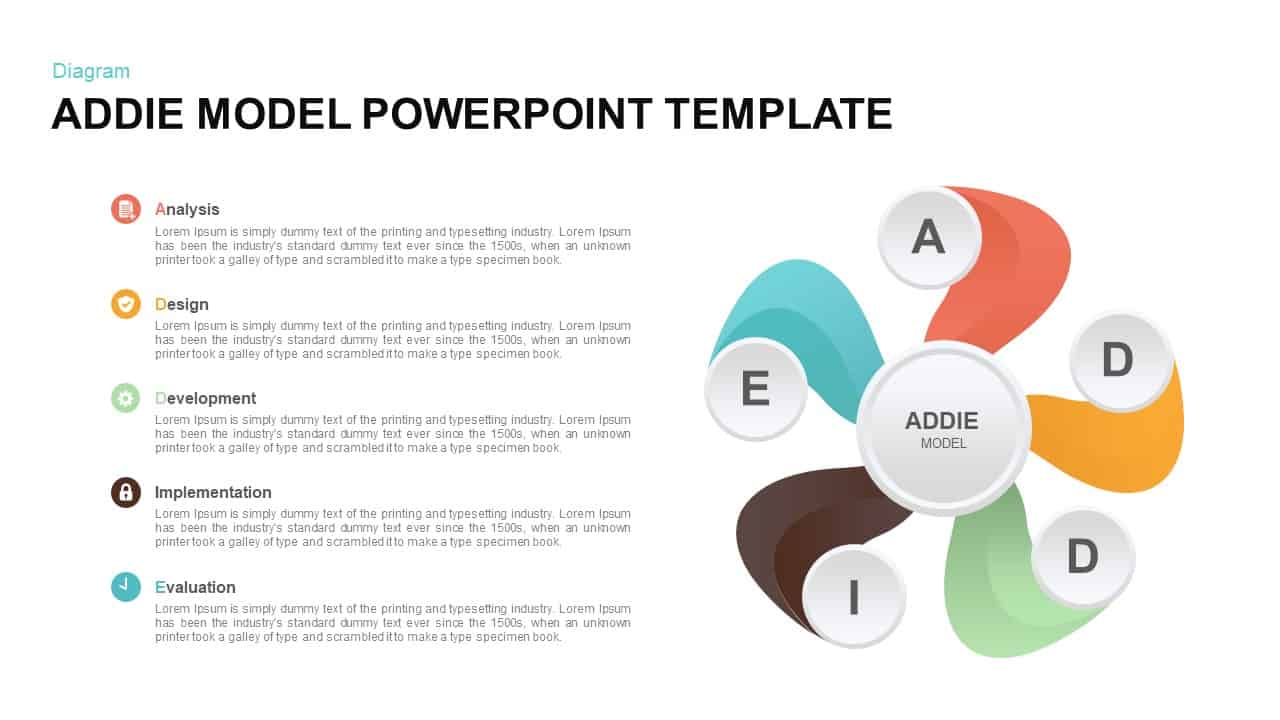
ADDIE Model Hub and Spoke Diagram Template for PowerPoint & Google Slides
Process
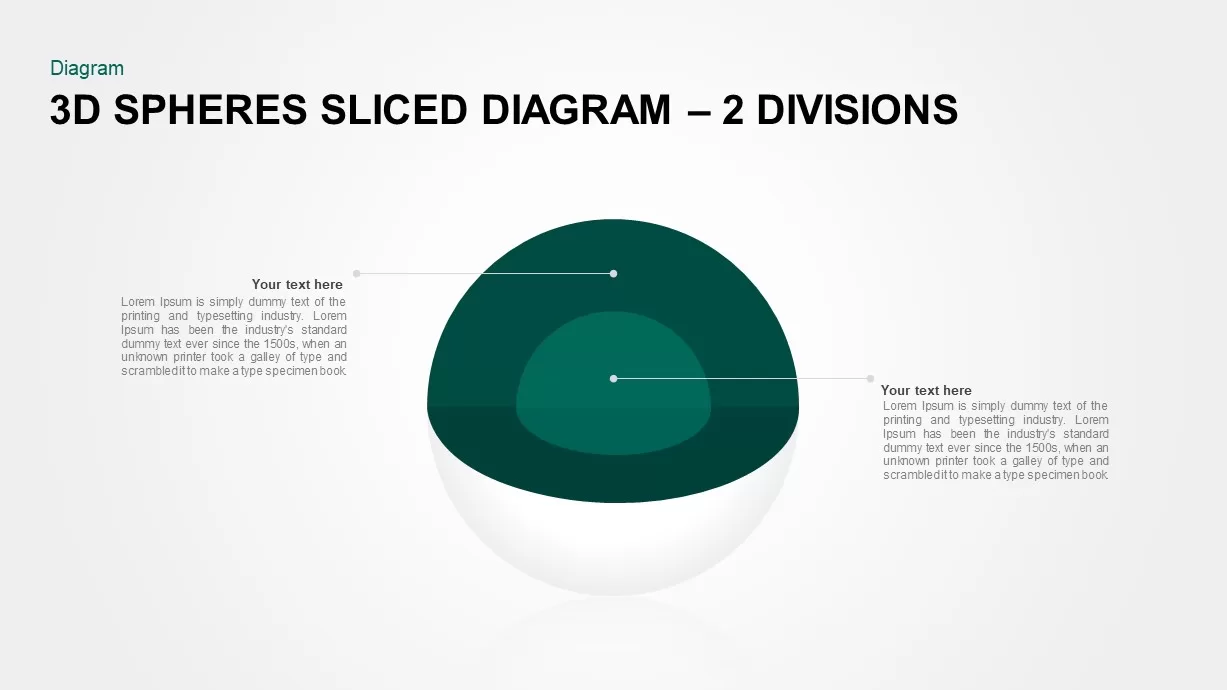
3D Spheres Sliced Diagram – 2 Divisions template for PowerPoint & Google Slides
Infographics
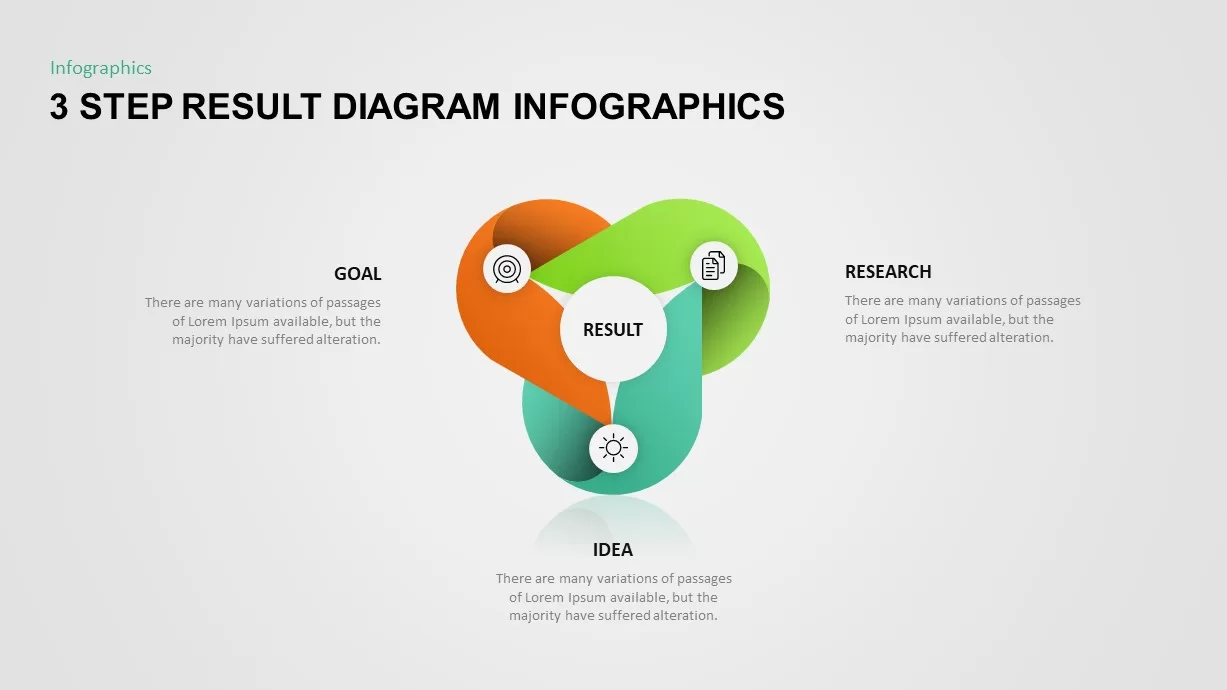
Three-Step Result Diagram Infographic Template for PowerPoint & Google Slides
Process
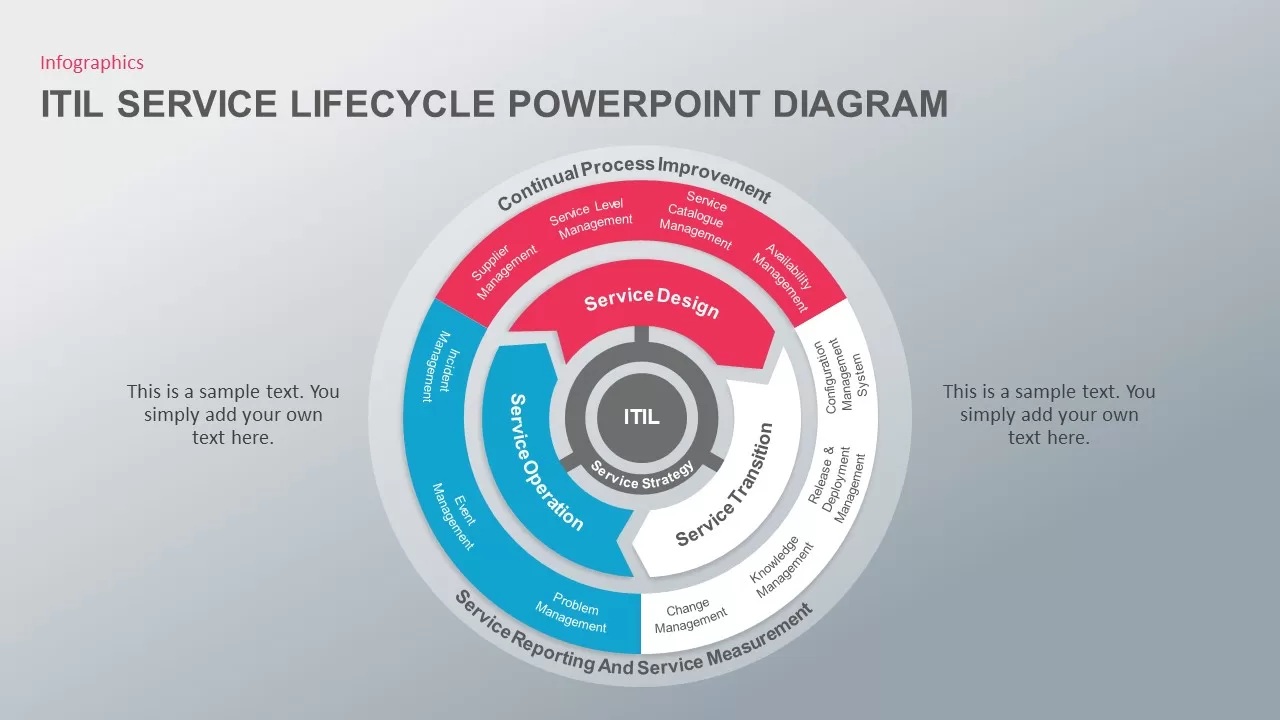
ITIL Service Lifecycle Circular Diagram Template for PowerPoint & Google Slides
Circular
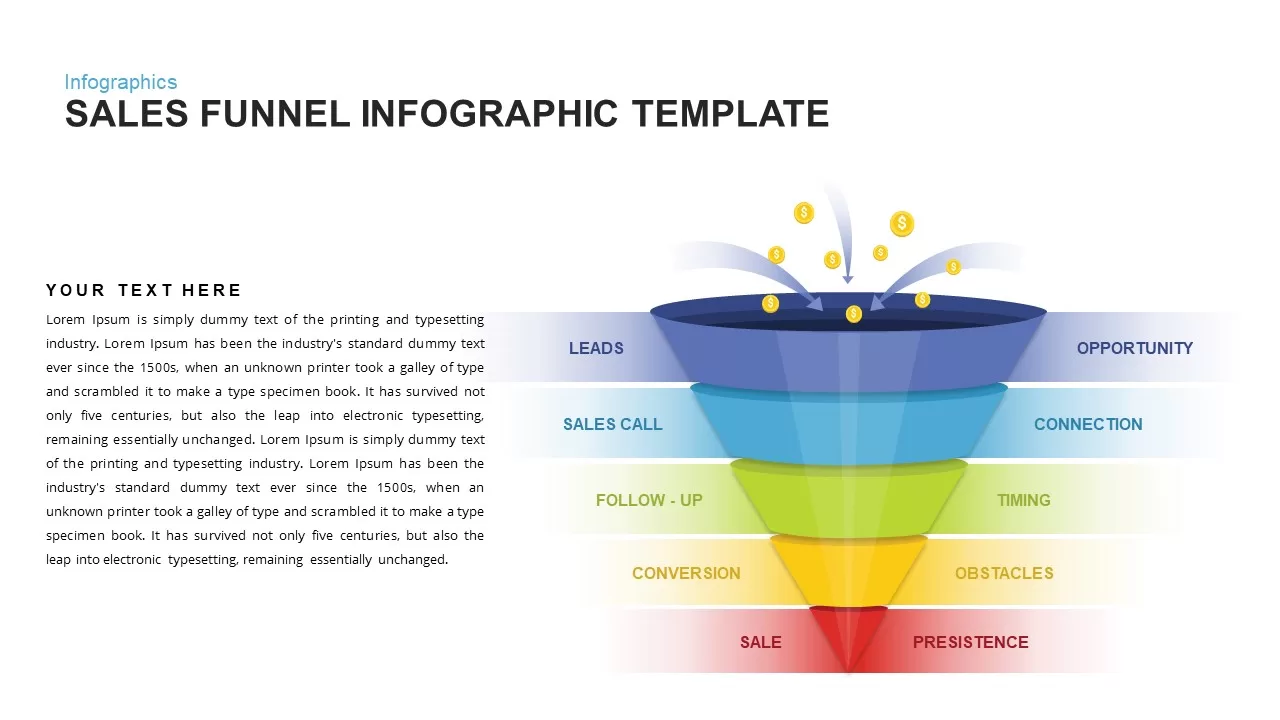
Sales Funnel Infographic Diagram Template for PowerPoint & Google Slides
Funnel
Capacity Planning Circular Diagram Template for PowerPoint & Google Slides
Circular
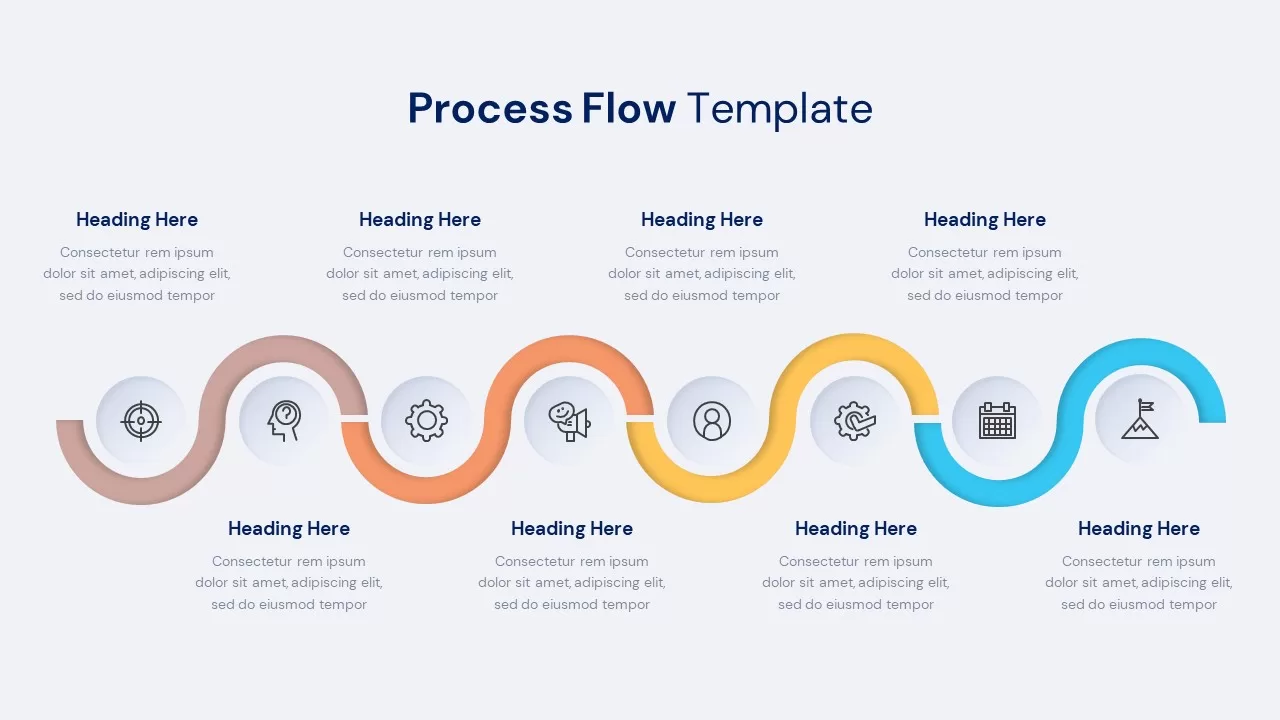
Process Flow Diagram template for PowerPoint & Google Slides
Process
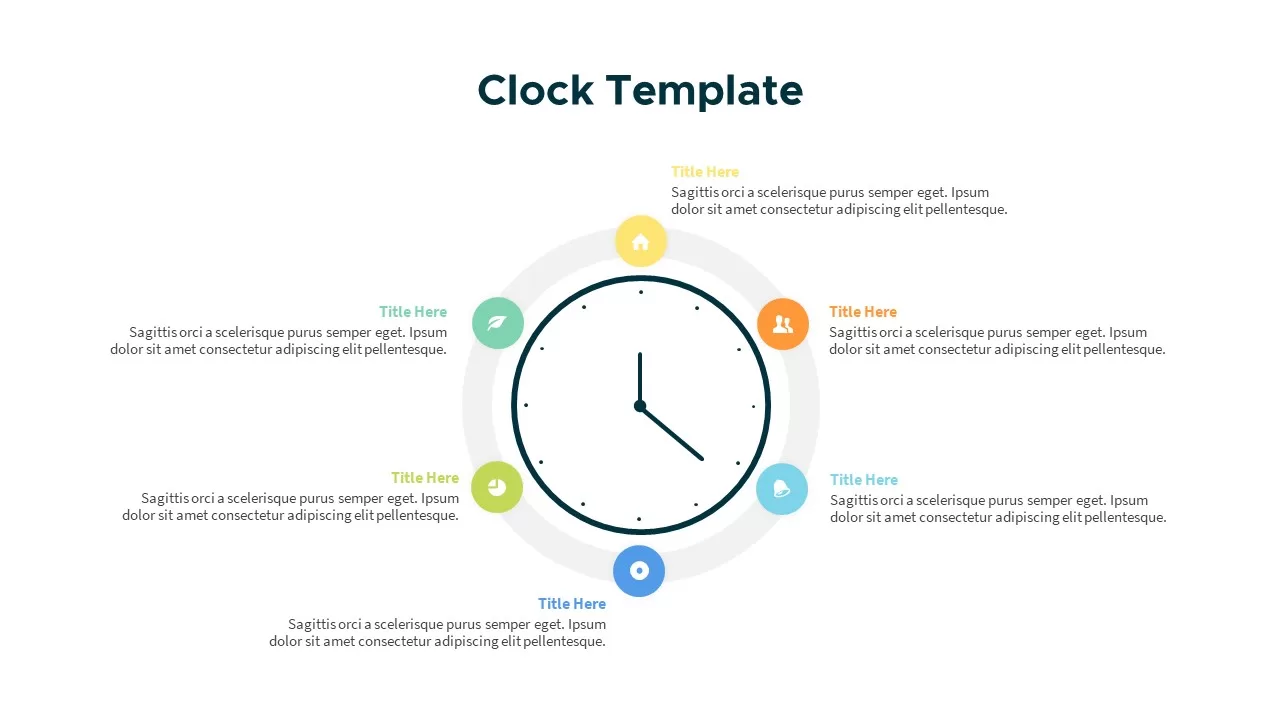
Clock Diagram for Time Management Template for PowerPoint & Google Slides
Circular
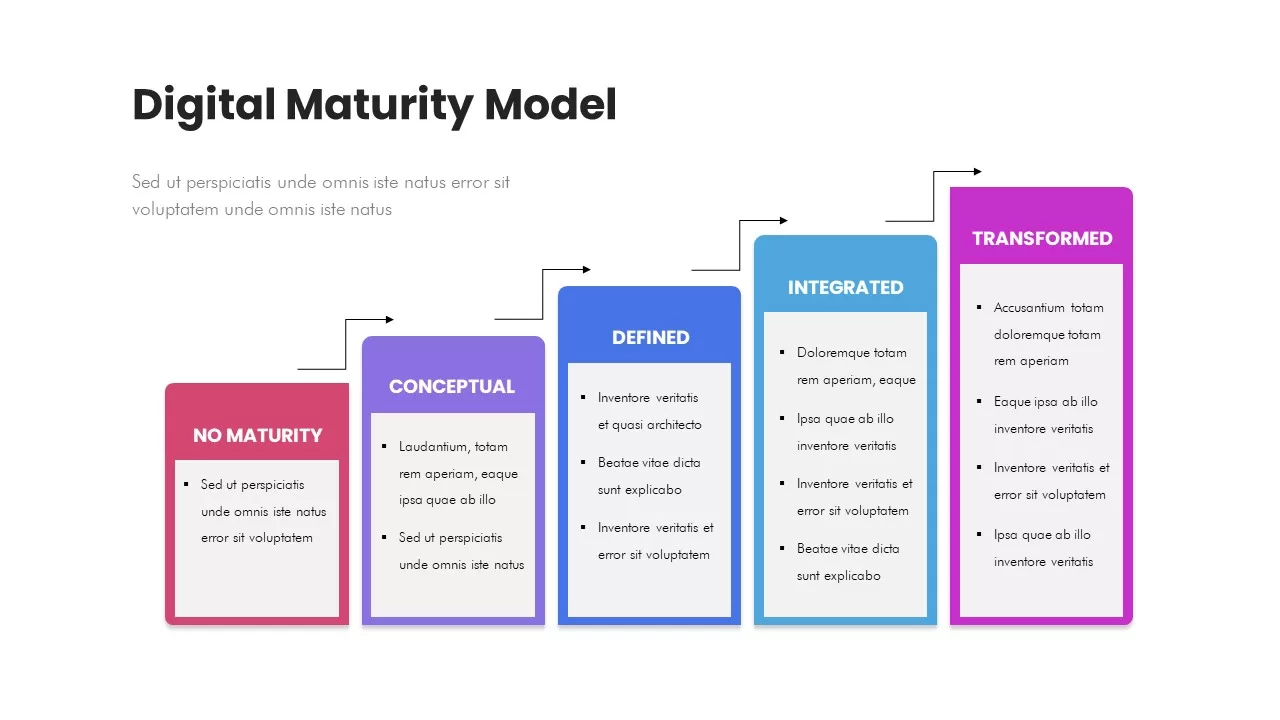
Digital Maturity Model Stages Diagram Template for PowerPoint & Google Slides
Process
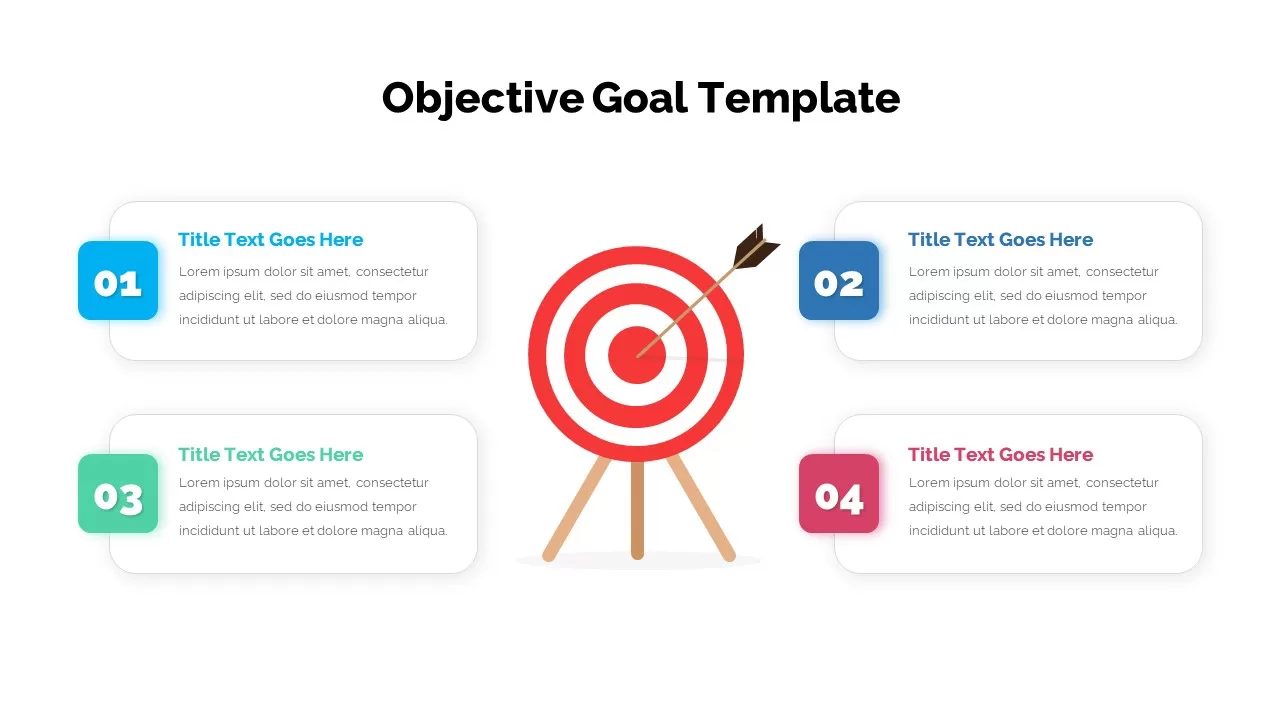
Four-Step Objective Goal Diagram Template for PowerPoint & Google Slides
Goals
Curved Arrow Process Flow Diagram Template for PowerPoint & Google Slides
Arrow
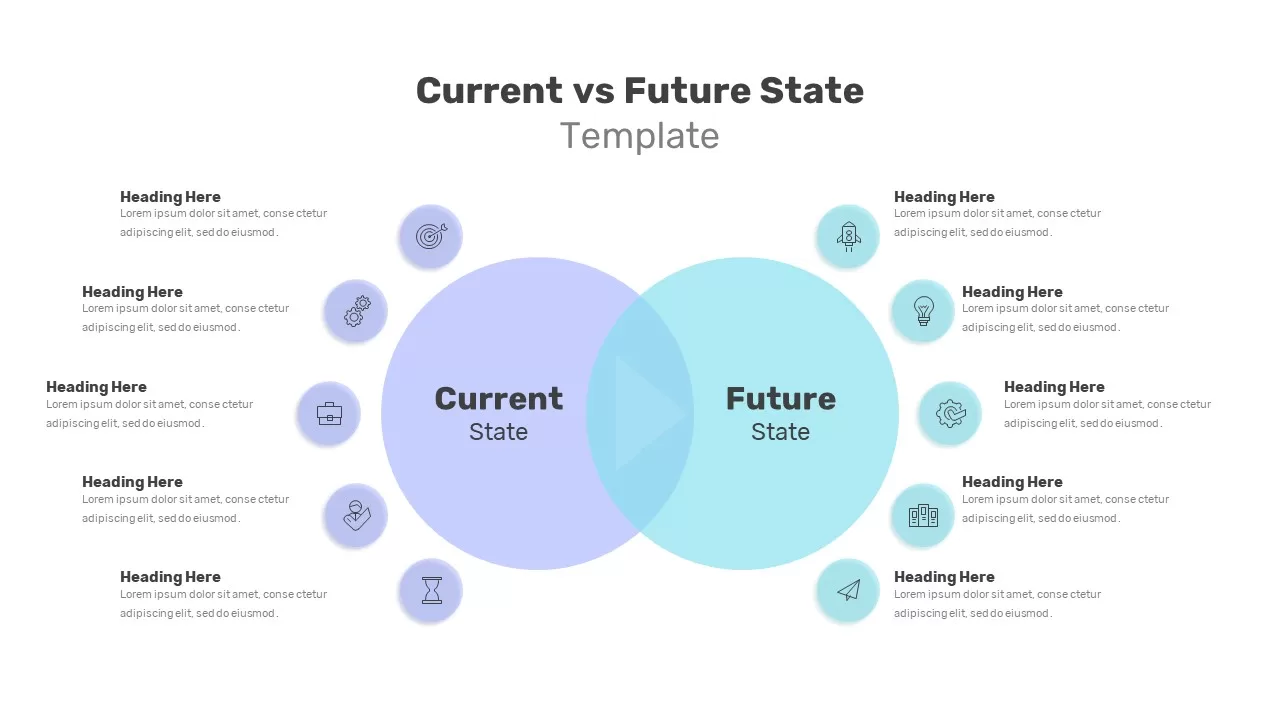
Current vs Future State Venn Diagram Template for PowerPoint & Google Slides
Comparison
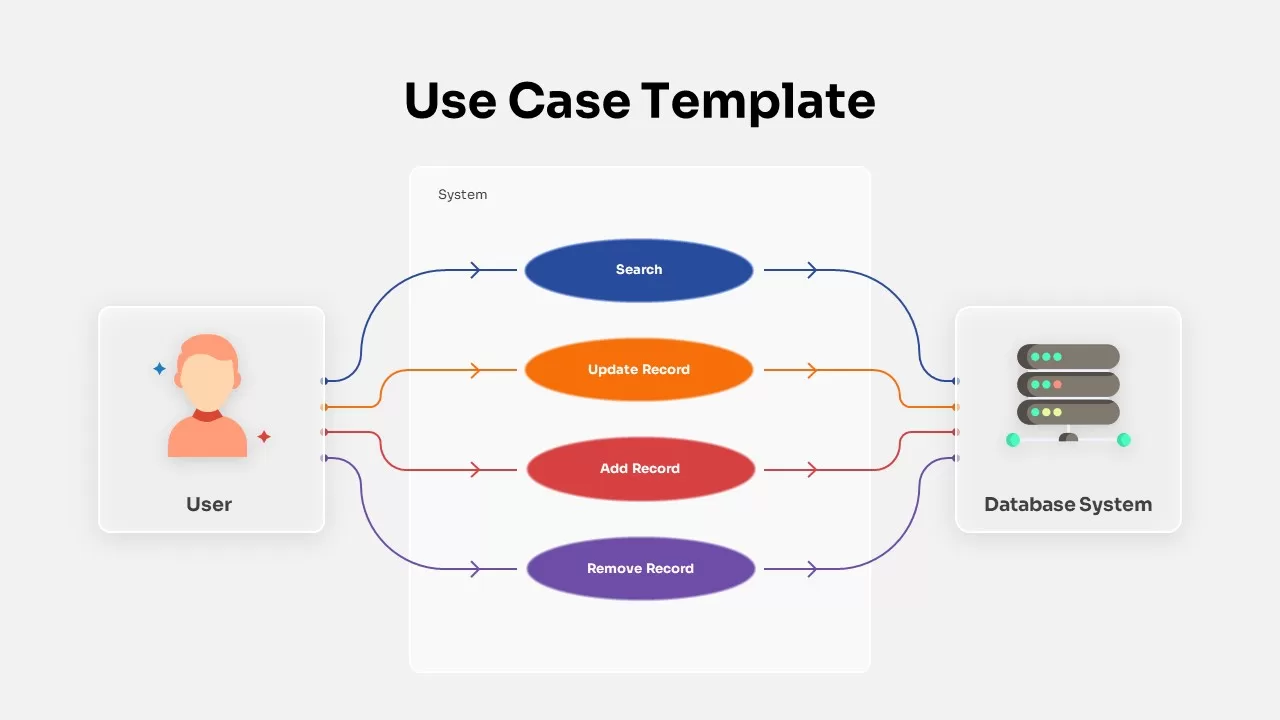
Use Case Diagram Template for PowerPoint & Google Slides
Flow Charts
Three-Step Hub and Spoke Diagram Template for PowerPoint & Google Slides
Circular
3D Six-Level Pyramid Diagram Infographic Template for PowerPoint & Google Slides
Pyramid
Bottleneck Process Analysis Diagram Template for PowerPoint & Google Slides
Process
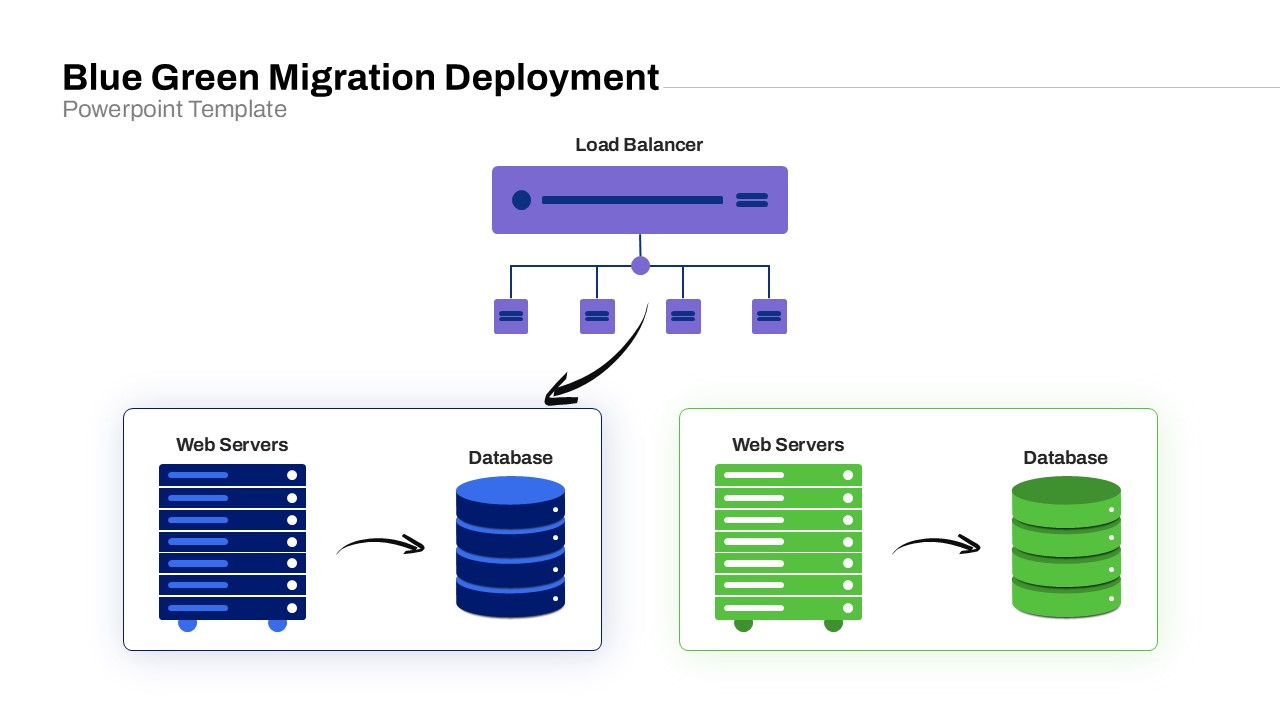
Blue-Green Cloud Deployment Diagram Template for PowerPoint & Google Slides
Cloud Computing
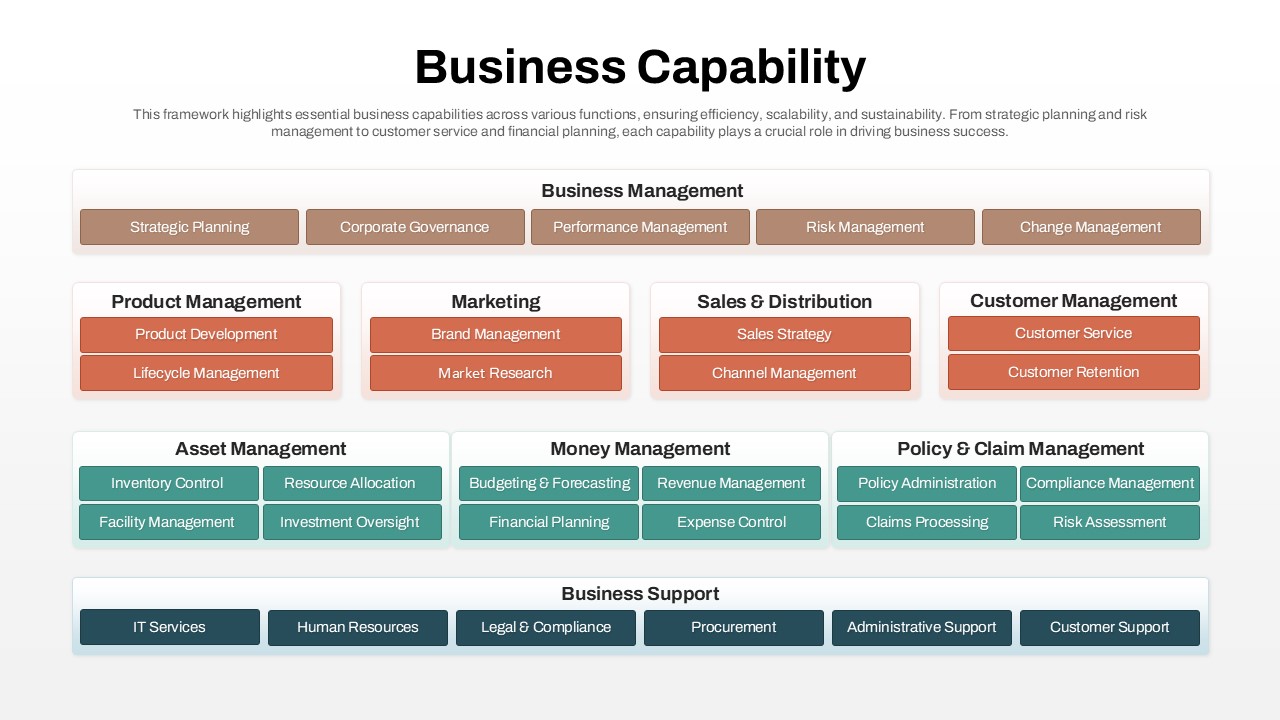
Business Capability Framework Diagram Template for PowerPoint & Google Slides
Business Models
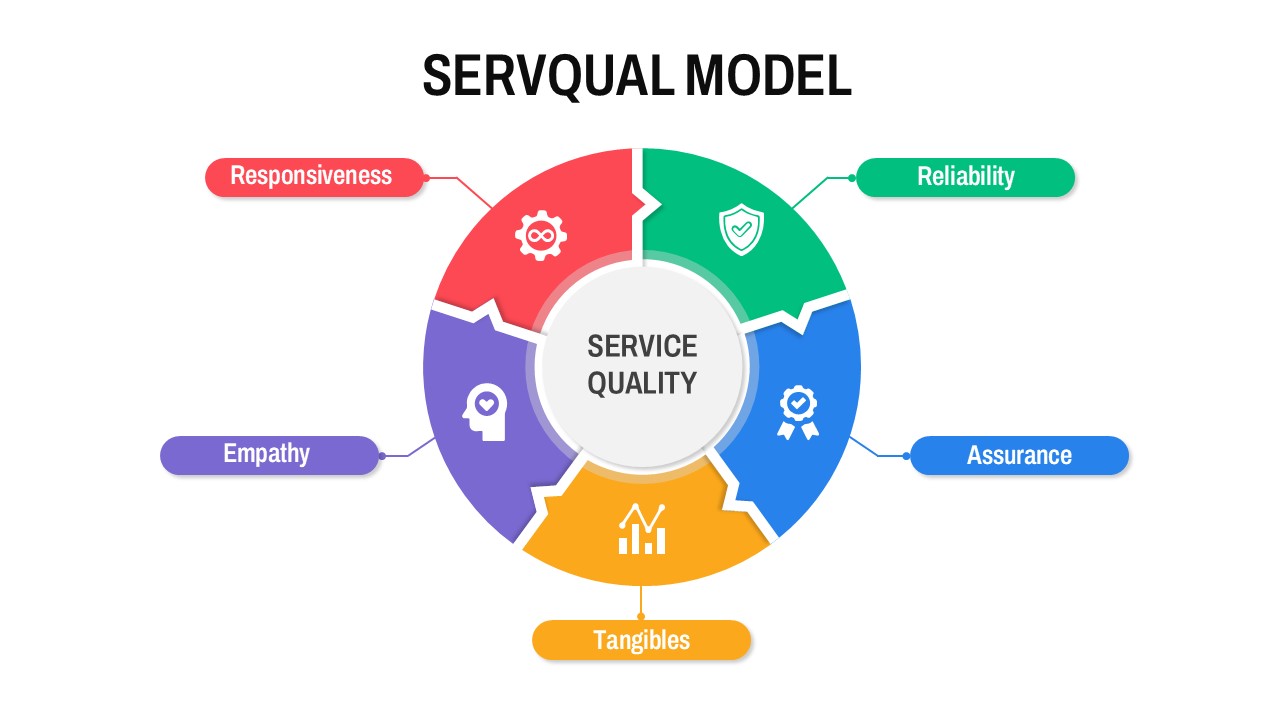
Circular SERVQUAL Model Diagram Template for PowerPoint & Google Slides
Business Strategy
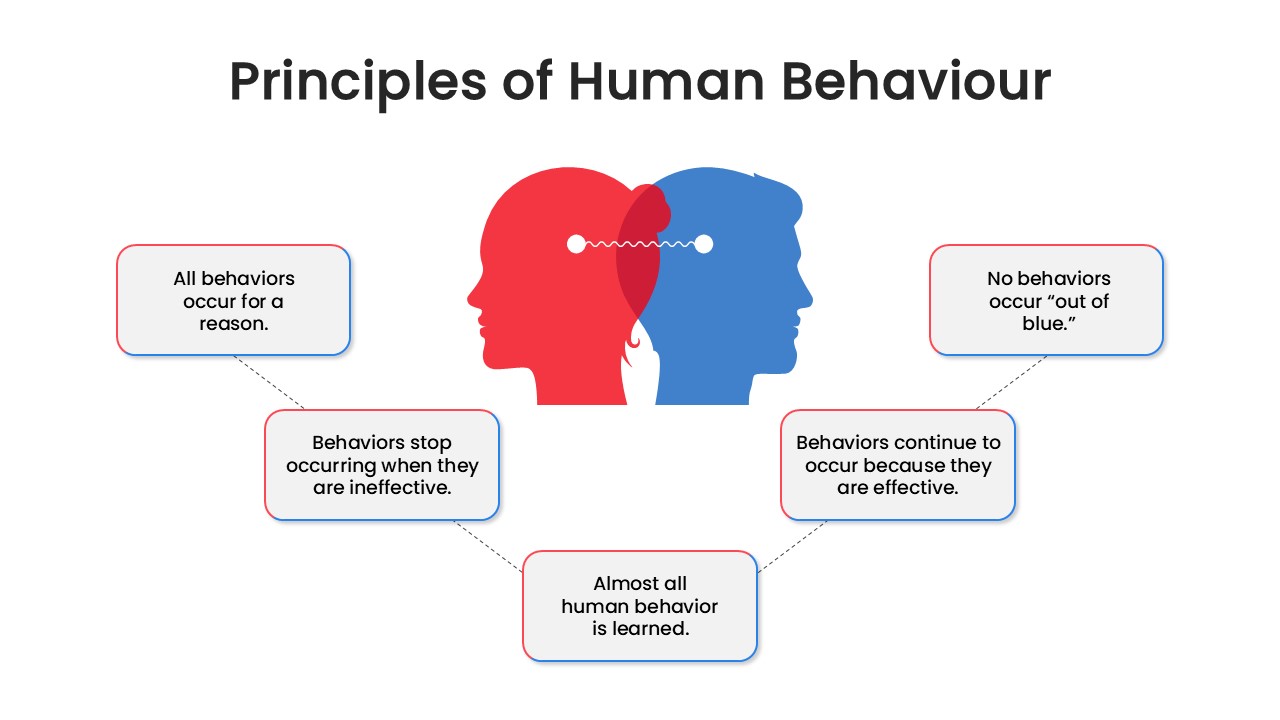
Human Behavior Principles Diagram Template for PowerPoint & Google Slides
Circular
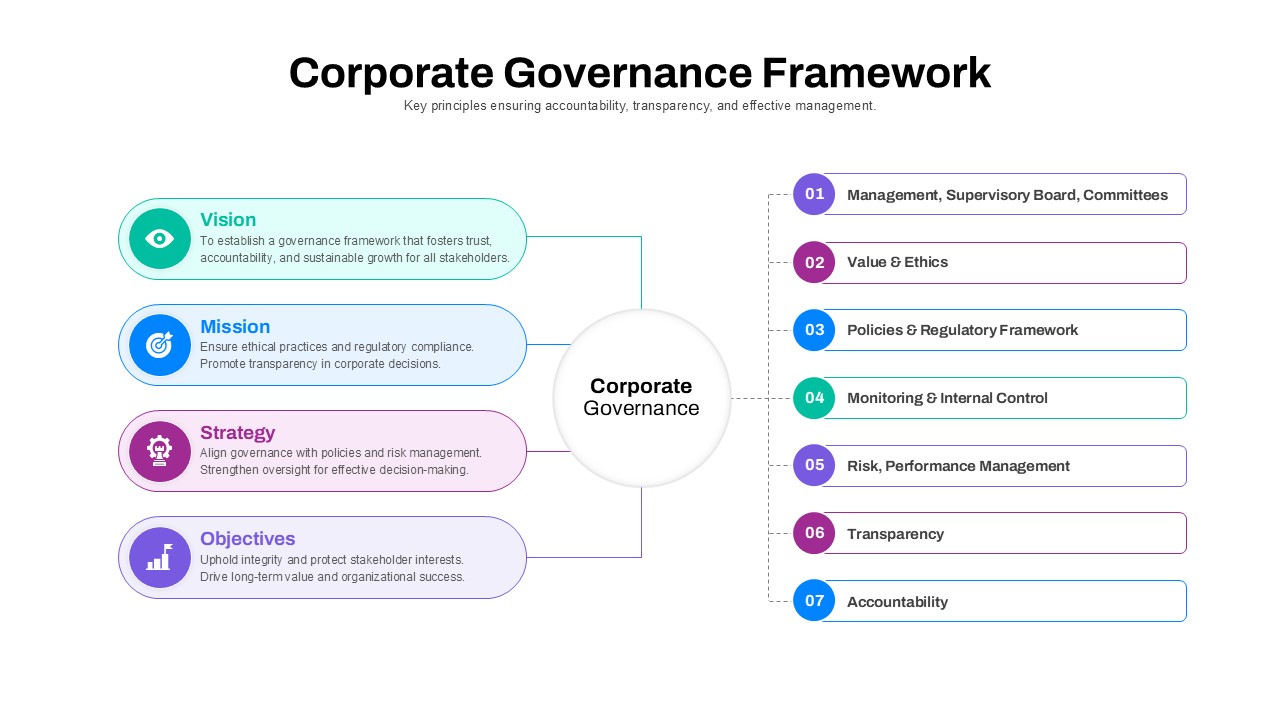
Corporate Governance Framework Diagram Template for PowerPoint & Google Slides
Process
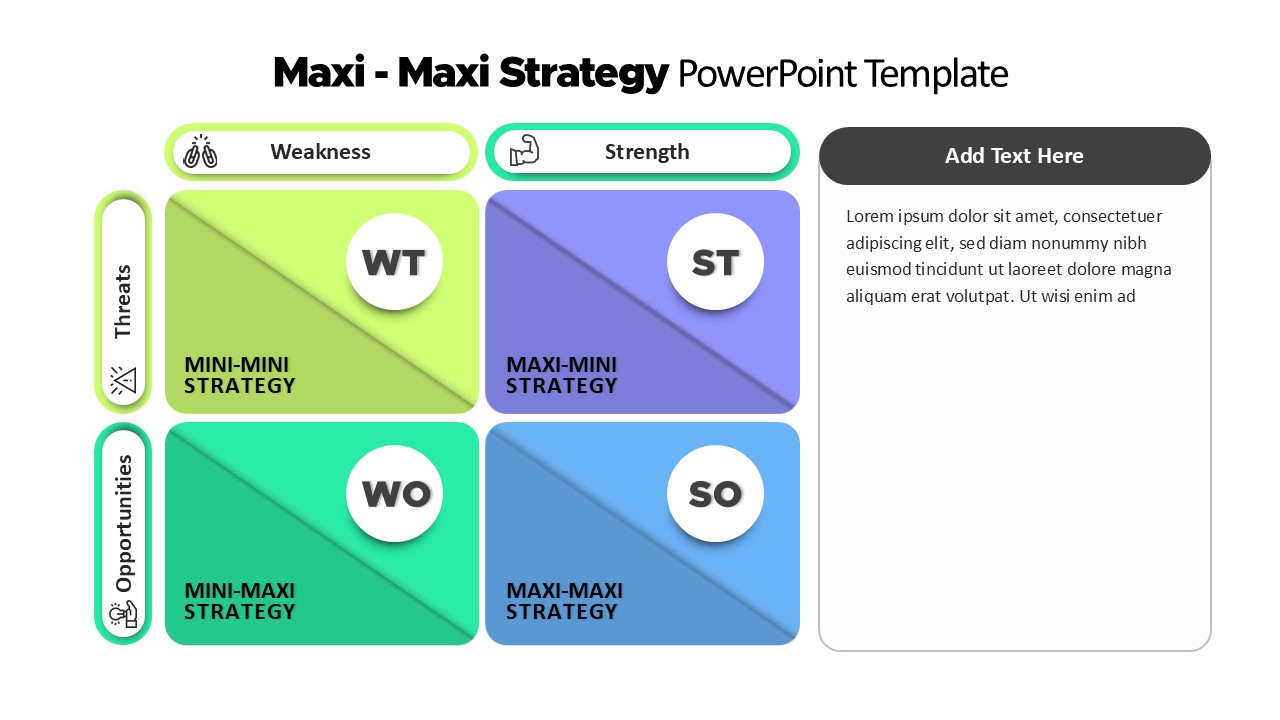
Maxi-Maxi Strategy Matrix SWOT Diagram Template for PowerPoint & Google Slides
SWOT
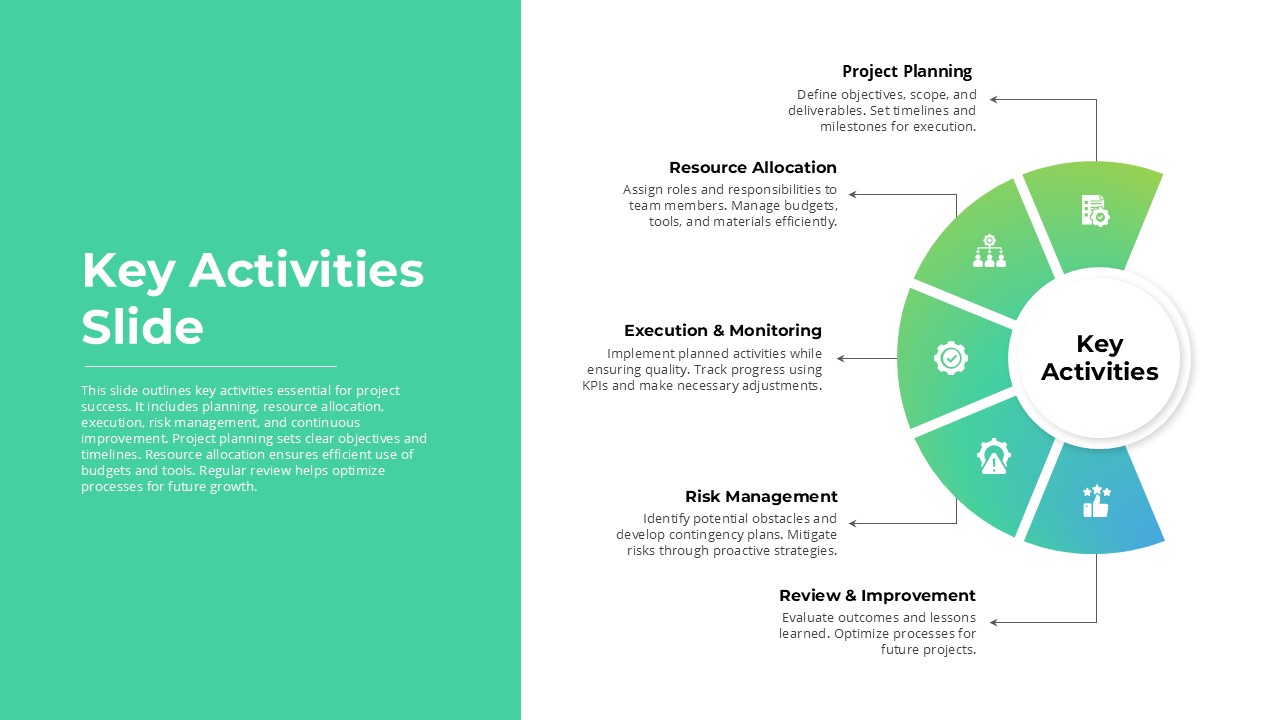
Project Key Activities Circular Diagram Template for PowerPoint & Google Slides
Process
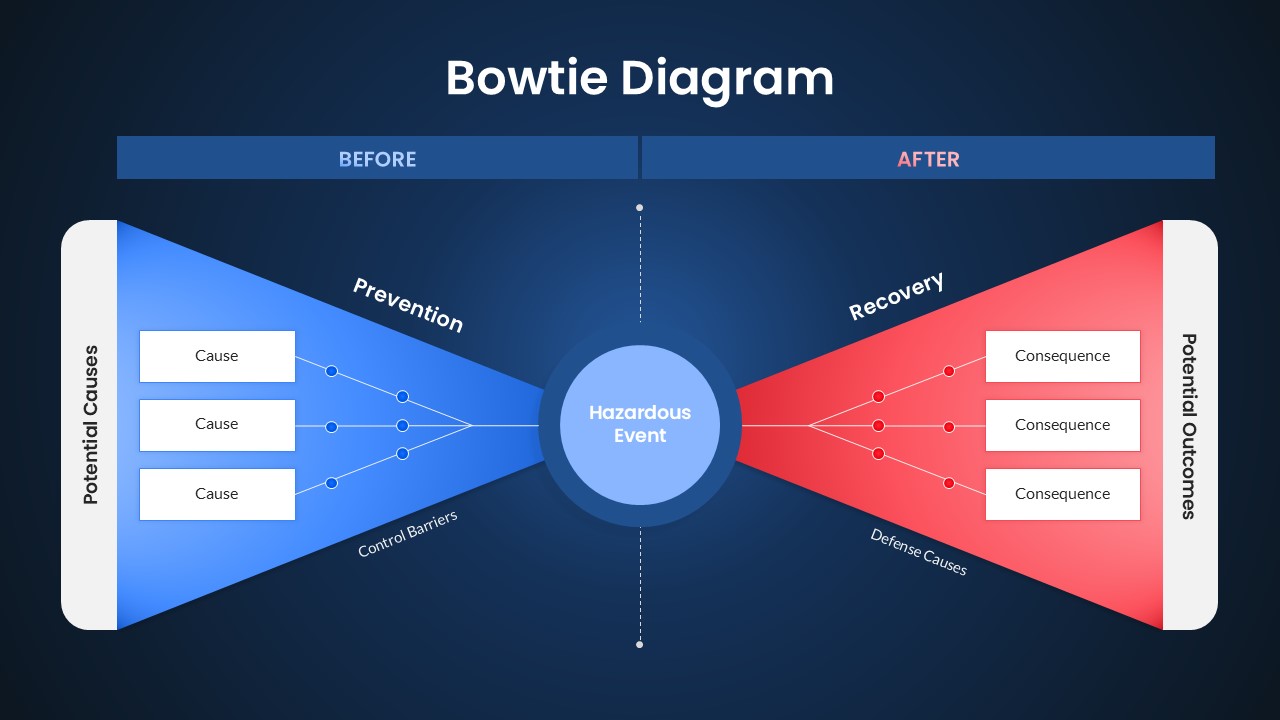
Bowtie Diagram Prevention & Recovery Template for PowerPoint & Google Slides
Decision Tree
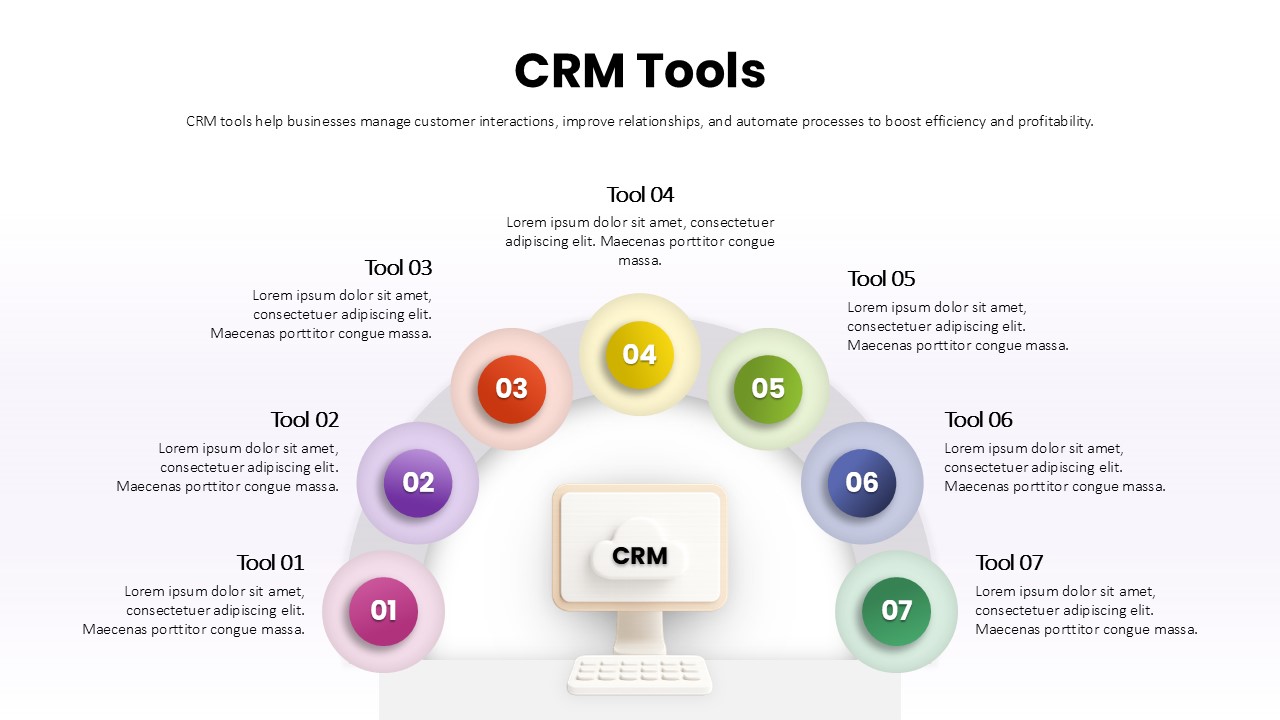
Seven-Part CRM Tools Arc Diagram Template for PowerPoint & Google Slides
Digital Marketing
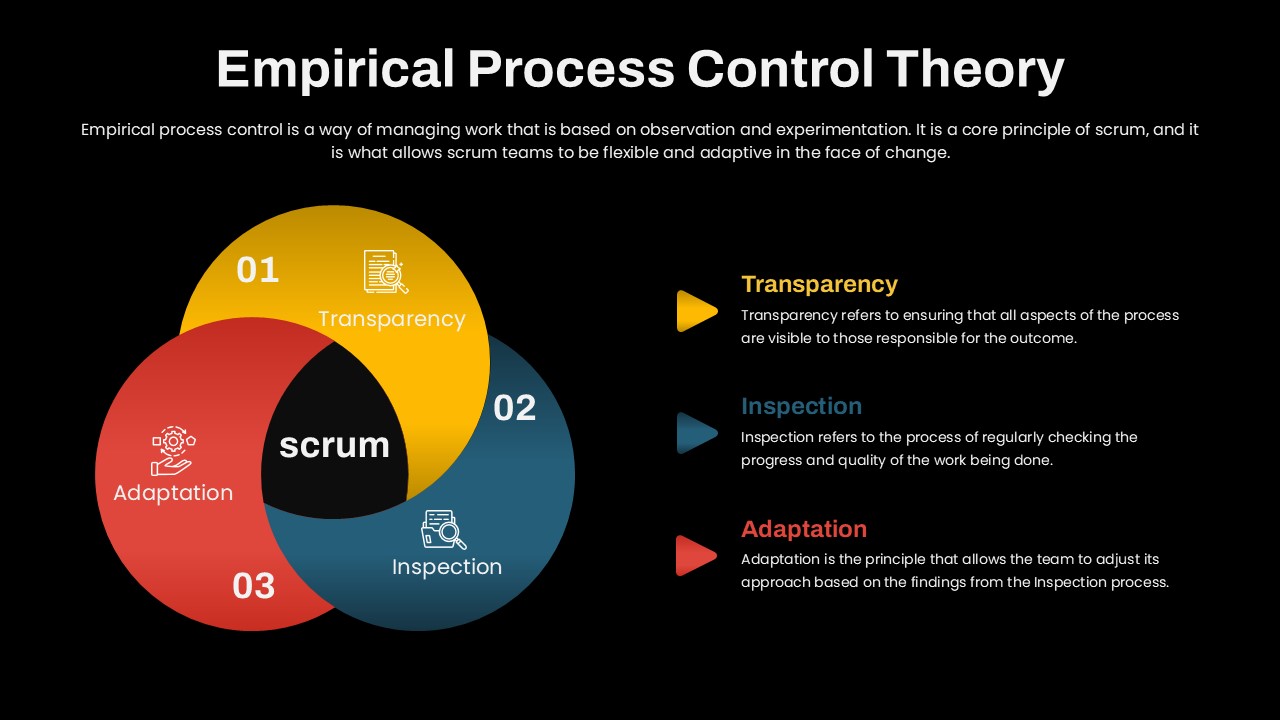
Empirical Process Control Theory Diagram Template for PowerPoint & Google Slides
Circular
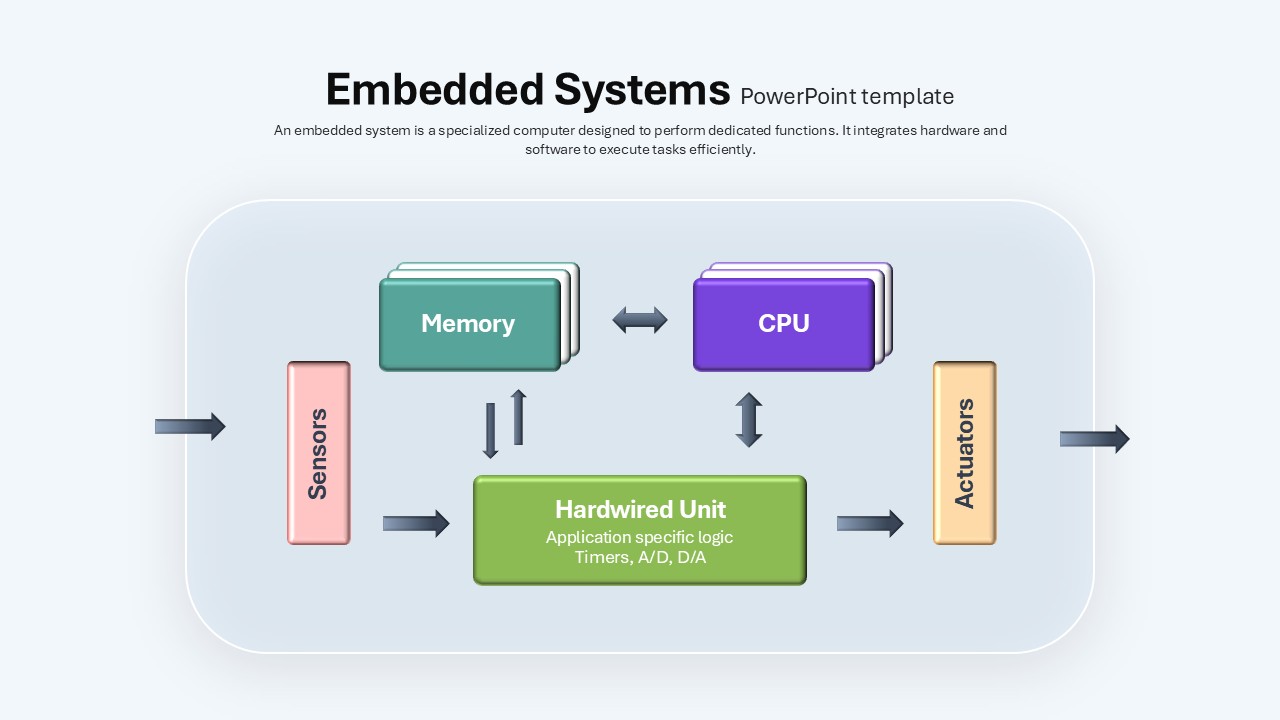
Embedded Systems Architecture Diagram Template for PowerPoint & Google Slides
Software Development
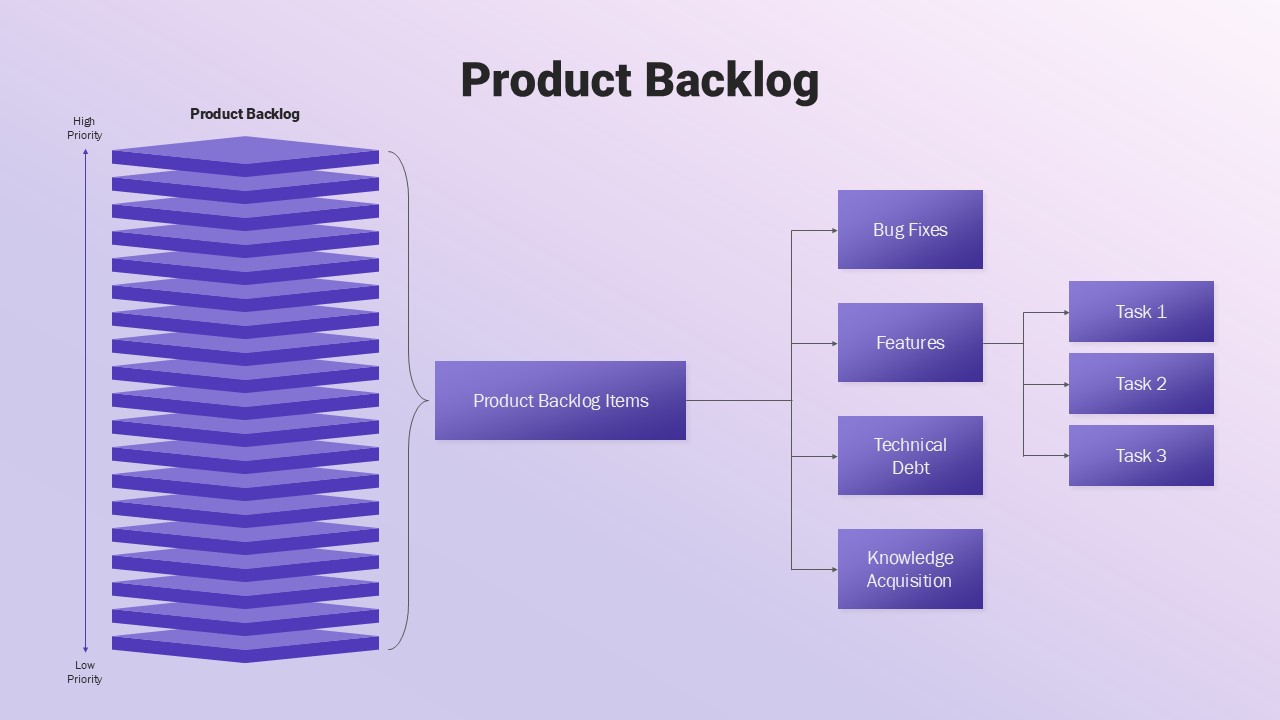
Product Backlog Diagram Template for PowerPoint & Google Slides
Software Development