Layered Onion Diagram Template for PowerPoint & Google Slides

Description
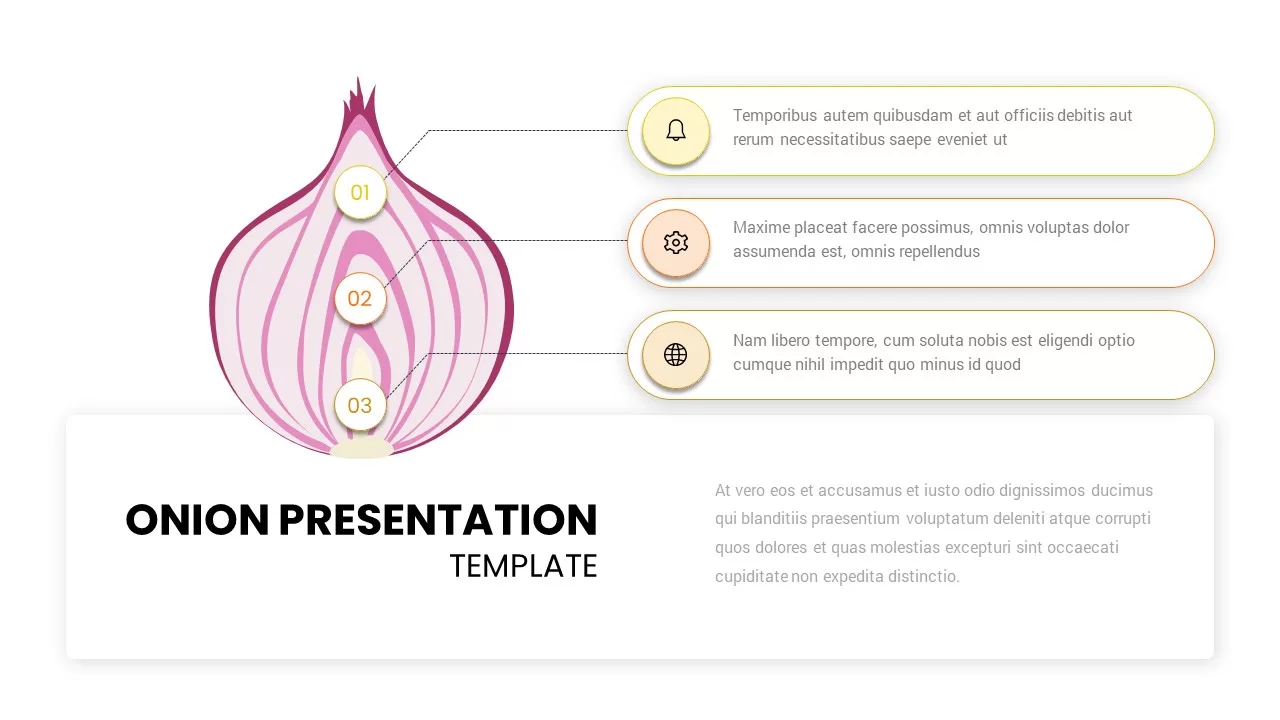
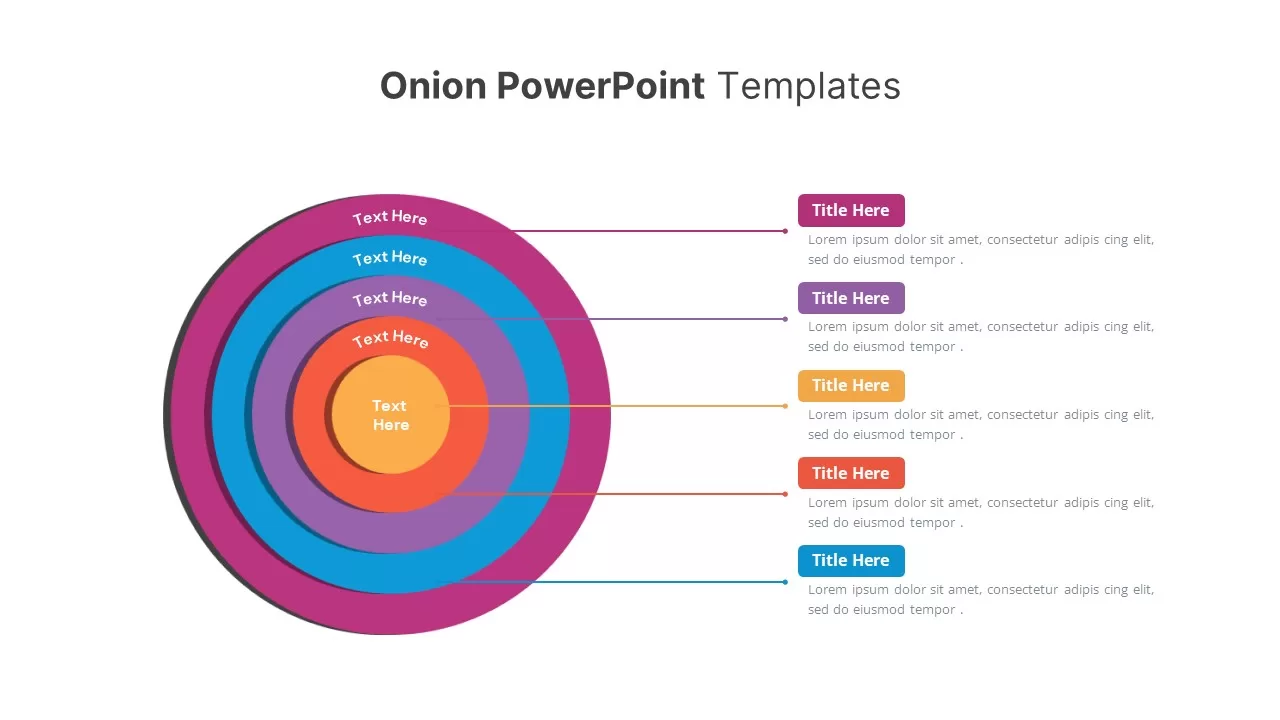
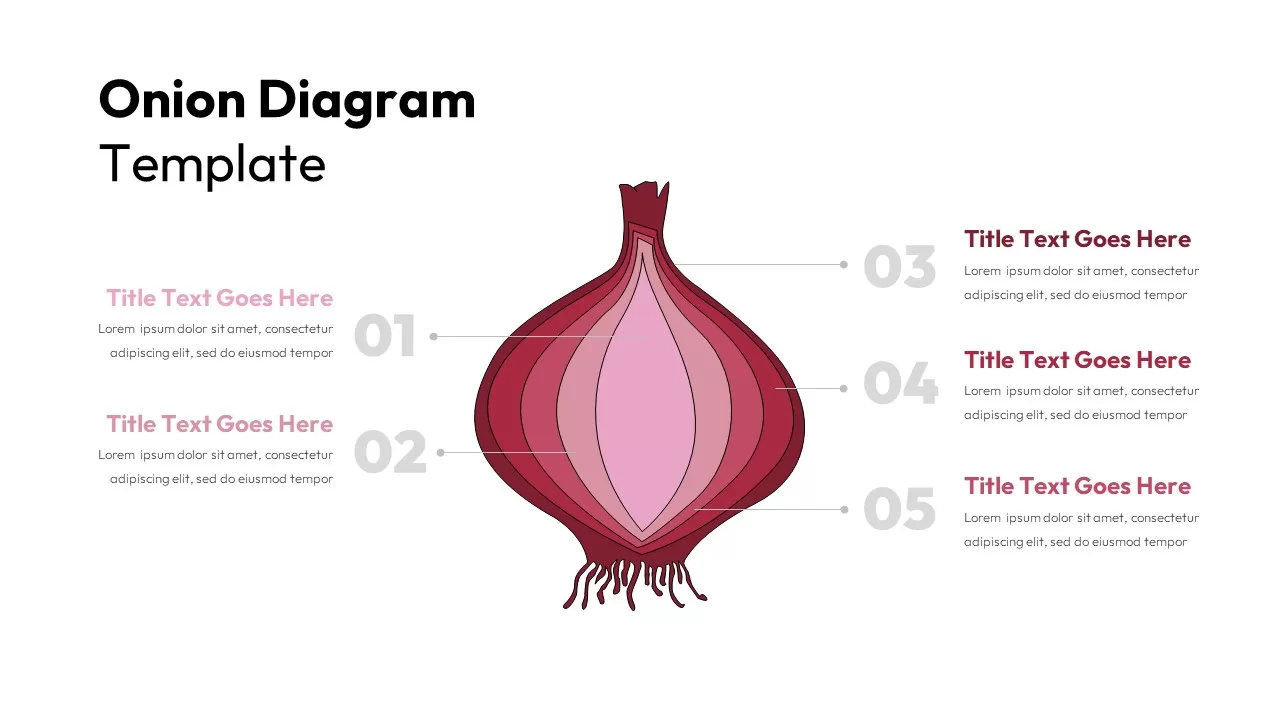
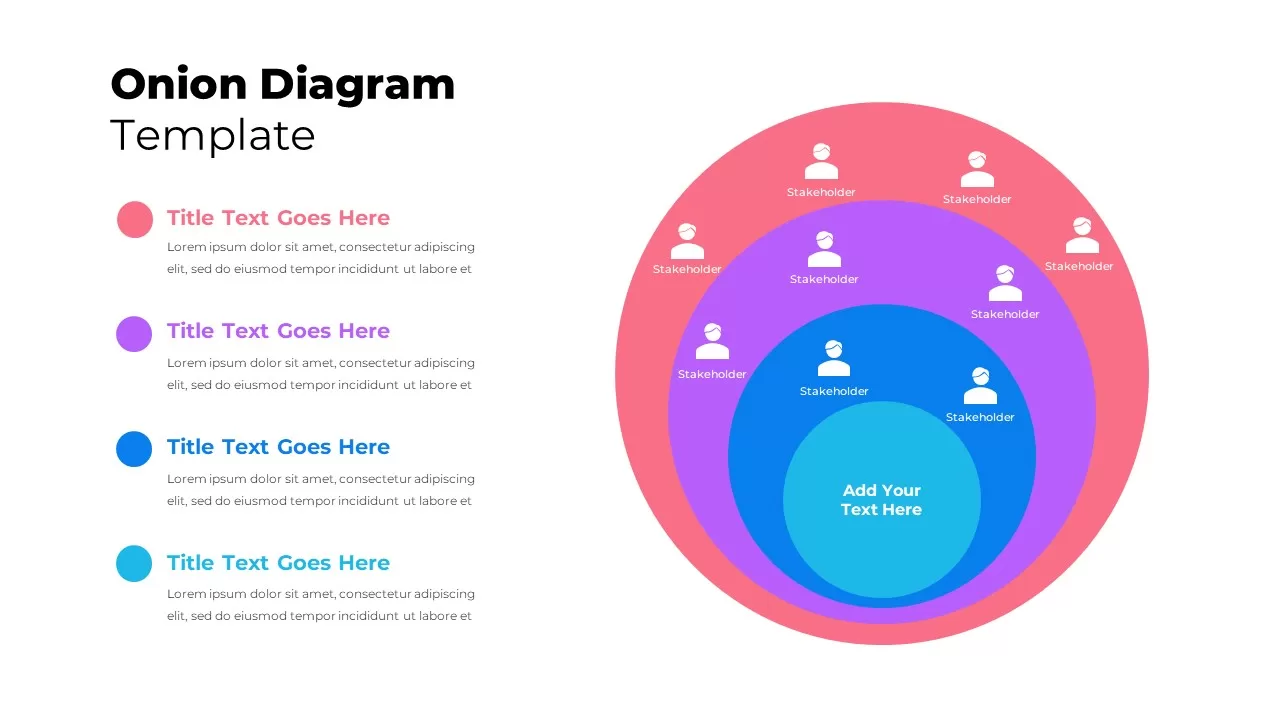
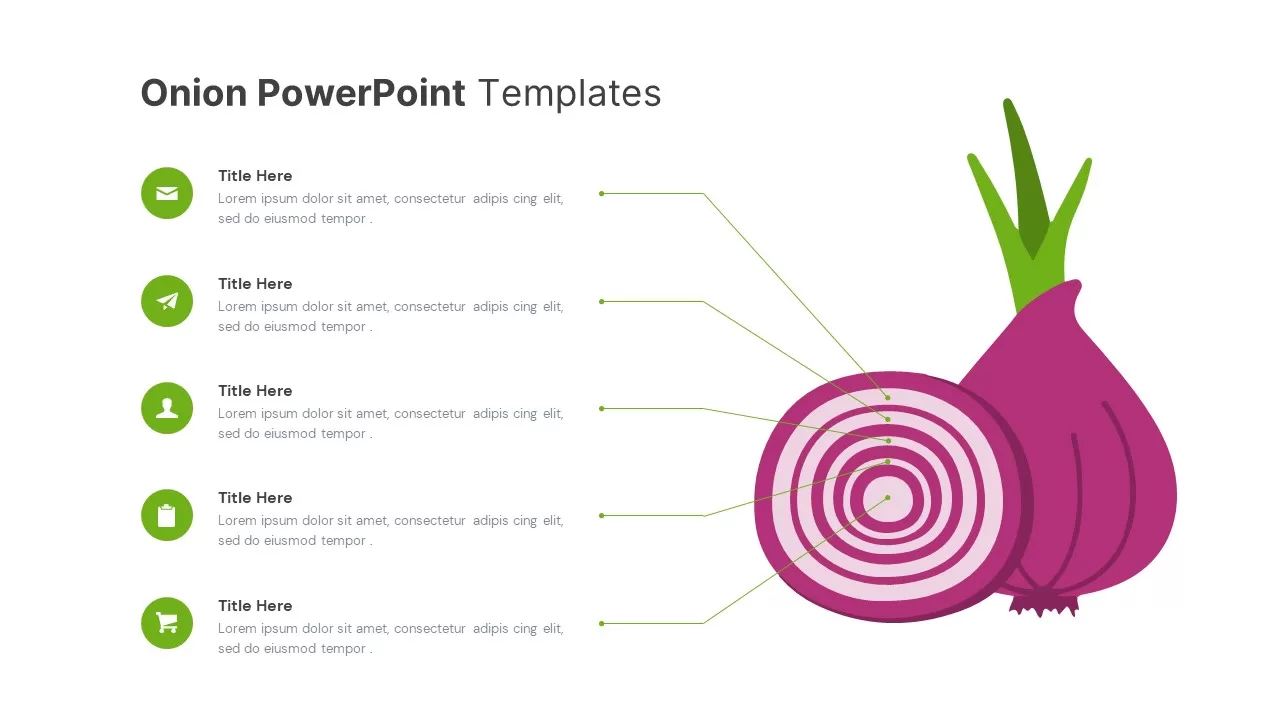
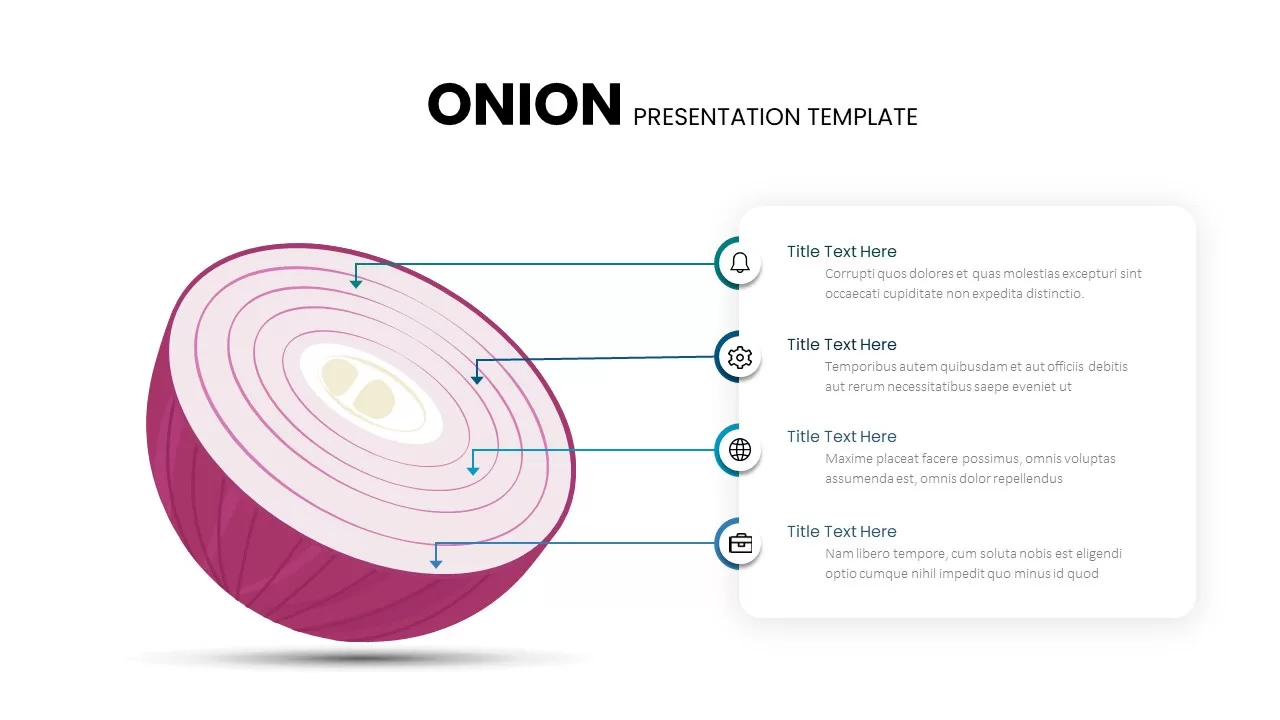
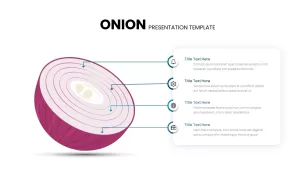
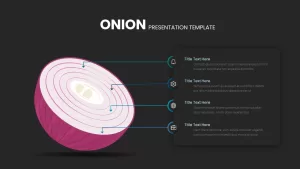
Visualize hierarchical structures, process layers, or system components with this layered onion diagram template, perfect for illustrating depth and interdependencies. The slide features a detailed half-onion graphic on the left, showcasing five concentric rings in subtle pink gradients. Four numbered callouts align to the right, each anchored by an intuitive icon—notifications, settings, global, and portfolio—and connected by colored arrows. A rounded text panel houses editable headings and descriptive placeholders, enabling you to define each layer’s function, stakeholder group, or process step with clarity.
Built on fully editable master slides and vector shapes, you can swap the onion graphic for custom illustrations, adjust ring colors to match your brand palette, or replace icons with your own symbols in seconds—without disrupting alignment. Crisp sans-serif typography, generous white space, and soft drop shadows ensure readability and a modern aesthetic. Theme compatibility propagates your corporate fonts, color styles, and logos seamlessly across both PowerPoint and Google Slides, eliminating manual formatting and version-control headaches.
Leverage built-in animation presets to reveal each callout sequentially, guiding audiences through layered explanations during live presentations or recorded webinars. Snap-to-grid guides maintain perfect spacing when you duplicate, resize, or reorder elements. High-resolution exports guarantee vivid clarity on any display or printed collateral. Whether you’re mapping product features, security tiers, organizational hierarchies, or risk management layers, this onion diagram slide transforms complex, nested information into an intuitive visual narrative, streamlining stakeholder alignment and decision-making.
Who is it for
Business analysts, project managers, strategy consultants, IT architects, and educators who need a clear, professional slide to present multi-layered models, stakeholder frameworks, or depth-based analyses.
Other Uses
Repurpose this template for concentric circle models, security clearance levels, core-to-periphery mappings, service tier breakdowns, or any scenario requiring a structured, layered visualization.
Login to download this file

Item ID
SB03135
Related Templates

Layered Onion Diagram Slide for Process Breakdown in PowerPoint & Google Slides
Process
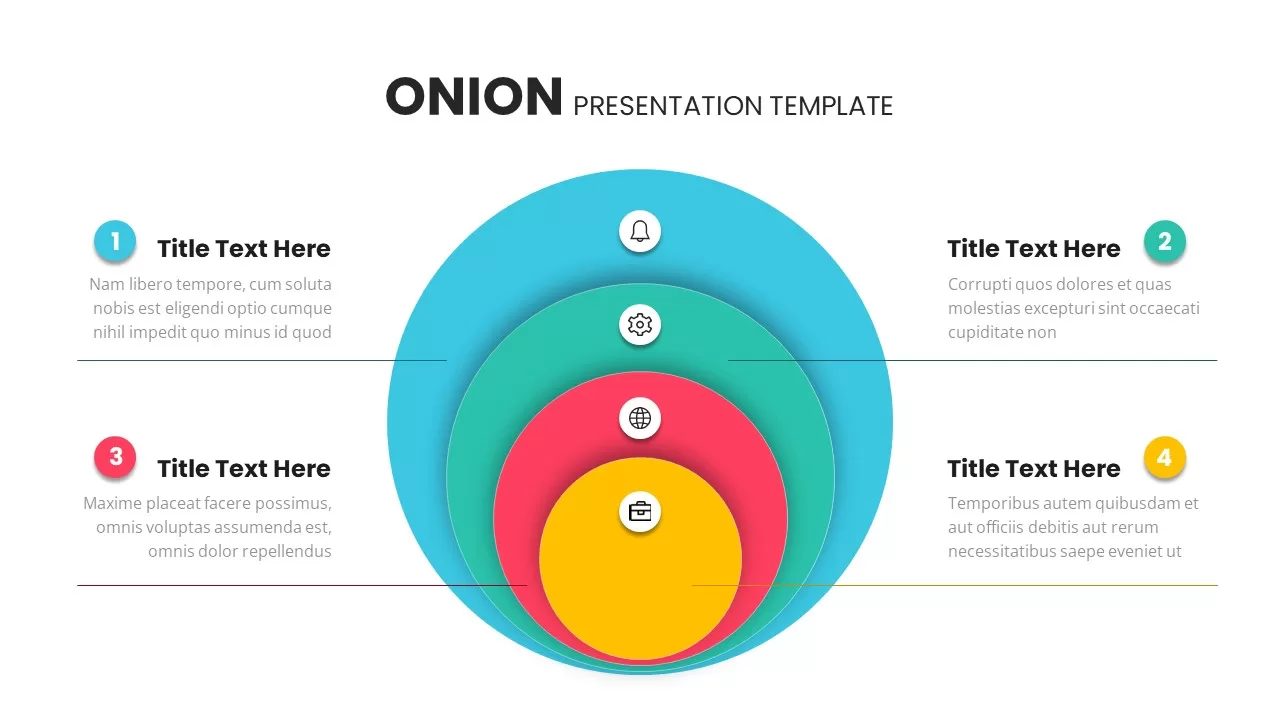
Colorful Layered Onion Diagram Slide for PowerPoint & Google Slides
Process
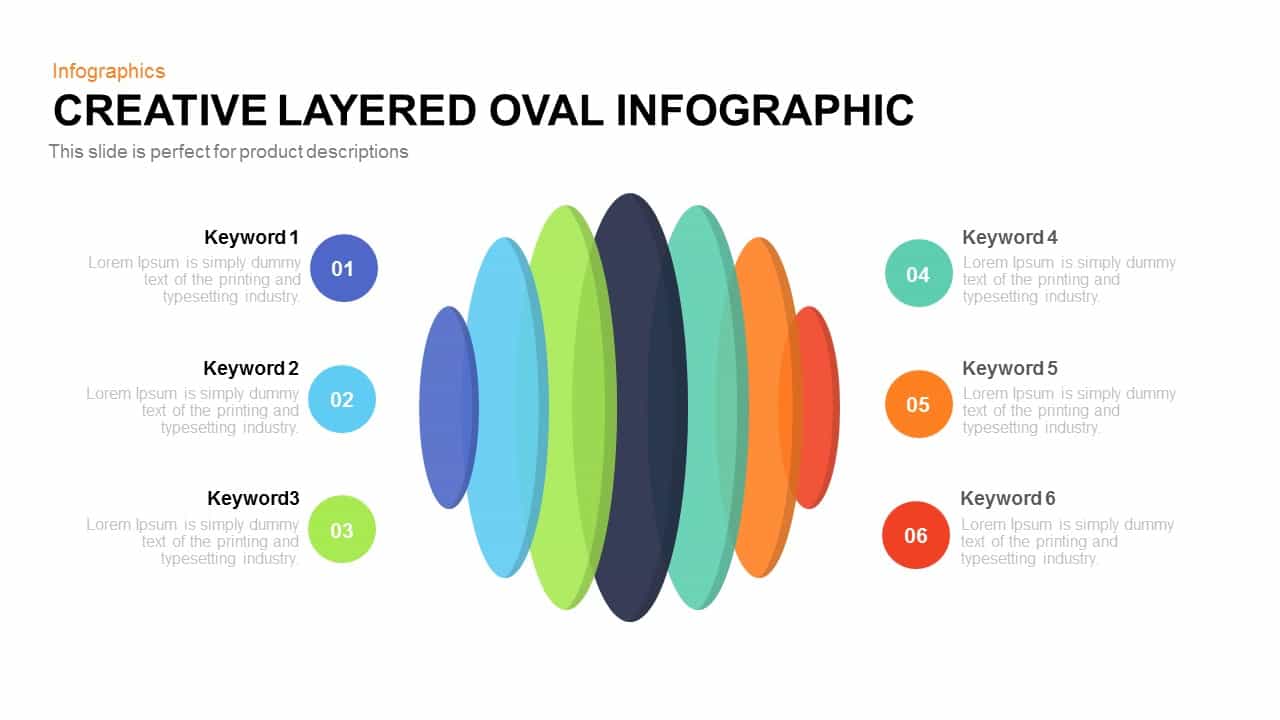
Creative Layered Oval Infographic Diagram Template for PowerPoint & Google Slides
Process
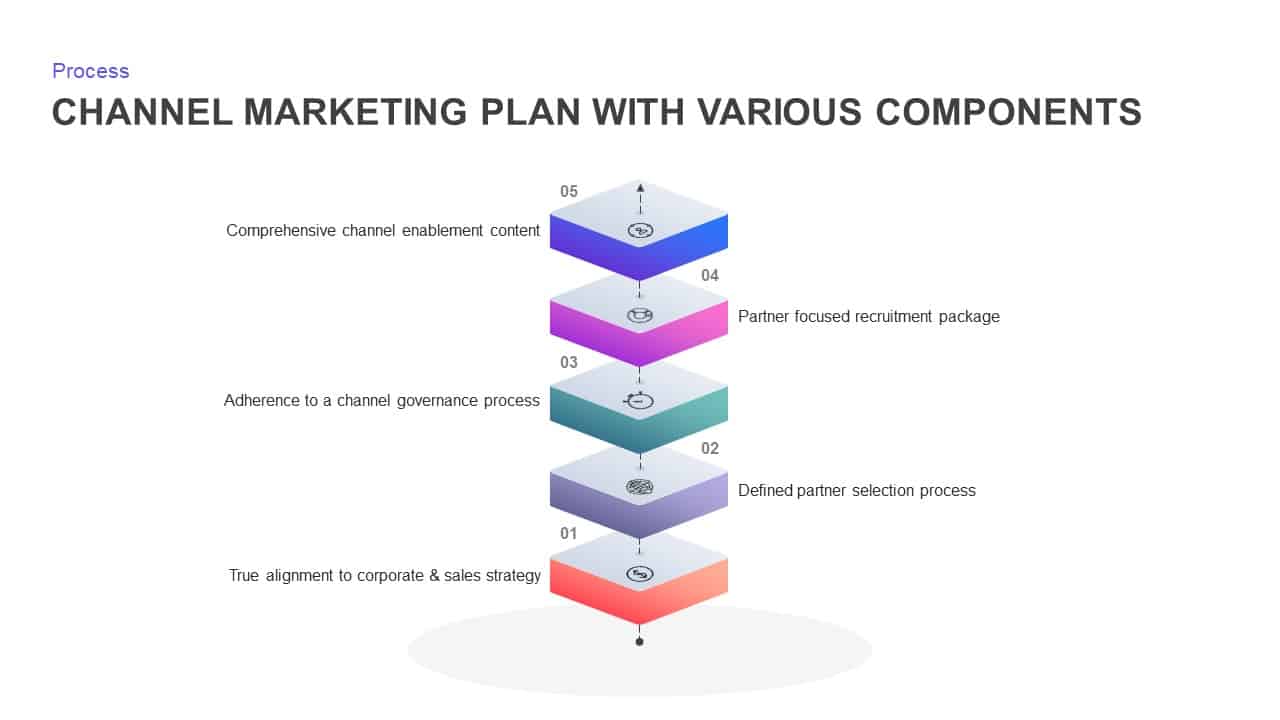
Channel Marketing Plan Layered Diagram Template for PowerPoint & Google Slides
Process
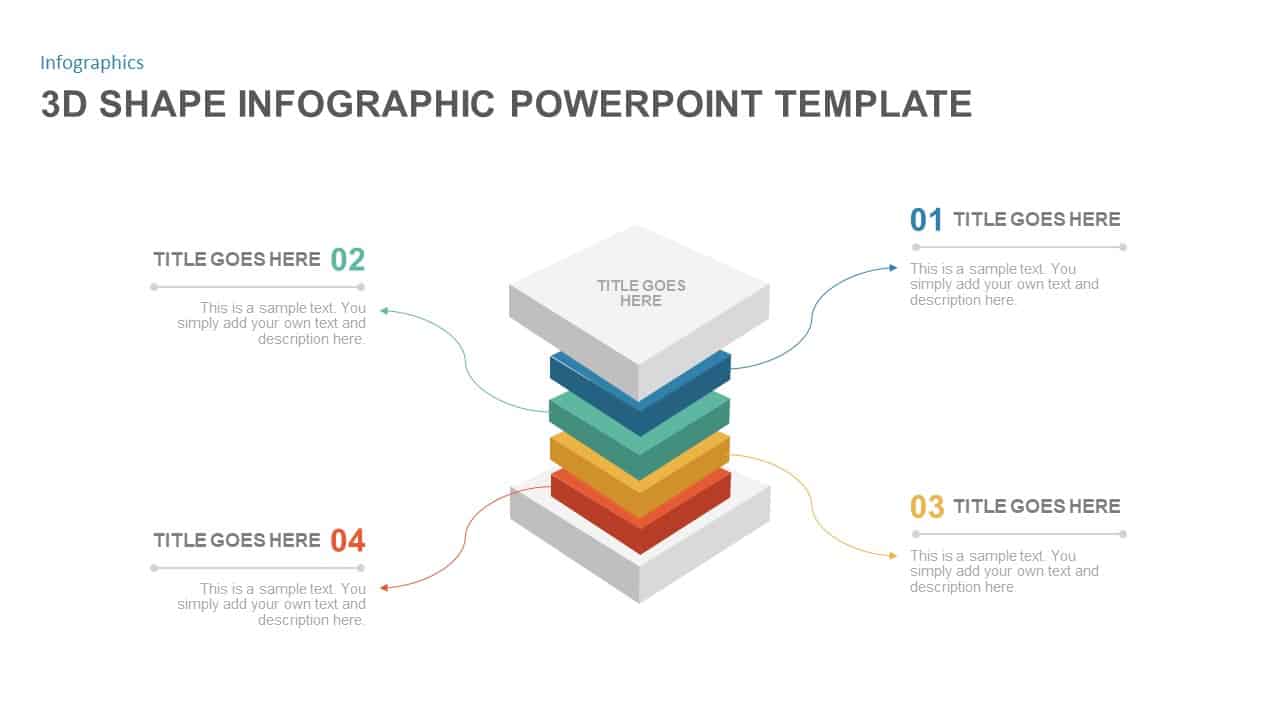
3D Layered Infographic Diagram Template for PowerPoint & Google Slides
Infographics
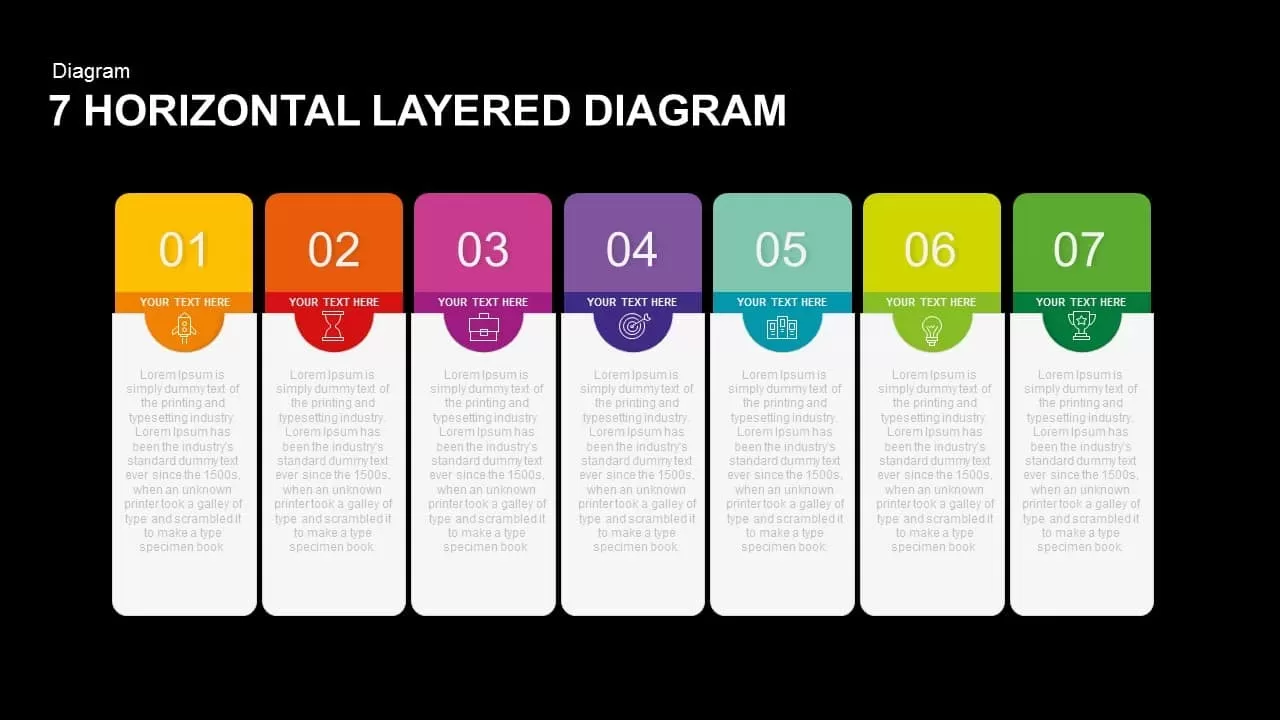
7 Horizontal Layered Diagram for PowerPoint & Google Slides
Process
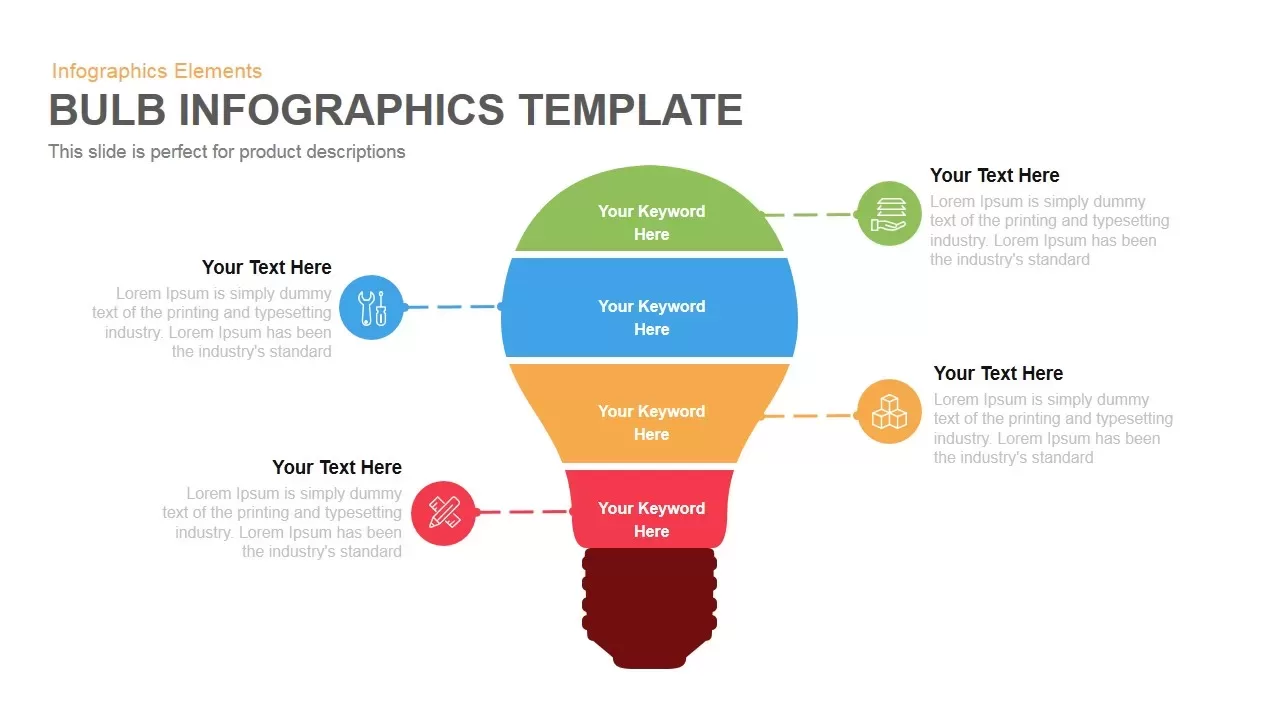
Layered Bulb Infographic Four Segments Template for PowerPoint & Google Slides
Funnel
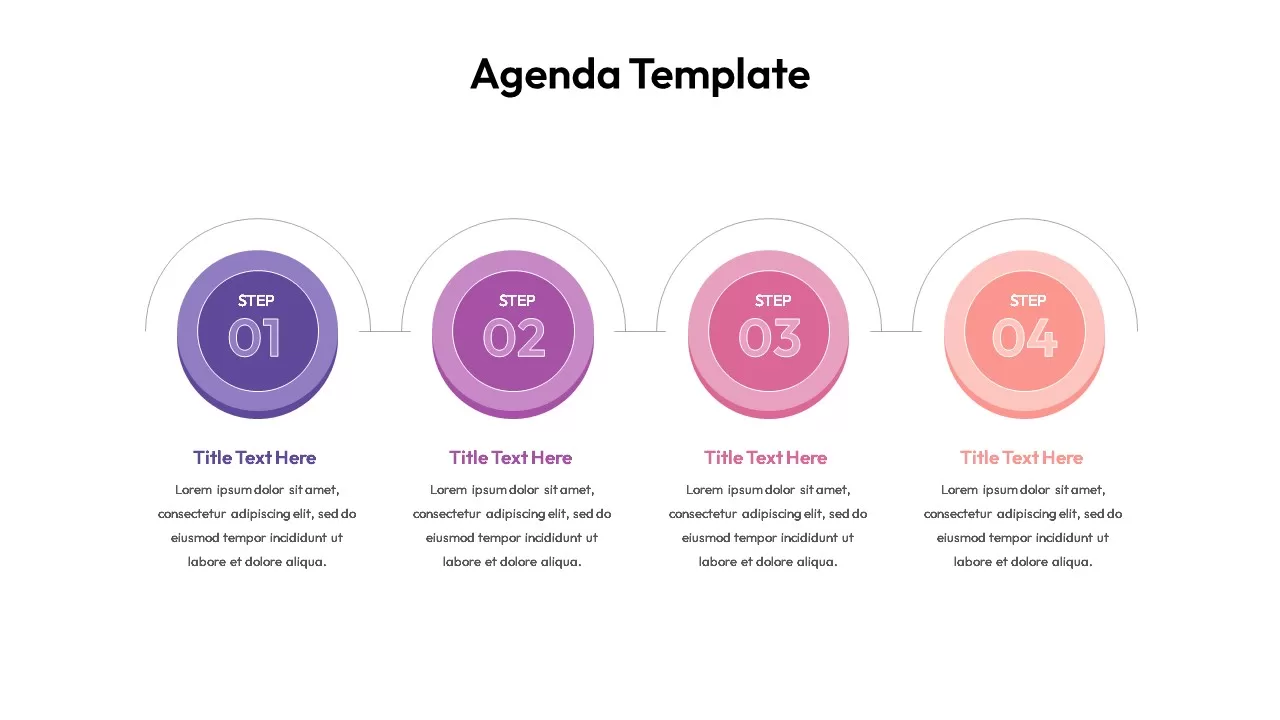
Layered Circular Four-Step Agenda Slide Layout Template for PowerPoint & Google Slides
Agenda
Layered Data Governance Maturity Model Template for PowerPoint & Google Slides
Process
Onion Layer Infographic Diagram Template for PowerPoint & Google Slides
Process
Five-Layer Onion Diagram Infographic Template for PowerPoint & Google Slides
Process
4-Layer Human-Centric Onion Diagram Template for PowerPoint & Google Slides
Process
Onion Diagram Callout Template for PowerPoint & Google Slides
Process
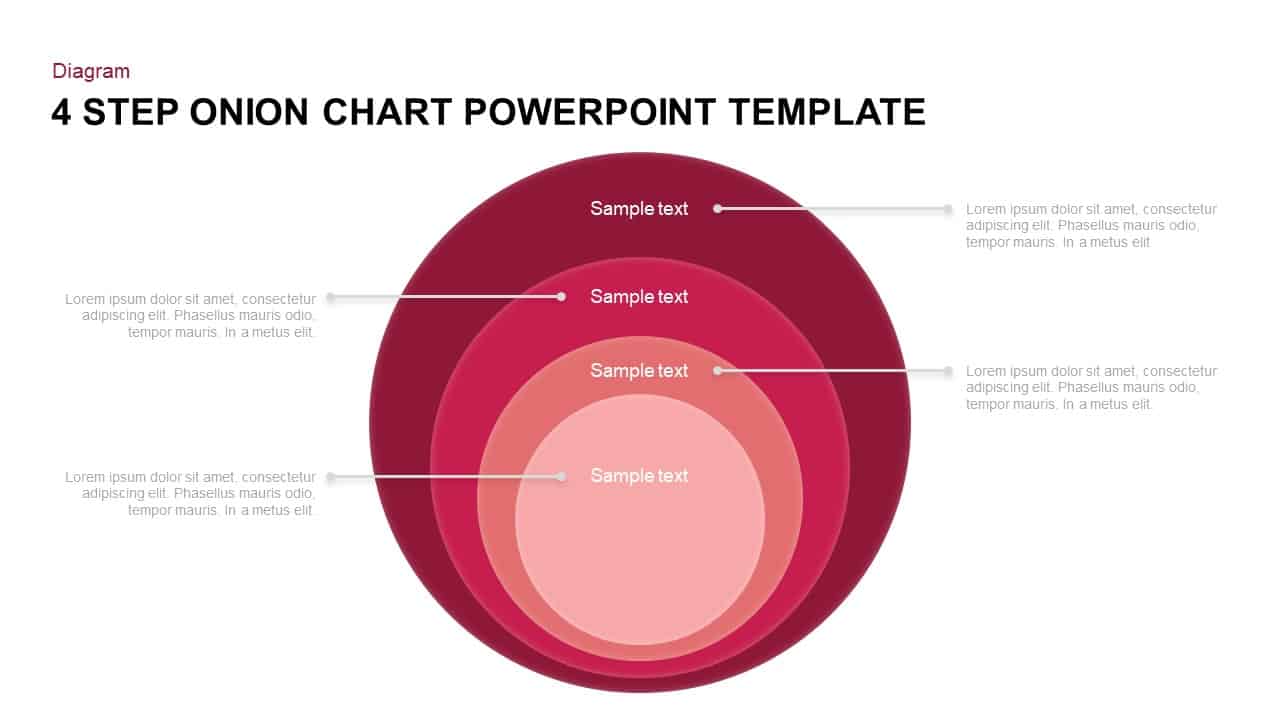
Four-Step Onion Chart Process Template for PowerPoint & Google Slides
Charts
Snake Diagram Pack of 8 Slides template for PowerPoint & Google Slides
Process
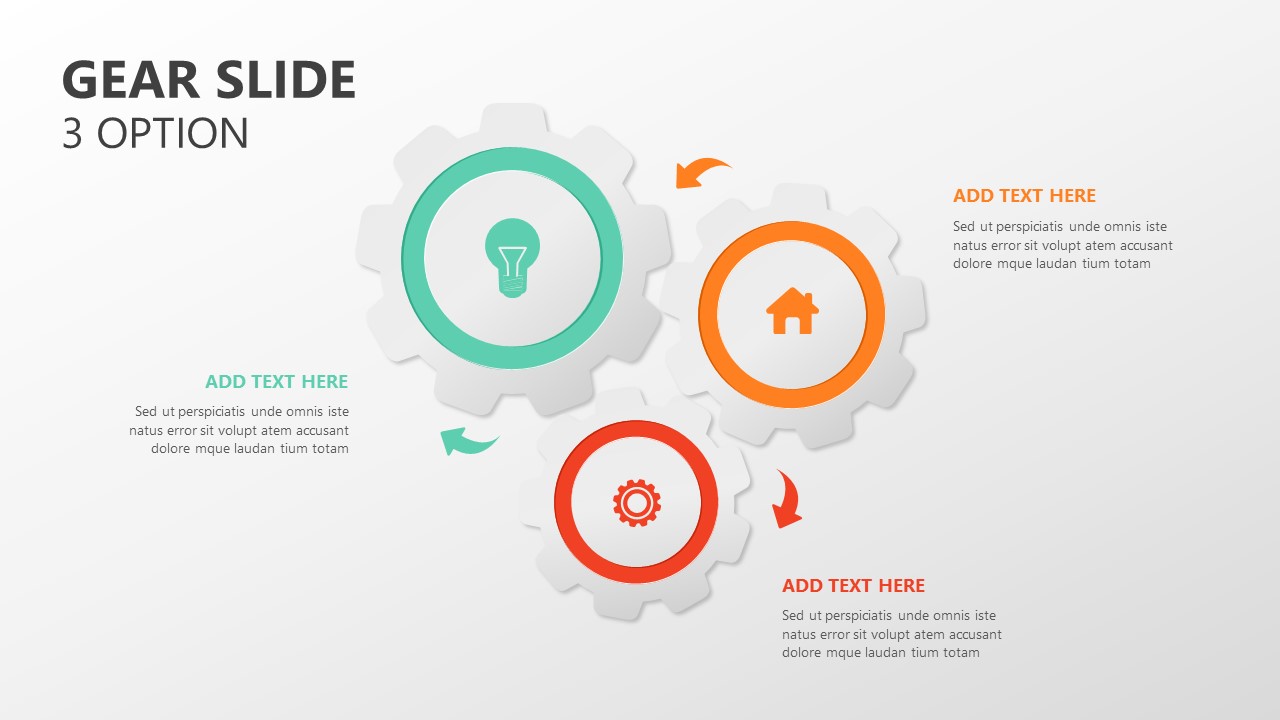
Gear Process Diagram PowerPoint Template for PowerPoint & Google Slides
Process
Sales Process Workflow Funnel Diagram PowerPoint Template for PowerPoint & Google Slides
Funnel
Puzzle Diagram PowerPoint Template for PowerPoint & Google Slides
Process
Transportation Logistics PowerPoint Diagram template for PowerPoint & Google Slides
Process
Emoji Scale PowerPoint Diagram for PowerPoint & Google Slides
Infographics
4 Step Problem Solving PowerPoint Diagram for PowerPoint & Google Slides
Process
Business Funnel Diagram template for PowerPoint & Google Slides
Funnel
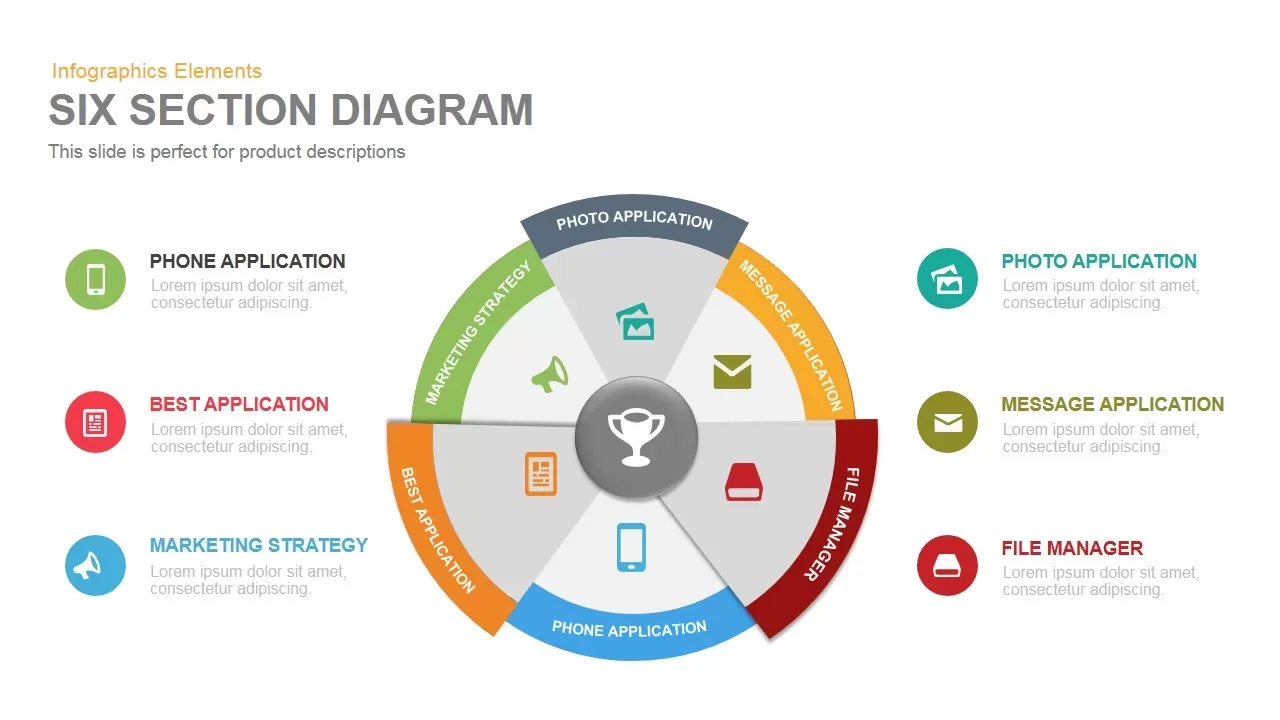
Six Section Diagram template for PowerPoint & Google Slides
Circular
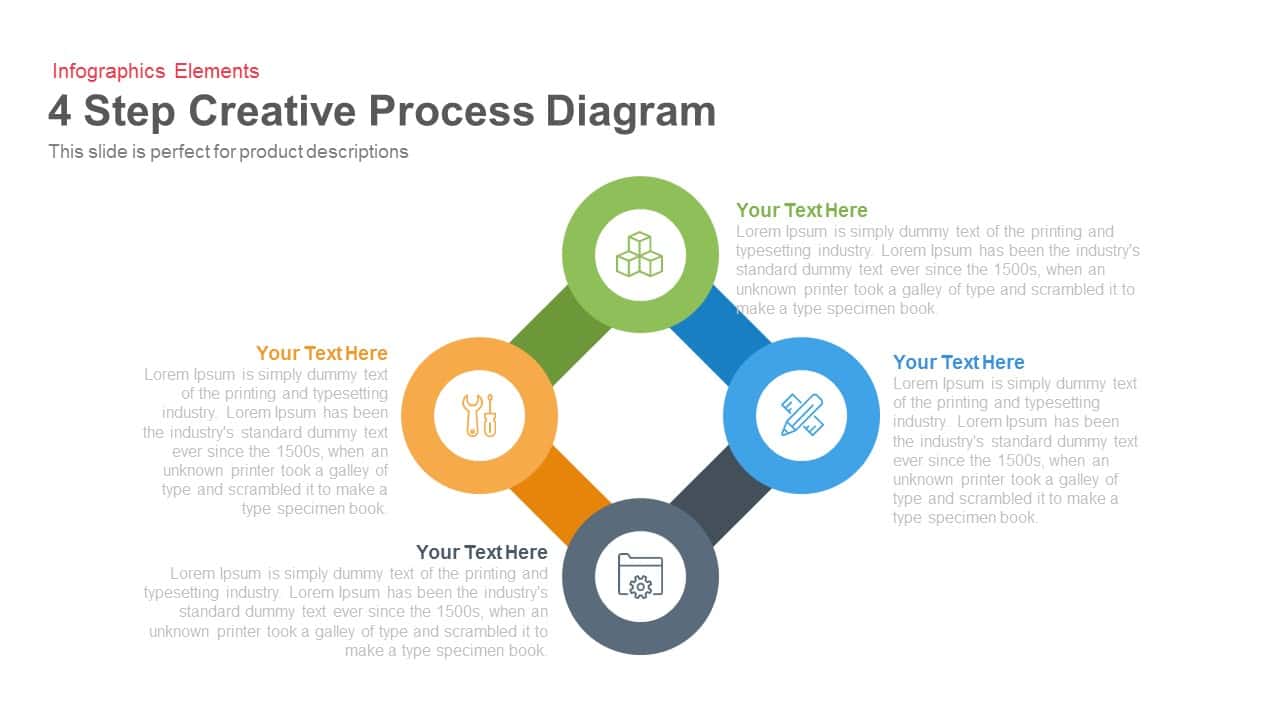
4 Step Creative Process Diagram Template for PowerPoint & Google Slides
Infographics
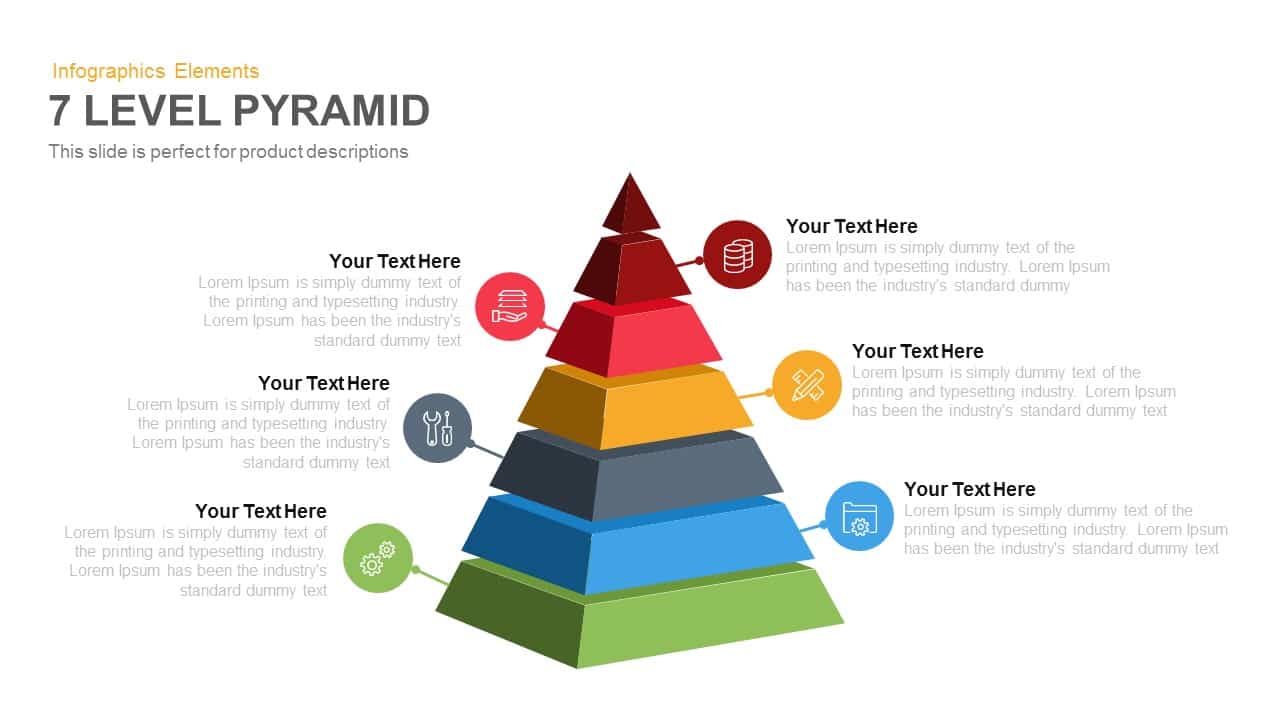
7-Level 3D Pyramid Infographic Diagram Template for PowerPoint & Google Slides
Pyramid
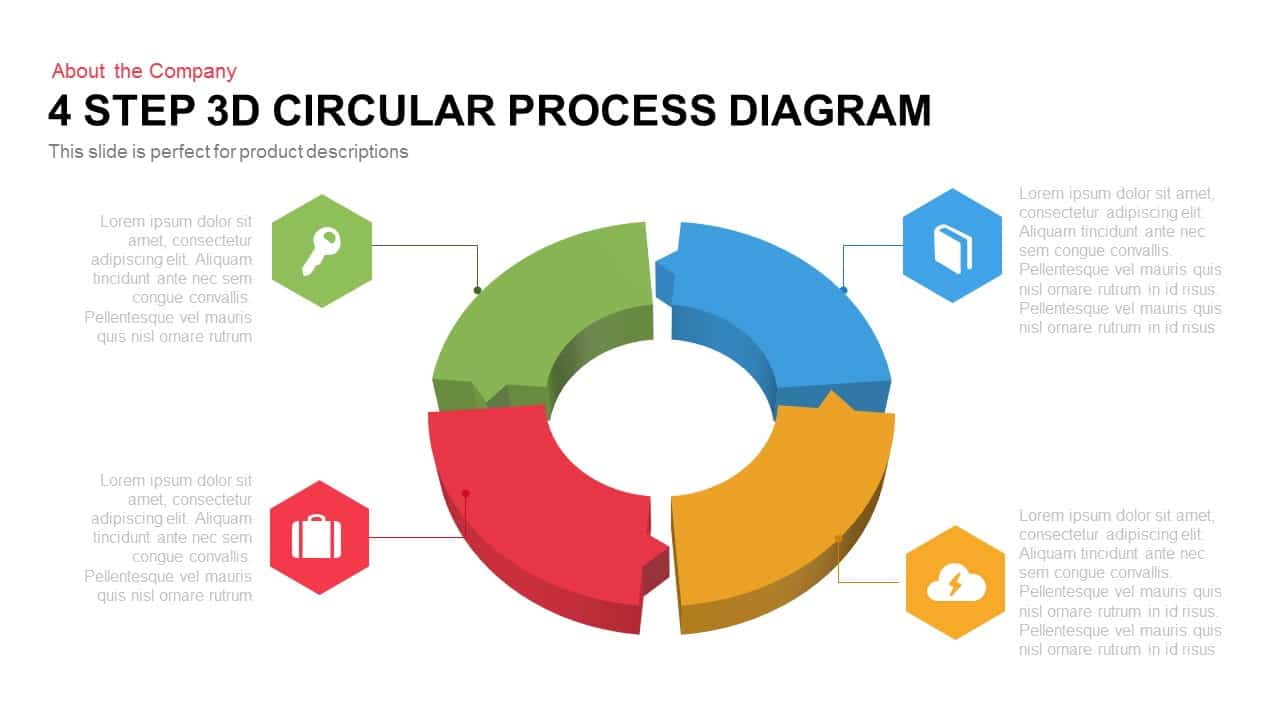
4 Step 3D Circular Process Diagram template for PowerPoint & Google Slides
Process
5 Arrow Diagram template for PowerPoint & Google Slides
Arrow
Multi-Segment Circle Split Diagram template for PowerPoint & Google Slides
Circular

15-Step Process Flow Diagram Template for PowerPoint & Google Slides
Process
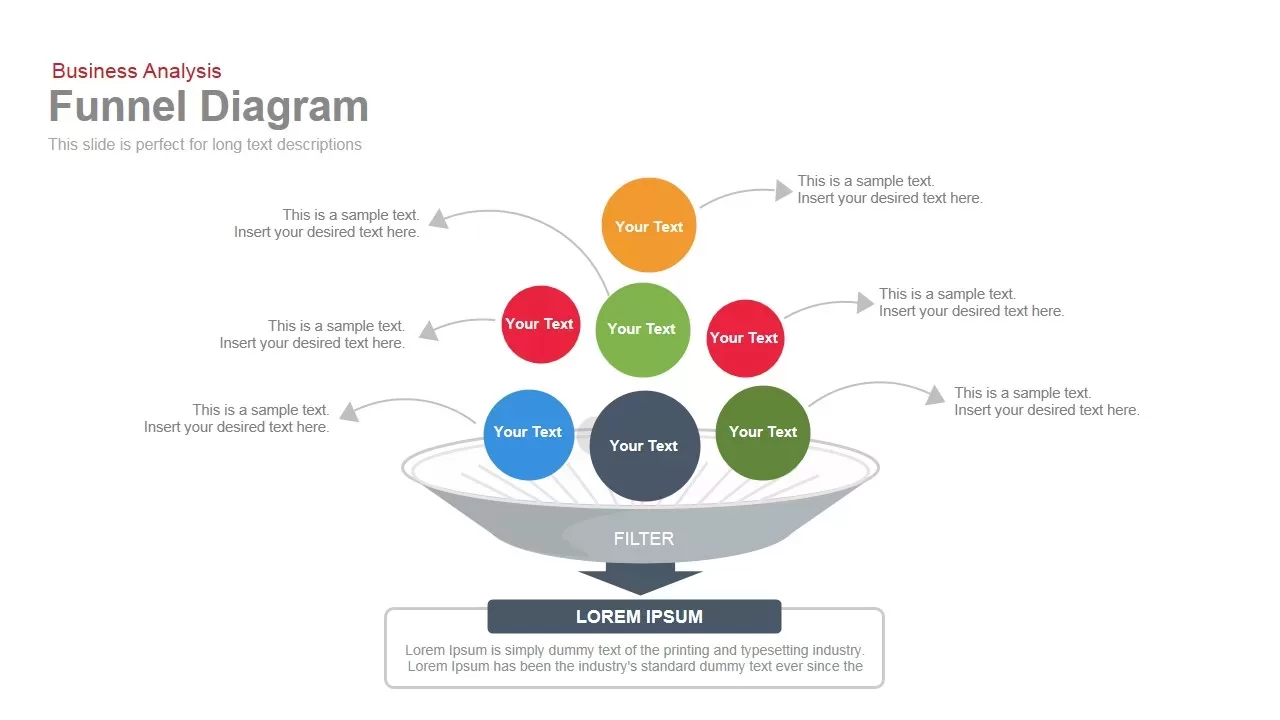
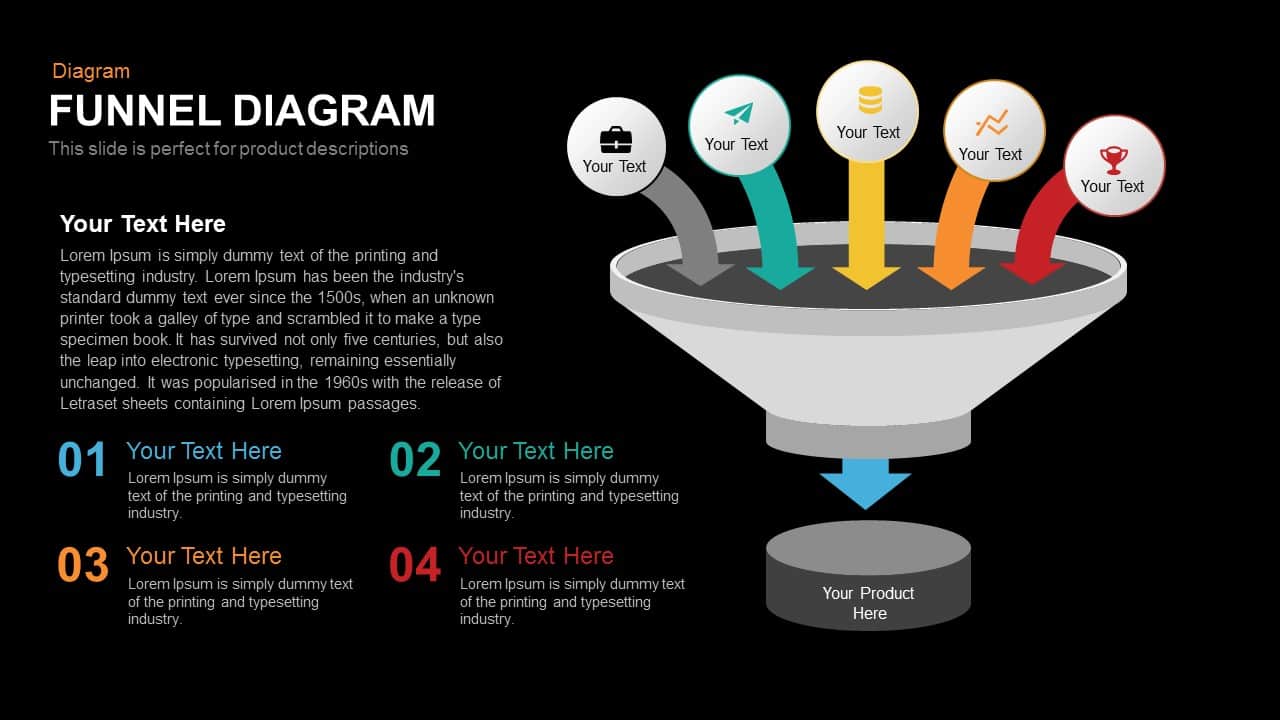
Funnel Diagram template for PowerPoint & Google Slides
Funnel

Four-Circle Venn Process Diagram template for PowerPoint & Google Slides
Process

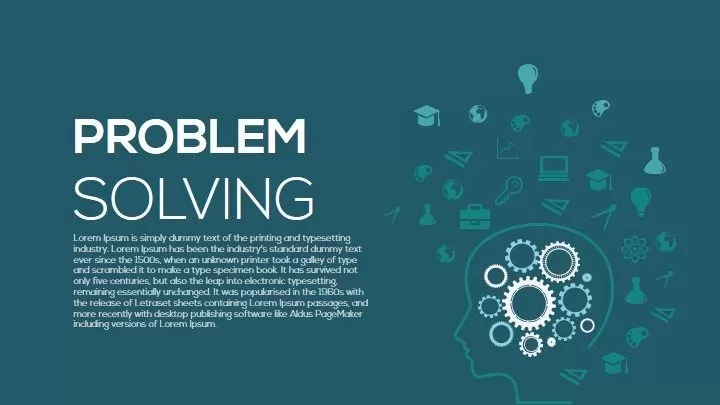
Problem Solving Concept Diagram Template for PowerPoint & Google Slides
Infographics
Five-Stage Pyramid Infographics Diagram Template for PowerPoint & Google Slides
Pyramid
Engaging Five-Stage Process Diagram Template for PowerPoint & Google Slides
Process
Three-Circle Diagram Infographic Template for PowerPoint & Google Slides
Circular
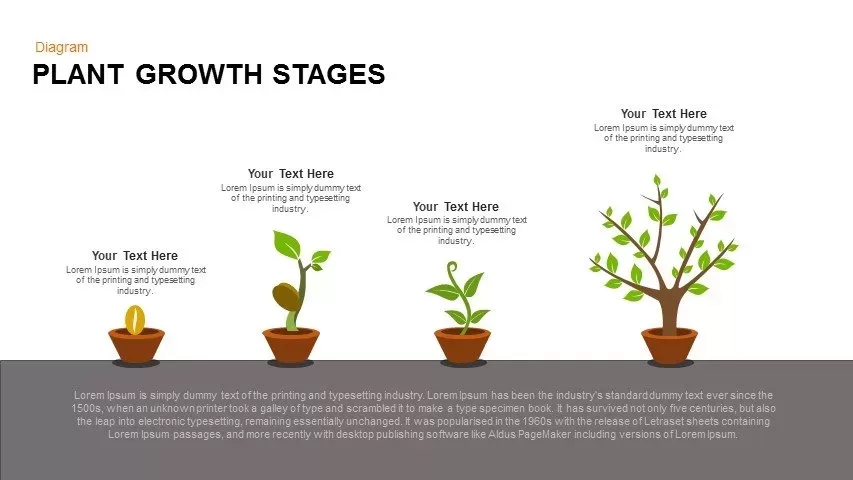
Editable Plant Growth Stages Diagram Template for PowerPoint & Google Slides
Process
8 Steps Arrow Process Diagram template for PowerPoint & Google Slides
Process

Four-Level Business Pyramid Diagram Template for PowerPoint & Google Slides
Pyramid
Five-Stage Cyclic Process Arrow Diagram Template for PowerPoint & Google Slides
Process
Modern Four Stage Gear Diagram Template for PowerPoint & Google Slides
Process
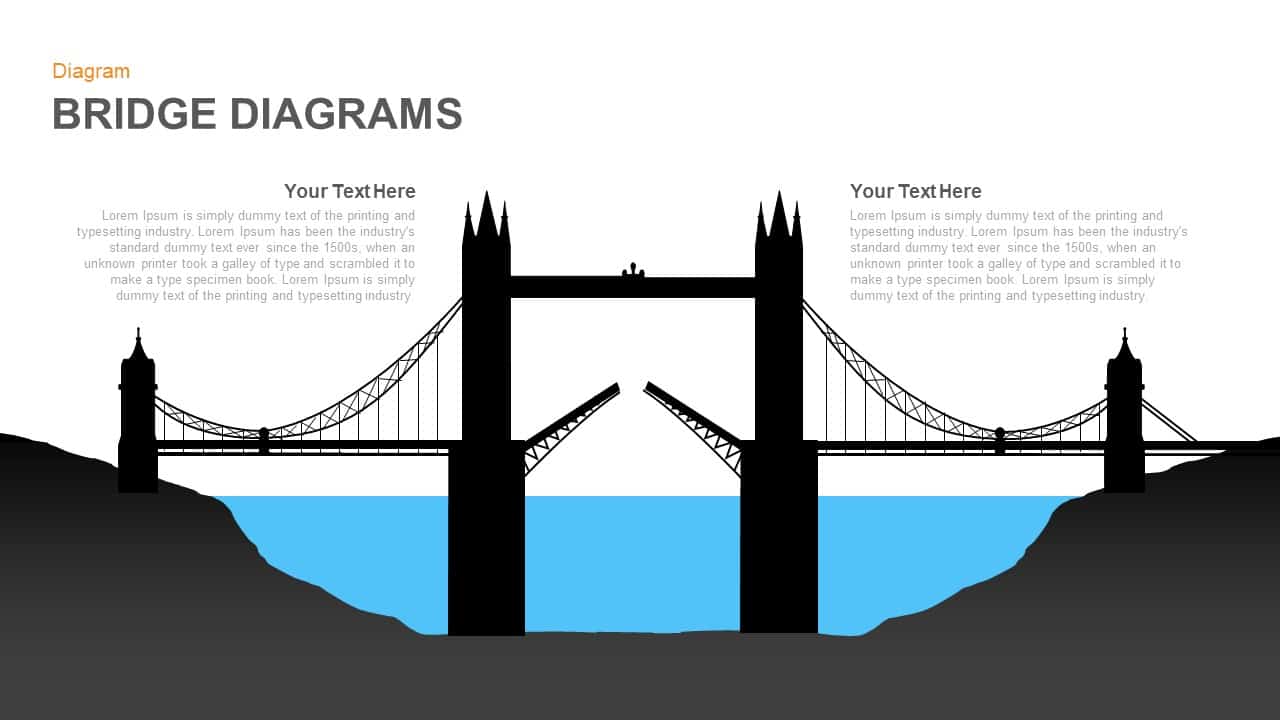
Modern Bridge Diagram Slide Design Template for PowerPoint & Google Slides
Process
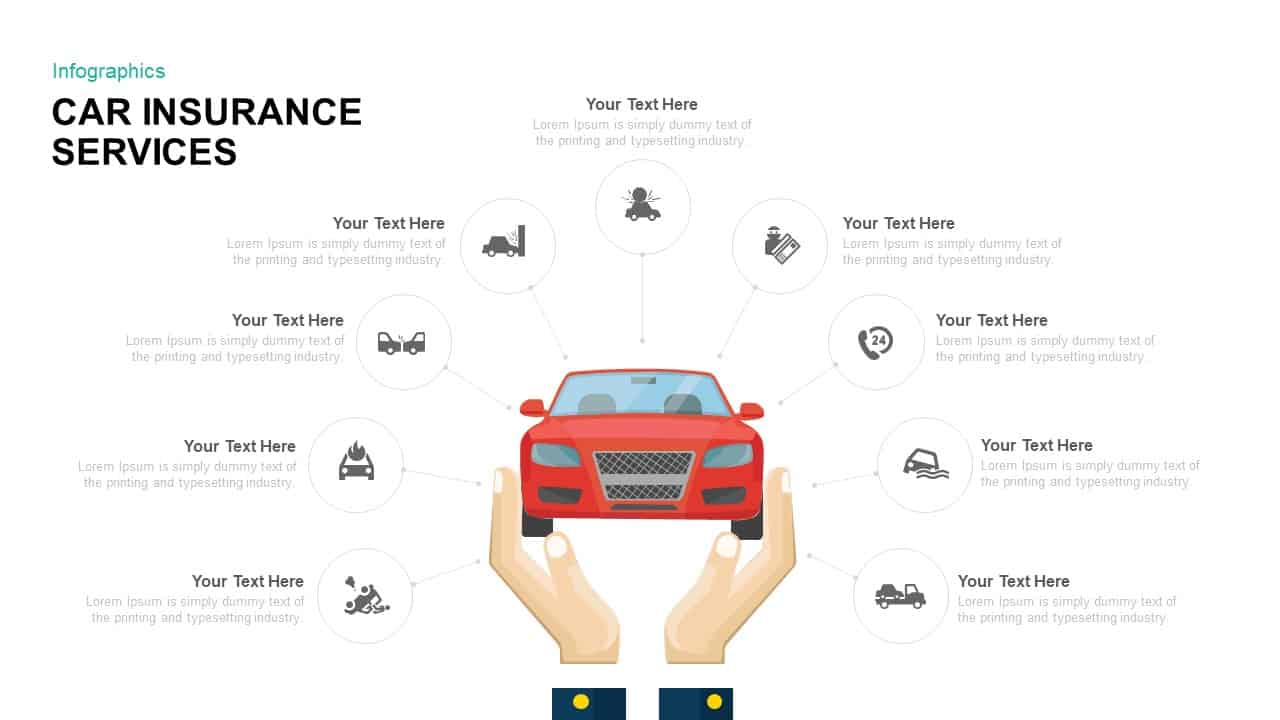
Comprehensive Car Insurance Services Diagram Template for PowerPoint & Google Slides
Business
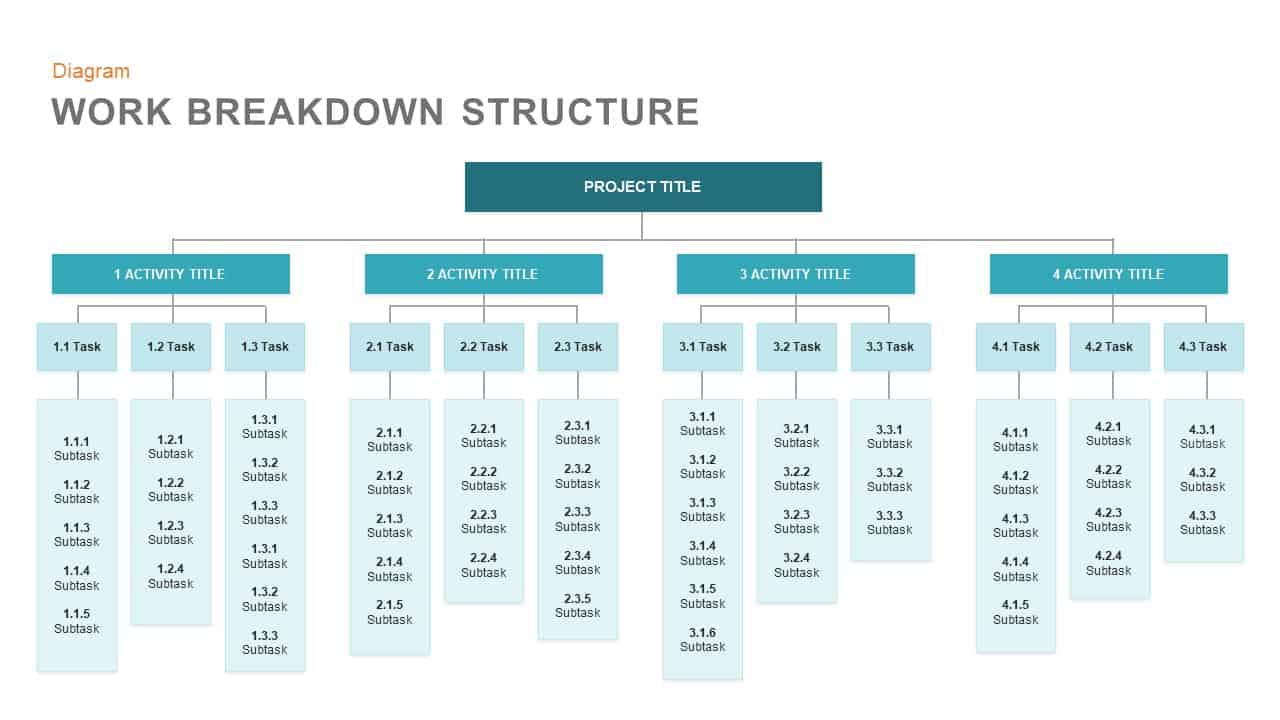
Work Breakdown Structure Diagram Template for PowerPoint & Google Slides
Diagrams
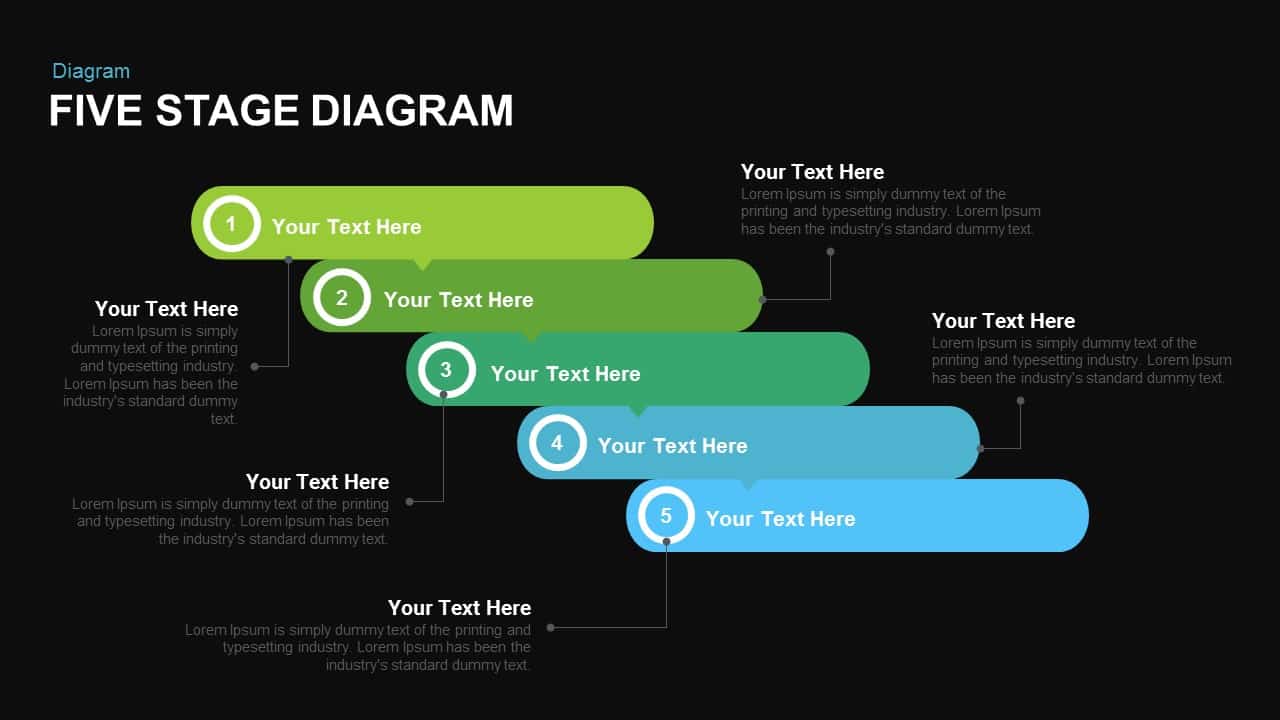
Five-Stage Process Diagram Template for PowerPoint & Google Slides
Process
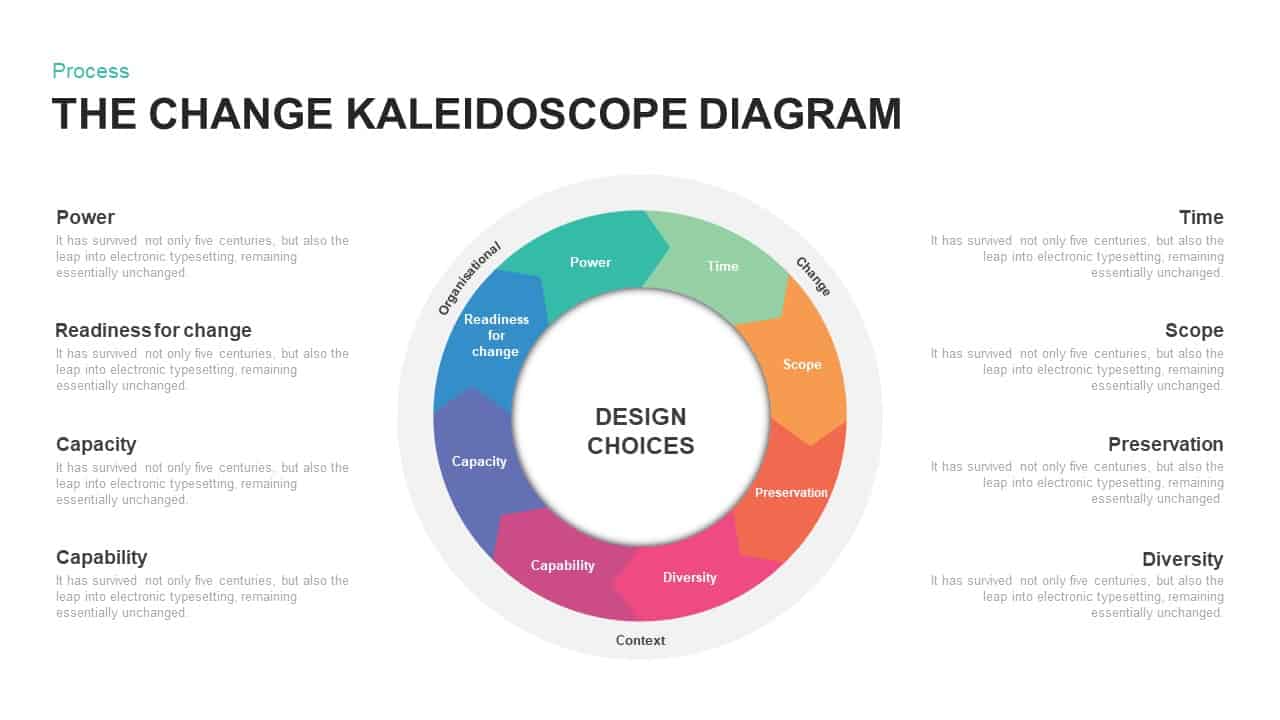
Change Kaleidoscope Process Diagram Template for PowerPoint & Google Slides
Circular
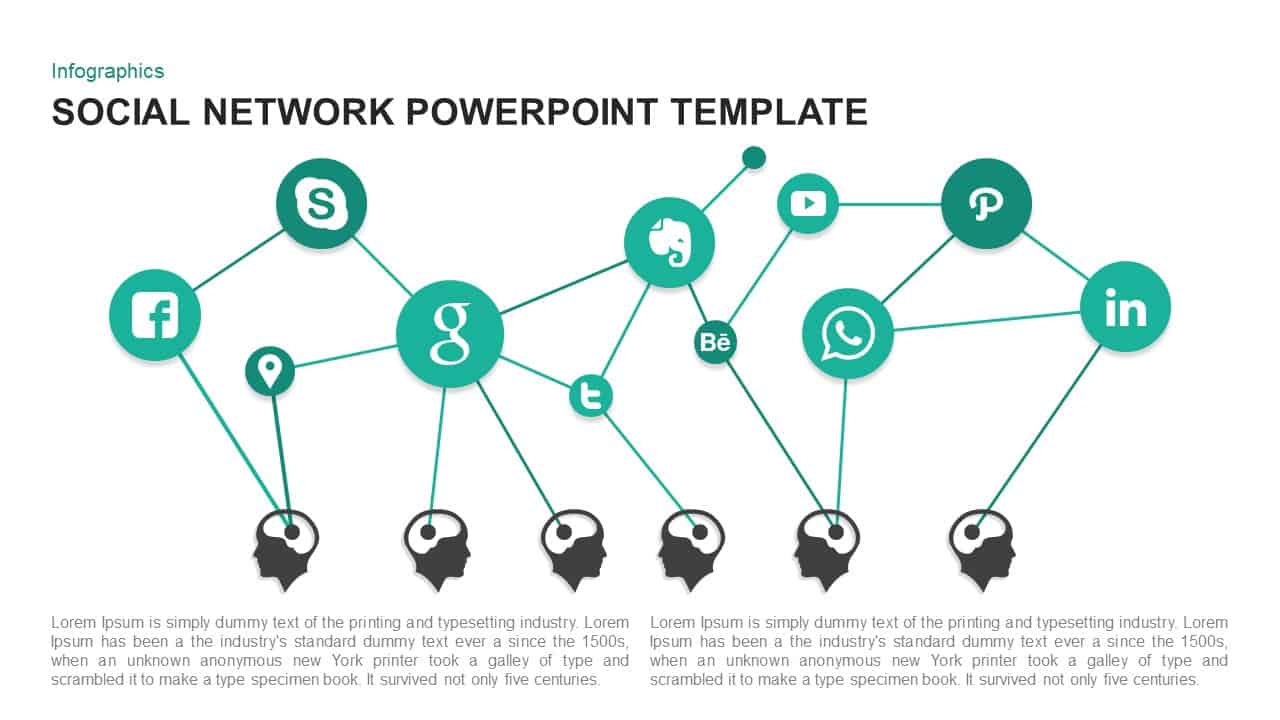
Social Network Infographic Diagram Template for PowerPoint & Google Slides
Digital Marketing
Five-Stage Linear Process Flow Diagram Template for PowerPoint & Google Slides
Process
Four-Stage Cycle Process Diagram Template for PowerPoint & Google Slides
Process
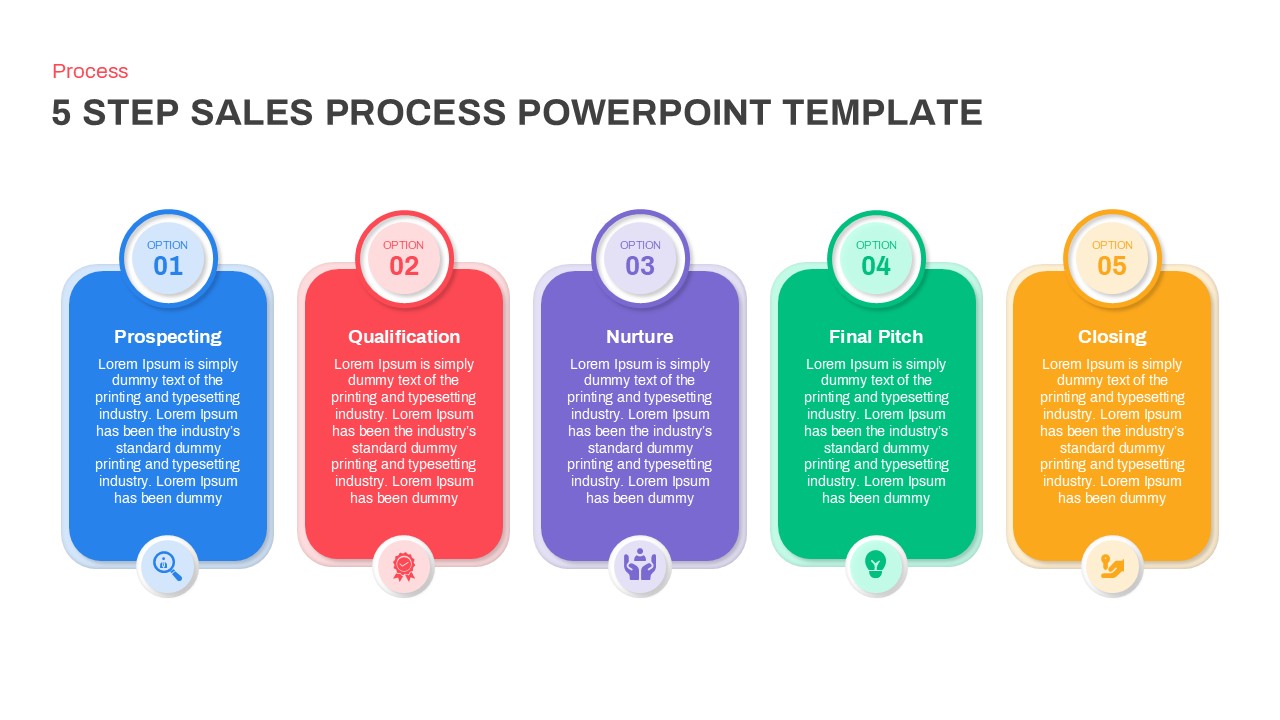
Modern 5-Step Sales Process Diagram Template for PowerPoint & Google Slides
Process
Agile Work Streams Arrow Diagram Template for PowerPoint & Google Slides
Process
6-Step Circular Process Flow Diagram Template for PowerPoint & Google Slides
Process
Four-Stage Funnel Diagram Infographic Template for PowerPoint & Google Slides
Funnel
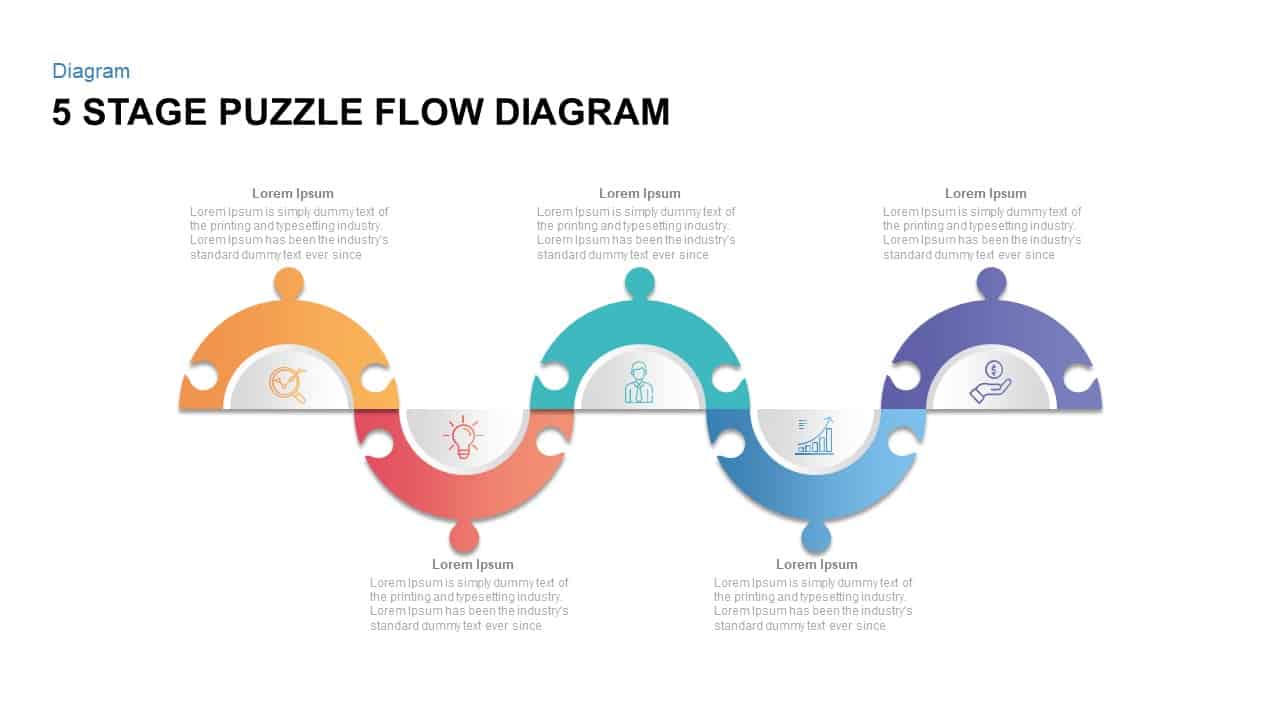
Five Stage Puzzle Flow Diagram Template for PowerPoint & Google Slides
Process
4-Stage Linear Process Flow Diagram Template for PowerPoint & Google Slides
Process
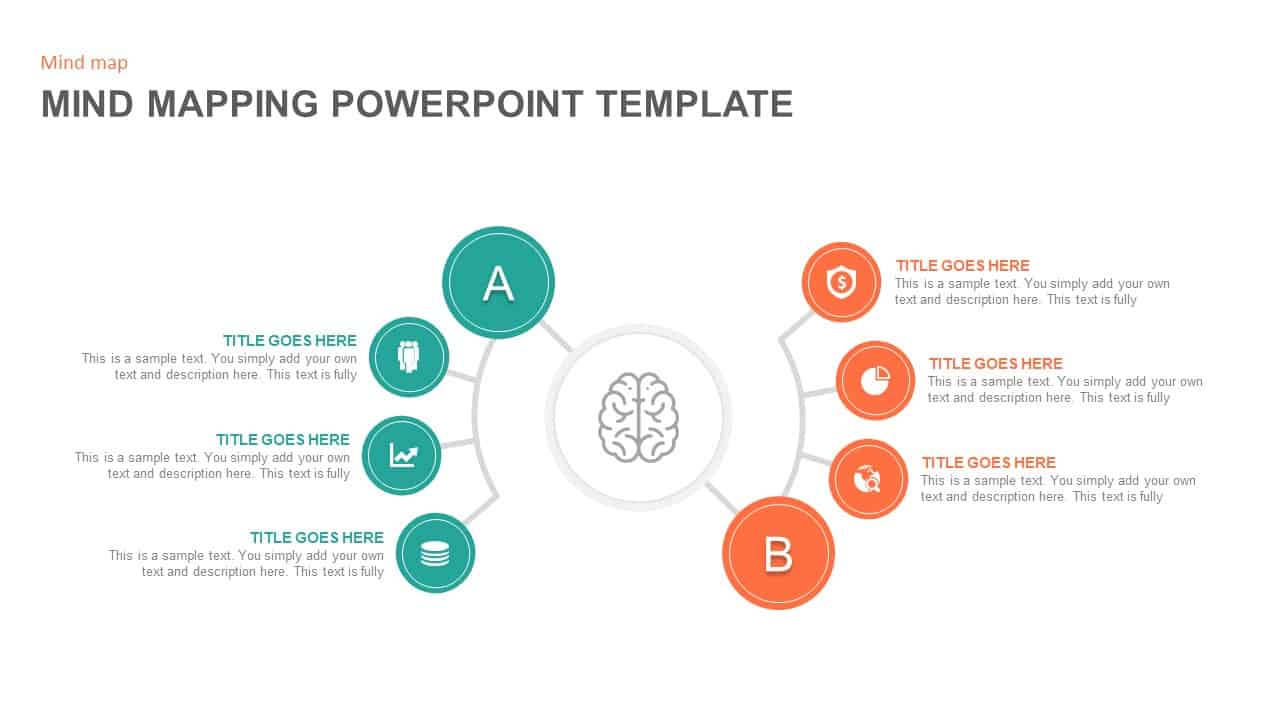
Creative Mind Mapping Diagram with Icons Template for PowerPoint & Google Slides
Mind Maps
Four-Stage Funnel Diagram Infographic Template for PowerPoint & Google Slides
Funnel
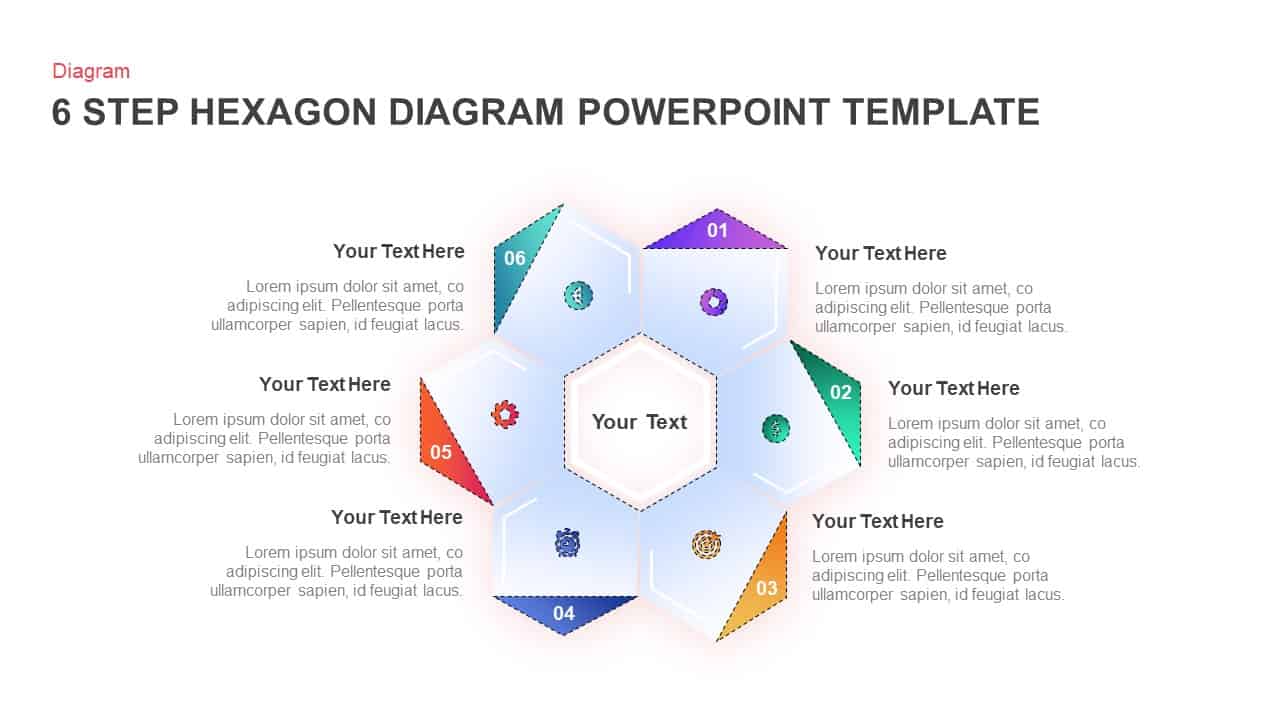
6 Step Hexagon Diagram template for PowerPoint & Google Slides
Process

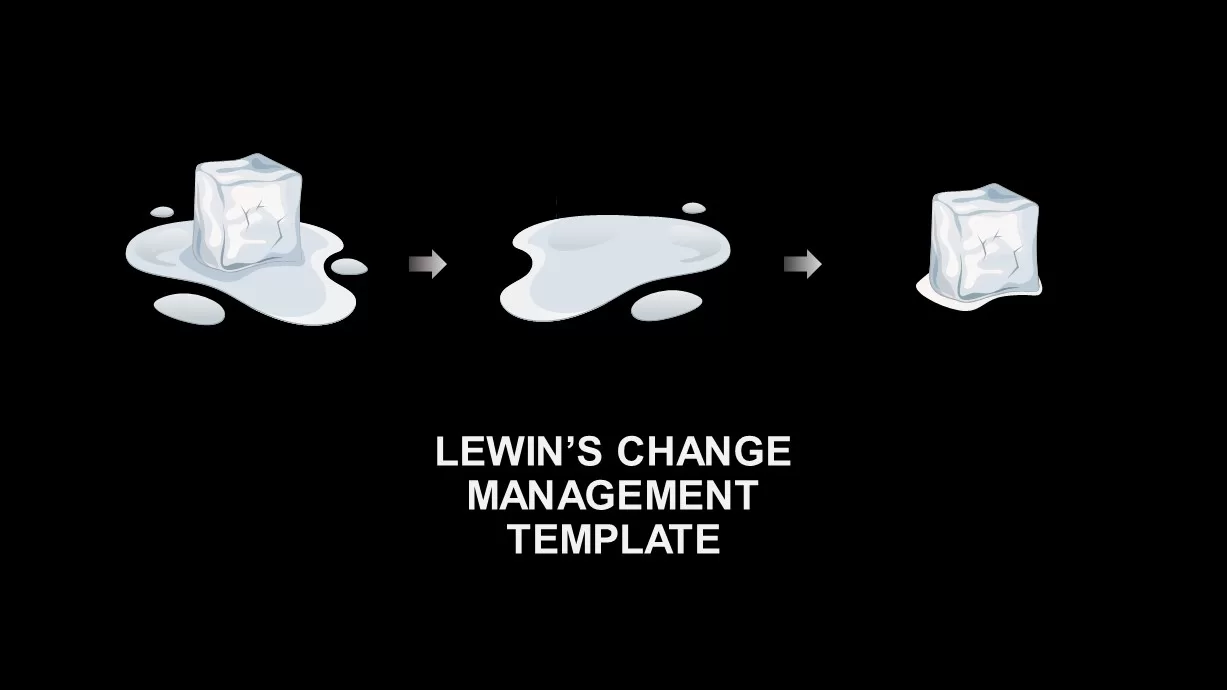
Lewin’s Change Management Diagram Template for PowerPoint & Google Slides
Process
Isometric 3D Block Comparison Diagram Template for PowerPoint & Google Slides
Comparison
Enterprise Risk Management Cycle Diagram Template for PowerPoint & Google Slides
Process
Multi-Color Enneagram Circular Diagram Template for PowerPoint & Google Slides
Circular
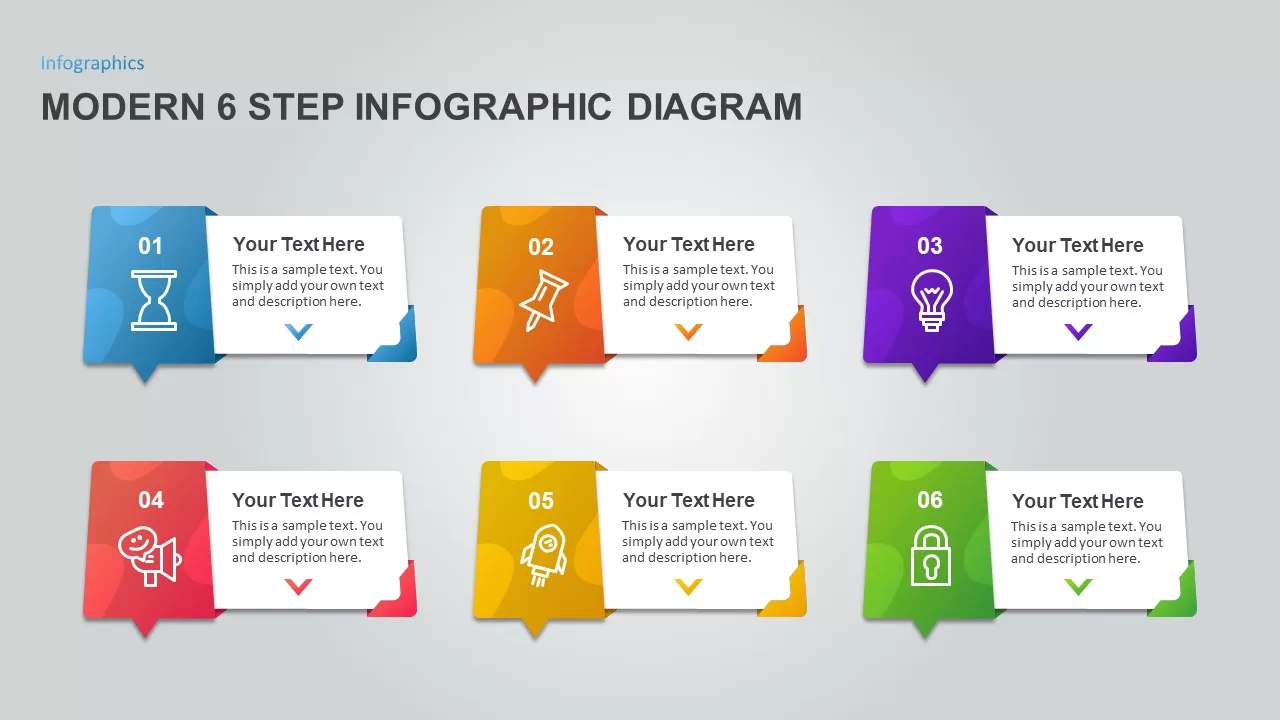
Modern 6 Step Infographic Diagram template for PowerPoint & Google Slides
Process
Dynamic Gear Diagram Infographics Template for PowerPoint & Google Slides
Process
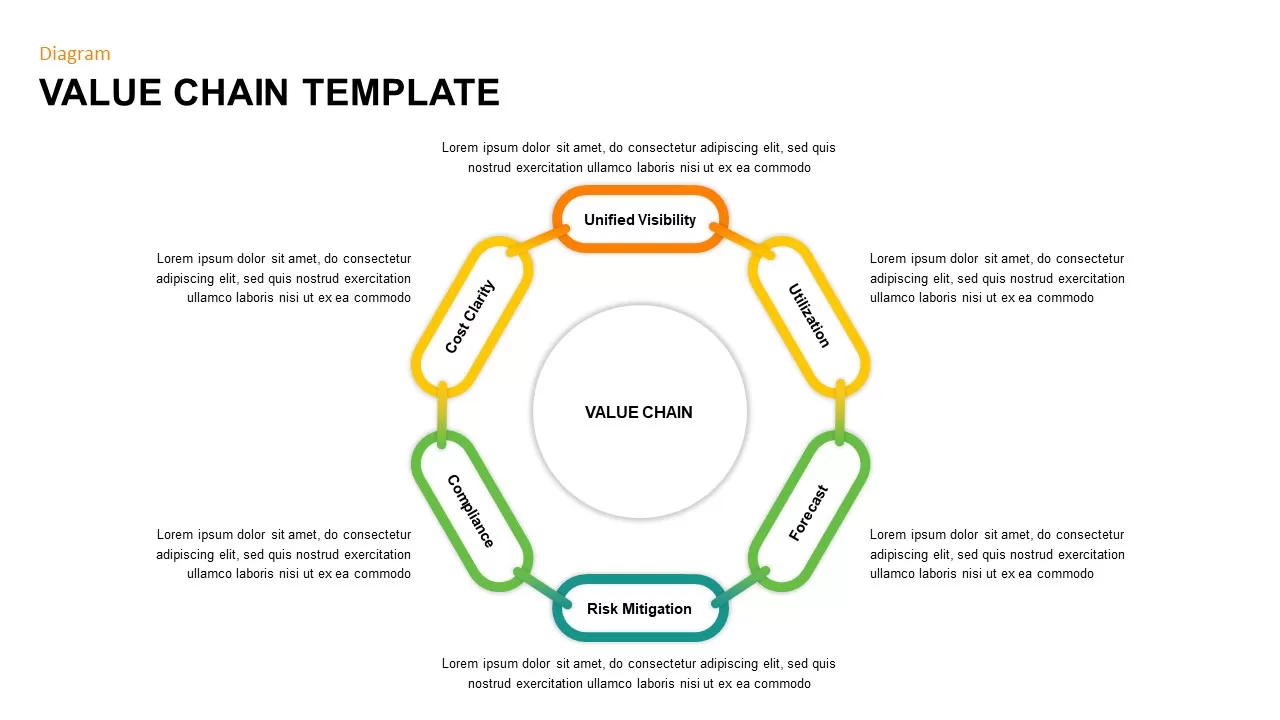
Value Chain Diagram template for PowerPoint & Google Slides
Business Strategy
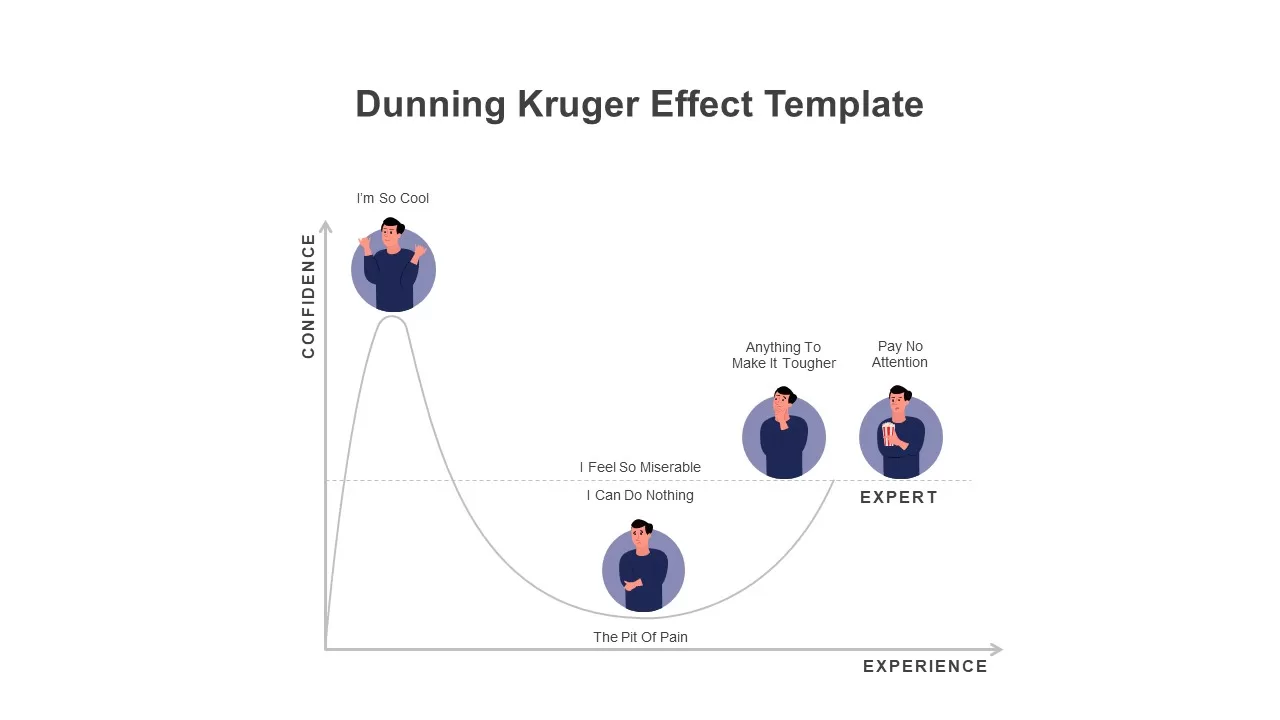
Modern Dunning Kruger Effect Diagram Template for PowerPoint & Google Slides
Business
Snake Shaped Curve Diagram template for PowerPoint & Google Slides
Business
Hand-Drawn Four-Step Curved Arrow Diagram Template for PowerPoint & Google Slides
Arrow
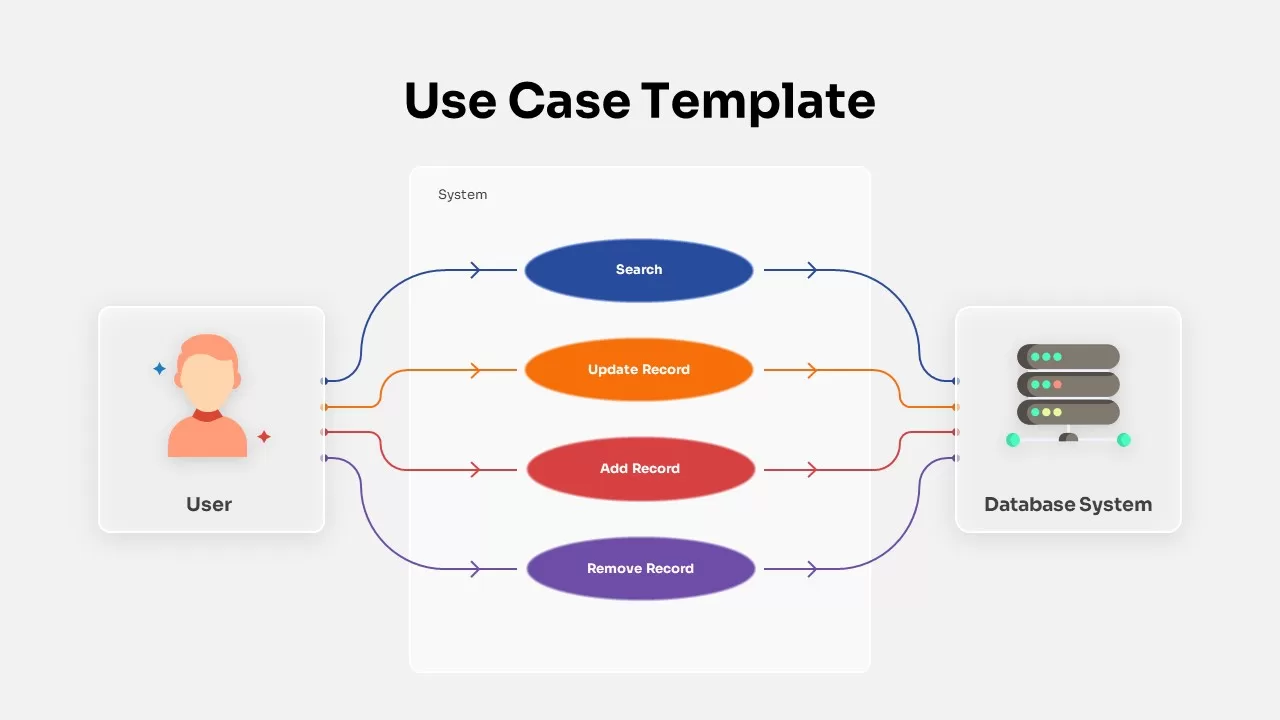
Use Case Diagram Template for PowerPoint & Google Slides
Flow Charts
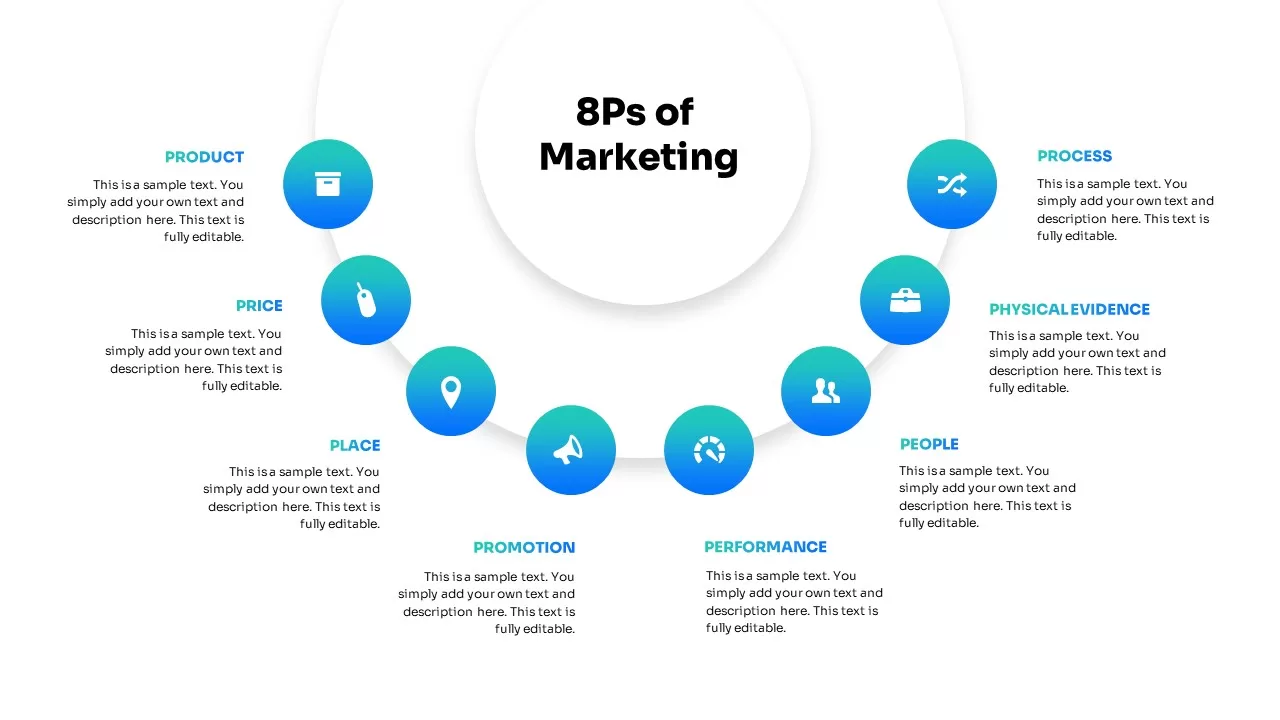
Curved 8Ps of Marketing Diagram Template for PowerPoint & Google Slides
Marketing
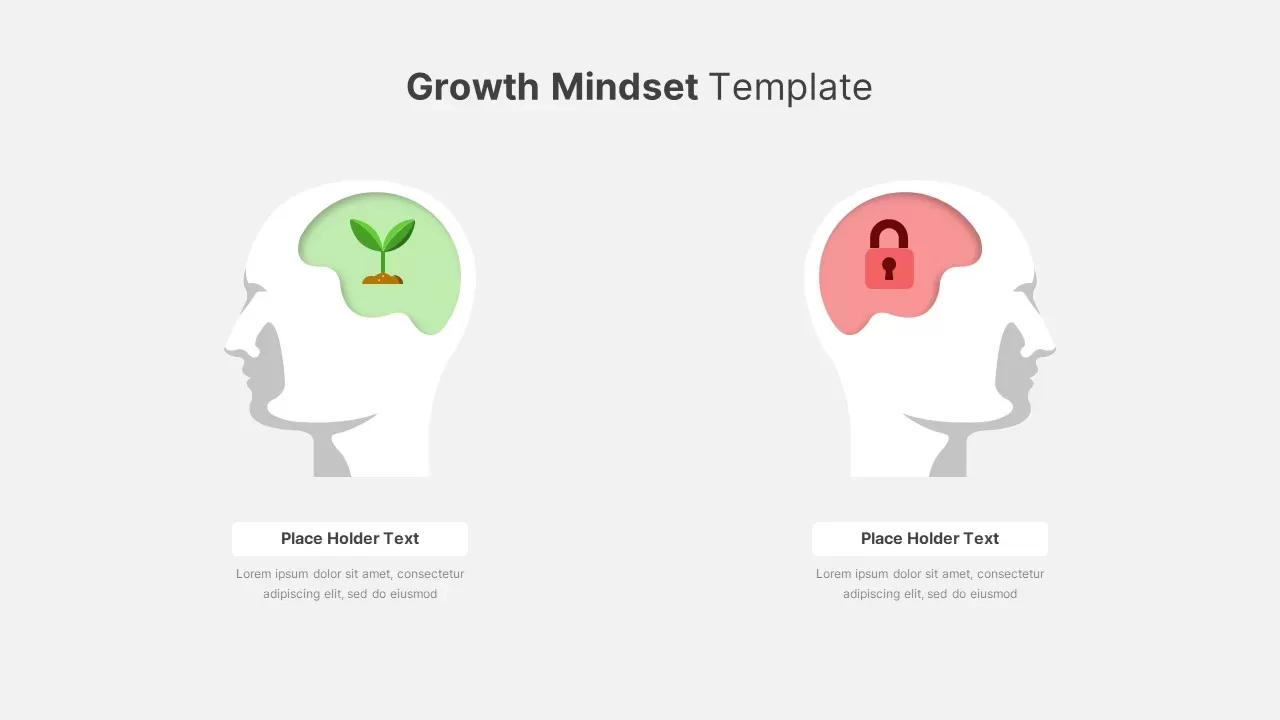
Growth vs Fixed Mindset Diagram Template for PowerPoint & Google Slides
Comparison
Pentagon Arrow Process Diagram Template for PowerPoint & Google Slides
Process
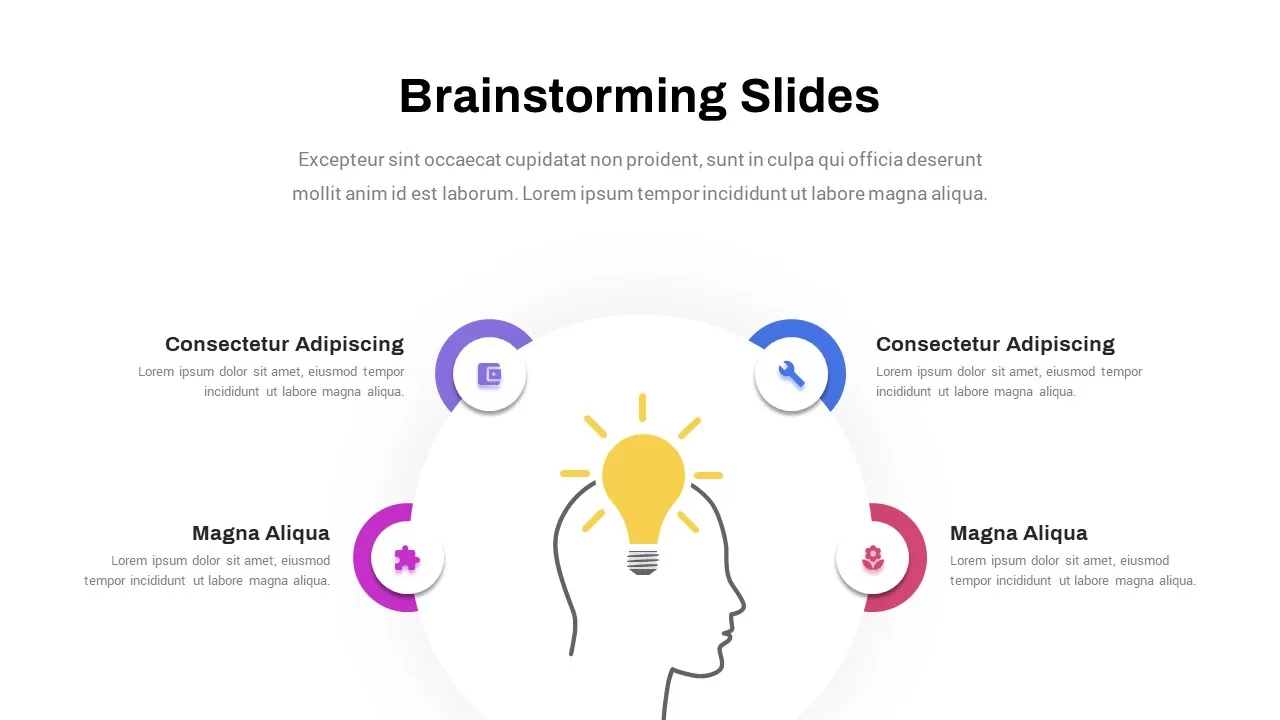
Creative Brainstorming Process Diagram Template for PowerPoint & Google Slides
Process
Six-Step Colorful Flywheel Diagram Template for PowerPoint & Google Slides
Circular
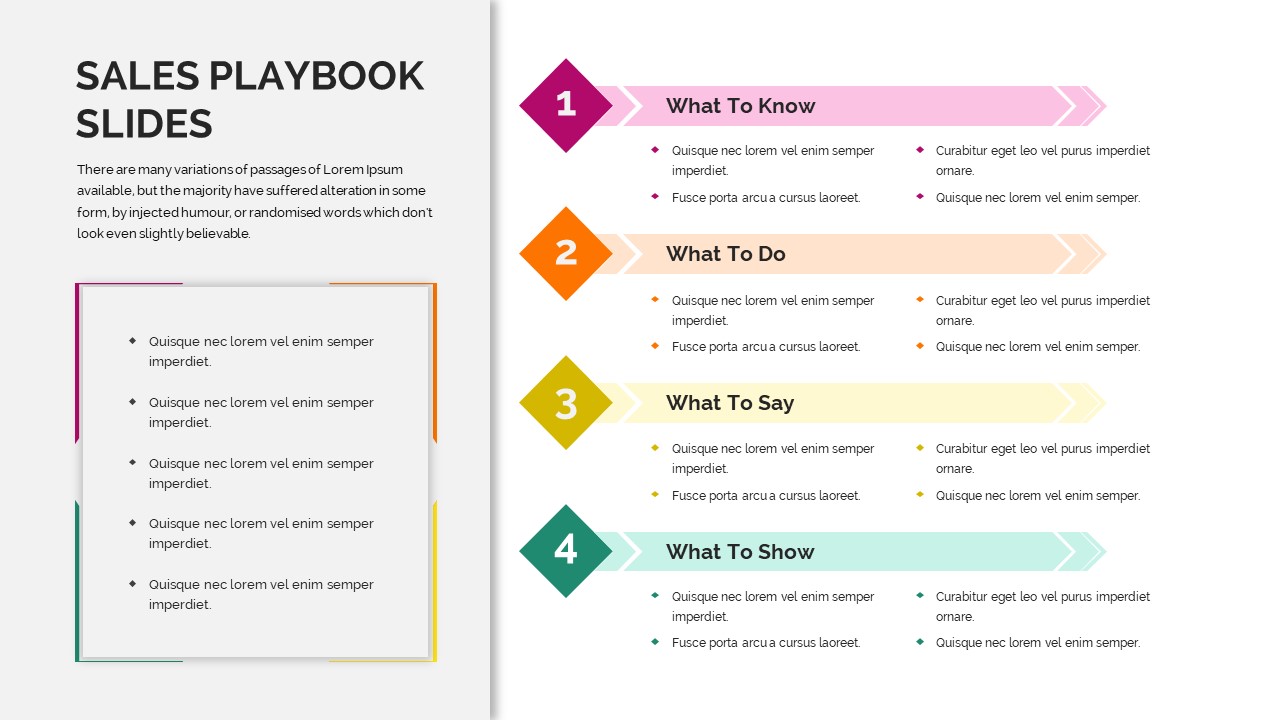
Sales Playbook Process Steps Diagram Template for PowerPoint & Google Slides
Marketing
Gear Process Diagram Template for PowerPoint & Google Slides
Process
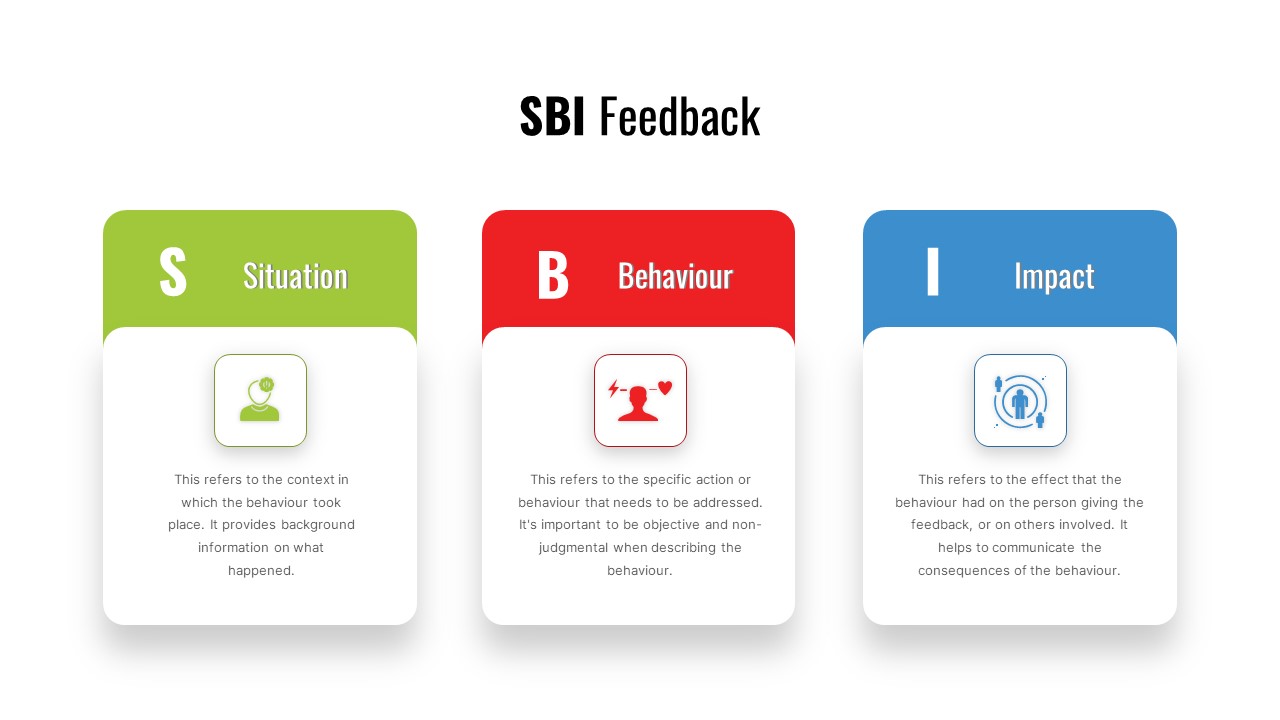
SBI Feedback Model Process Diagram Template for PowerPoint & Google Slides
Process
Simple Flowchart Process Diagram Template for PowerPoint & Google Slides
Flow Charts
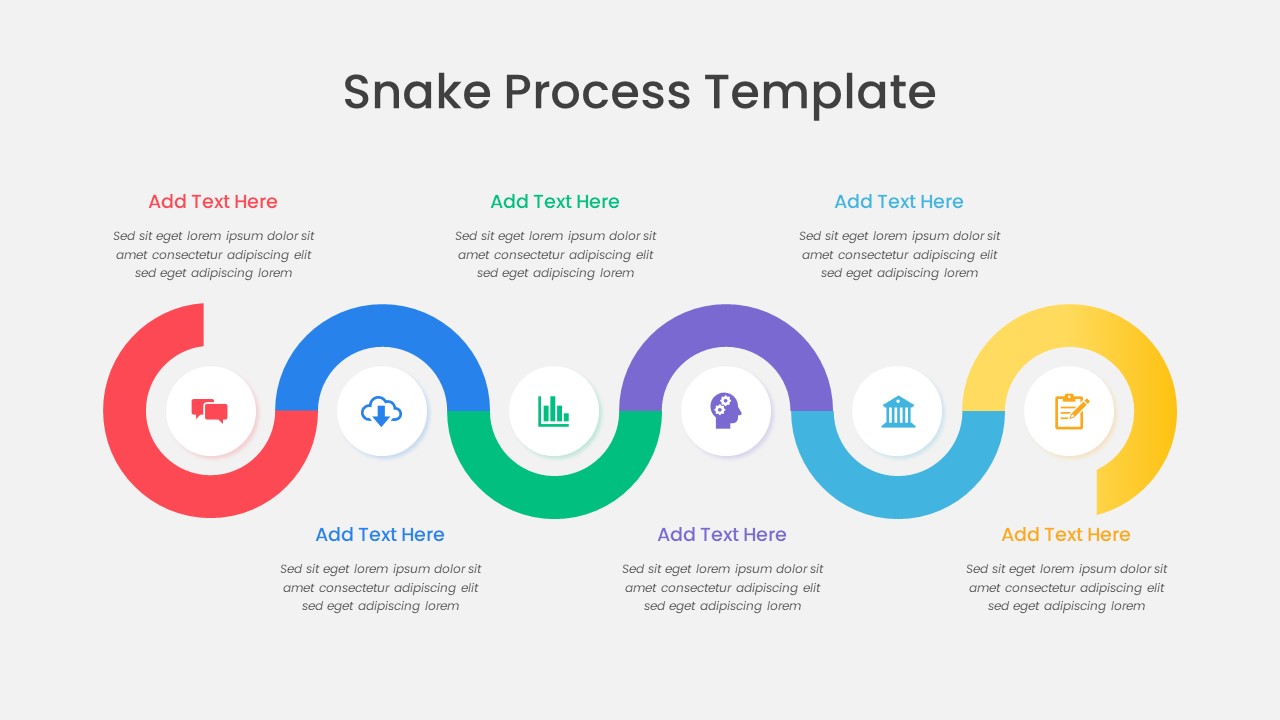
Colorful Snake Process Diagram Template for PowerPoint & Google Slides
Process
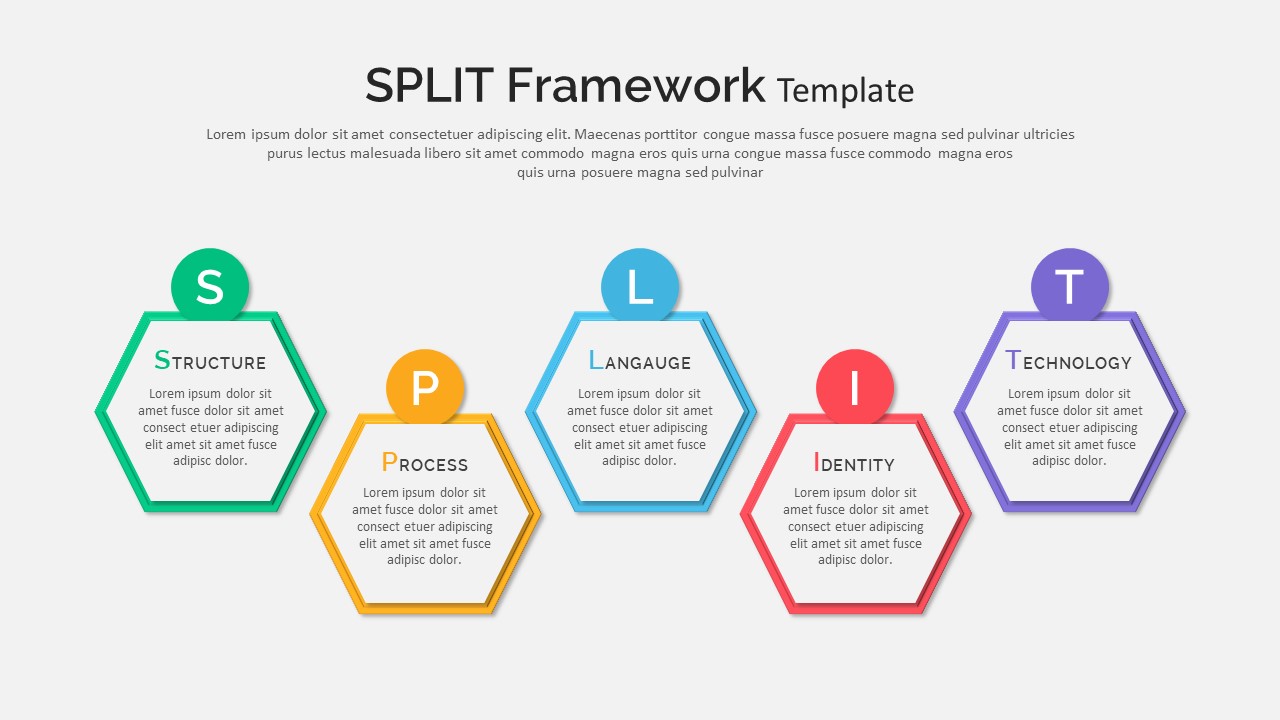
Split Framework Hexagon Diagram Slide Template for PowerPoint & Google Slides
Process
Cost-Volume-Profit Analysis Diagram Template for PowerPoint & Google Slides
Finance
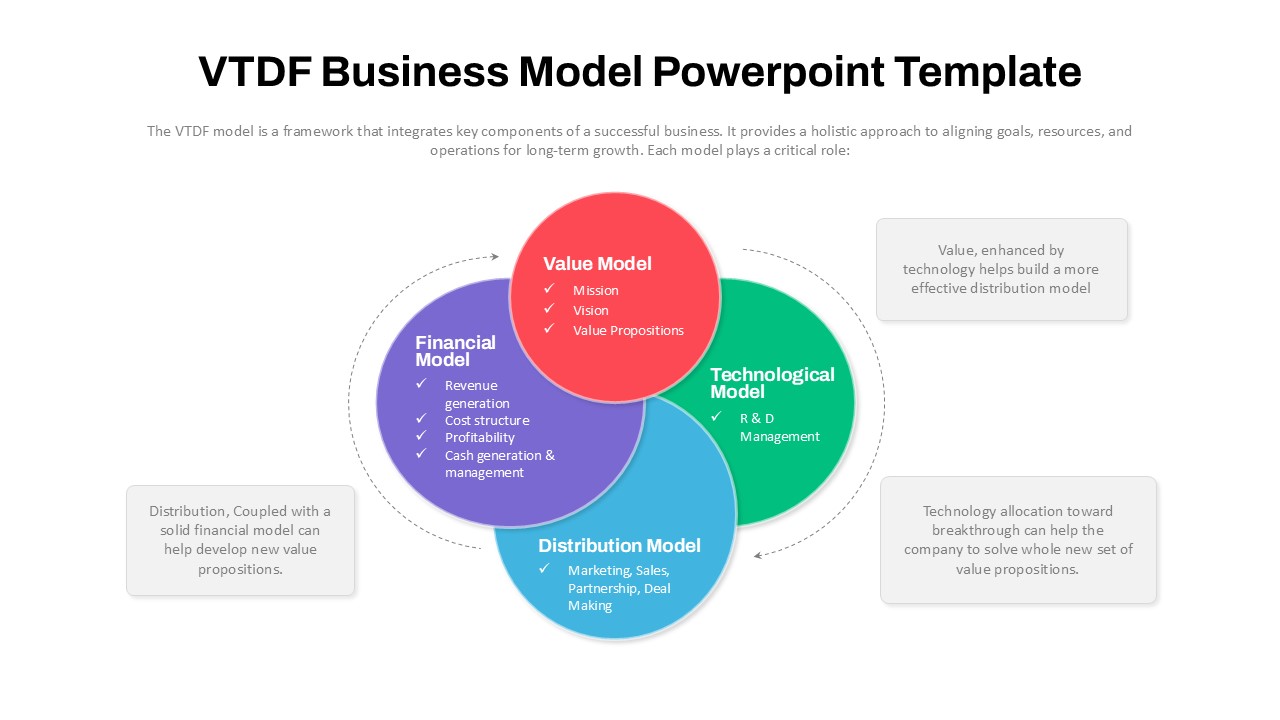
VTDF Business Model Framework Diagram Template for PowerPoint & Google Slides
Business Models
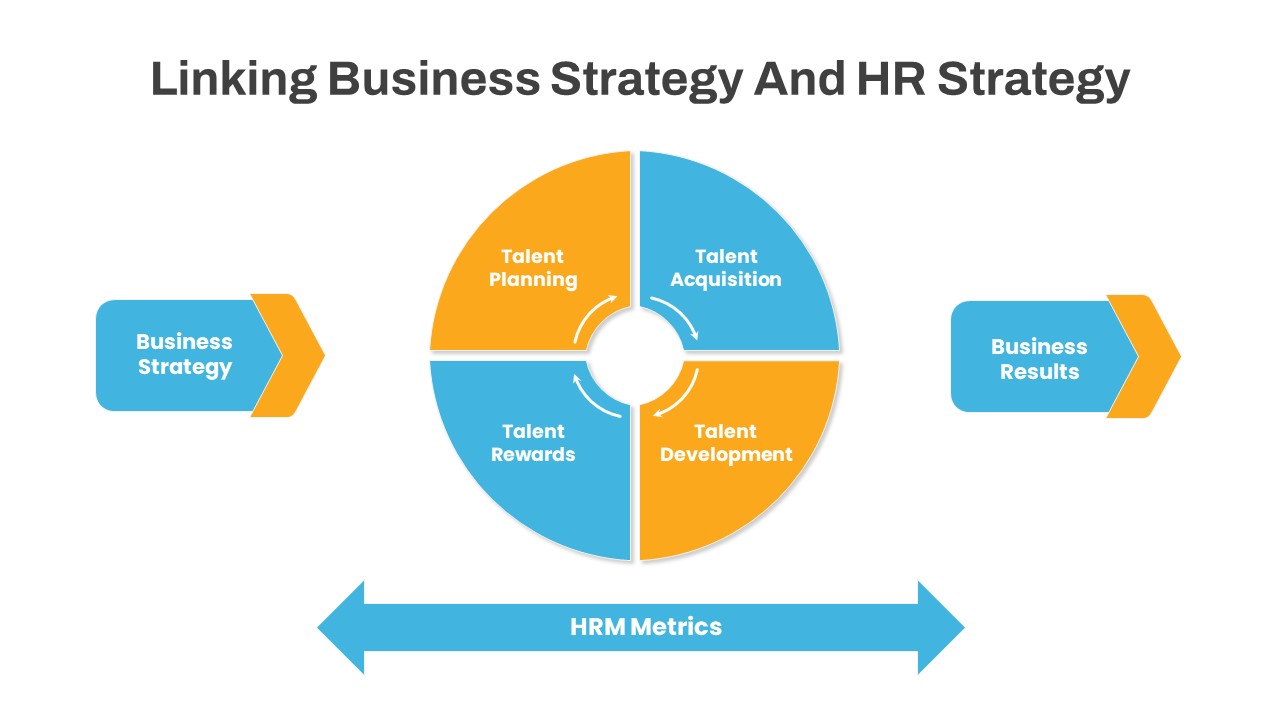
Linking Business HR Strategy Circular Diagram Template for PowerPoint & Google Slides
Business Strategy
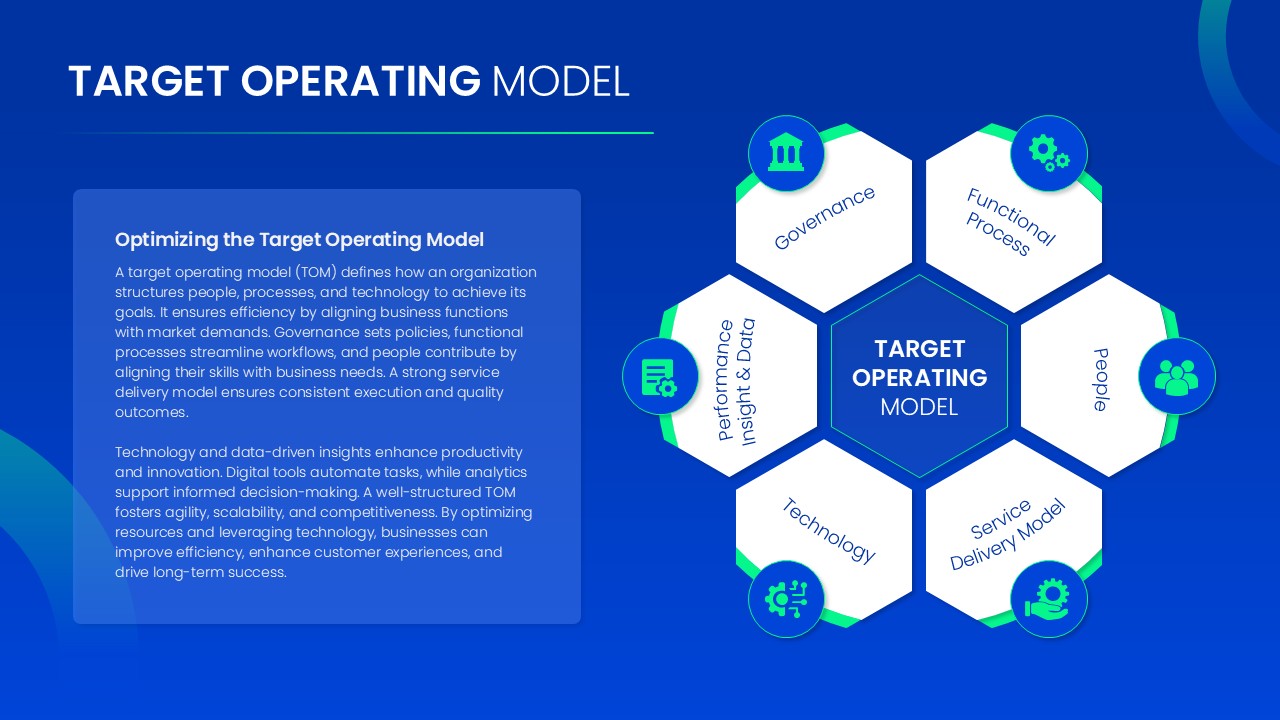
Target Operating Model Diagram Template for PowerPoint & Google Slides
Business Strategy
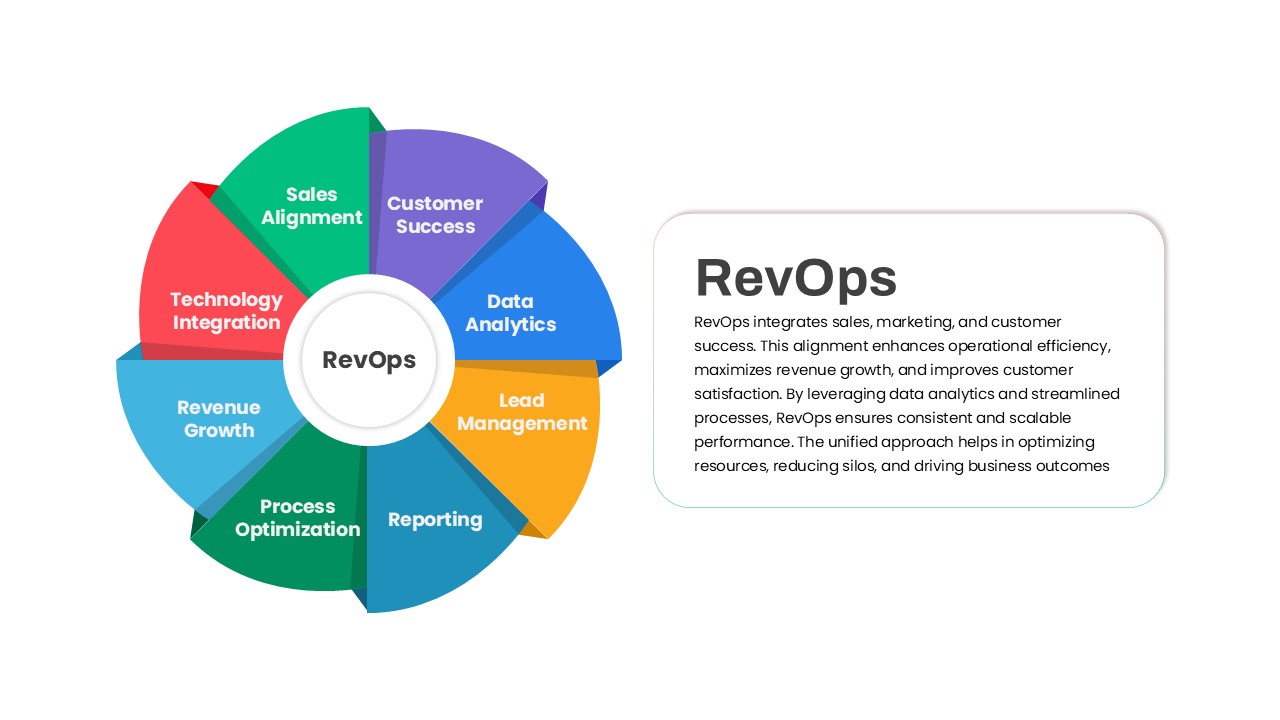
RevOps Revenue Operations Diagram Template for PowerPoint & Google Slides
Revenue
ETL Data Pipeline Workflow Diagram Template for PowerPoint & Google Slides
Process
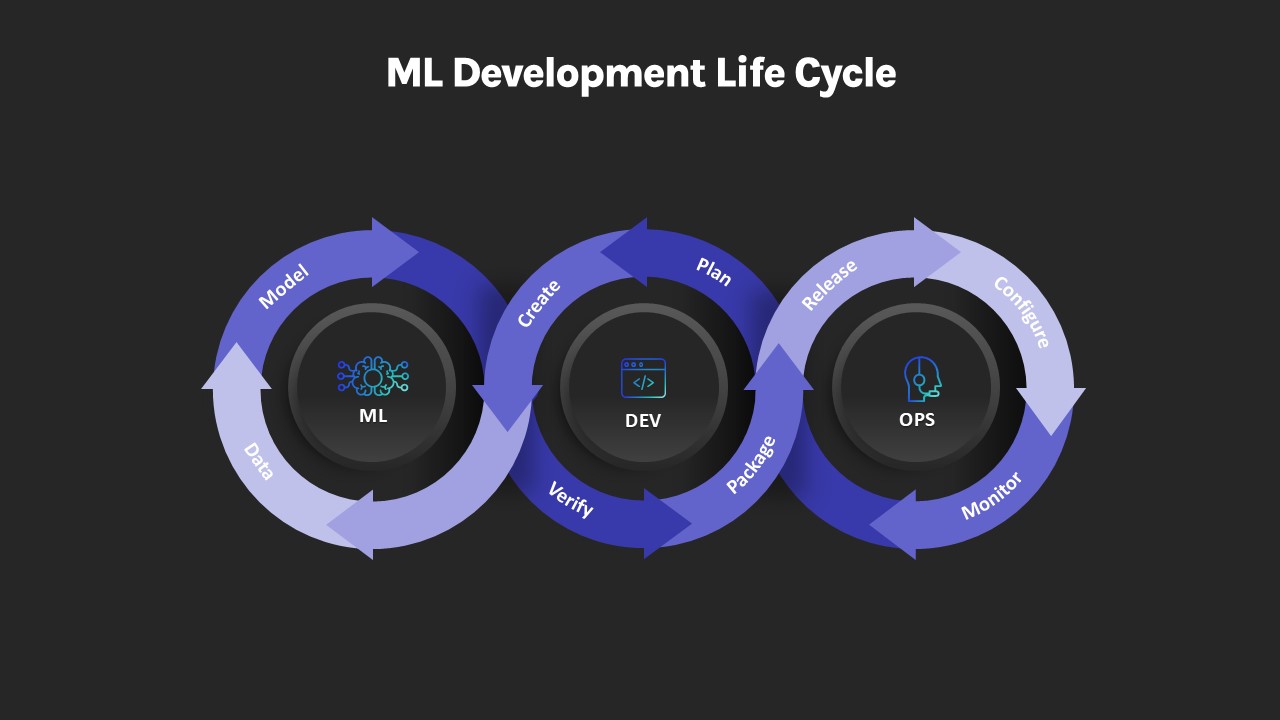
ML Development Life Cycle Diagram Template for PowerPoint & Google Slides
Machine Learning
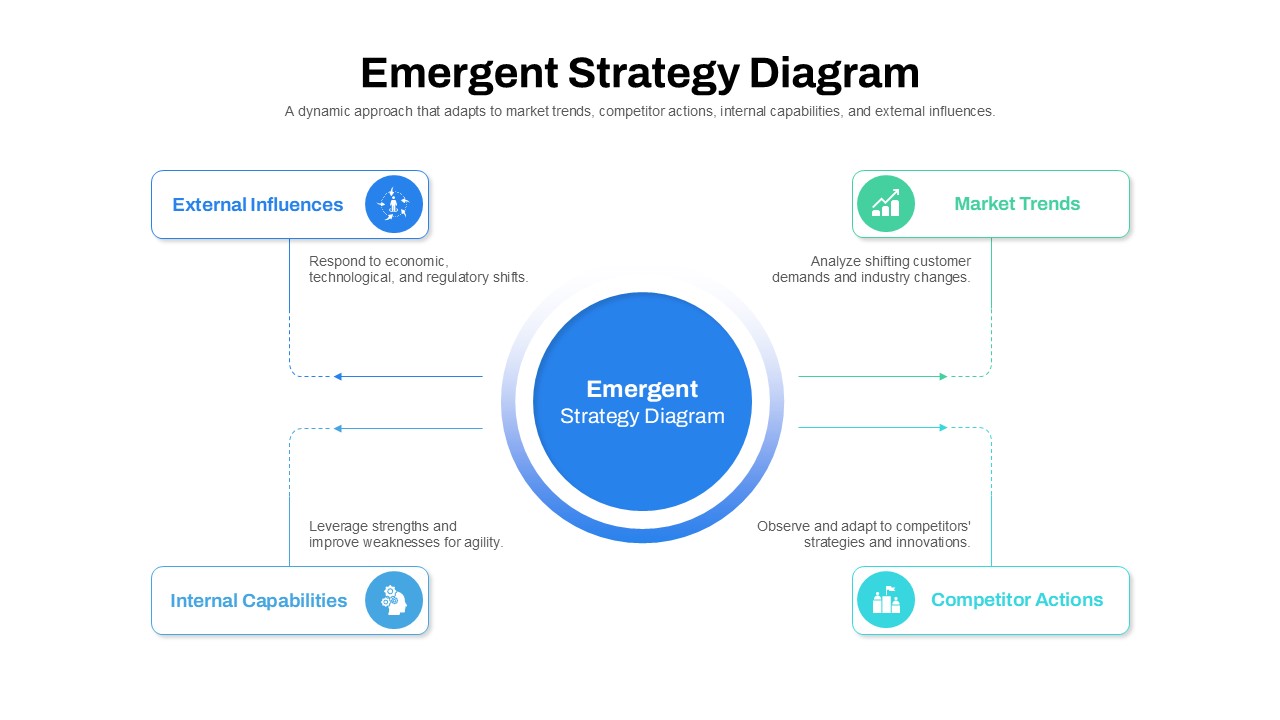
Emergent Strategy Diagram Framework Template for PowerPoint & Google Slides
Process
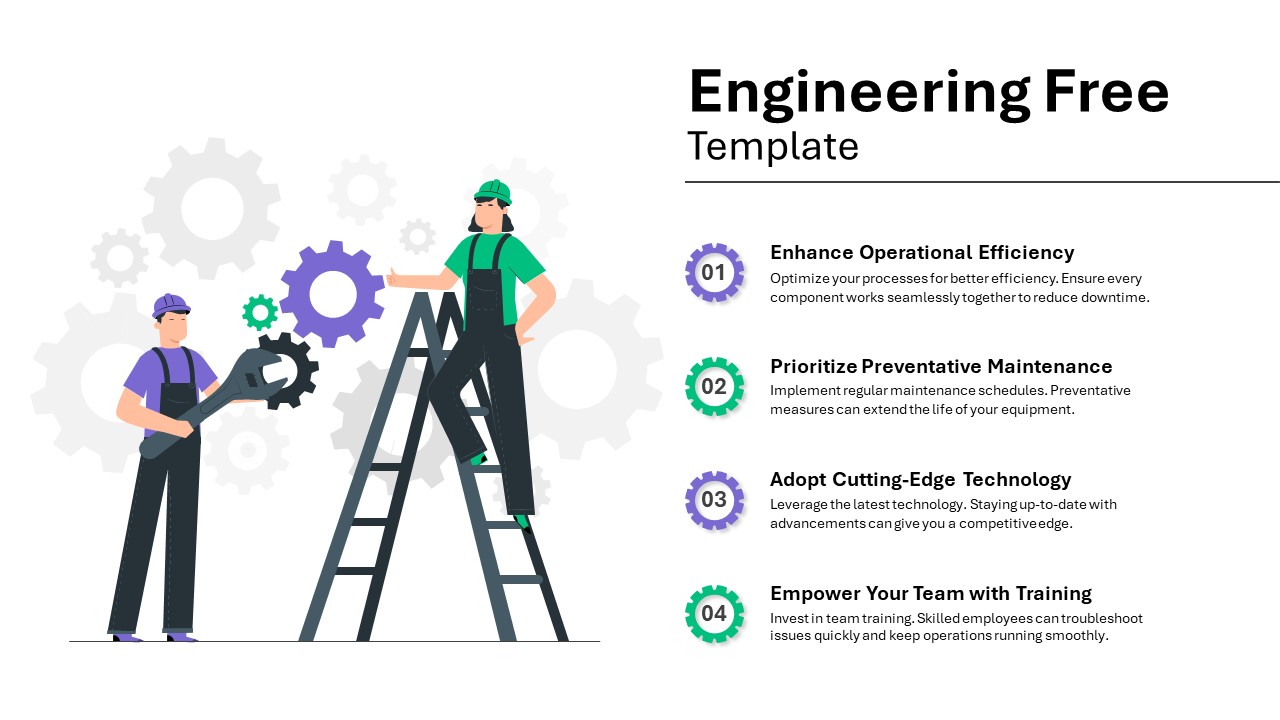
Engineering Efficiency Diagram Template for PowerPoint & Google Slides
Process
Free
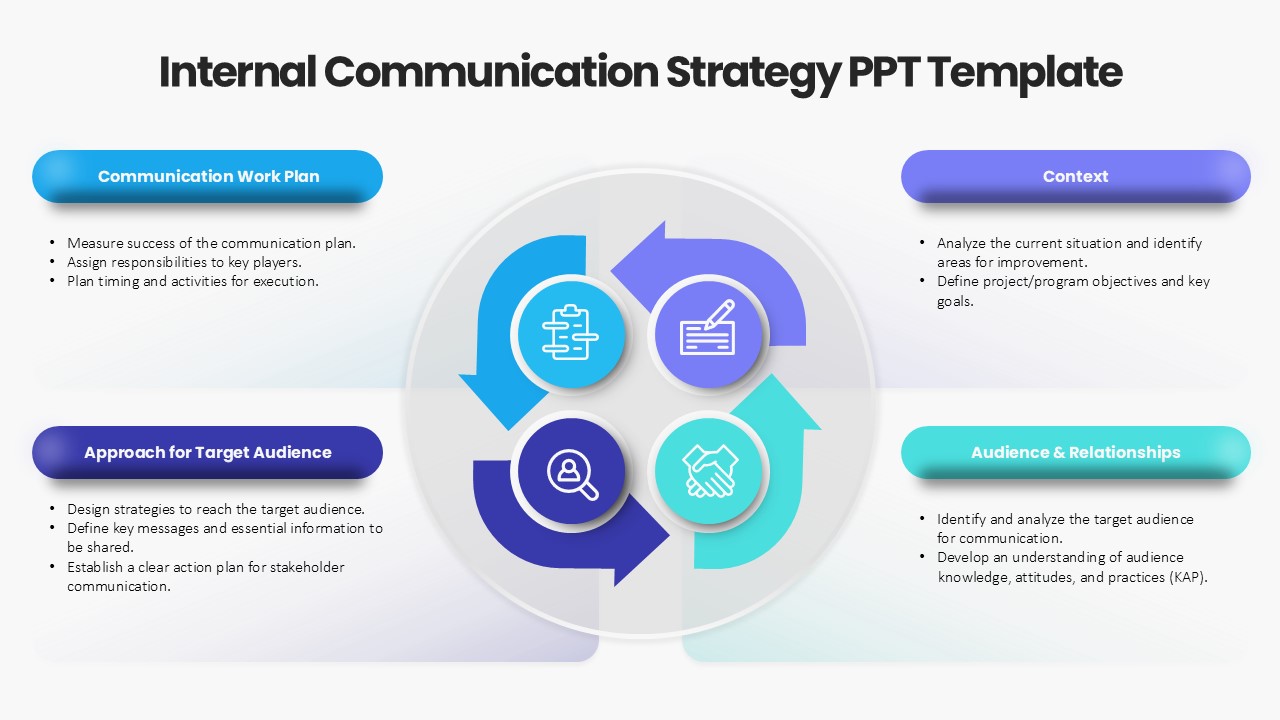
Internal Communication Strategy Diagram Template for PowerPoint & Google Slides
Process
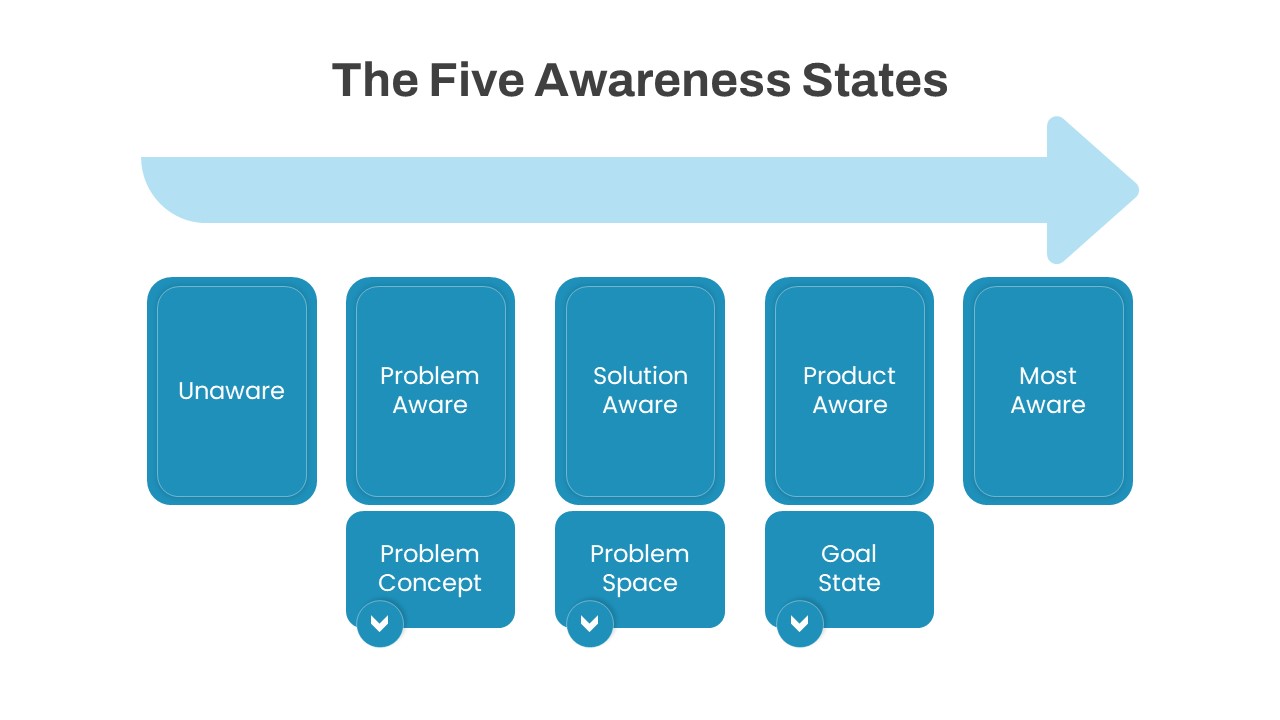
The Five Awareness States diagram template for PowerPoint & Google Slides
Infographics
Integrative Thinking Comparison Diagram Template for PowerPoint & Google Slides
Comparison
Market Share Comparison Diagram Template for PowerPoint & Google Slides
Comparison Chart
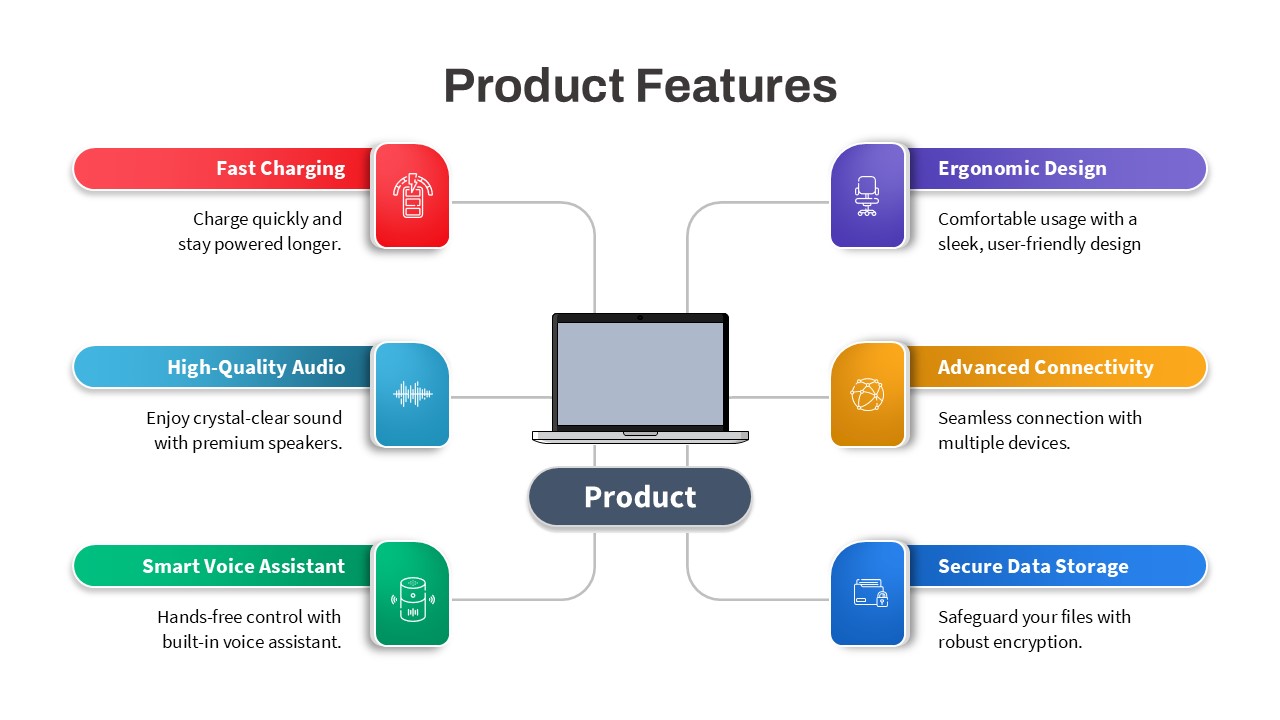
Product Features Diagram Template for PowerPoint & Google Slides
Process
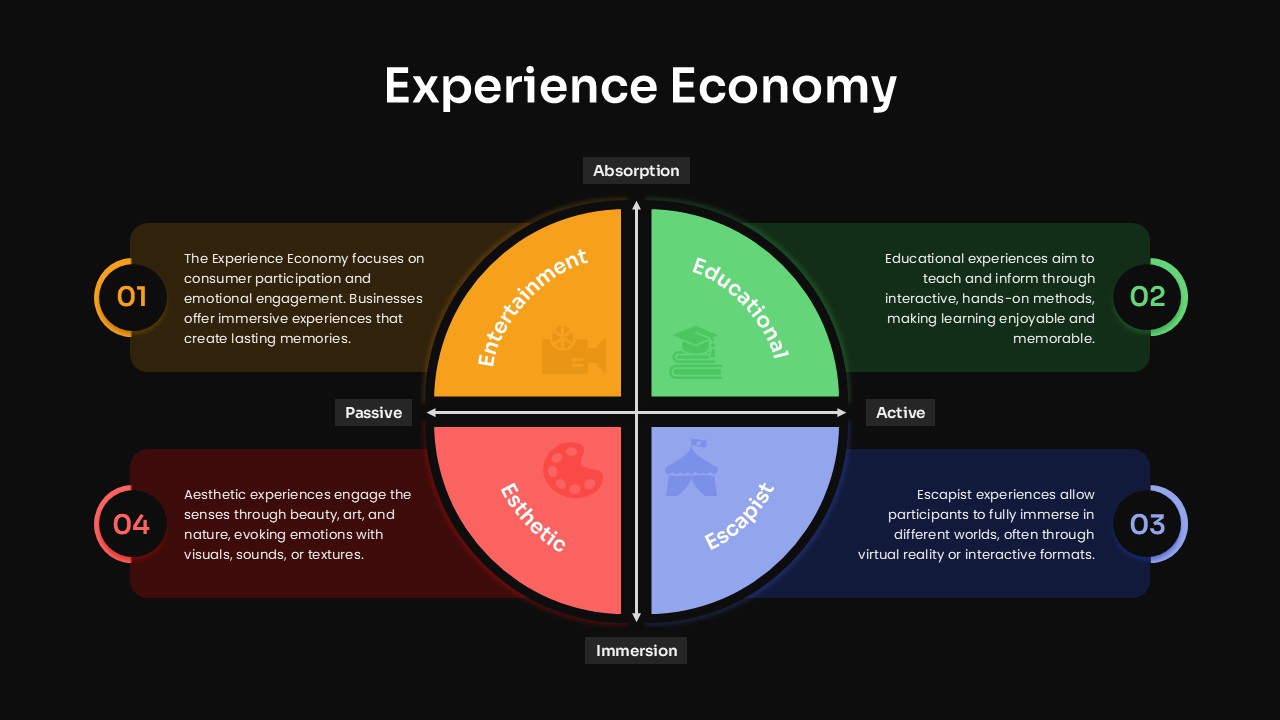
Experience Economy Quadrant Diagram Template for PowerPoint & Google Slides
Circular
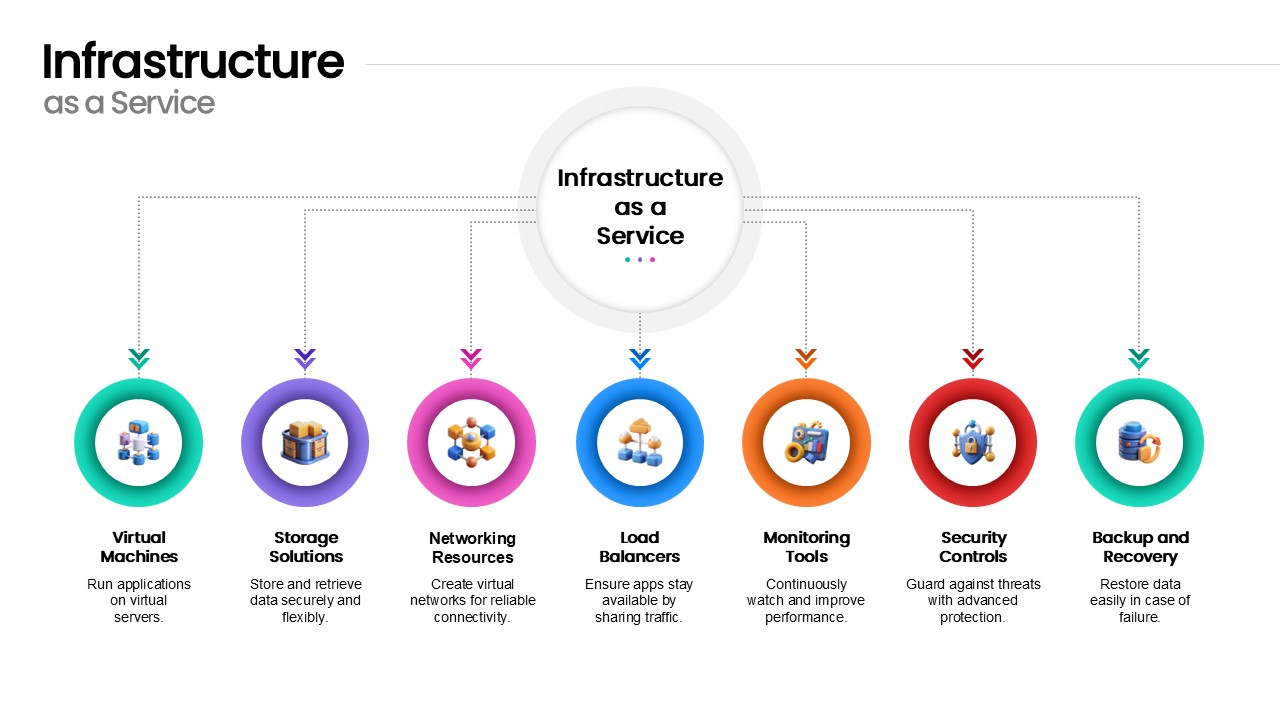
Infrastructure as a Service Diagram Template for PowerPoint & Google Slides
Cloud Computing
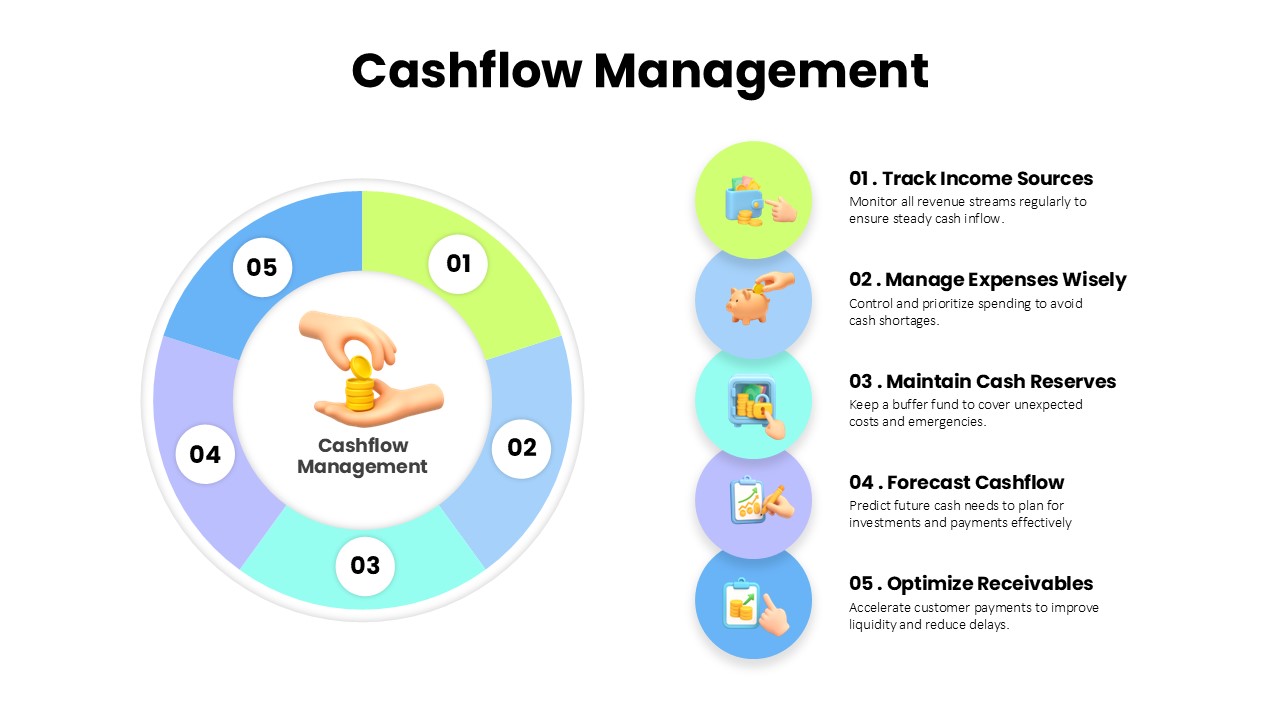
Cashflow Management Cycle Diagram Template for PowerPoint & Google Slides
Finance
Resume Screening Process Flow Diagram Template for PowerPoint & Google Slides
Process
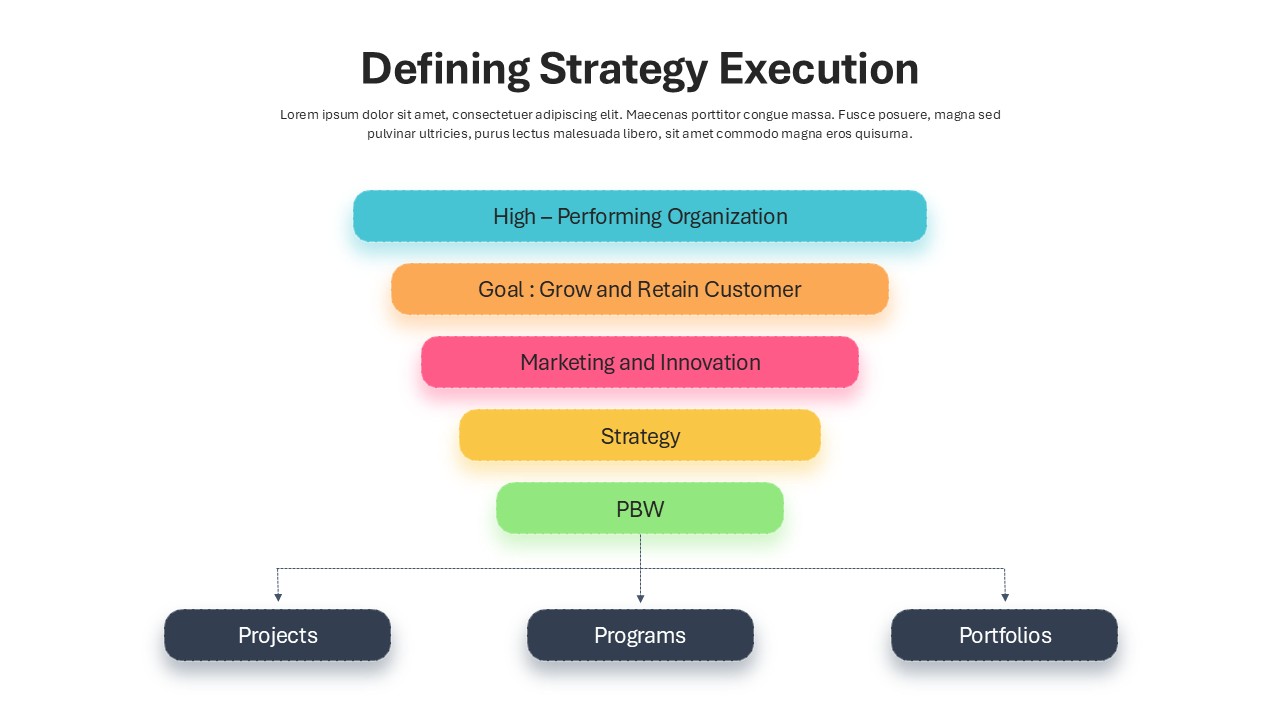
Defining Strategy Execution Diagram Template for PowerPoint & Google Slides
Funnel
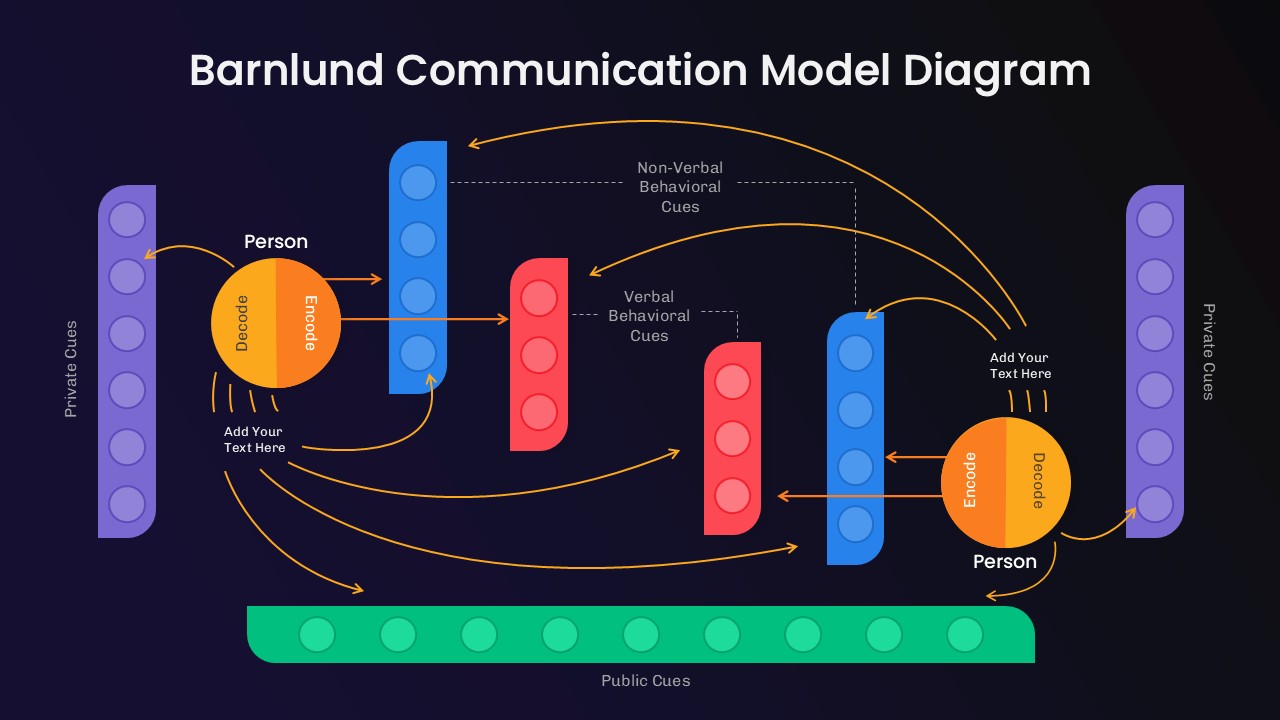
Barnlund Communication Model Diagram Template for PowerPoint & Google Slides
Process
Materiality Assessment Matrix Diagram Template for PowerPoint & Google Slides
Risk Management