Maldives Map Infographic Template for PowerPoint & Google Slides


Description
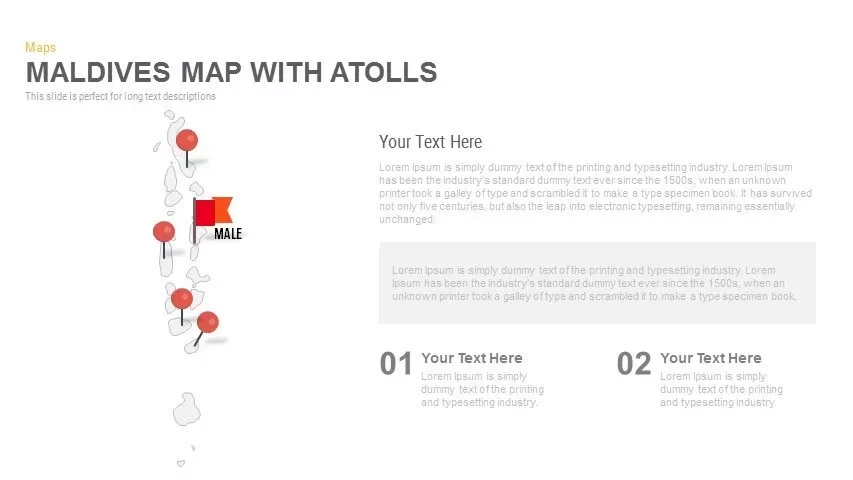
This six-slide Maldives atoll map infographic pack provides a suite of region-focused layouts to visualize data, callouts, and comparisons across the island chain. Each slide uses a clean, light-gray vector outline of the Maldives atolls with customizable pin markers and accent shapes:
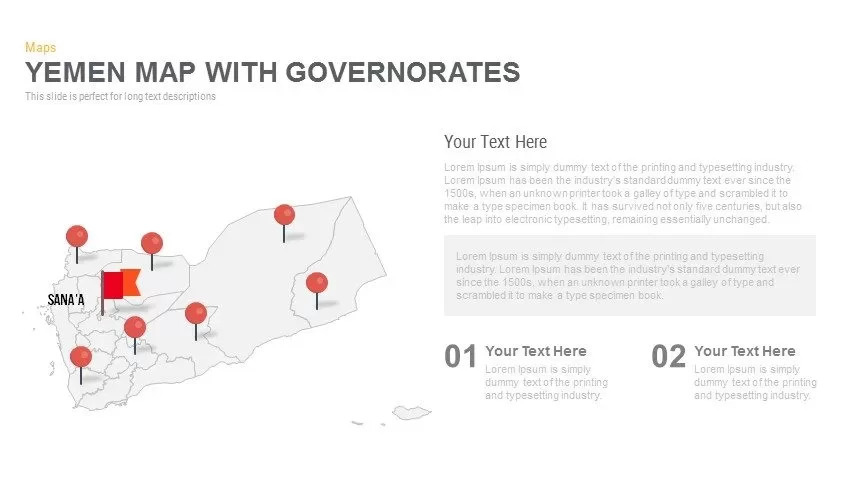
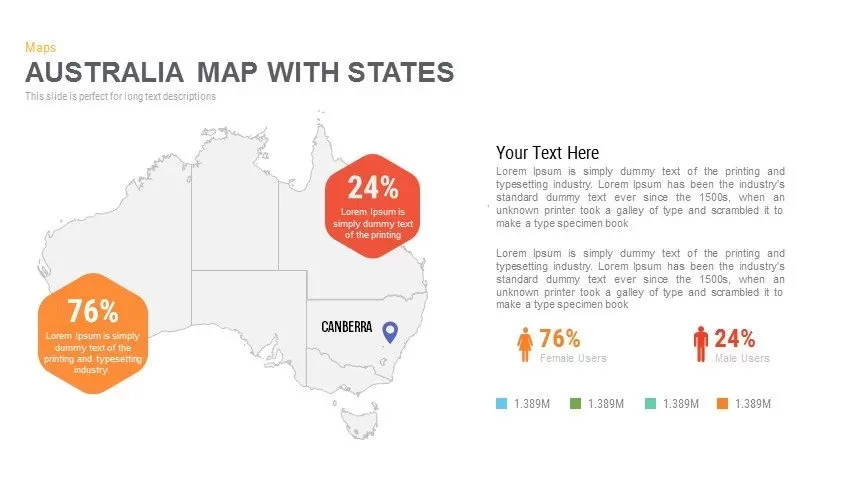
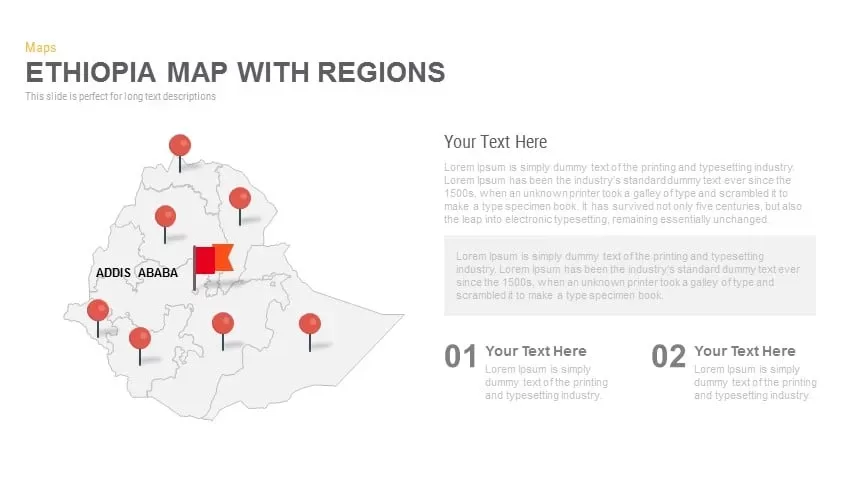
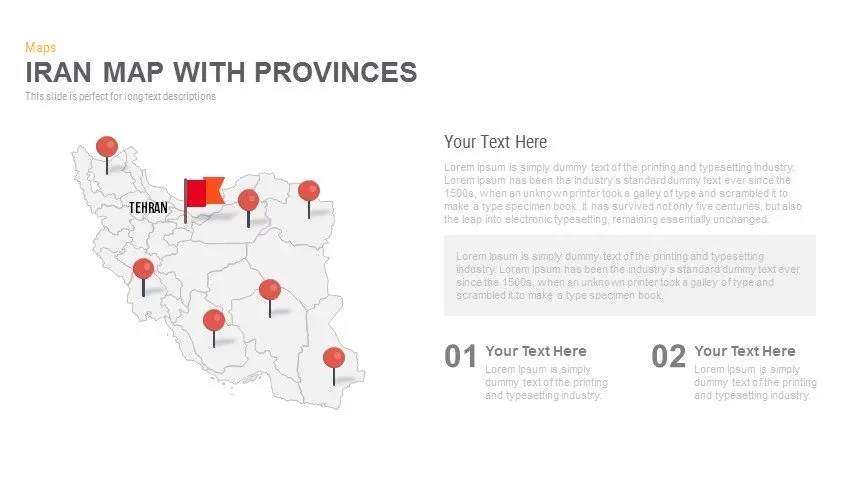
Flag & Numbered Callouts: Highlight Male with a flag icon, plus two numbered text entries for quick bullet points.
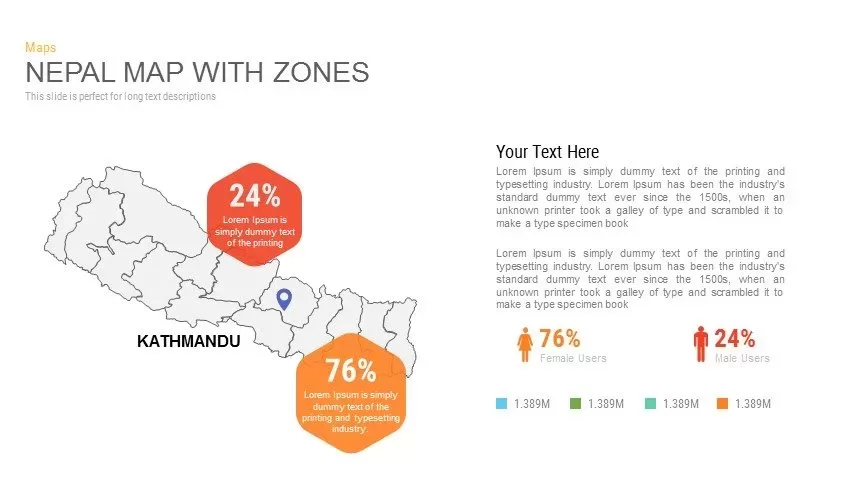
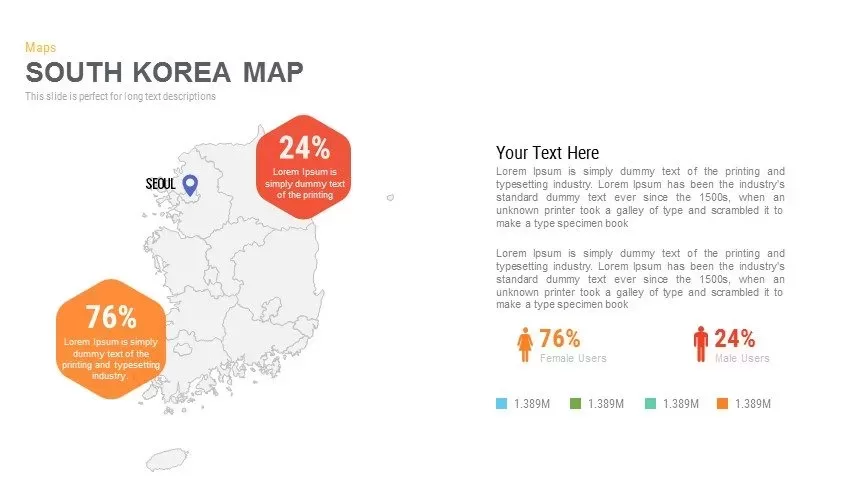
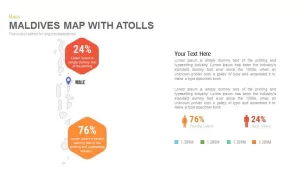
Hexagon Percentage Badges: Dual hexagon callouts (76%/24%) for demographic splits or survey results, paired with gender icons and a legend.
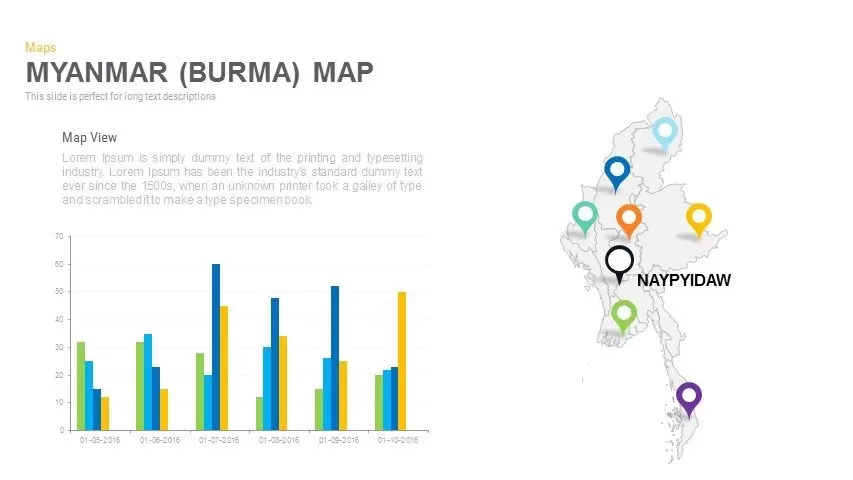
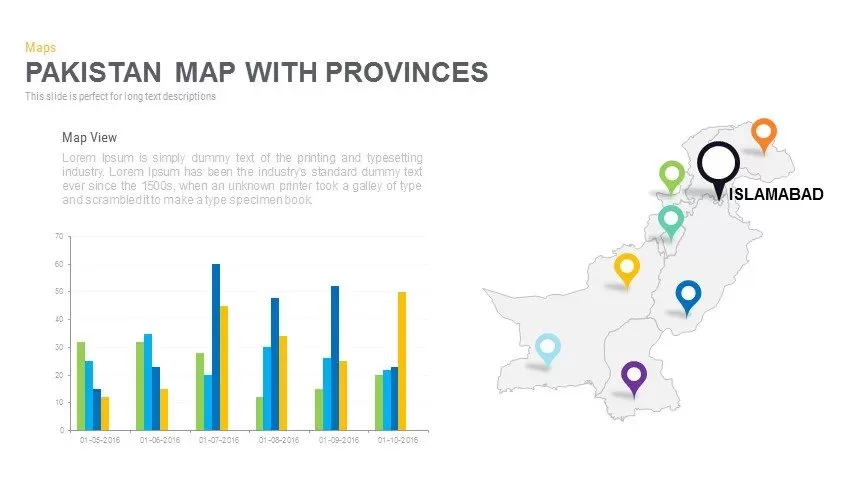
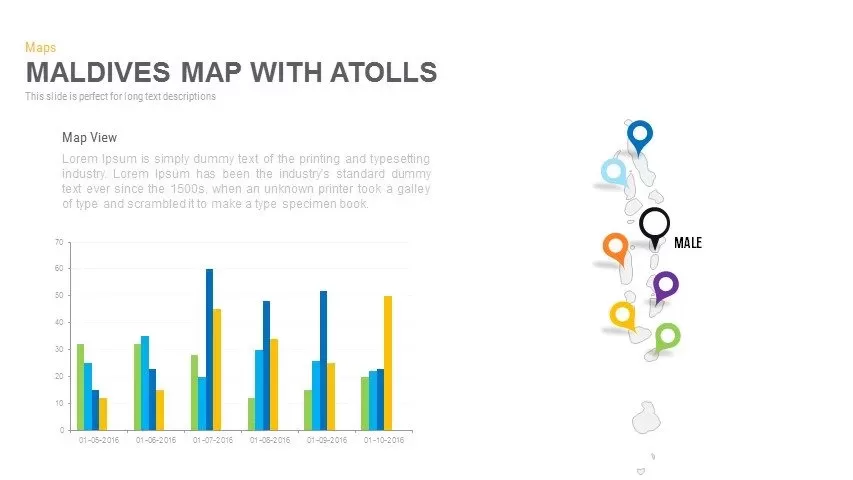
Side-by-Side Chart View: A bar chart on the left and a cluster of colored pins on the right—perfect for comparing regional KPIs over time.
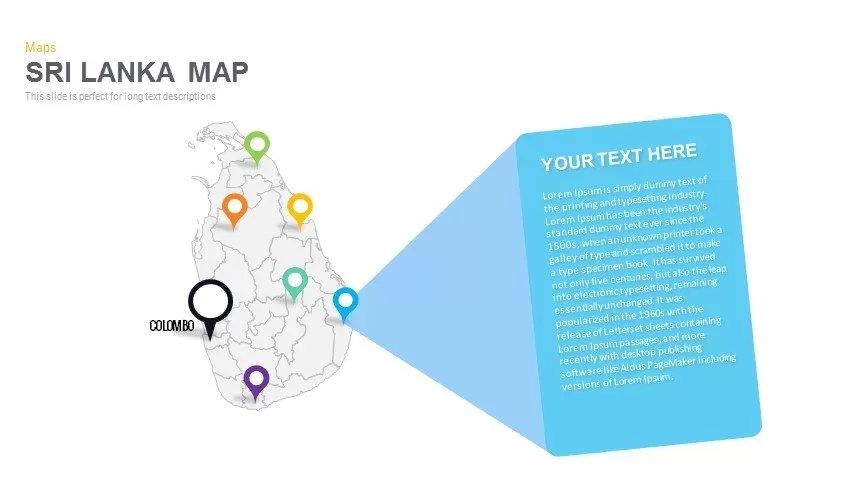
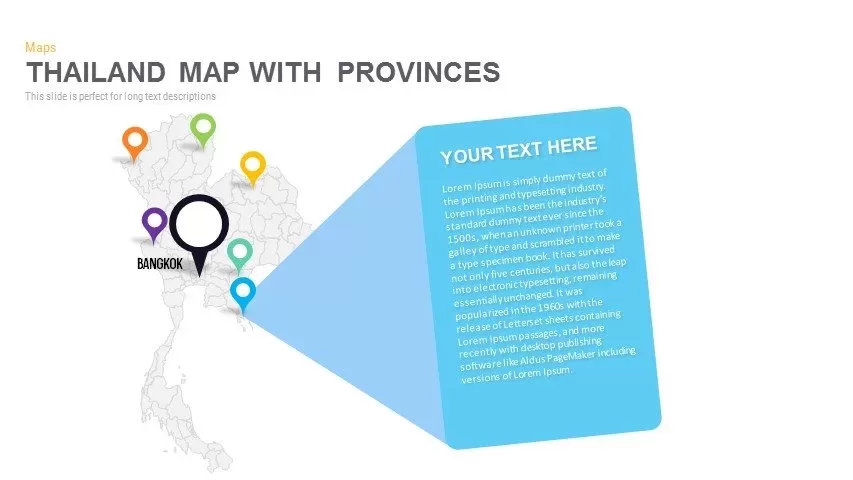
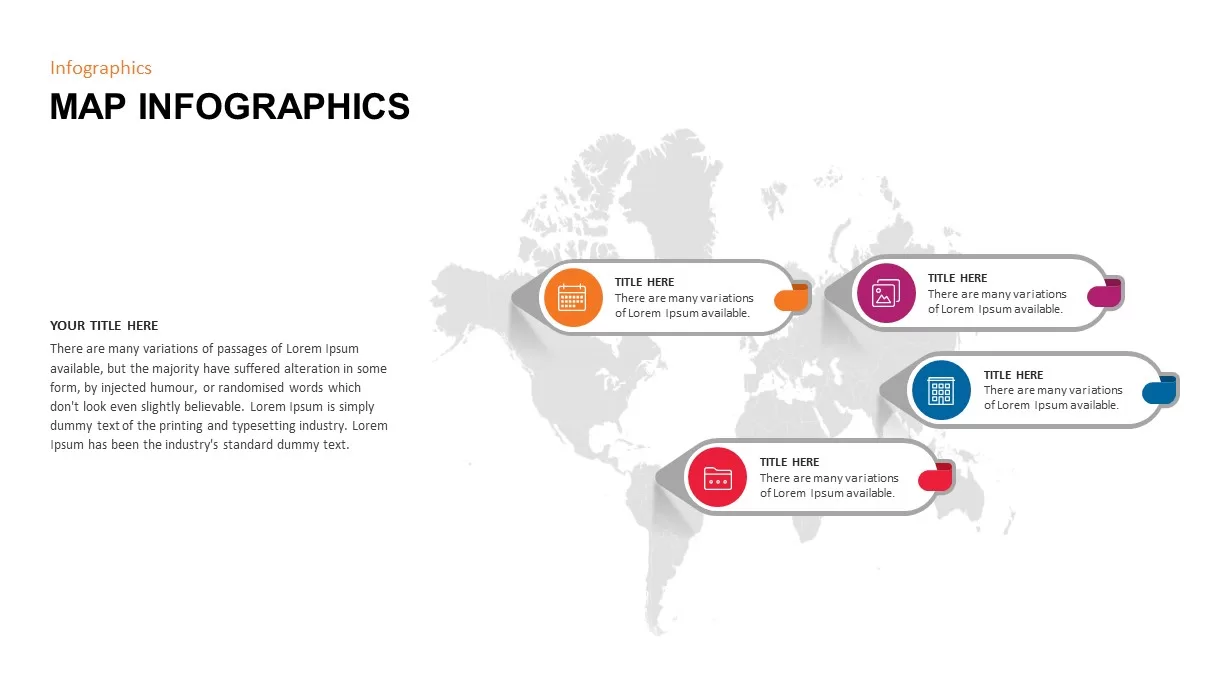
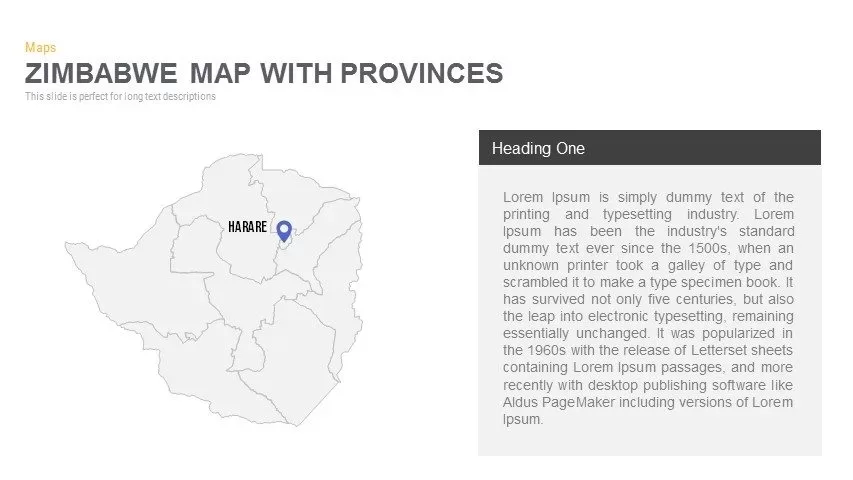
Magnifier Callout Panel: Multiple color pins around the map with a large magnifying-glass callout box for detailed commentary.
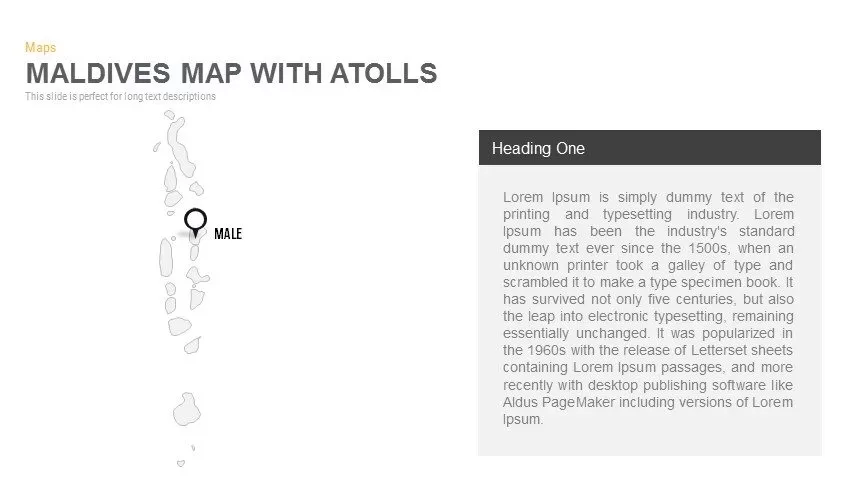
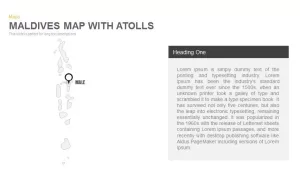
Clean Map & Sidebar Text: Minimal map with a right-side text panel and dark-heading box for long-form insights.
Pin-Only Map with Data Chart: Vertical map layout with left-side bar graph and right-side multiple pins to highlight atoll-level metrics.
All elements are built with editable vector shapes on master slides—swap pin colors, adjust callout shapes, update chart data, and edit text placeholders in seconds. The minimalist design and modern sans-serif fonts ensure maximum readability and professional polish. Fully compatible with PowerPoint and Google Slides, this map pack scales flawlessly for screen or print presentations.
Who is it for
Tourism boards, hospitality marketers, and regional planners will leverage these slides to showcase visitor distribution, resort performance, or infrastructure projects across the Maldives’ atolls.
Other Uses
Repurpose for marine conservation studies, supply-chain logistics, telecom coverage maps, or environmental impact reports by simply swapping icons, recoloring pins, or adjusting data visuals.
Login to download this file

Item ID
SB00681
Related Templates

Africa Country Map Infographic Template for PowerPoint & Google Slides
World Maps
Asia Map Infographic with Demographics template for PowerPoint & Google Slides
World Maps
Curved Road Map Timeline Infographic Template for PowerPoint & Google Slides
Roadmap

Japan Province Map Infographic Template for PowerPoint & Google Slides
Maps
Malaysia Regional Map Infographic Template for PowerPoint & Google Slides
Maps
Myanmar (Burma) Provincial Map Infographic Template for PowerPoint & Google Slides
Maps
Nepal Map with Zones Infographic Template for PowerPoint & Google Slides
Maps
North Korea Map with Provinces Infographic Pack Template for PowerPoint & Google Slides
Maps
Pakistan Provinces Map Infographic Pack Template for PowerPoint & Google Slides
Maps
Infographic South Korea Map Template for PowerPoint & Google Slides
Maps
Sri Lanka Map Infographic Pack Template for PowerPoint & Google Slides
Maps
Thailand Provinces Map Infographic Pack Template for PowerPoint & Google Slides
Maps
Vietnam Provinces Map Infographic Pack Template for PowerPoint & Google Slides
Maps
Yemen Governorates Infographic Map Template for PowerPoint & Google Slides
Maps

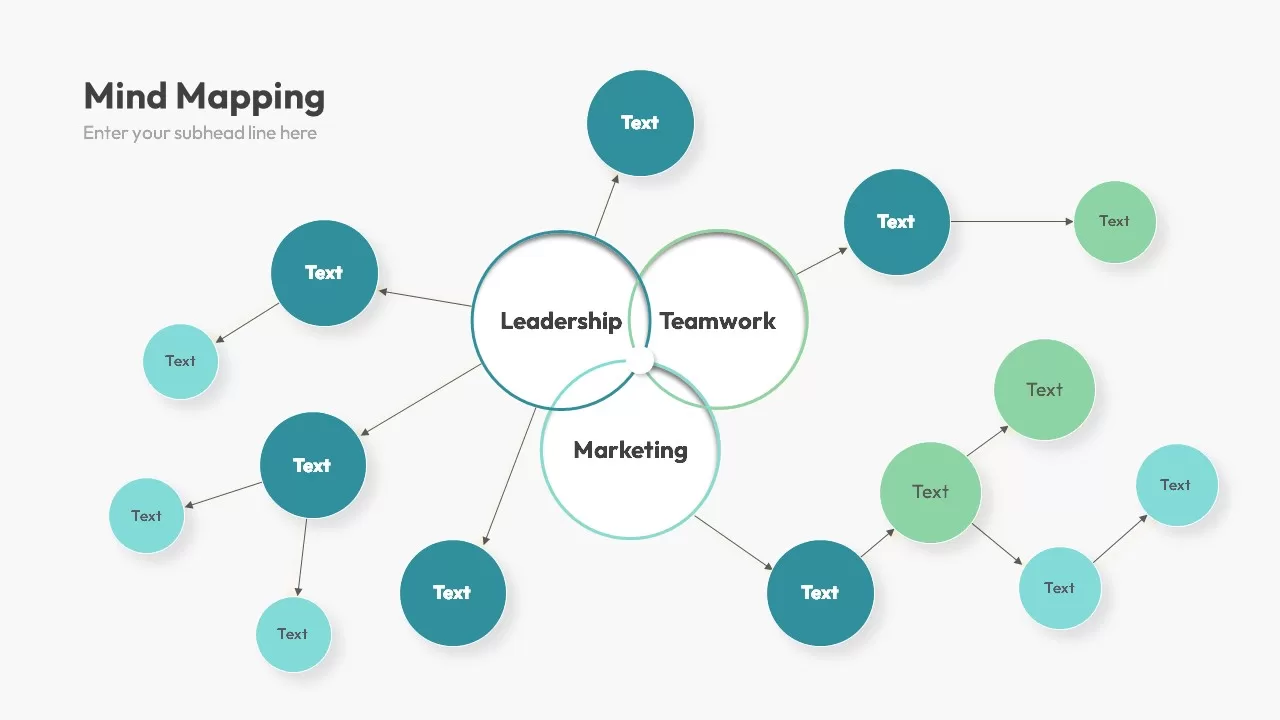
Multi-Cluster Mind Map Infographic Template for PowerPoint & Google Slides
Mind Maps
Colorful Mind Map Infographic Template with Icons for PowerPoint & Google Slides
Mind Maps
Colorful Mind Map Infographic Template for PowerPoint & Google Slides
Mind Maps
Mind Map Infographic Slide Template for PowerPoint & Google Slides
Mind Maps

Modern World Map Callout Infographic Template for PowerPoint & Google Slides
World Maps
Eight-Node Mind Map Infographic Diagram Template for PowerPoint & Google Slides
Mind Maps
Six-Stage Road Map Infographic Timeline Template for PowerPoint & Google Slides
Roadmap
Versatile Mind Map Infographic Template for PowerPoint & Google Slides
Mind Maps
Structured Mind Map Infographic Diagram Template for PowerPoint & Google Slides
Mind Maps
Dual Topic Mind Map Infographic Template for PowerPoint & Google Slides
Mind Maps
Tri-Cluster Mind Map Infographic Template for PowerPoint & Google Slides
Mind Maps
Fully Editable World Map Infographic Template for PowerPoint & Google Slides
World Maps
Editable World Map Callout Infographic Template for PowerPoint & Google Slides
World Maps
Editable World Map Callout Infographic Template for PowerPoint & Google Slides
World Maps
North America Percentage Map Infographic Template for PowerPoint & Google Slides
World Maps
North America Map Infographic Slide Template for PowerPoint & Google Slides
World Maps
Editable Africa Map Infographic Data Template for PowerPoint & Google Slides
World Maps
Editable Ireland Map Infographic Slide Template for PowerPoint & Google Slides
World Maps
Free
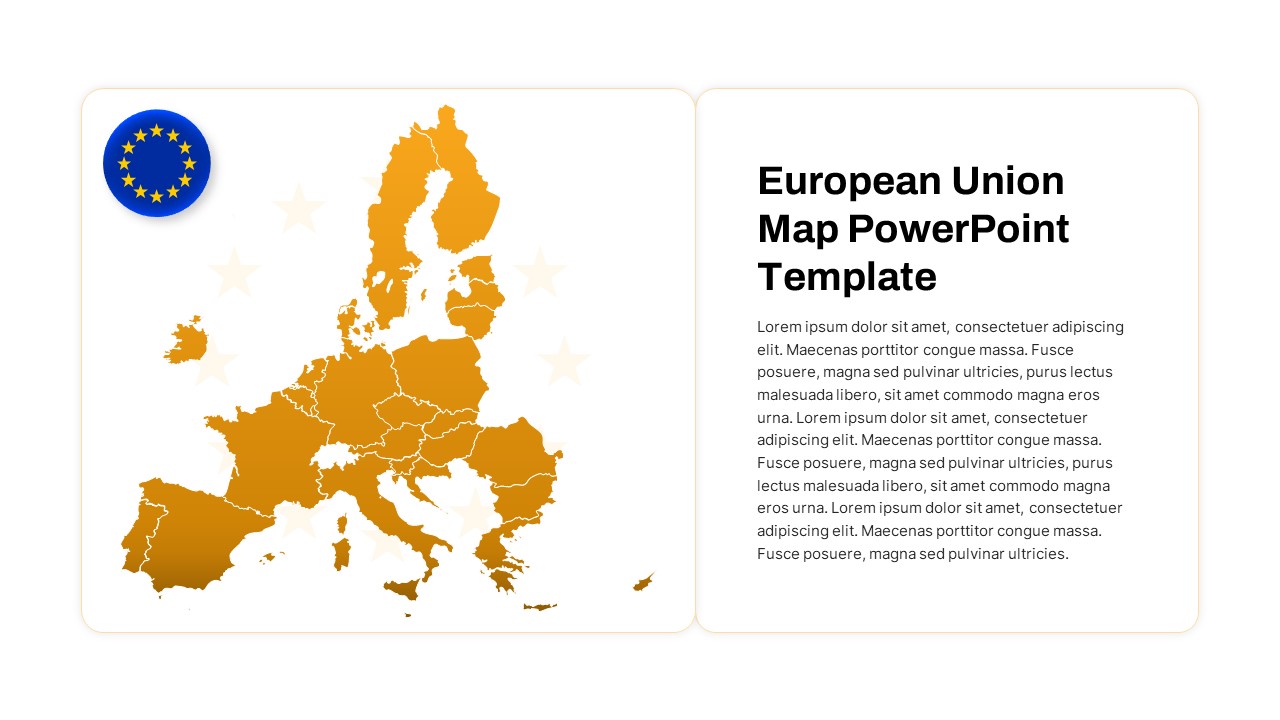
European Union Map Infographic Template for PowerPoint & Google Slides
World Maps
Syria Regional Data Map Infographic Template for PowerPoint & Google Slides
World Maps
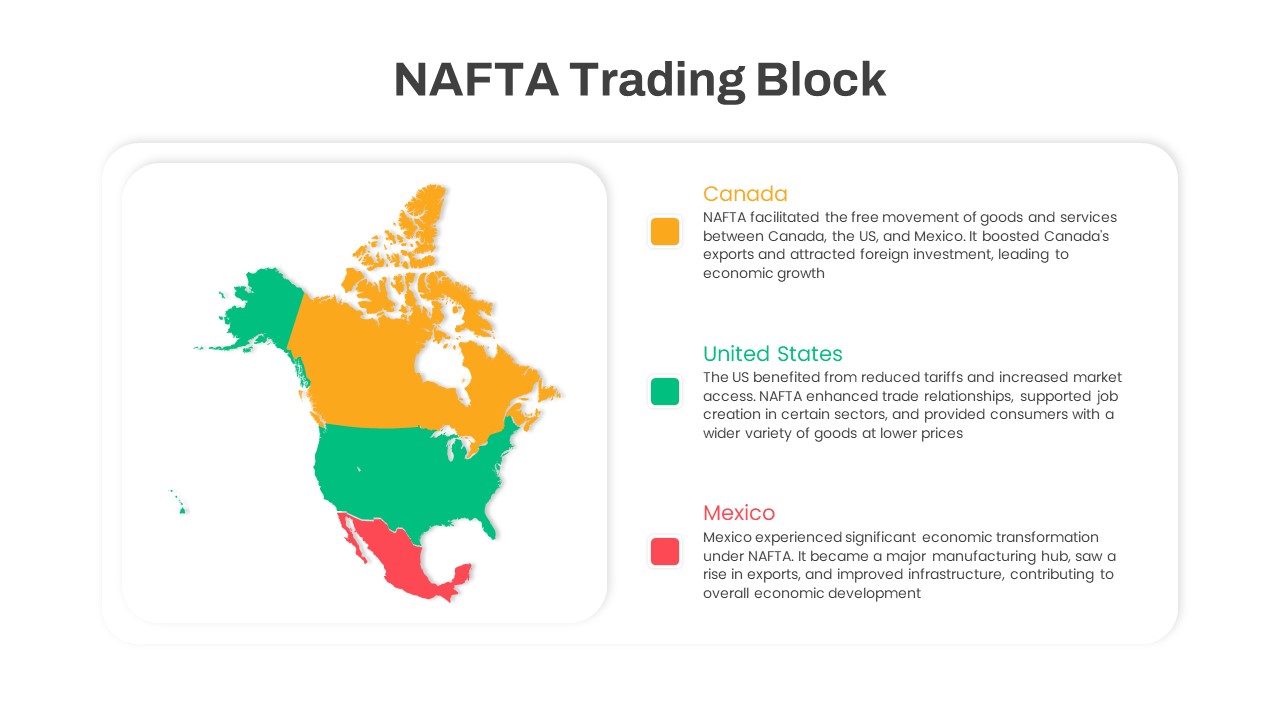
NAFTA Trading Block Map Infographic Template for PowerPoint & Google Slides
World Maps
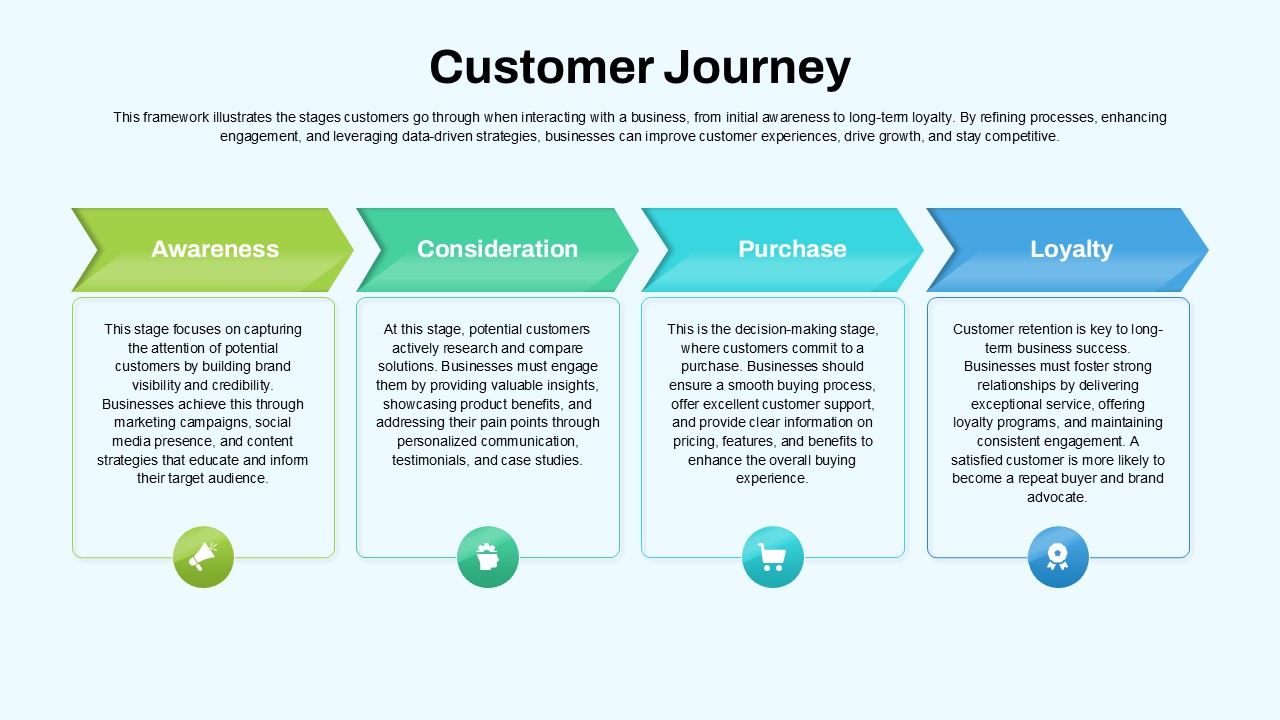
Customer Journey Process Map Infographic Template for PowerPoint & Google Slides
Customer Journey
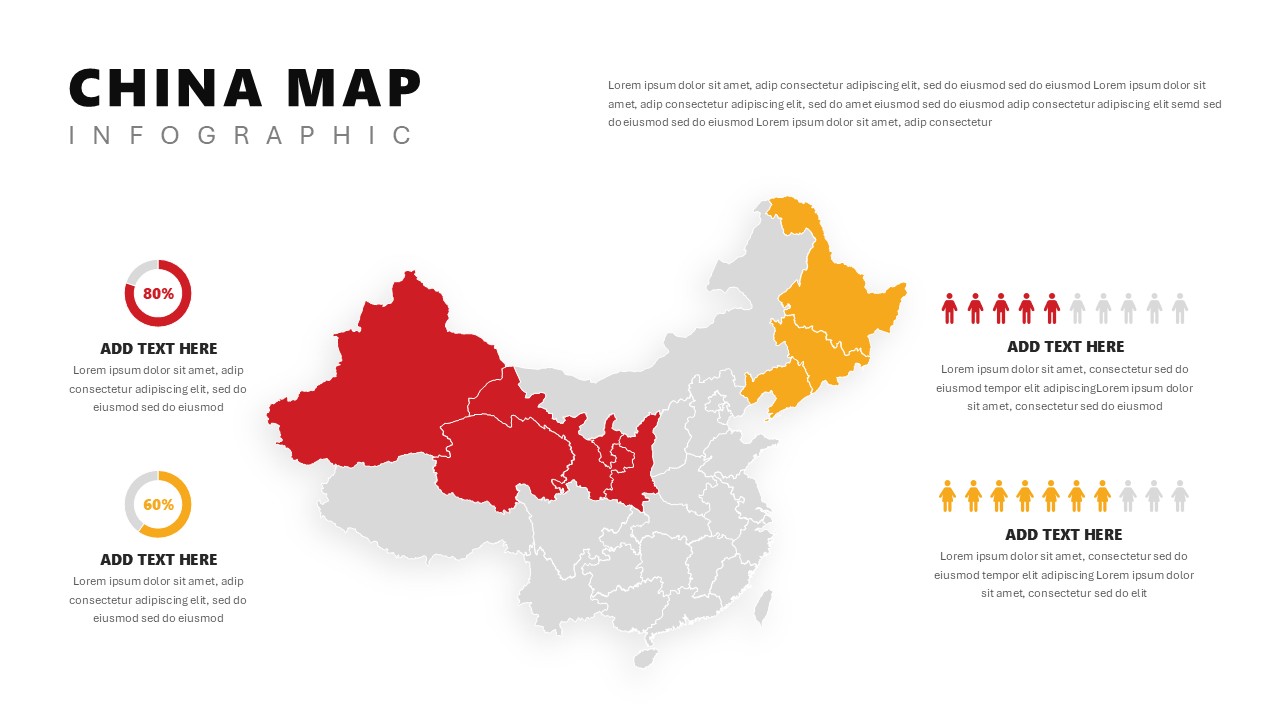
China Map Infographic Regional Stats Template for PowerPoint & Google Slides
World Maps
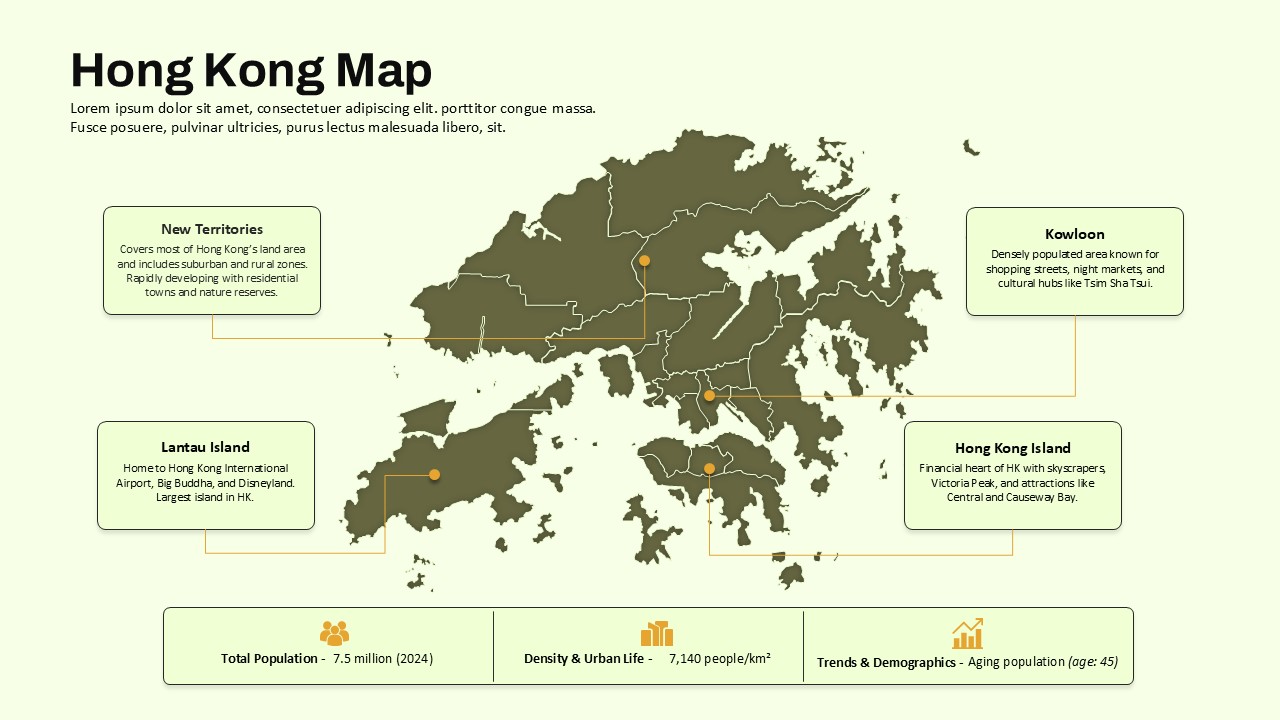
Hong Kong Geographic Map Infographic Template for PowerPoint & Google Slides
World Maps
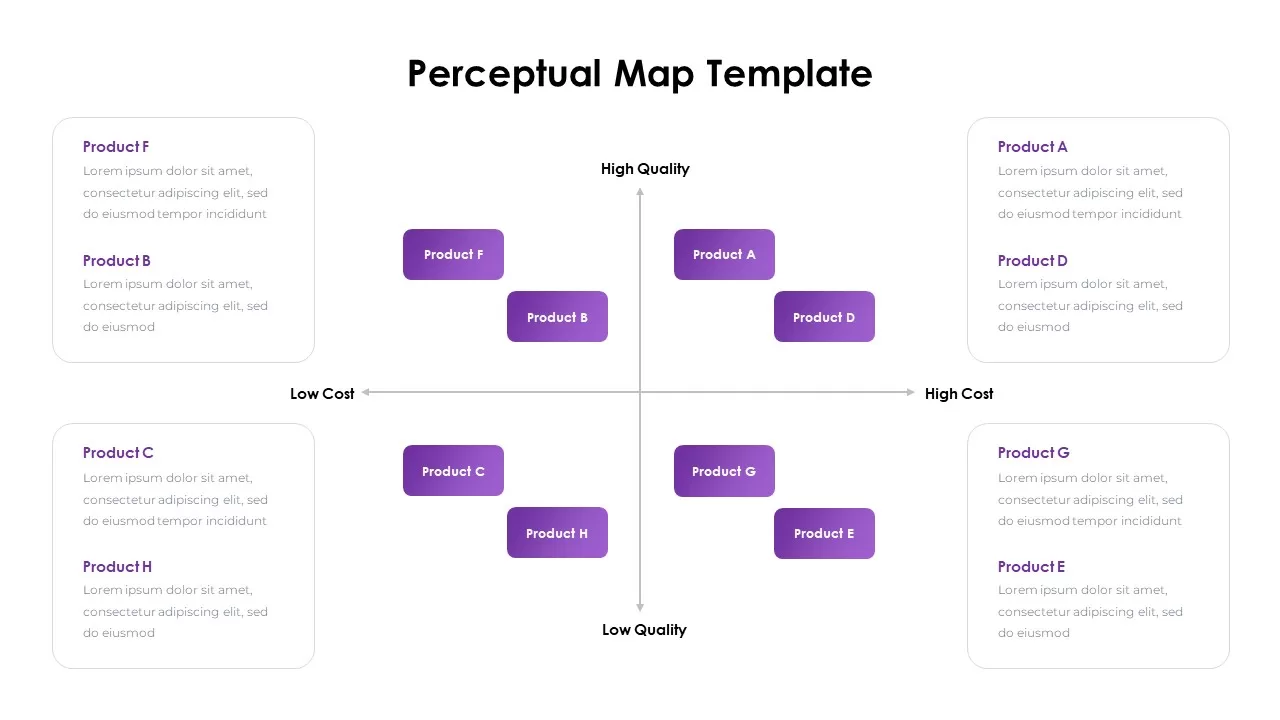
Perceptual Map infographic for PowerPoint & Google Slides
Competitor Analysis
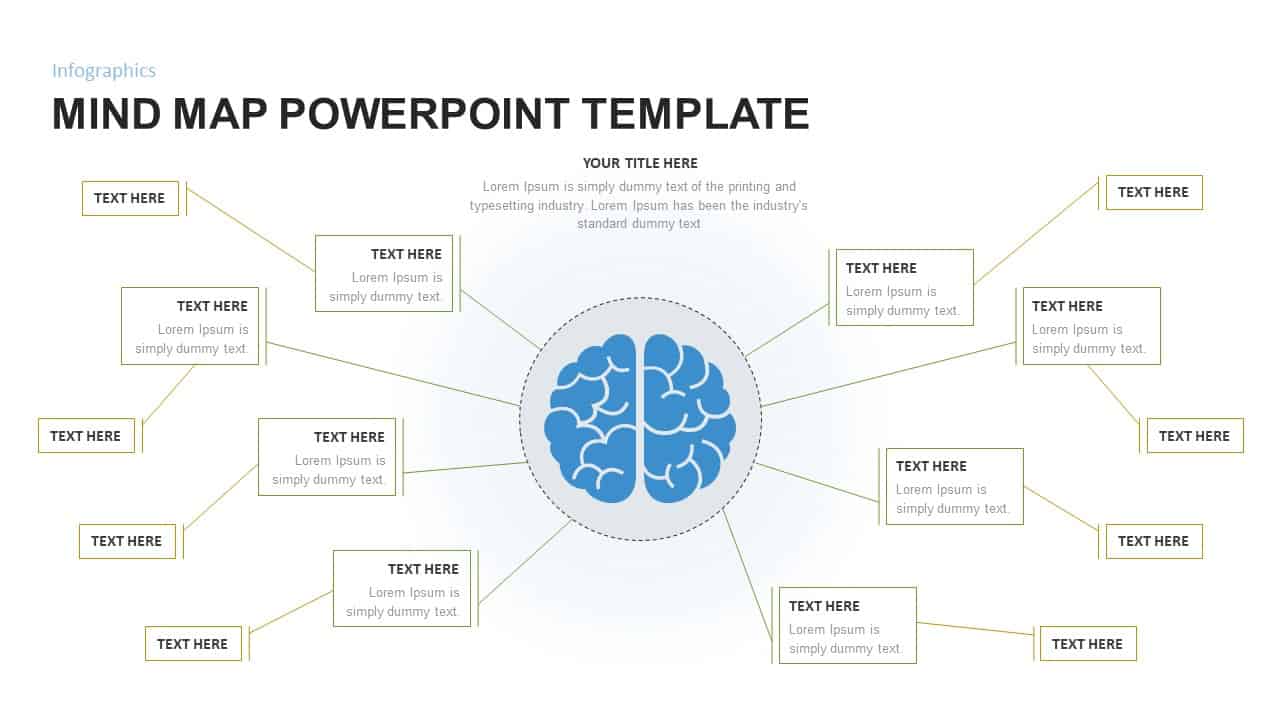
Mind Map PowerPoint template for PowerPoint & Google Slides
Mind Maps
Editable Colombia Map PowerPoint Template for PowerPoint & Google Slides
Business Models
World Map Data template for PowerPoint & Google Slides
World Maps
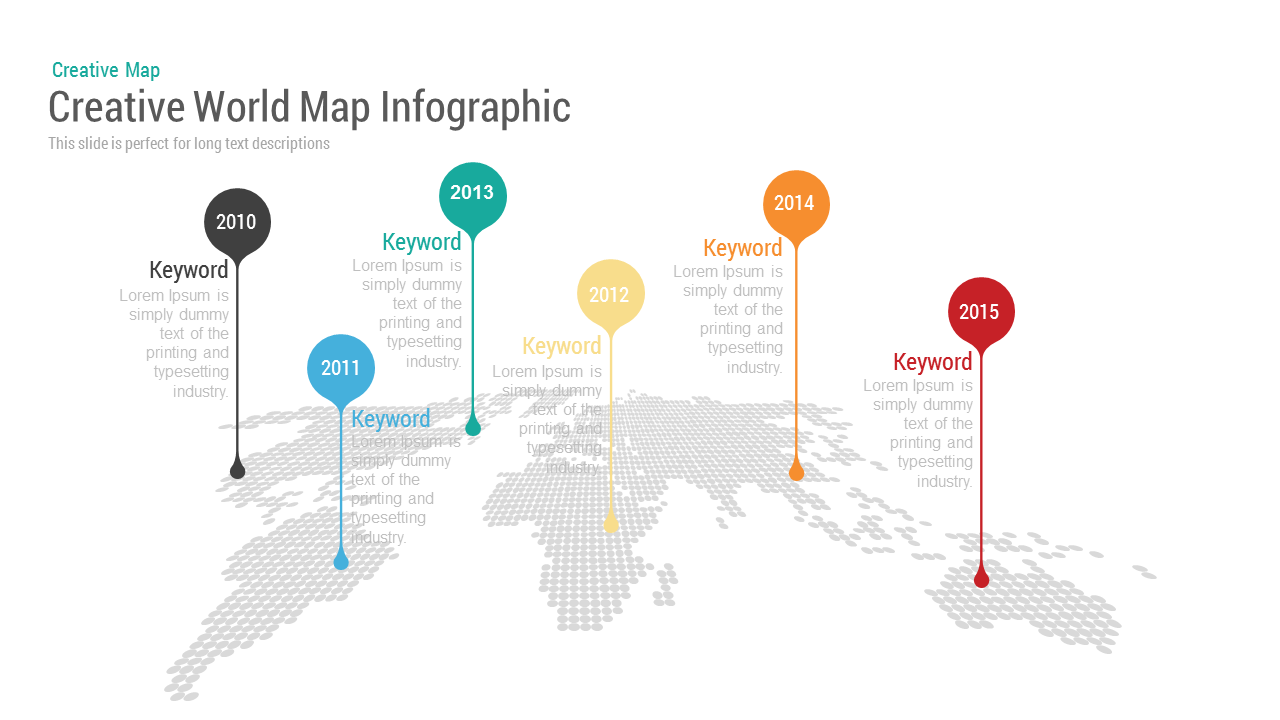
Creative World Map template for PowerPoint & Google Slides
World Maps
Interactive US Population Data Map Slide Template for PowerPoint & Google Slides
World Maps
Asia Map with KPI Metrics and Legend Template for PowerPoint & Google Slides
World Maps
Diamond Mind Map Diagram Four Branches Template for PowerPoint & Google Slides
Mind Maps
Simple Multi-Branch Mind Map Template for PowerPoint & Google Slides
Mind Maps
Customizable USA Map With State Markers Template for PowerPoint & Google Slides
World Maps
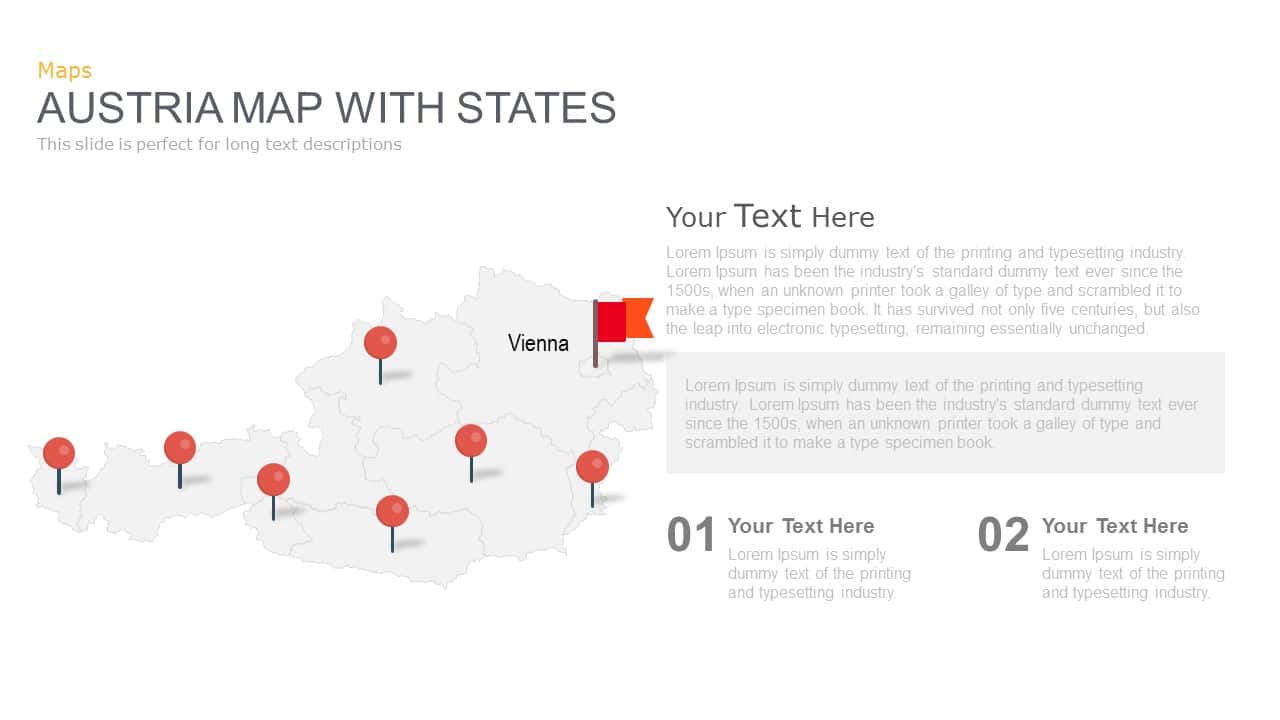
Austria Map With State Markers Template for PowerPoint & Google Slides
World Maps
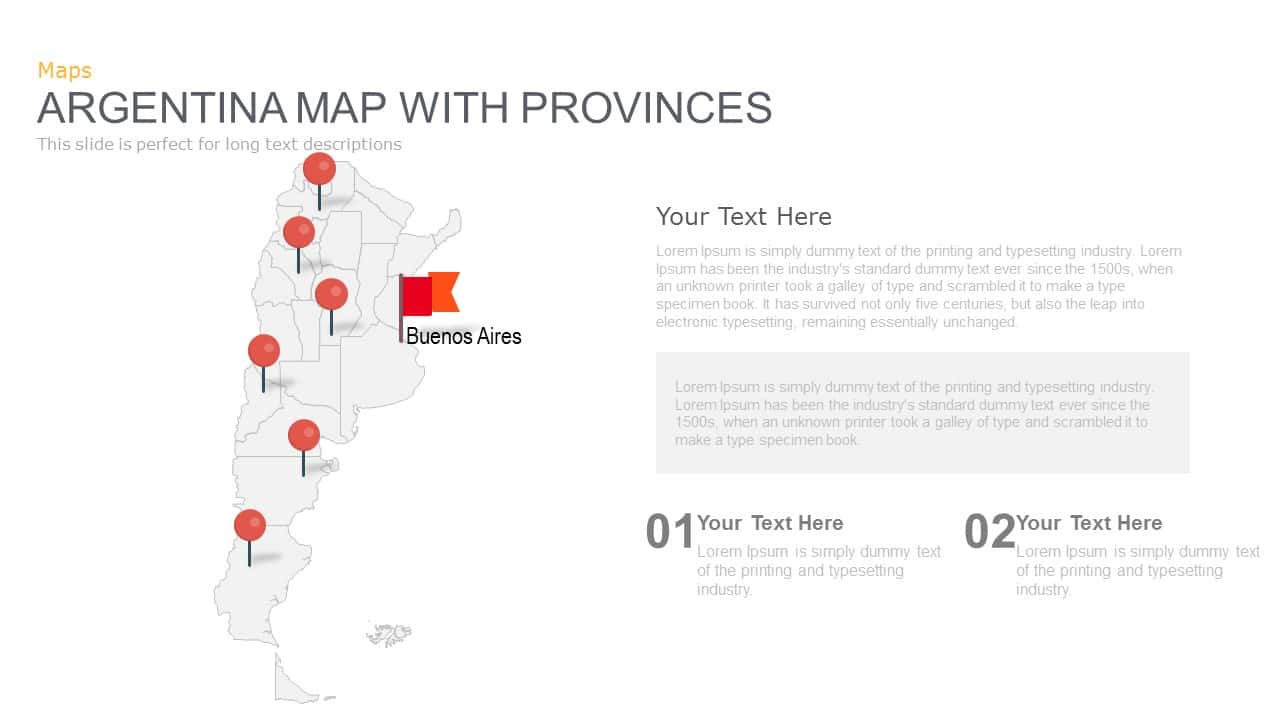
Argentina Province Map Markers Template for PowerPoint & Google Slides
World Maps
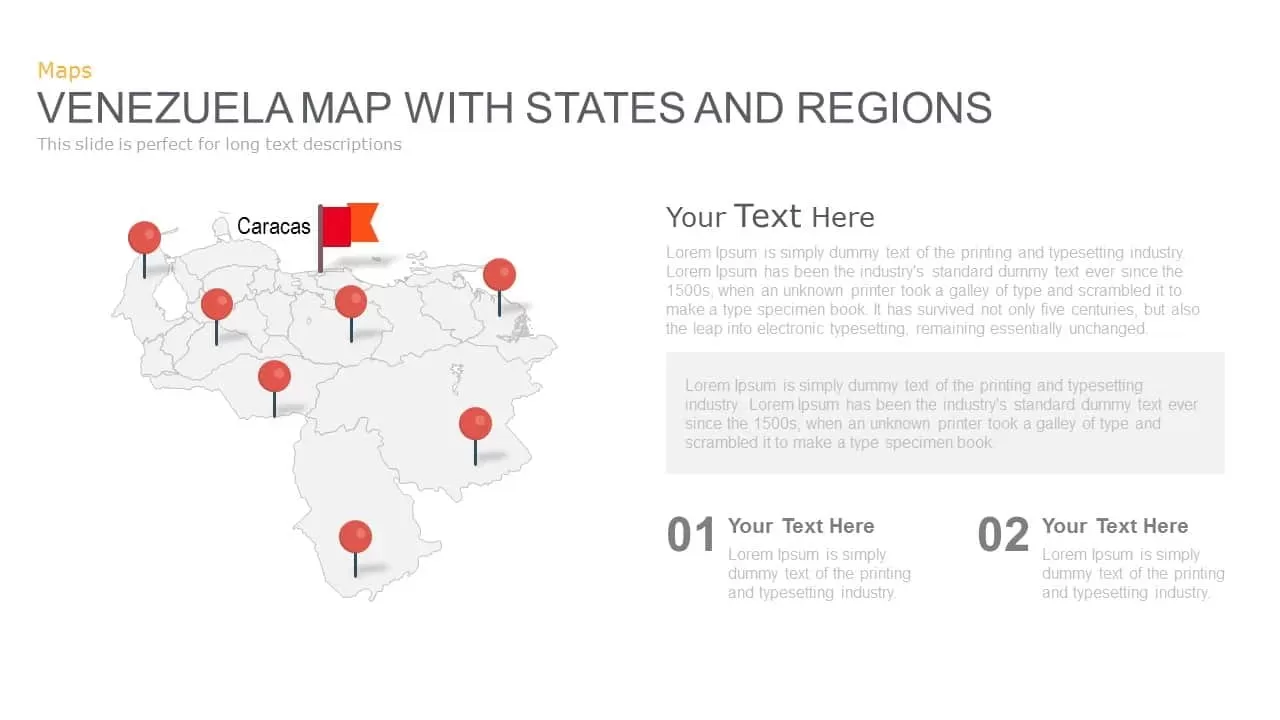
Venezuela Map with States and Regions Template for PowerPoint & Google Slides
World Maps
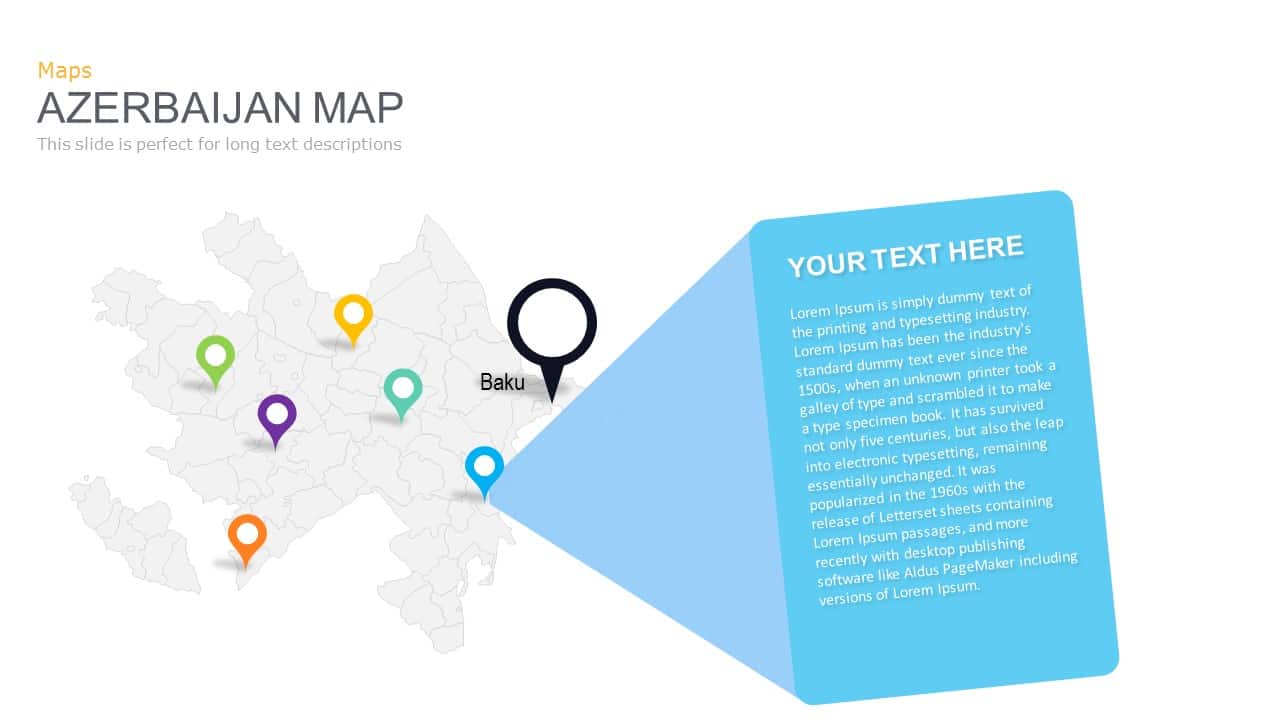
Azerbaijan Map with Provinces & Callouts Template for PowerPoint & Google Slides
World Maps
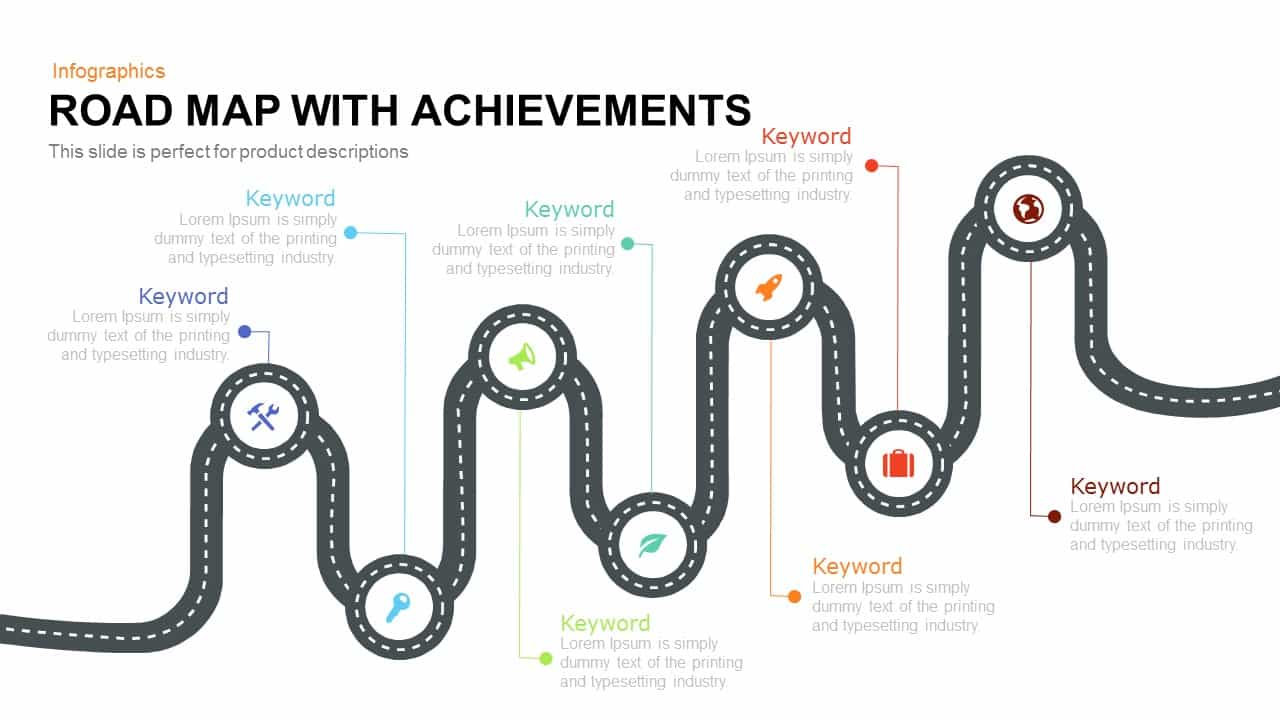
Road Map with Achievements Milestones Template for PowerPoint & Google Slides
Roadmap
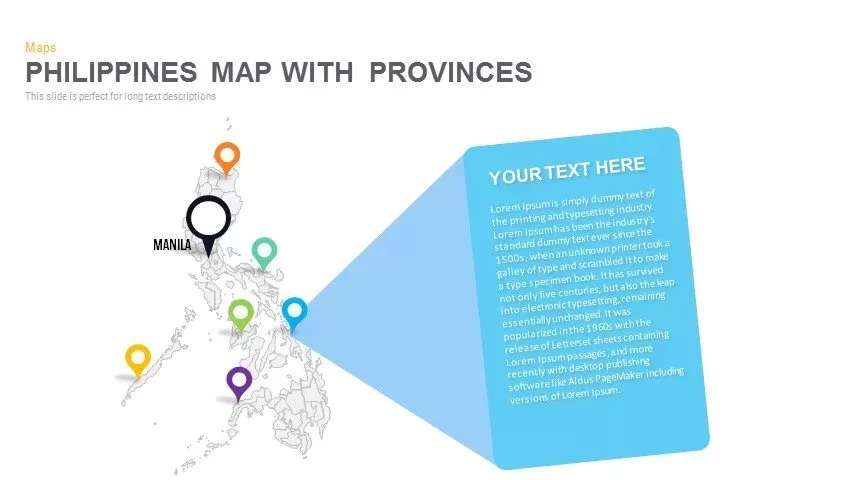
Philippines Map with Provinces Pack Template for PowerPoint & Google Slides
Maps
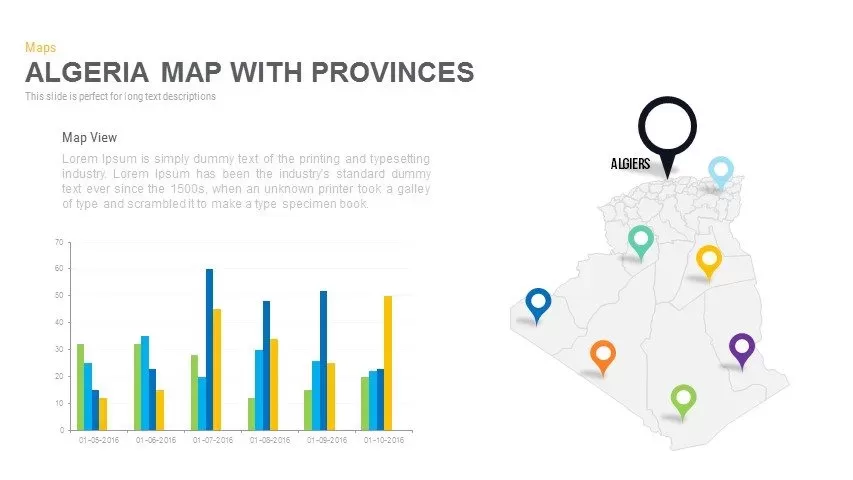
Algeria Map with Provinces Pack Template for PowerPoint & Google Slides
Maps
Angola Provinces Map Slide Pack Template for PowerPoint & Google Slides
World Maps
Australia Map with State Markers Template for PowerPoint & Google Slides
Maps
Egypt Regional Map Slide Pack Template for PowerPoint & Google Slides
World Maps
Ethiopia Map with Regions Slide Pack Template for PowerPoint & Google Slides
World Maps
Iran Map with Provinces Slide Pack Template for PowerPoint & Google Slides
World Maps
Zimbabwe Map with Provinces Slide Pack Template for PowerPoint & Google Slides
World Maps

Road Map Timeline Presentation template for PowerPoint & Google Slides
Roadmap

Global Map with Location Markers Template for PowerPoint & Google Slides
World Maps
Risk Management Heat Map Diagram Template for PowerPoint & Google Slides
Comparison Chart
Mind Map Infographics template for PowerPoint & Google Slides
Mind Maps
Concept Map Presentation Template for PowerPoint & Google Slides
Mind Maps
Stakeholder Map Template for PowerPoint & Google Slides
Business
Mind Map Template for PowerPoint & Google Slides
Mind Maps
Colorful Mind Map Template for PowerPoint & Google Slides
Mind Maps
Colorful Mind Map Template for PowerPoint & Google Slides
Mind Maps
North America Regional Map Overview Template for PowerPoint & Google Slides
World Maps
Customizable Canada Map Outline Template for PowerPoint & Google Slides
World Maps
Heat Map Risk Assessment Presentation Template for PowerPoint & Google Slides
Risk Management
Professional Risk Heat Map Visualization Template for PowerPoint & Google Slides
Risk Management
Professional Interactive Heat Map Matrix Template for PowerPoint & Google Slides
Comparison Chart
Heat Map Risk Matrix Dashboard Template for PowerPoint & Google Slides
Comparison Chart
Connect the Dots Mind Map Diagram Template for PowerPoint & Google Slides
Mind Maps
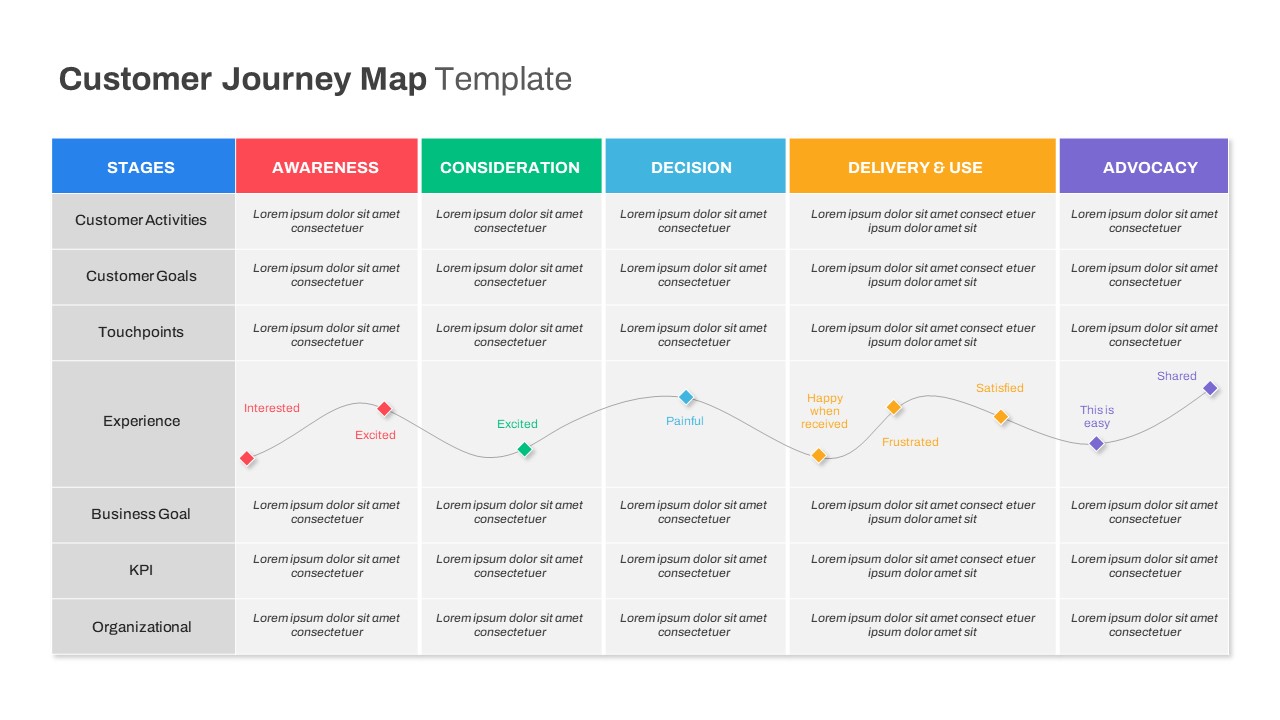
Versatile Customer Journey Map Template for PowerPoint & Google Slides
Customer Journey
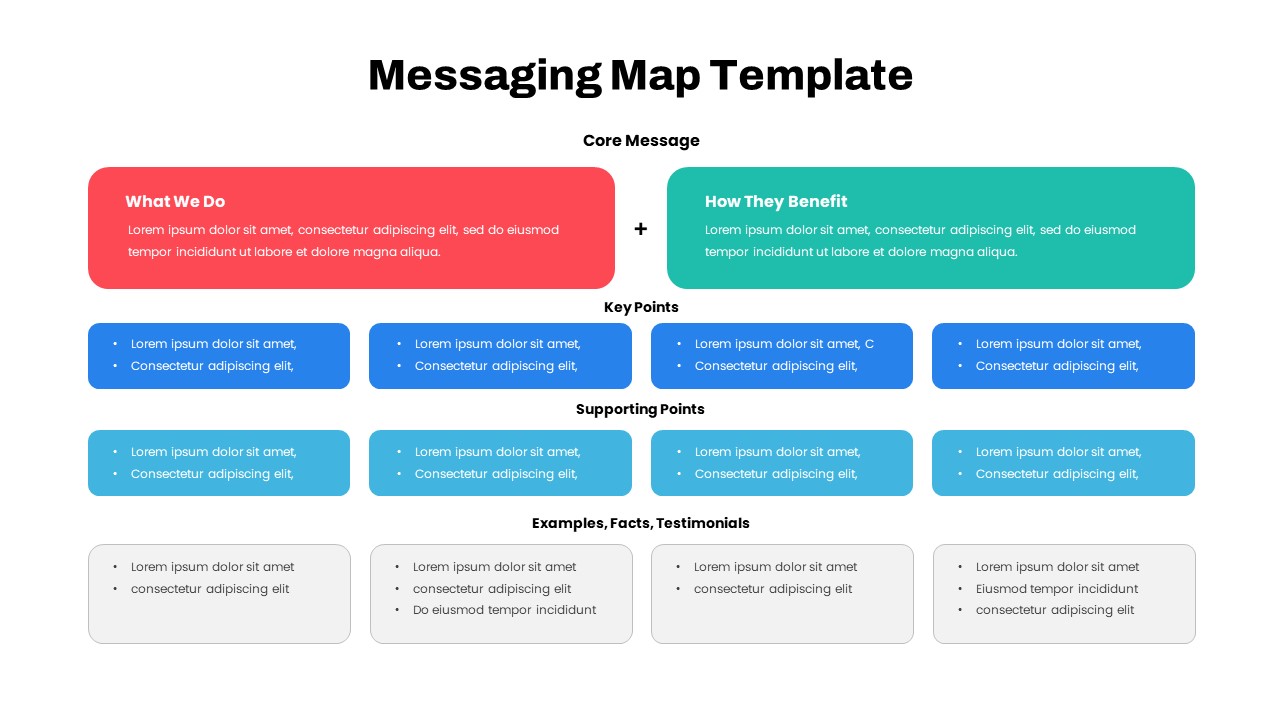
Comprehensive Messaging Map Framework Template for PowerPoint & Google Slides
Process
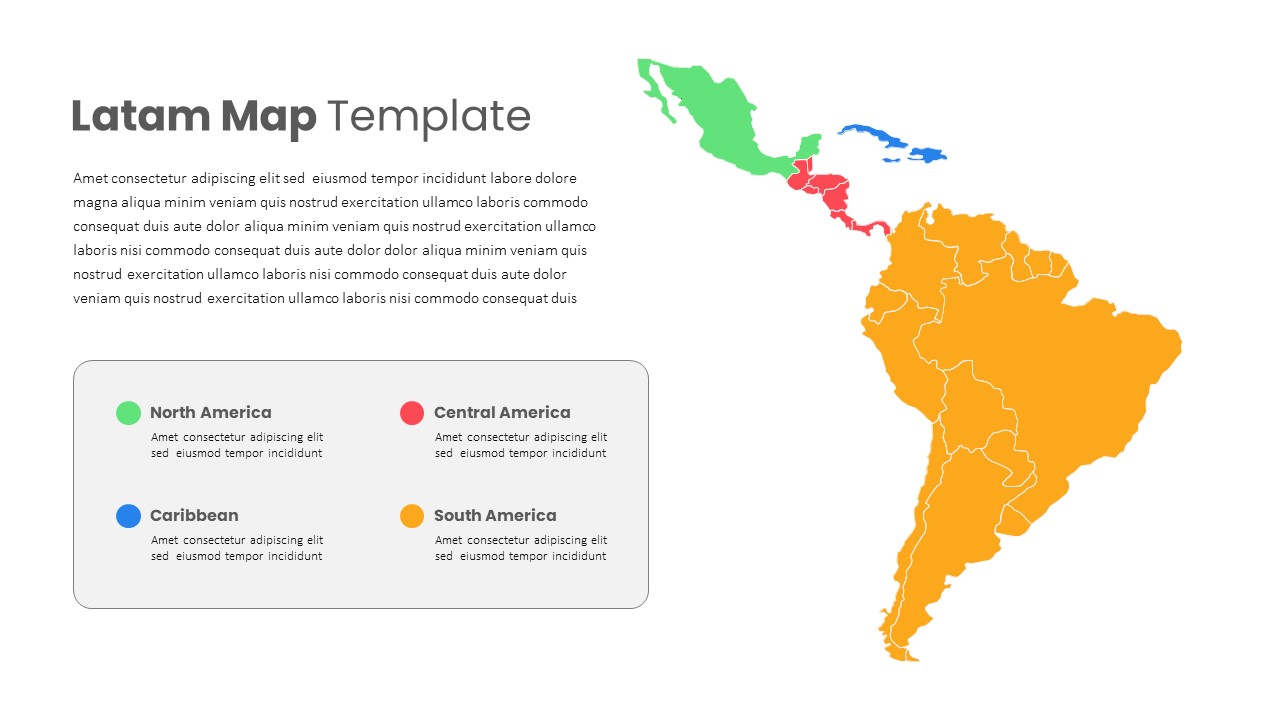
Latin America Regional Map Breakdown Template for PowerPoint & Google Slides
World Maps
Free Editable U.S. Map with Regional Metrics Template for PowerPoint & Google Slides
World Maps
Free
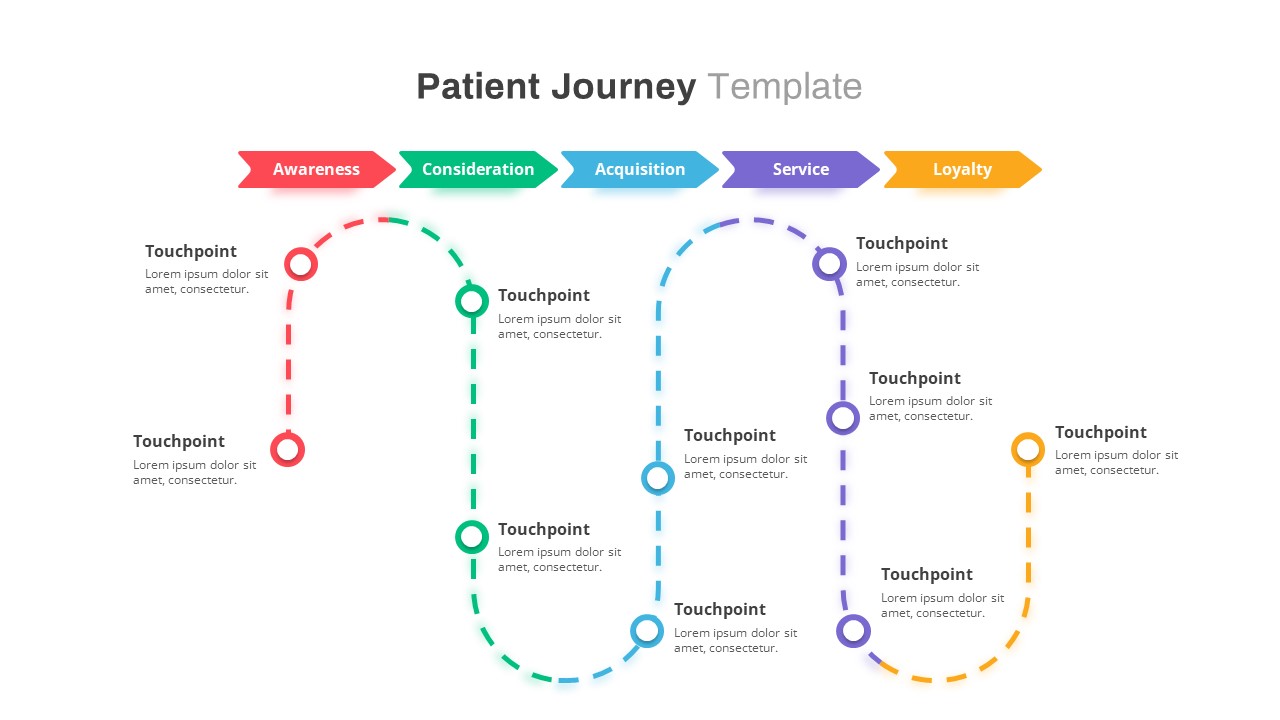
Healthcare Patient Journey Map Overview Template for PowerPoint & Google Slides
Health
Free Global Market Distribution Map Template for PowerPoint & Google Slides
World Maps
Free
UK Counties Map Data Visualization Template for PowerPoint & Google Slides
World Maps
Comprehensive Customer Journey Map Template for PowerPoint & Google Slides
Customer Journey
Louisiana Parish Map with Markers Template for PowerPoint & Google Slides
Maps
Colorful Multi-Branch Mind Map Slide Template for PowerPoint & Google Slides
Mind Maps
Iowa County Map with Location Markers Template for PowerPoint & Google Slides
World Maps
Michigan County Map with KPI Dashboard Template for PowerPoint & Google Slides
World Maps
Pennsylvania State Map Diagram Template for PowerPoint & Google Slides
World Maps
Graphic Organizer & Double Bubble Map Template for PowerPoint & Google Slides
Maps
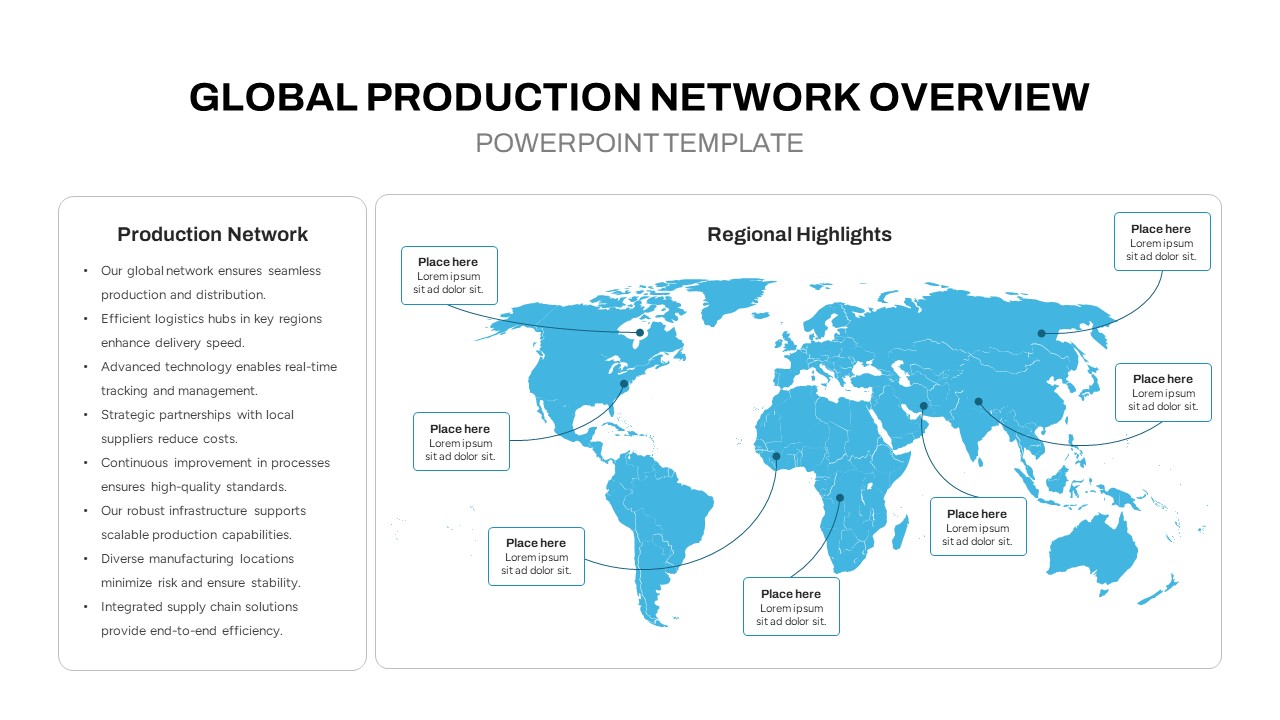
Global Production Network Overview Map Template for PowerPoint & Google Slides
World Maps
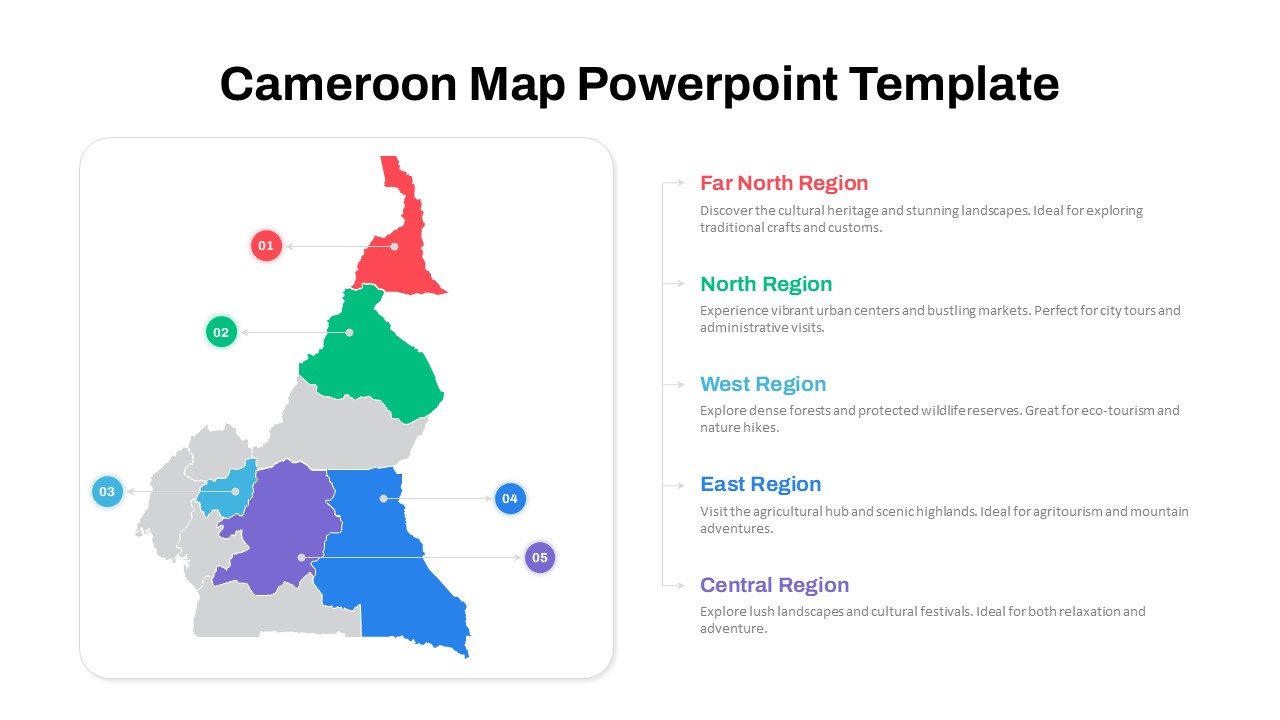
Numbered Cameroon Regional Map Slide Template for PowerPoint & Google Slides
World Maps
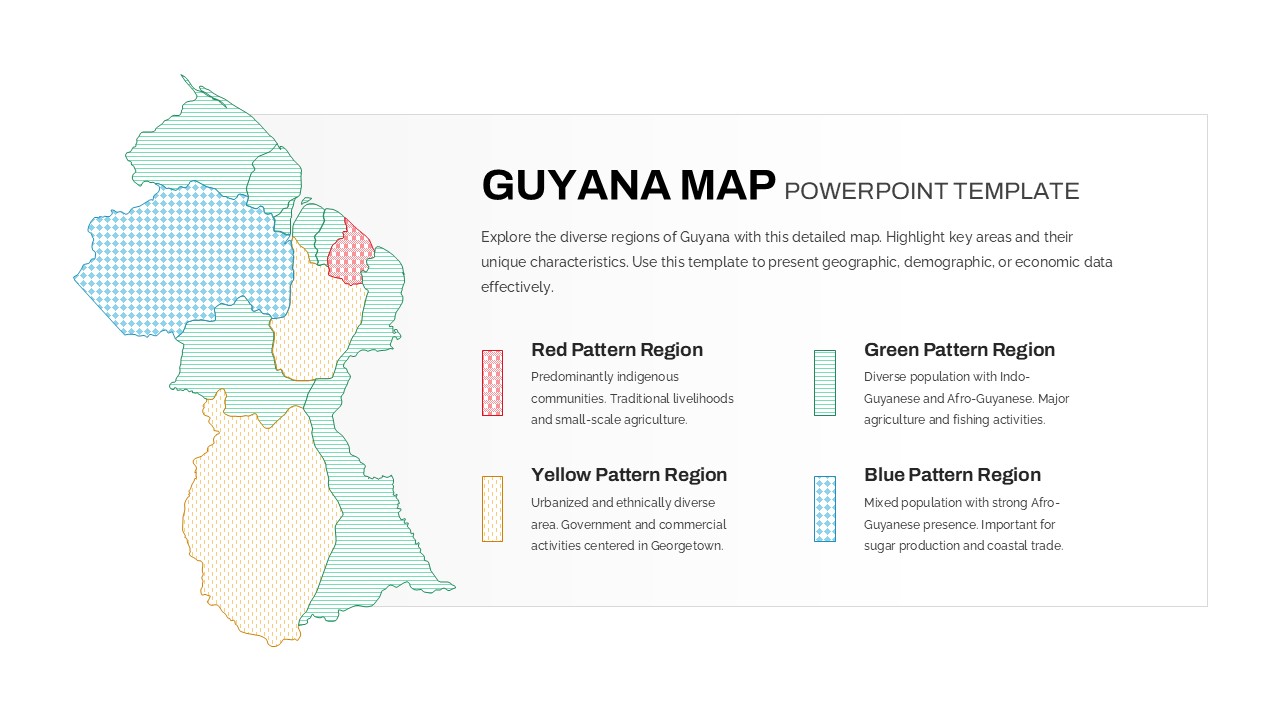
Patterned Guyana Regional Map Template for PowerPoint & Google Slides
World Maps
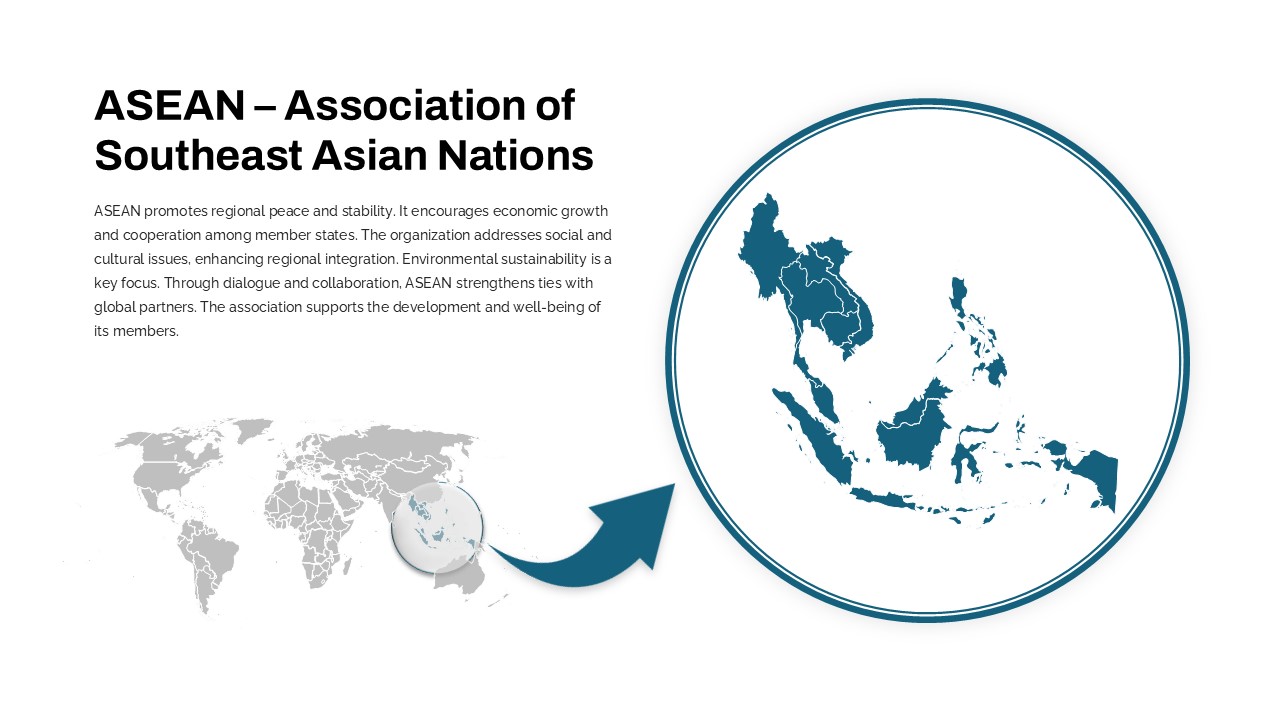
Professional ASEAN Region Zoom Map Slide Template for PowerPoint & Google Slides
World Maps
AI Mind Map & Hub-and-Spoke Diagram Template for PowerPoint & Google Slides
Mind Maps
Interactive Taiwan Map Highlight Template for PowerPoint & Google Slides
World Maps
South America Map template for PowerPoint & Google Slides
Maps
Editable South America Map Diagram Template for PowerPoint & Google Slides
Maps
Employee Journey Map with Stages template for PowerPoint & Google Slides
Recruitment