Machine Learning Strategy Flowchart


Description
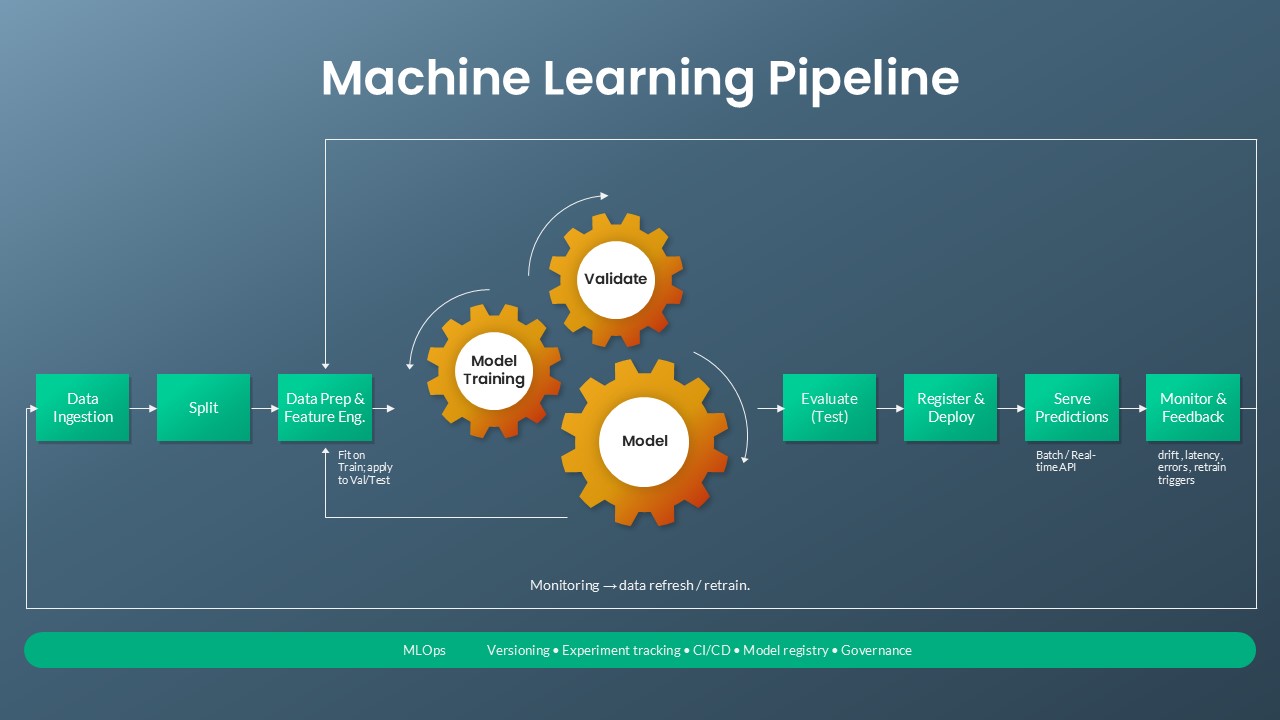
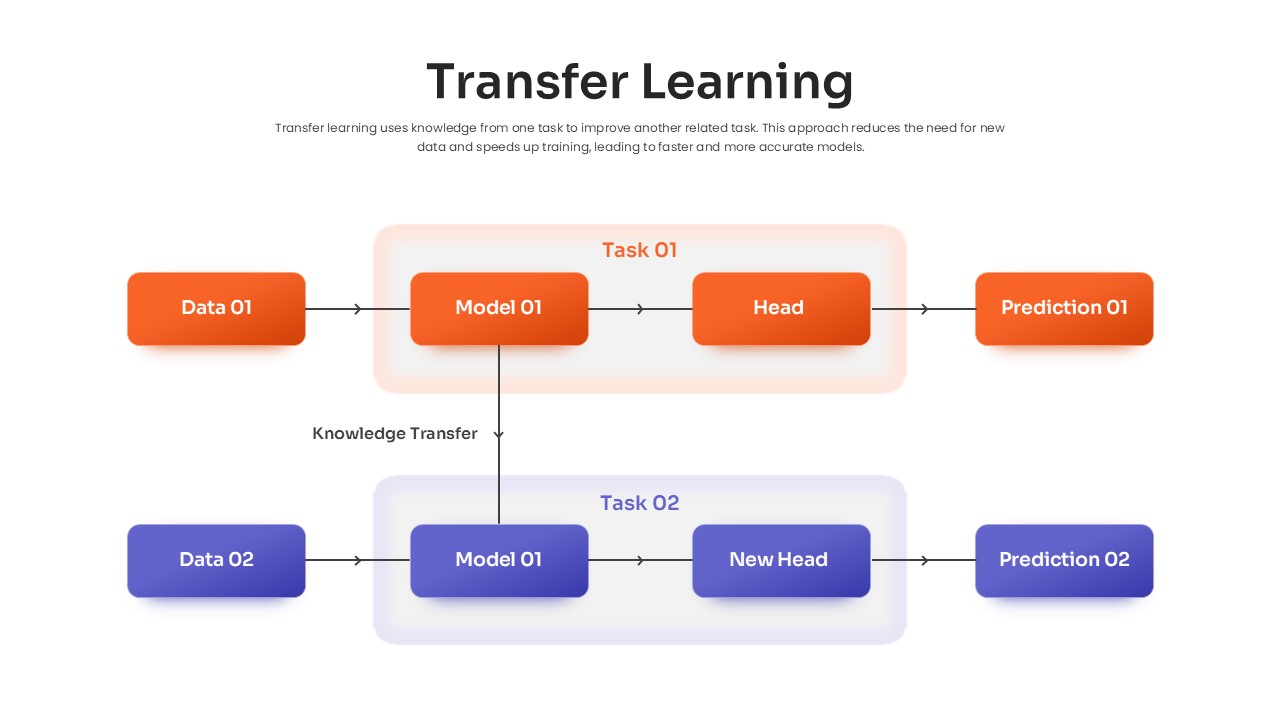
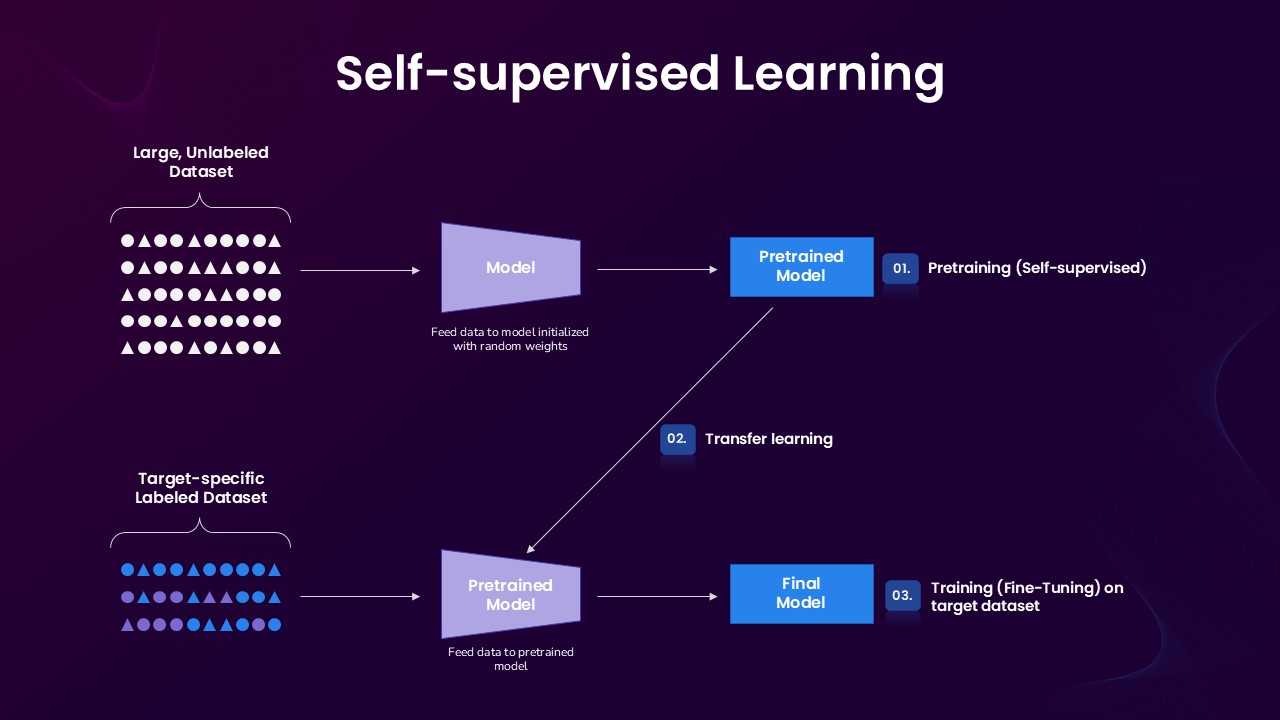
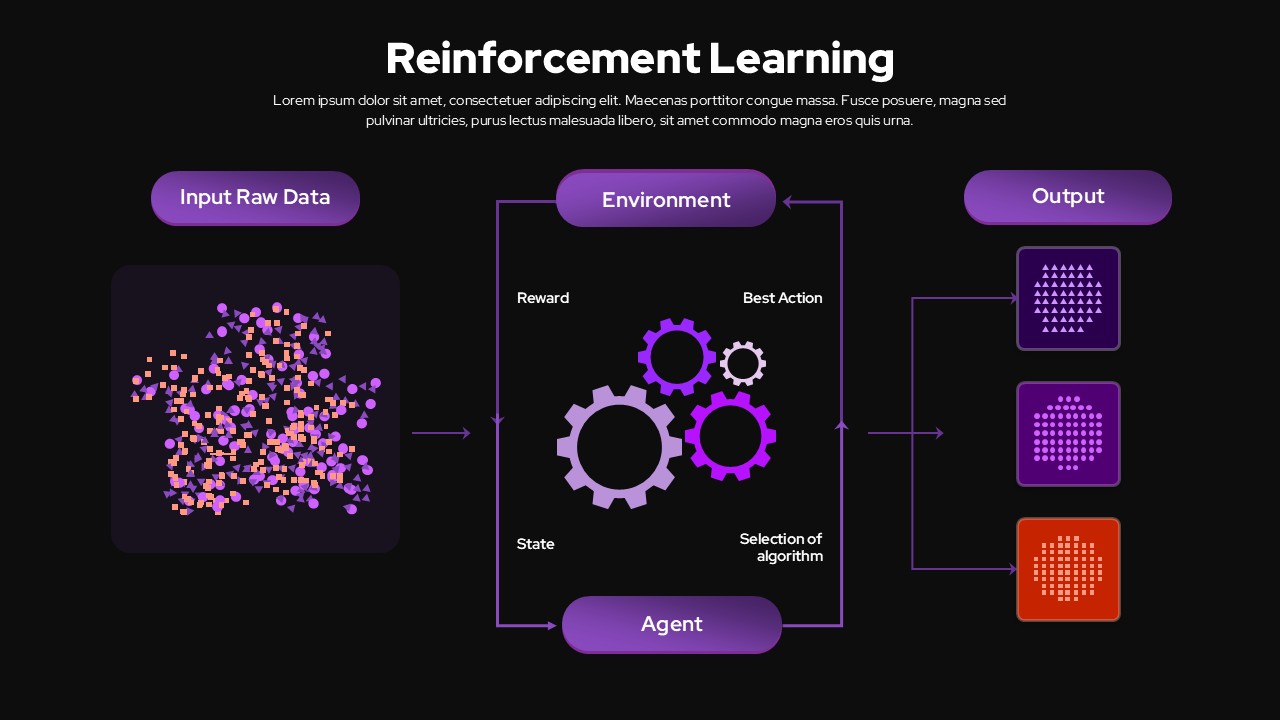
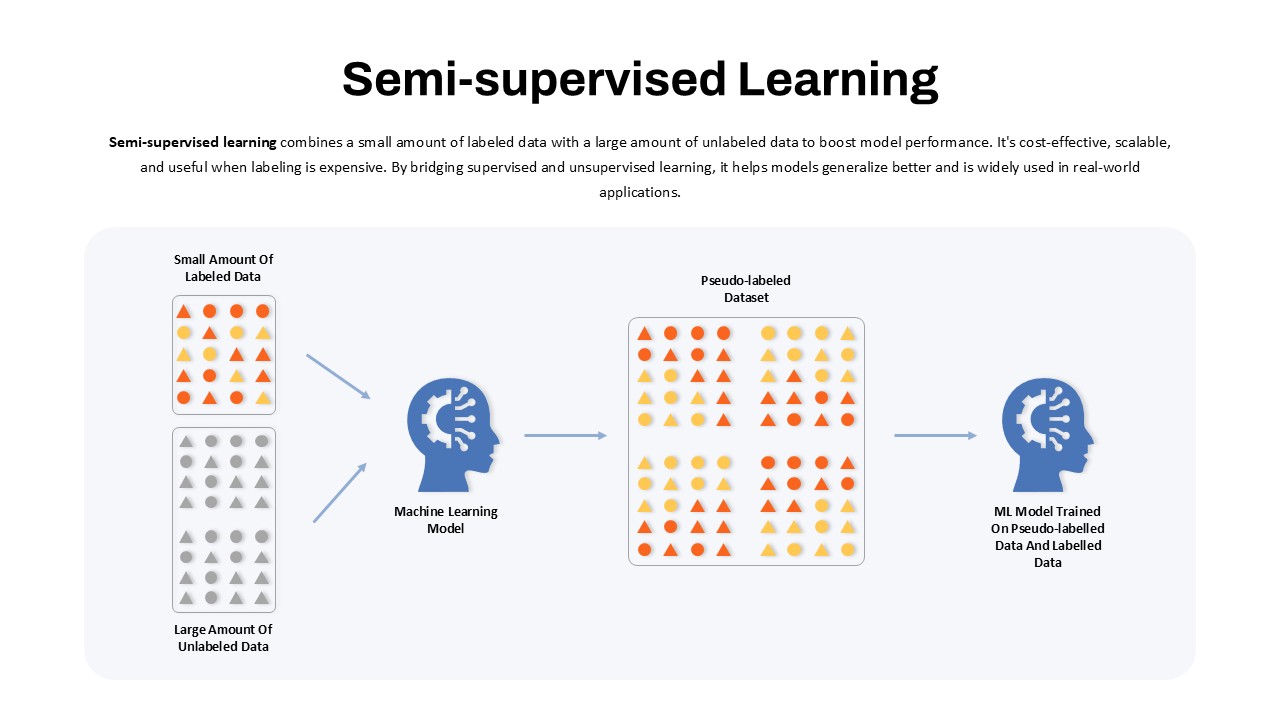
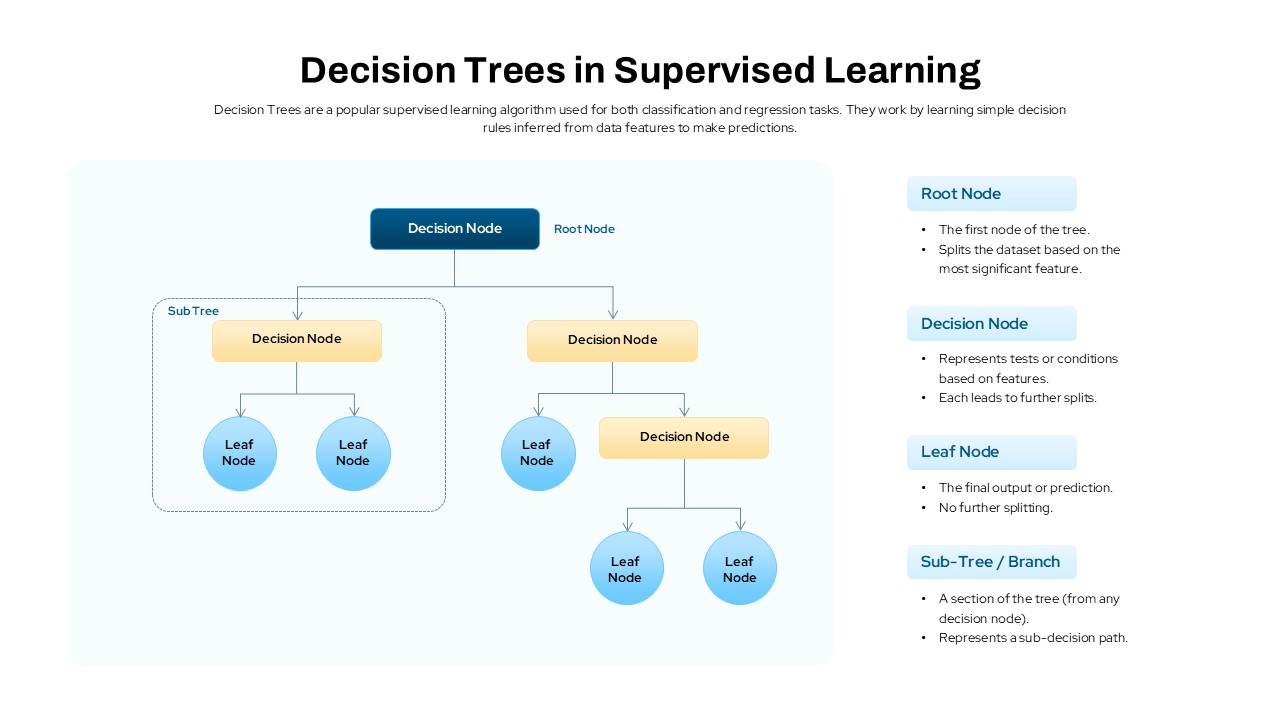
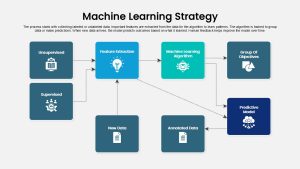
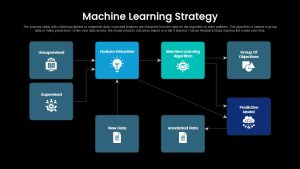
A structured flow diagram that visualizes the end-to-end machine learning workflow:
- Data Sources – Unsupervised & Supervised data inputs (two dark-teal cards on left).
- Feature Extraction – Key feature engineering step (bright-cyan card).
- Model Training – Core ML algorithm processes features and produces either grouped objectives or predictive models (teal-green card).
- Outputs & Feedback – Generates Group of Objectives and Predictive Model (dark-blue cards on right), which feed annotated data and new data back into the pipeline for continuous learning (bottom cards).
Arrows (solid for primary flow, dotted for feedback loops) clearly indicate data and control flow between stages. A concise header and sub-header explain the process context.
Who Is It For
- Data Science Teams mapping out their model development lifecycle.
- Machine Learning Engineers outlining architecture and data flows.
- Project Managers presenting ML project roadmaps to stakeholders.
- Consultants & Trainers educating clients on end-to-end ML pipelines.
Other Uses
- AI Solution Design diagrams for proof-of-concept or pilots.
- Data Ops & MLOps process documentation (add CI/CD loops).
- Academic Lectures illustrating core ML pipeline in courses.
- R&D Proposals showcasing iterative model improvement cycles.
Login to download this file

Item ID
SB05071
Related Templates

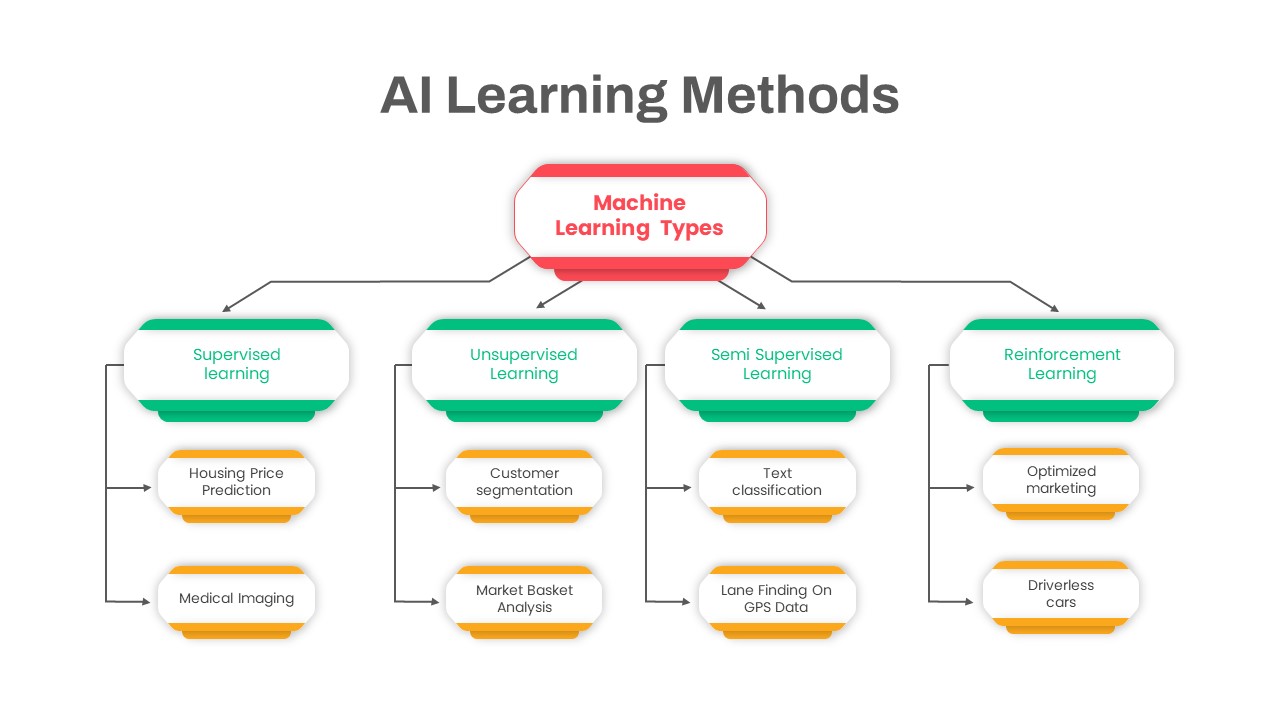
AI Learning Methods Flowchart Diagram Template for PowerPoint & Google Slides
Flow Charts
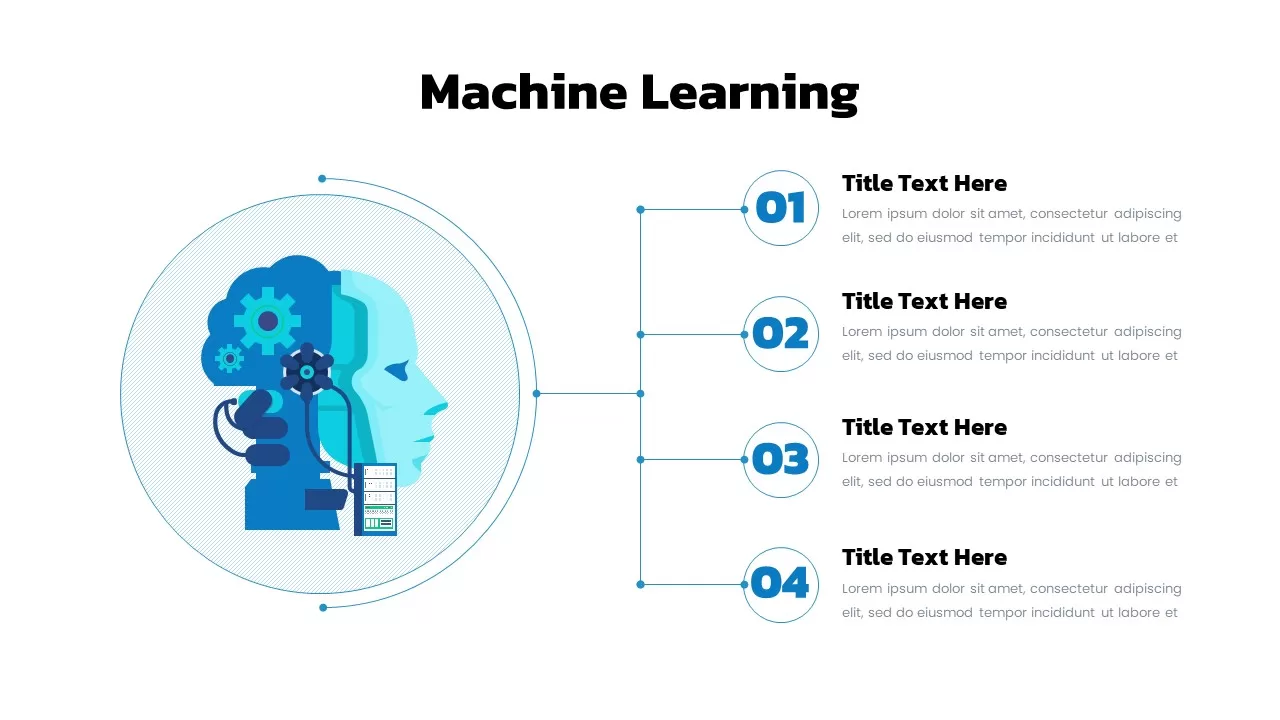
Machine Learning Diagram Template for PowerPoint & Google Slides
Process
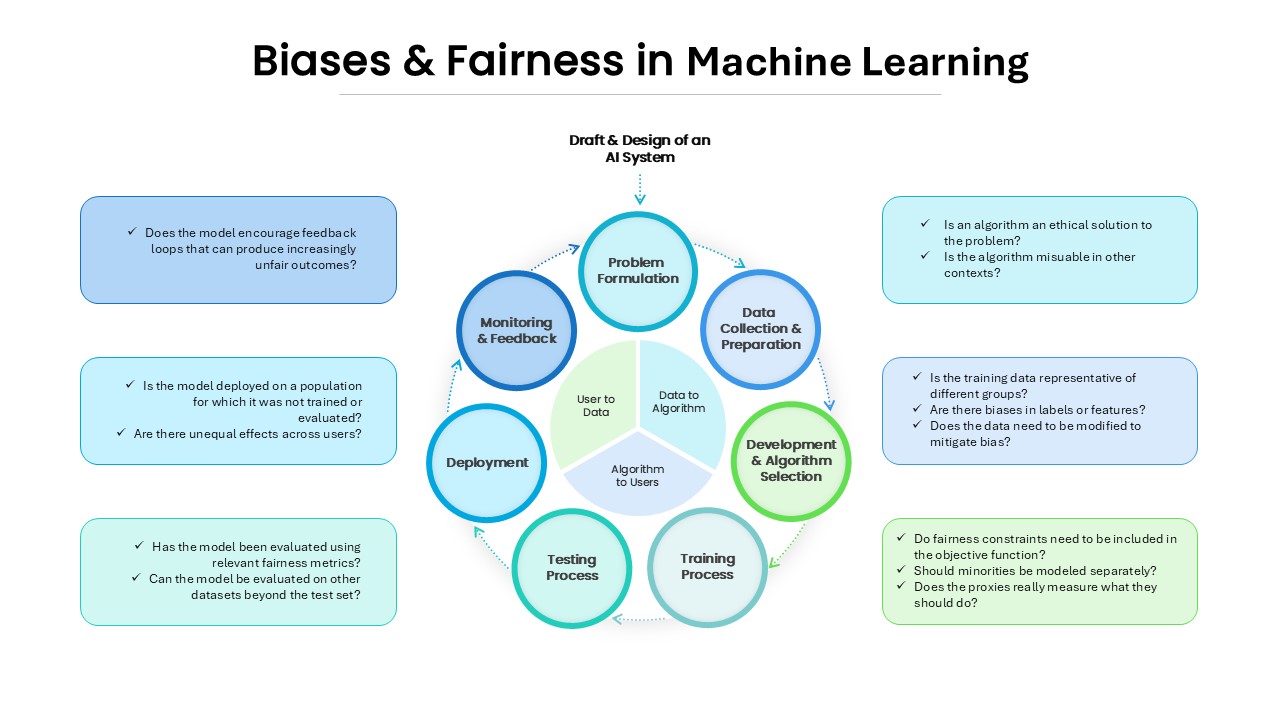
Biases and Fairness in Machine Learning for PowerPoint & Google Slides
Information Technology
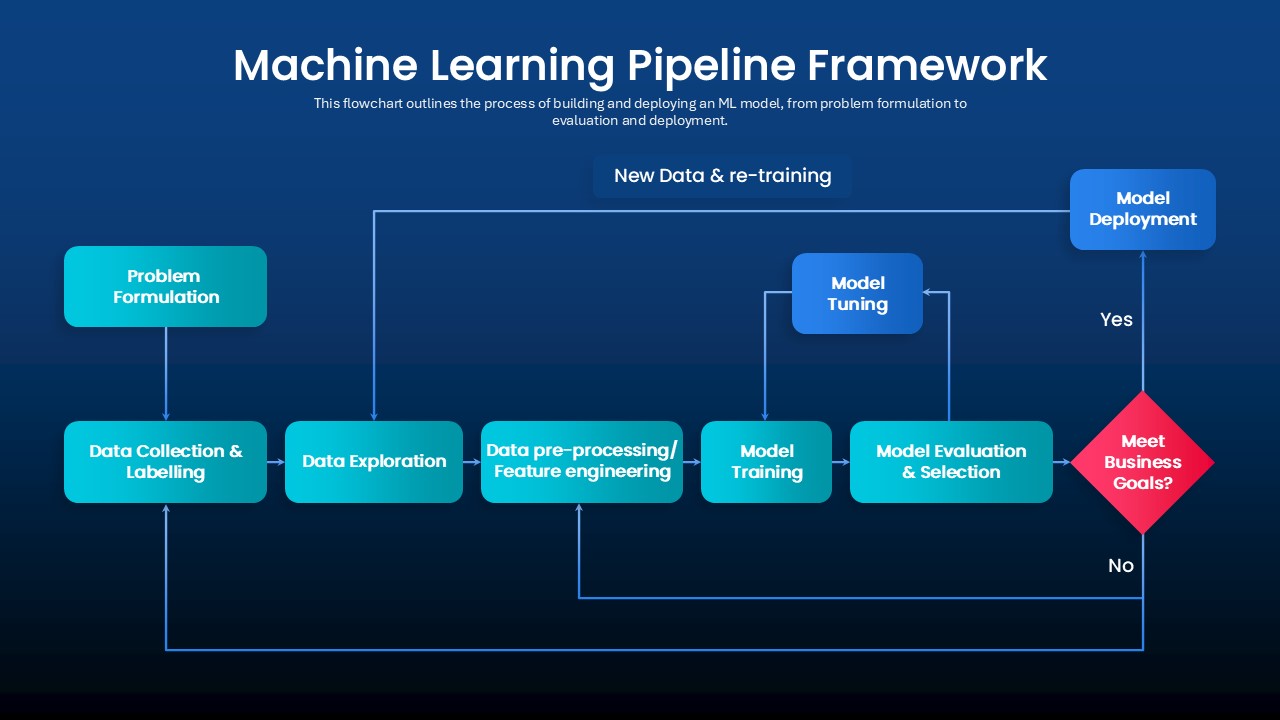
Machine Learning Pipeline Framework Template for PowerPoint & Google Slides
Charts
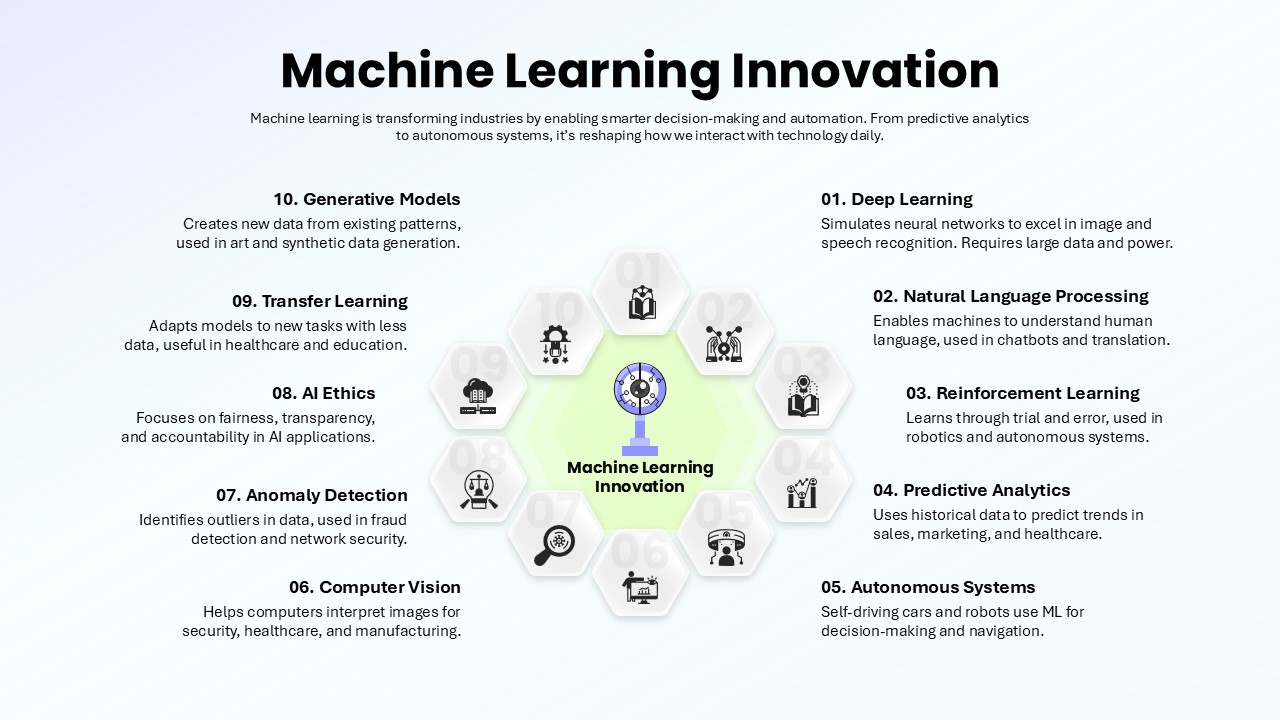
Machine Learning Innovation Overview template for PowerPoint & Google Slides
AI
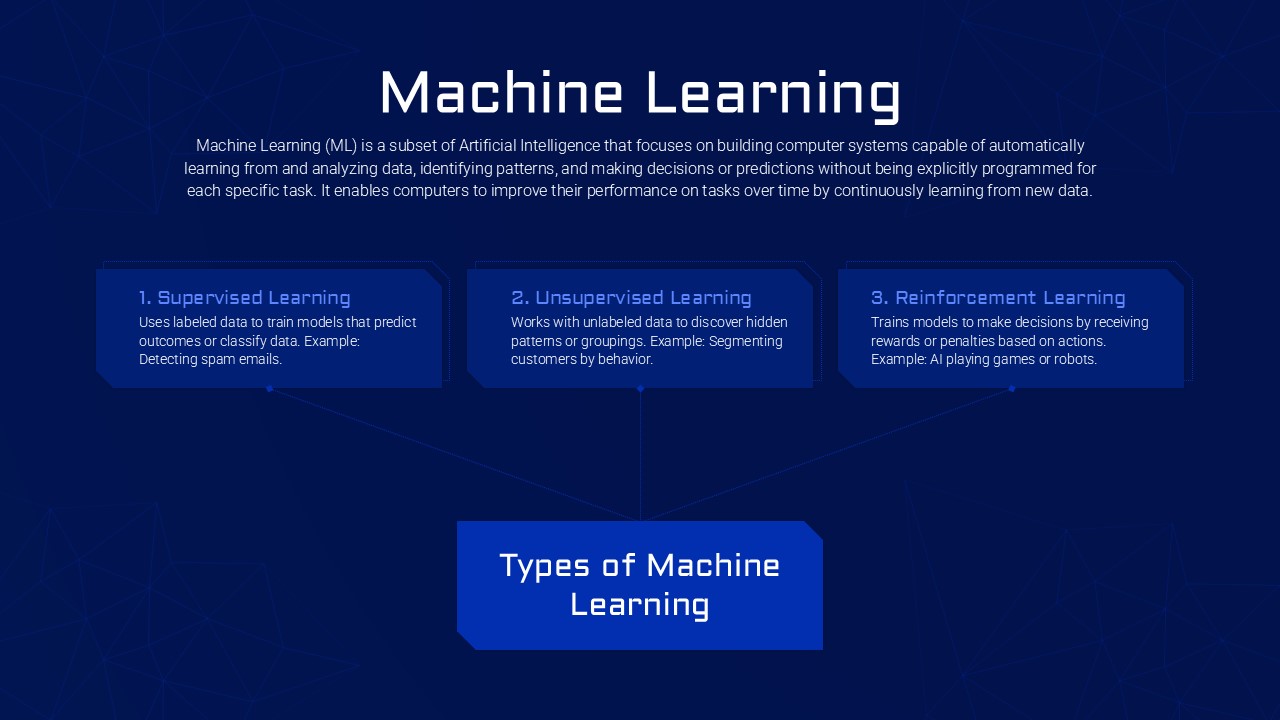
Machine Learning Types template for PowerPoint & Google Slides
Technology
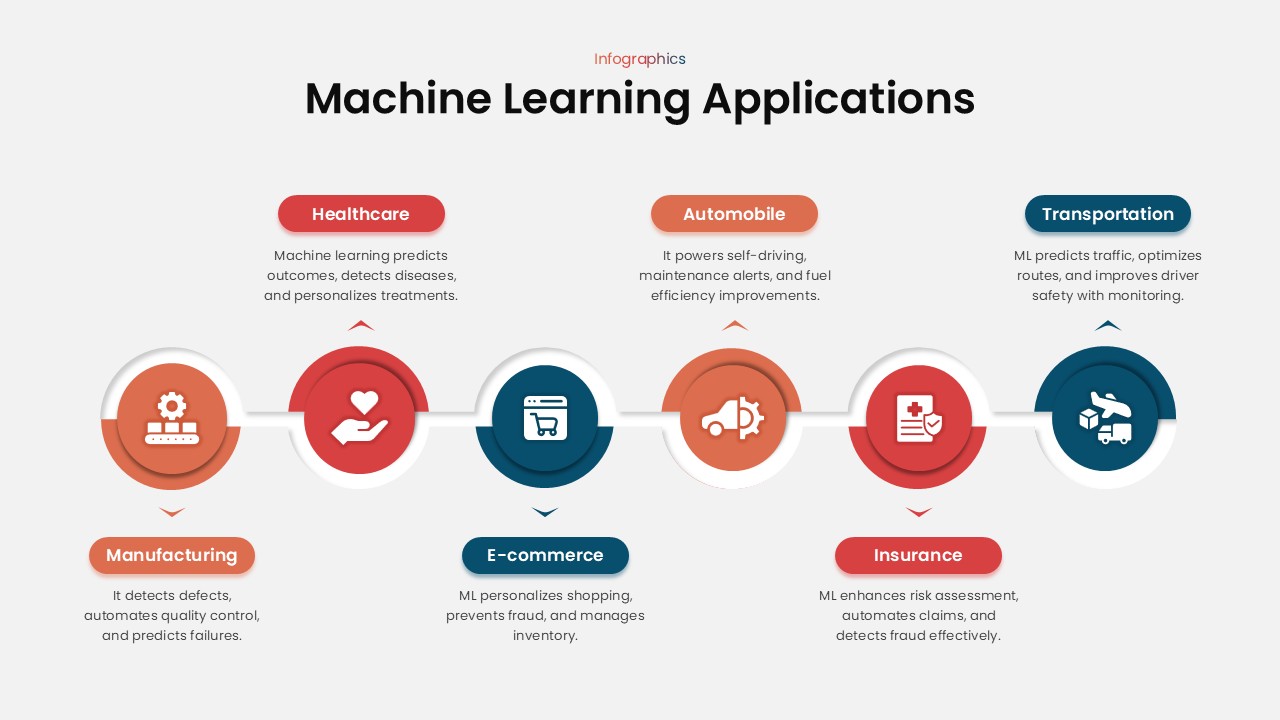
Machine Learning Applications template for PowerPoint & Google Slides
Technology
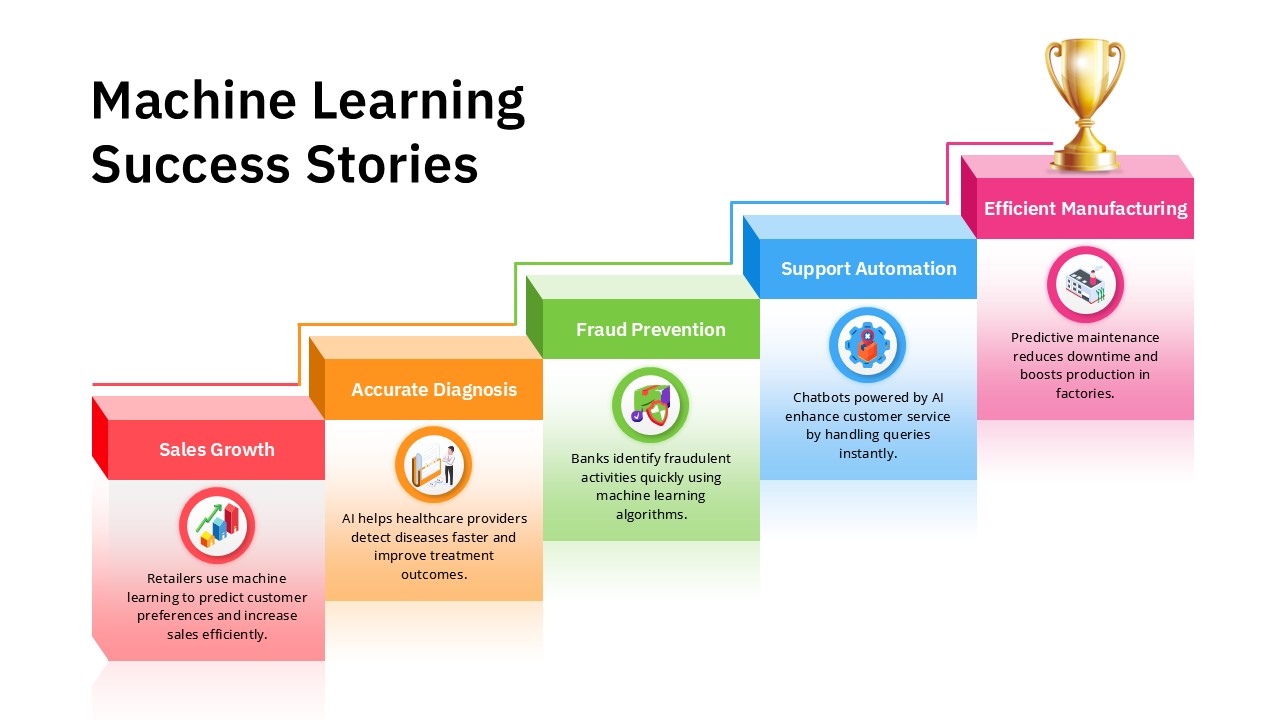
Machine Learning Success Stories Infographic Template for PowerPoint & Google Slides
Process
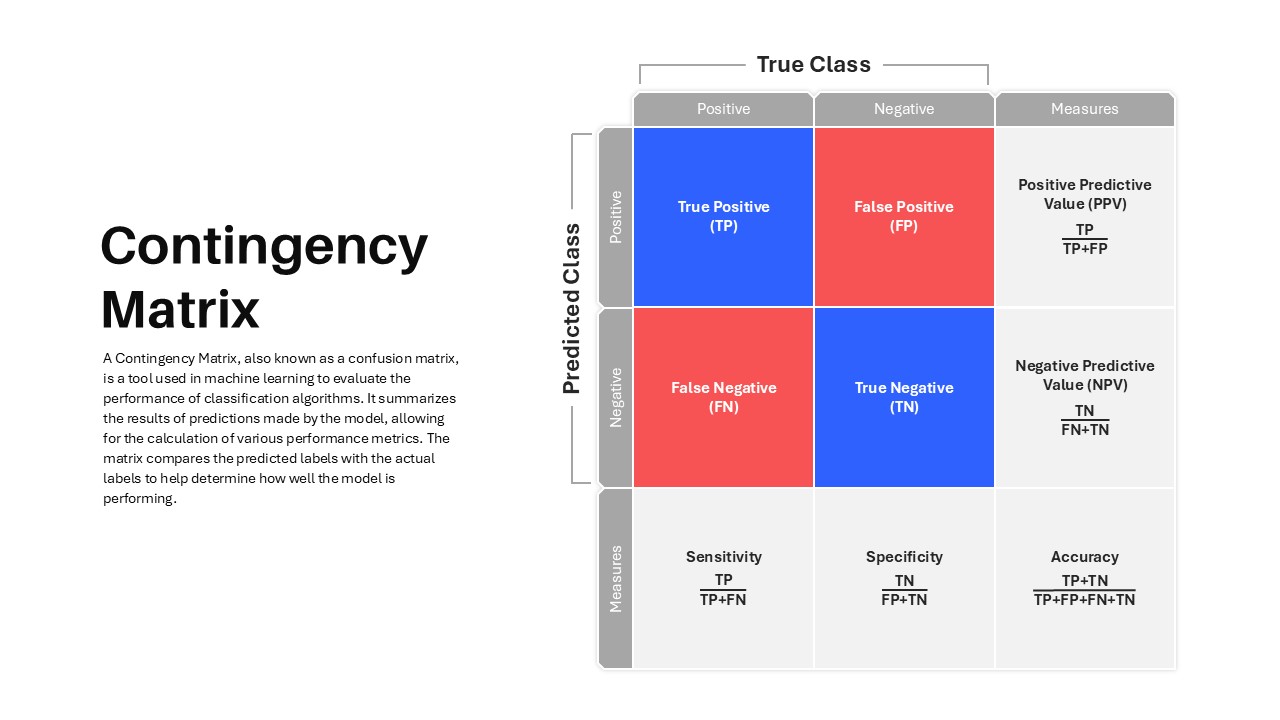
Contingency Matrix in Machine Learning template for PowerPoint & Google Slides
Technology
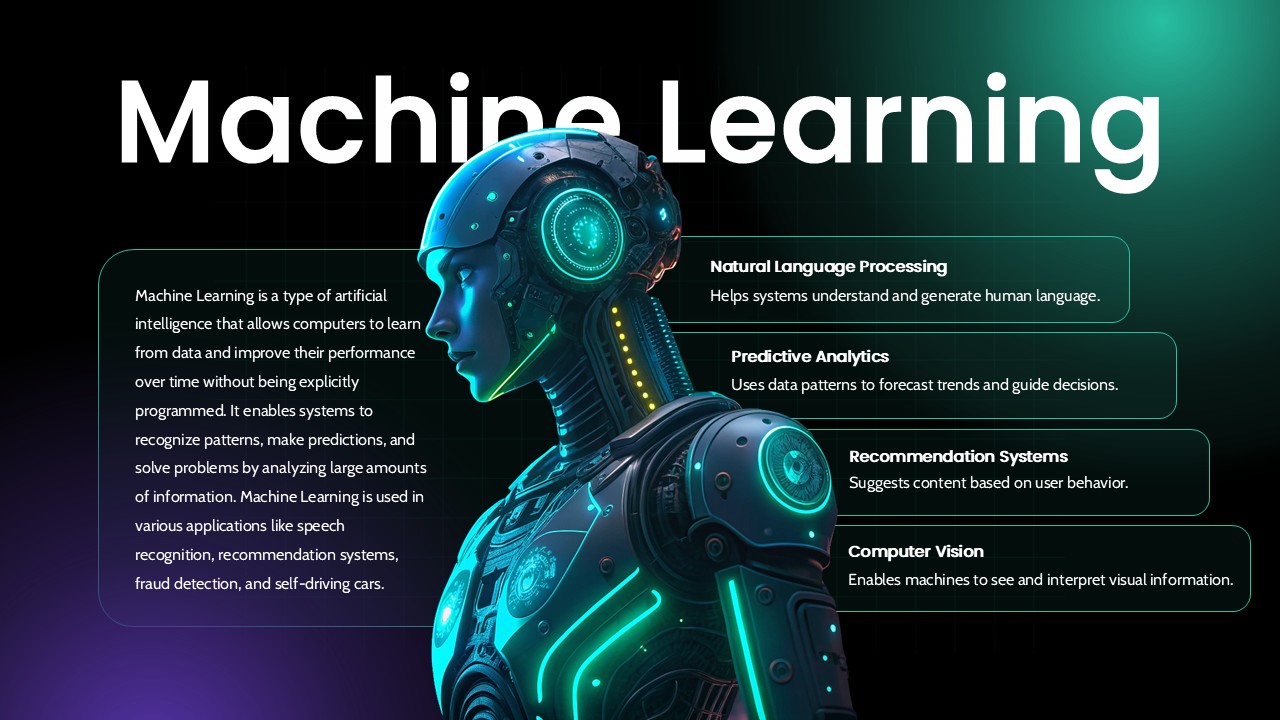
Machine Learning Overview Slide Template for PowerPoint & Google Slides
Machine Learning
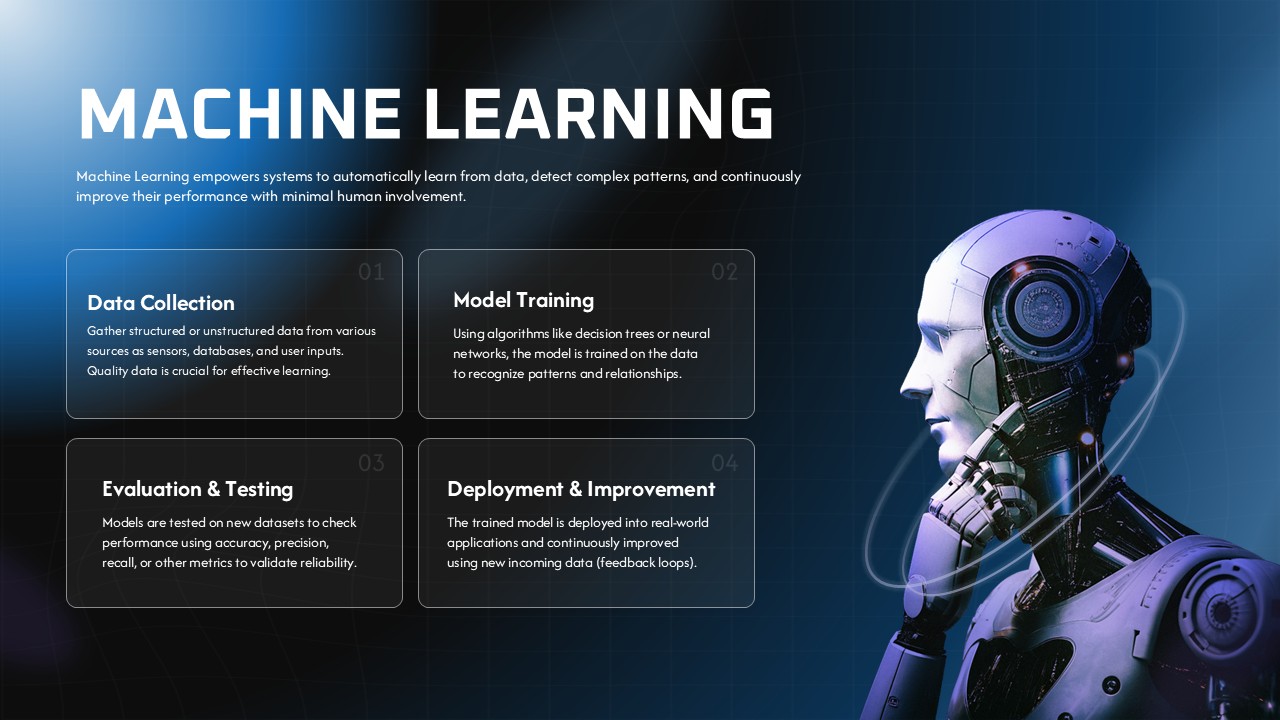
Machine Learning Four-Step Process Template for PowerPoint & Google Slides
Machine Learning
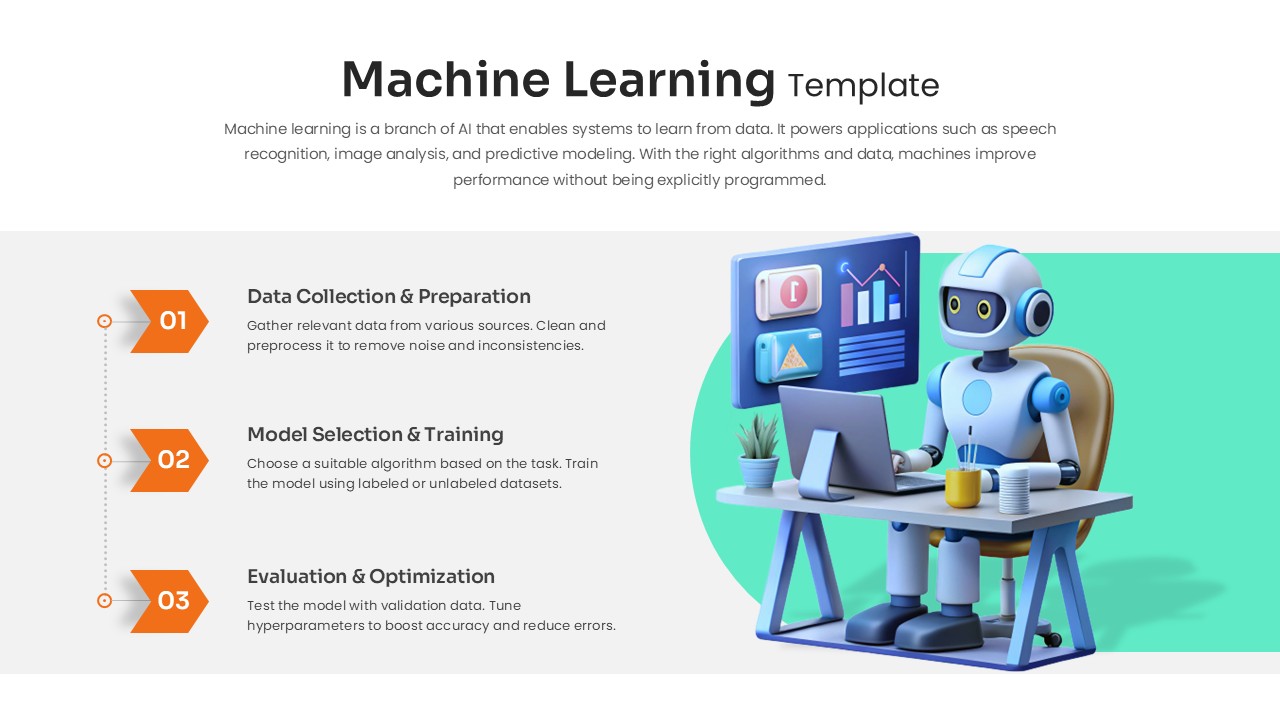
Machine Learning Three-Step Process Template for PowerPoint & Google Slides
Machine Learning
Free Machine Learning Concept Slide Template for PowerPoint & Google Slides
Machine Learning
Free
Futuristic Machine Learning Workflow Template for PowerPoint & Google Slides
Machine Learning
Futuristic Machine Learning Types Overview Template for PowerPoint & Google Slides
AI
Machine Learning Pipeline Overview Template for PowerPoint & Google Slides
Machine Learning
Machine Learning Presentation Use Cases Template for PowerPoint & Google Slides
Machine Learning
Machine Learning 4-Step Workflow Template for PowerPoint & Google Slides
Machine Learning
Machine Learning Model Management Template for PowerPoint & Google Slides
Machine Learning
Machine Learning Pipeline & MLOps Flow Template for PowerPoint & Google Slides
Machine Learning
Machine Learning Process Template for PowerPoint & Google Slides
Machine Learning
Seven Stage Machine Learning Pipeline Template for PowerPoint & Google Slides
Machine Learning
Machine Learning Model Training Template for PowerPoint & Google Slides
Machine Learning
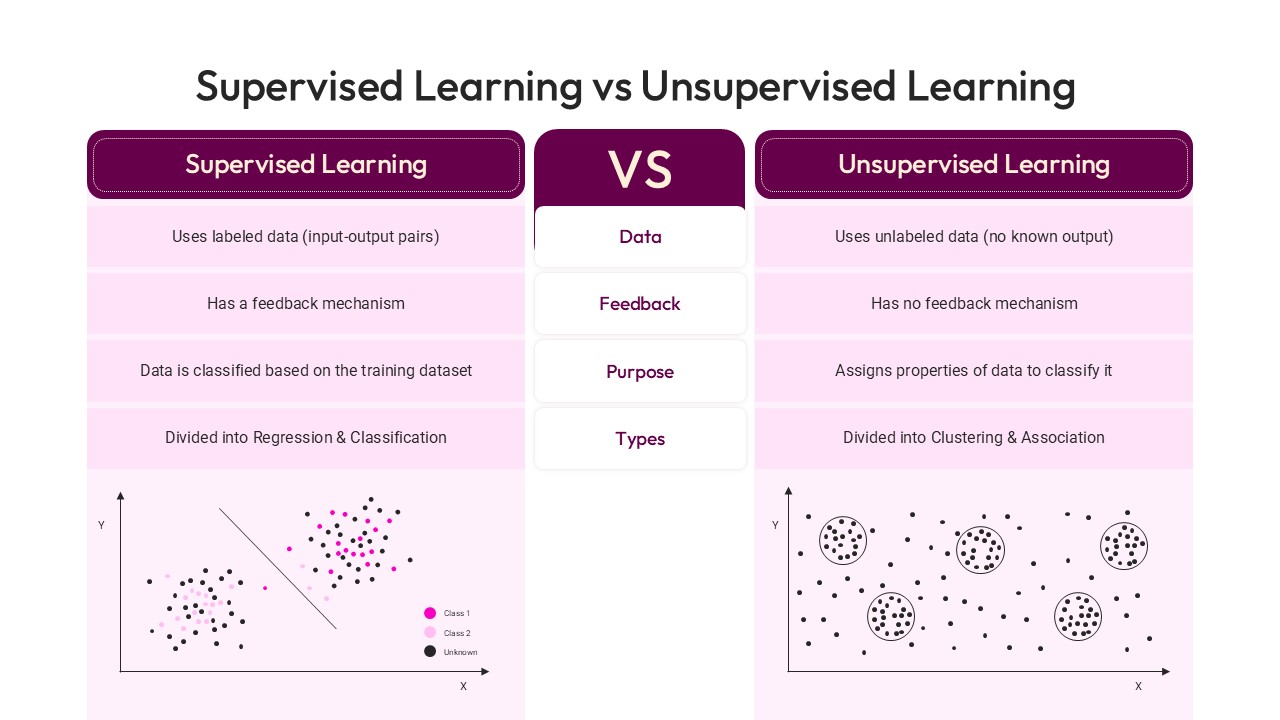
Supervised Learning vs Unsupervised Learning template for PowerPoint & Google Slides
Technology
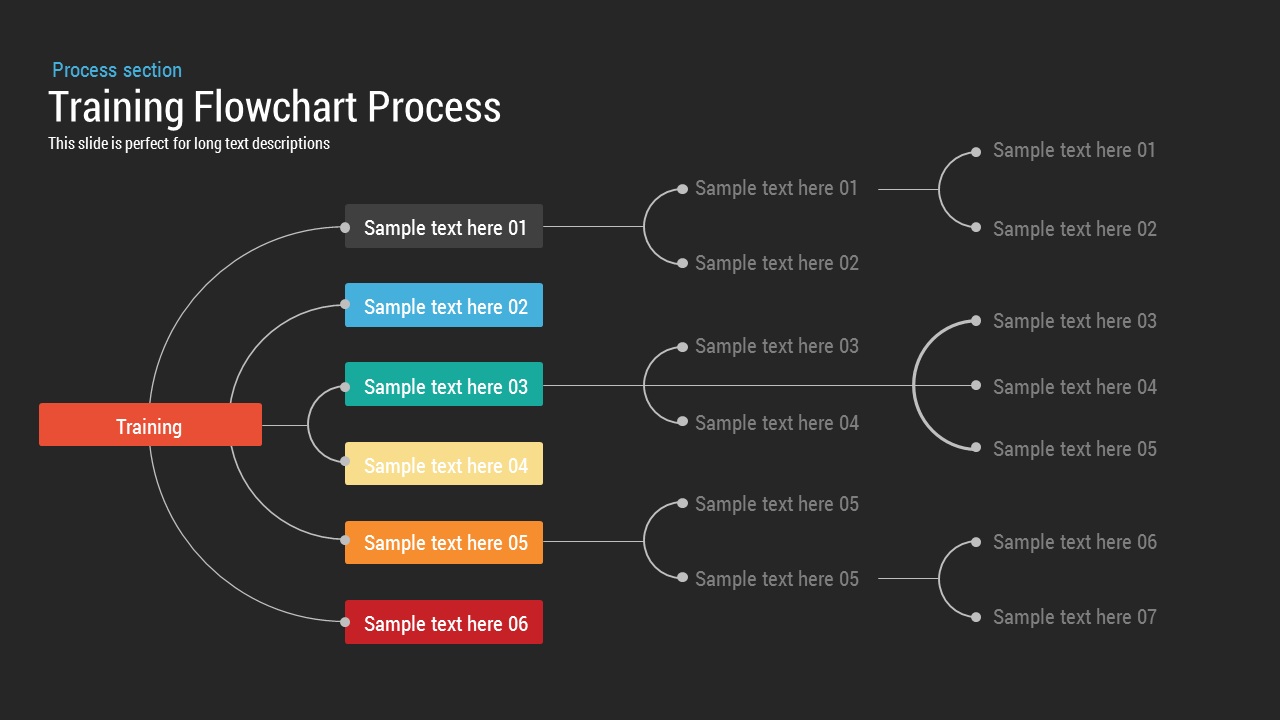
Training Flowchart template for PowerPoint & Google Slides
Flow Charts
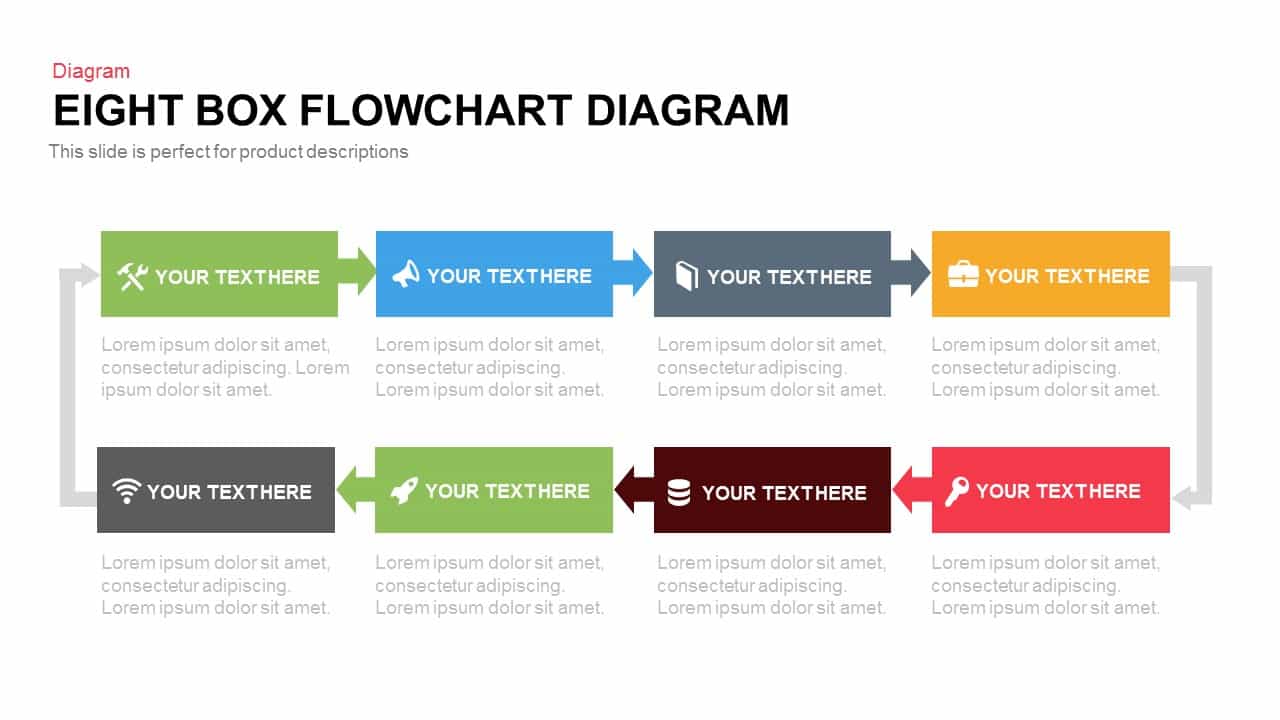
Eight Box Flowchart template for PowerPoint & Google Slides
Flow Charts

Planning Metaphor Flowchart Slide Template for PowerPoint & Google Slides
Process
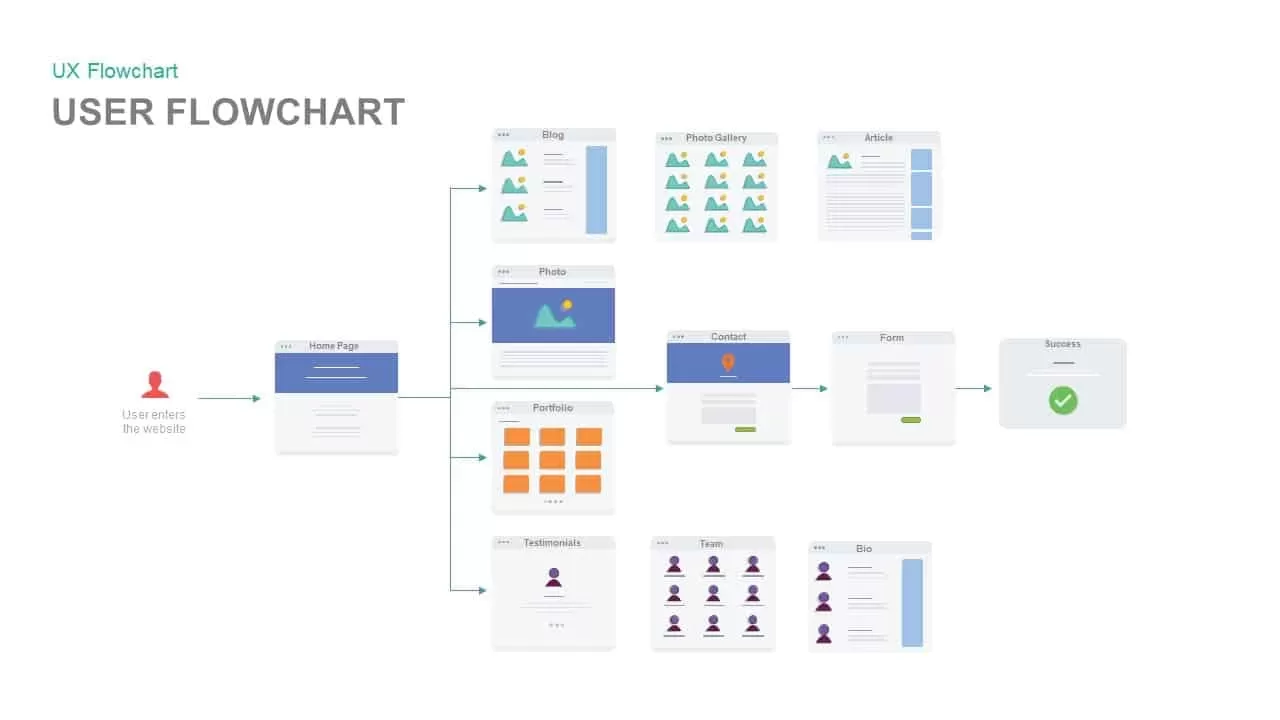
Website User Flowchart Diagram Template for PowerPoint & Google Slides
Process

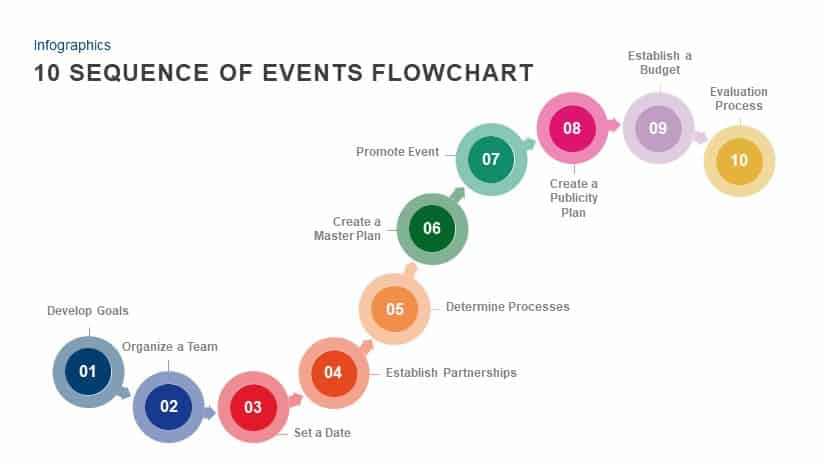
10 Sequence of Events Flowchart template for PowerPoint & Google Slides
Flow Charts
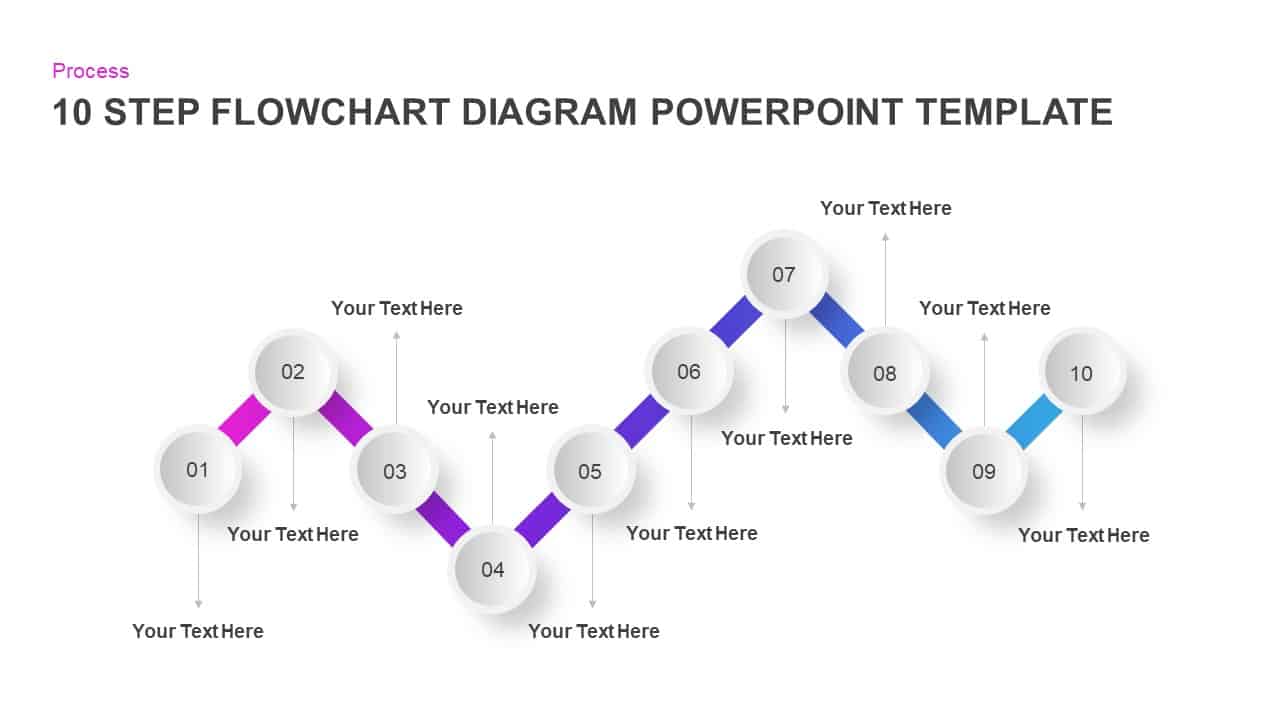
Gradient Ten-Step Flowchart Diagram Template for PowerPoint & Google Slides
Process
Three-Step Flowchart Process Diagram Template for PowerPoint & Google Slides
Flow Charts
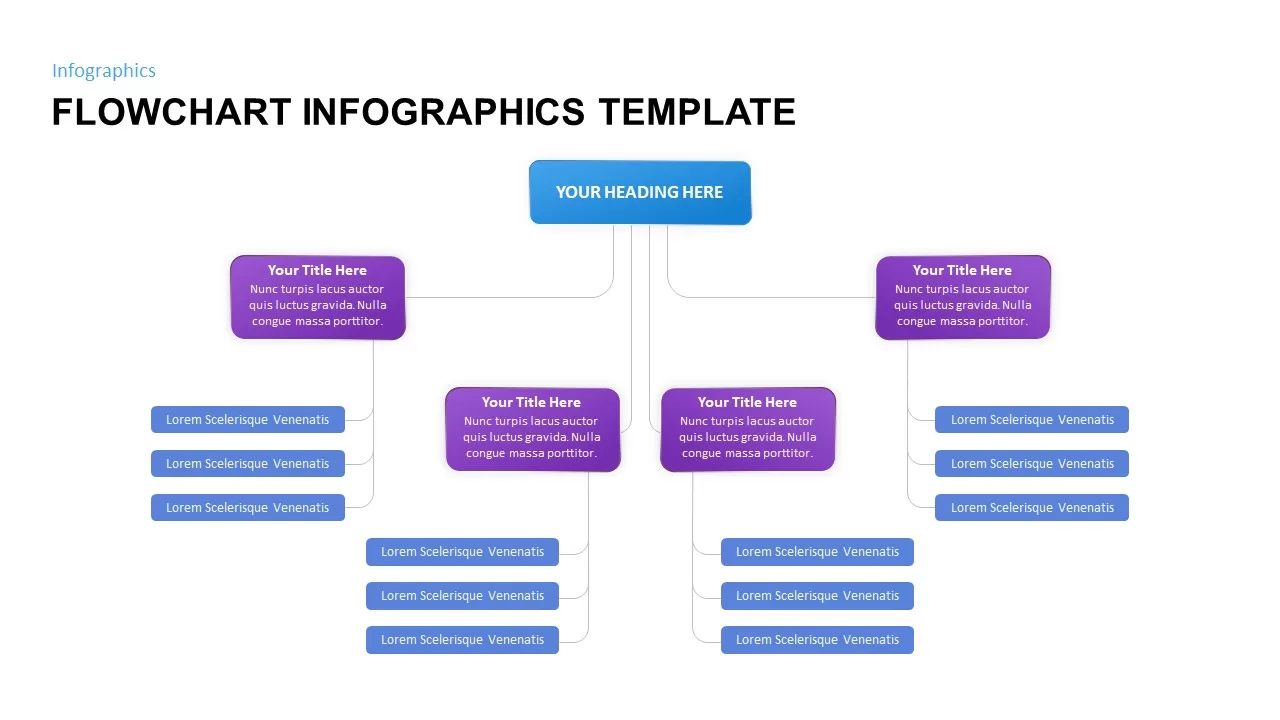
Flowchart Infographics Template for PowerPoint & Google Slides
Infographics
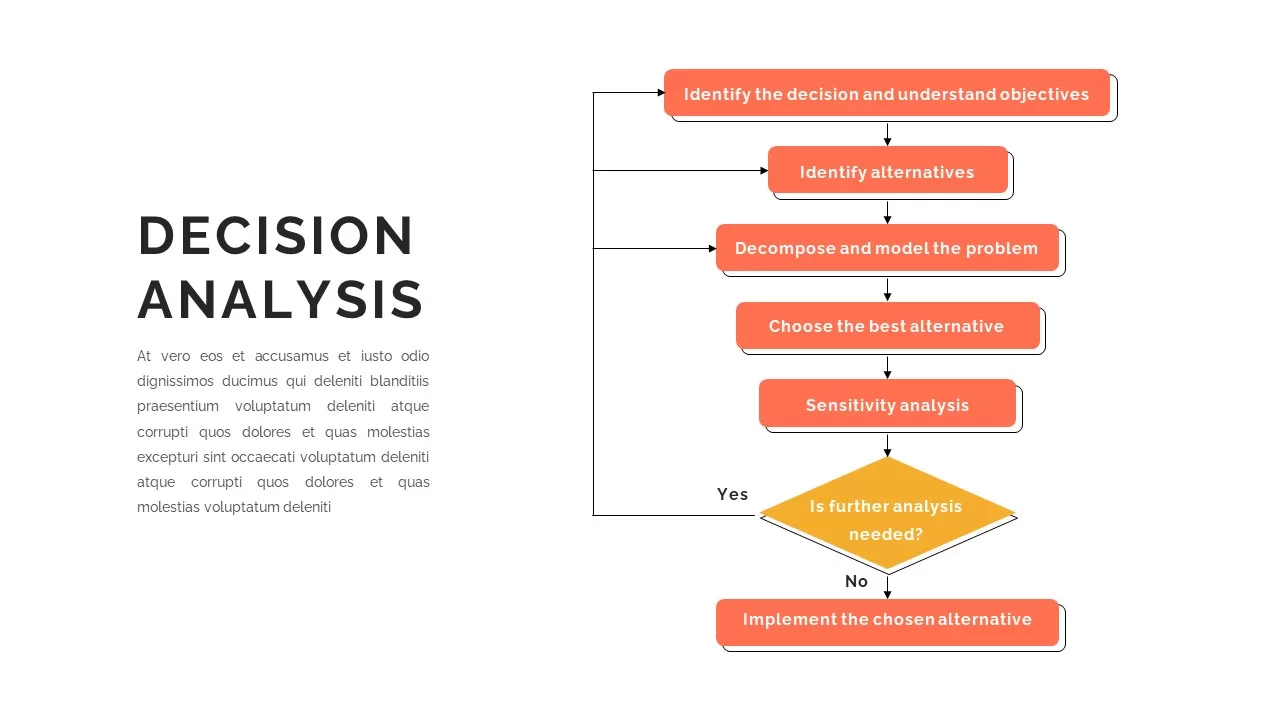
Decision Analysis Process Flowchart Template for PowerPoint & Google Slides
Flow Charts
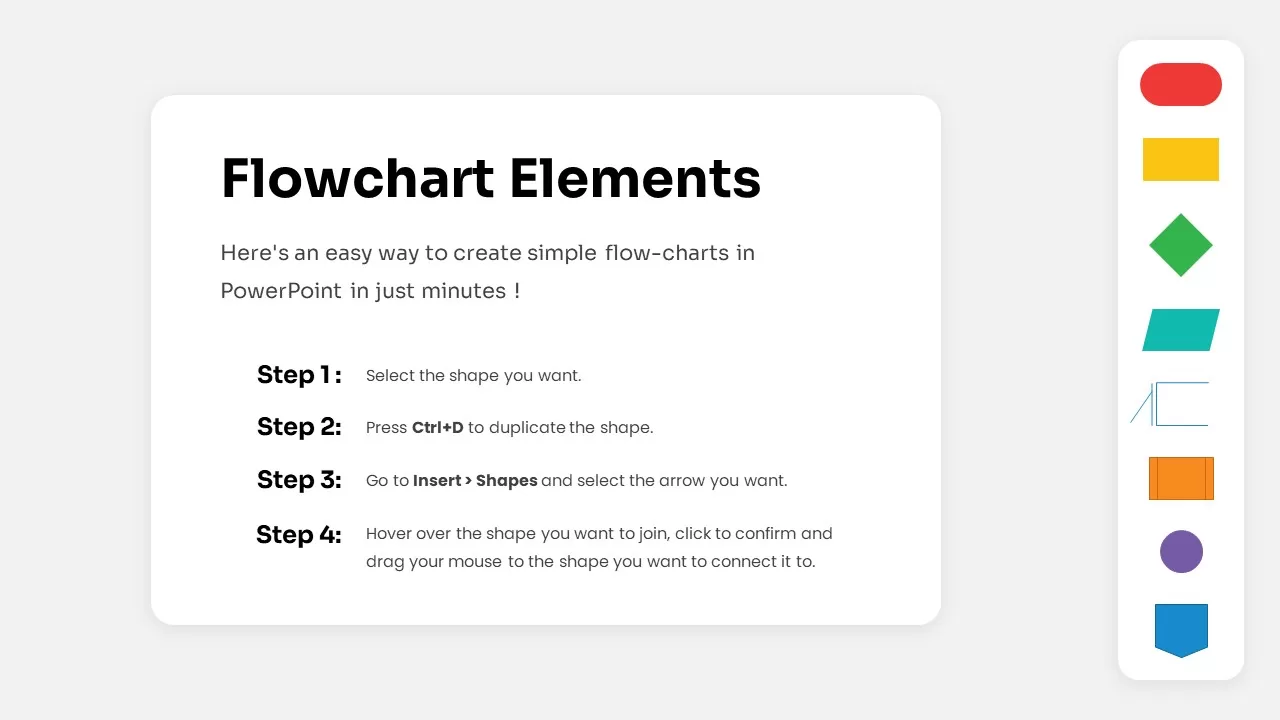
Free Flowchart Elements Tutorial Slide Template for PowerPoint & Google Slides
Flow Charts
Free
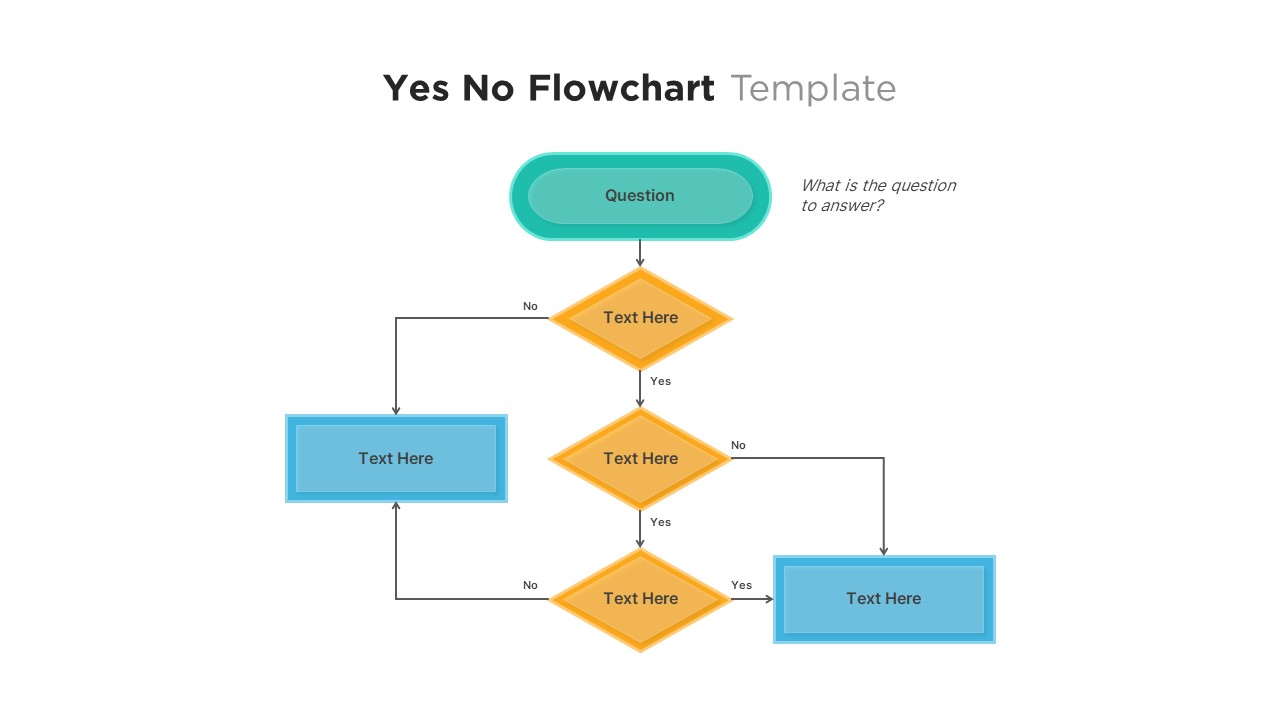
Professional Yes No Decision Flowchart Template for PowerPoint & Google Slides
Flow Charts
Simple Flowchart Process Diagram Template for PowerPoint & Google Slides
Flow Charts
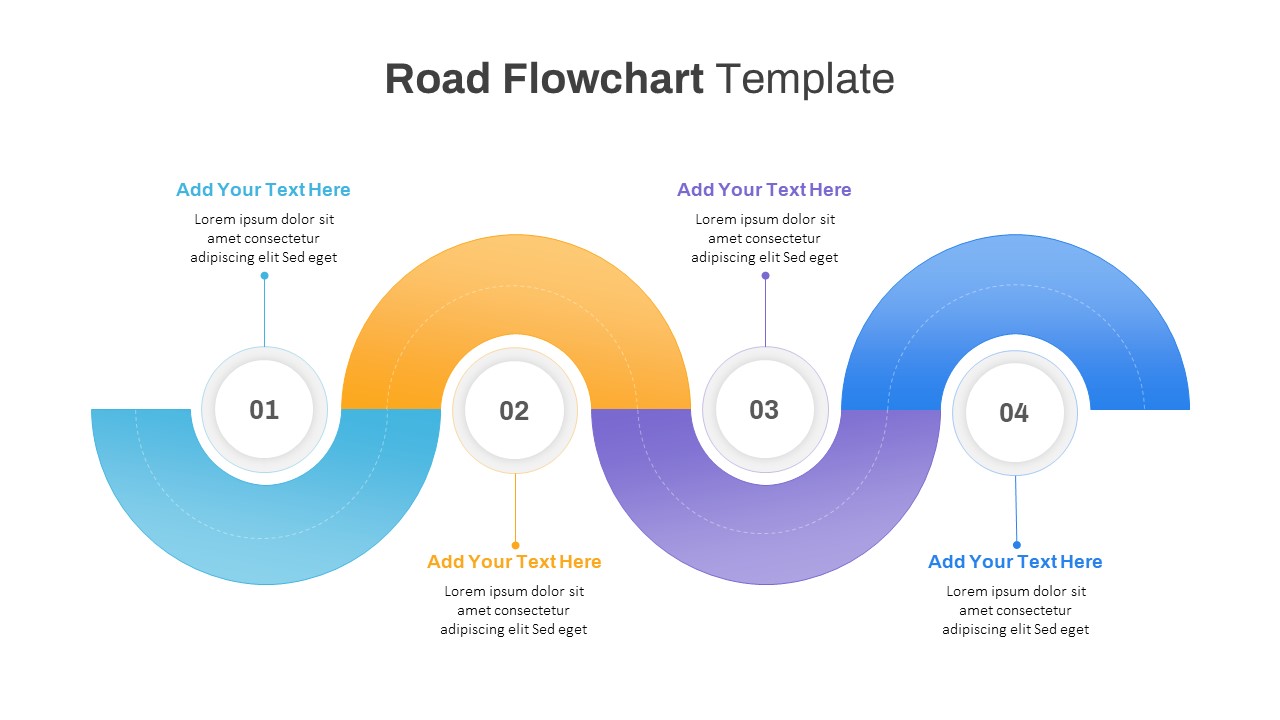
Road Flowchart Process with Four Steps Template for PowerPoint & Google Slides
Flow Charts
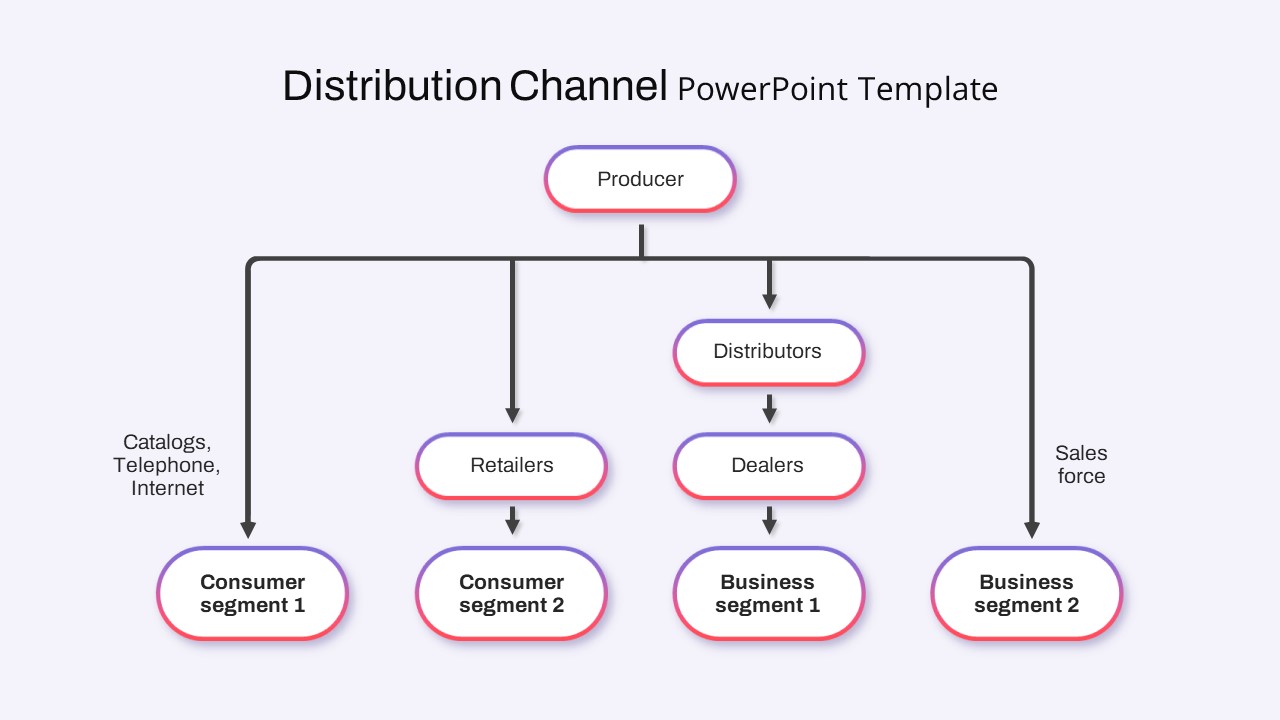
Distribution Channel Flowchart Template for PowerPoint & Google Slides
Business Models
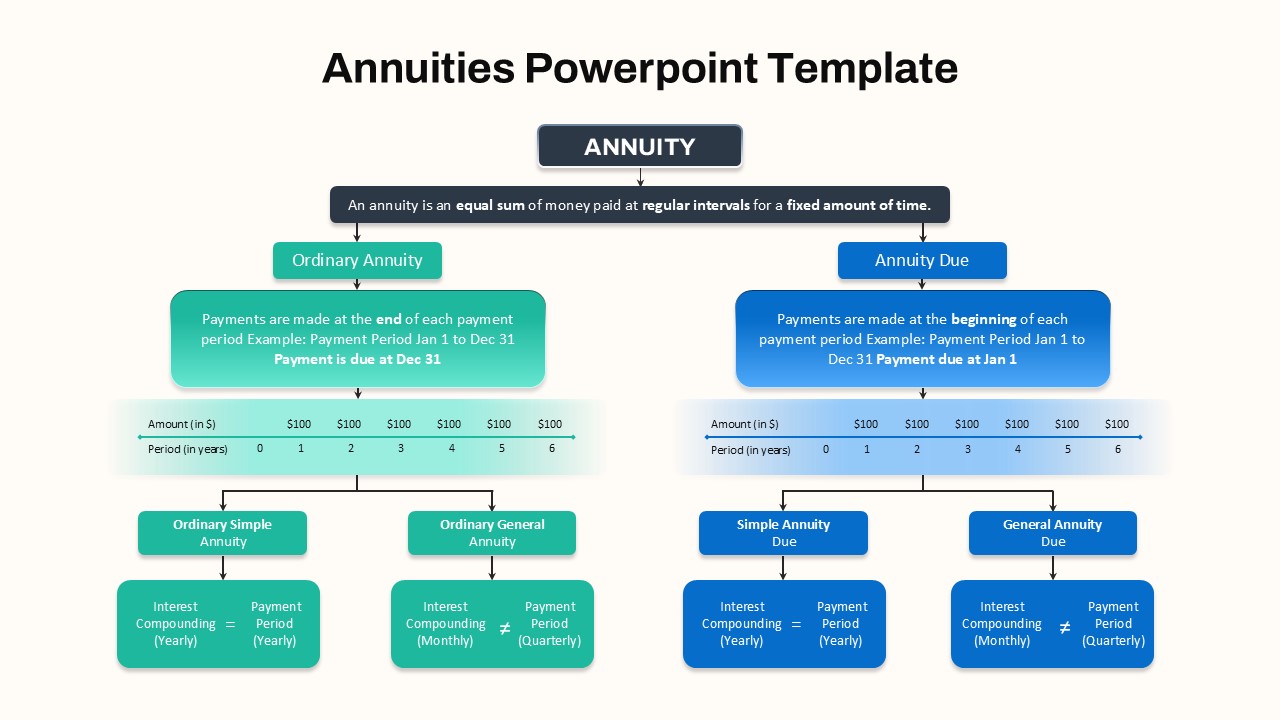
Hierarchical Annuity Comparison Flowchart Template for PowerPoint & Google Slides
Business Report
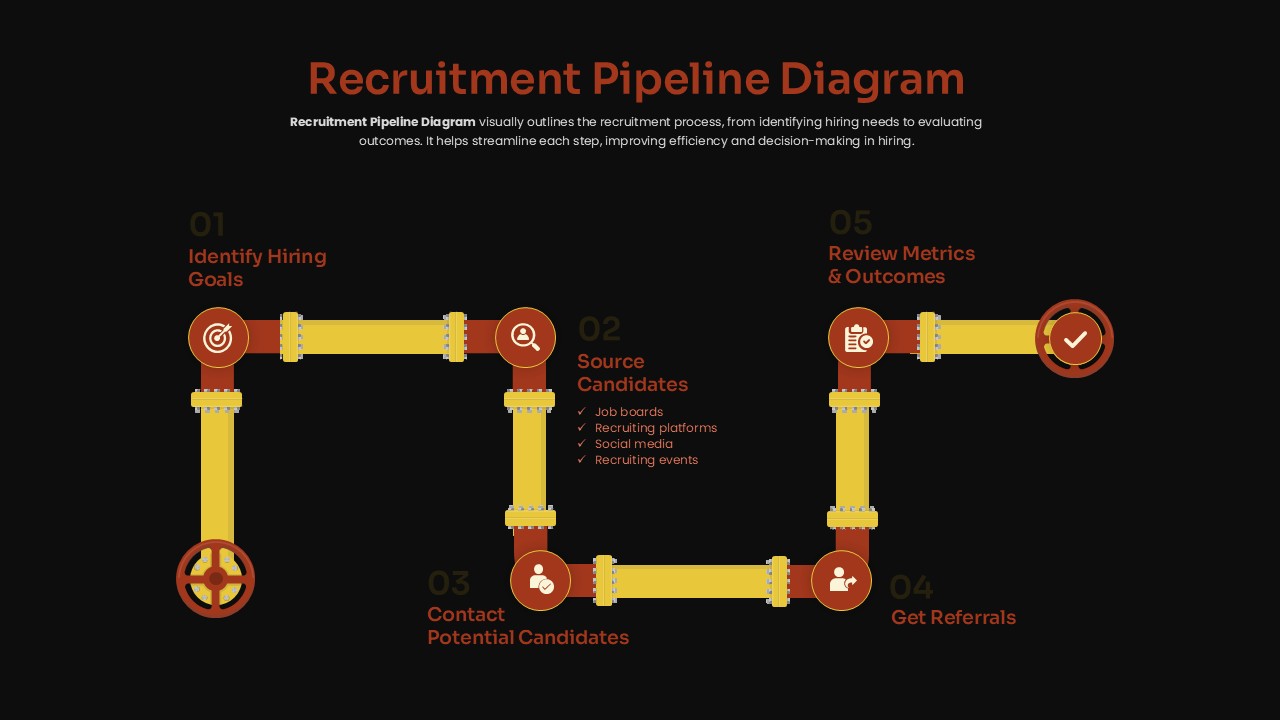
Recruitment Pipeline Flowchart Diagram Template for PowerPoint & Google Slides
Process
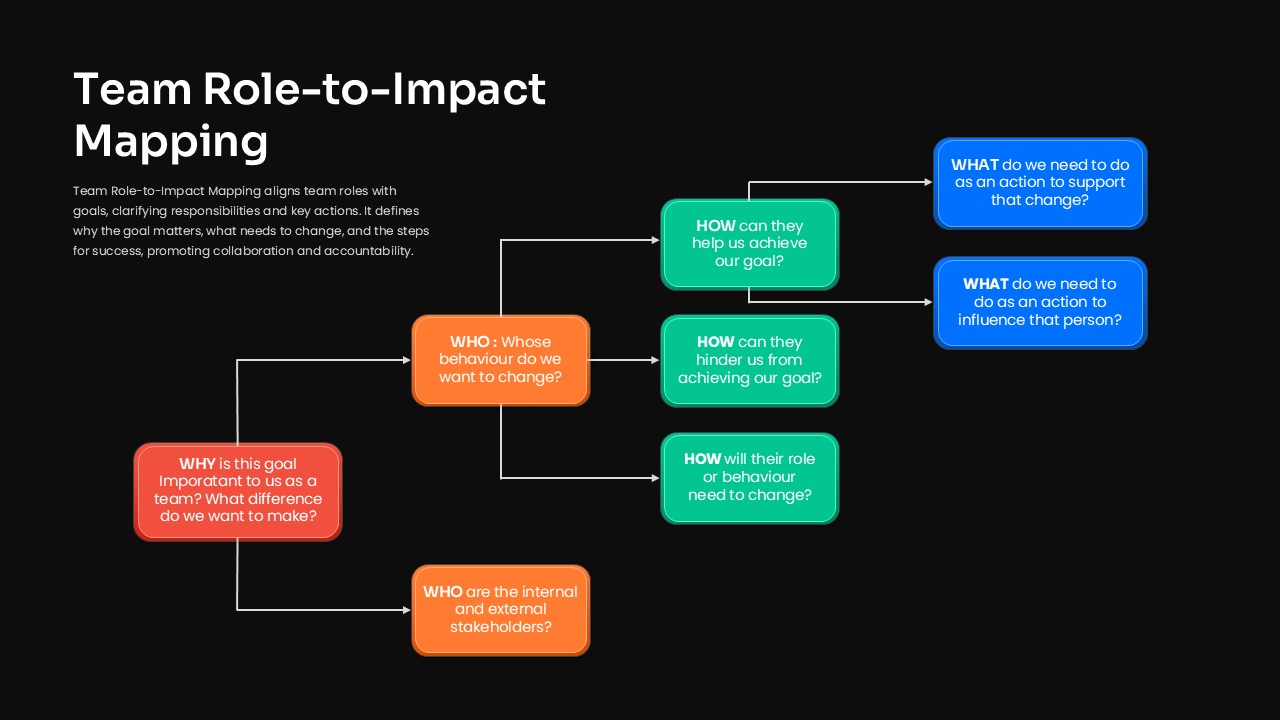
Team Role-to-Impact Mapping Flowchart Template for PowerPoint & Google Slides
Process
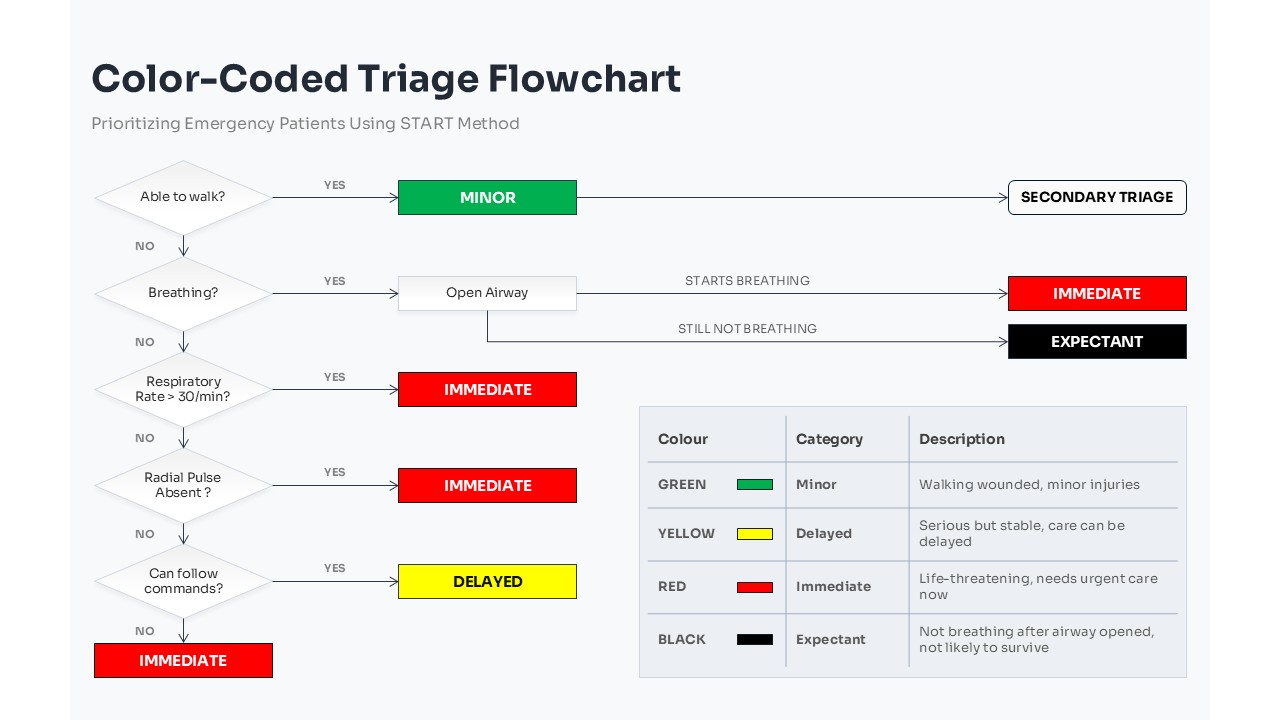
Color-Coded Medical Triage Flowchart Template for PowerPoint & Google Slides
Flow Charts
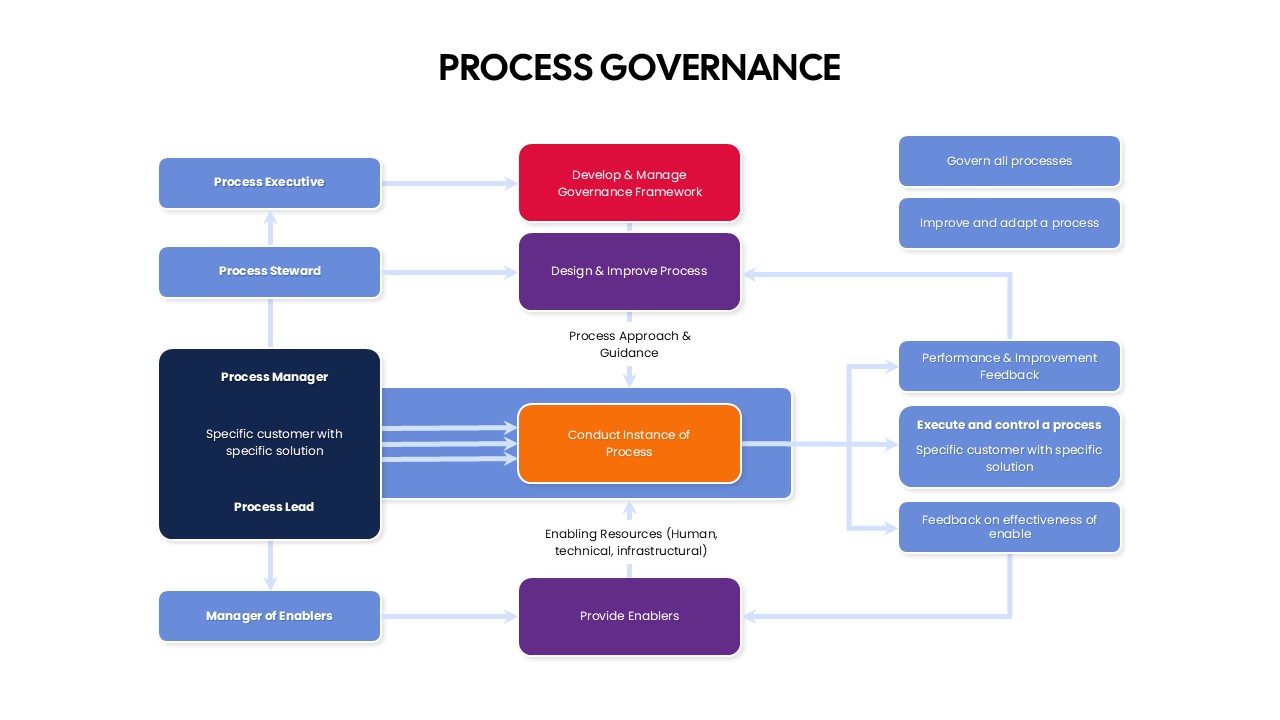
Process Governance Framework Flowchart Template for PowerPoint & Google Slides
Flow Charts
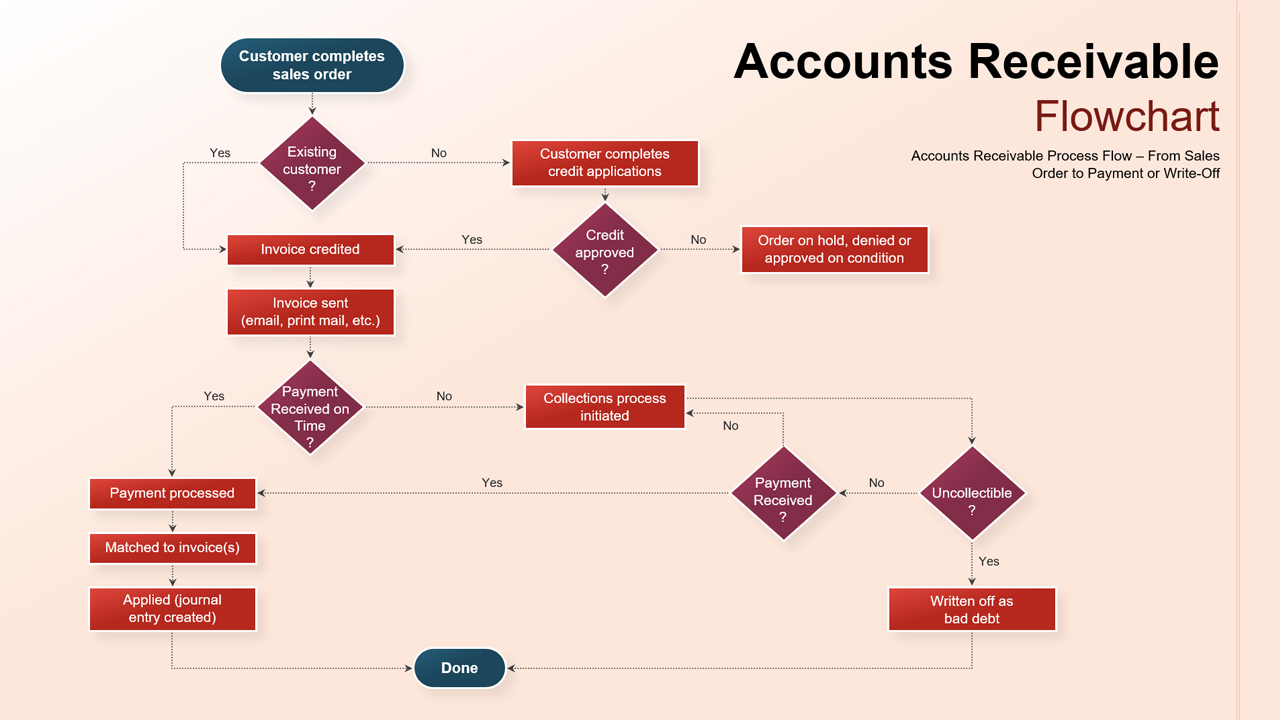
Accounts Receivable Process Flowchart Template for PowerPoint & Google Slides
Flow Charts
E-Learning Report Analysis Template for PowerPoint & Google Slides
Infographics
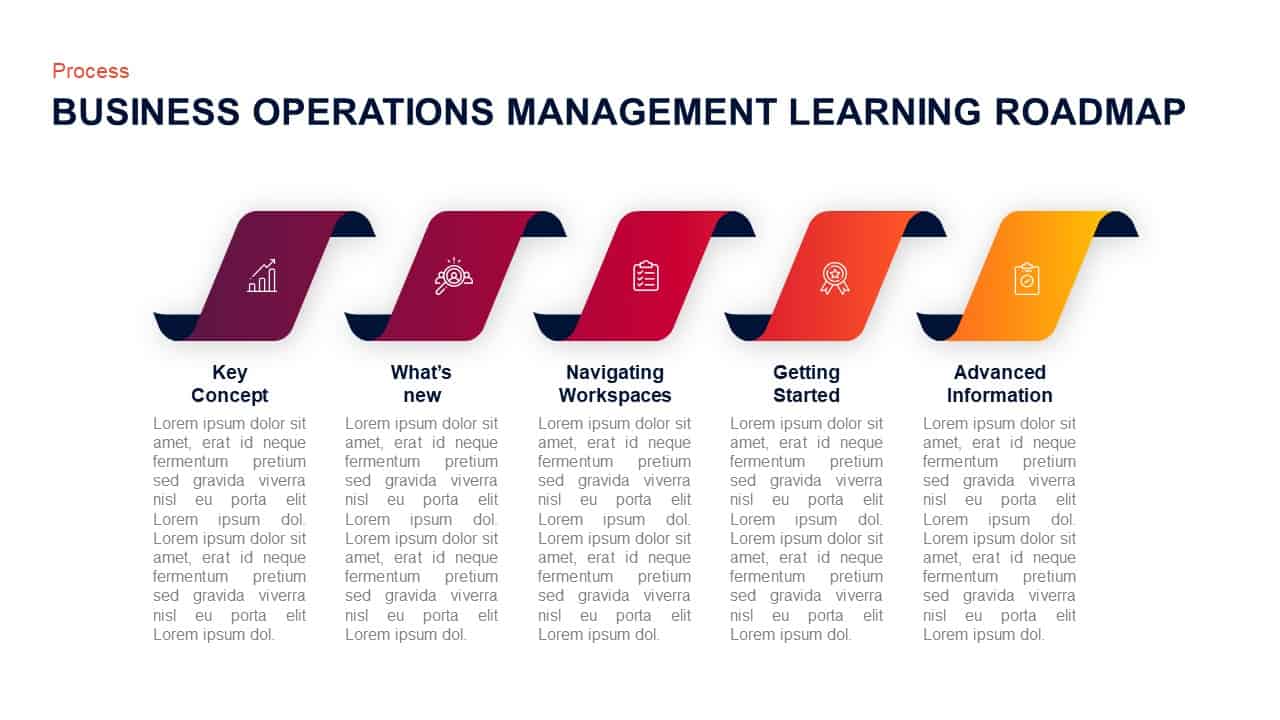
Operations Management Learning Roadmap Template for PowerPoint & Google Slides
Roadmap
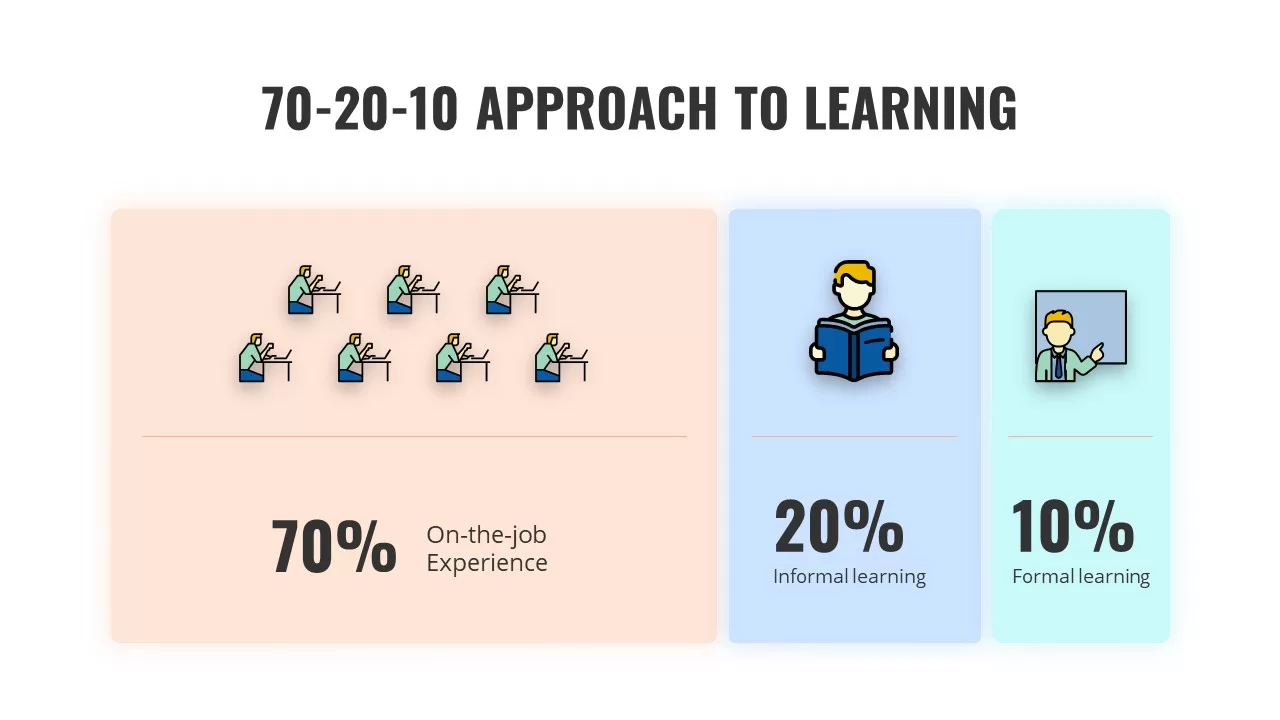
70-20-10 Learning Approach Infographic Template for PowerPoint & Google Slides
Process

4MAT Learning Cycle Circular Diagram Template for PowerPoint & Google Slides
Circular
Free Stylish E-Learning Presentation Template for PowerPoint & Google Slides
Pitch Deck
Free
Online Learning PowerPoint Template for PowerPoint & Google Slides
Customer Journey
E-Learning Education Presentation Deck Template for PowerPoint & Google Slides
Decks
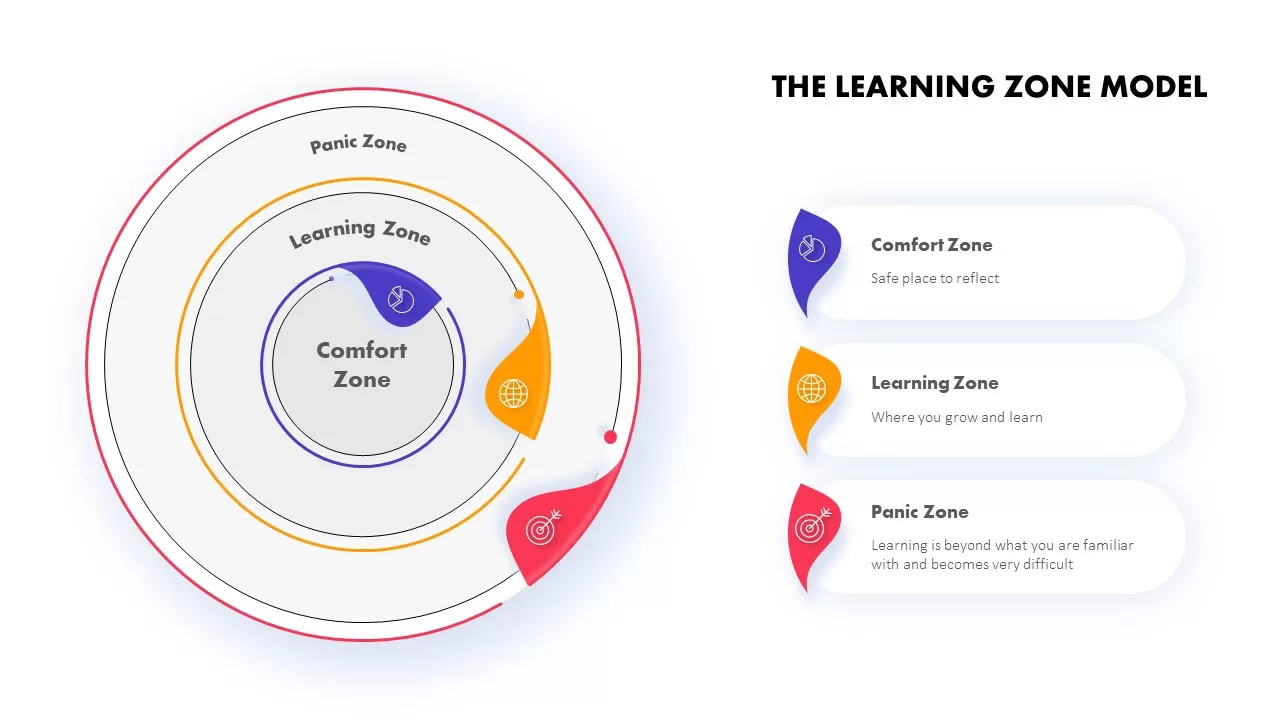
The Learning Zone Model Template for PowerPoint & Google Slides
Process
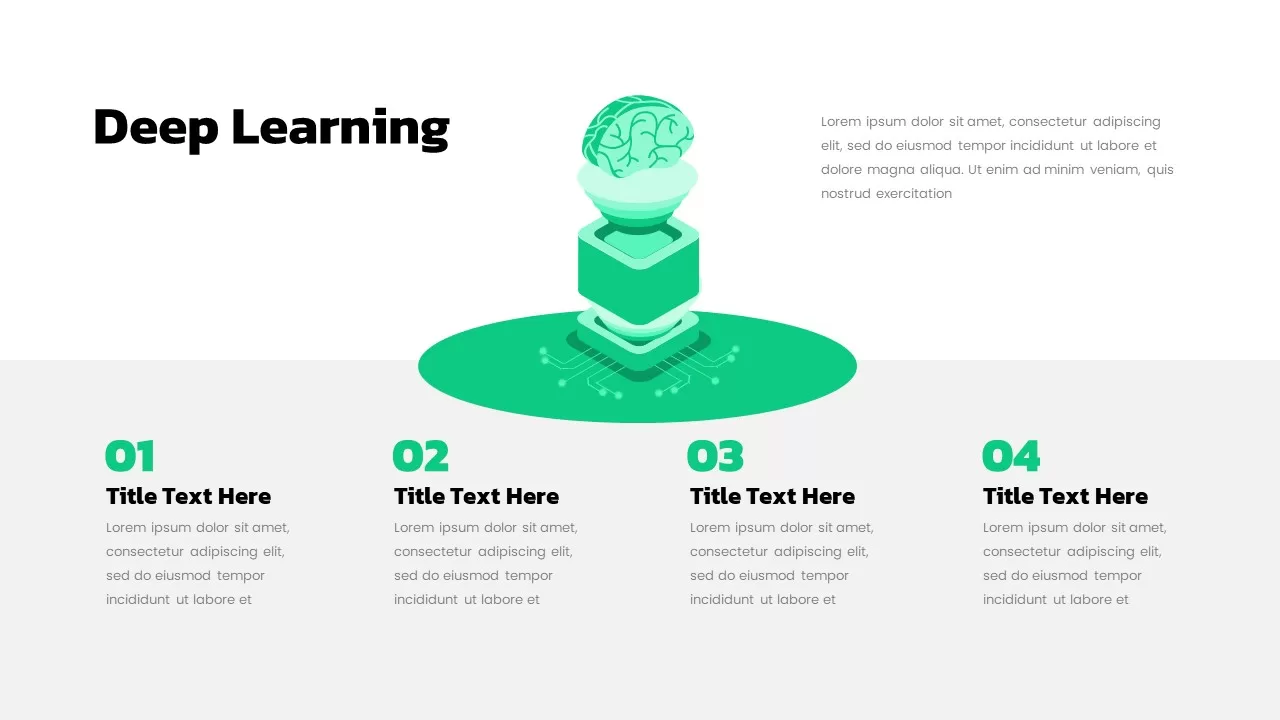
Deep Learning Concept Illustration Template for PowerPoint & Google Slides
Machine Learning
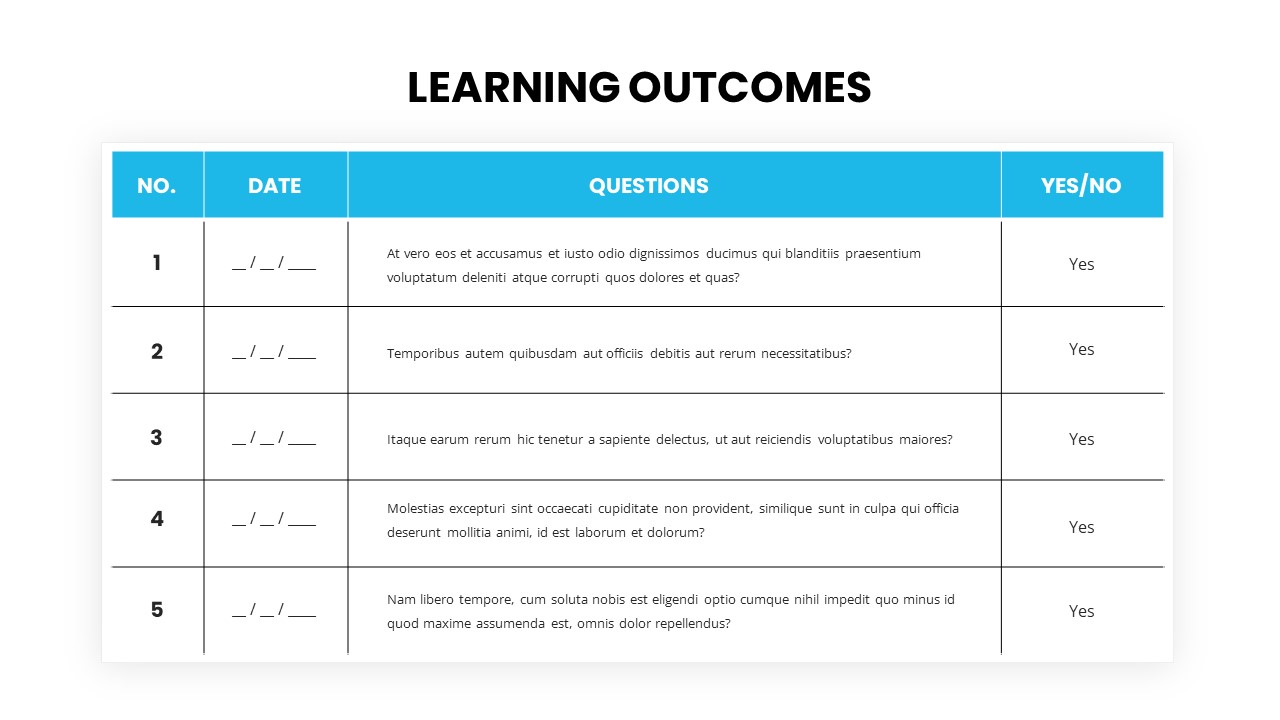
Learning Outcomes table template for PowerPoint & Google Slides
Charts

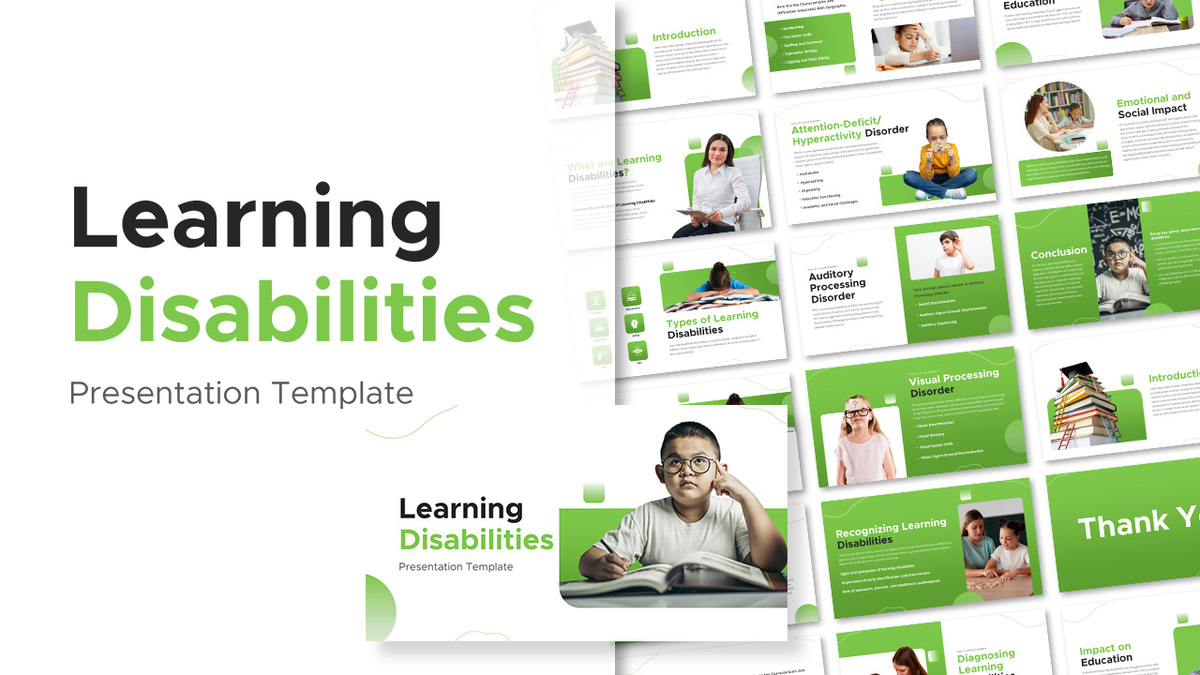
Learning Disabilities Presentation Template for PowerPoint & Google Slides
Company Profile
Free Learning Retention Pyramid Chart Template for PowerPoint & Google Slides
Pyramid
Free
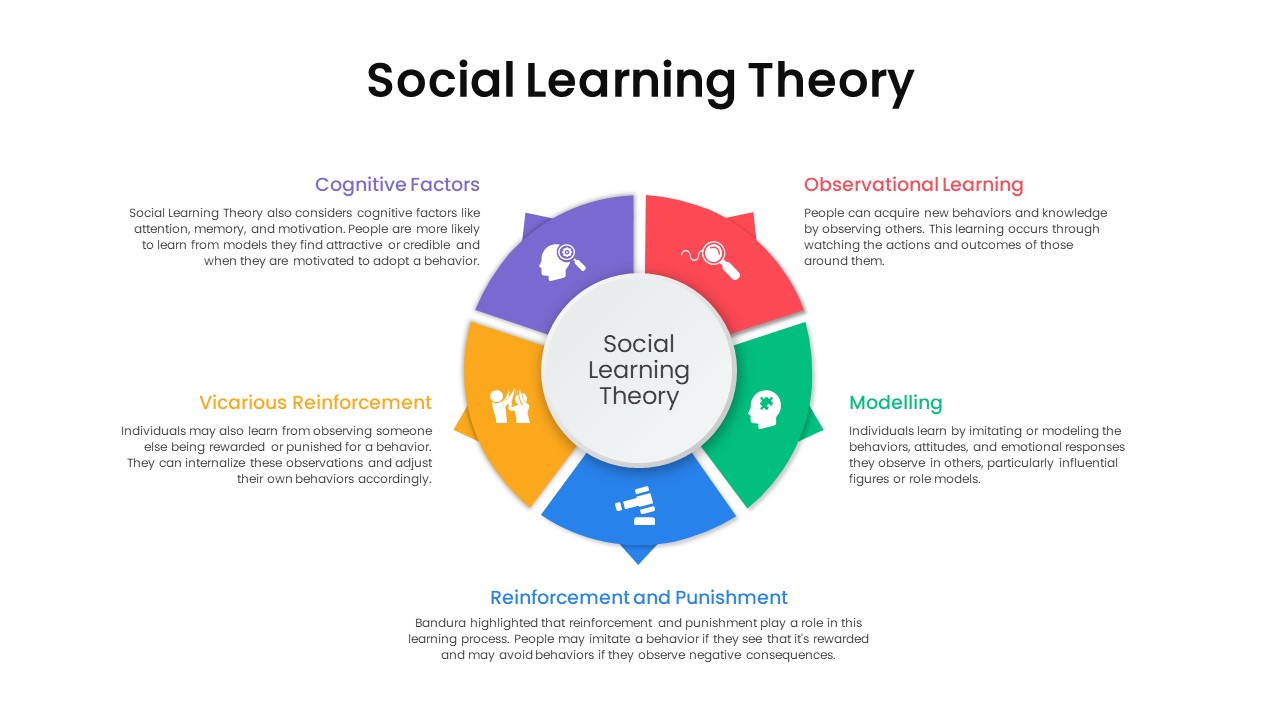
Social Learning Theory Infographic Template for PowerPoint & Google Slides
Circular
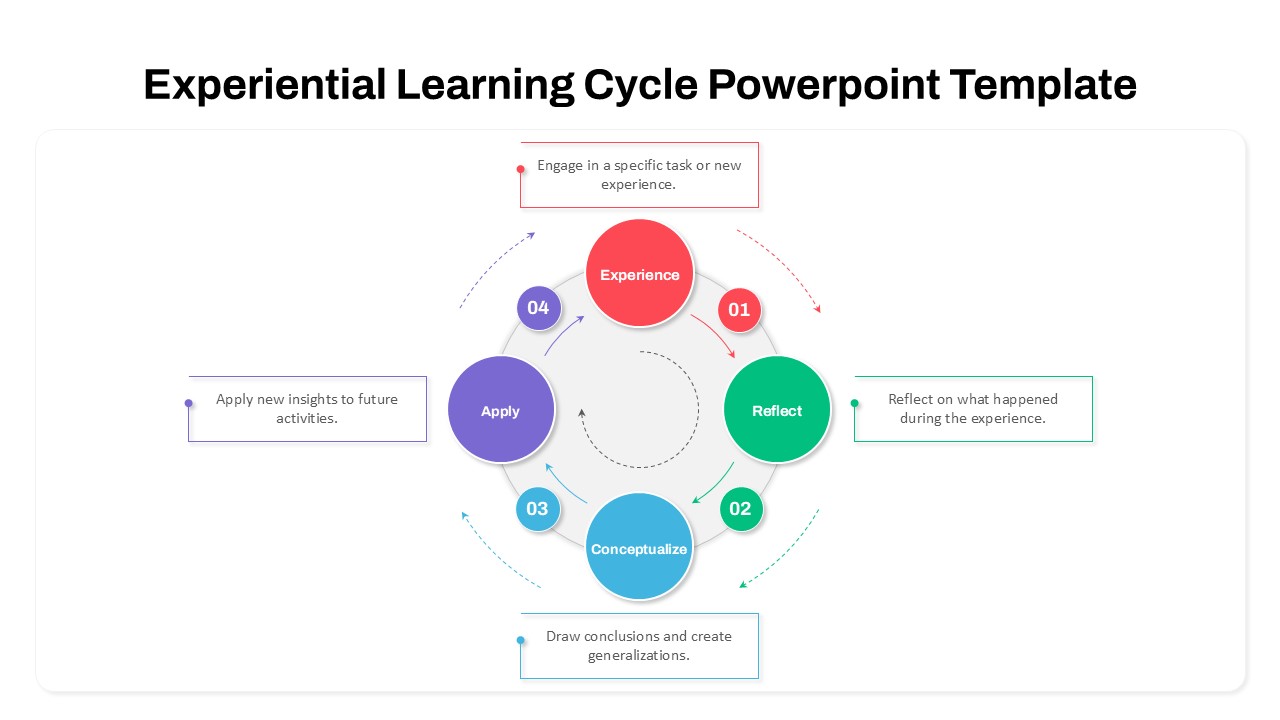
Experiential Learning Cycle Diagram Template for PowerPoint & Google Slides
Circular
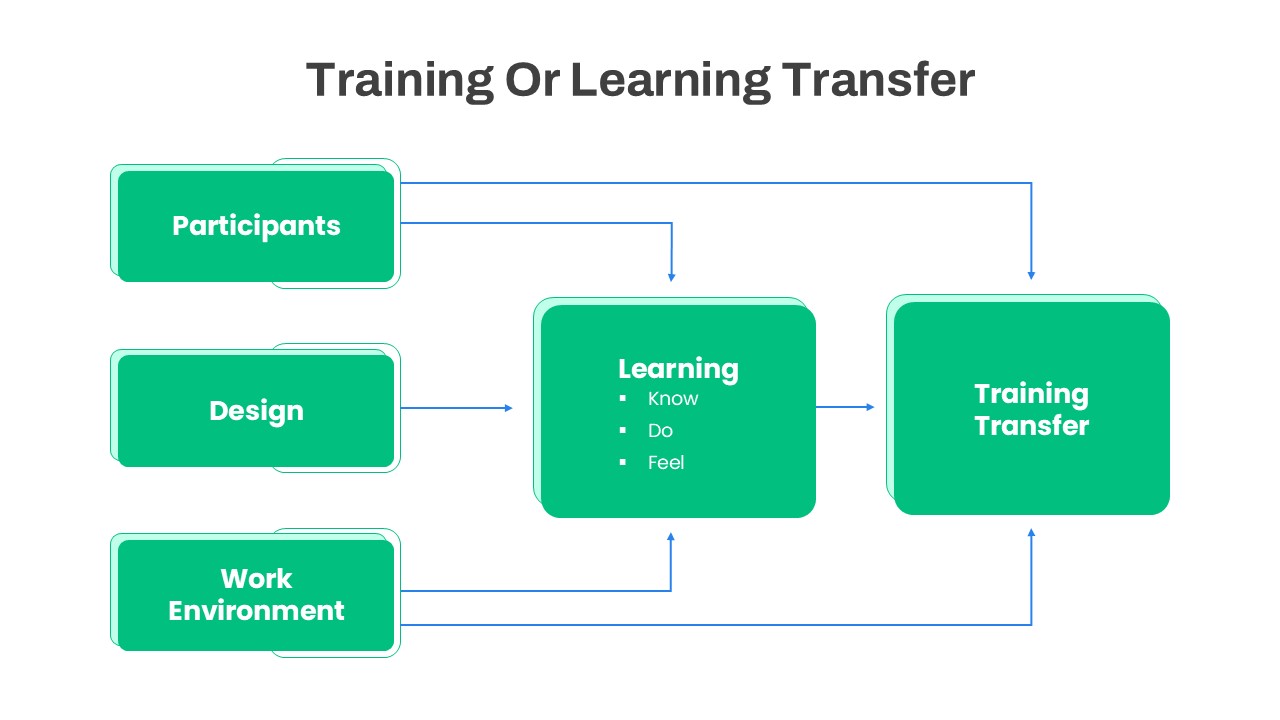
Training or Learning Transfer PowerPoint Template for PowerPoint & Google Slides
Business Proposal
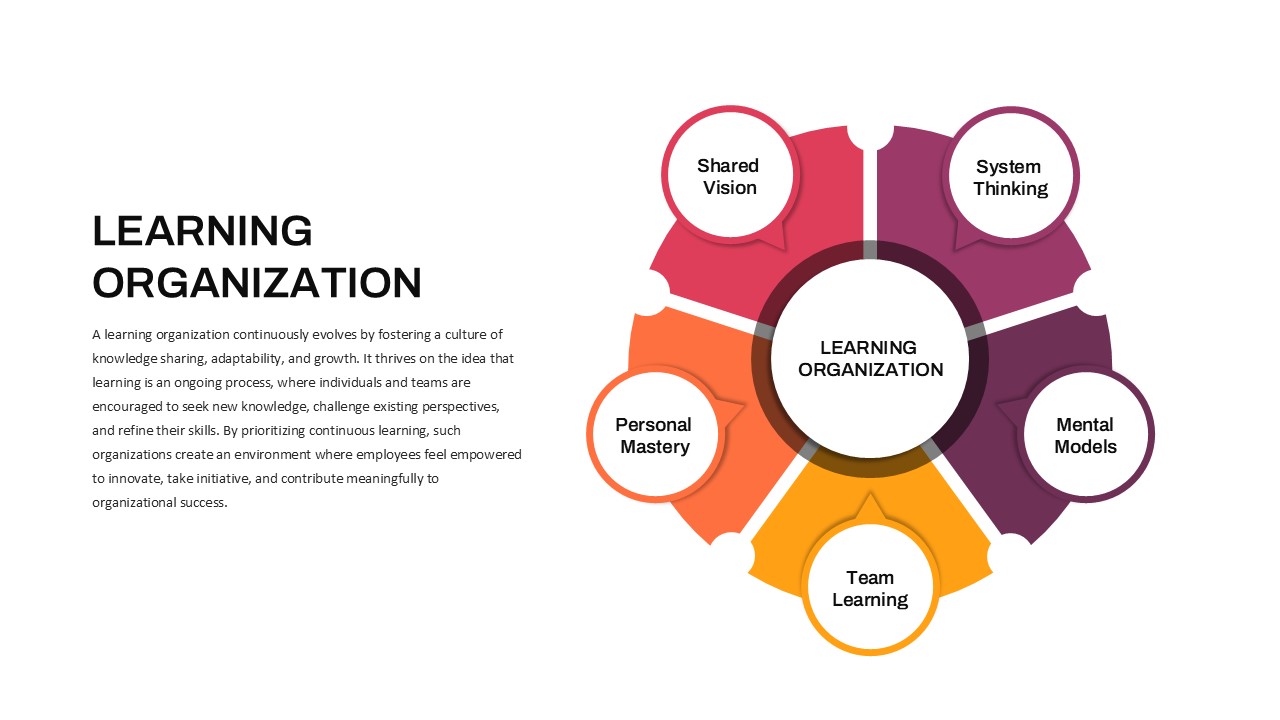
Learning Organization PowerPoint Template for PowerPoint & Google Slides
Business Strategy
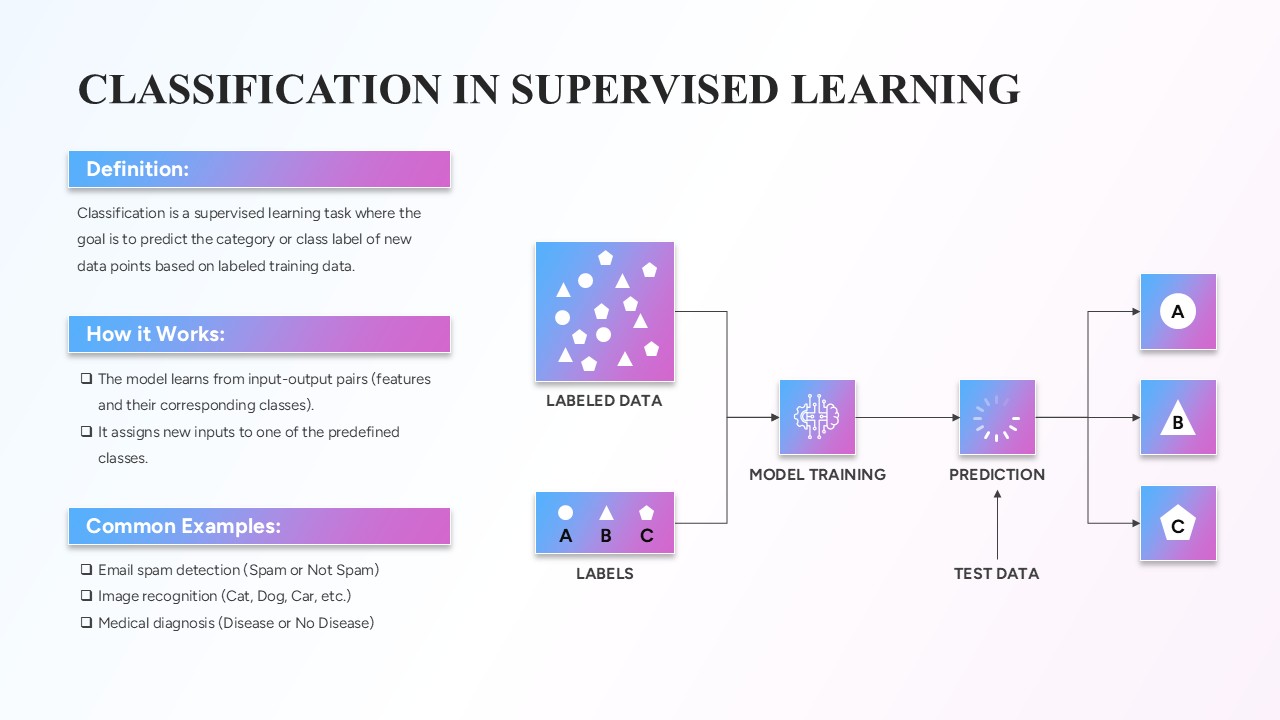
Classification in Supervised Learning template for PowerPoint & Google Slides
Infographics
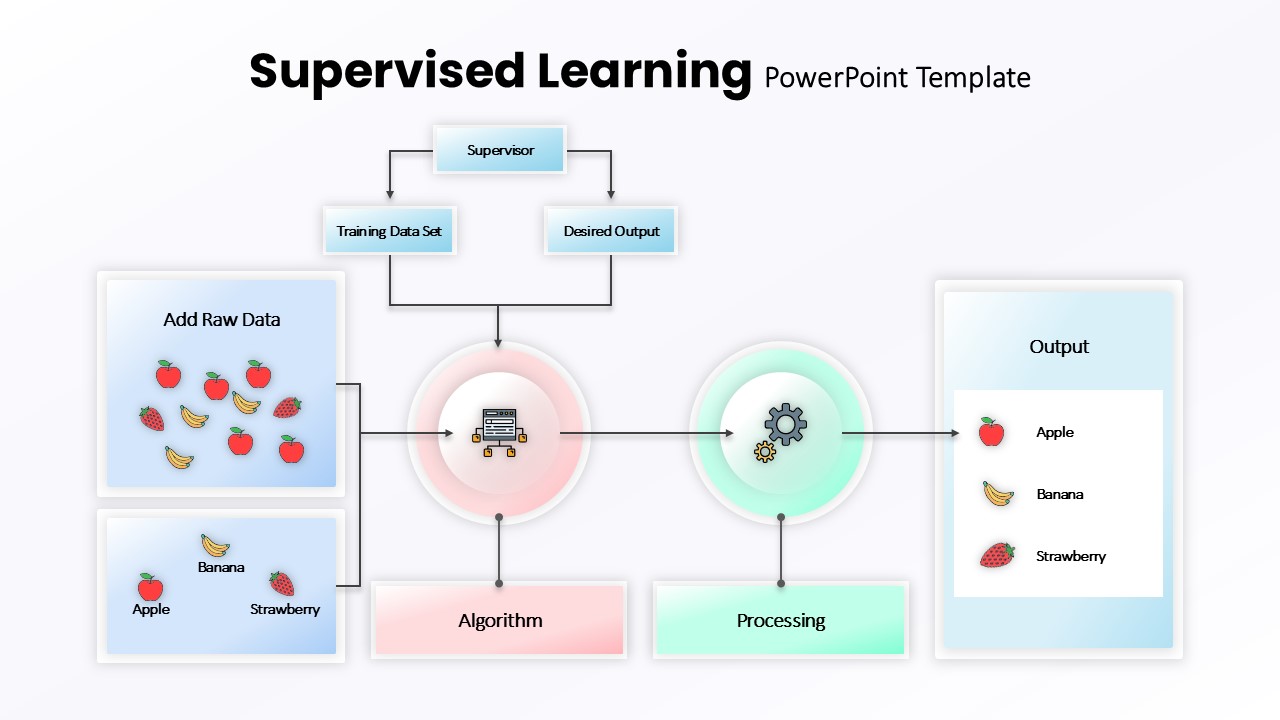
Supervised Learning Overview template for PowerPoint & Google Slides
Technology
Transfer Learning Process template for PowerPoint & Google Slides
Technology
Self-supervised Learning Process template for PowerPoint & Google Slides
Technology
Reinforcement Learning Diagram Dark Template for PowerPoint & Google Slides
Machine Learning
Semi-Supervised Learning Flow Diagram Template for PowerPoint & Google Slides
Machine Learning
Deep Q Networks in Reinforcement Learning template for PowerPoint & Google Slides
Technology
Learning Agility template for PowerPoint & Google Slides
Business
Regression in Supervised Learning Overview template for PowerPoint & Google Slides
Process
Learning Path Infographic Template for PowerPoint & Google Slides
Process
Q-Learning Process Flow Diagram Template for PowerPoint & Google Slides
Process
Decision Trees in Supervised Learning Template for PowerPoint & Google Slides
Machine Learning
Learning Curve Performance Growth Chart Template for PowerPoint & Google Slides
Employee Performance
Strategy Core Diagram template for PowerPoint & Google Slides
Process
Risk Mitigation Strategy template for PowerPoint & Google Slides
Risk Management
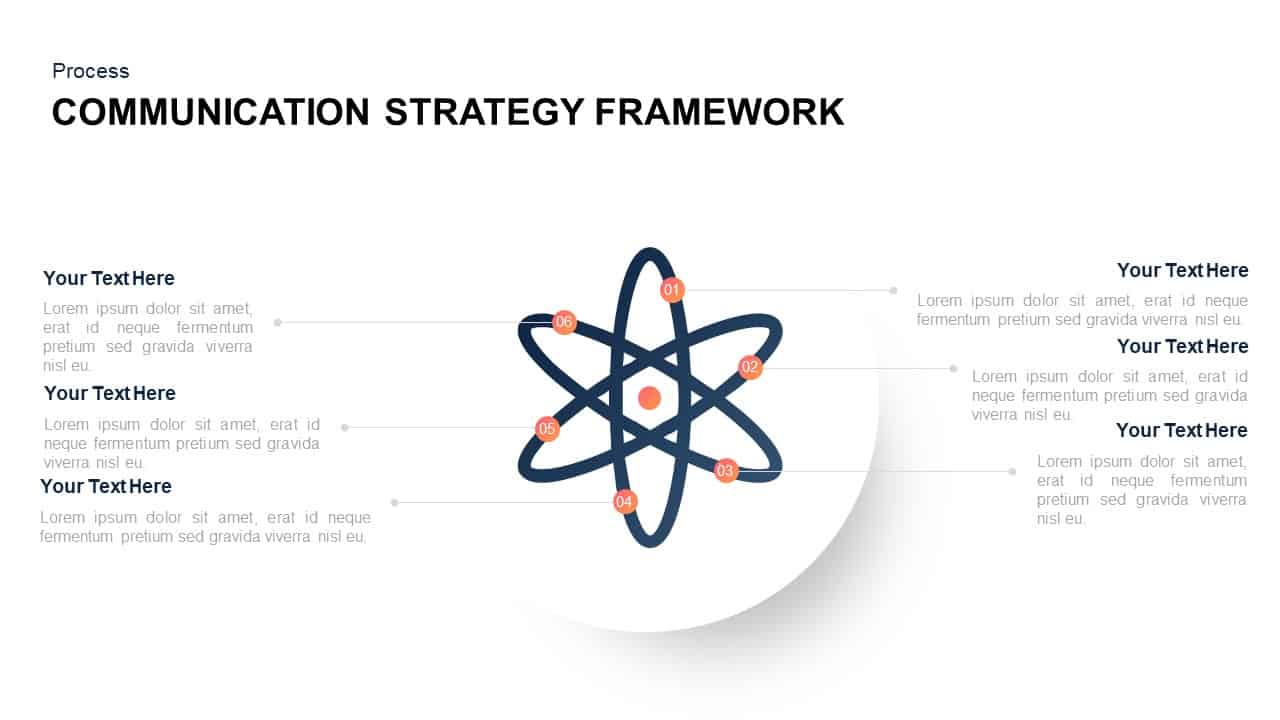
Communication Strategy Framework Diagram Template for PowerPoint & Google Slides
Circular
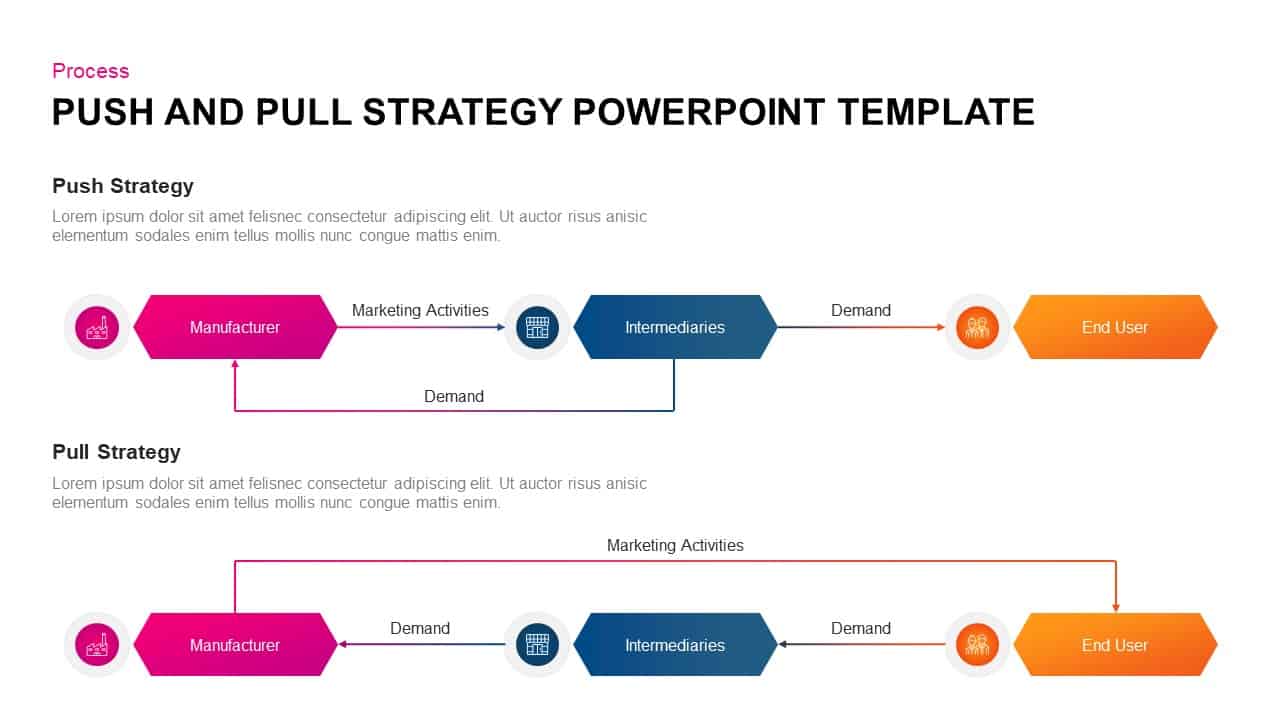
Push and Pull Marketing Strategy Diagram Template for PowerPoint & Google Slides
Business Strategy
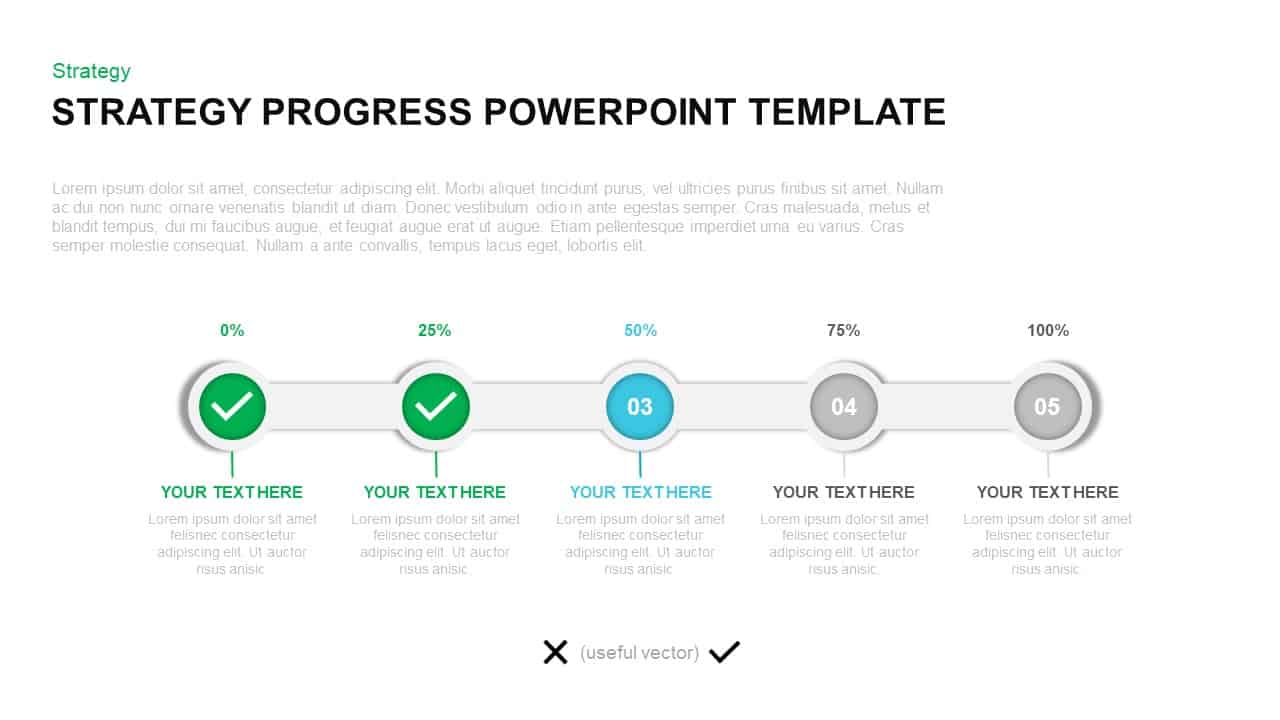
Strategy Progress Timeline Template for PowerPoint & Google Slides
Process
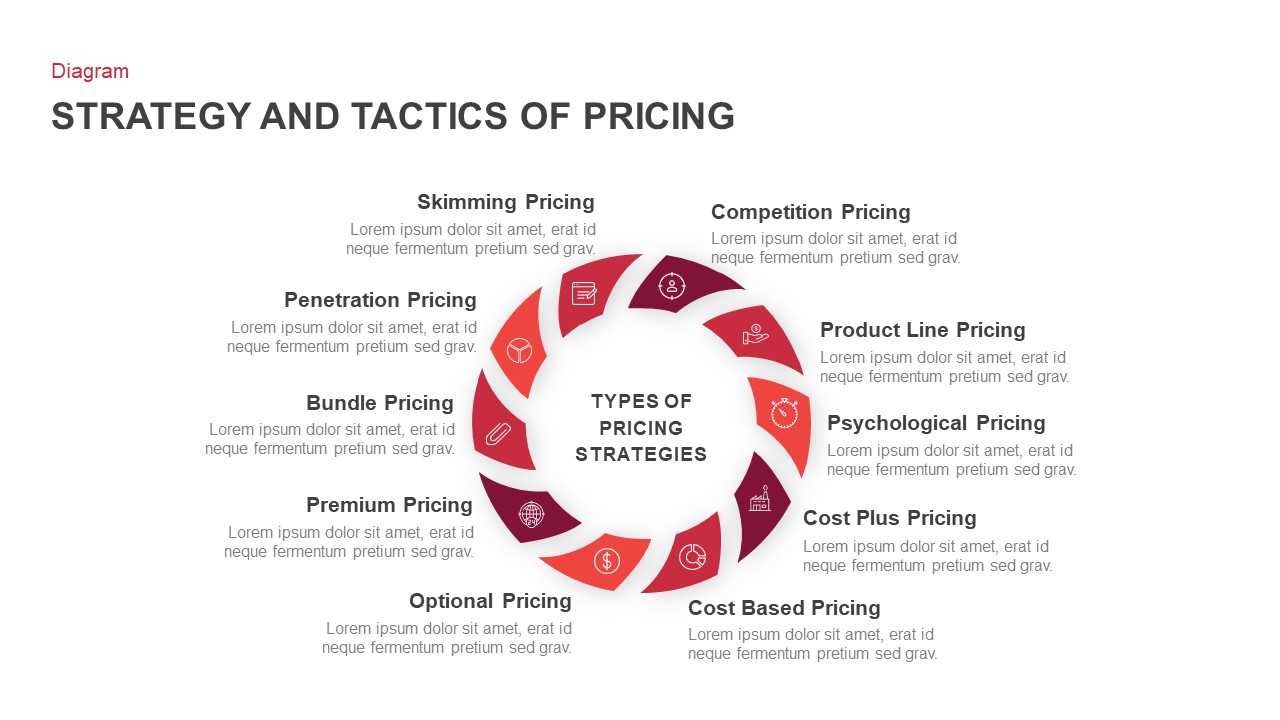
Pricing Strategy and Tactics Diagram Template for PowerPoint & Google Slides
Circular
Modern Digital Marketing Strategy Template for PowerPoint & Google Slides
Pitch Deck
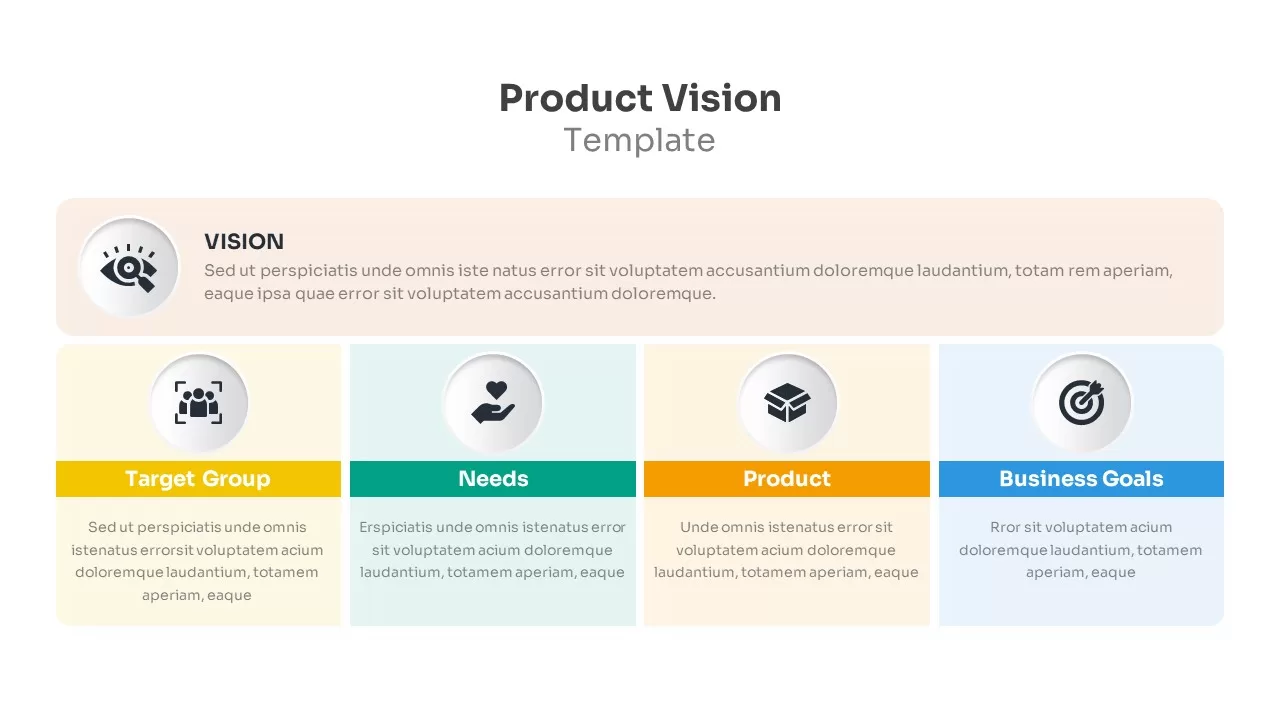
Product Vision & Strategy template for PowerPoint & Google Slides
Business Plan
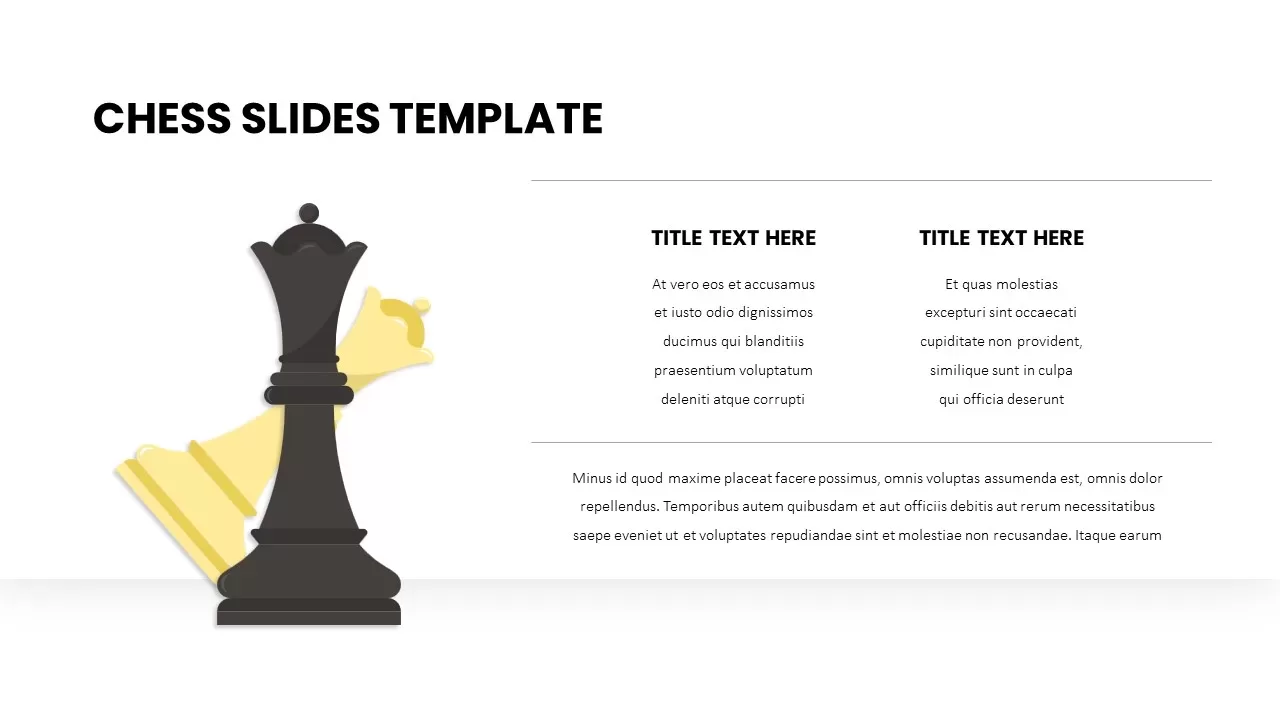
Chess Strategy Illustration Slide Template for PowerPoint & Google Slides
Competitor Analysis
Business Strategy House Model Diagram Template for PowerPoint & Google Slides
Business Strategy
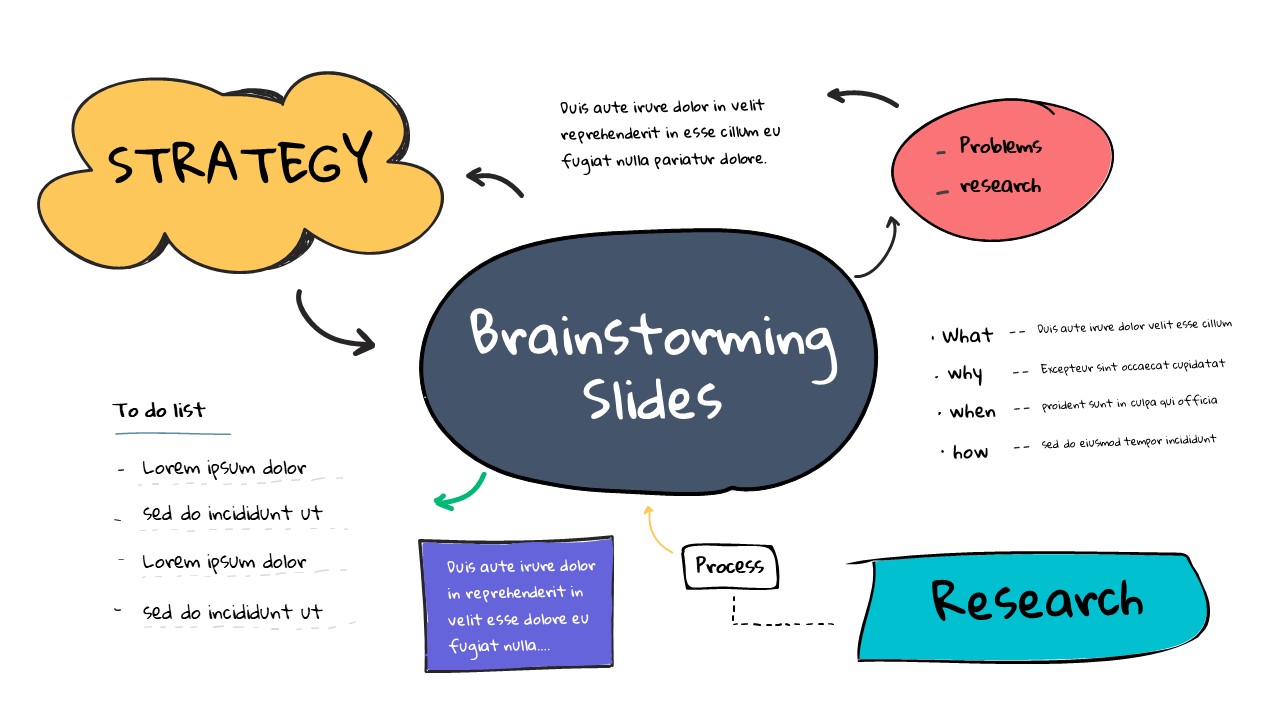
Brainstorming Strategy Slide template for PowerPoint & Google Slides
Business Strategy
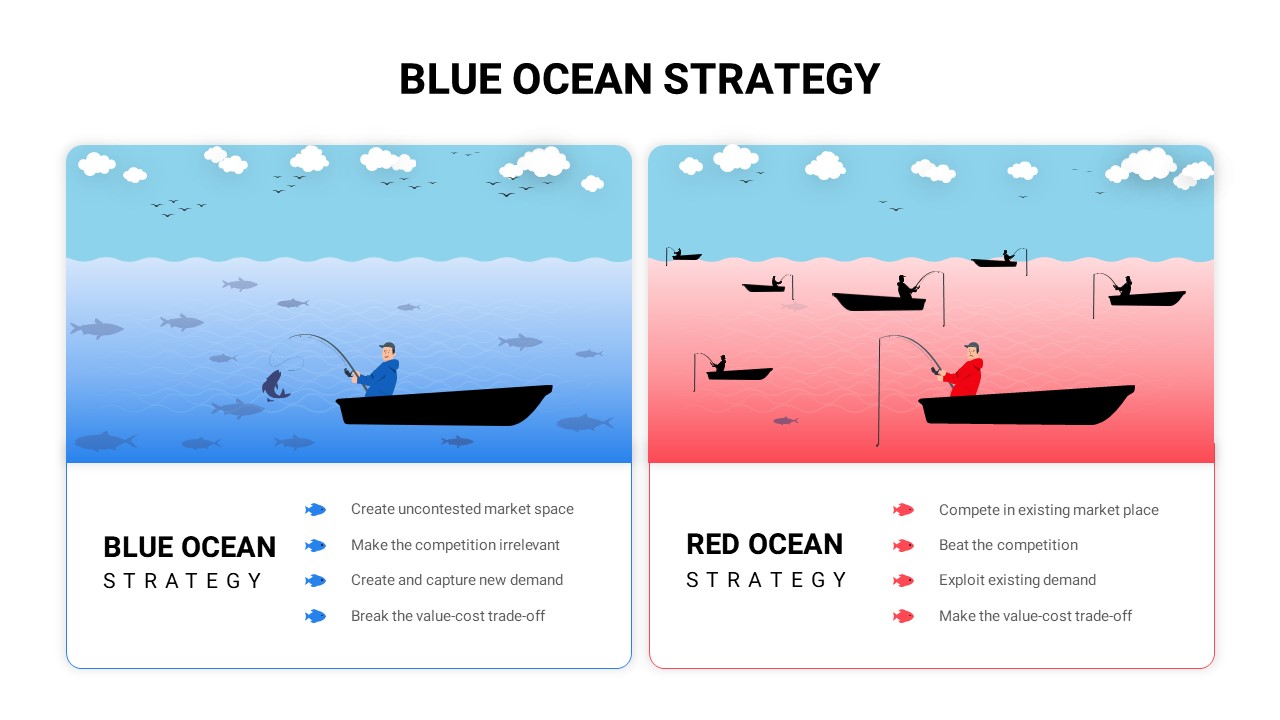
Blue vs Red Ocean Strategy Comparison Template for PowerPoint & Google Slides
Business Strategy
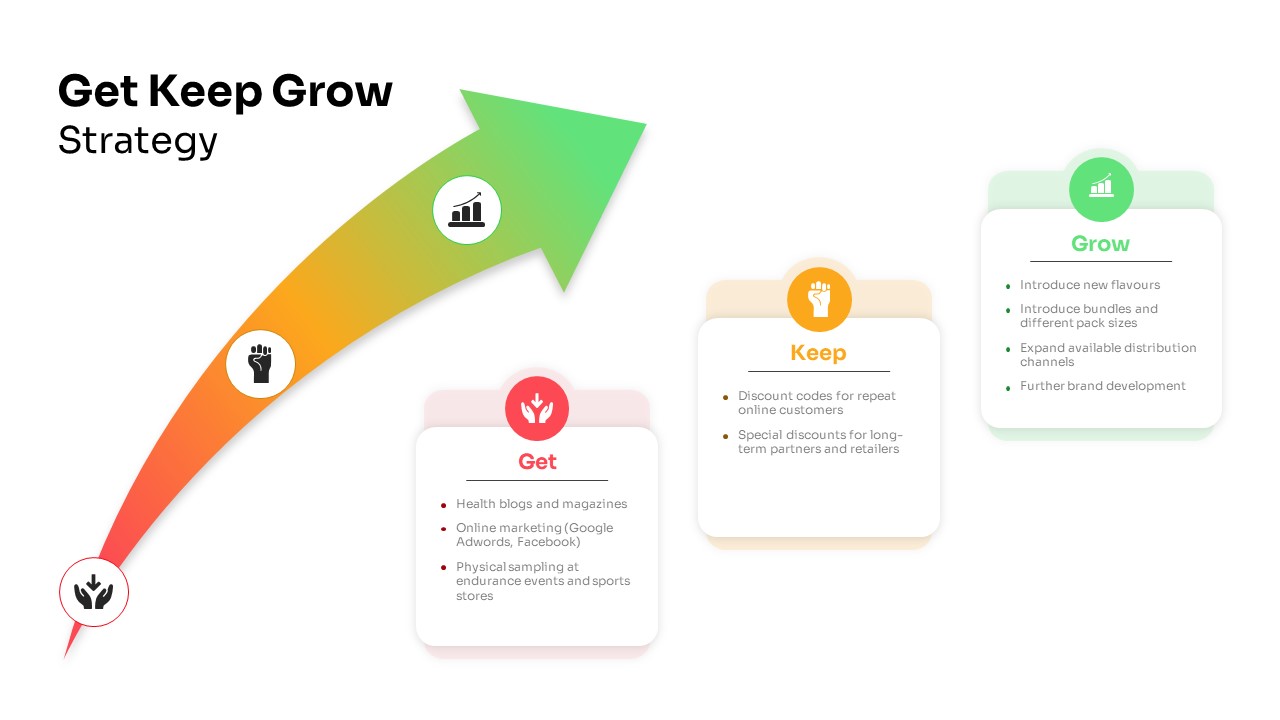
Get Keep Grow Customer Strategy Template for PowerPoint & Google Slides
Business Strategy
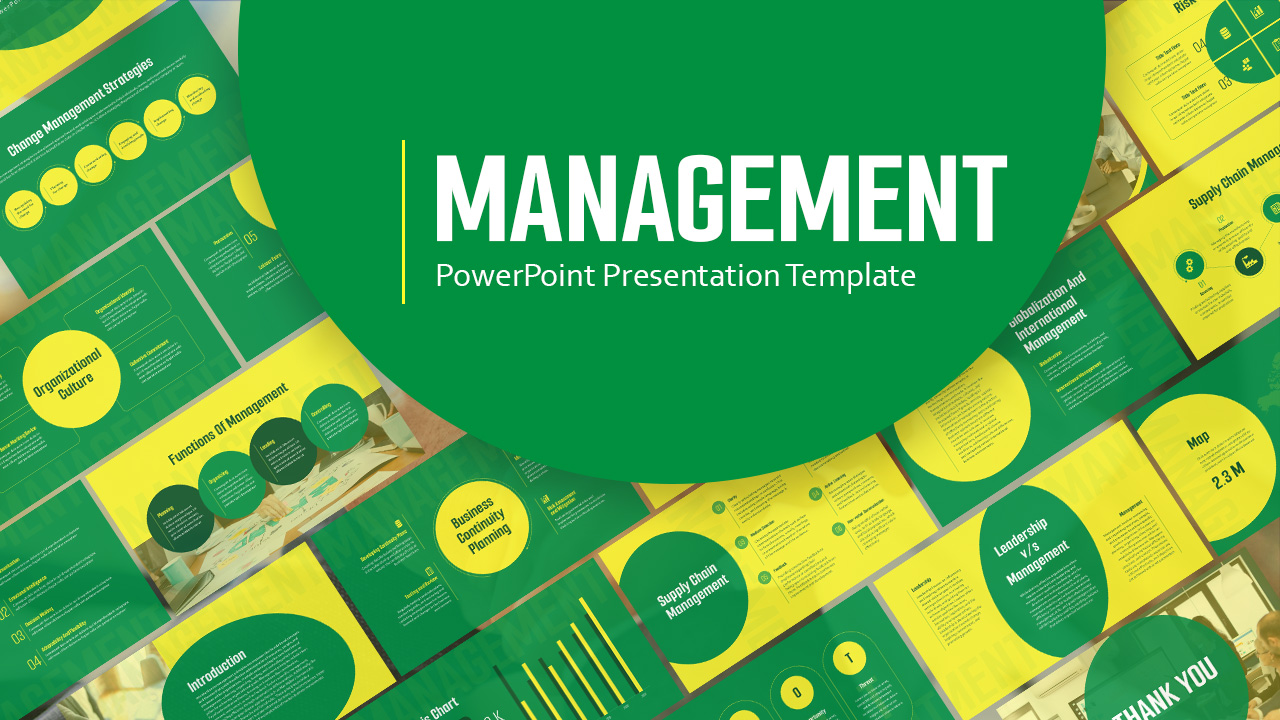
Free Comprehensive Management Strategy Deck Template for PowerPoint & Google Slides
Pitch Deck
Free
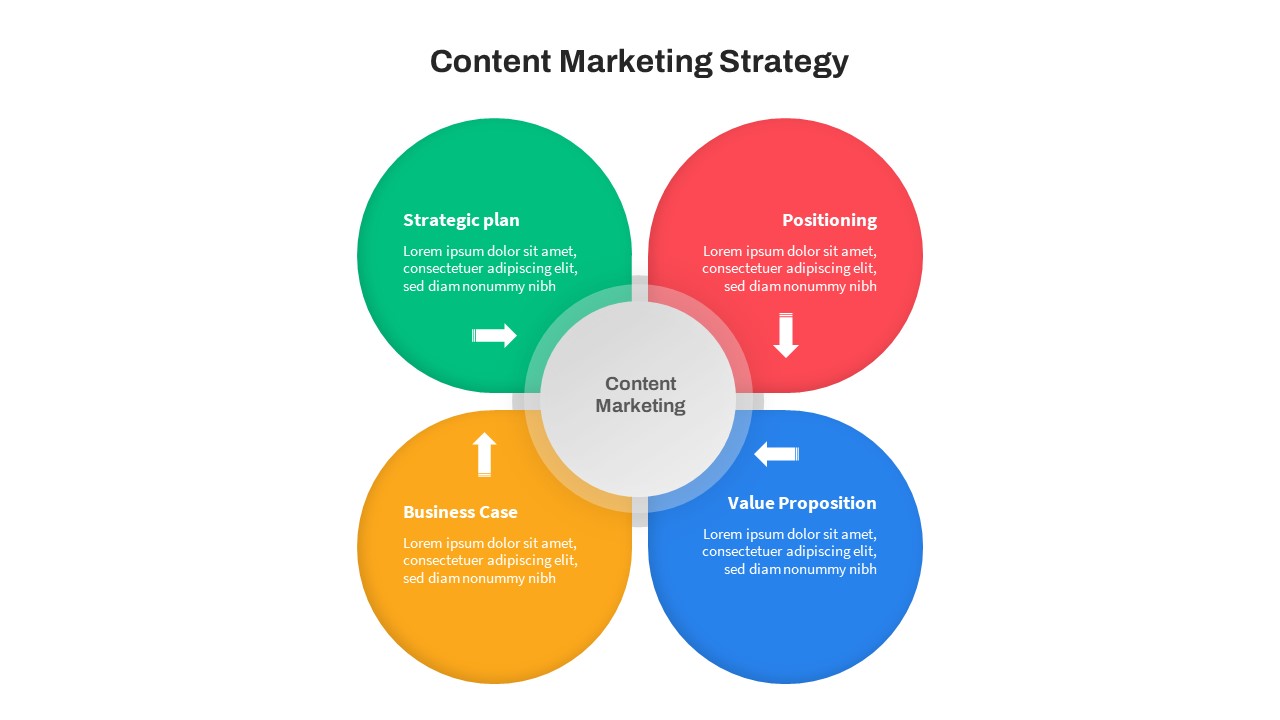
Color-Coded Content Marketing Strategy Slide for PowerPoint & Google Slides
Marketing
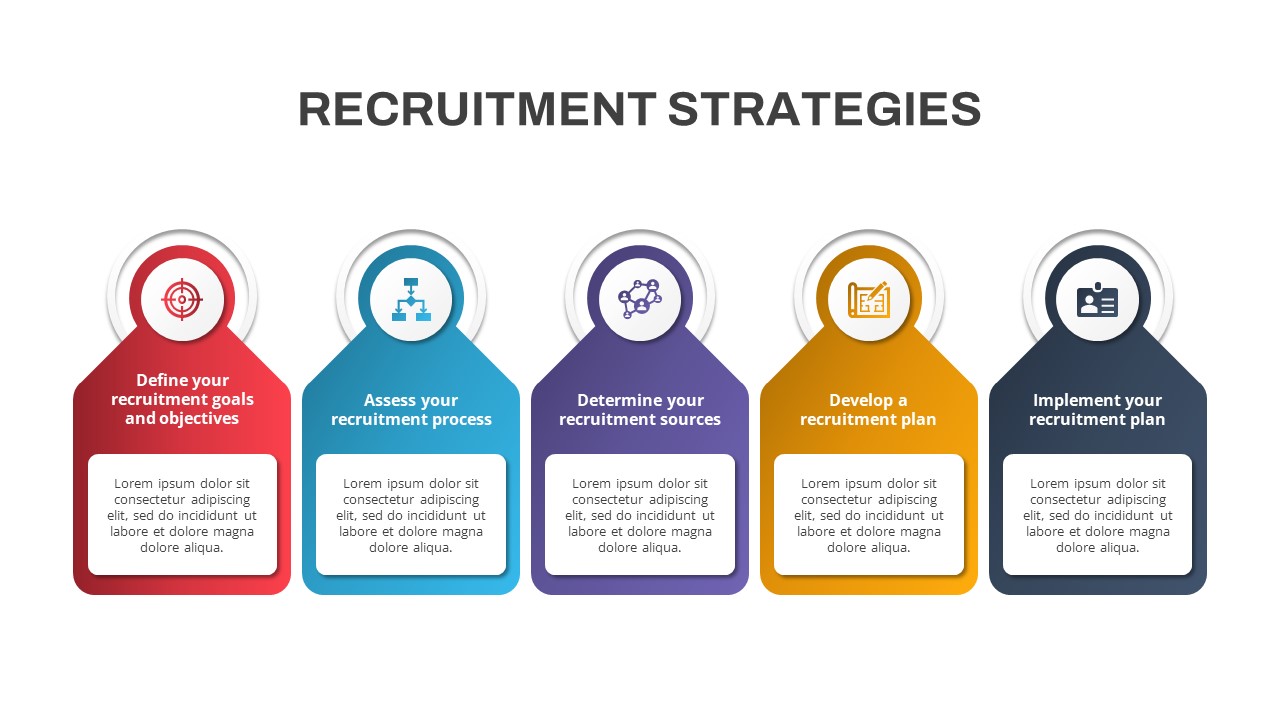
Recruitment Strategy Slide for PowerPoint & Google Slides
Recruitment
Skimming Pricing Strategy Line Chart Template for PowerPoint & Google Slides
Business Strategy
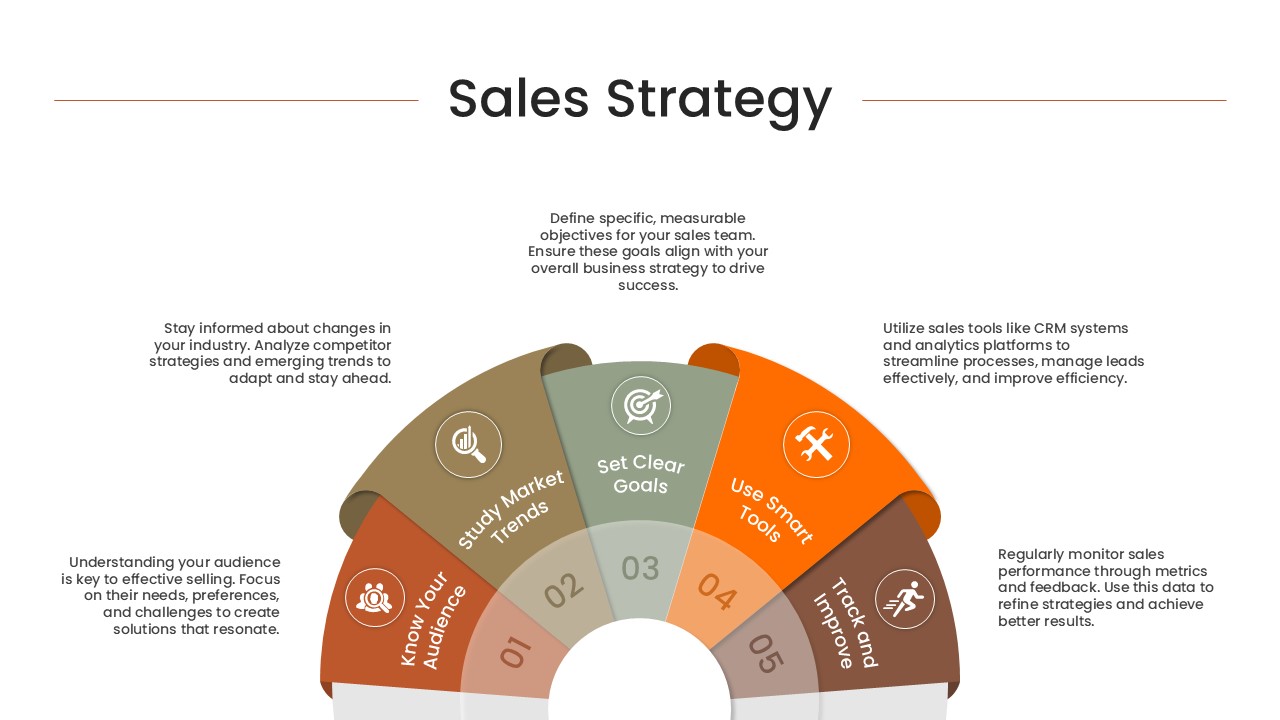
Semi-Circular Sales Strategy Roadmap Template for PowerPoint & Google Slides
Circular
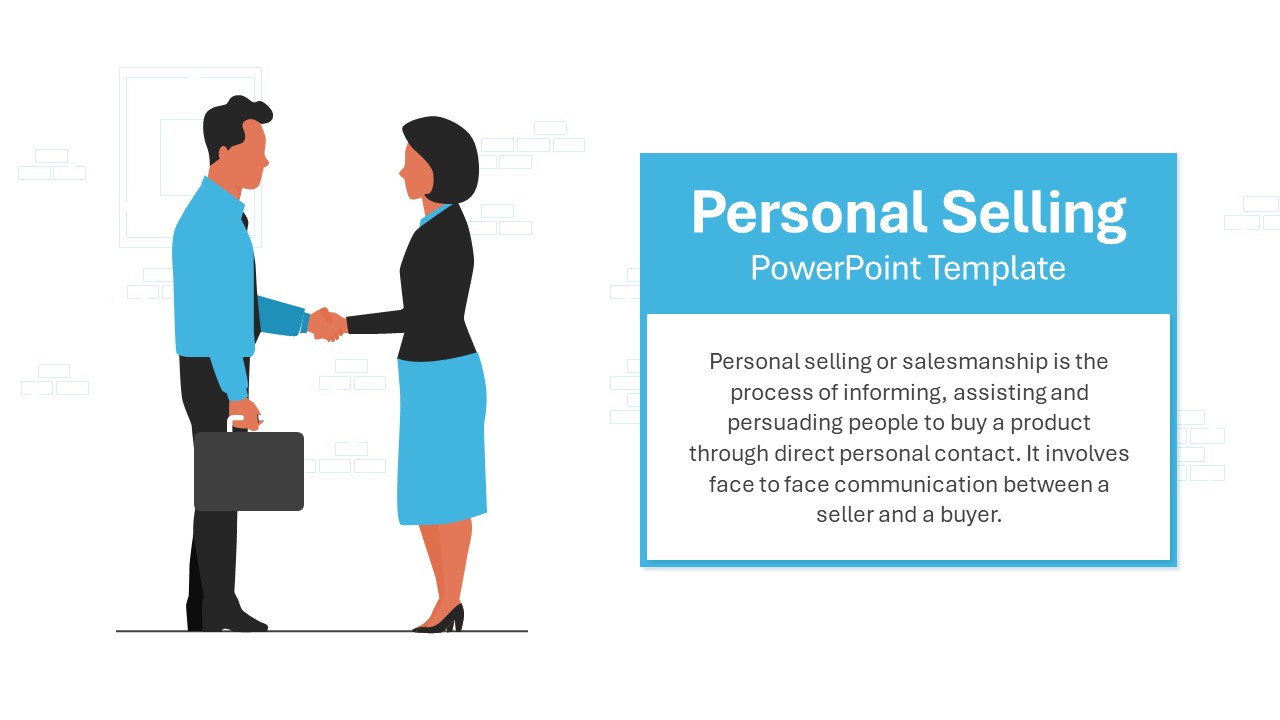
Personal Selling Strategy Illustration Template for PowerPoint & Google Slides
Marketing
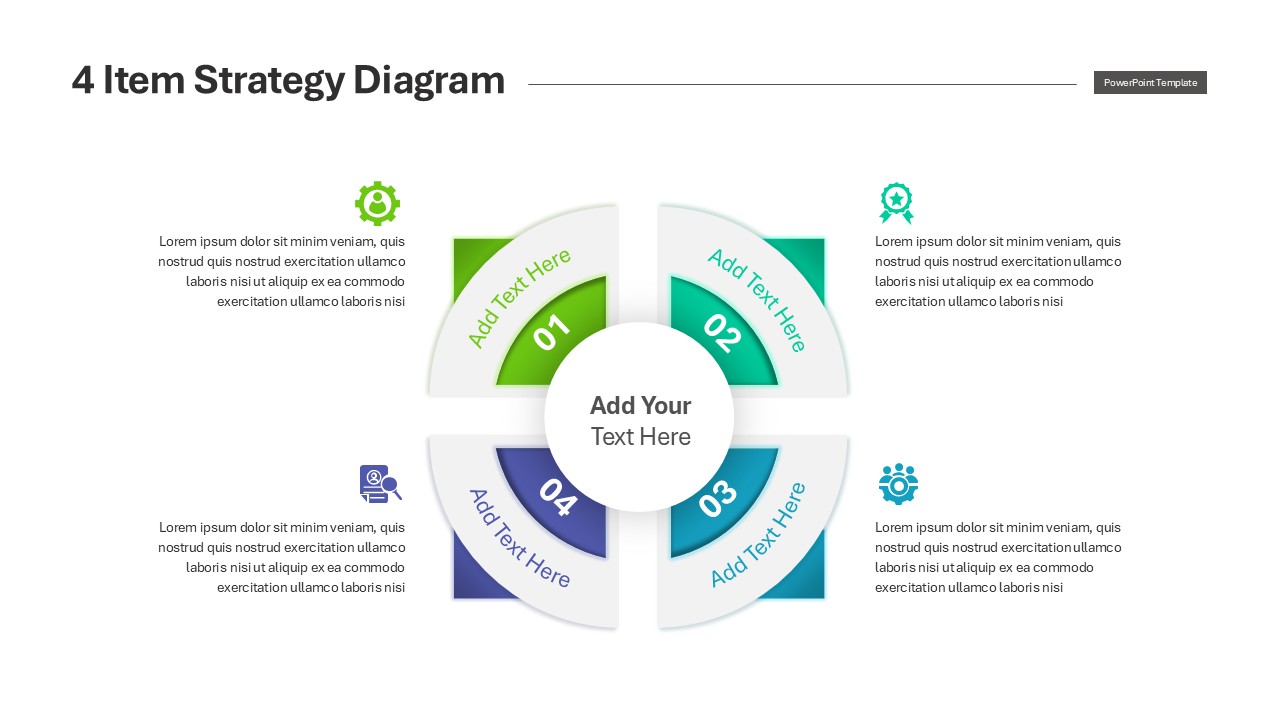
Engaging Four-Option Strategy Diagram Template for PowerPoint & Google Slides
Business Strategy
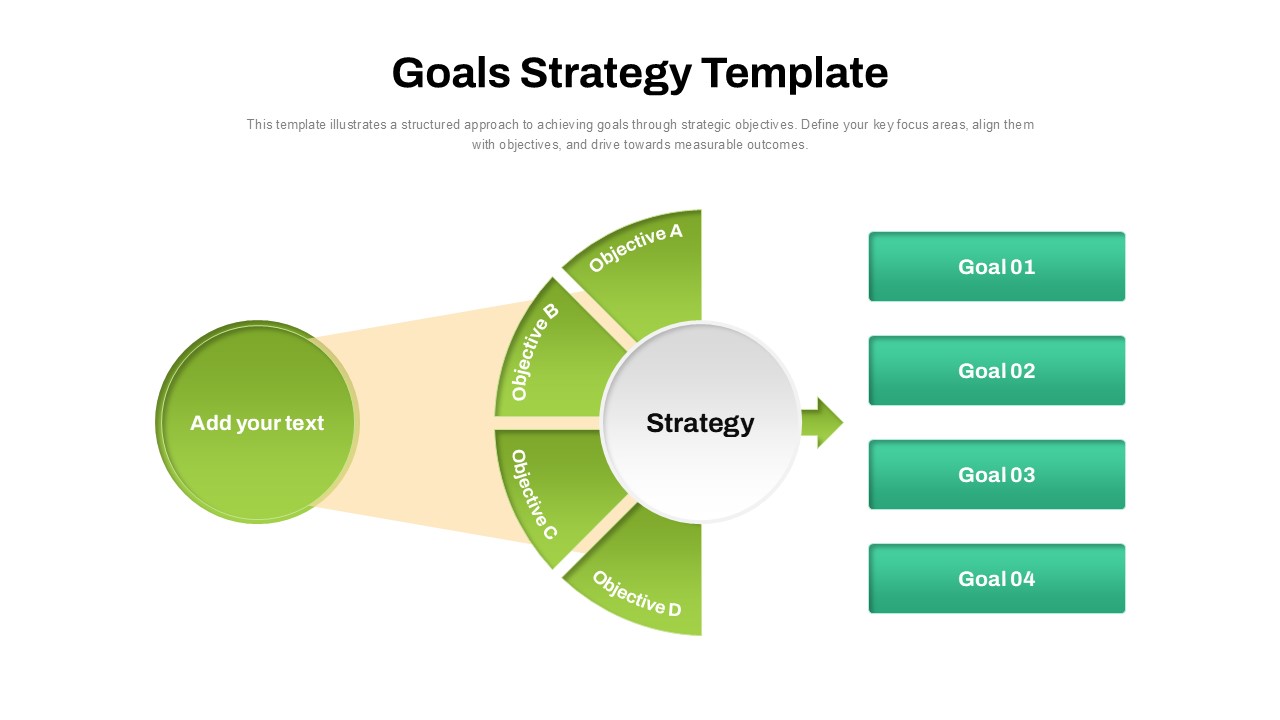
Goals Strategy Semicircle Diagram Template for PowerPoint & Google Slides
Process
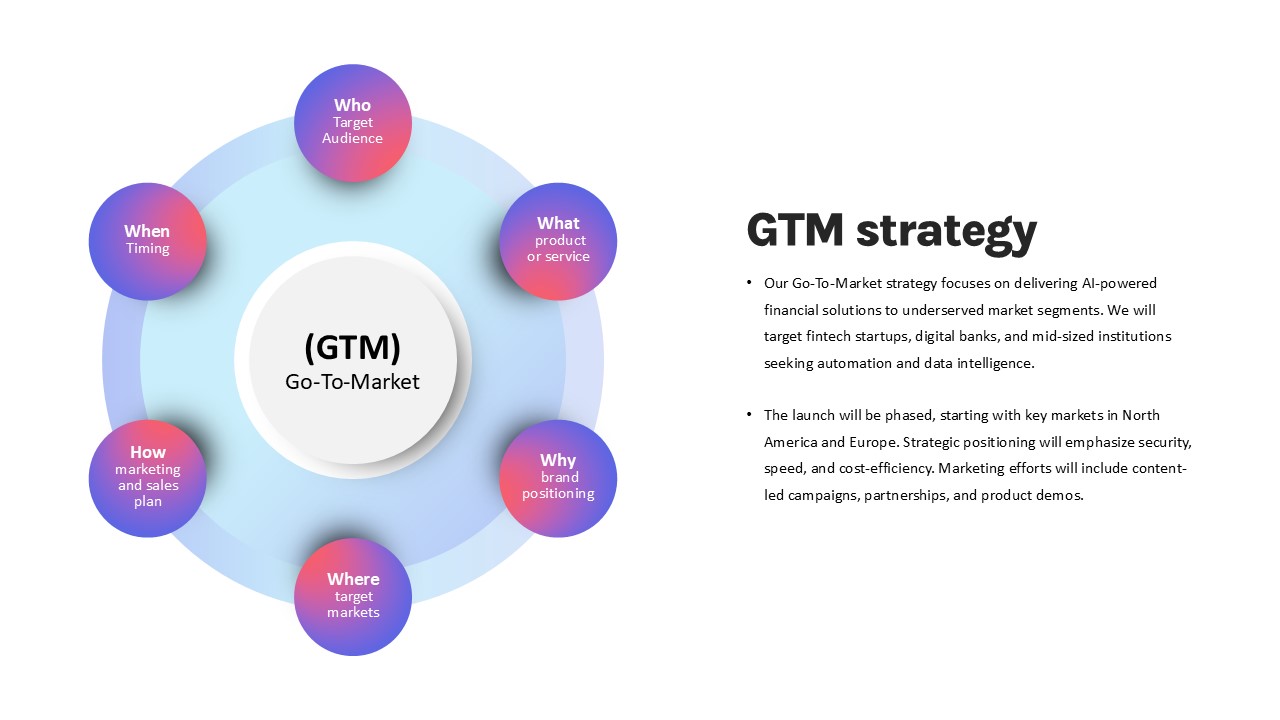
GTM Strategy template for PowerPoint & Google Slides
Business Strategy
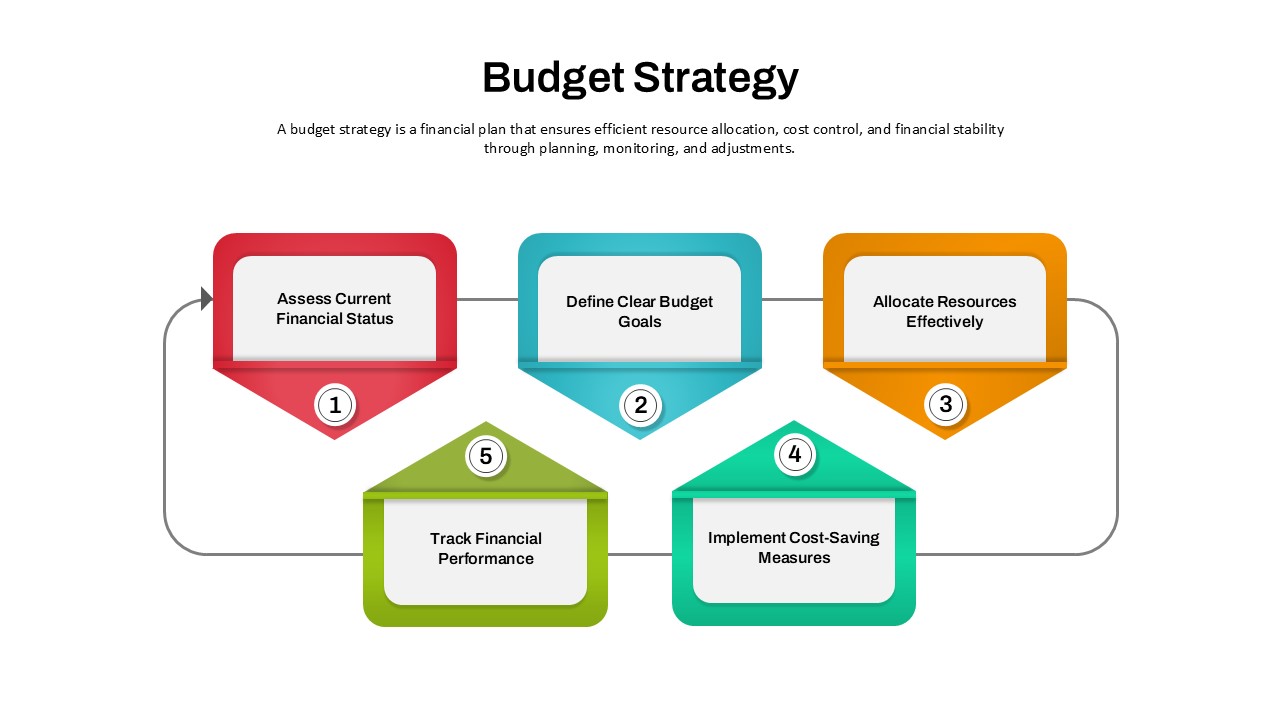
Budget Strategy Five-Step Process Template for PowerPoint & Google Slides
Finance
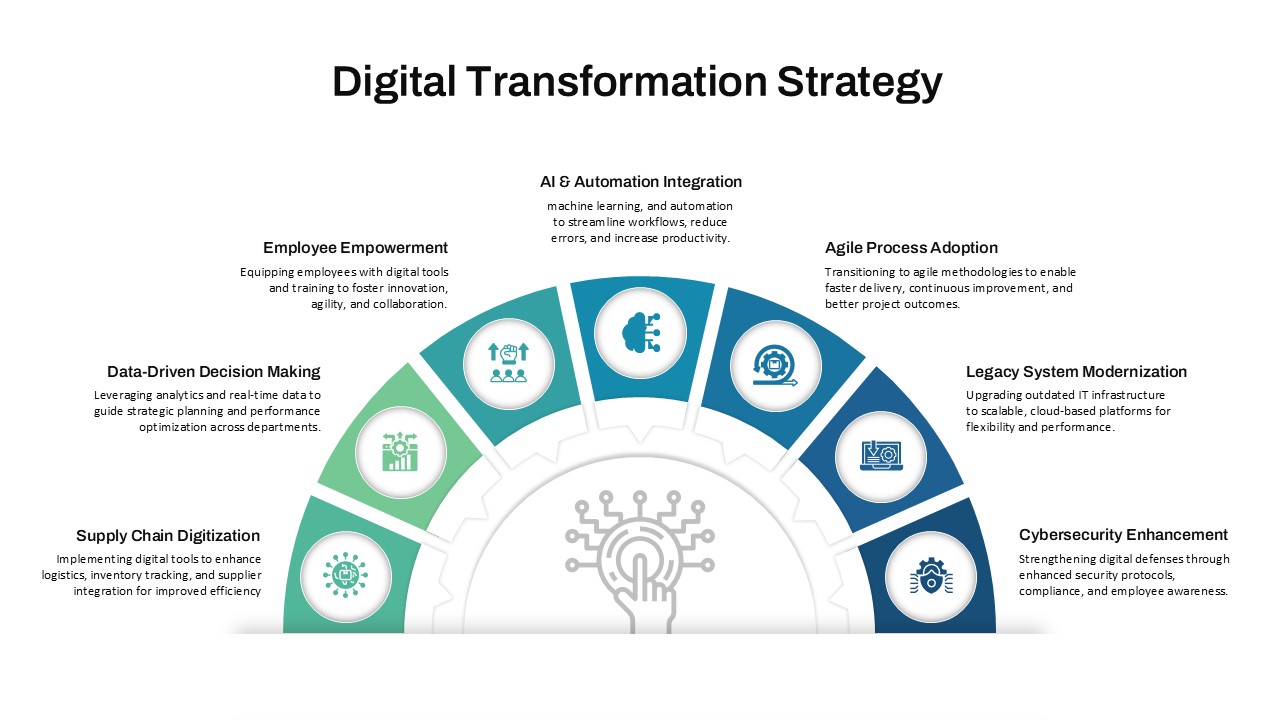
Digital Transformation Strategy Template for PowerPoint & Google Slides
Circular
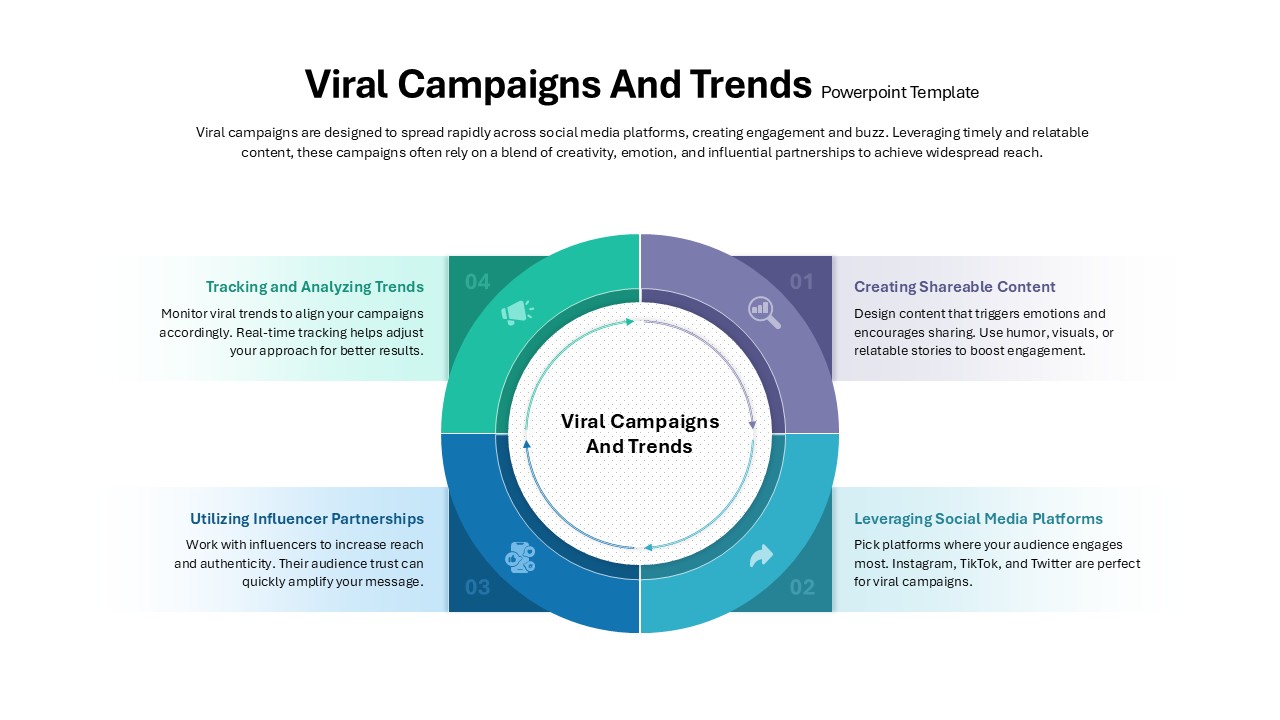
Viral Campaigns and Trends Strategy for PowerPoint & Google Slides
Advertising
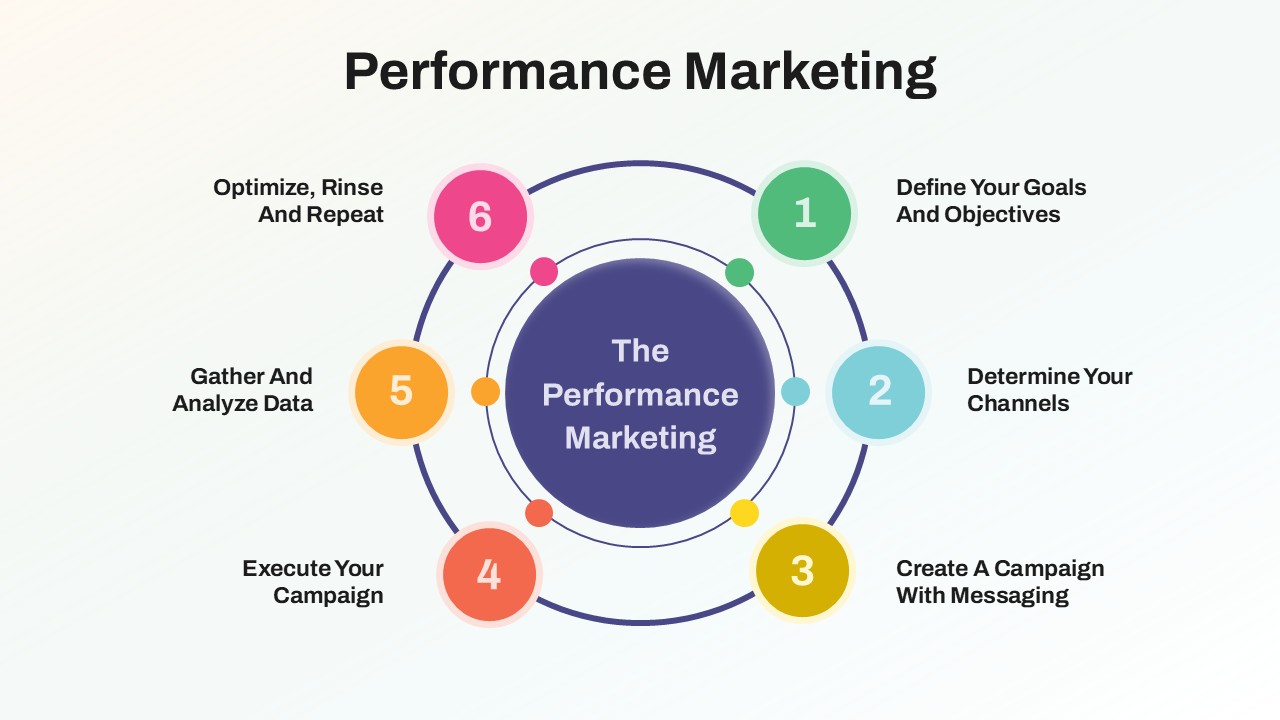
Performance Marketing Strategy template for PowerPoint & Google Slides
Digital Marketing
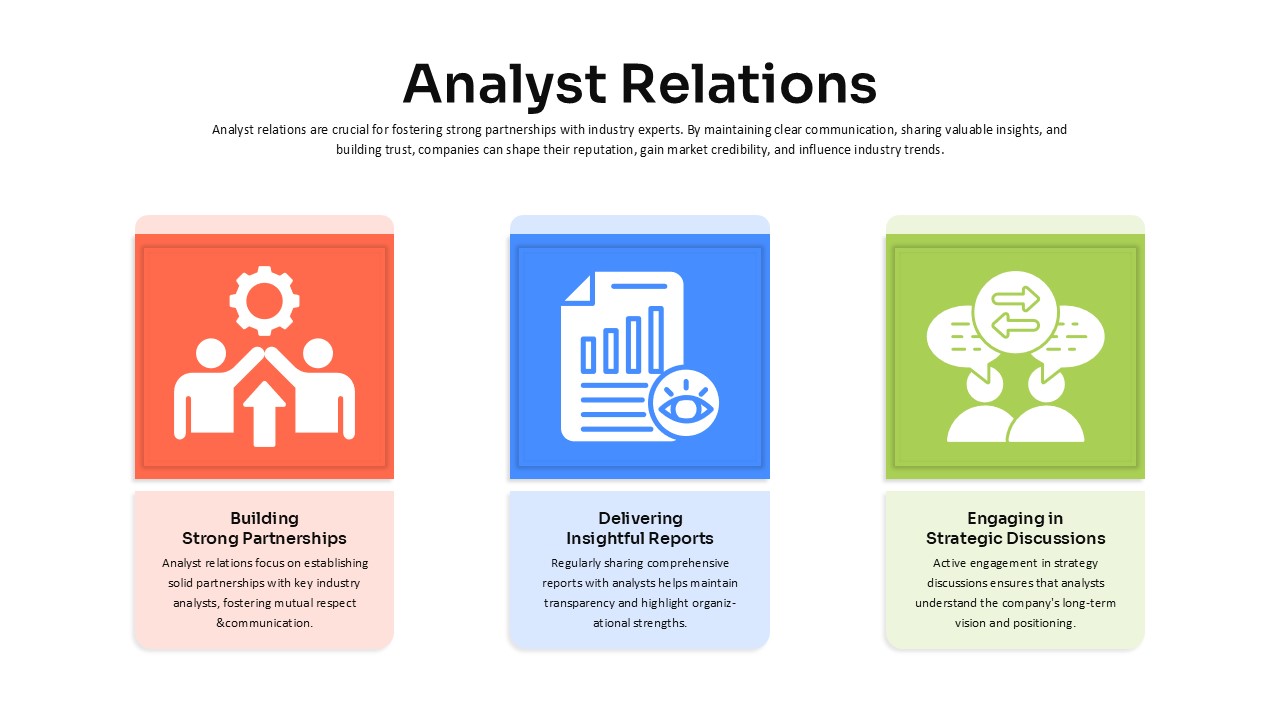
Analyst Relations Strategy template for PowerPoint & Google Slides
Business