Linear Process Flow Circles Diagram Template for PowerPoint & Google Slides


Description
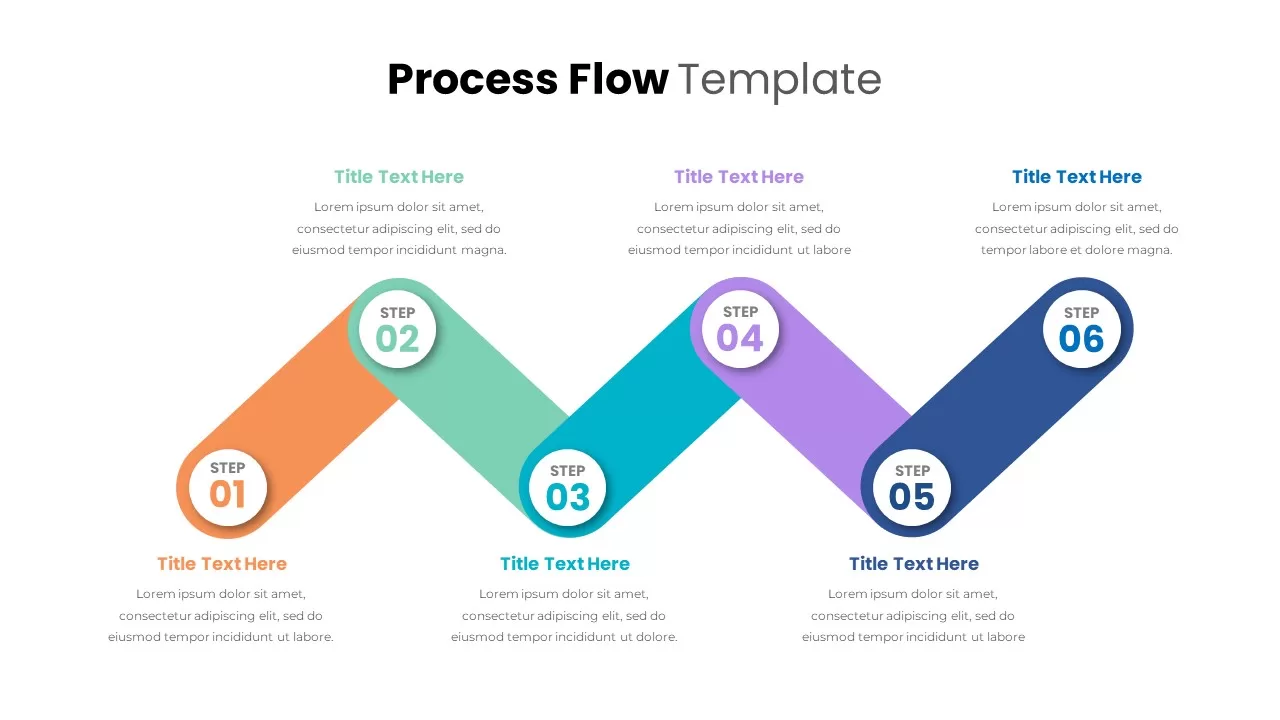
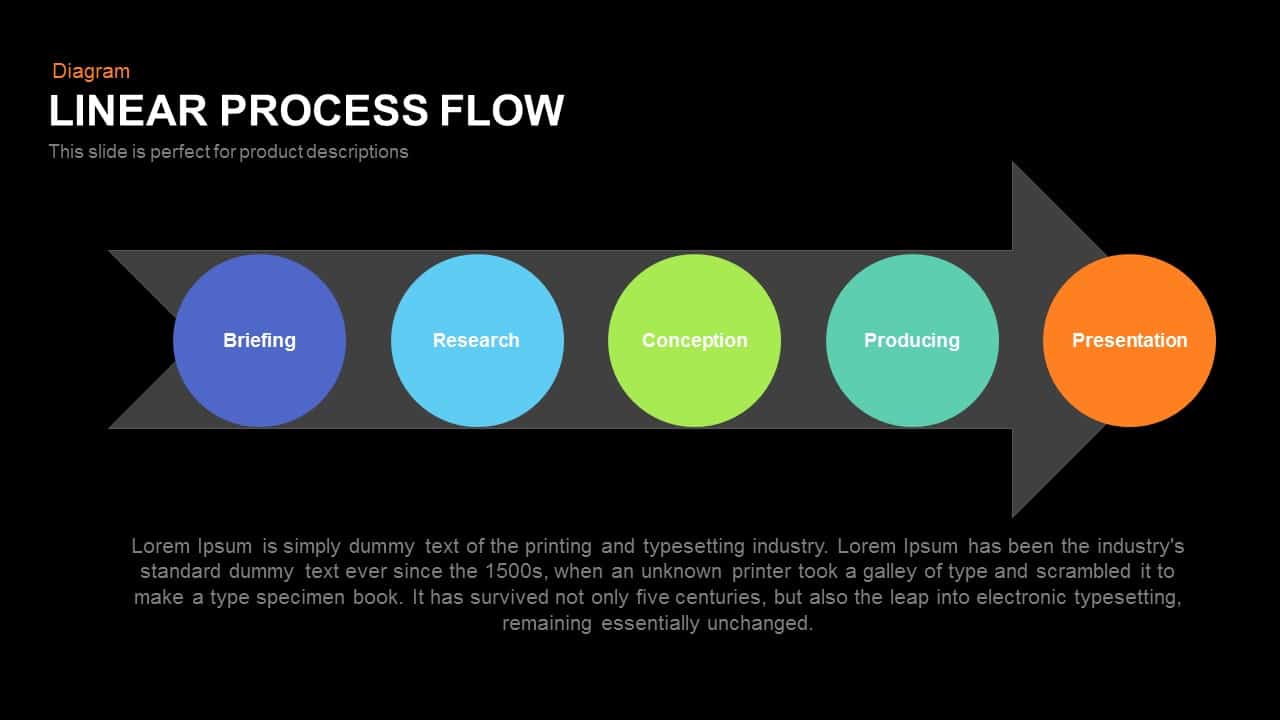
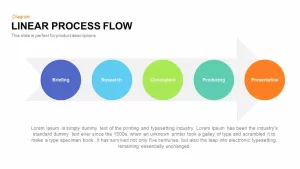
This slide showcases a clean linear process flow infographic built atop a subtle gray arrow stretching horizontally across the canvas. Five vibrant, fully editable circular nodes—dark blue for Briefing, blue for Research, light green for Concept, green for Producing, and orange for Presentation—sit evenly along the arrow, each containing crisp white text labels for immediate clarity. A spacious white background and minimalist typography maintain focus on your content, while semi-transparent navigation arrows at the slide margins hint at step-by-step storytelling or carousel navigation.
Designed on master slides with vector-based shapes, every element is customizable in seconds. Recolor the arrow, adjust circle hues, swap segment titles, or replace text placeholders to match your brand guidelines. You can reorder or duplicate nodes, modify connector spacing, or tweak font styles without losing alignment. The slide’s intuitive grid ensures seamless formatting across PowerPoint and Google Slides, eliminating version-control headaches and preserving pixel-perfect fidelity on any display.
Below the process flow, ample space for long-form text or bullet summaries lets you provide context, insights, or call-to-action details. Use this area to highlight key milestones, performance metrics, or strategic objectives tied to each stage. The balanced white space and clear visual hierarchy guide your audience from briefing through final presentation, reinforcing progression and causality at every step.
Whether you’re mapping product roadmaps, outlining research phases, or illustrating training modules, this linear process flow diagram accelerates slide creation and drives engagement. Duplicate the slide to expand your workflow, repurpose nodes for parallel processes, or integrate custom icons to represent department-specific tasks. With a versatile, vector-driven design and built-in layout guides, you’ll deliver polished, professional presentations that resonate across teams and platforms.
Who is it for
Project managers, marketing strategists, business analysts, and product teams will leverage this slide to illustrate phased workflows, R&D cycles, or stakeholder roadmaps in executive briefings, kickoff meetings, and training workshops.
Other Uses
Repurpose this layout for customer journey mapping, sales funnel visualizations, compliance checklists, or event timelines. Adjust node labels and colors to convey priority shifts, risk assessments, or parallel task streams with ease.
Login to download this file

Item ID
SB00489
Related Templates

3D Shape Linear Process Flow Diagram Template for PowerPoint & Google Slides
Process
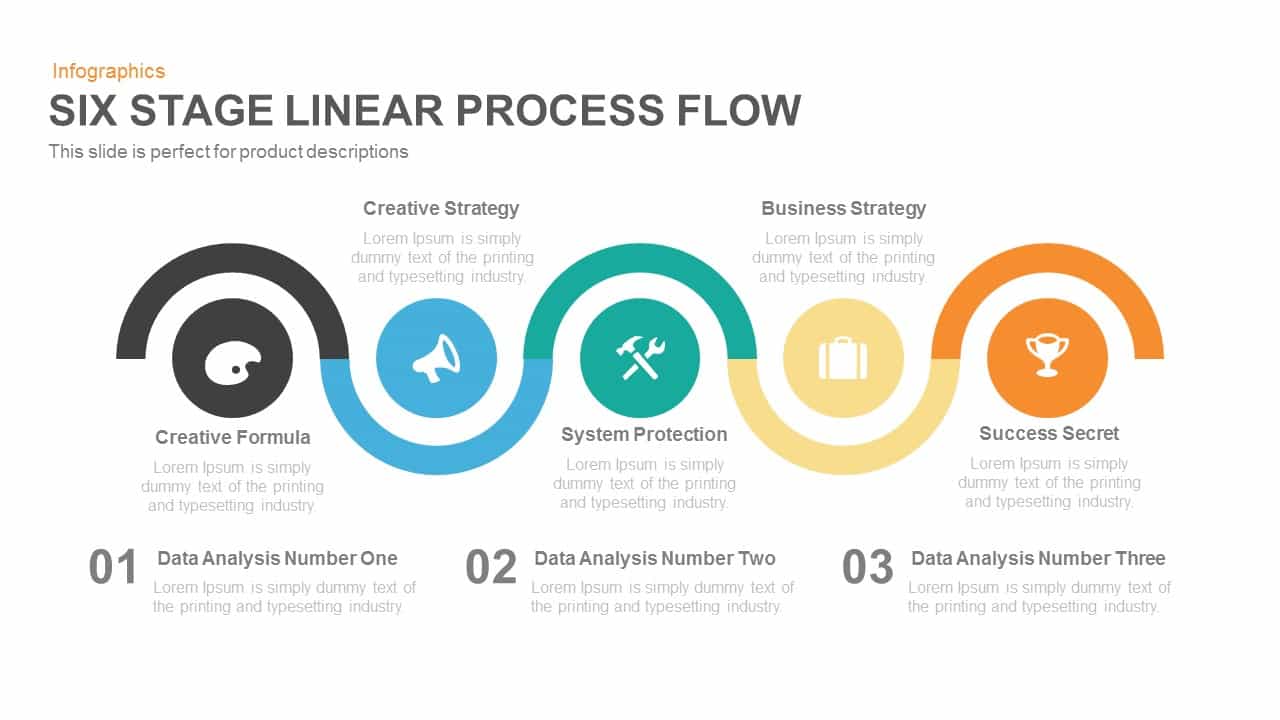
Five Stage Linear Process Flow Diagram Template for PowerPoint & Google Slides
Process
Five-Stage Linear Process Flow Diagram Template for PowerPoint & Google Slides
Process
Four-Stage Linear Process Flow Diagram Template for PowerPoint & Google Slides
Process
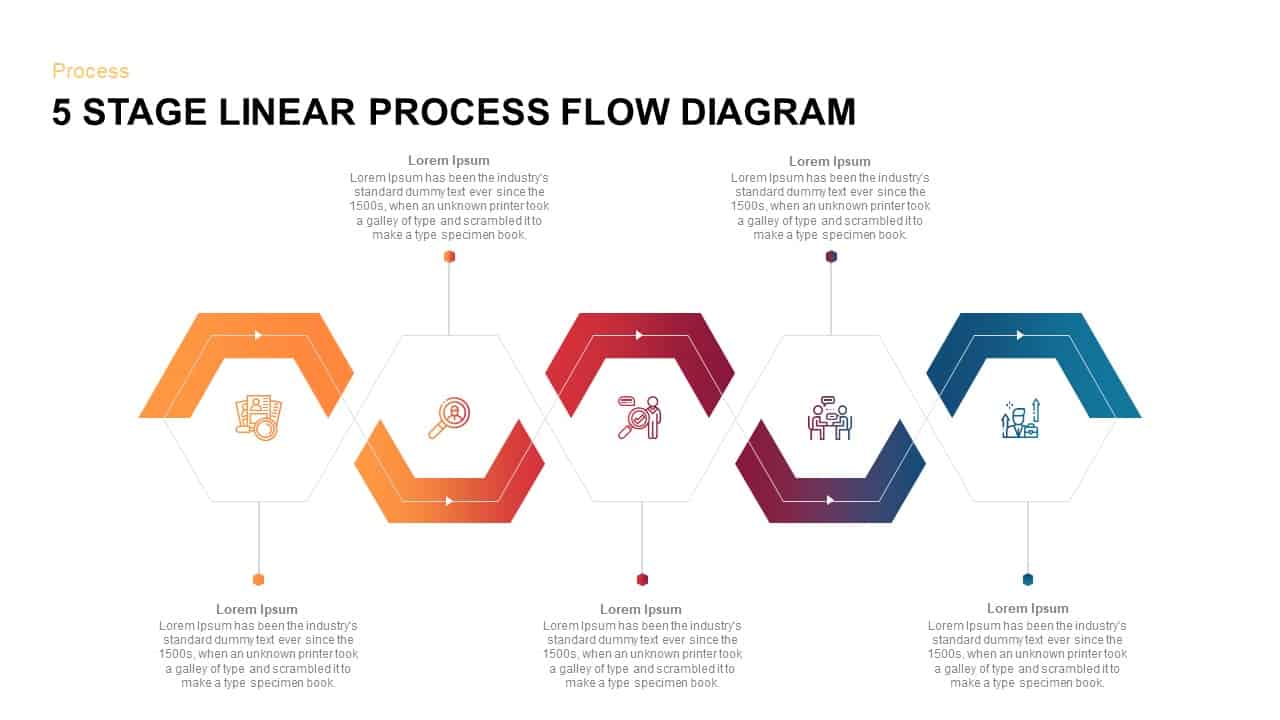
5-Stage Linear Process Flow Diagram Template for PowerPoint & Google Slides
Process
5 Stage Linear Process Flow Diagram Template for PowerPoint & Google Slides
Process
4 Stage Linear Process Flow Diagram Template for PowerPoint & Google Slides
Process
7 Stage Linear Process Flow Diagram Template for PowerPoint & Google Slides
Process
4 Stage Linear Process Flow Diagram Template for PowerPoint & Google Slides
Process
4-Stage Linear Process Flow Diagram Template for PowerPoint & Google Slides
Process
4-Step Linear Process Flow Diagram Template for PowerPoint & Google Slides
Process
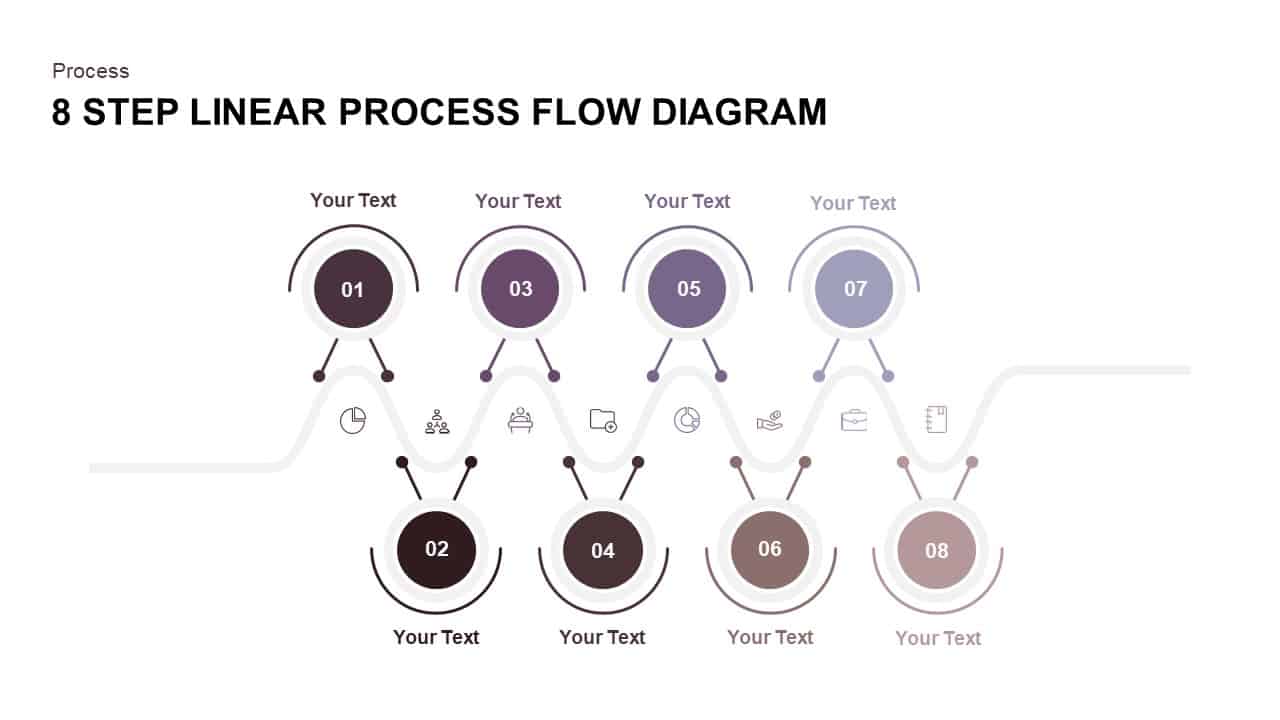
8 Step Linear Process Flow Diagram for PowerPoint & Google Slides
Process

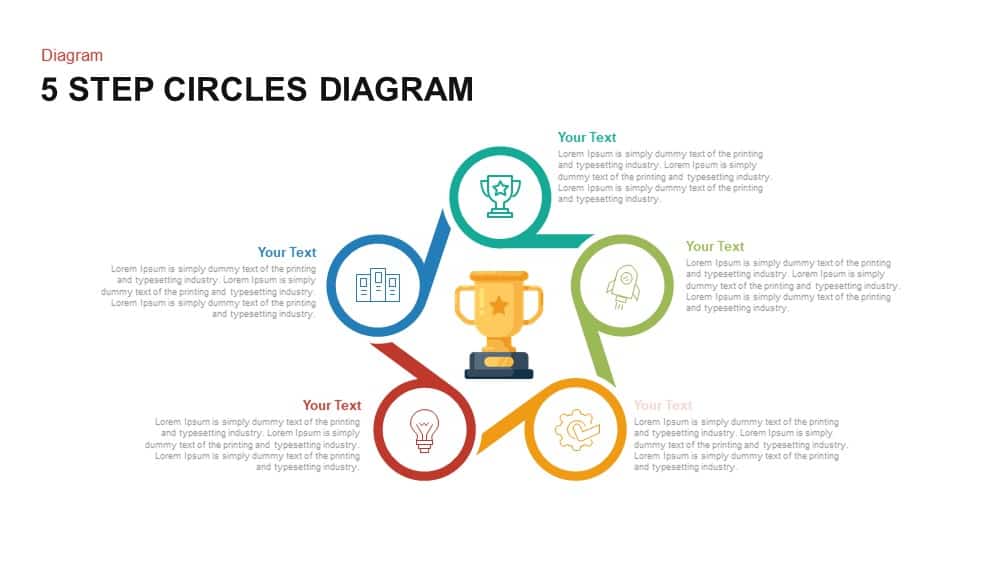
Modern Five-Step Circles Process Diagram Template for PowerPoint & Google Slides
Circular
5 Steps Linear Process Flow Diagram template
Process
Five Stage Linear Process Flow Template for PowerPoint & Google Slides
Process

Radial Connected Circles Infographic Template for PowerPoint & Google Slides
Circular
Simon Sinek Circles Model Infographic template for PowerPoint & Google Slides
Business Strategy
5 Layer Concentric Circles Infographics Template for PowerPoint & Google Slides
Circular
3-Tier Concentric Circles Infographic Template for PowerPoint & Google Slides
Circular
SWOT Template with Colorful Circles for PowerPoint & Google Slides
SWOT
Colorful Concentric Circles Infographic Slide for PowerPoint & Google Slides
Process

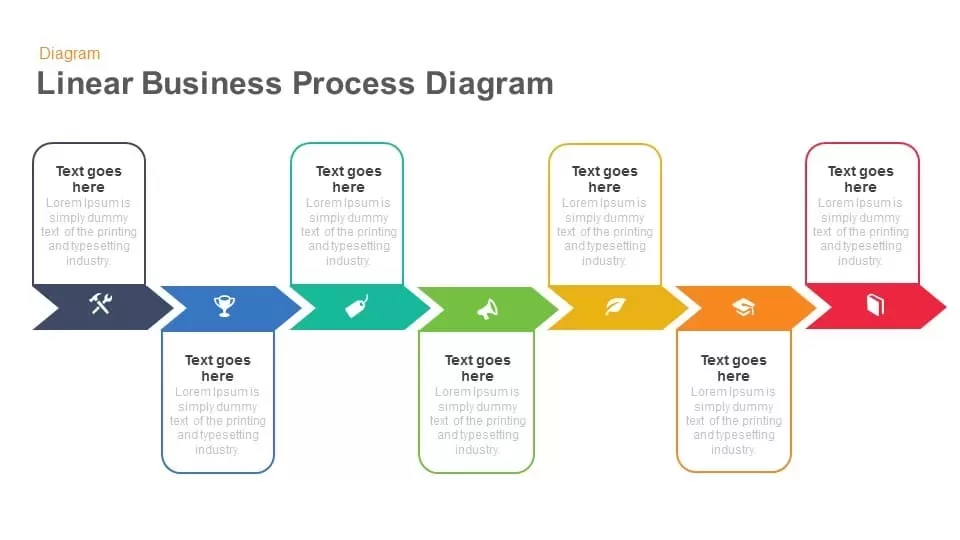
Linear Business Process Diagram template for PowerPoint & Google Slides
Process
Six-Step Linear Arrow Process Diagram Template for PowerPoint & Google Slides
Process

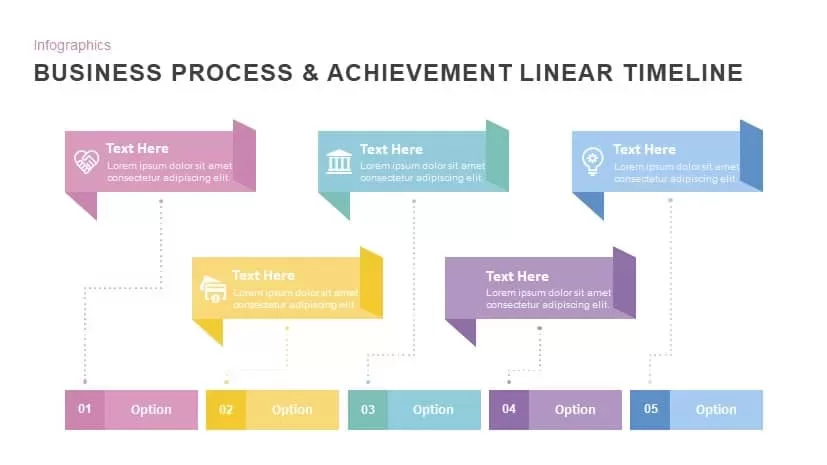
Business Process & Achievement Linear Timeline template for PowerPoint & Google Slides
Timeline
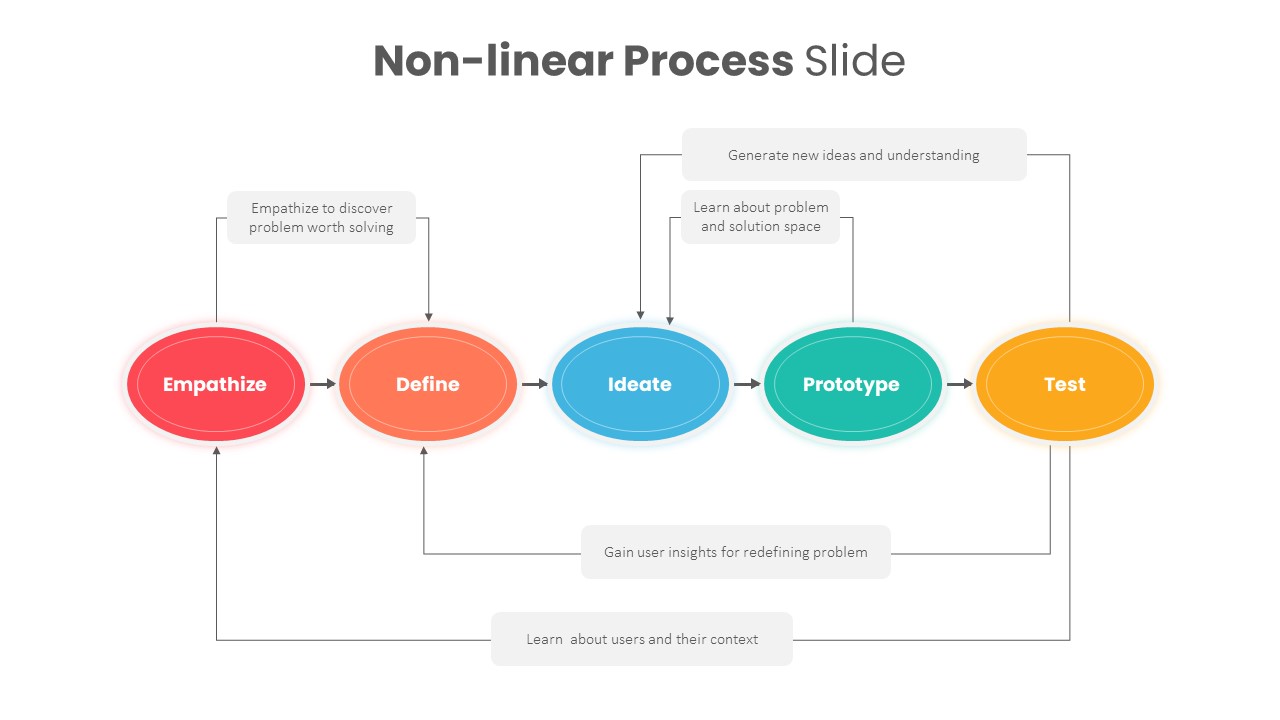
Non-linear Design Thinking Process Template for PowerPoint & Google Slides
Process
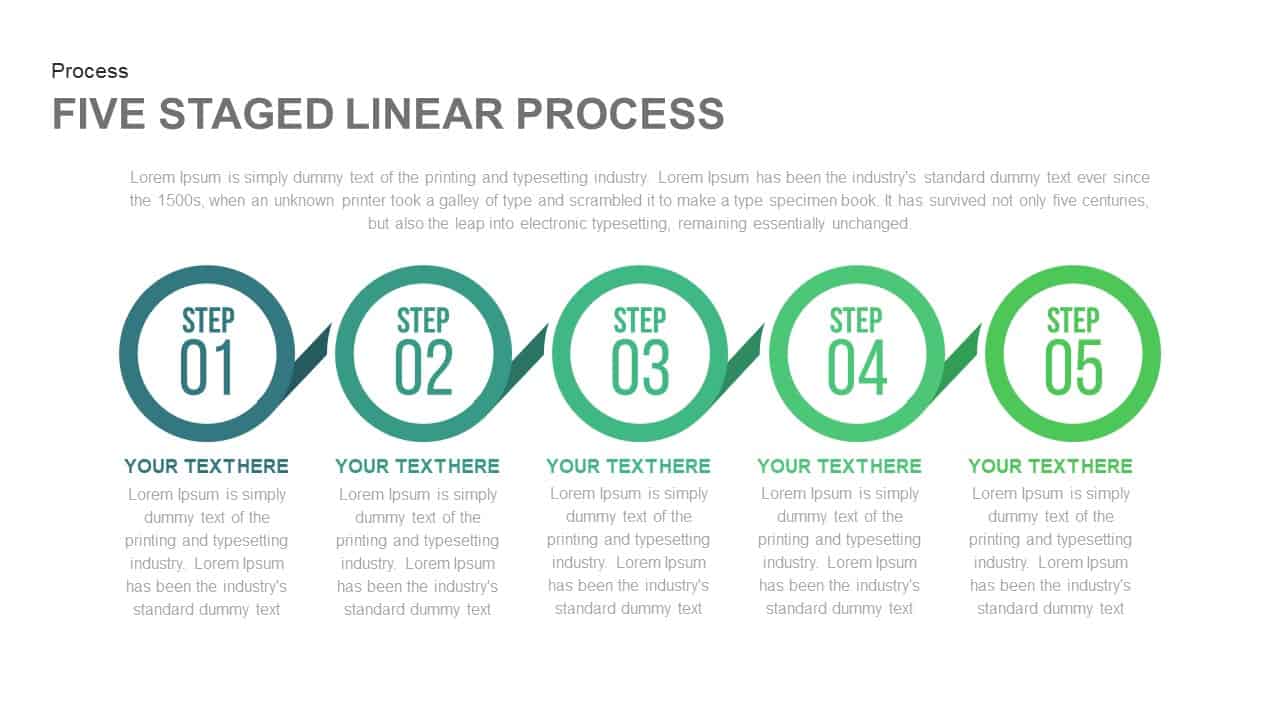
Five Staged Linear Process for PowerPoint & Google Slides
Process
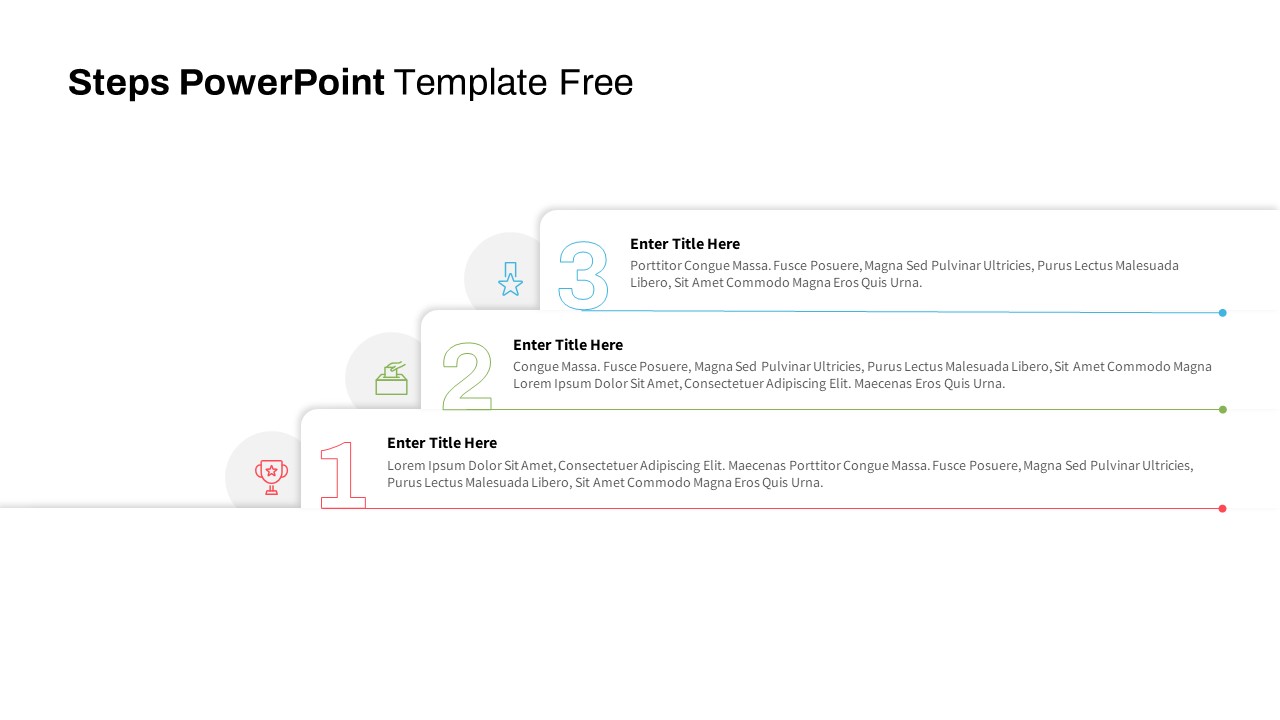
Free Linear Step Process Slide for PowerPoint & Google Slides
Process
Free
Four-Stage Linear Infographic Diagram Template for PowerPoint & Google Slides
Process
Five and Six Step Line Linear Stage Diagram for PowerPoint & Google Slides
Infographics
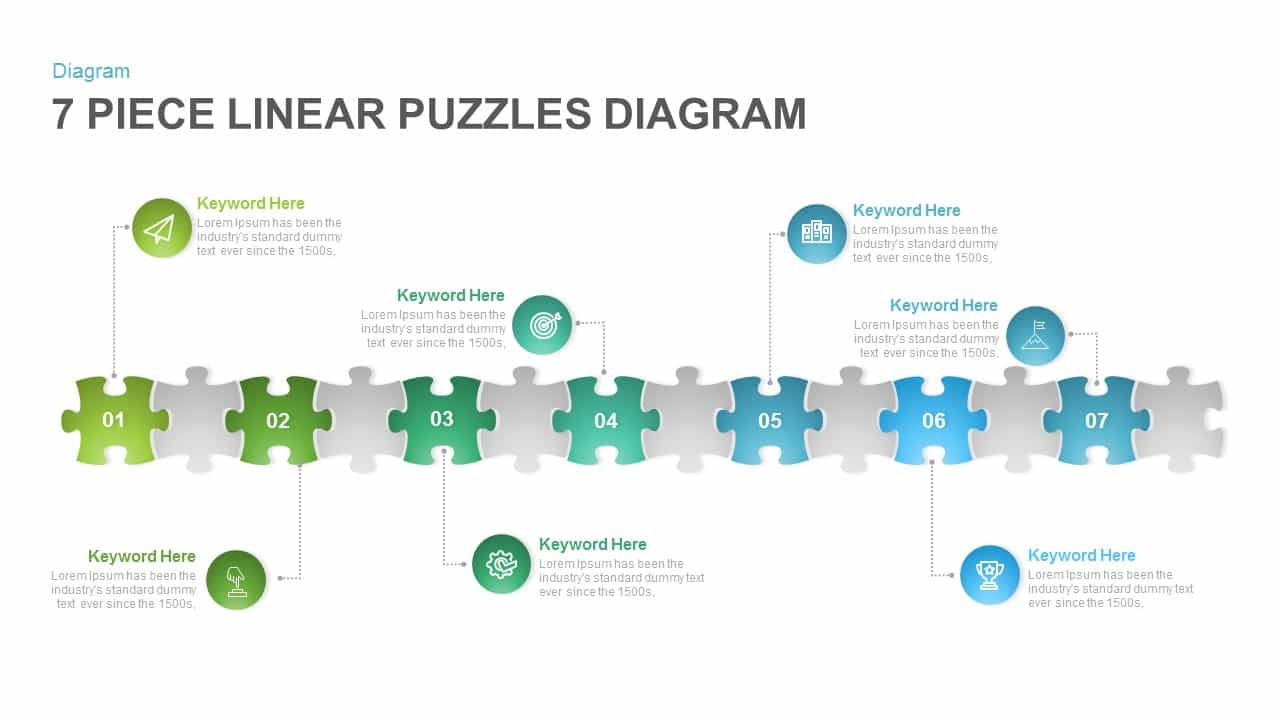
7 Piece Linear Puzzles Diagram for PowerPoint & Google Slides
Process
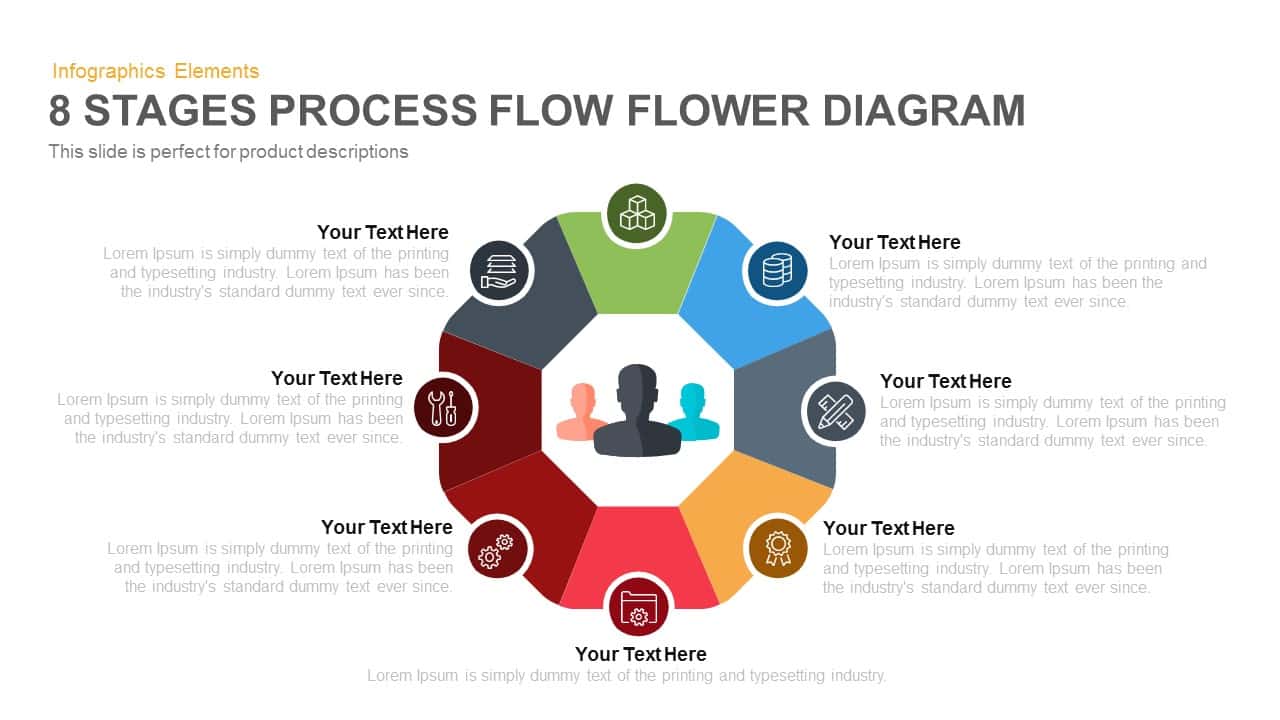
8-Stage Process Flow Flower Diagram Template for PowerPoint & Google Slides
Infographics
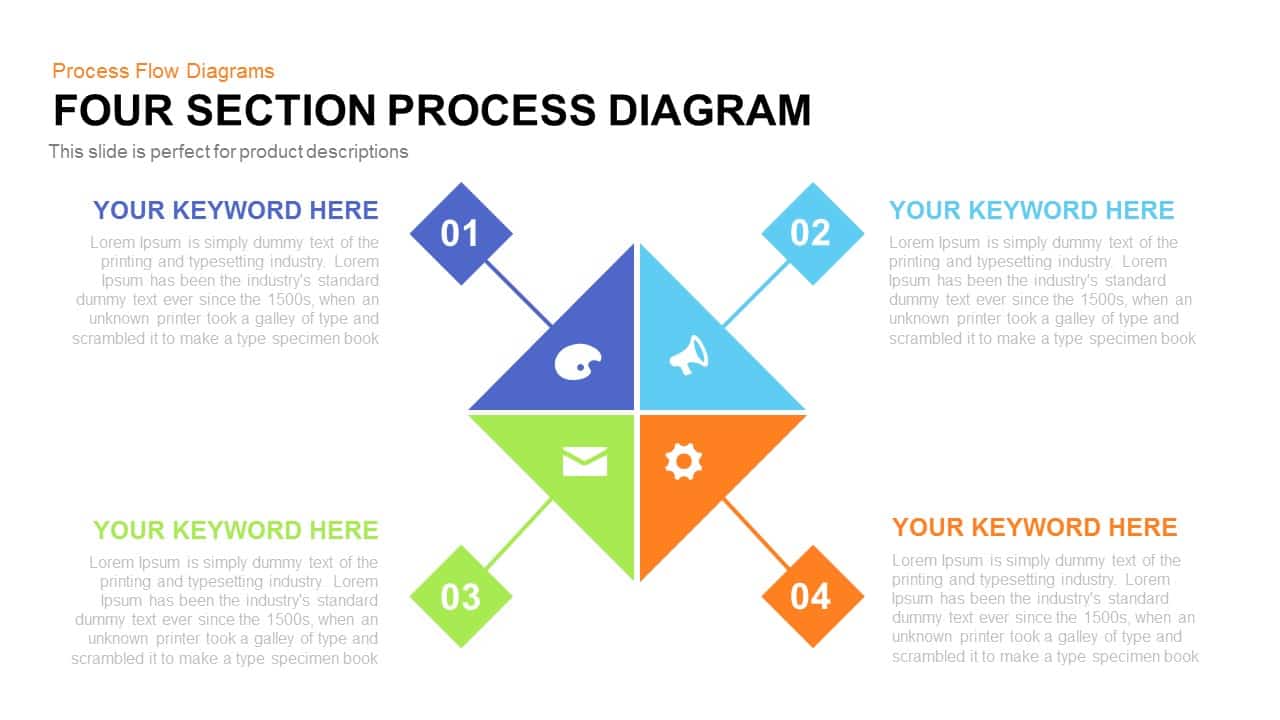
4 Section Pipe Diagram Process Flow Template for PowerPoint & Google Slides
Process
Dynamic Shield Process Flow Diagram template for PowerPoint & Google Slides
Process
Six Hexagon Stages Process Flow Diagram Template for PowerPoint & Google Slides
Process
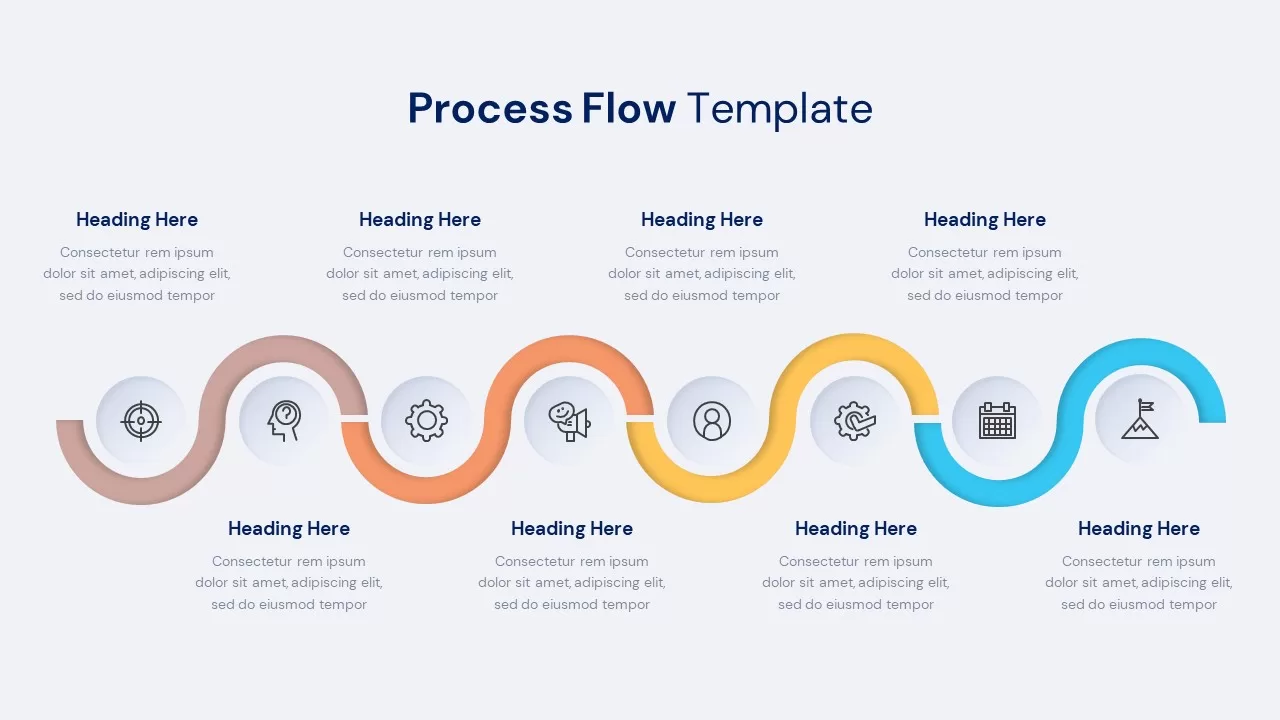
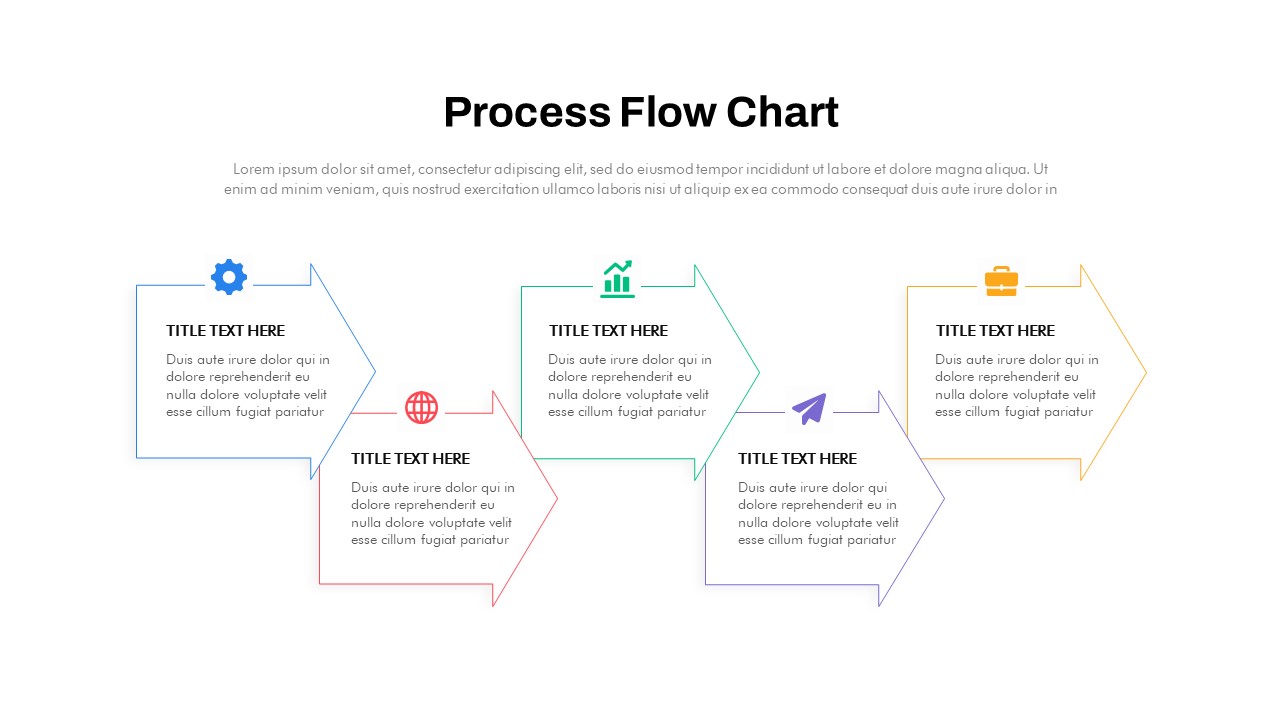
Process Flow Diagram template for PowerPoint & Google Slides
Infographics
15-Step Process Flow Diagram Template for PowerPoint & Google Slides
Process
Six-Stage Zig-Zag Process Flow Diagram Template for PowerPoint & Google Slides
Process
Vertical Business Process Flow Diagram Template for PowerPoint & Google Slides
Process
Six-Sided Shutter Diagram Process Flow Template for PowerPoint & Google Slides
Process
10 Stages Business Flow Process Diagram template for PowerPoint & Google Slides
Business
Eight-Stage Radial Process Flow Diagram Template for PowerPoint & Google Slides
Process
Four-Plus Process Flow Diagram Template for PowerPoint & Google Slides
Process
Six-Step Hexagon Process Flow Diagram Template for PowerPoint & Google Slides
Process
Five-Stage Circular Process Flow Diagram Template for PowerPoint & Google Slides
Circular
5-Stage Gear Process Flow Diagram Template for PowerPoint & Google Slides
Process
3D Seven-Stage Process Flow Diagram Template for PowerPoint & Google Slides
Process
Five-Stage Process Flow Diagram Template for PowerPoint & Google Slides
Process
8 Step Circular Process Flow Diagram Template for PowerPoint & Google Slides
Process
6-Step Business Process Flow Diagram Template for PowerPoint & Google Slides
Process
6-Step Circular Process Flow Diagram Template for PowerPoint & Google Slides
Process
Business Process Management Flow Diagram Template for PowerPoint & Google Slides
Process
Colorful 8-Stage Droplet Process Flow Diagram Template for PowerPoint & Google Slides
Process
Minimal Process Flow Diagram Infographic Template for PowerPoint & Google Slides
Process
Process Flow Diagram template for PowerPoint & Google Slides
Process
Curved Arrow Process Flow Diagram Template for PowerPoint & Google Slides
Process
Curved Arrow Process Flow Diagram Template for PowerPoint & Google Slides
Arrow
3D Conveyor Belt Process Flow Diagram Template for PowerPoint & Google Slides
Process
E-Waste Management Process Flow Diagram Template for PowerPoint & Google Slides
Process
Comprehensive Process Flow Diagram Template for PowerPoint & Google Slides
Process
Animated Gears Process Flow Diagram Template for PowerPoint & Google Slides
Process
Capital Investments Process Flow Diagram Template for PowerPoint & Google Slides
Process
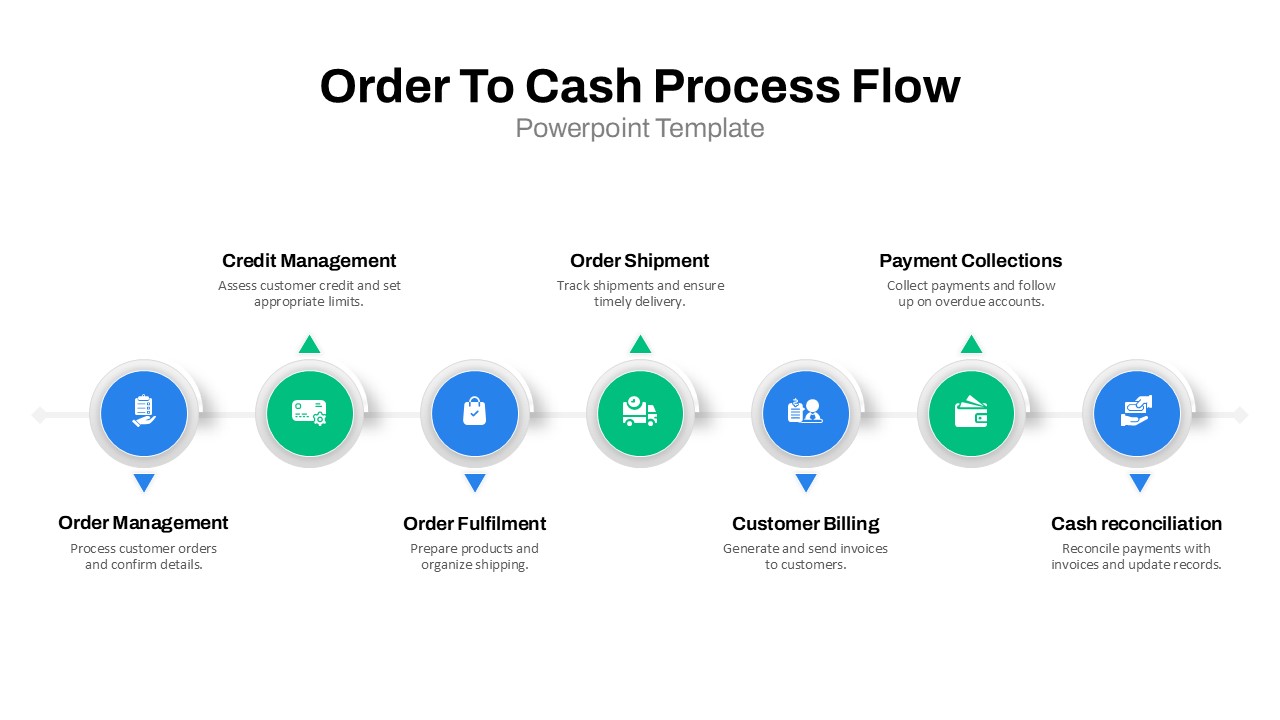
Order to Cash Process Flow Diagram Template for PowerPoint & Google Slides
Process
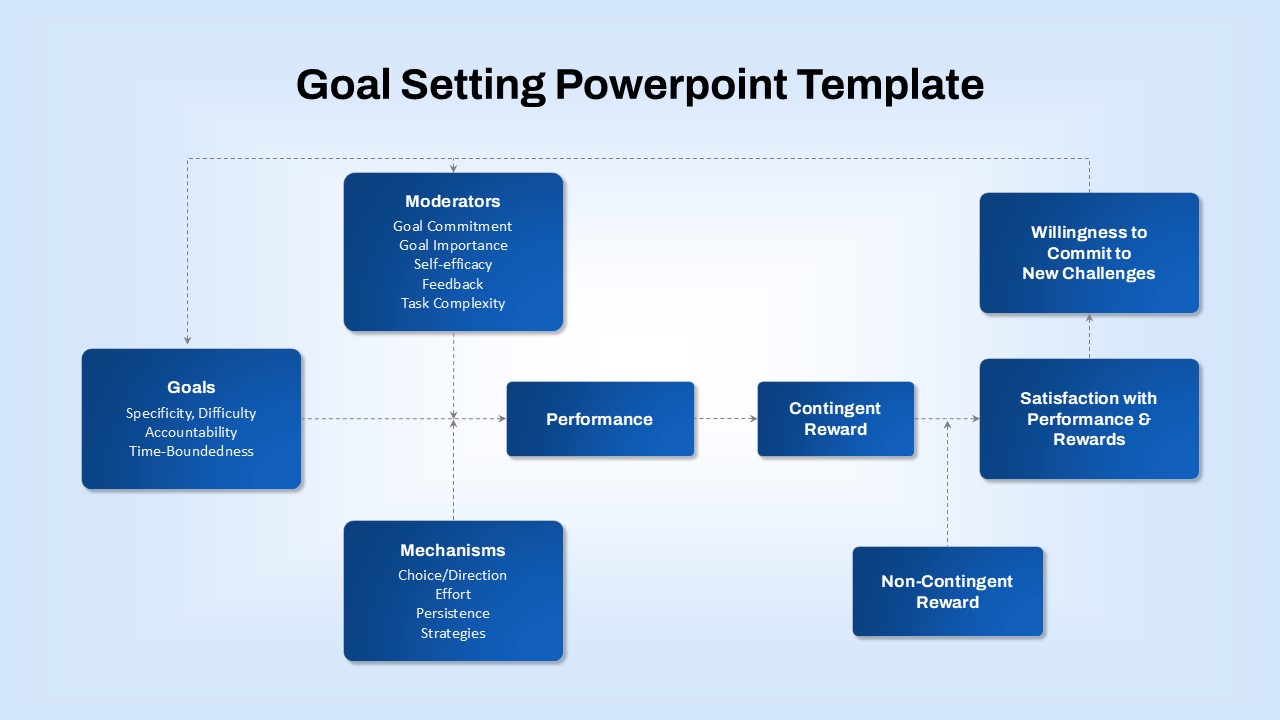
Goal-Setting Process Flow Diagram Template for PowerPoint & Google Slides
Goals
Resume Screening Process Flow Diagram Template for PowerPoint & Google Slides
Process
Q-Learning Process Flow Diagram Template for PowerPoint & Google Slides
Process
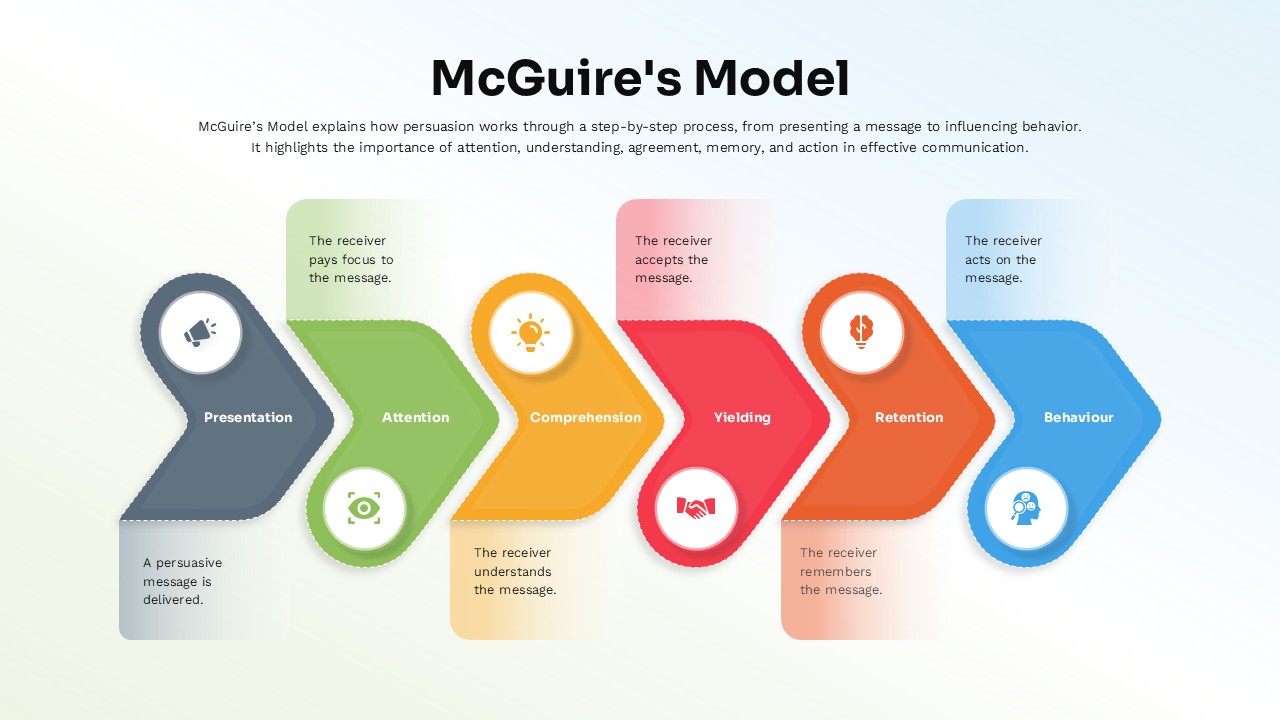
McGuire’s Persuasion Process Flow Diagram Template for PowerPoint & Google Slides
Marketing
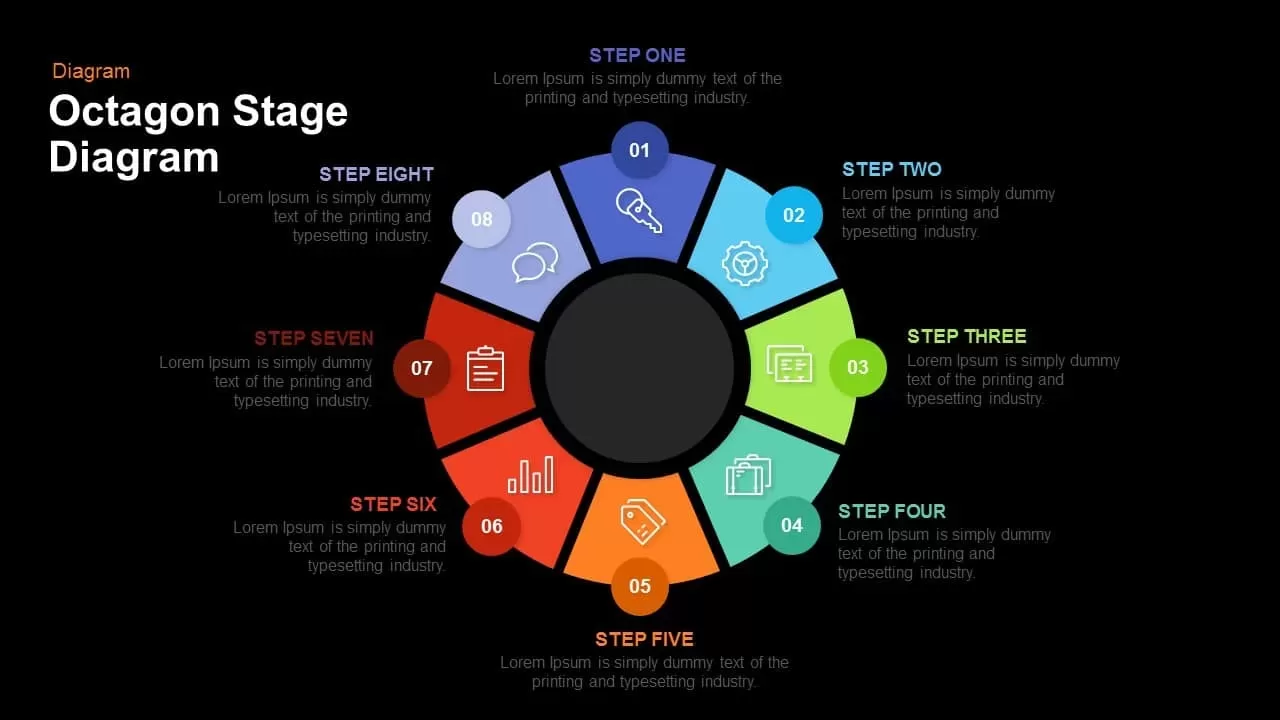
Octagon Stage Process Flow Diagram for PowerPoint & Google Slides
Process
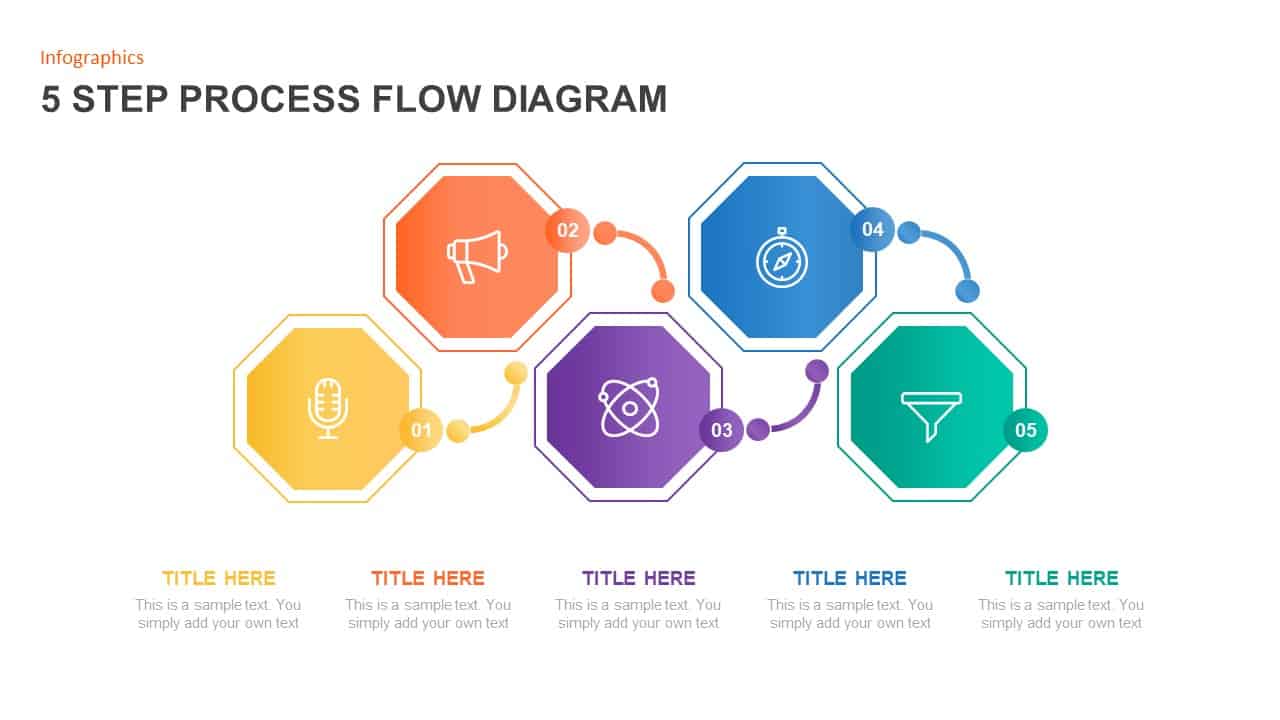
5 Step Process Flow Diagram for PowerPoint & Google Slides
Process

Color-Coded SIPOC Diagram with Process Flow for PowerPoint & Google Slides
Process
6 Step Process Flow Diagram for PowerPoint & Google Slides
Charts
Company Objective Linear Chart Template for PowerPoint & Google Slides
Flow Charts
Professional Linear Timeline Infographic Template for PowerPoint & Google Slides
Timeline
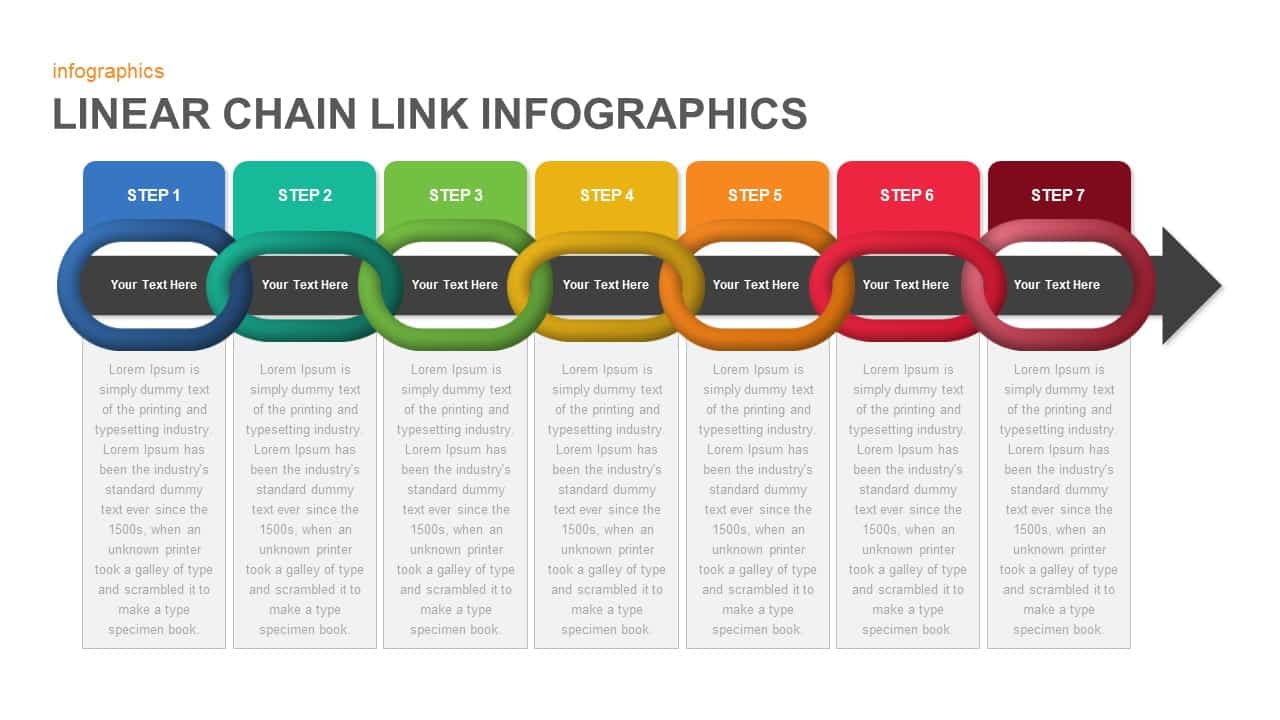
Linear Chain Link Infographics Template for PowerPoint & Google Slides
Process
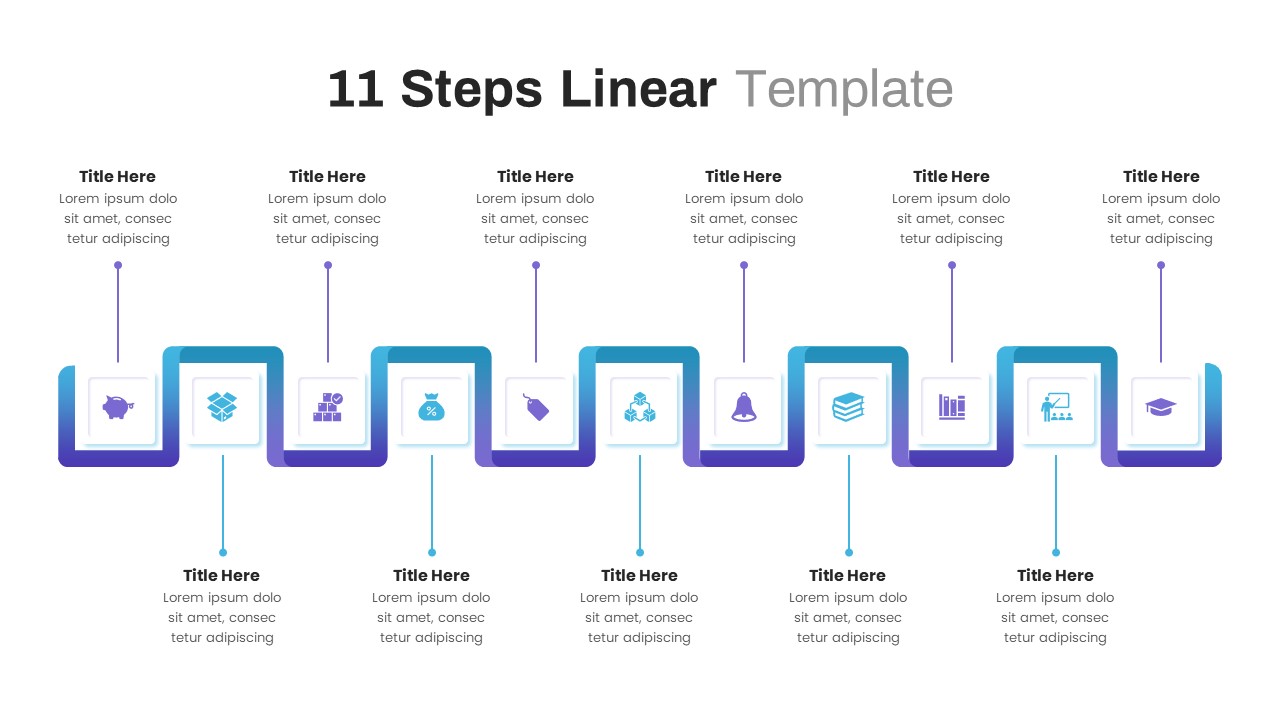
Modern 11-Step Linear Timeline Template for PowerPoint & Google Slides
Timeline
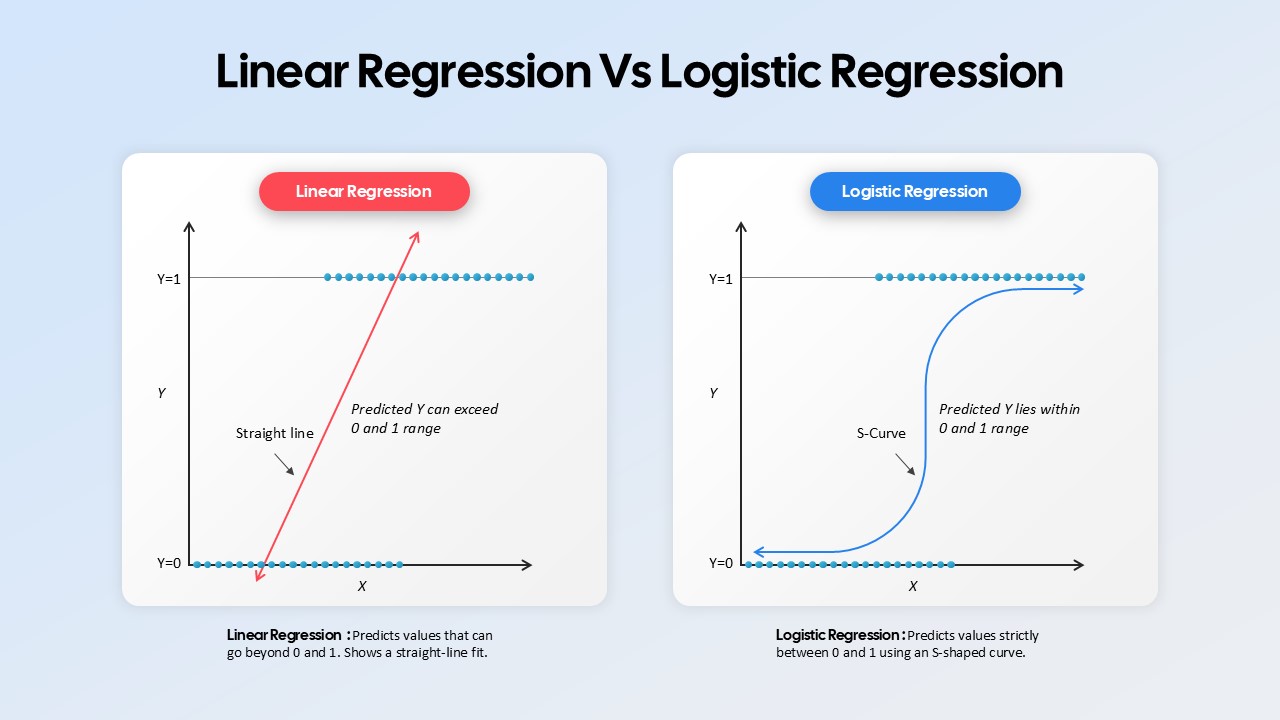
Linear Regression vs Logistic Regression Comparison template for PowerPoint & Google Slides
Comparison
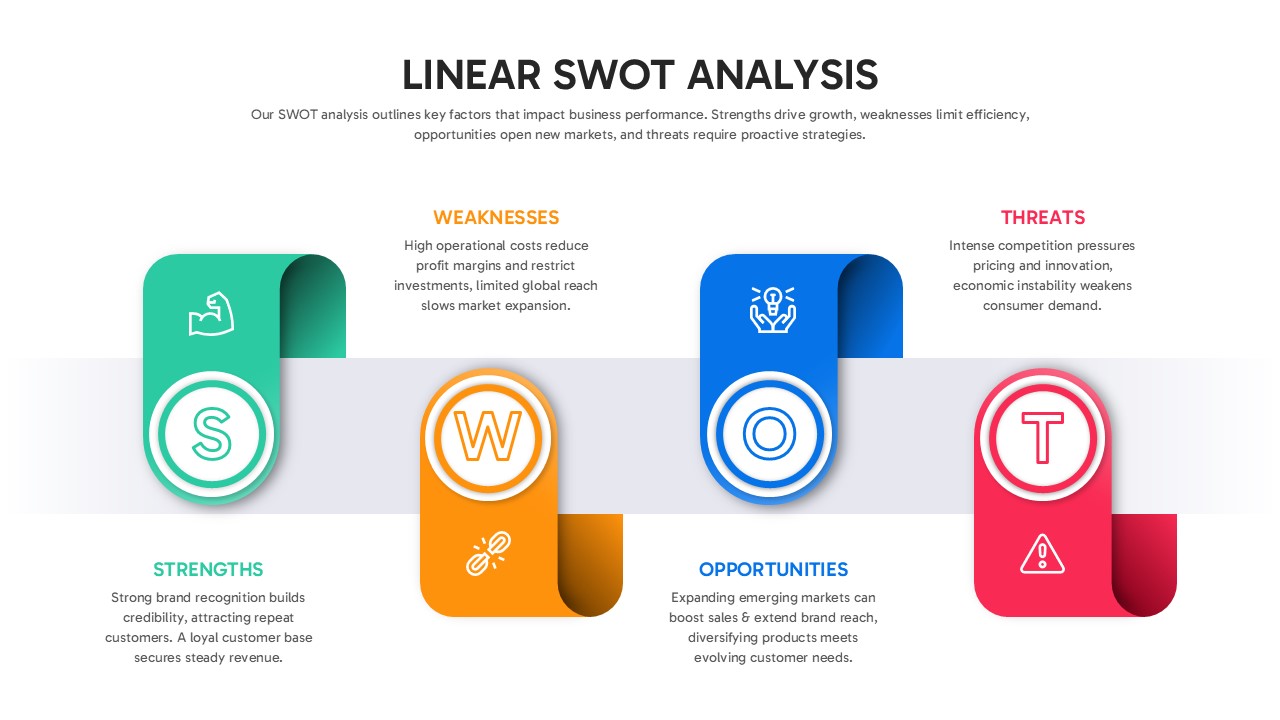
Linear SWOT Analysis Slide Template for PowerPoint & Google Slides
SWOT
5-Stage Arrow Infographics Process Flow Template for PowerPoint & Google Slides
Arrow
Four-Stage Circular Process Flow Template for PowerPoint & Google Slides
Process
Modern 5-Step Process Flow Infographic Template for PowerPoint & Google Slides
Process
Five-Step Process Flow Infographic Template for PowerPoint & Google Slides
Process
Free Colorful Process Flow Infographics Template for PowerPoint & Google Slides
Process
Free
Process Flow Overview template for PowerPoint & Google Slides
Business
Colorful Process Flow Template for PowerPoint & Google Slides
Process
Colorful Process Flow Infographics Template for PowerPoint & Google Slides
Process
Process Flow Template for PowerPoint & Google Slides
Process
Free
Process Flow Template for PowerPoint & Google Slides
Process
Free
Curved Arrow Process Flow Infographic Template for PowerPoint & Google Slides
Process
Curved Arrow Process Flow template for PowerPoint & Google Slides
Process
Circular Arrows Process Flow template for PowerPoint & Google Slides
Process
Curved Arrow Process Flow template for PowerPoint & Google Slides
Process
Animated Accordion Process Flow Template for PowerPoint & Google Slides
Process
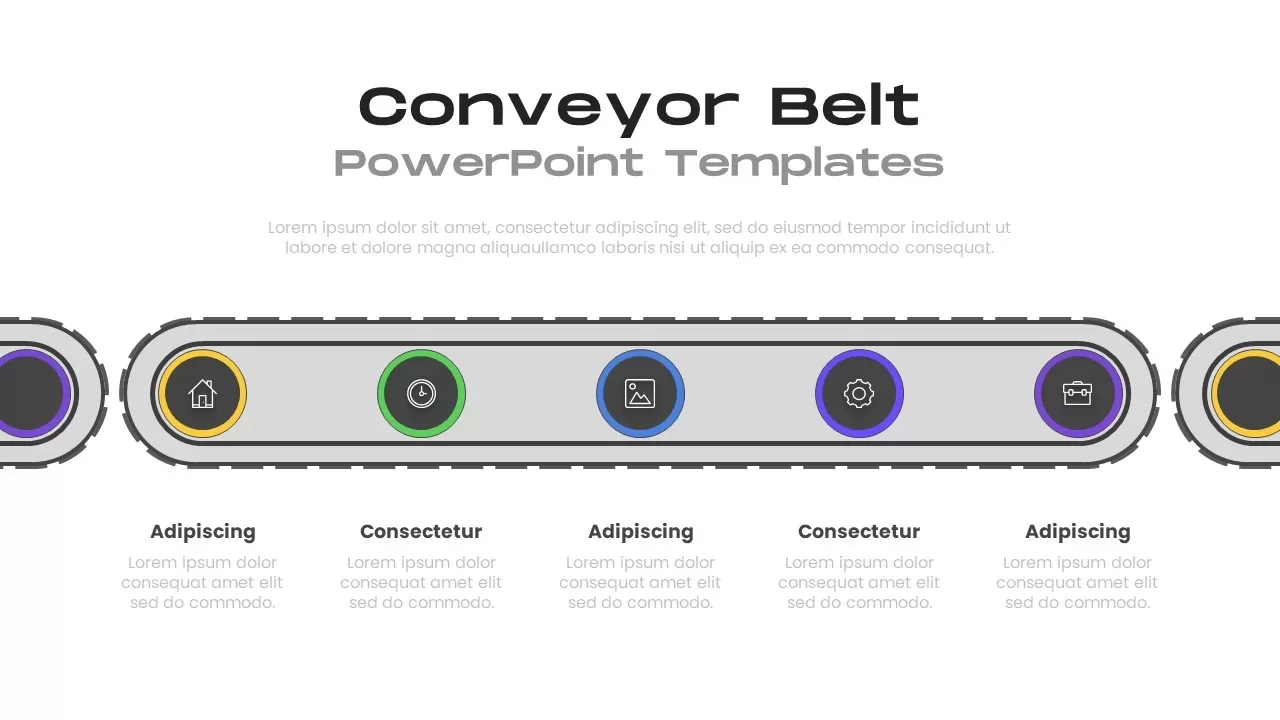
Conveyor Belt Infographic Process Flow Template for PowerPoint & Google Slides
Process
Comprehensive Hiring Process Flow Chart Template for PowerPoint & Google Slides
Flow Charts
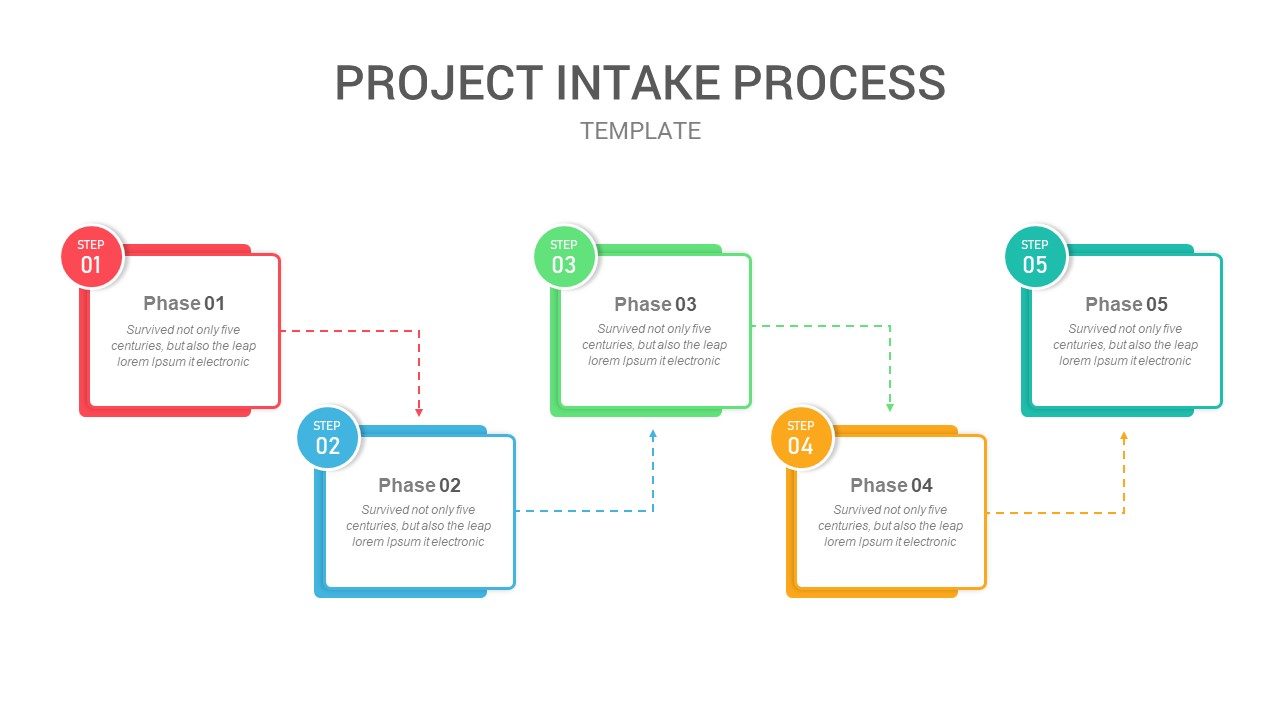
Five-Phase Project Intake Process Flow Template for PowerPoint & Google Slides
Process
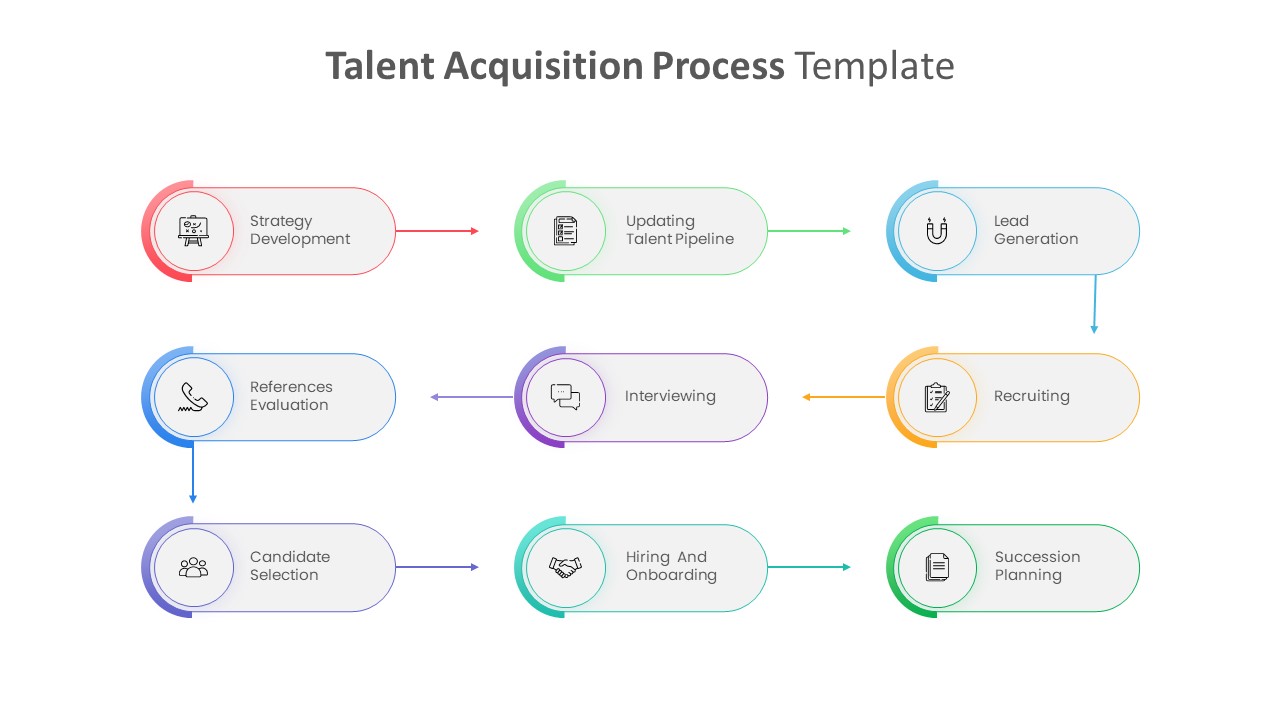
Talent Acquisition Process Flow Template for PowerPoint & Google Slides
Recruitment
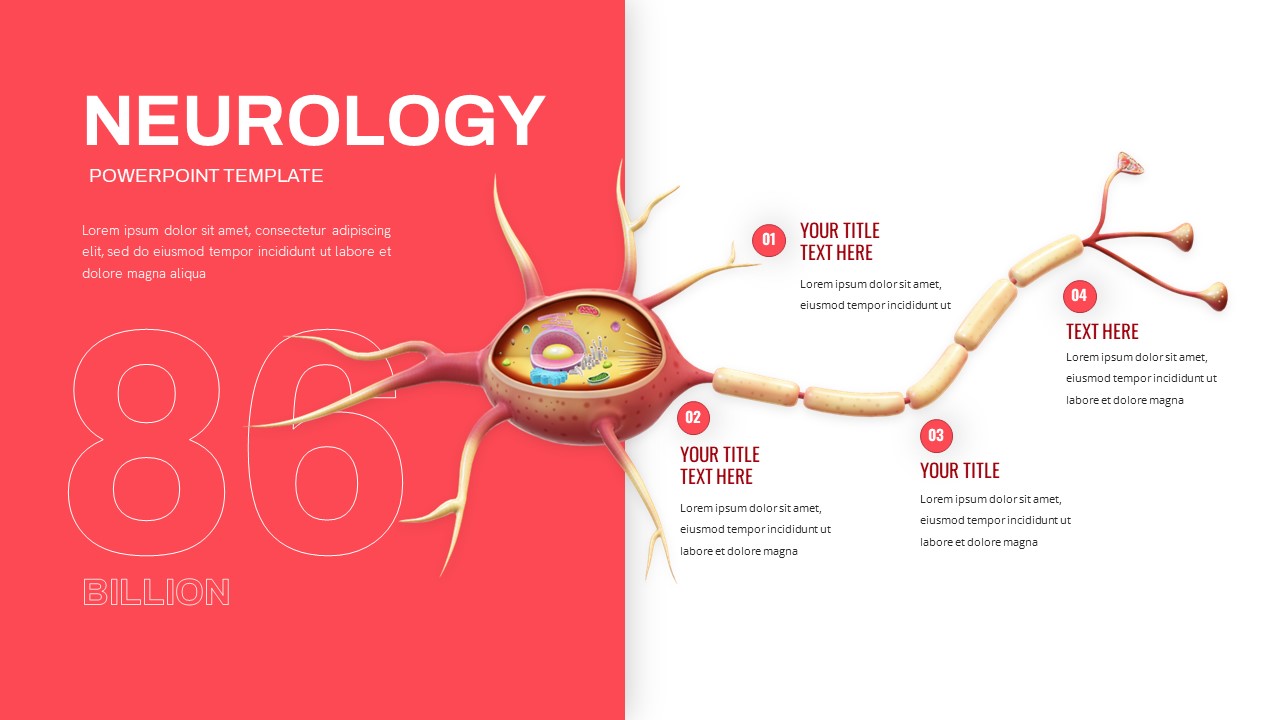
Neurology Neuron Structure Process Flow Template for PowerPoint & Google Slides
Health
Animated Process Flow Chart Template for PowerPoint & Google Slides
Infographics
Chevron Process Flow Sequence Slide Template for PowerPoint & Google Slides
Arrow
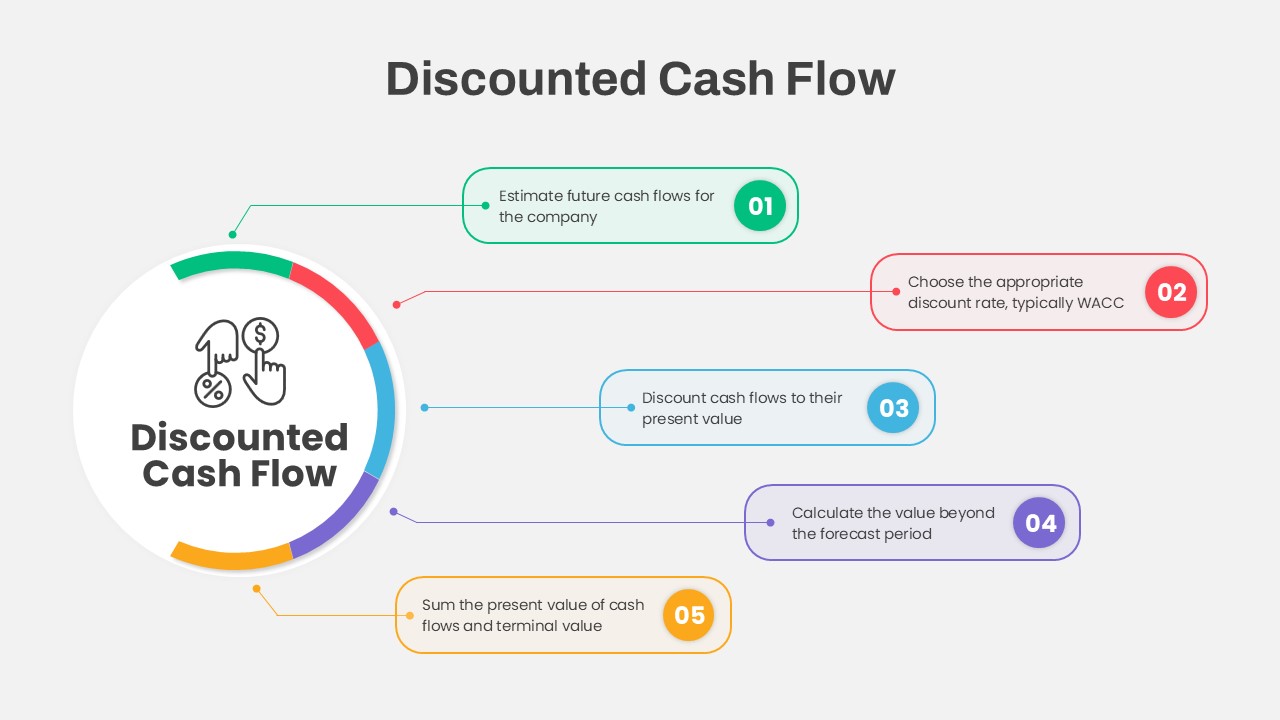
Discounted Cash Flow Five-Step Process Template for PowerPoint & Google Slides
Process
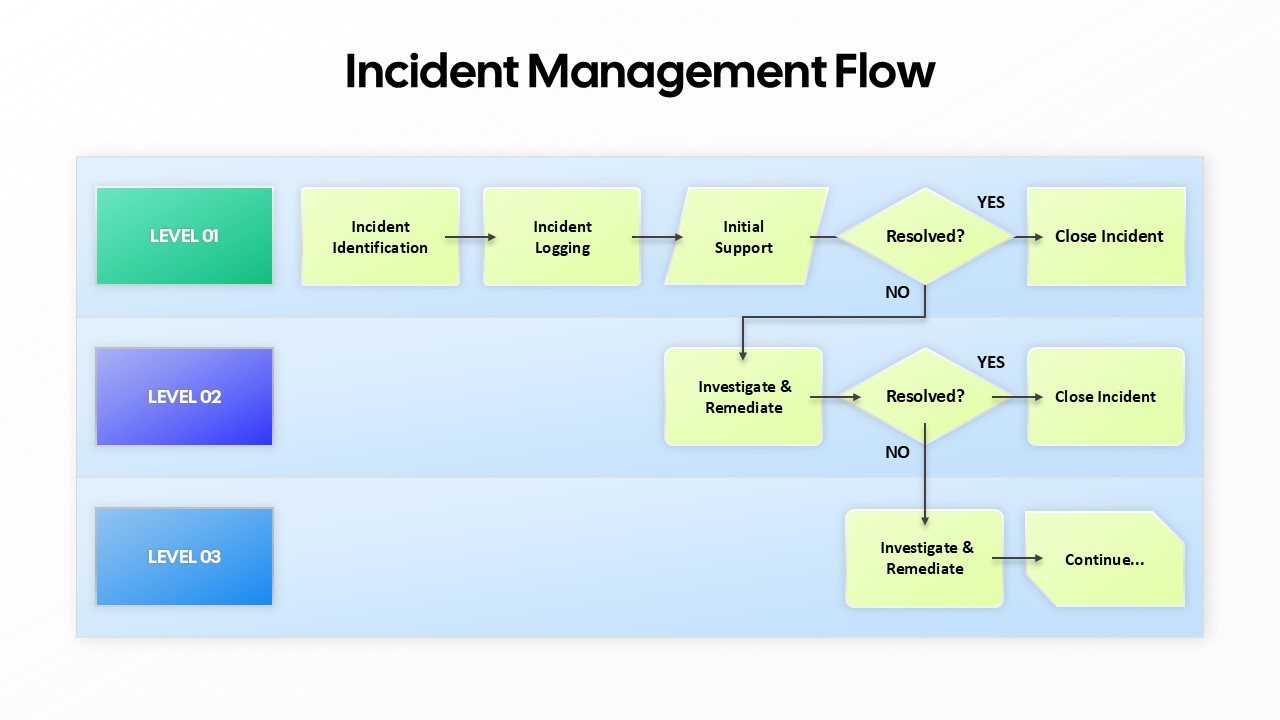
Incident Management Flow Process template for PowerPoint & Google Slides
Flow Charts