Free Layer Infographics template for PowerPoint & Google Slides


Description
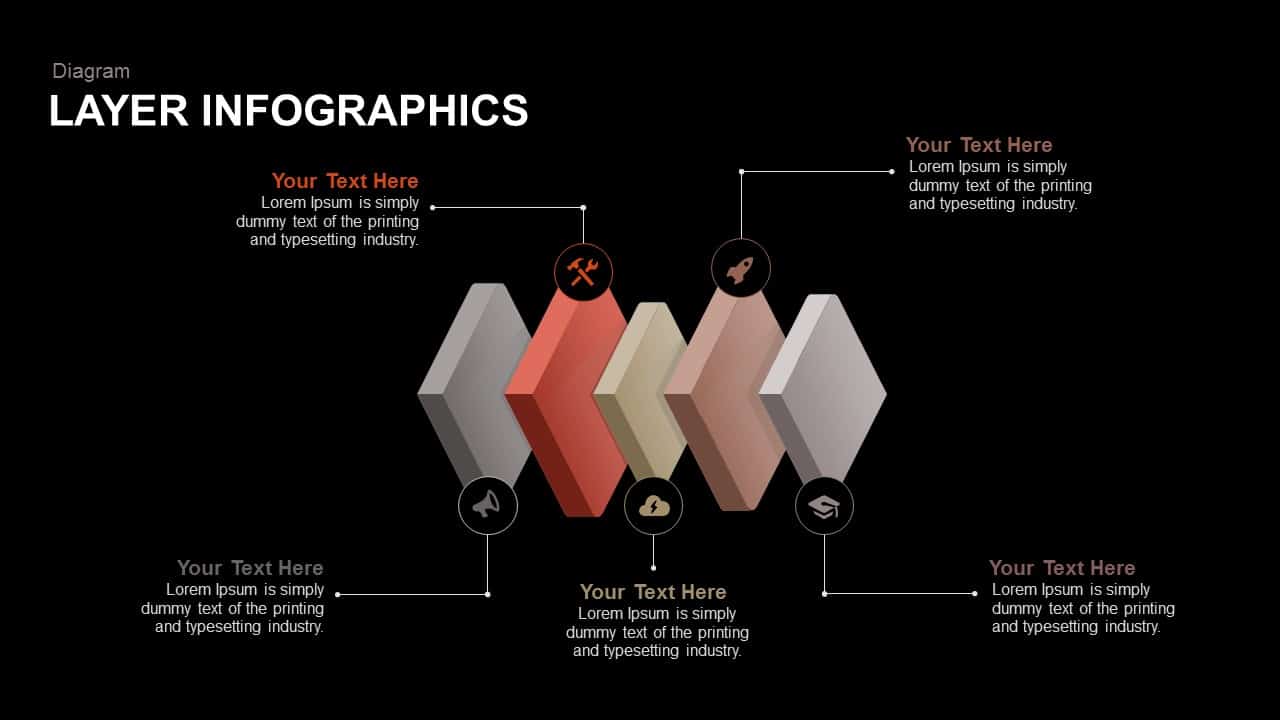
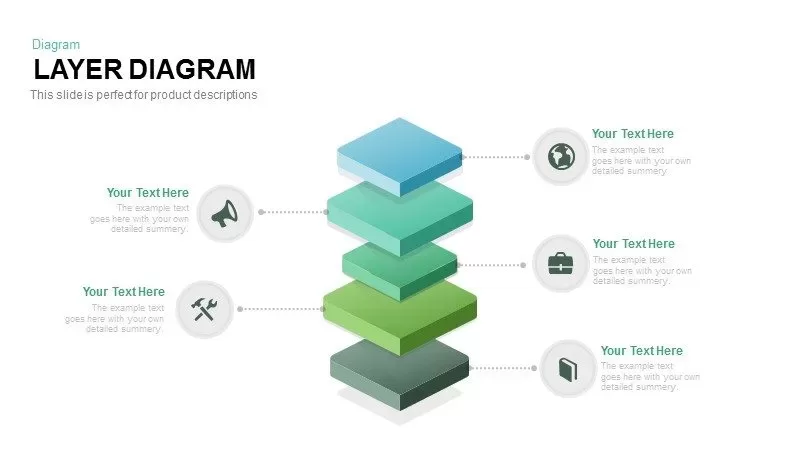
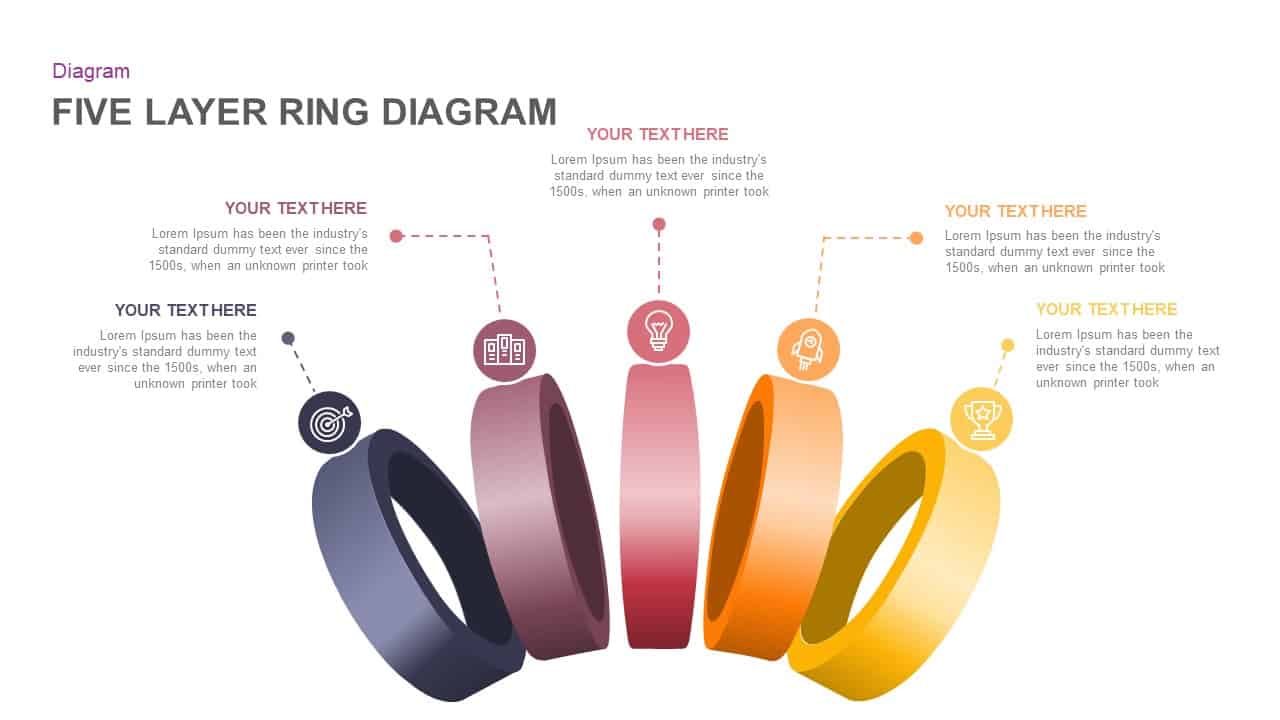
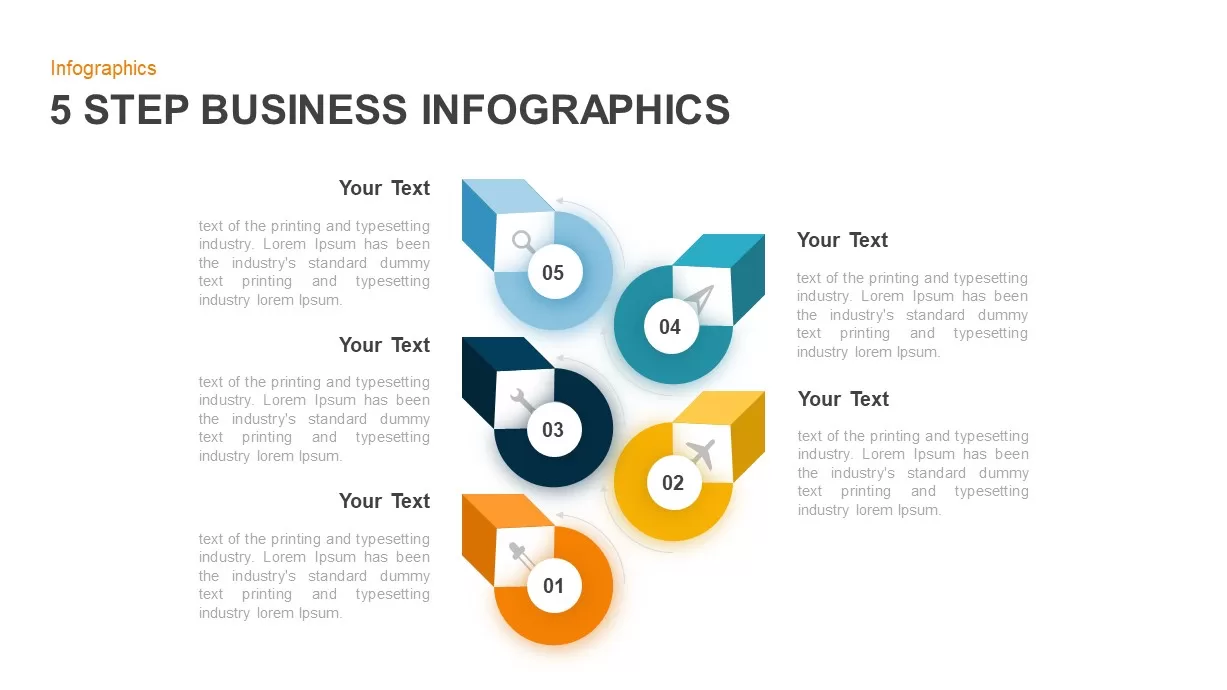
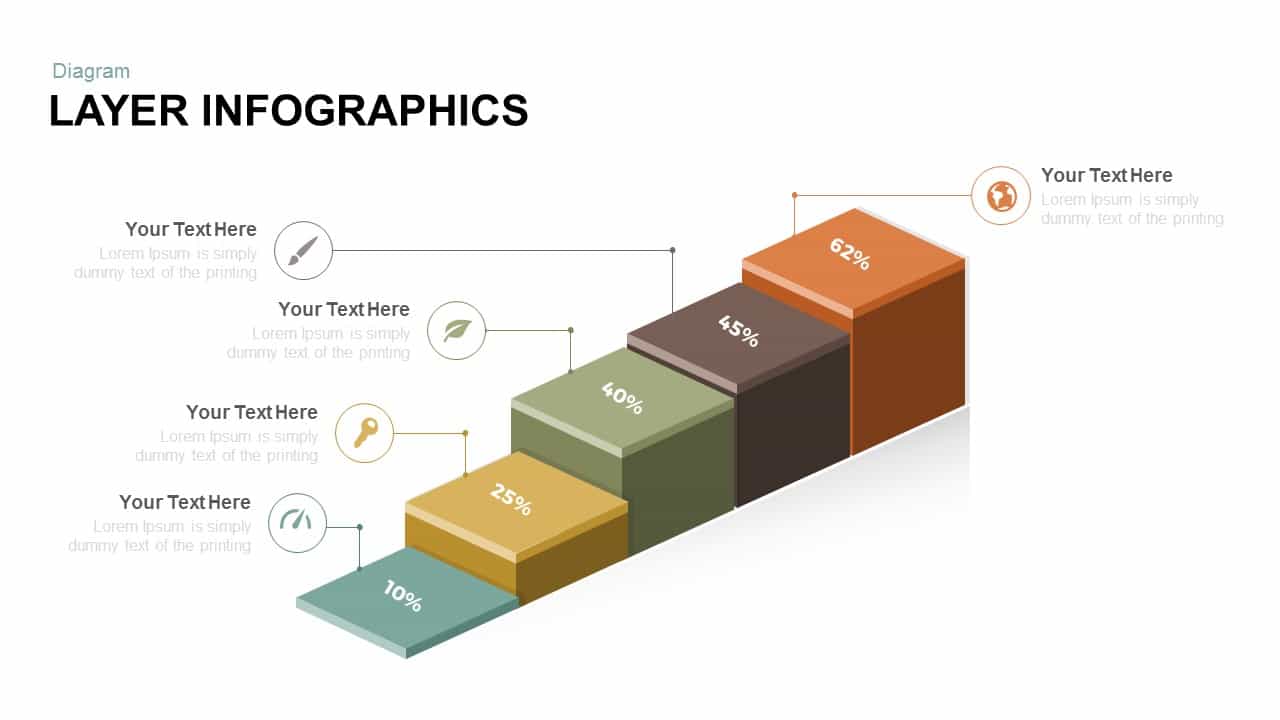
This dynamic layer infographic template is designed to visually represent hierarchical or sequential data in a stepped format. The infographic consists of five layers, each represented by a block with an icon and percentage indicator, showing progressive stages of growth or completion. The varying block colors, ranging from light green to dark orange, offer a clean and professional look, while the percentage values allow for easy understanding of progress or distribution. The icons above each block—such as a pencil, leaf, key, magnifying glass, and globe—provide context to each layer, helping you effectively communicate the specific element or milestone.
This template is highly customizable, with easy-to-edit text fields and icons, making it ideal for presenting data, project stages, or process flows. Whether you’re presenting business performance metrics, project progress, or any other layered information, this infographic offers a visually engaging way to break down complex concepts. It works perfectly across both PowerPoint and Google Slides, ensuring consistency in design and presentation quality on all devices.
Who is it for
This template is ideal for professionals in business, marketing, project management, or education who need to present layered data or sequential information. It is perfect for project managers, business analysts, marketing teams, and educators who need to display progress, growth, or stages in a clear, structured way.
Other Uses
In addition to business and project progress presentations, this template can be used to showcase market research data, sales growth, academic achievements, or process improvements. It can also be adapted for presenting survey results, product development stages, or any situation requiring a clear, layered visual structure.
Login to download this file

Item ID
SBF00017
Related Templates

Layer Infographics template for PowerPoint & Google Slides
Process
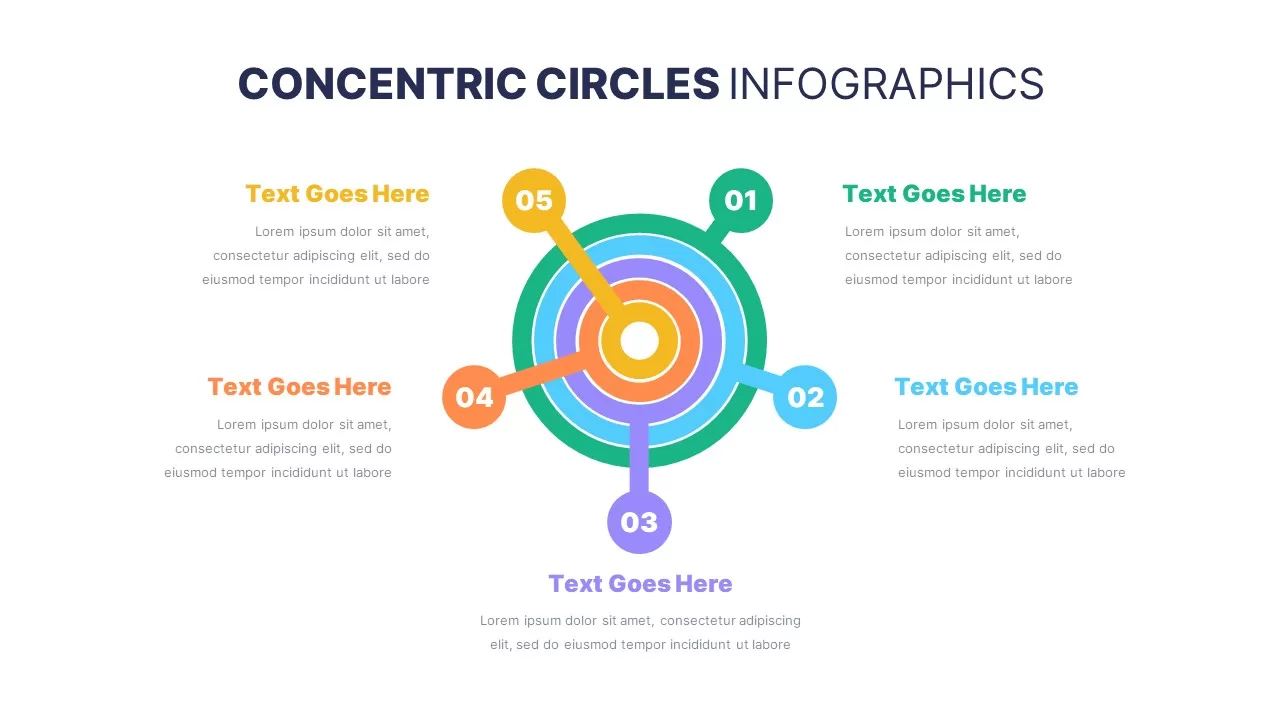
5 Layer Concentric Circles Infographics Template for PowerPoint & Google Slides
Circular
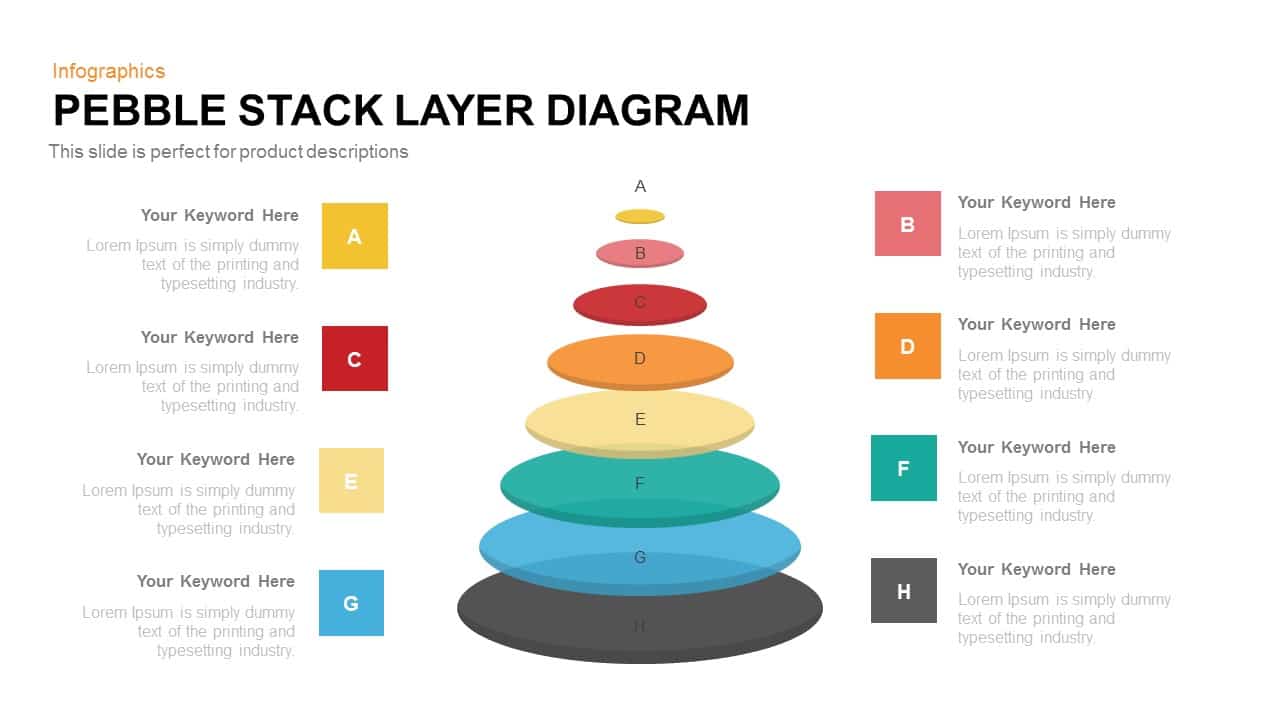
Pebble Stack Layer Template for PowerPoint and Google Slides
Infographics
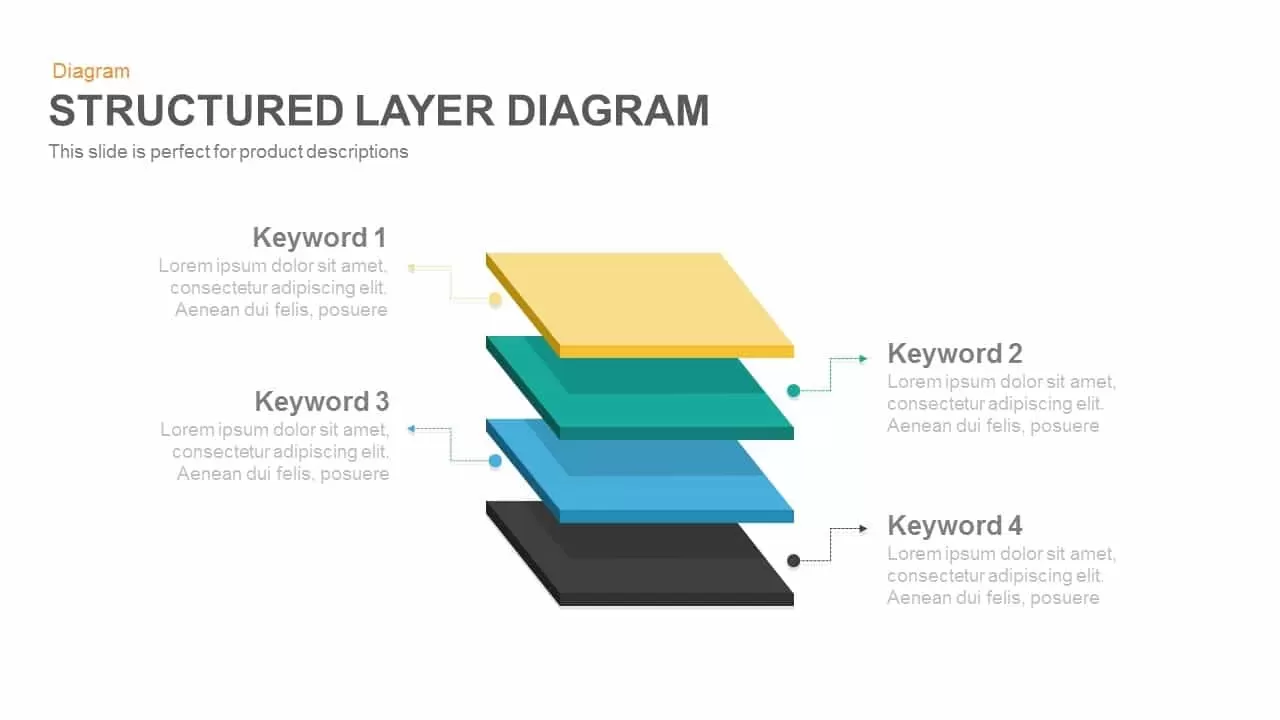
Professional Structured 3D Layer Diagram Template for PowerPoint & Google Slides
Process
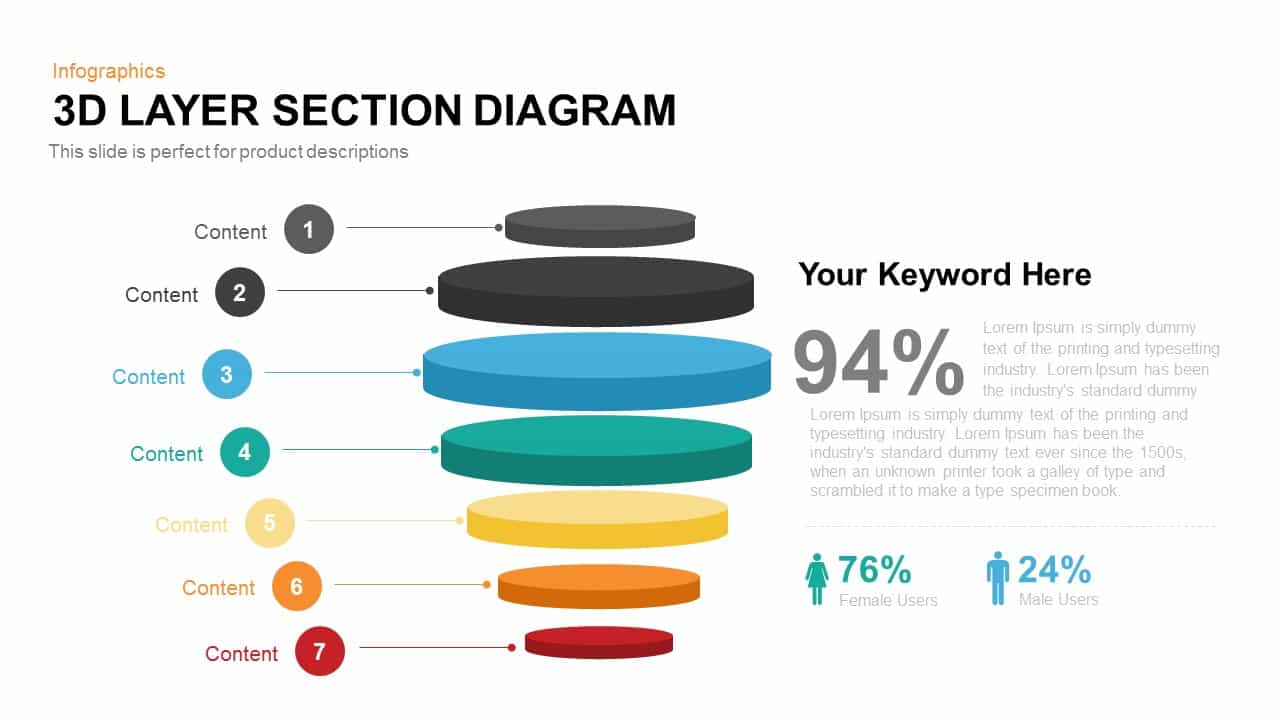
Modern 3D Layer Section Diagram Template for PowerPoint & Google Slides
Circular

Five Layer Product Architecture Diagram Template for PowerPoint & Google Slides
Process
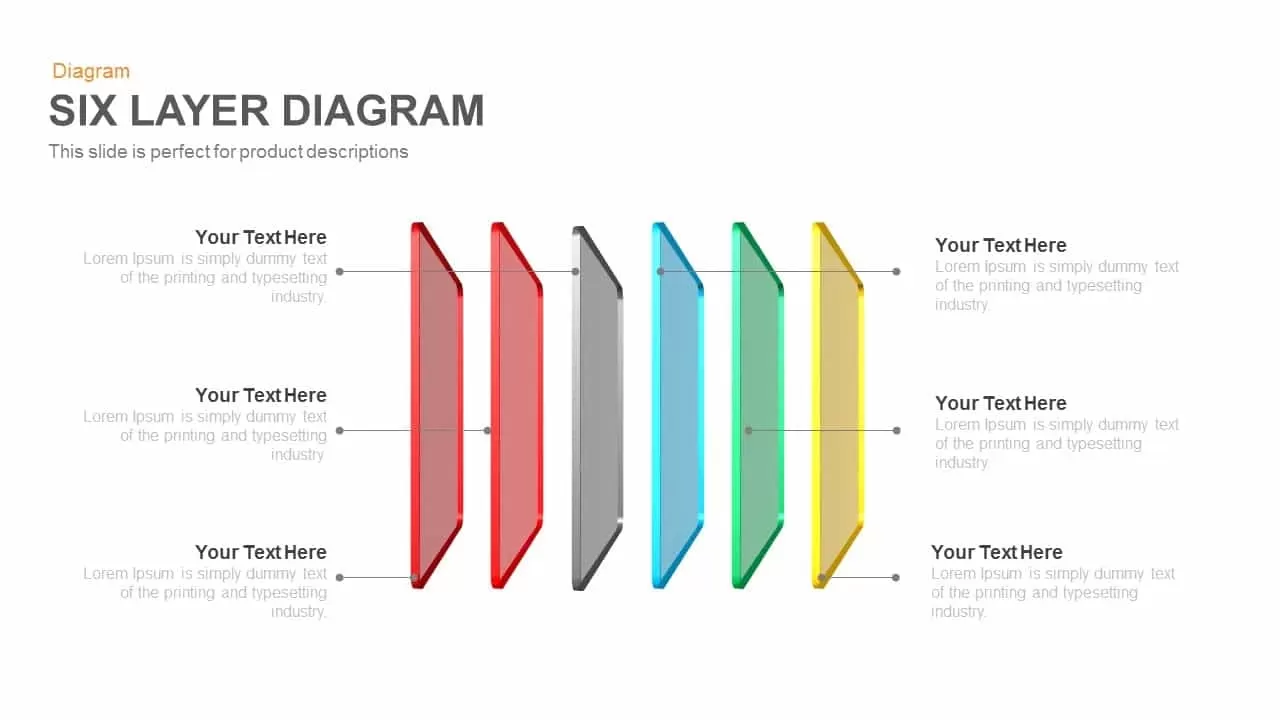
Six Layer Diagram template for PowerPoint & Google Slides
Process

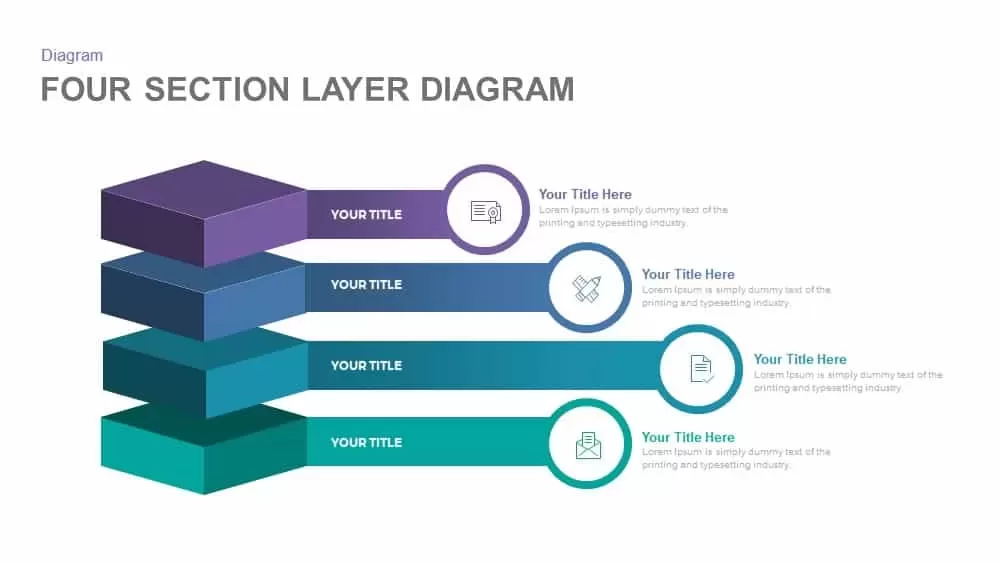
Professional Four-Section Layer Diagram Template for PowerPoint & Google Slides
Process
Five Layer Circular Ring Diagram Template for PowerPoint & Google Slides
Circular
Concentric Four-Layer Core Diagram Template for PowerPoint & Google Slides
Circular
Six-Layer 3D Block Stack Infographic Template for PowerPoint & Google Slides
Process
Onion Layer Infographic Diagram Template for PowerPoint & Google Slides
Process
Five-Layer Onion Diagram Infographic Template for PowerPoint & Google Slides
Process
4-Layer Human-Centric Onion Diagram Template for PowerPoint & Google Slides
Process
Free Gear Infographics template for PowerPoint & Google Slides
Process
Free
Free Cycle Object Infographics template for PowerPoint & Google Slides
Process
Free
Free Pyramid Infographics template for PowerPoint & Google Slides
Pyramid
Free
Free Creative Hemisphere Infographics template for PowerPoint & Google Slides
Infographics
Free
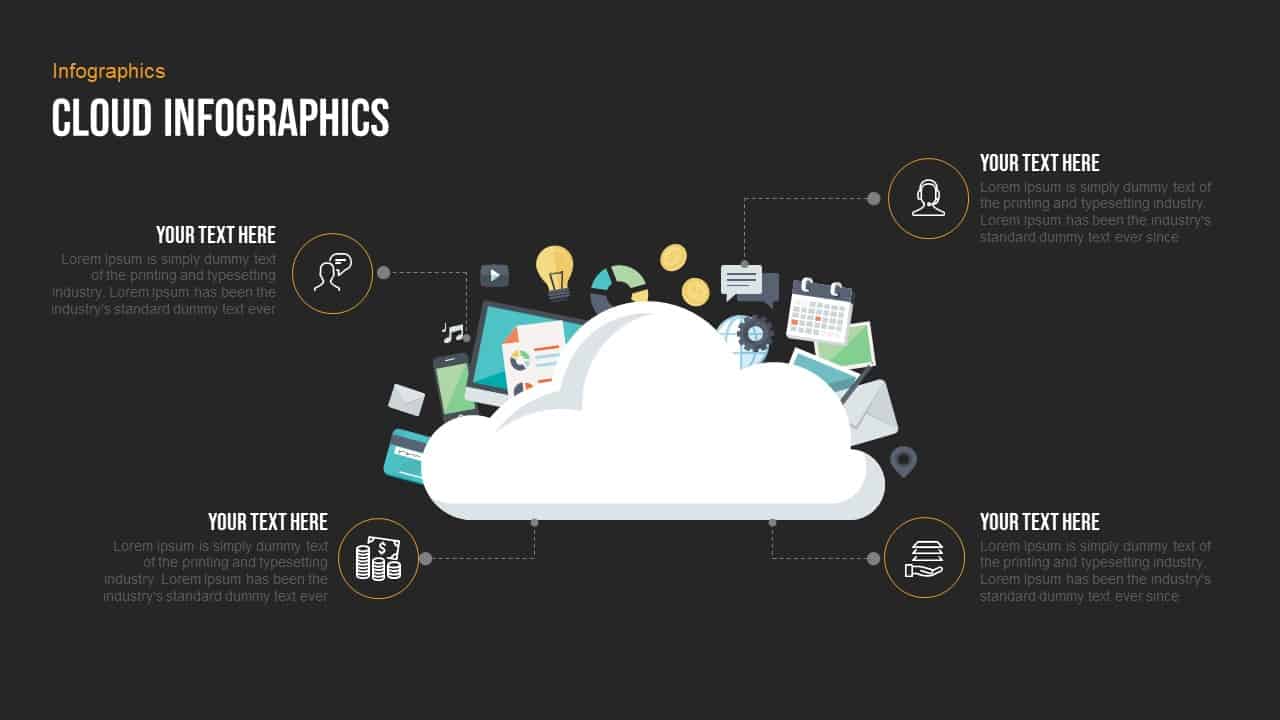
Free Professional Cloud Infographics Template for PowerPoint & Google Slides
Process
Free
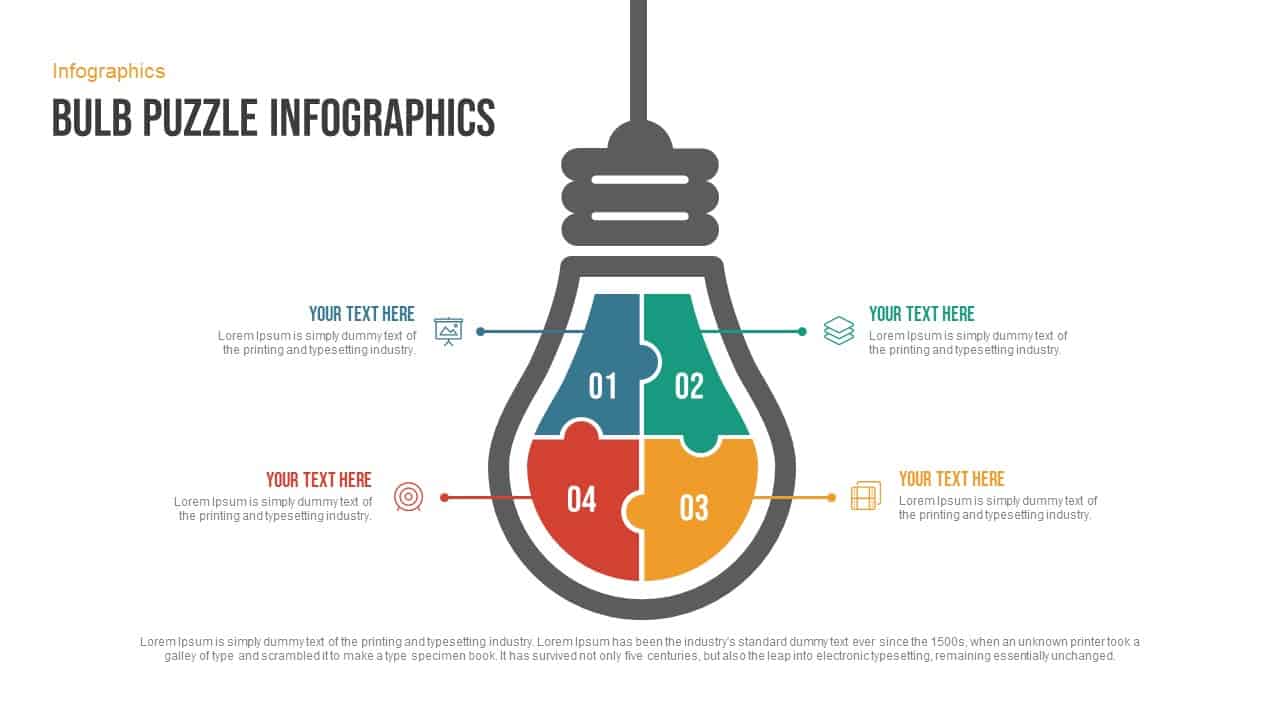
Free Bulb Puzzle Infographics Diagram Template for PowerPoint & Google Slides
Process
Free

Free Colorful Process Flow Infographics Template for PowerPoint & Google Slides
Process
Free
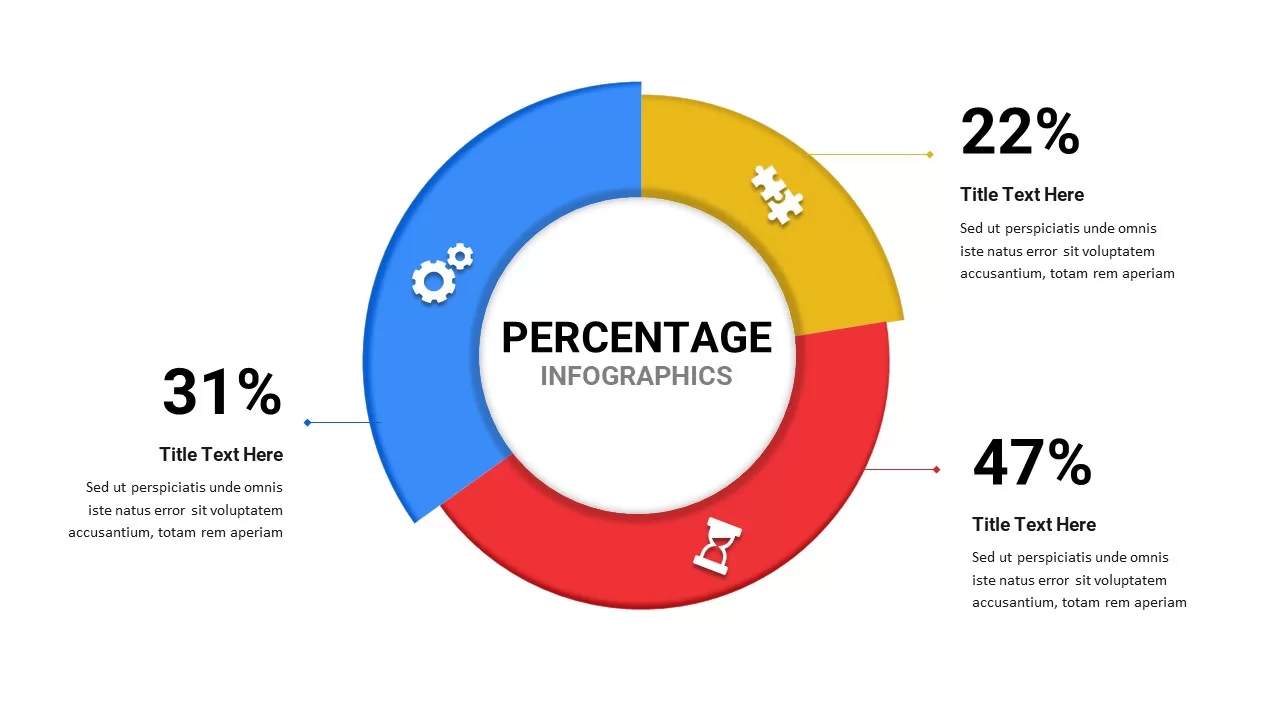
Free Percentage Infographics template for PowerPoint & Google Slides
Comparison
Free
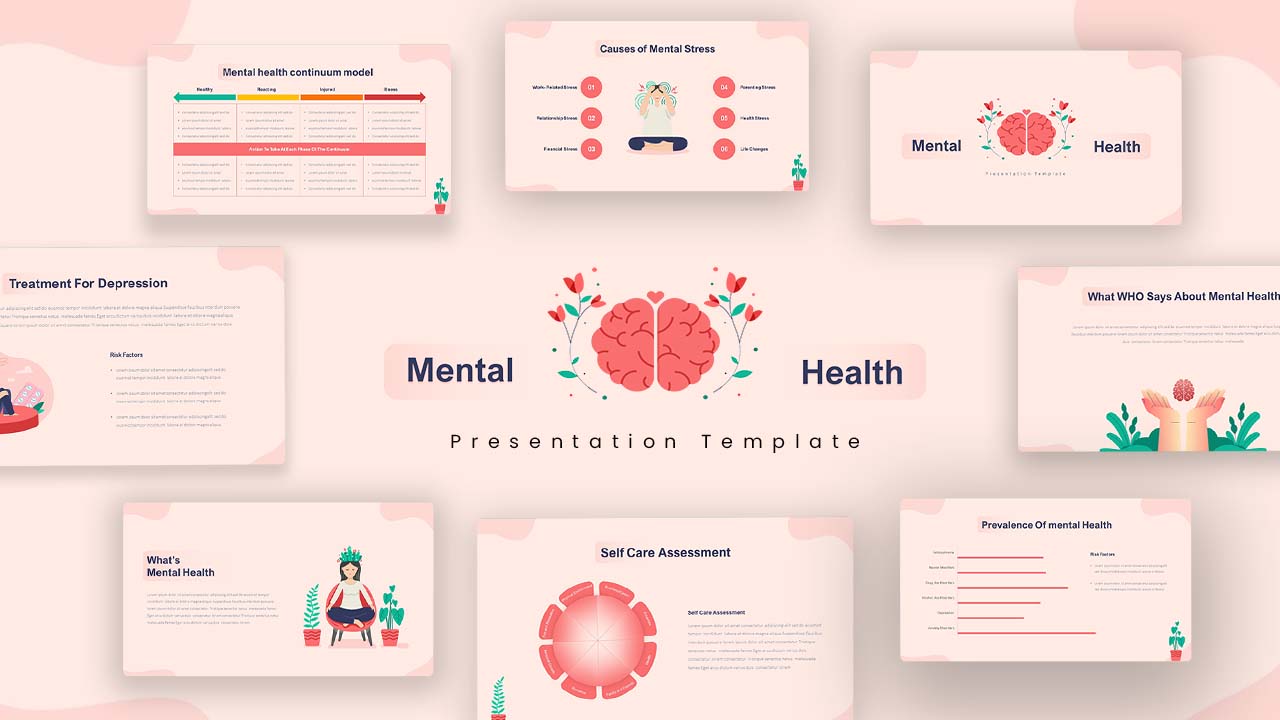
Free Mental Health Awareness & Infographics Presentation Template for PowerPoint & Google Slides
Health
Free
Free Roadmap Infographics Pack Template for PowerPoint & Google Slides
Pitch Deck
Free

Free Colorful Timeline Infographics Template for PowerPoint & Google Slides
Timeline
Free
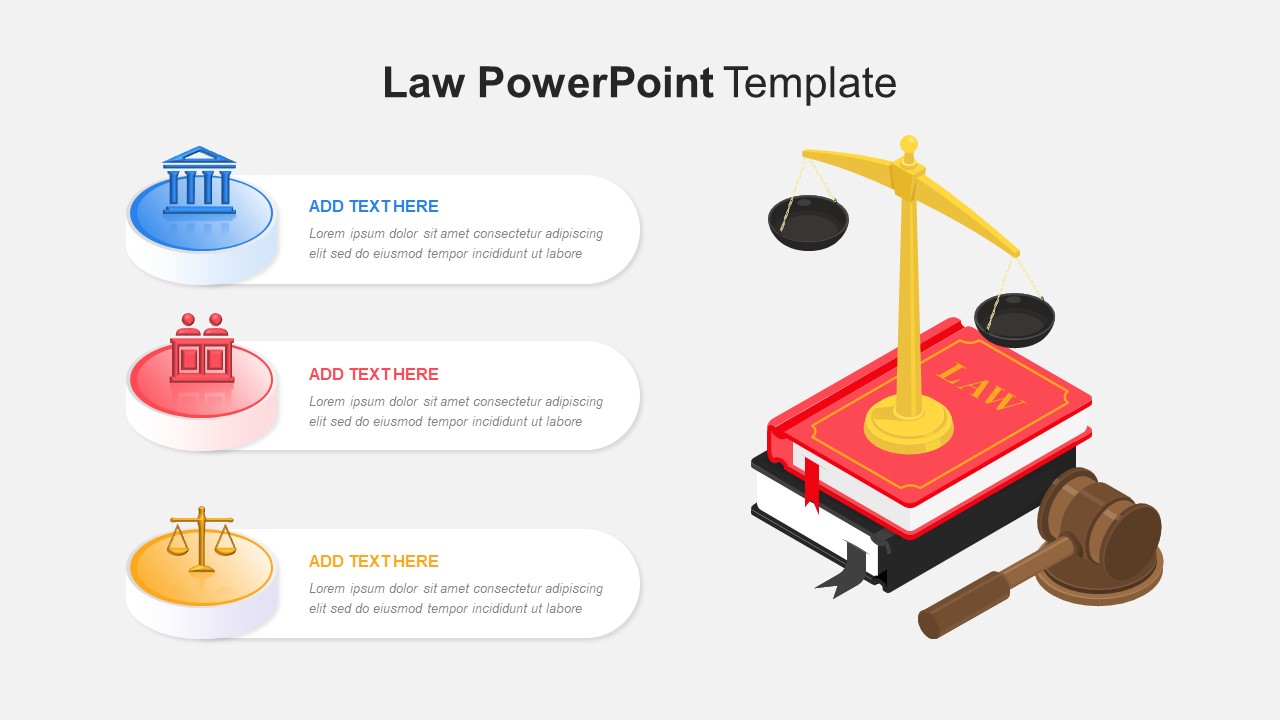
Free Law Infographics Slide Pack Collection Template for PowerPoint & Google Slides
Infographics
Free
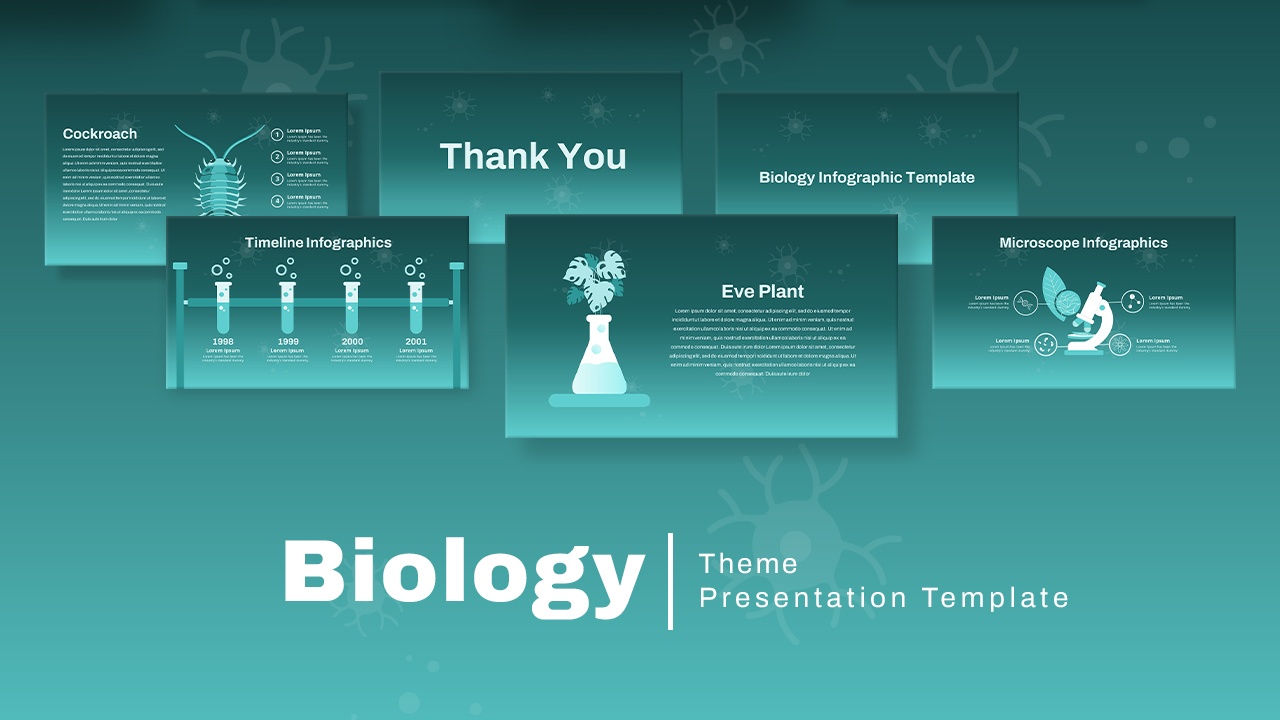
Free Biology Theme Infographics Deck Template for PowerPoint & Google Slides
Health
Free
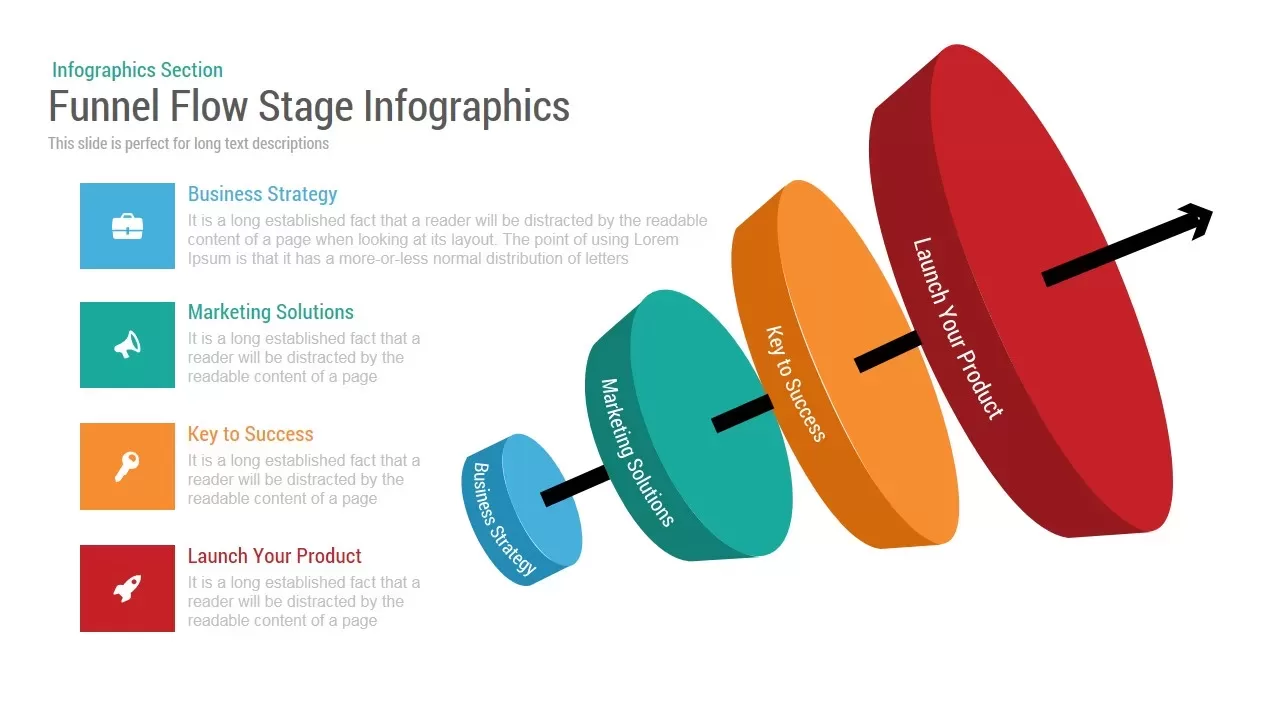
Funnel Flow Stage Infographics template for PowerPoint & Google Slides
Funnel
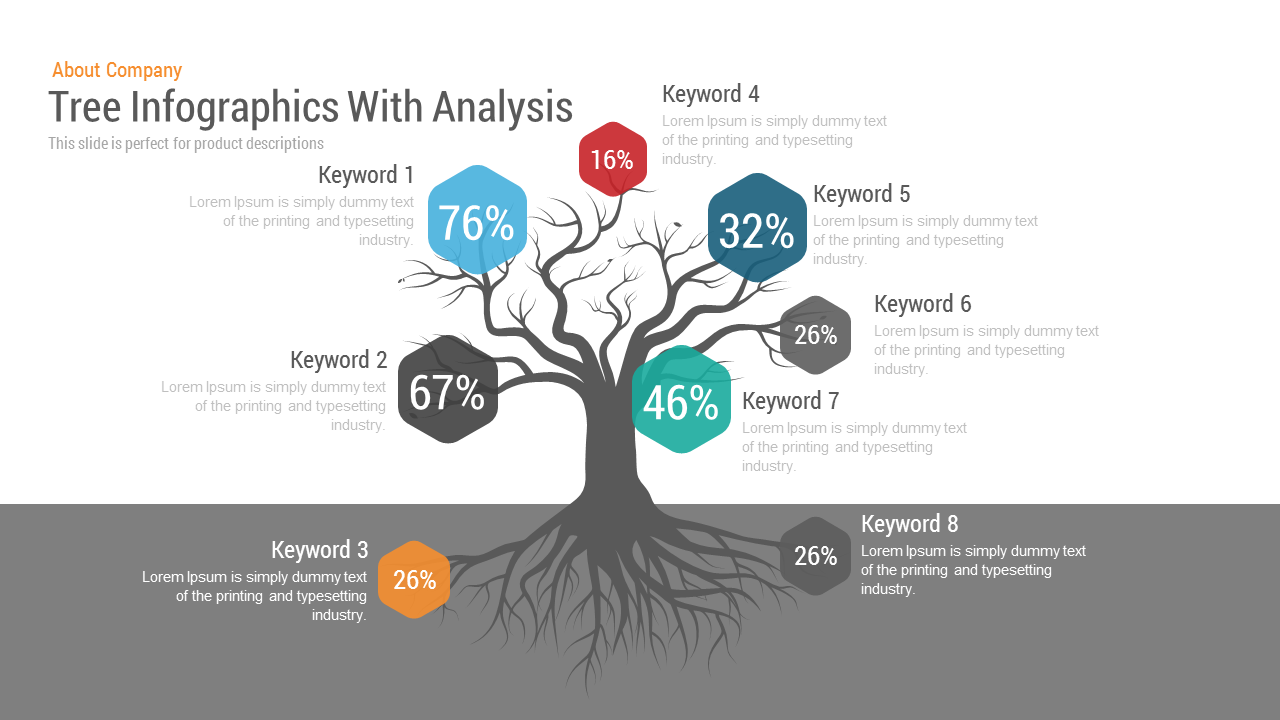
Tree Infographics template for PowerPoint & Google Slides
Decision Tree
Arrow Infographics template for PowerPoint & Google Slides
Infographics
3D Arrow Infographics Circular Flow Template for PowerPoint & Google Slides
Arrow
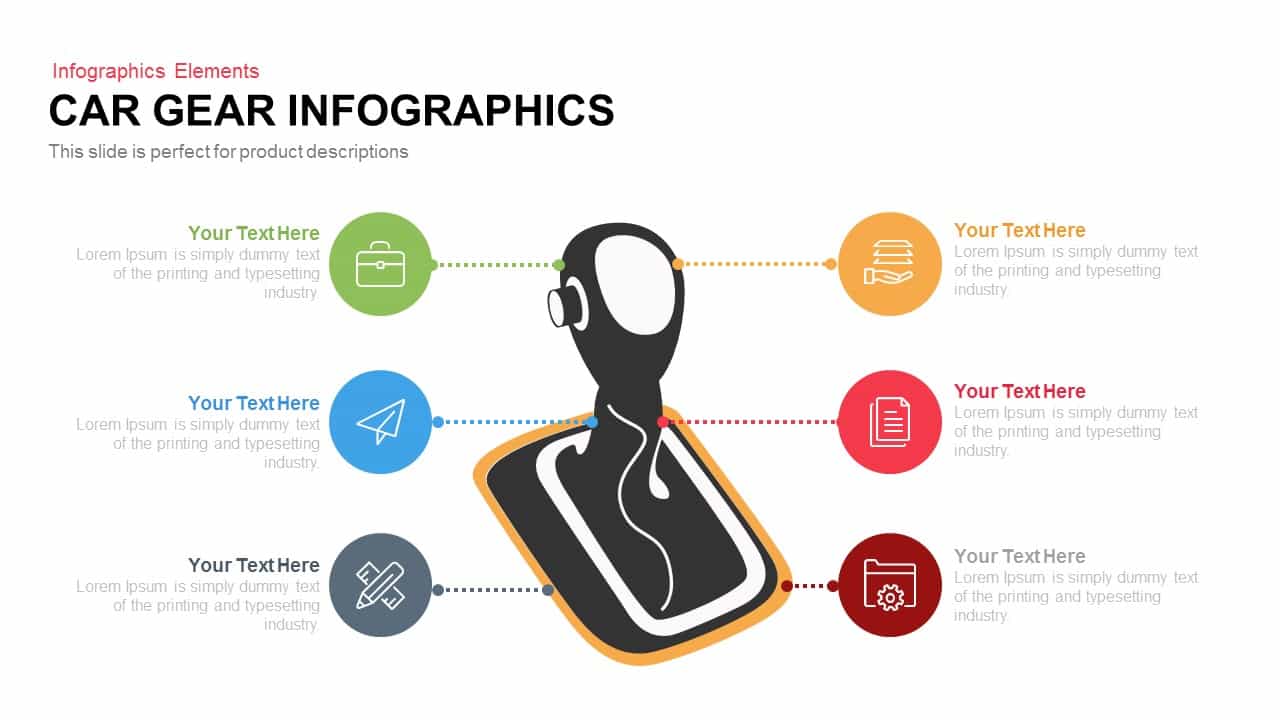
Car Gear Infographics Template for PowerPoint & Google Slides
Infographics
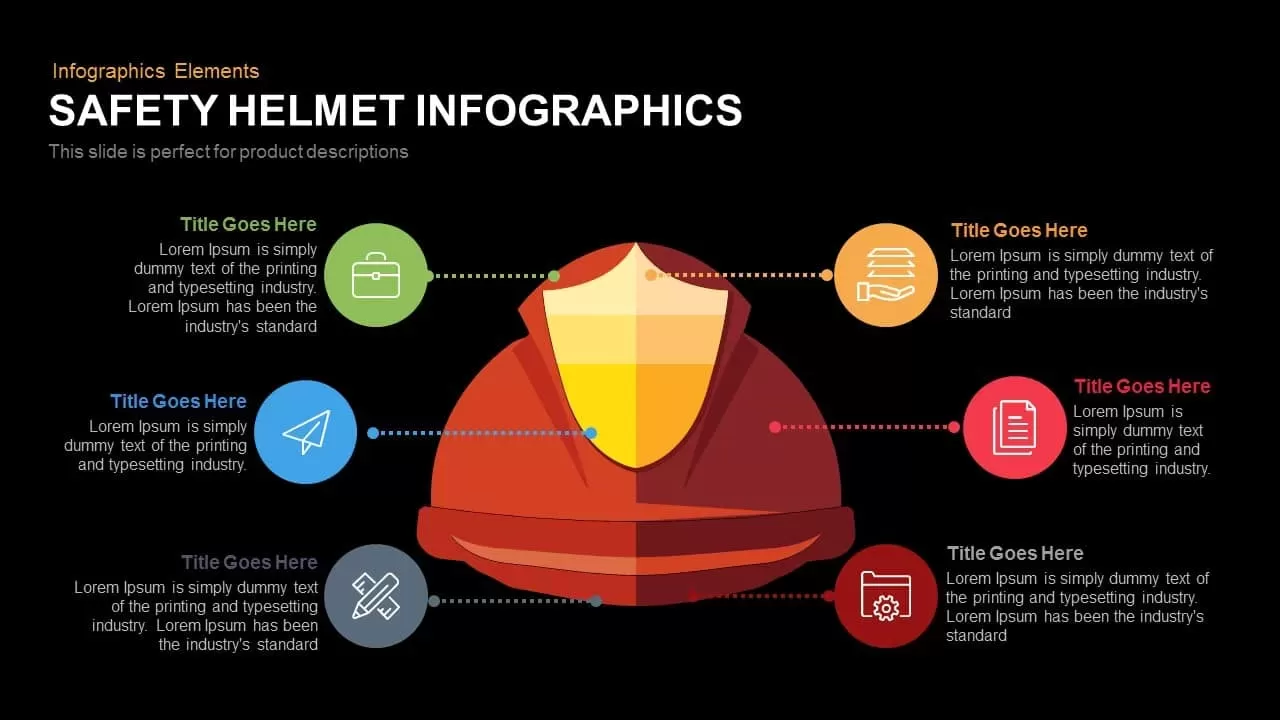
Safety Helmet Infographics Template for PowerPoint & Google Slides
Infographics
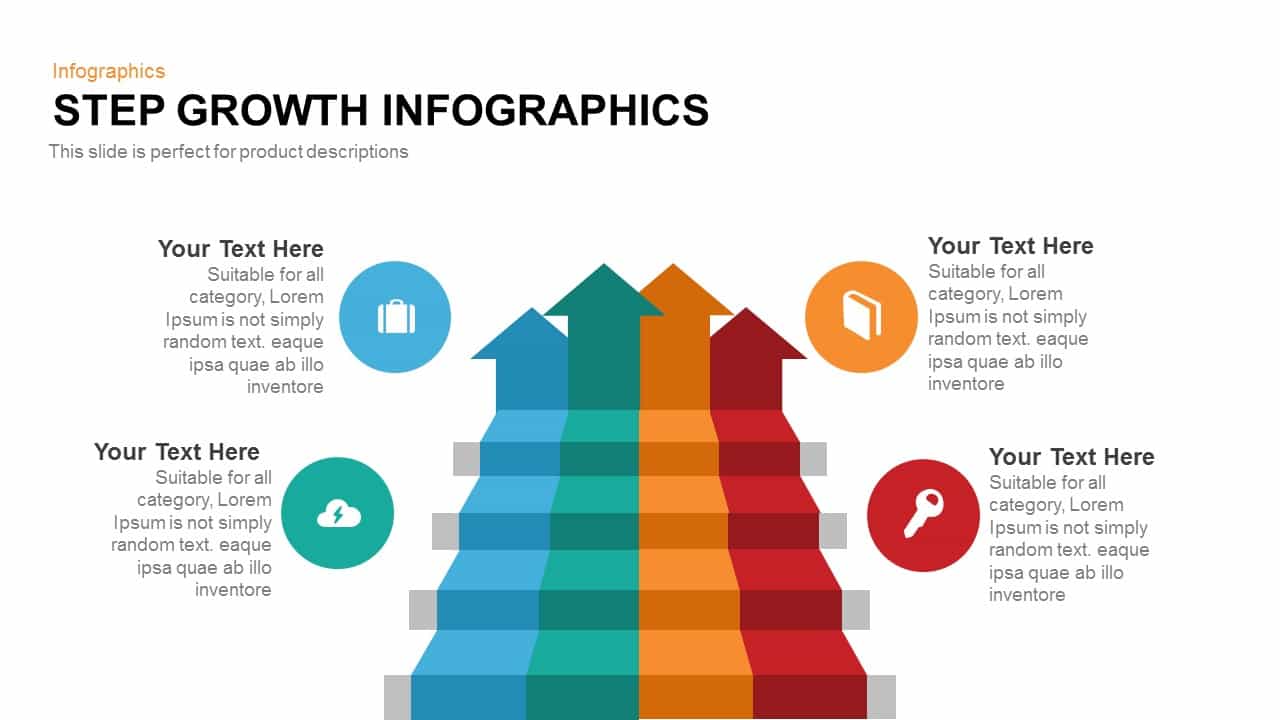
Modern Step Growth Infographics Template for PowerPoint & Google Slides
Process
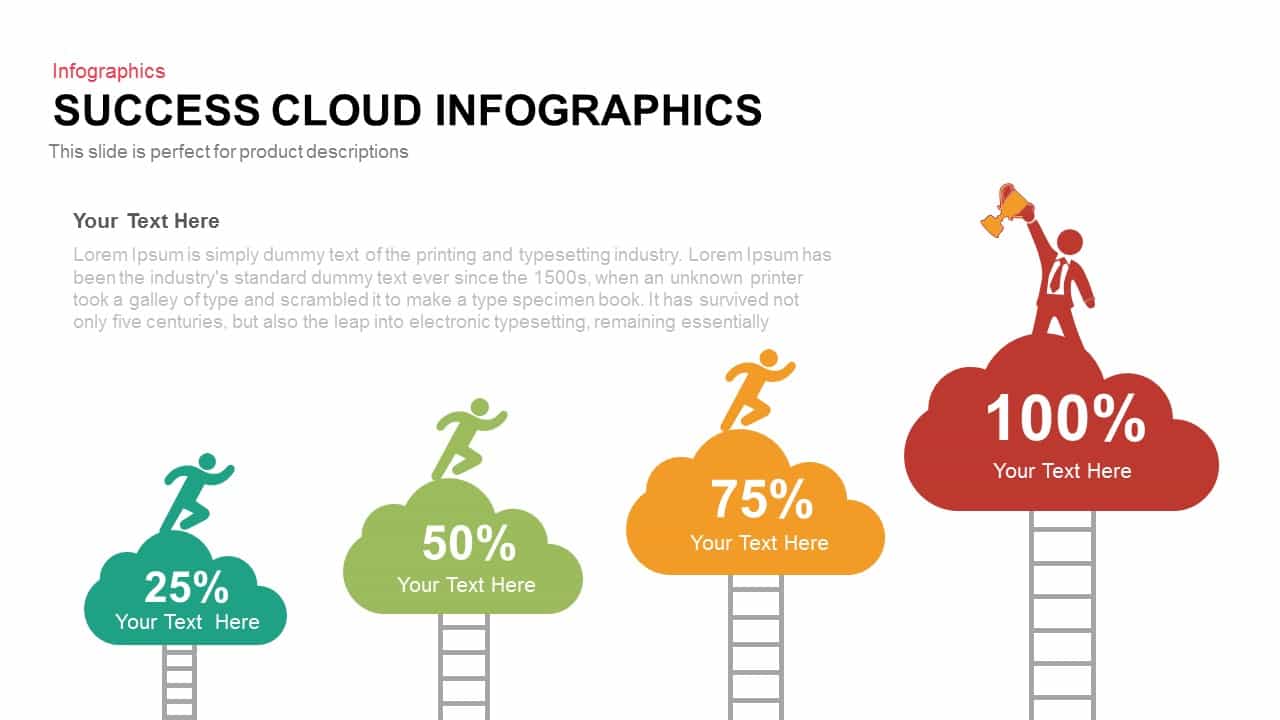
Success Cloud Progress Infographics Template for PowerPoint & Google Slides
Charts
Dynamic Circle Timeline Infographics template for PowerPoint & Google Slides
Timeline

Arrow Step Infographics Workflow Template for PowerPoint & Google Slides
Arrow
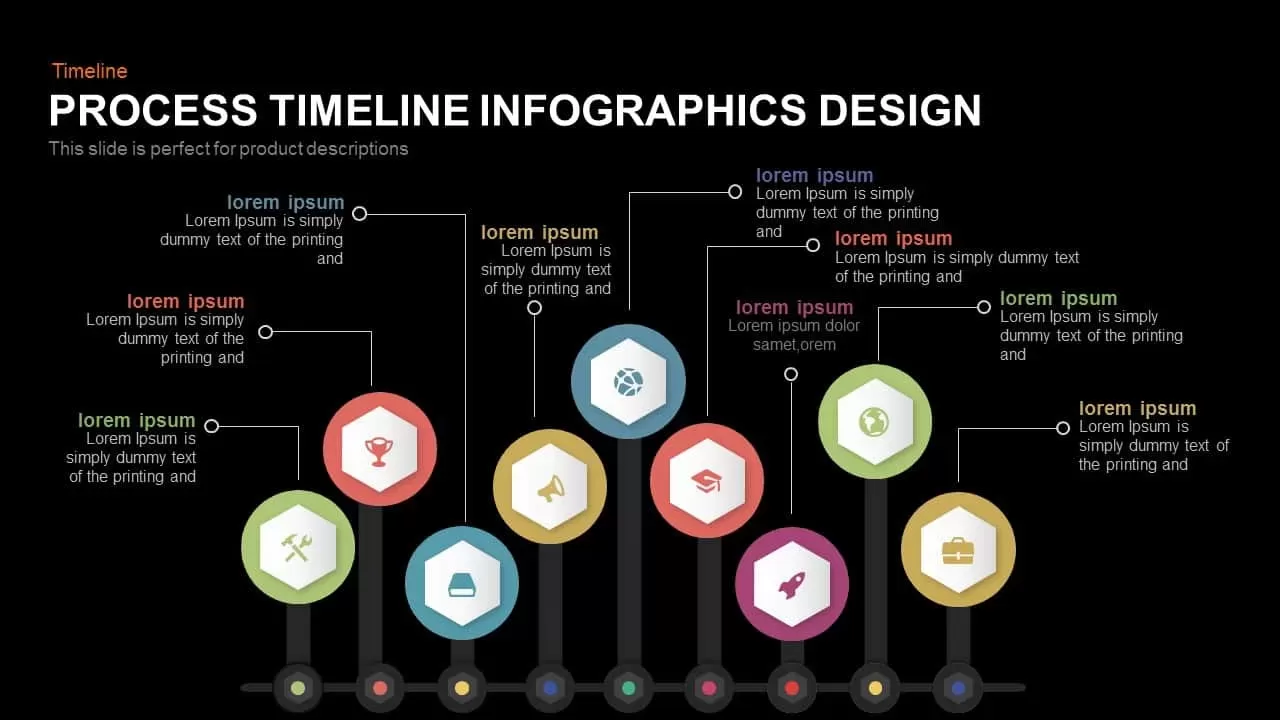
Process Timeline Infographics Design template for PowerPoint & Google Slides
Timeline
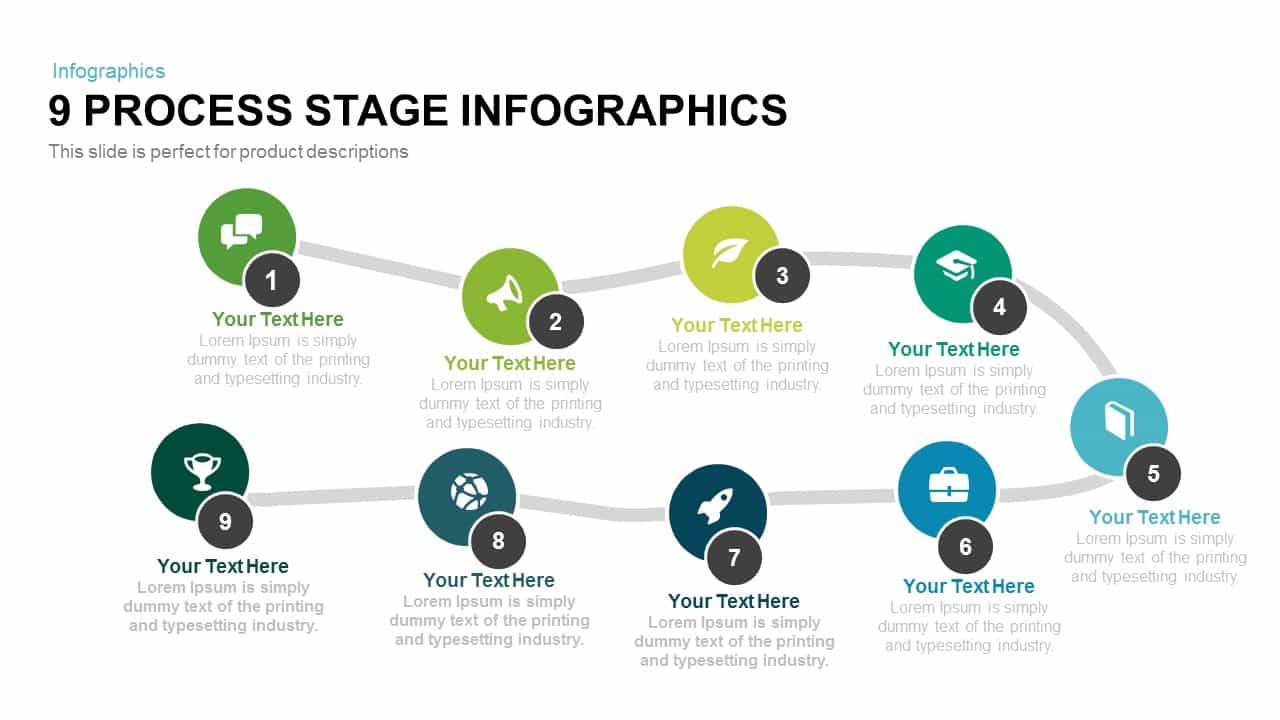
9 Process Stage Infographics template for PowerPoint & Google Slides
Process
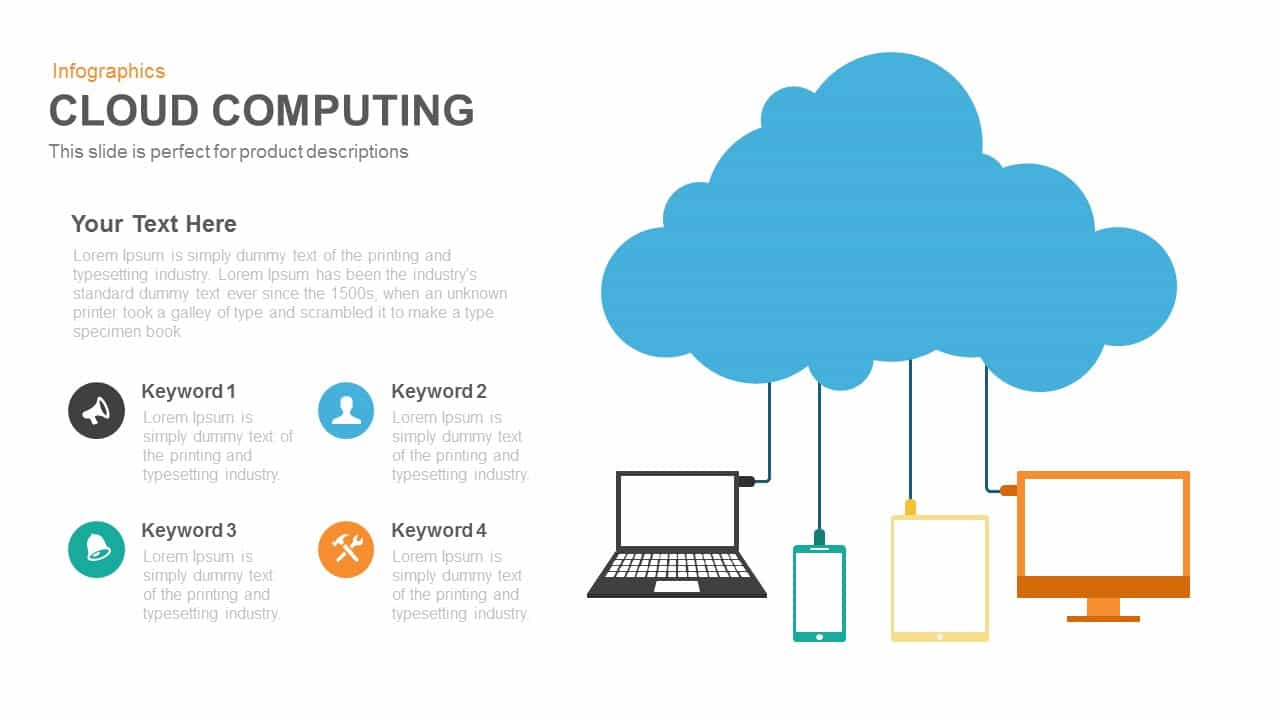
Cloud Computing Infographics template for PowerPoint & Google Slides
Cloud Computing
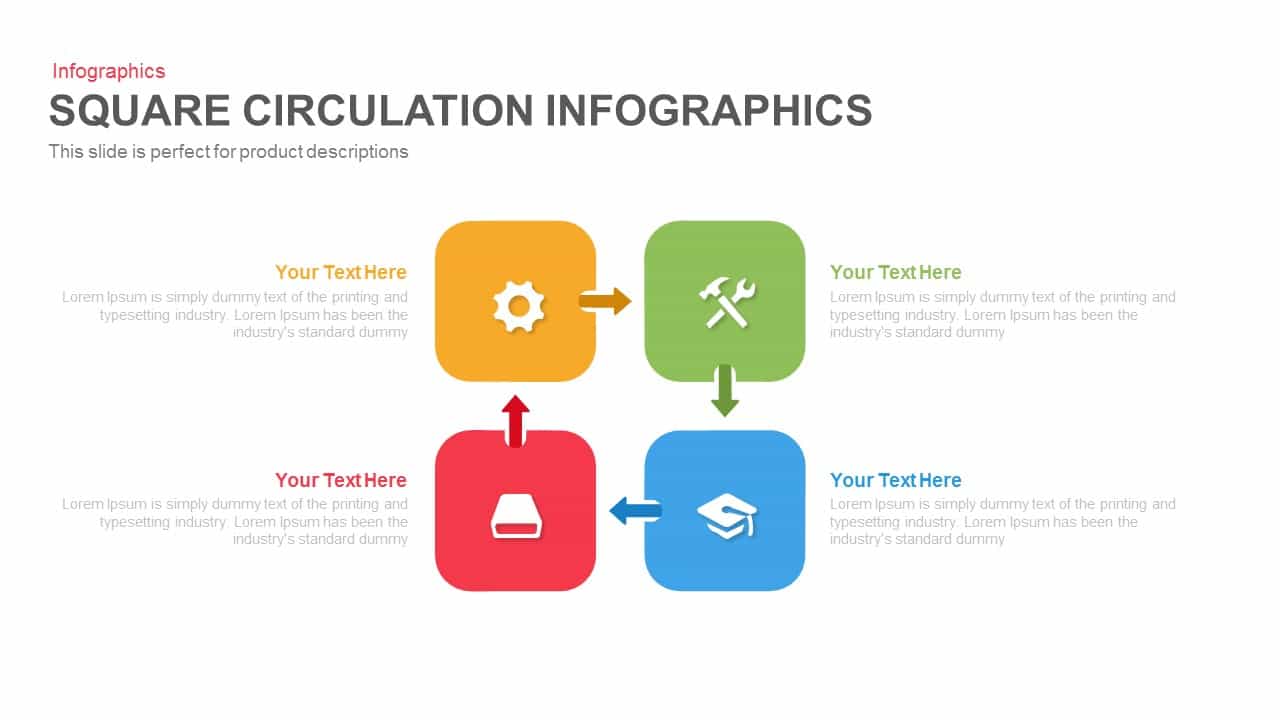
Square Circulation Infographics Template for PowerPoint & Google Slides
Process
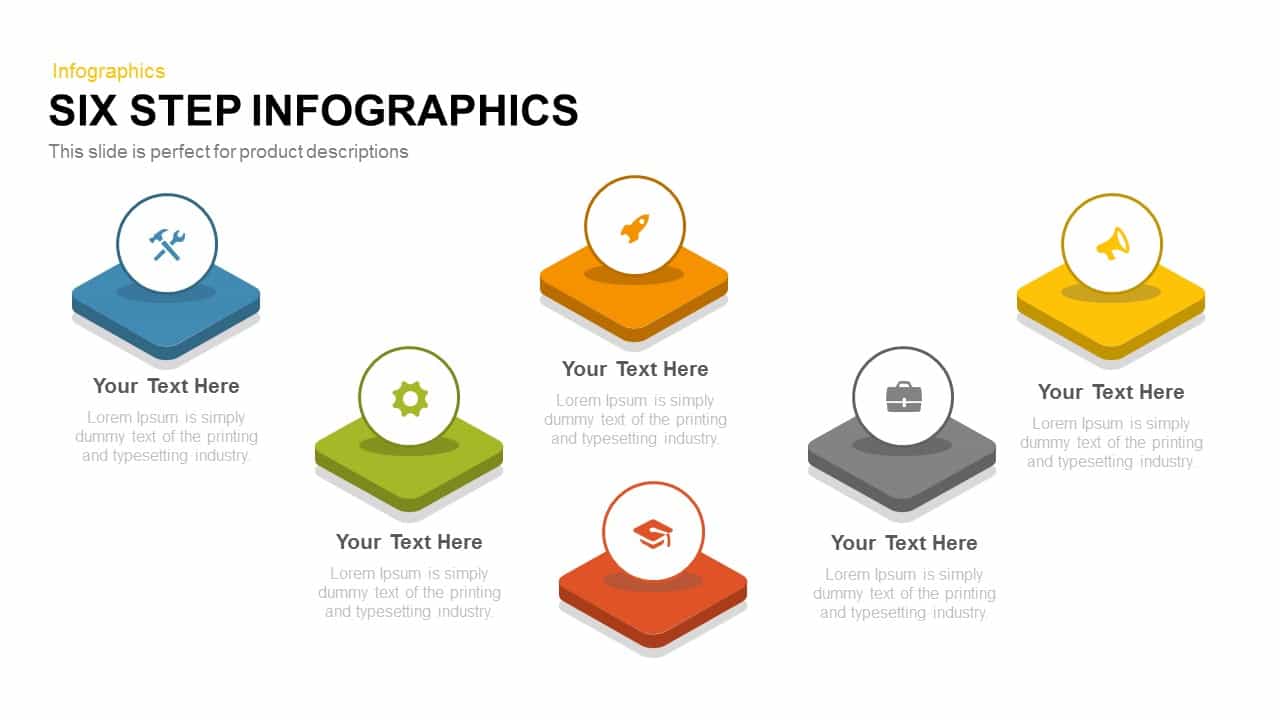
Six-Step Infographics Template for PowerPoint & Google Slides
Process
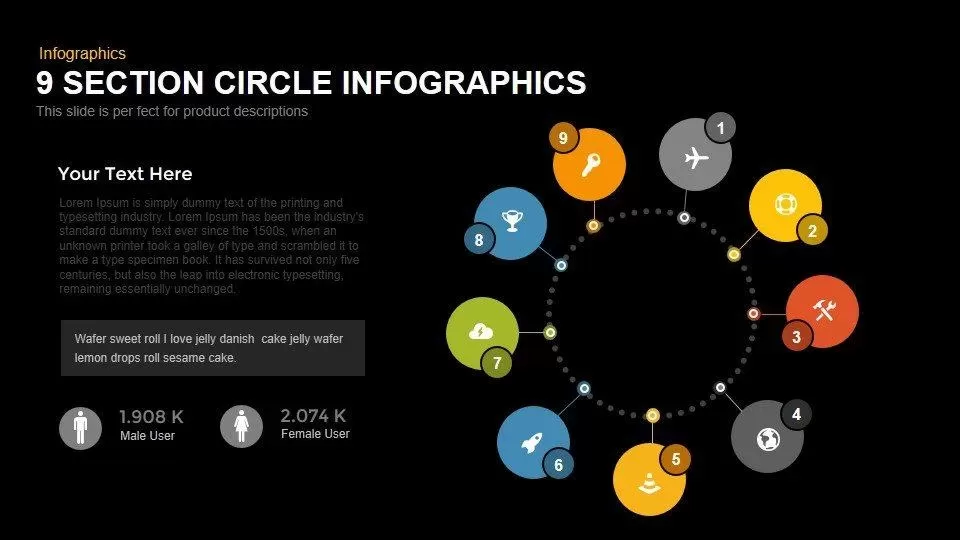
Modern 9-Section Circle Infographics Template for PowerPoint & Google Slides
Circular
3D Four-Directional Arrow Infographics Template for PowerPoint & Google Slides
Arrow
Five-Stage Arrow Infographics Timeline Template for PowerPoint & Google Slides
Arrow
Five-Stage Pyramid Infographics Diagram Template for PowerPoint & Google Slides
Pyramid
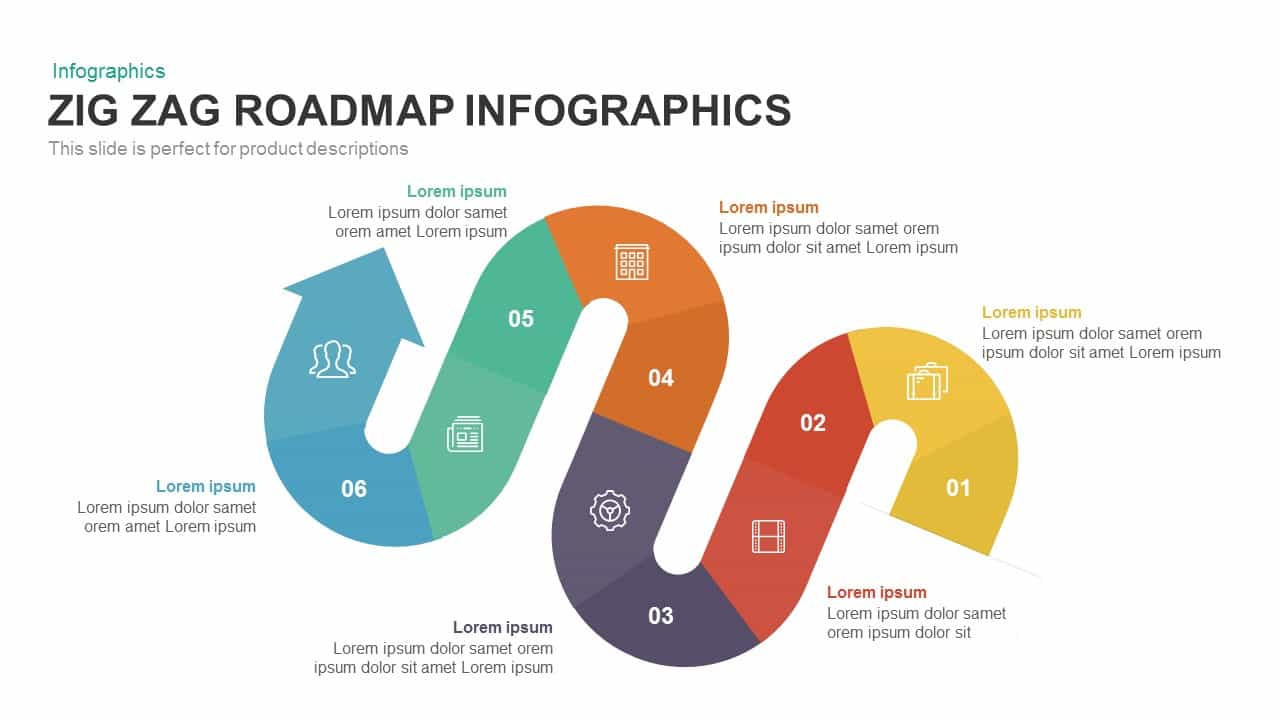
Six-Stage Zig-Zag Roadmap Infographics Template for PowerPoint & Google Slides
Roadmap
Timeline Arrow Infographics Diagram Template for PowerPoint & Google Slides
Timeline
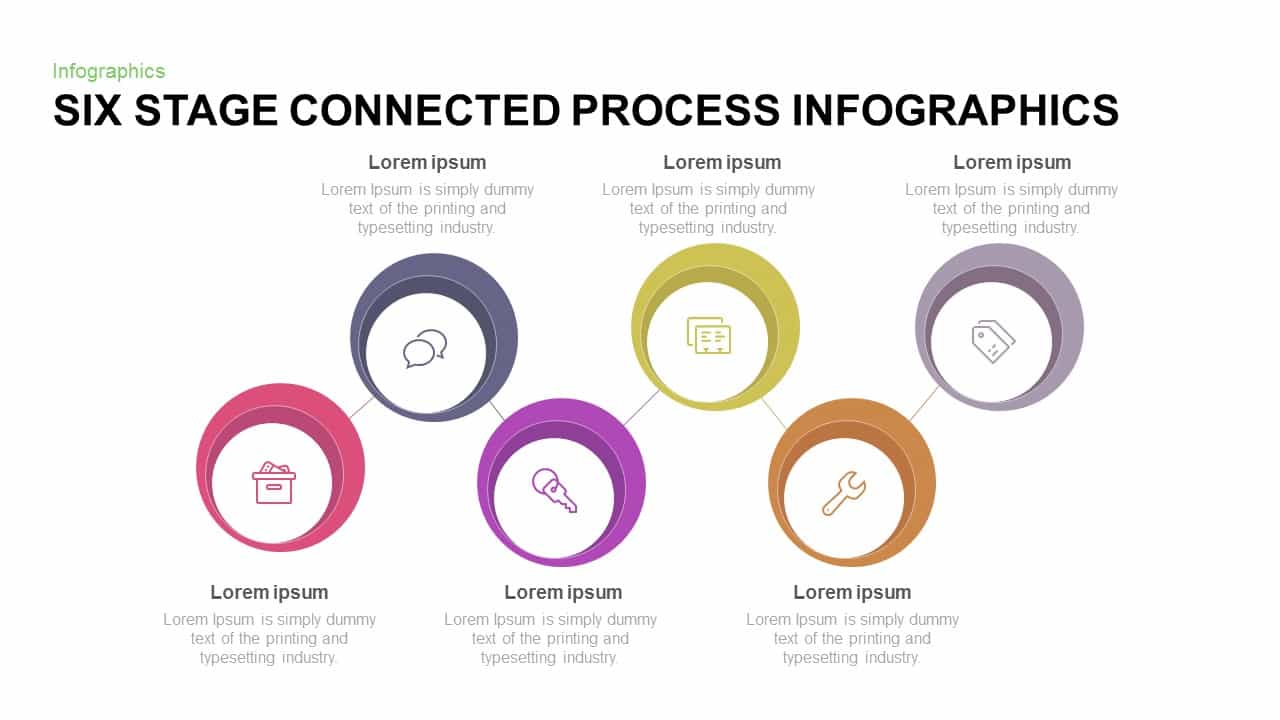
Six-Stage Connected Process Infographics Template for PowerPoint & Google Slides
Process
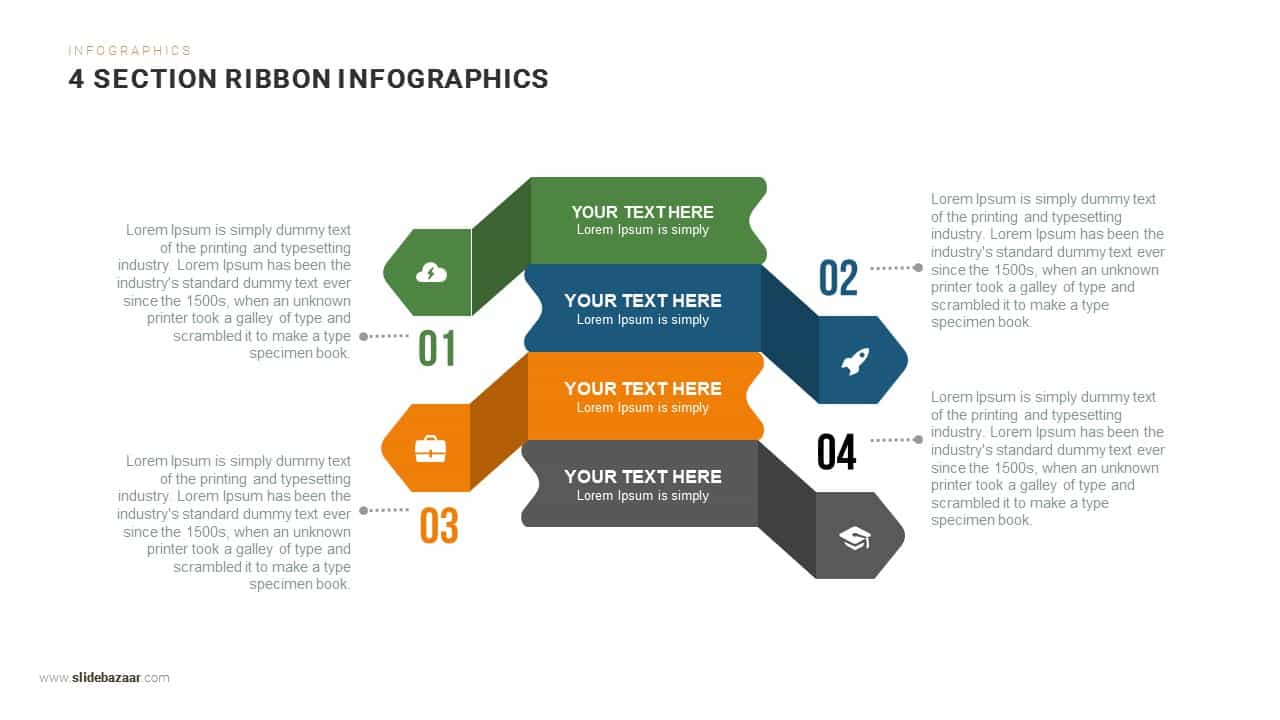
Four-Section Ribbon Infographics Template for PowerPoint & Google Slides
Process
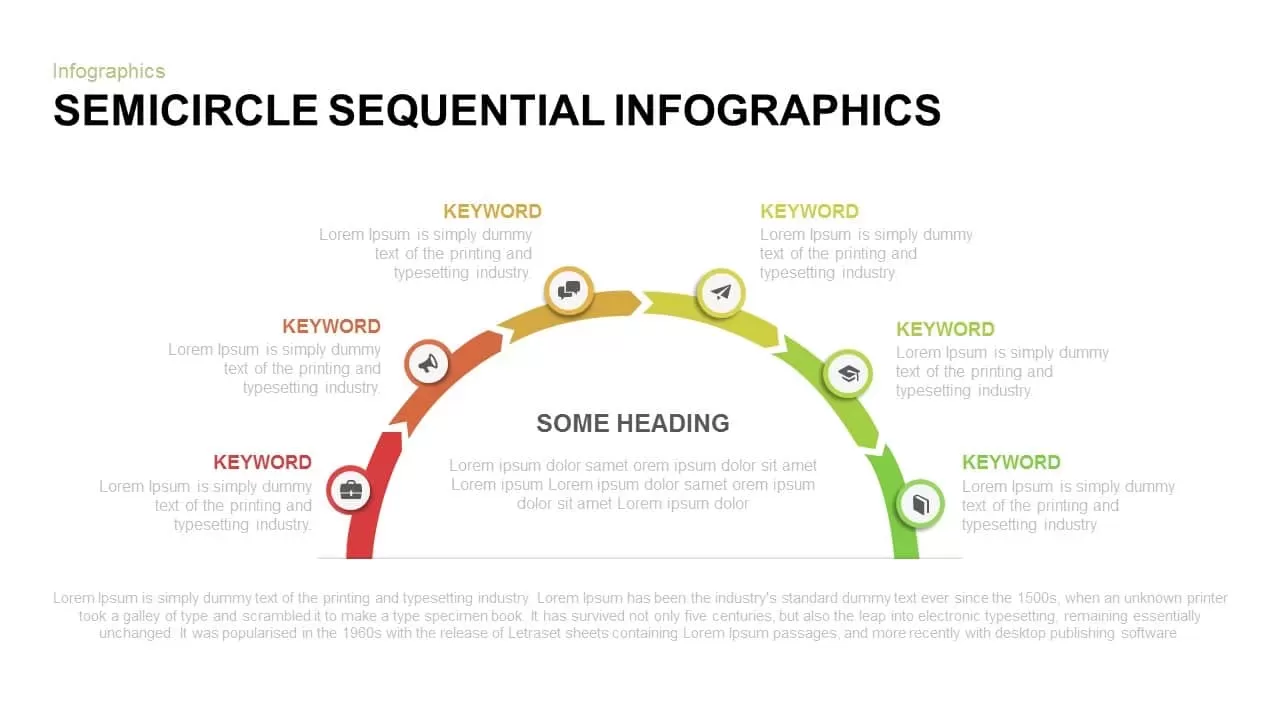
Semicircle Sequential Infographics Template for PowerPoint & Google Slides
Arrow
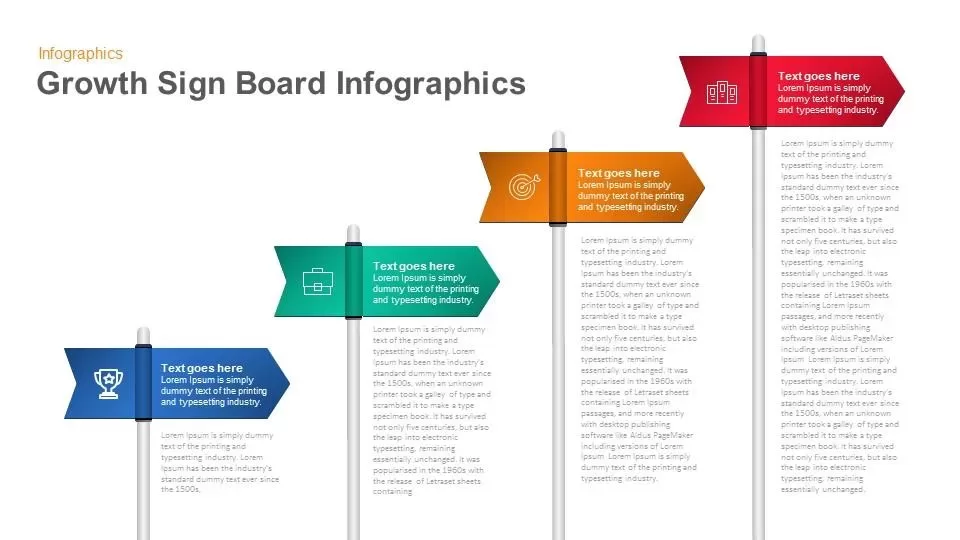
Growth Sign Board Infographics template for PowerPoint & Google Slides
Timeline
Circular Timeline Infographics Template for PowerPoint & Google Slides
Timeline
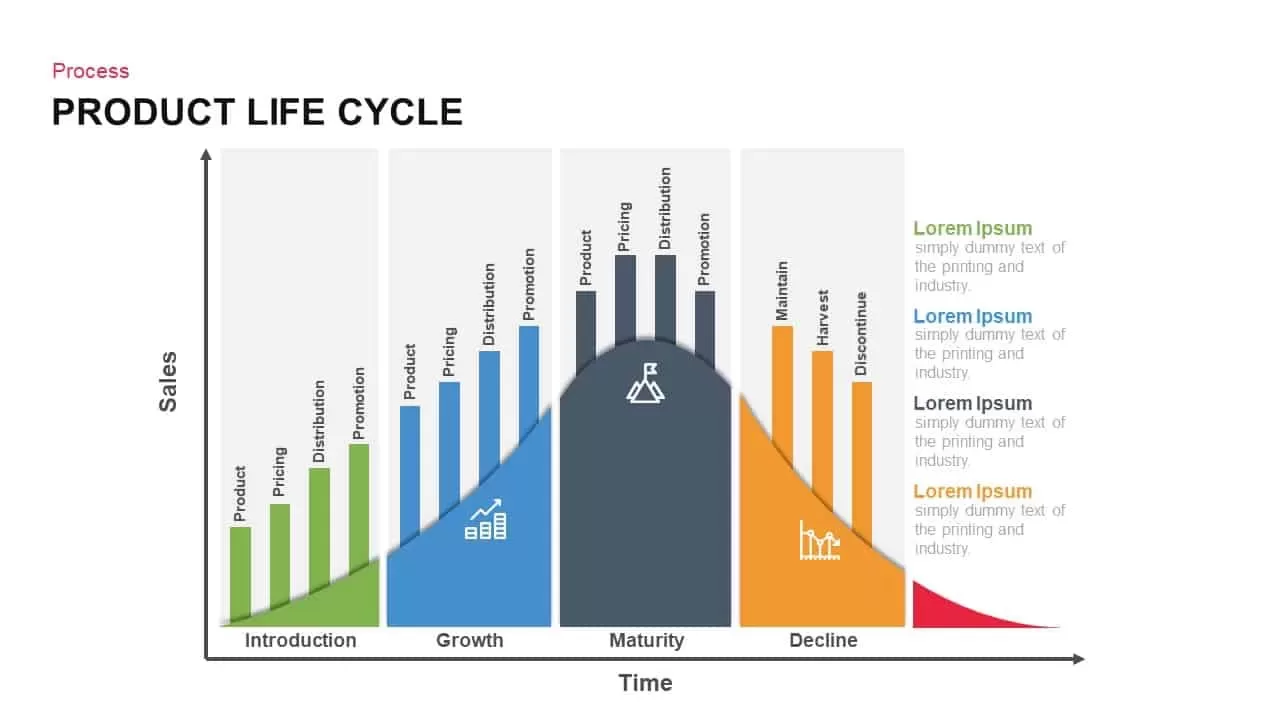
Product Life Cycle Infographics template for PowerPoint & Google Slides
Business
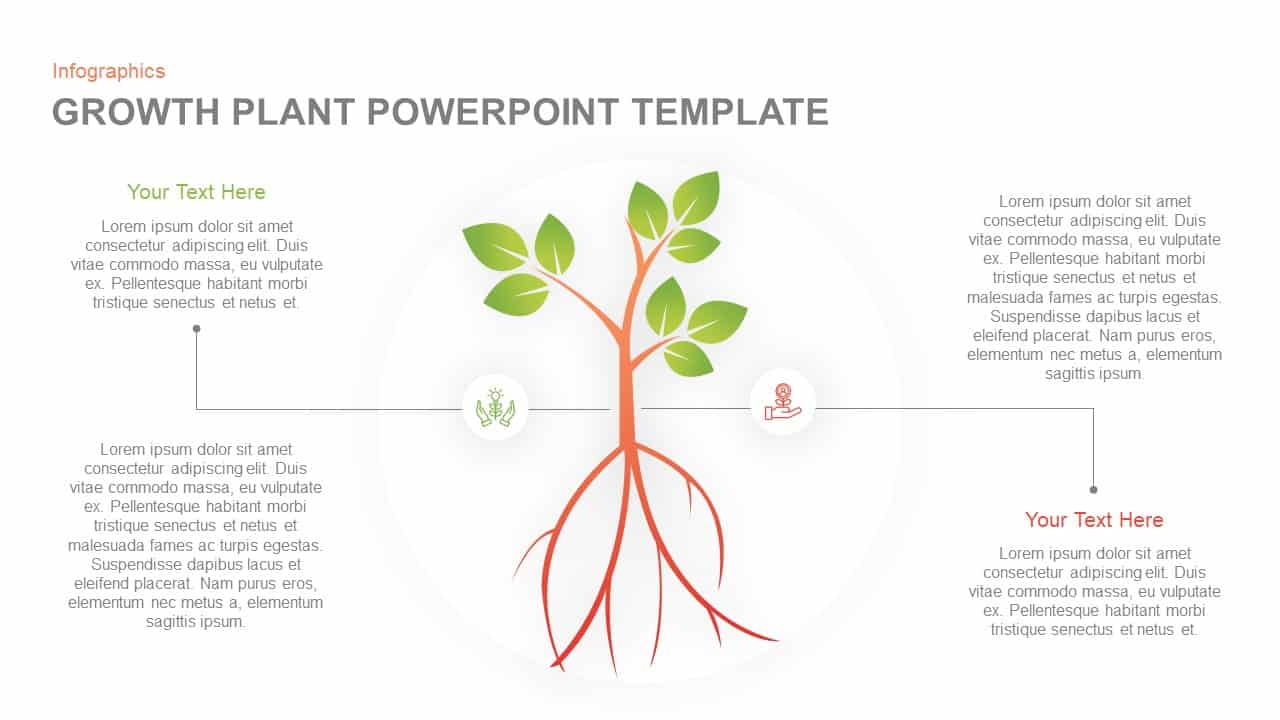
Growth Plant Infographics template for PowerPoint & Google Slides
Process
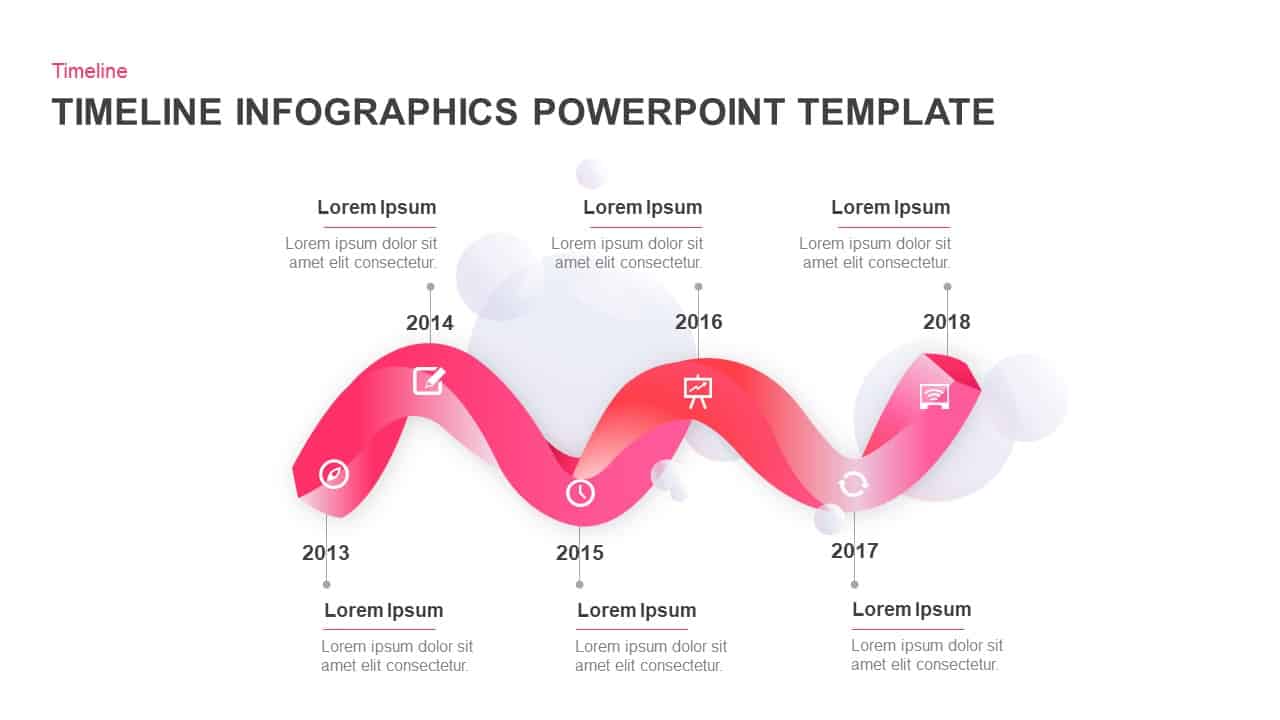
Wavy Ribbon Timeline Infographics Template for PowerPoint & Google Slides
Timeline
Five-Stage Pyramid Infographics Process Template for PowerPoint & Google Slides
Pyramid
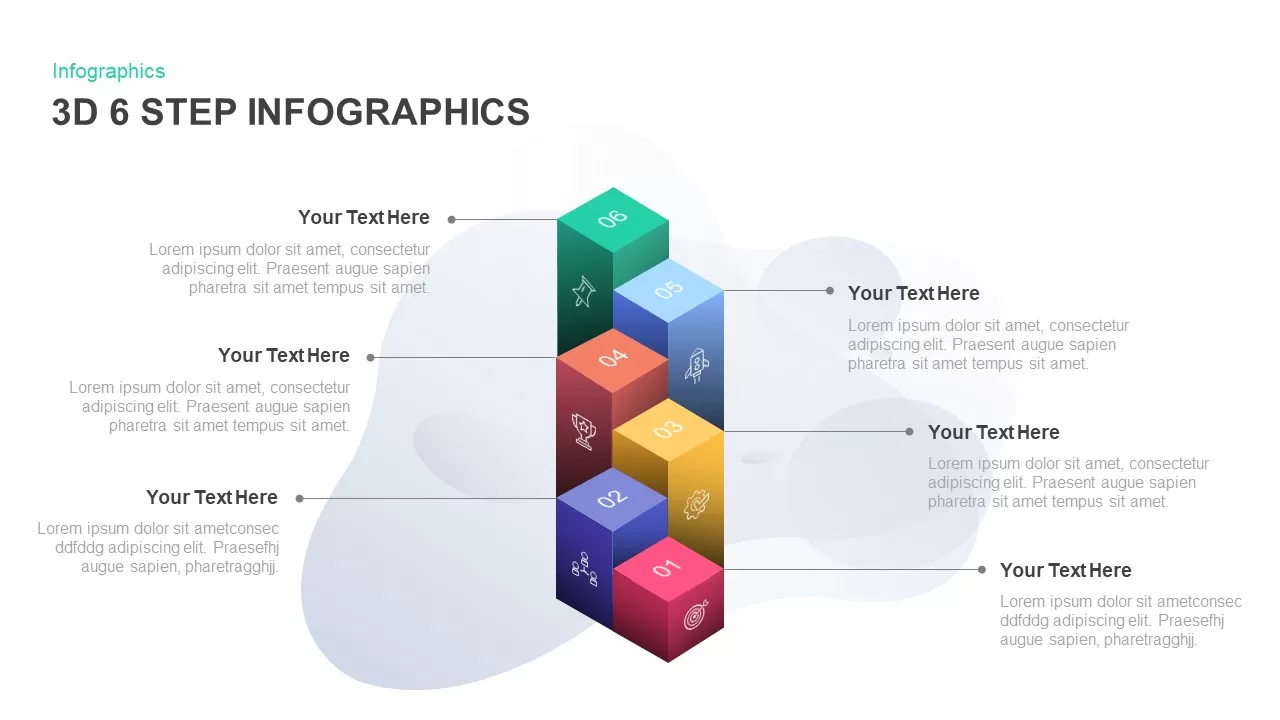
3D 6-Step Infographics Process Diagram Template for PowerPoint & Google Slides
Infographics
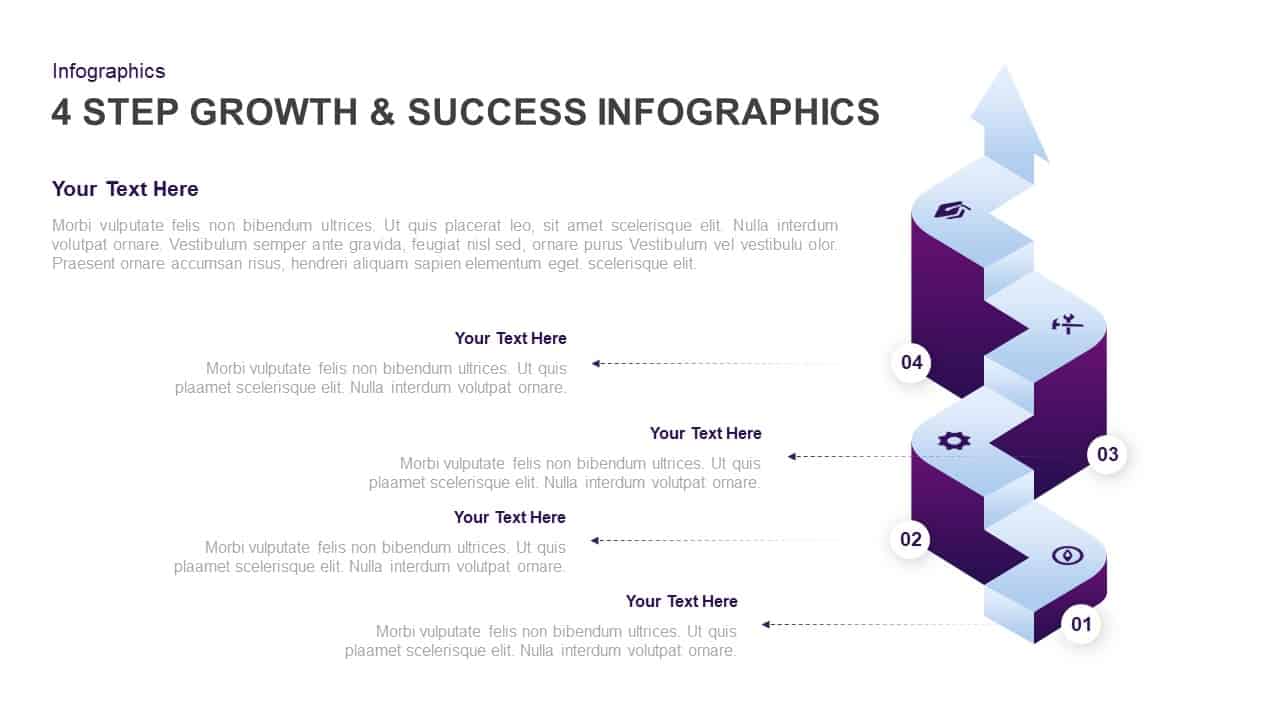
4-Step Growth & Success Infographics Template for PowerPoint & Google Slides
Accomplishment
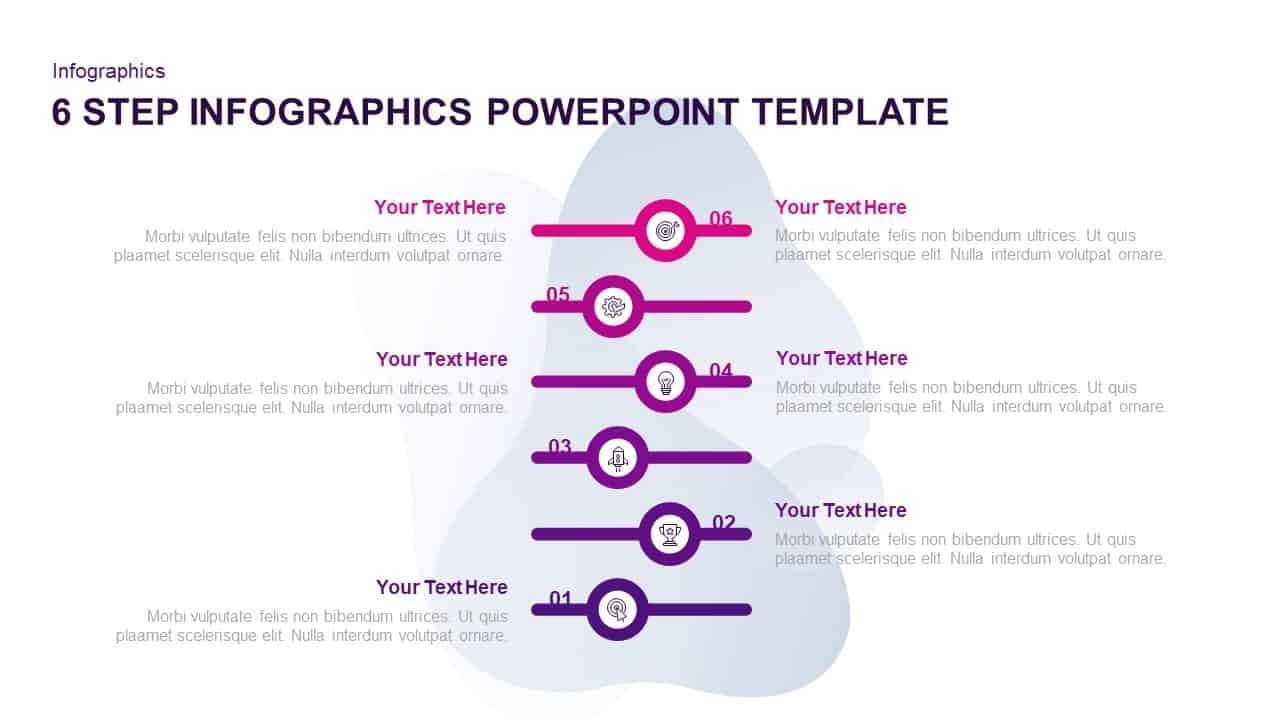
Six-Step Purple Gradient Infographics Template for PowerPoint & Google Slides
Process
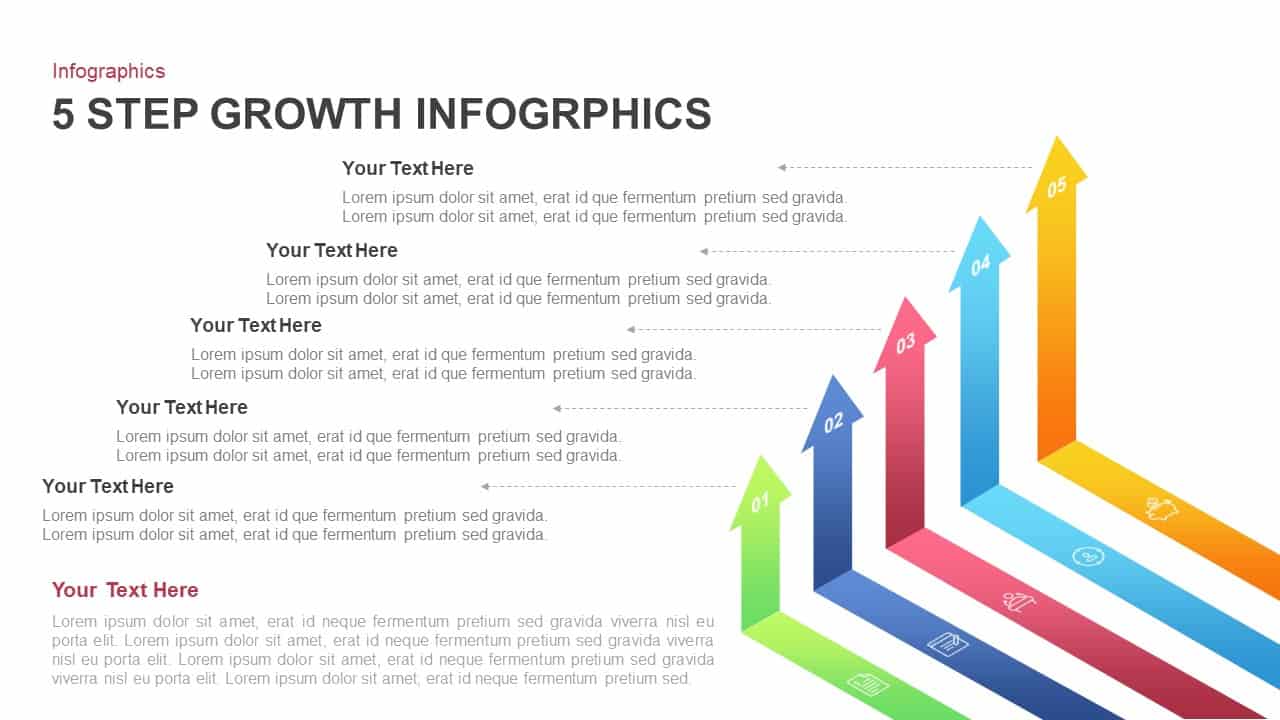
5-Step Growth Arrow Infographics Template for PowerPoint & Google Slides
Arrow
Colorful Venn Diagram Infographics Template for PowerPoint & Google Slides
Circular
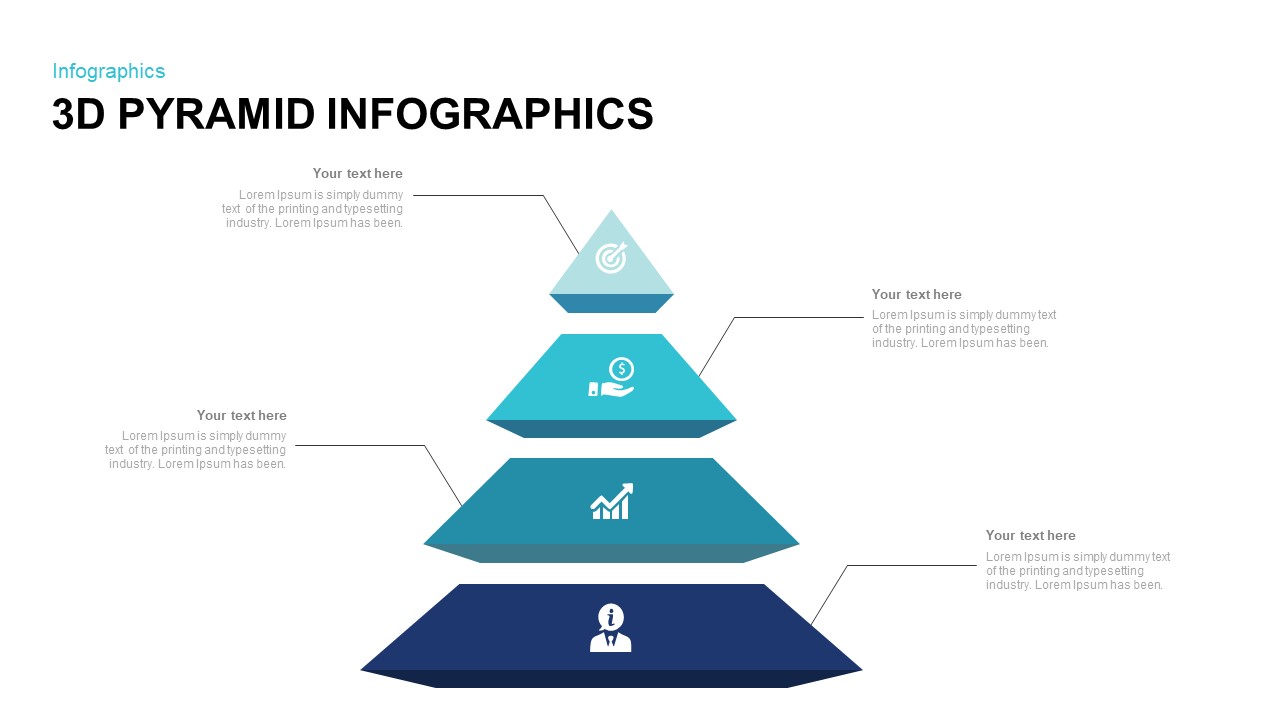
3D Pyramid Infographics Slide Template for PowerPoint & Google Slides
Pyramid
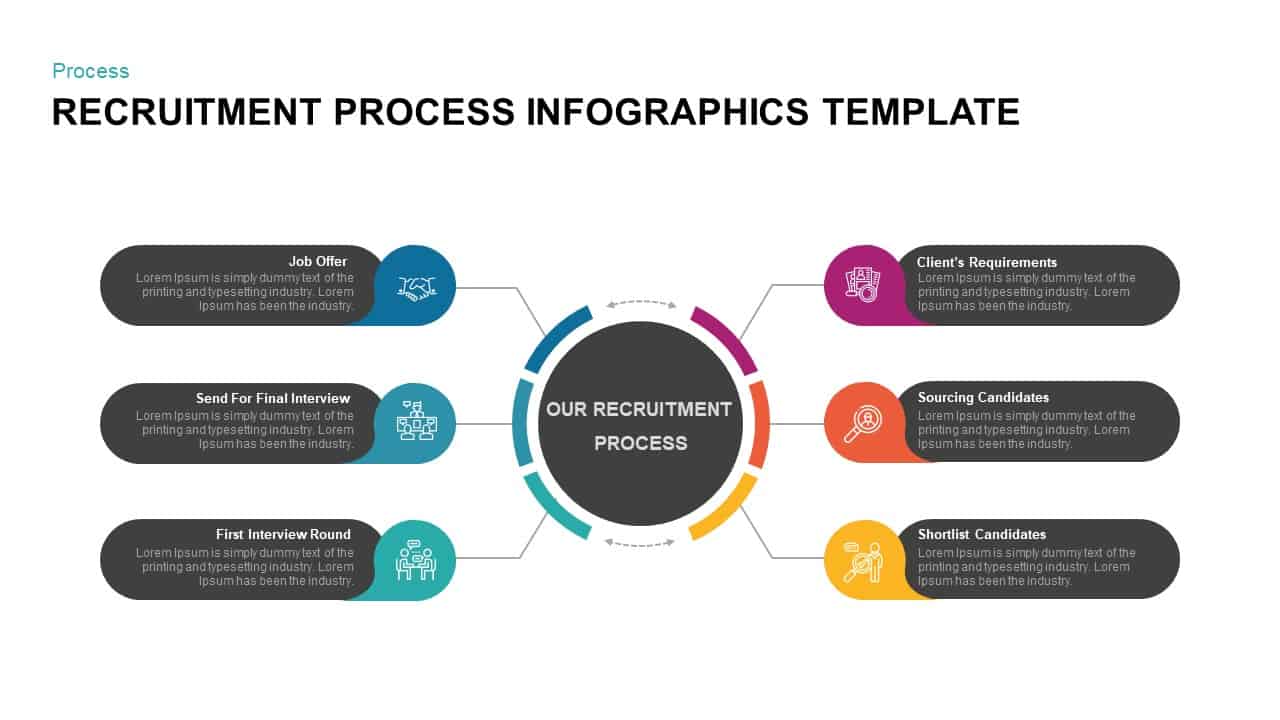
Recruitment Process Infographics Template for PowerPoint & Google Slides
Process
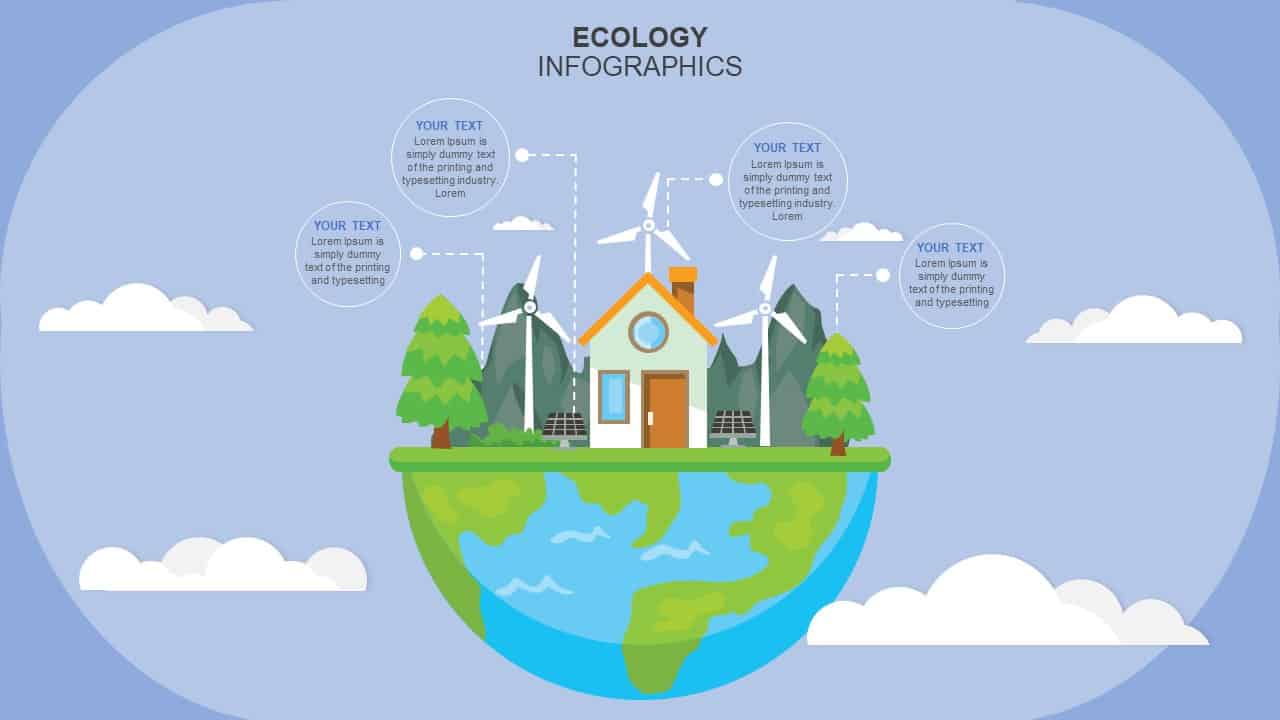
Ecology Infographics Overview template for PowerPoint & Google Slides
Business Proposal
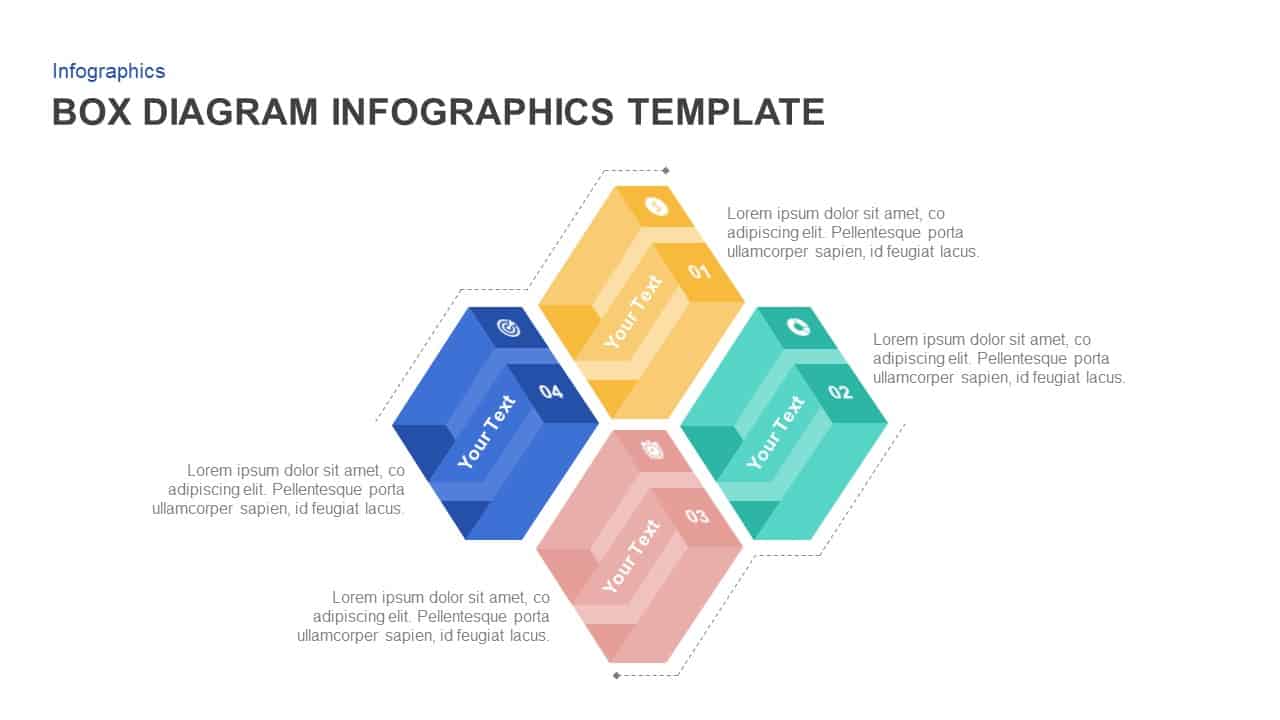
Box Diagram Infographics template for PowerPoint & Google Slides
Business
Four Section Diagram Infographics template for PowerPoint & Google Slides
Process
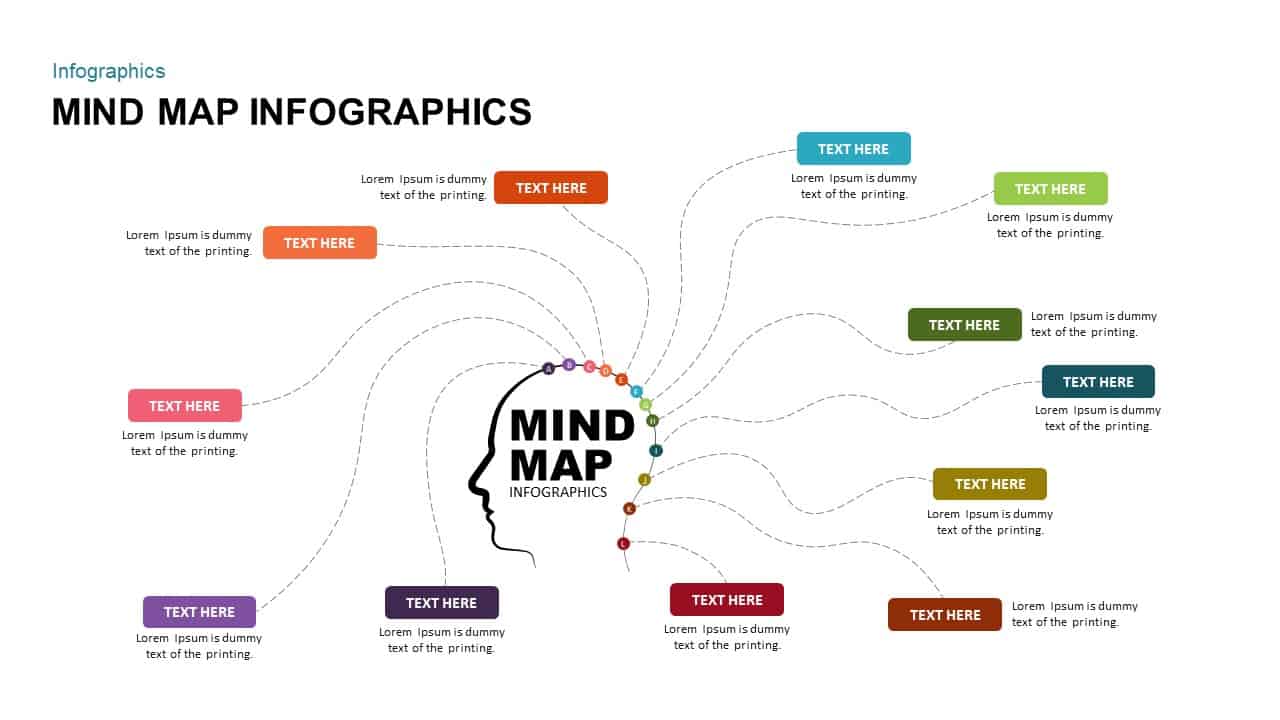
Mind Map Infographics template for PowerPoint & Google Slides
Mind Maps

Five-Step Business Infographics Template for PowerPoint & Google Slides
Infographics
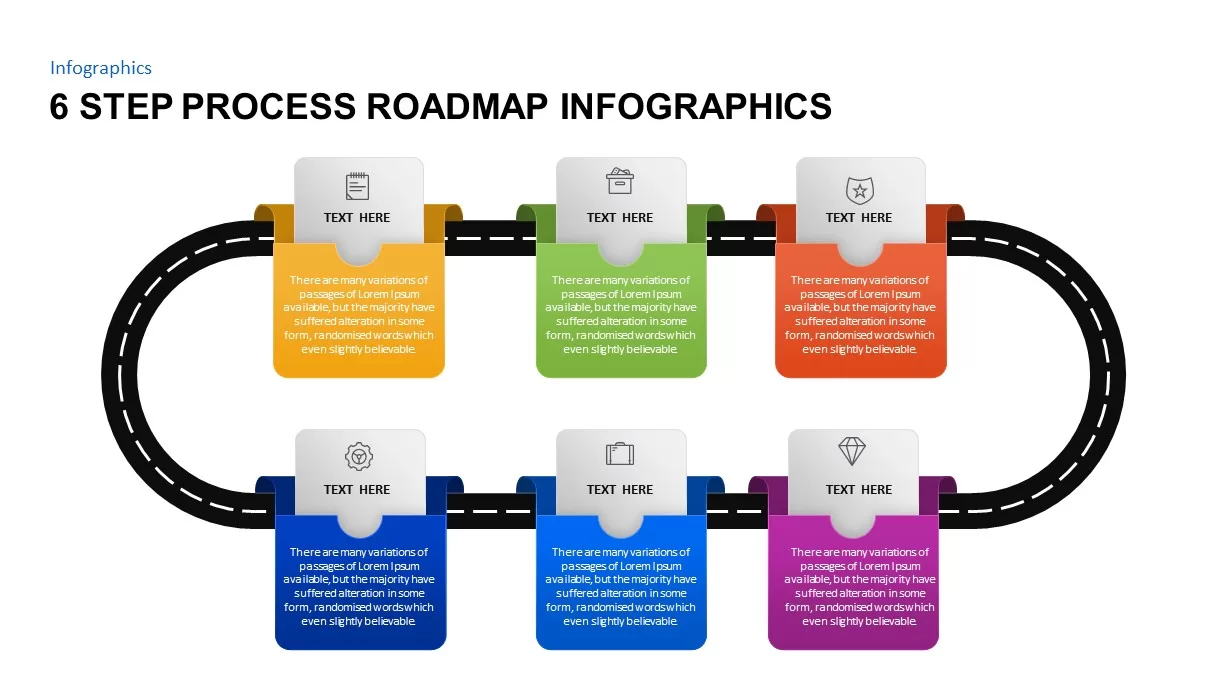
6 Step Process Roadmap Infographics Template for PowerPoint & Google Slides
Roadmap
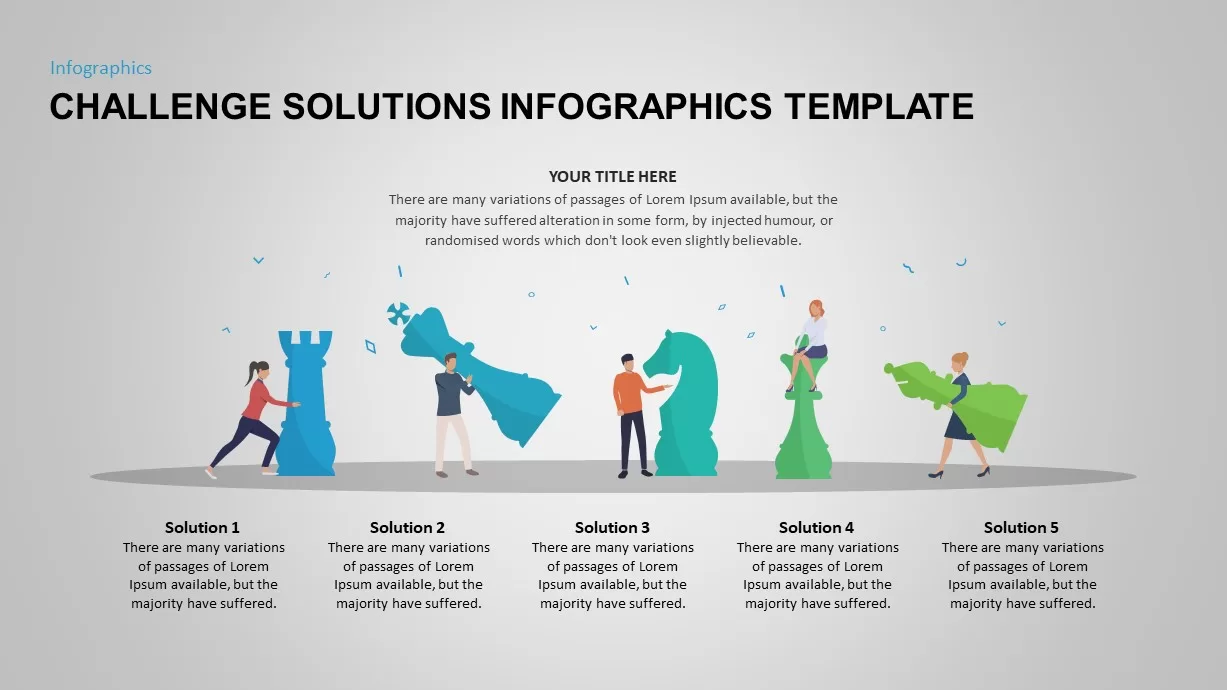
Challenge Solutions Infographics Template for PowerPoint & Google Slides
Opportunities Challenges
Four-Step Circular Process Infographics Template for PowerPoint & Google Slides
Circular
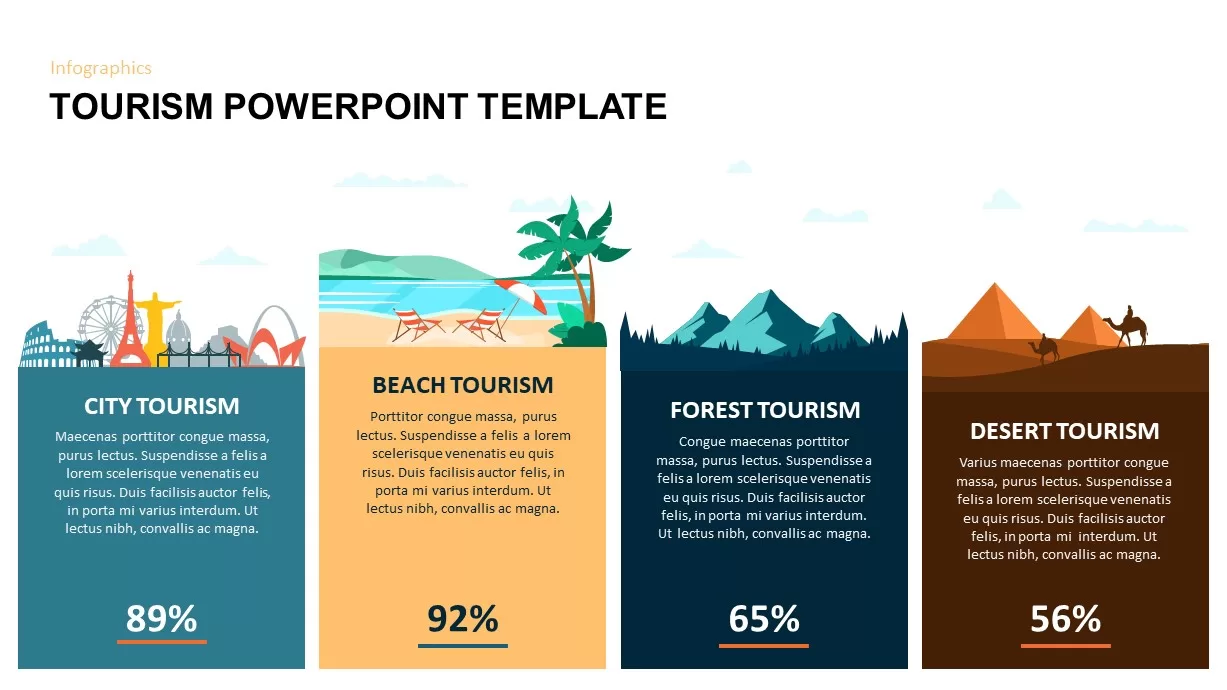
Comparative Tourism Infographics Template for PowerPoint & Google Slides
Comparison
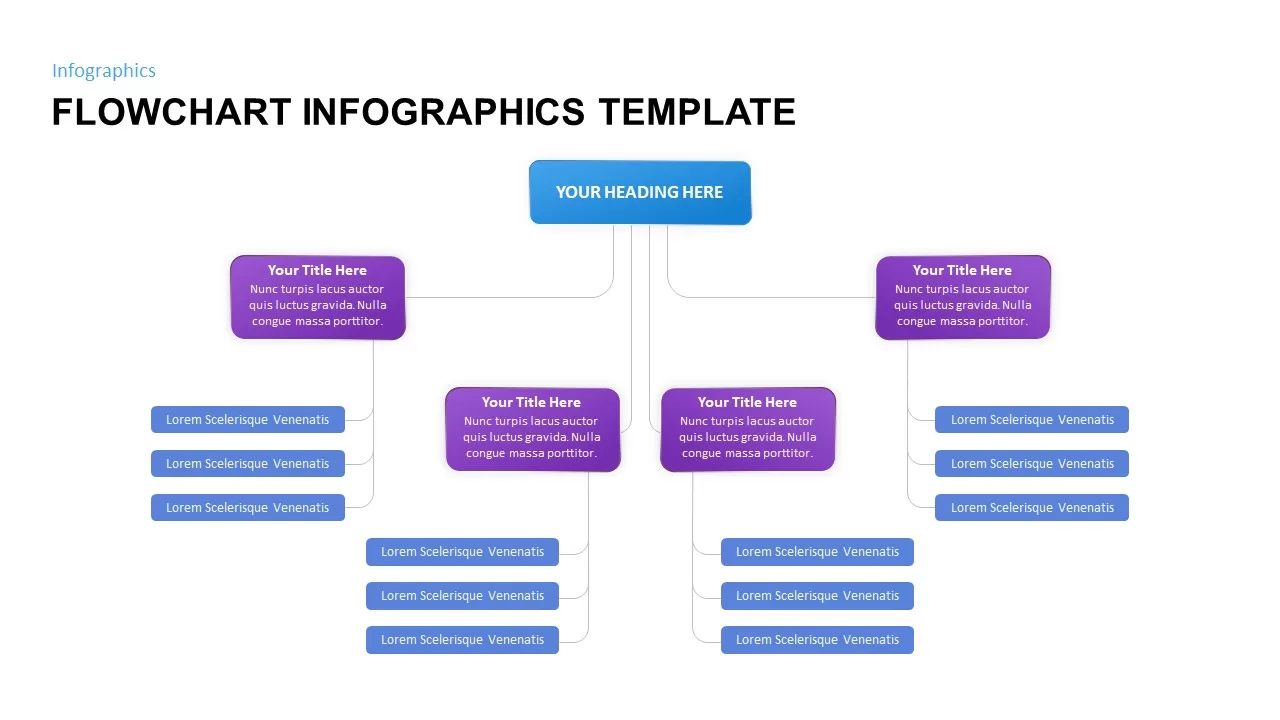
Flowchart Infographics Template for PowerPoint & Google Slides
Infographics
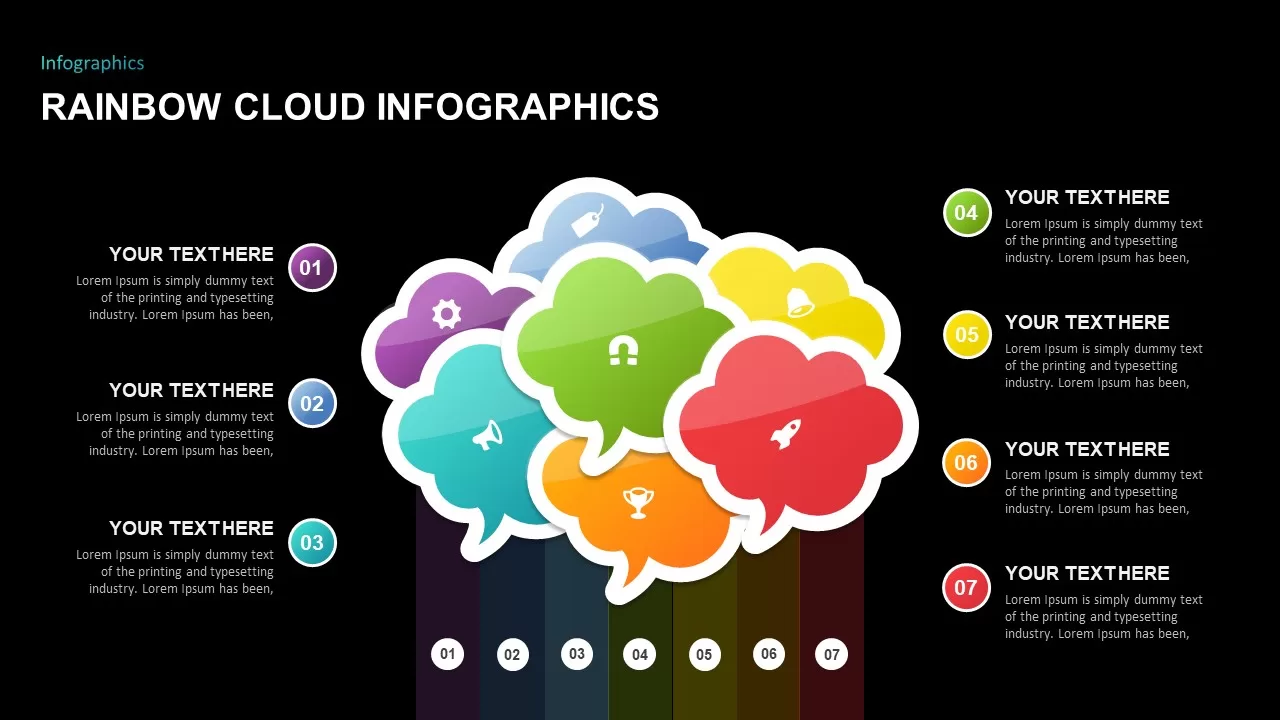
Rainbow Cloud Infographics Diagram Template for PowerPoint & Google Slides
Process
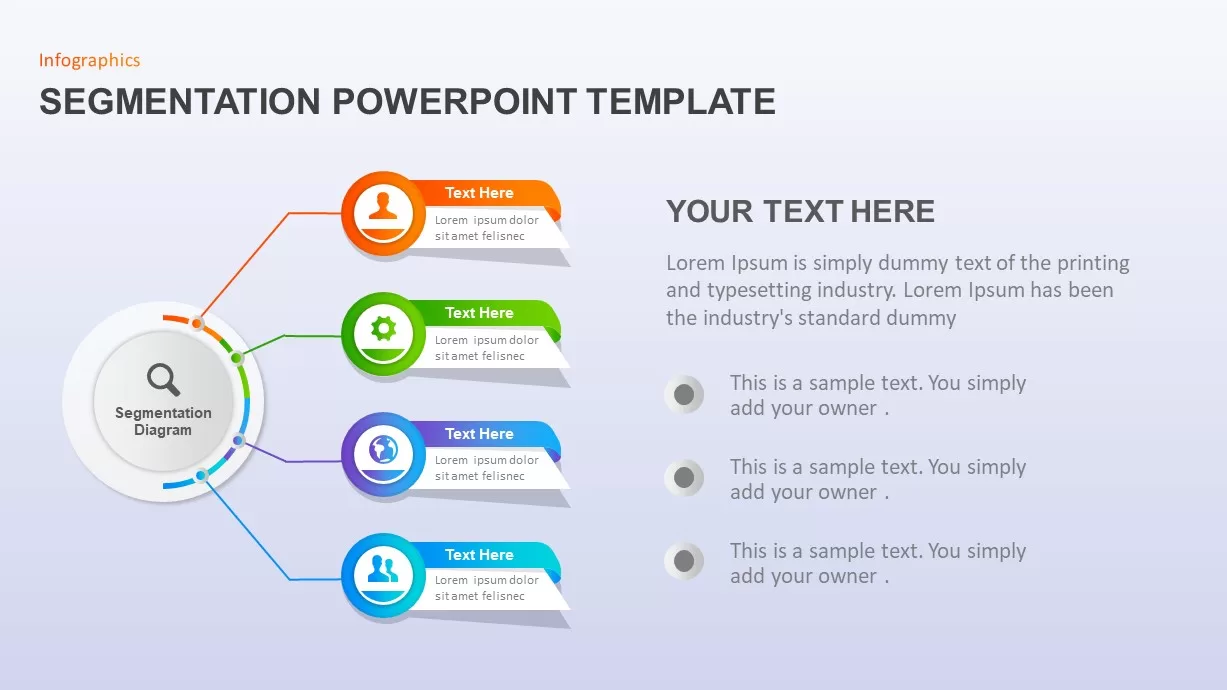
Market Segmentation & STP Infographics Pack Template for PowerPoint & Google Slides
Marketing
Business Growth Plant Infographics Pack Template for PowerPoint & Google Slides
Process
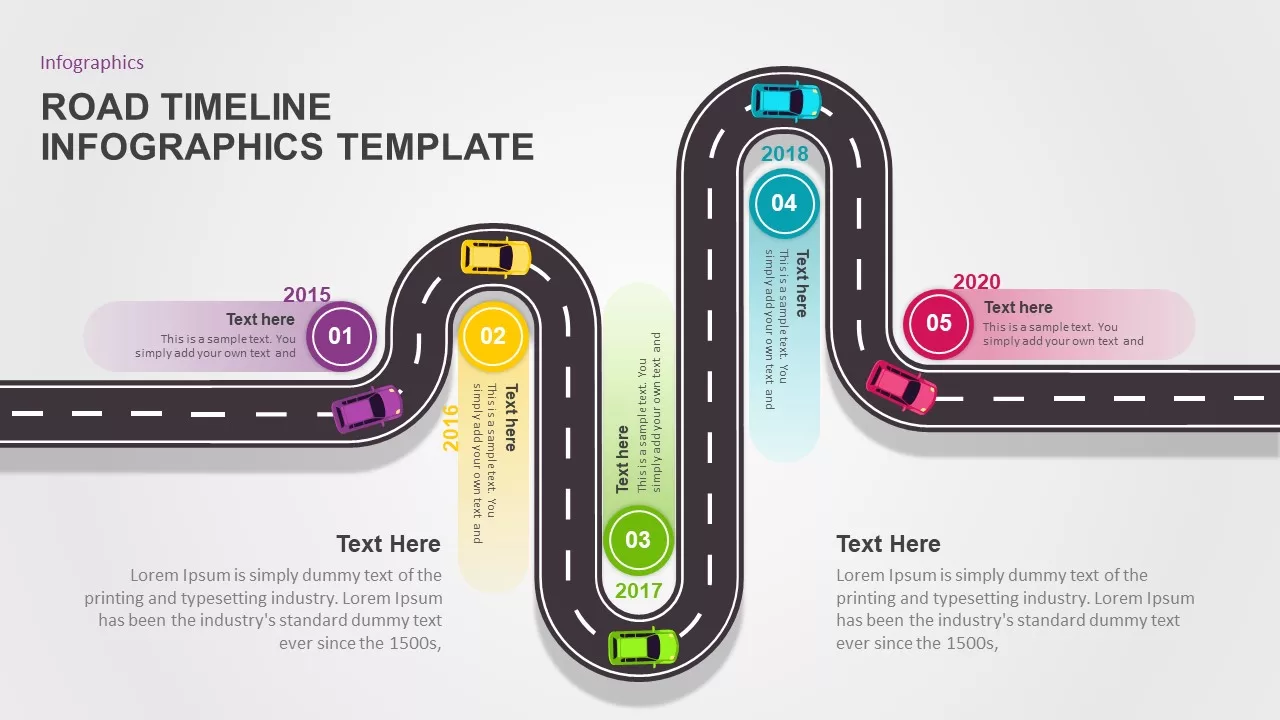
Road Timeline Infographics Template for PowerPoint & Google Slides
Timeline
Dynamic Gear Diagram Infographics Template for PowerPoint & Google Slides
Process
Floating Island Ecosystem Infographics Template for PowerPoint & Google Slides
Graphics
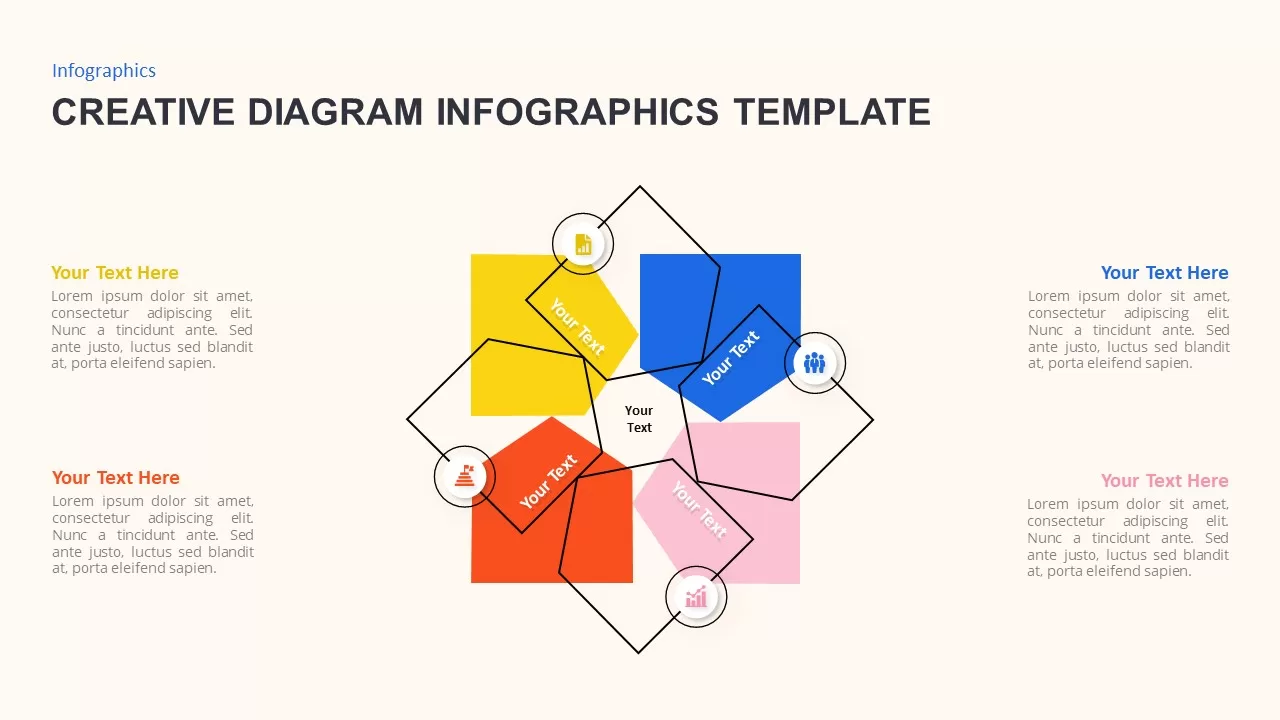
Versatile Creative Diagram Infographics Template for PowerPoint & Google Slides
Process
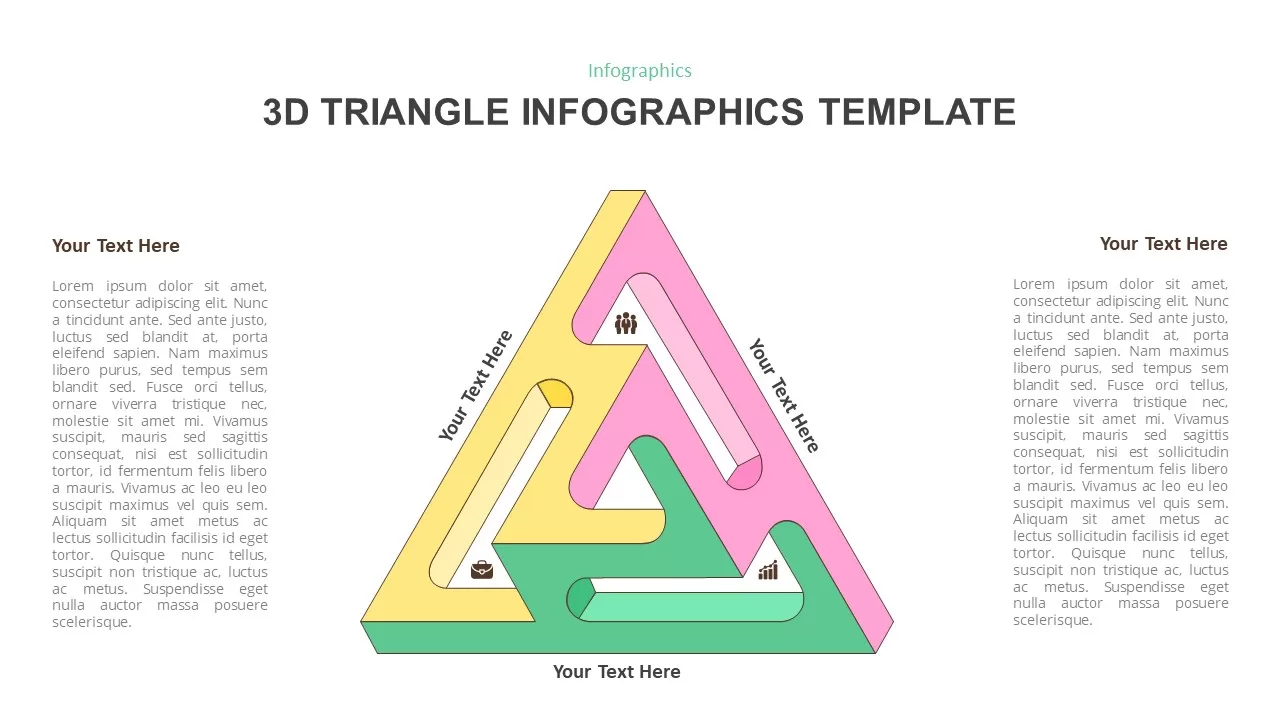
Versatile 3D Modular Shape Infographics Template for PowerPoint & Google Slides
Infographics
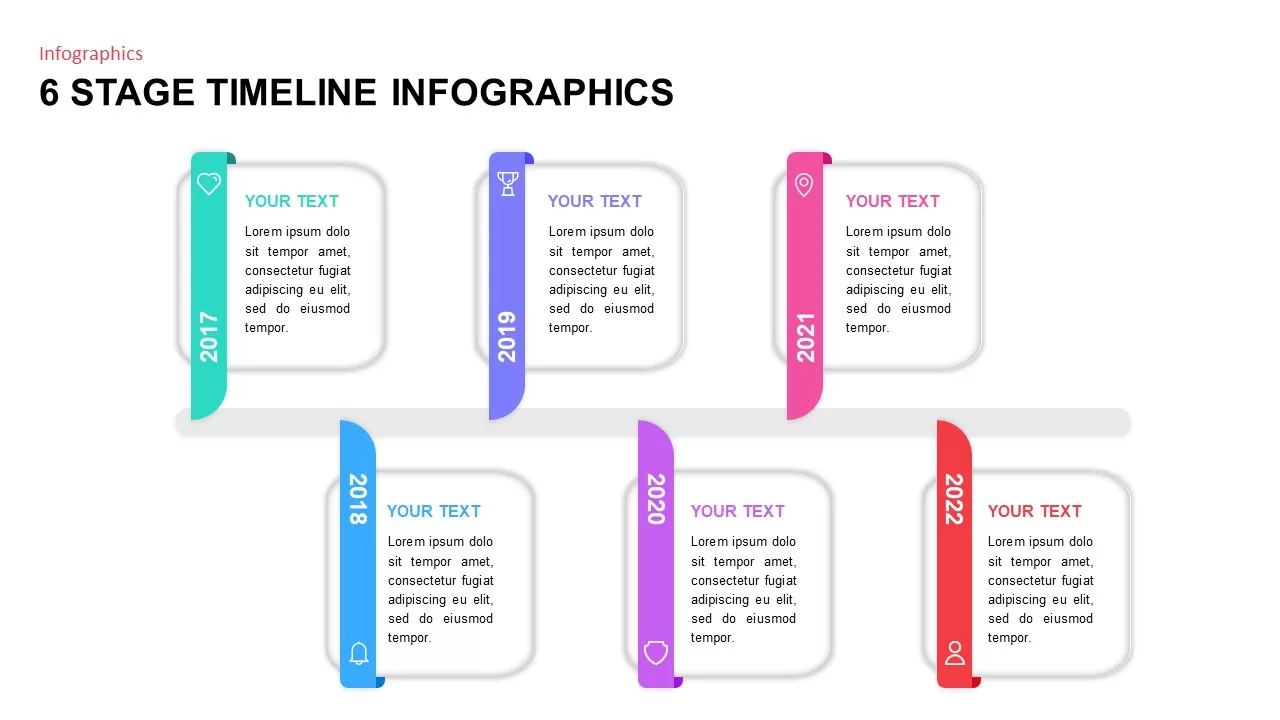
6 Stage Timeline Infographics template for PowerPoint & Google Slides
Timeline
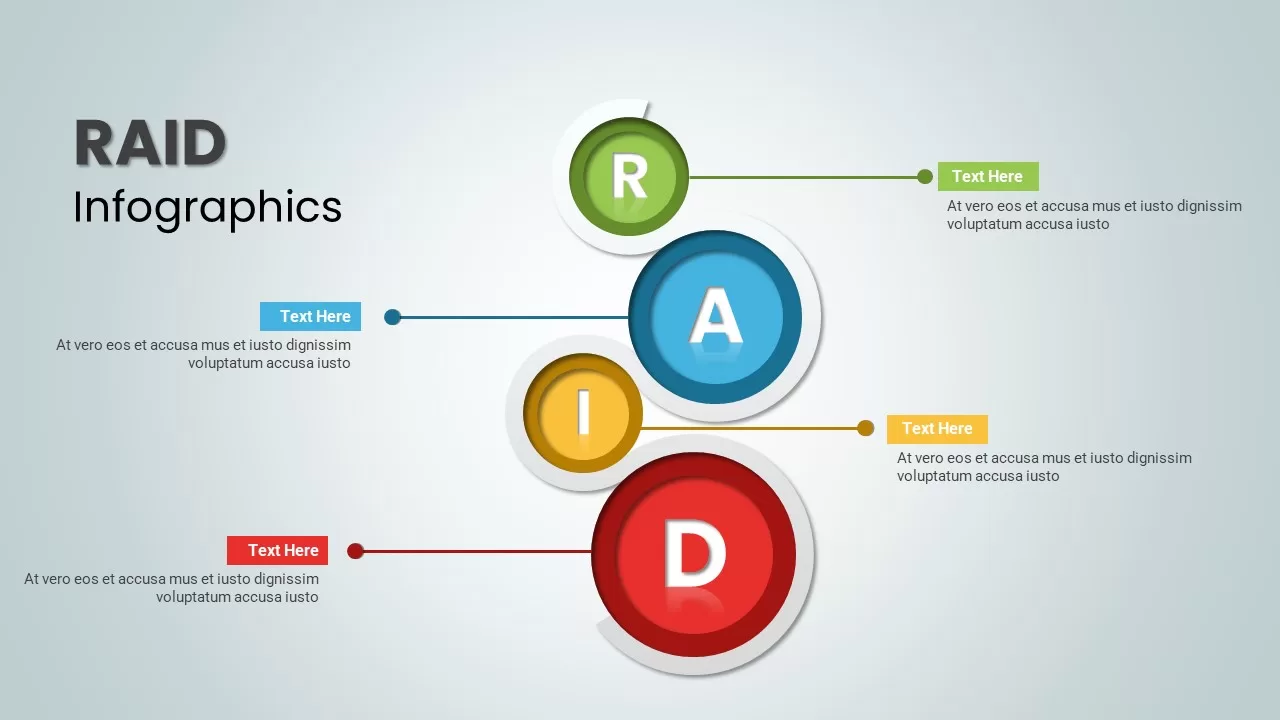
RAID Infographics template for PowerPoint & Google Slides
Business
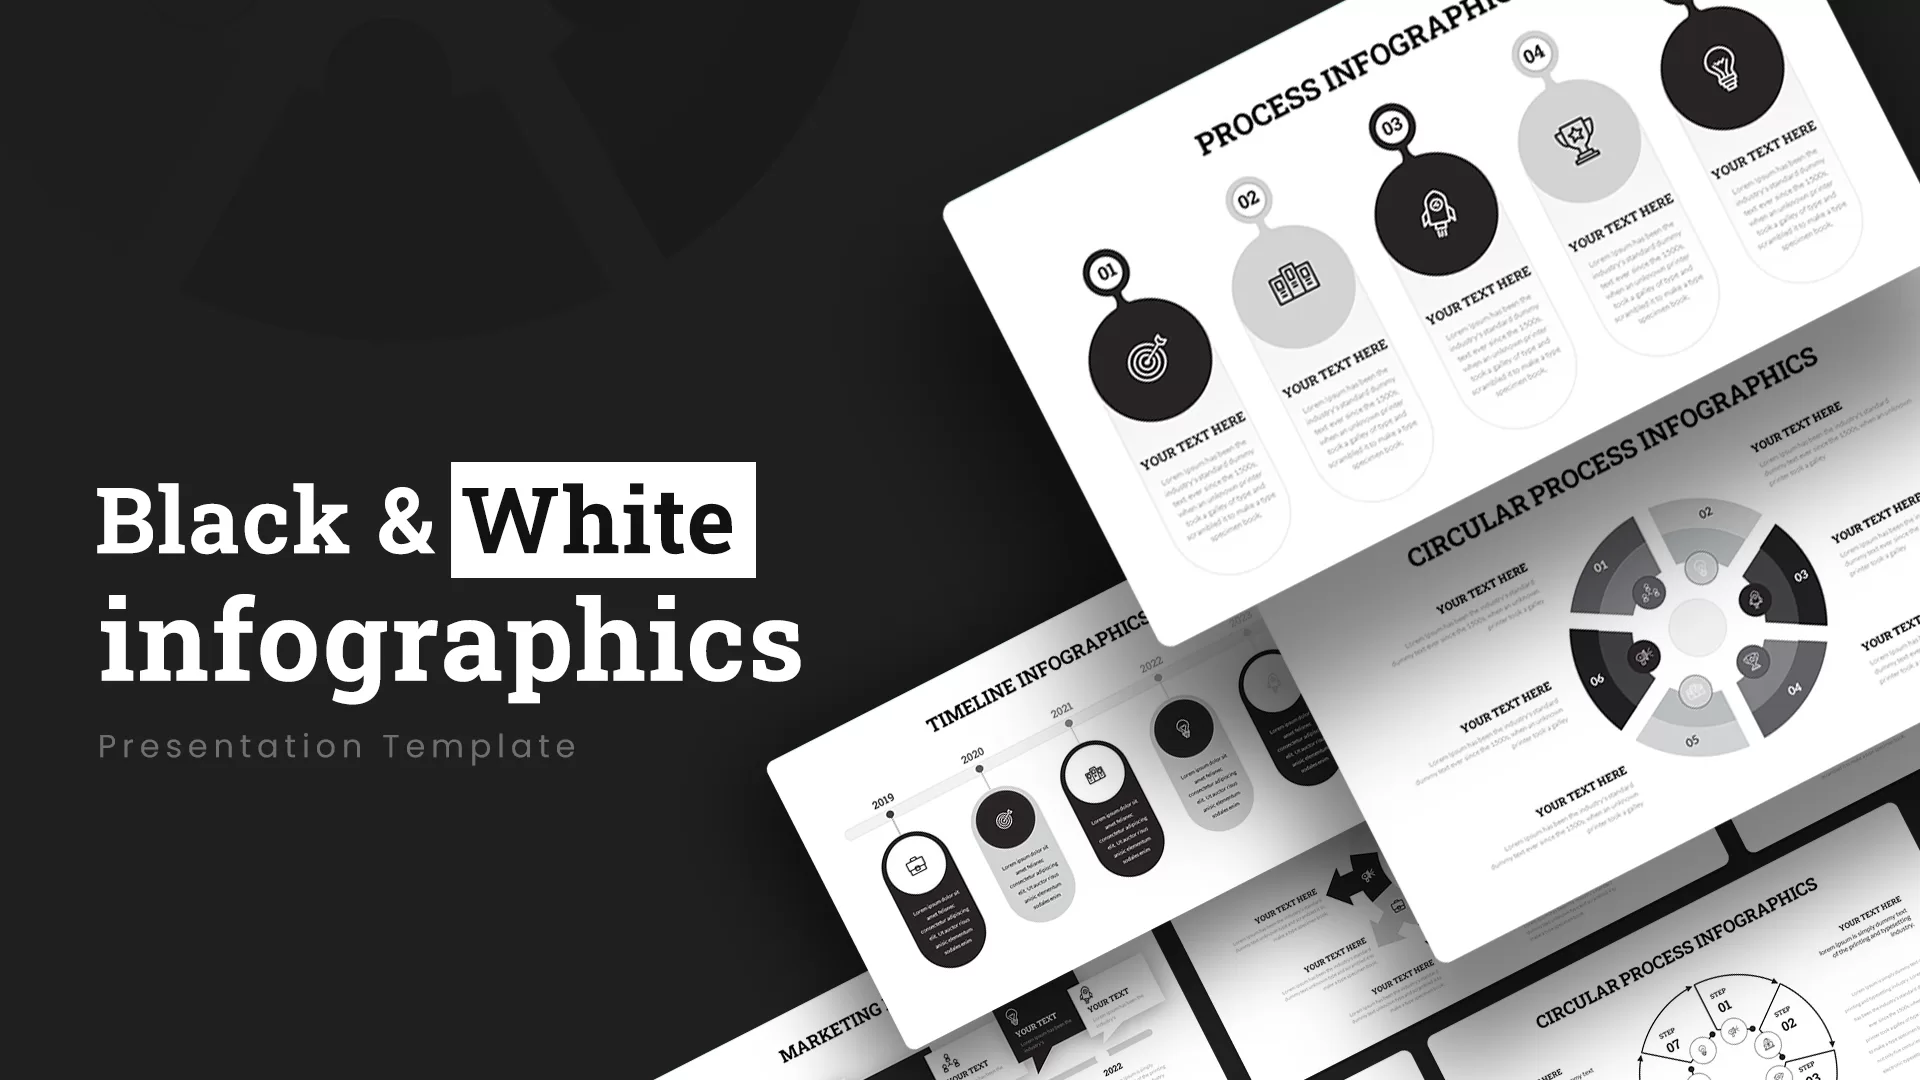
Black and White Infographics template for PowerPoint & Google Slides
Business
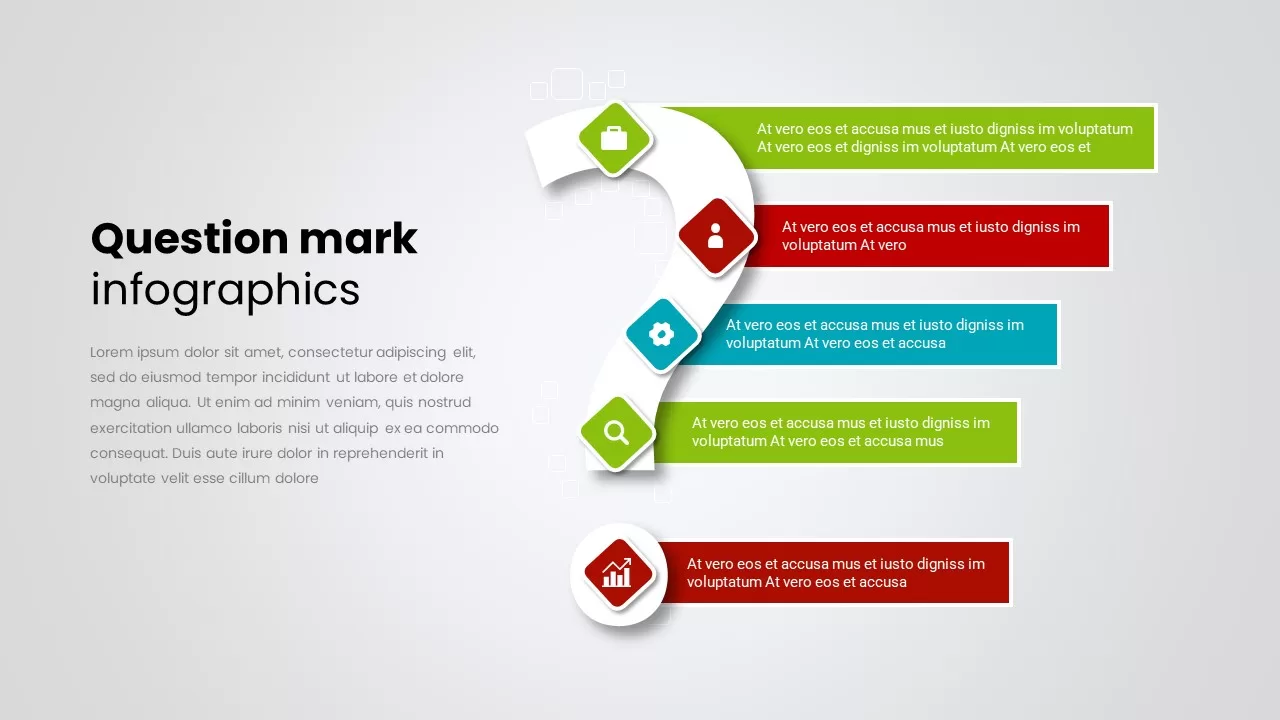
Question Mark Infographics template for PowerPoint & Google Slides
Infographics
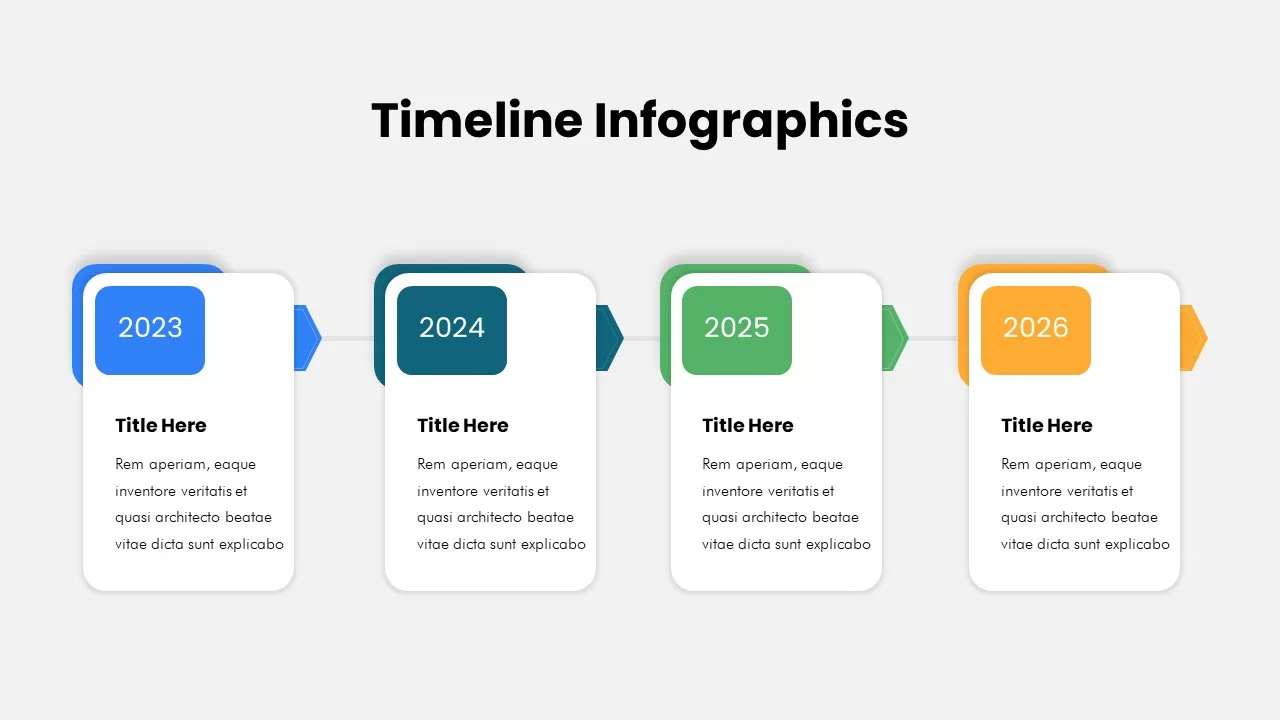
Animated Timeline Infographics template for PowerPoint & Google Slides
Timeline
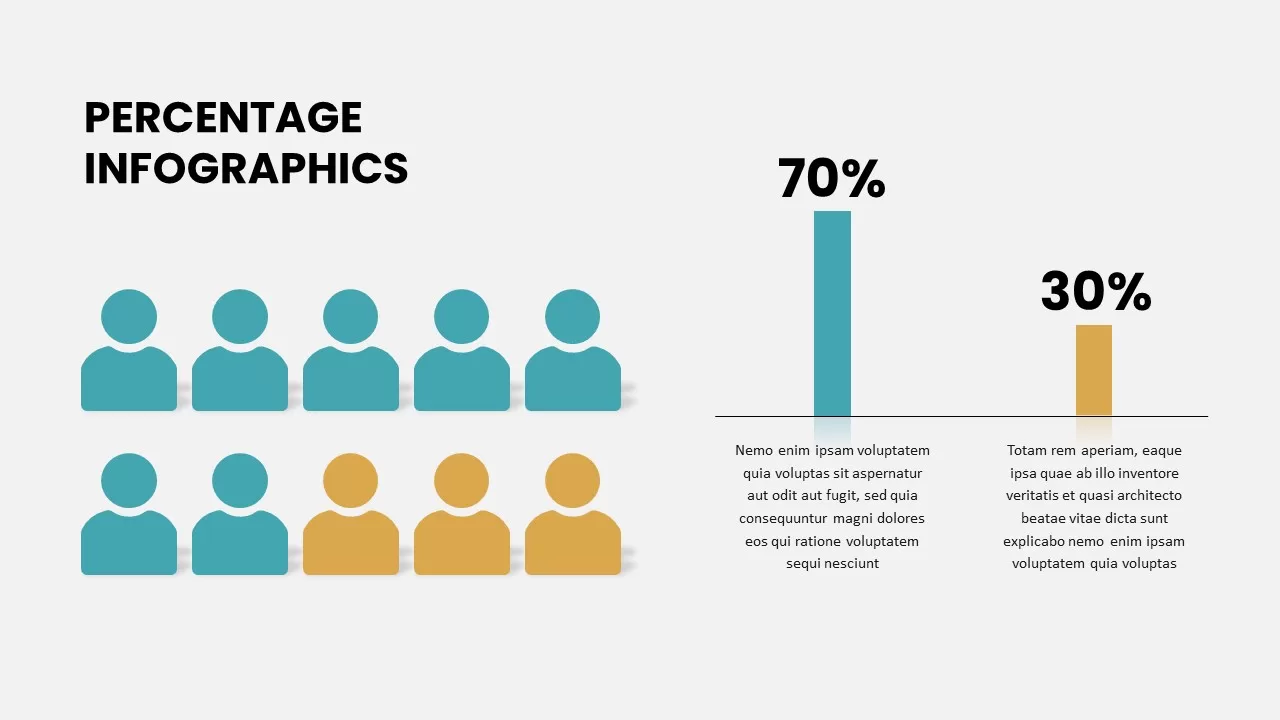
Percentage Infographics template for PowerPoint & Google Slides
Comparison
Before and After Comparison Infographics Template for PowerPoint & Google Slides
Comparison
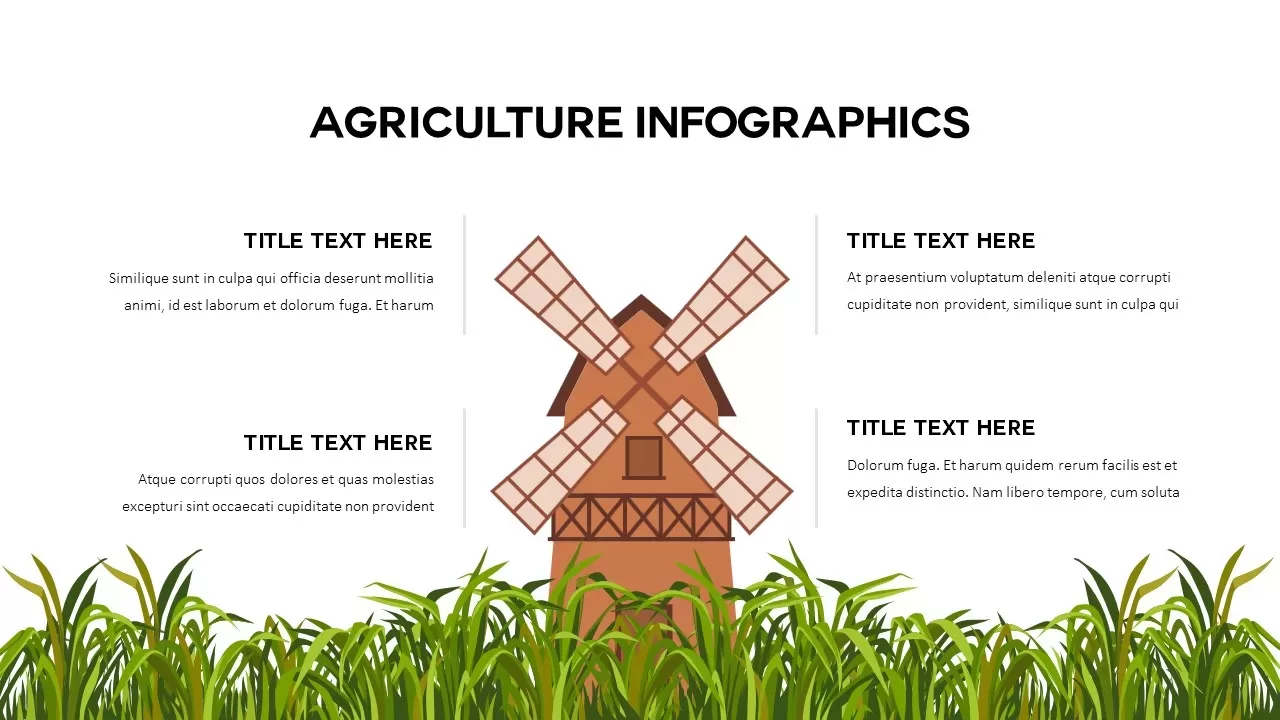
Agriculture Windmill Infographics Template for PowerPoint & Google Slides
Comparison
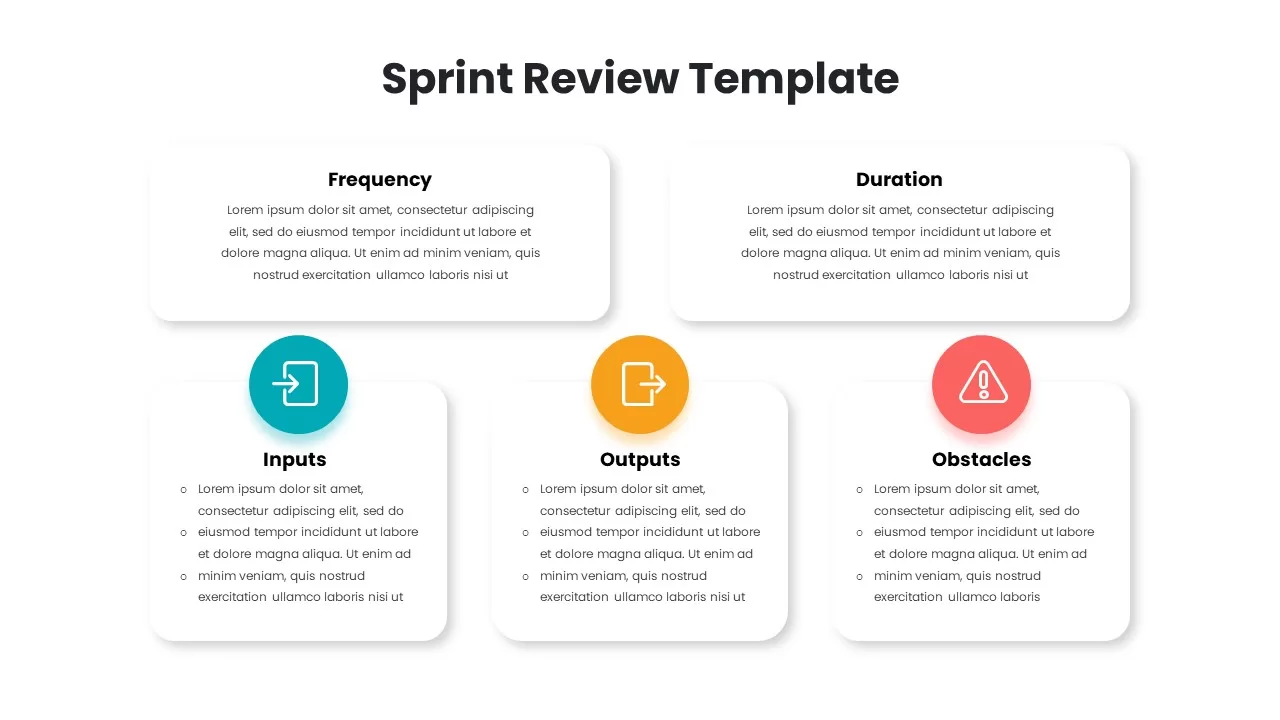
Sprint Review Process Infographics Pack Template for PowerPoint & Google Slides
Infographics
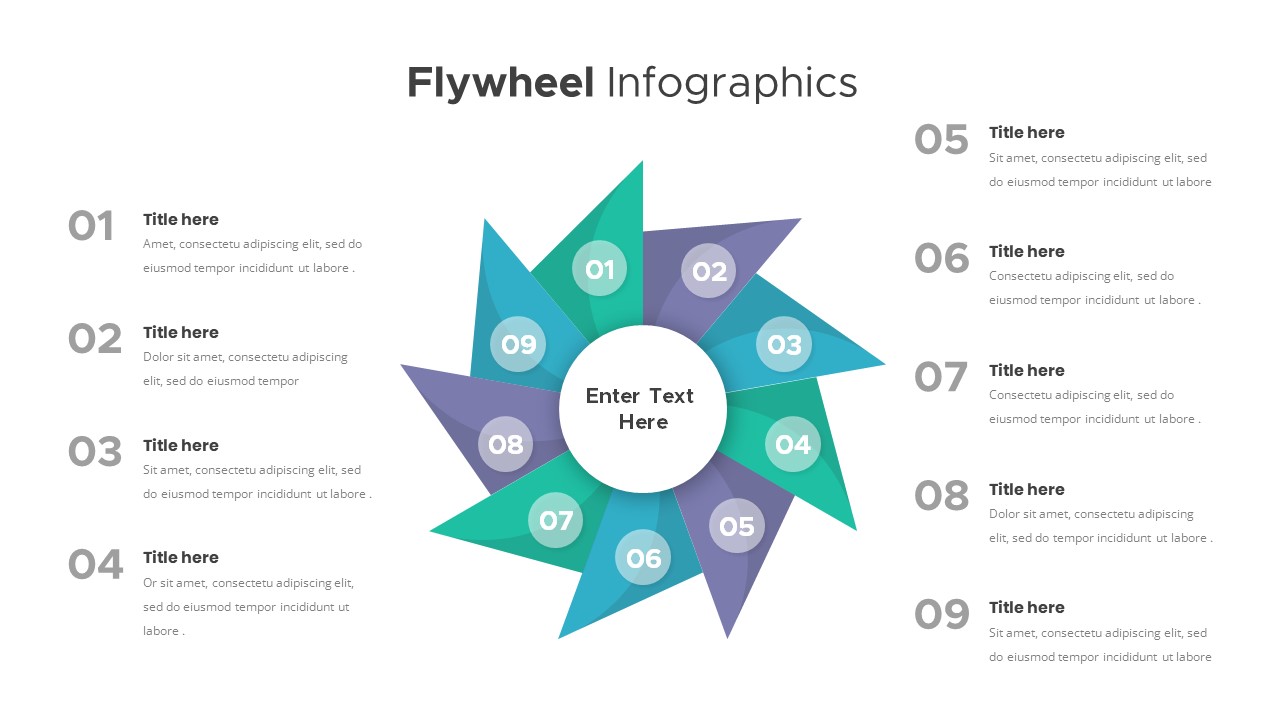
Flywheel Infographics template for PowerPoint & Google Slides
Process
Flywheel Infographics template for PowerPoint & Google Slides
Business Strategy
Flywheel Infographics template for PowerPoint & Google Slides
Business Strategy
Social Media Hub-and-Spoke Infographics Template for PowerPoint & Google Slides
Circular

Steps Infographics Template for PowerPoint & Google Slides
Decks
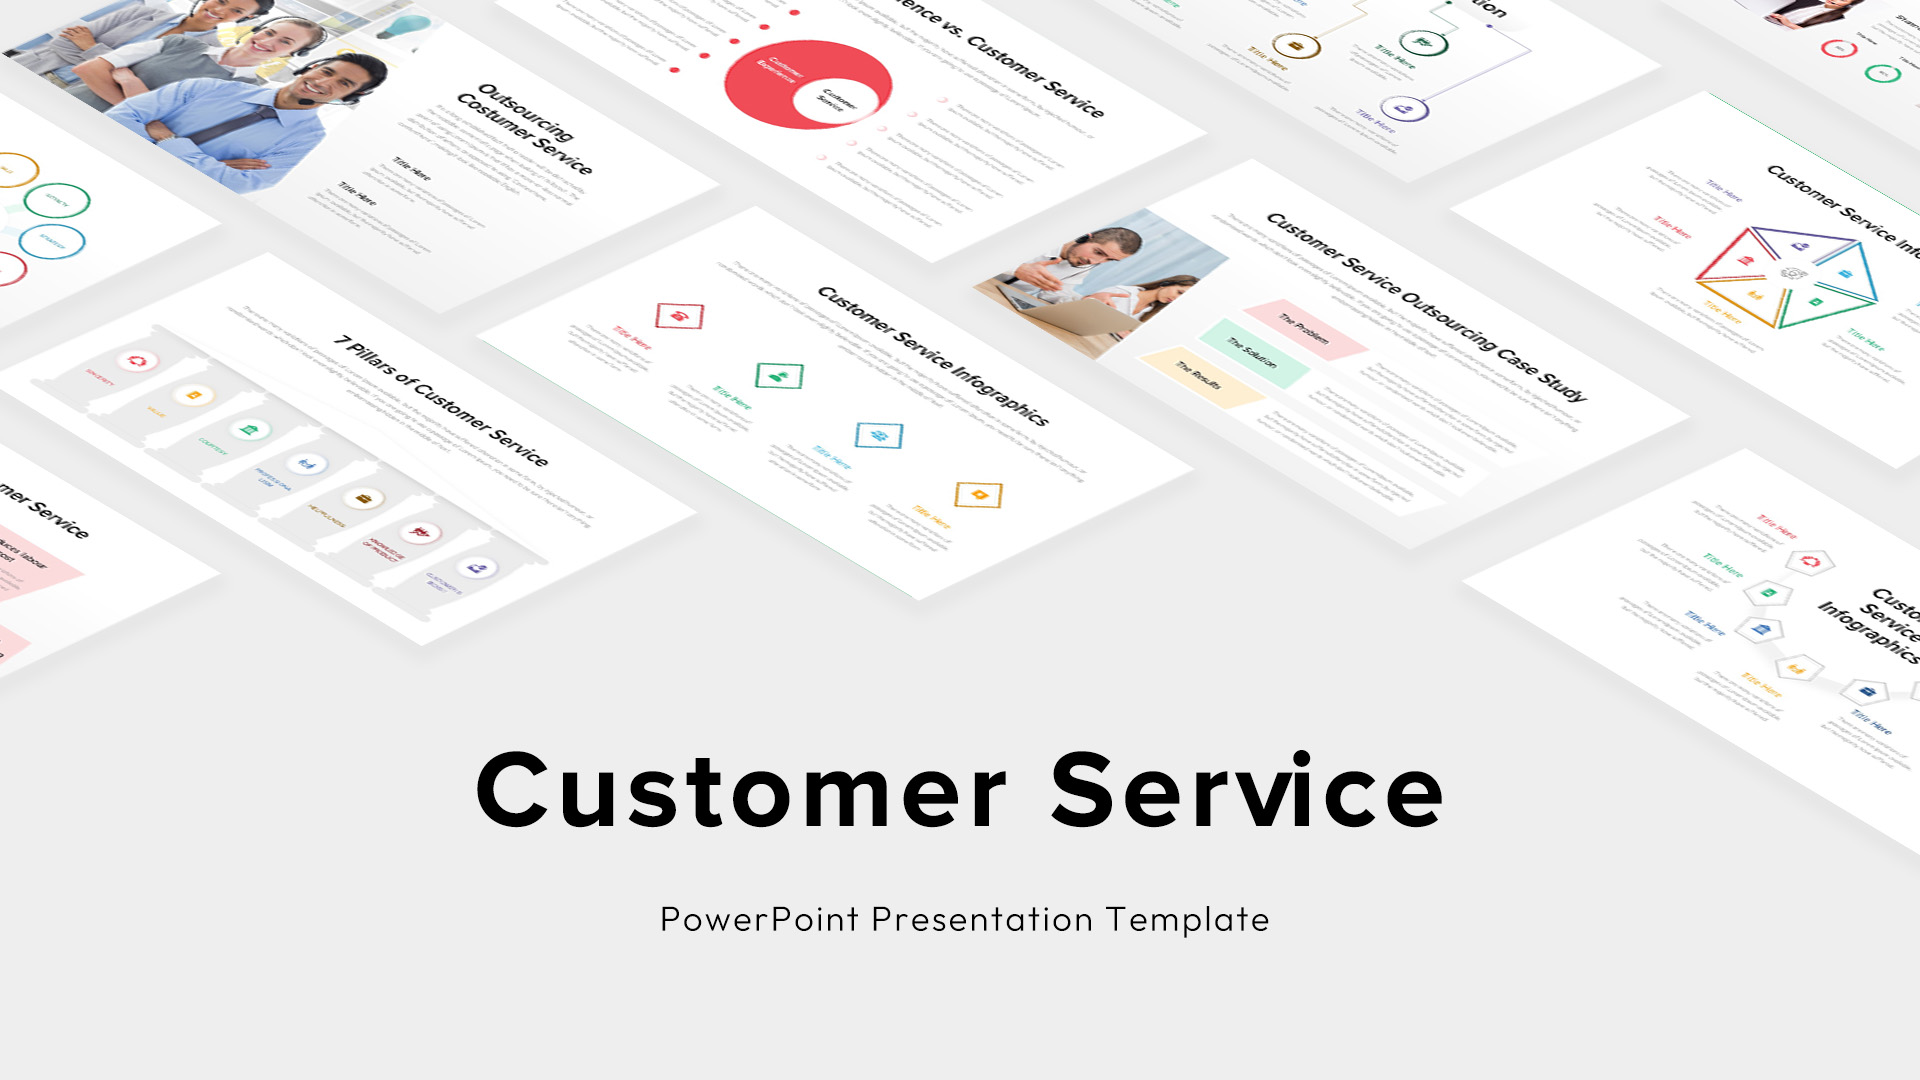
Custom Customer Service Infographics Template for PowerPoint & Google Slides
Process
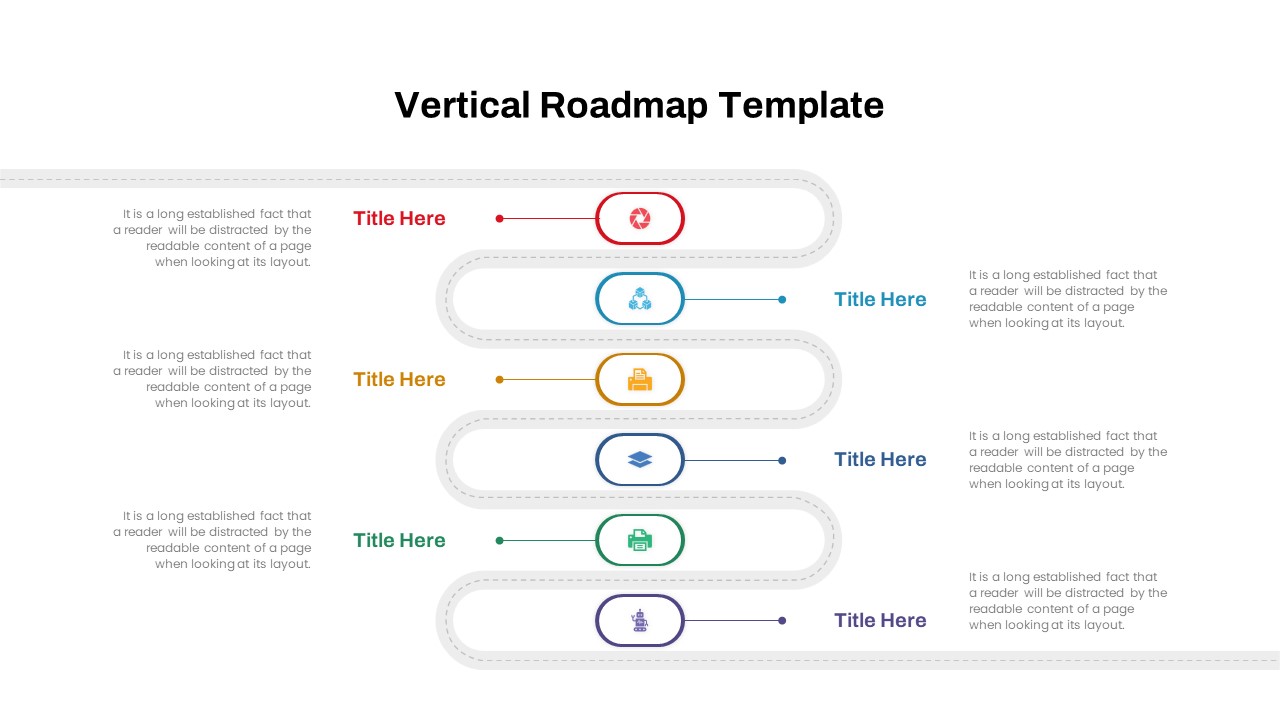
Vertical Roadmap Infographics Template for PowerPoint & Google Slides
Roadmap
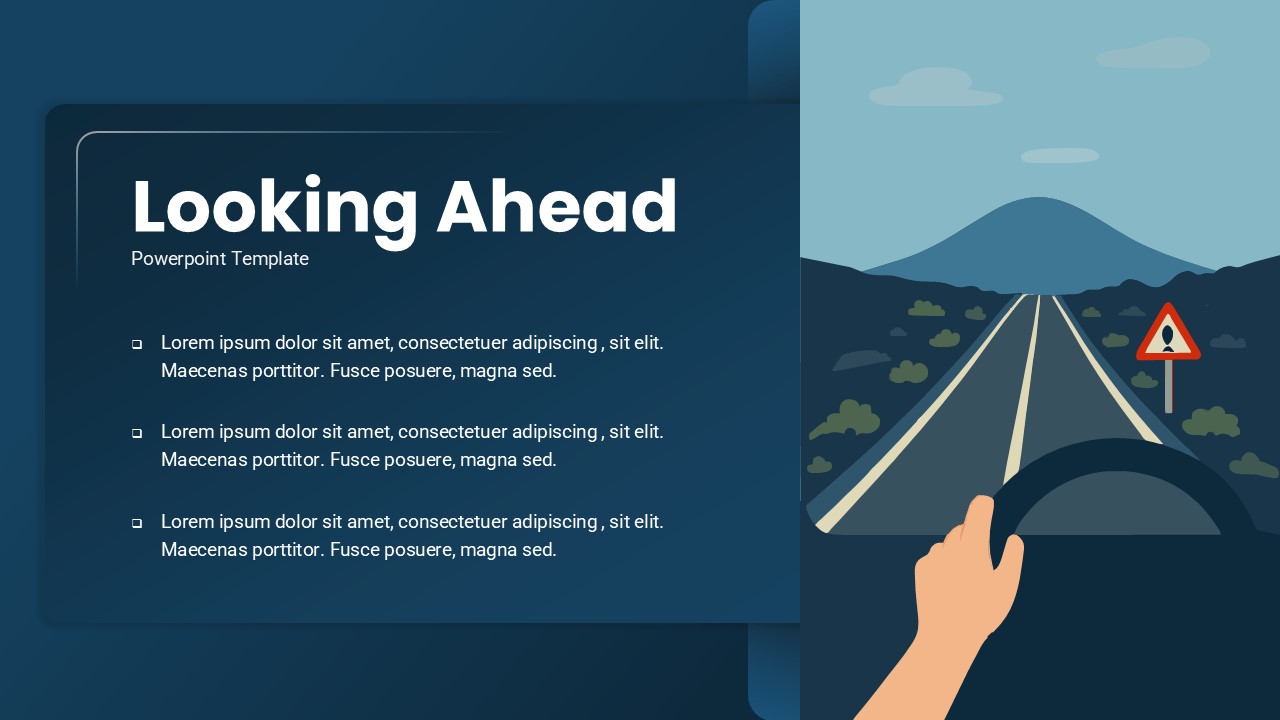
Looking Ahead 3-Slide Infographics Pack Template for PowerPoint & Google Slides
Business
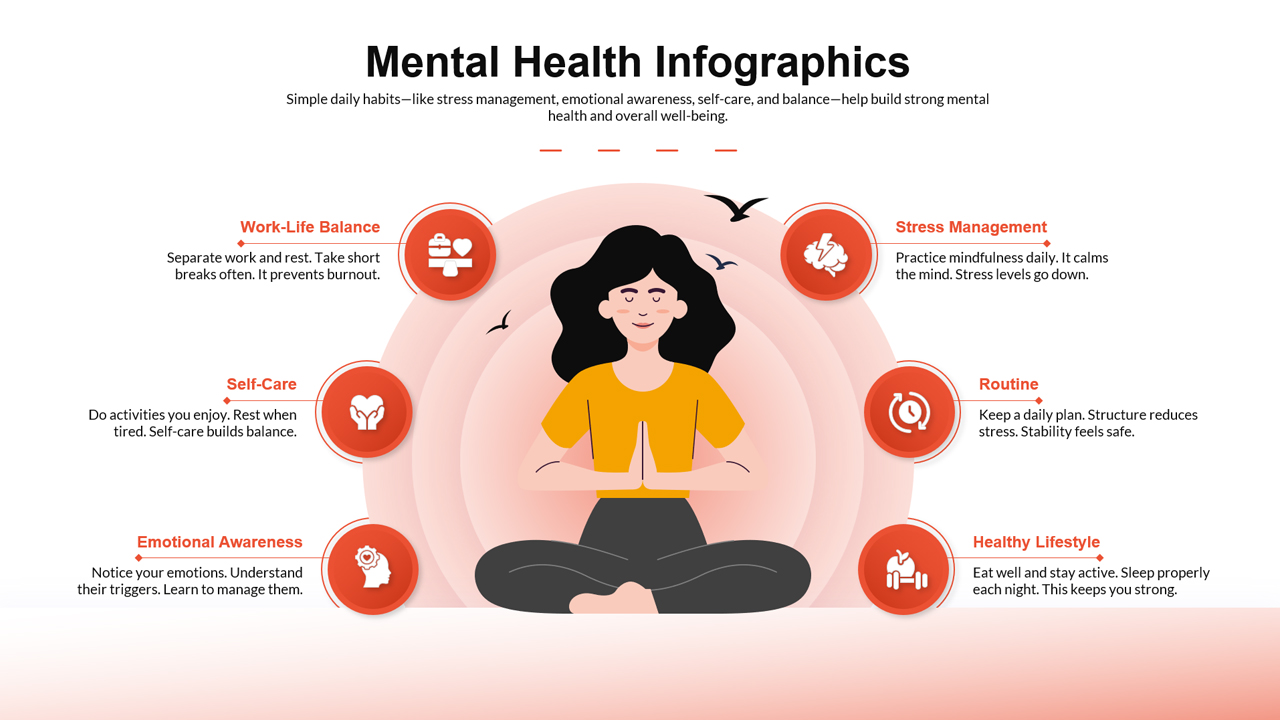
Mental Health Infographics Template for PowerPoint & Google Slides
Health