Looped Infinity Infographic Slide Template for PowerPoint & Google Slides


Description
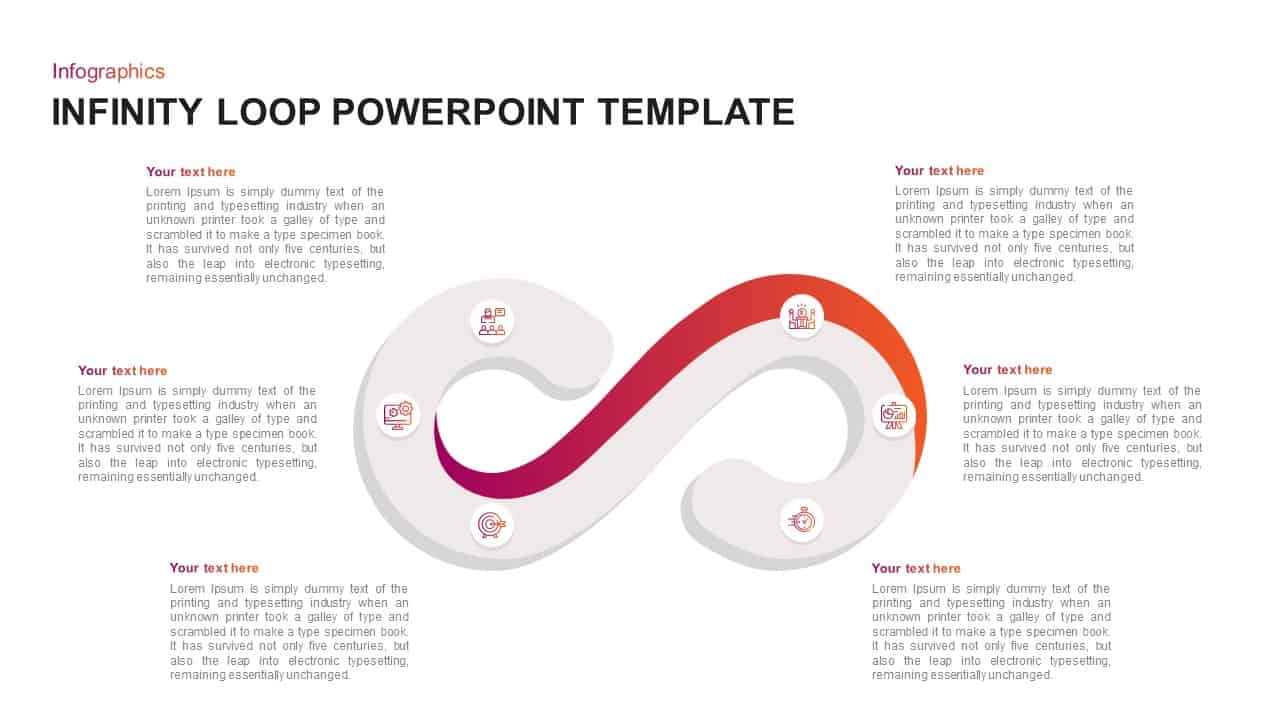
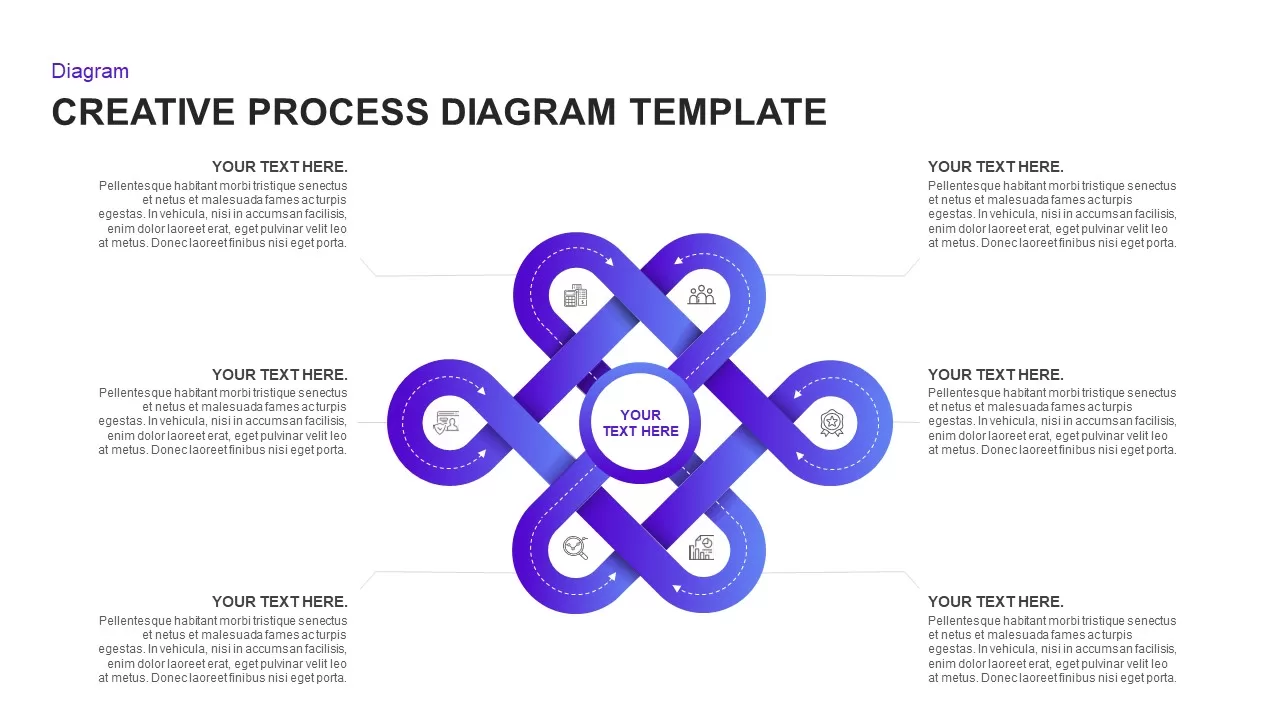
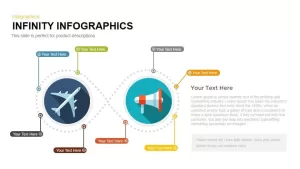
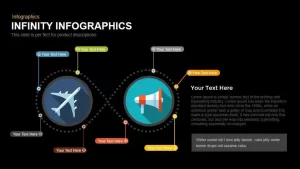
Leverage this infinity loop infographic slide to showcase dual-phase processes and segmented content within a seamless figure-eight layout. Two central circular pods house core icons—an airplane symbol in a dark navy circle signifying transportation or launch, and a megaphone icon in a vibrant teal circle denoting communication or outreach. These pods are connected by a dotted, figure-eight pathway that guides viewers through a logical, clockwise progression. Eight customizable markers, each featuring a colored label and text placeholder, encircle the loops to call out distinct data points, feature highlights, or strategic pillars. A clean header area presents your main title and subtitle “This slide is perfect for product descriptions,” while a versatile body-text region on the right offers space for expanded narratives or explanatory copy.
Built with flat icons, crisp typography, and generous white space, this slide delivers a modern, professional aesthetic that adapts seamlessly across PowerPoint and Google Slides platforms. Master-slide integration and fully editable vector shapes empower users to swap icons, adjust hues, resize elements, and rearrange markers in seconds. Whether you are mapping a two-stage product lifecycle with four focal points per phase, illustrating a customer journey loop, or breaking down dual-channel marketing strategies, the modular design simplifies complex narratives into an intuitive visual flow. The dotted infinity path not only adds a dynamic sense of movement but also reinforces cyclical relationships between concepts. With its balanced composition and clear visual hierarchy, this template ensures audience engagement and comprehension, helping presenters guide stakeholders through intricate information with maximum clarity and impact.
Who is it for
Product managers, marketers, business analysts, and consultants will find this slide invaluable when presenting dual-phase strategies, cyclical workflows, or multi-point processes. Strategic planners can map customer journeys, training facilitators can design interactive modules, and startup founders can visualize go-to-market plans with clarity and engagement.
Other Uses
Beyond product overviews, repurpose this infinity infographic to illustrate marketing funnels, customer retention loops, project lifecycles, service portfolios, sales pipelines, or risk management cycles. Use the adaptable figure-eight layout for educational diagrams, process mappings, change management frameworks, or data storytelling, making it a versatile asset across industries and corporate functions.
Login to download this file

Item ID
SB00435
Related Templates

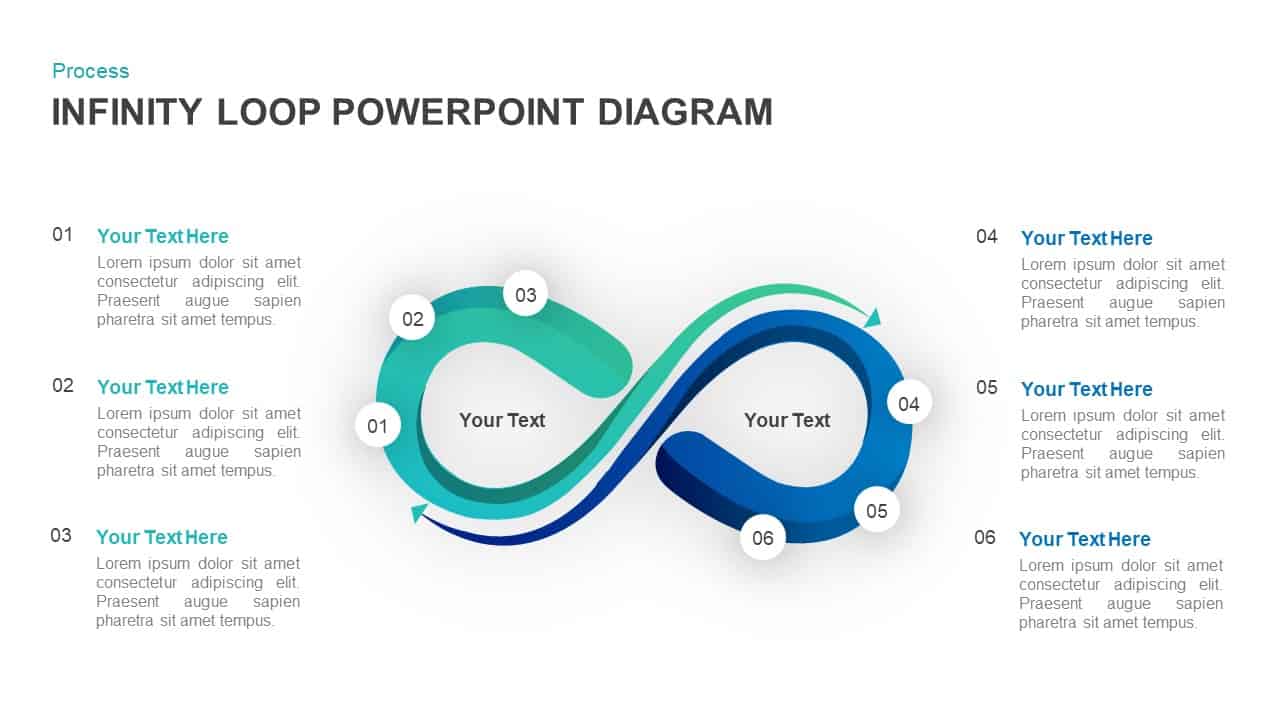
Infinity Loop Infographic template for PowerPoint & Google Slides
Process

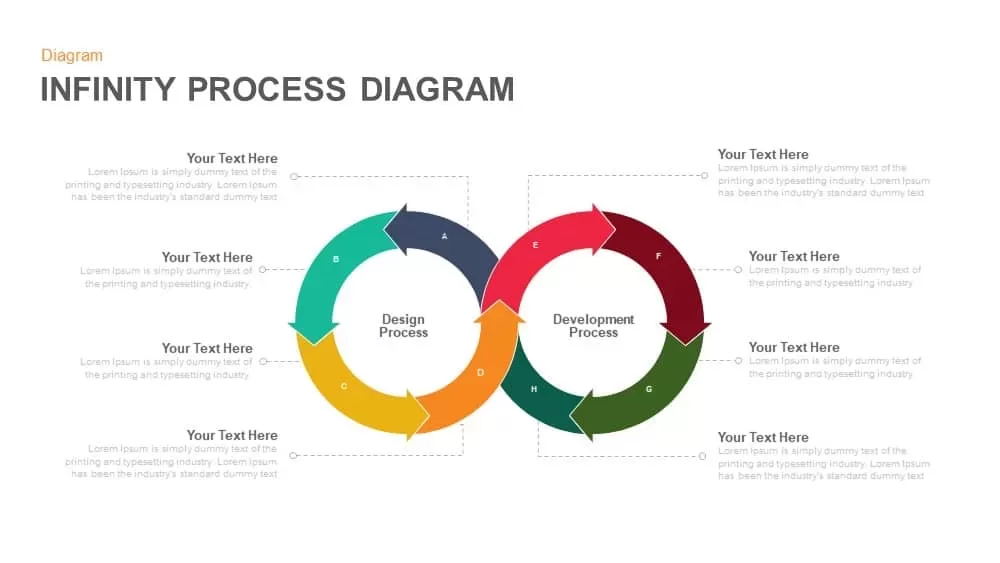
Infinity Process Diagram Template for PowerPoint & Google Slides
Process
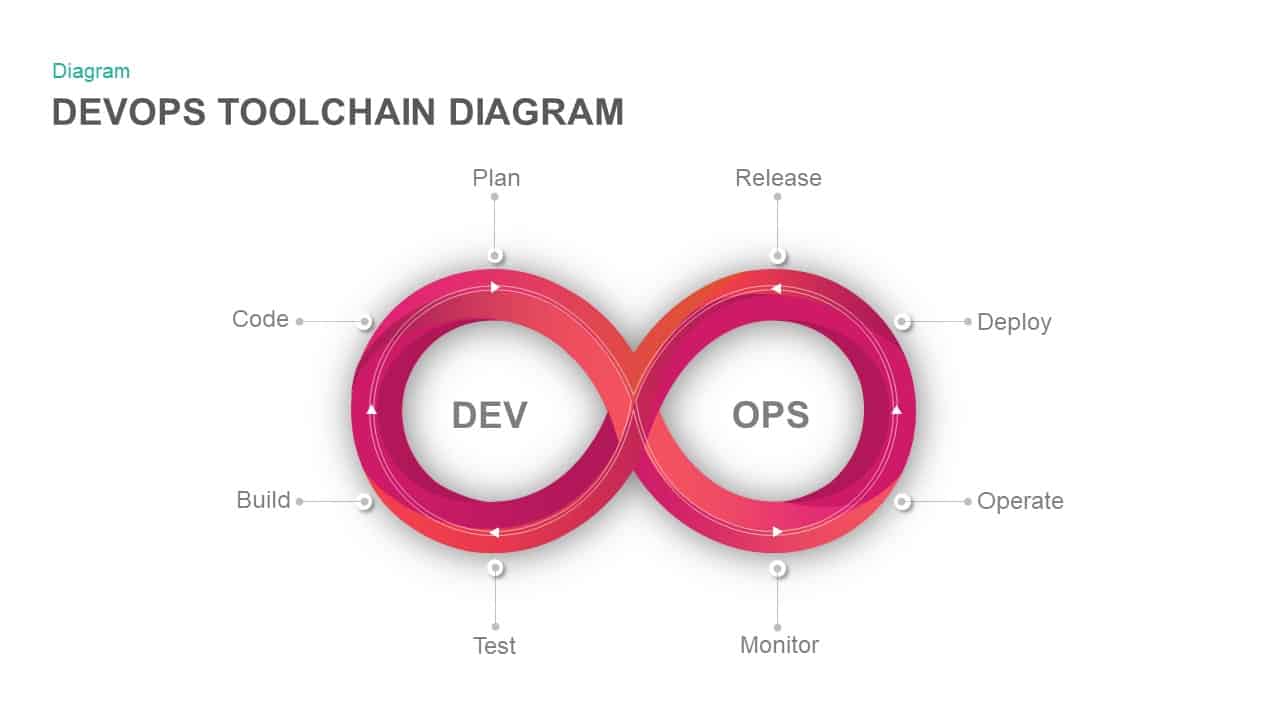
DevOps Infinity Loop Process Diagram Template for PowerPoint & Google Slides
Process
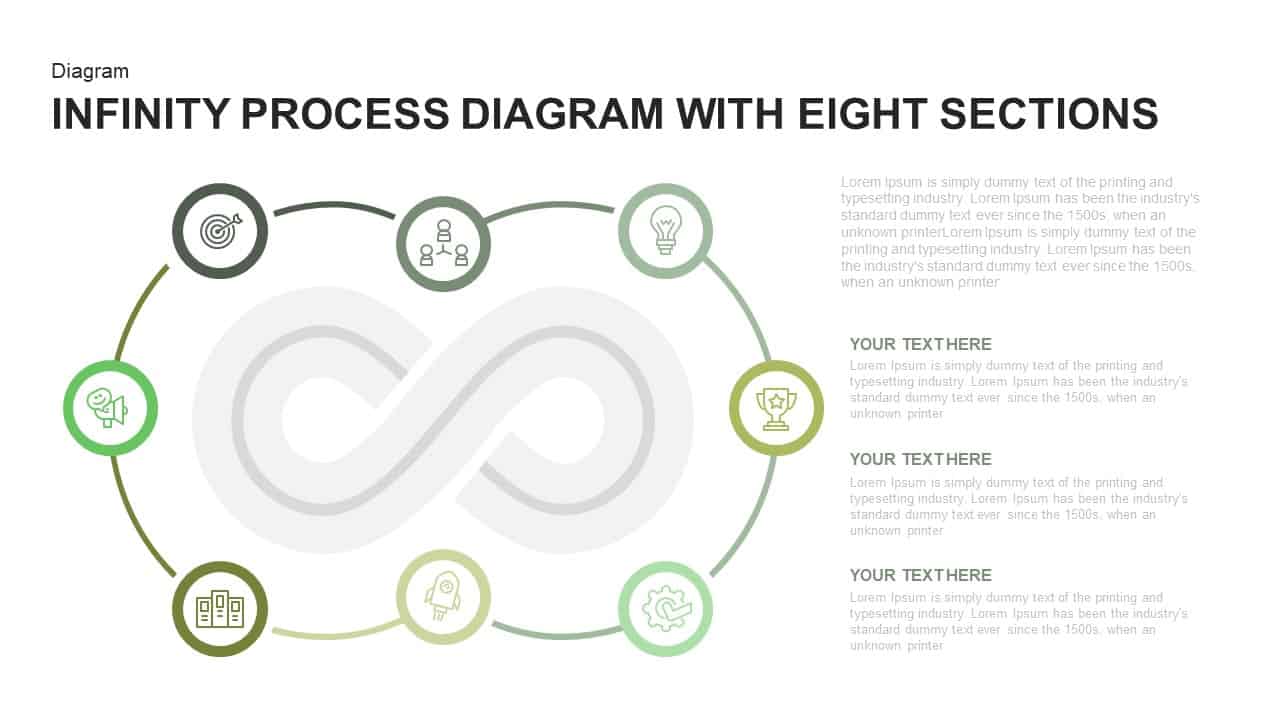
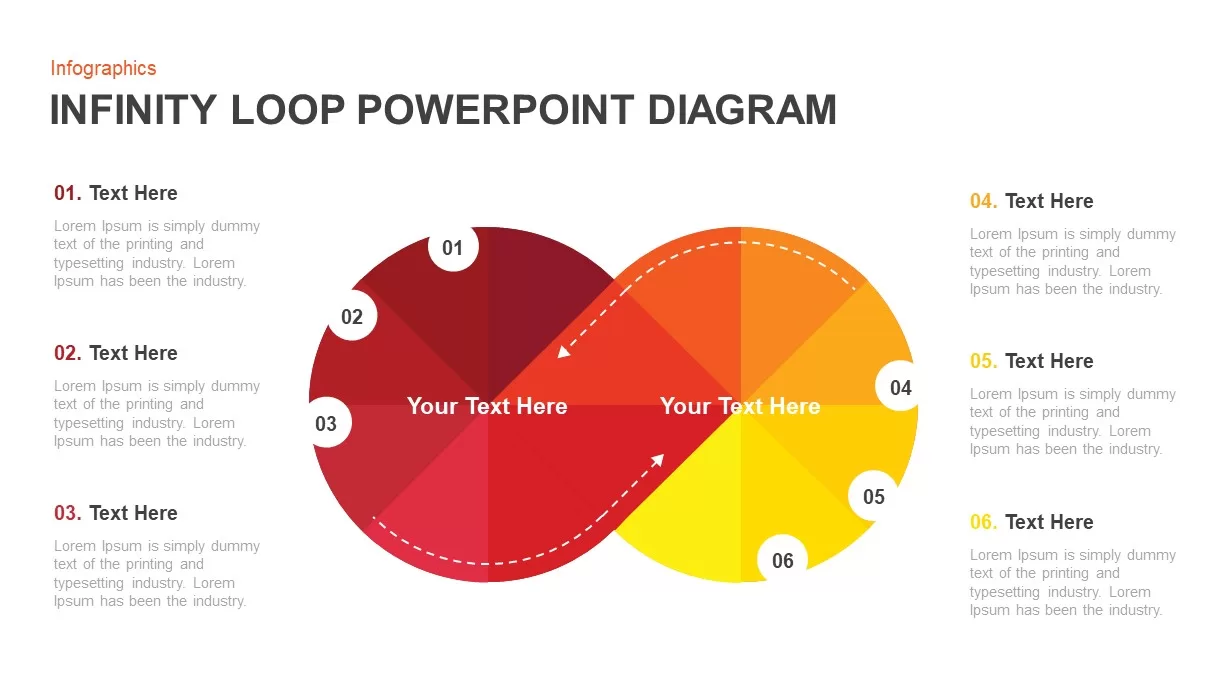
Infinity Process Diagram template for PowerPoint & Google Slides
Process
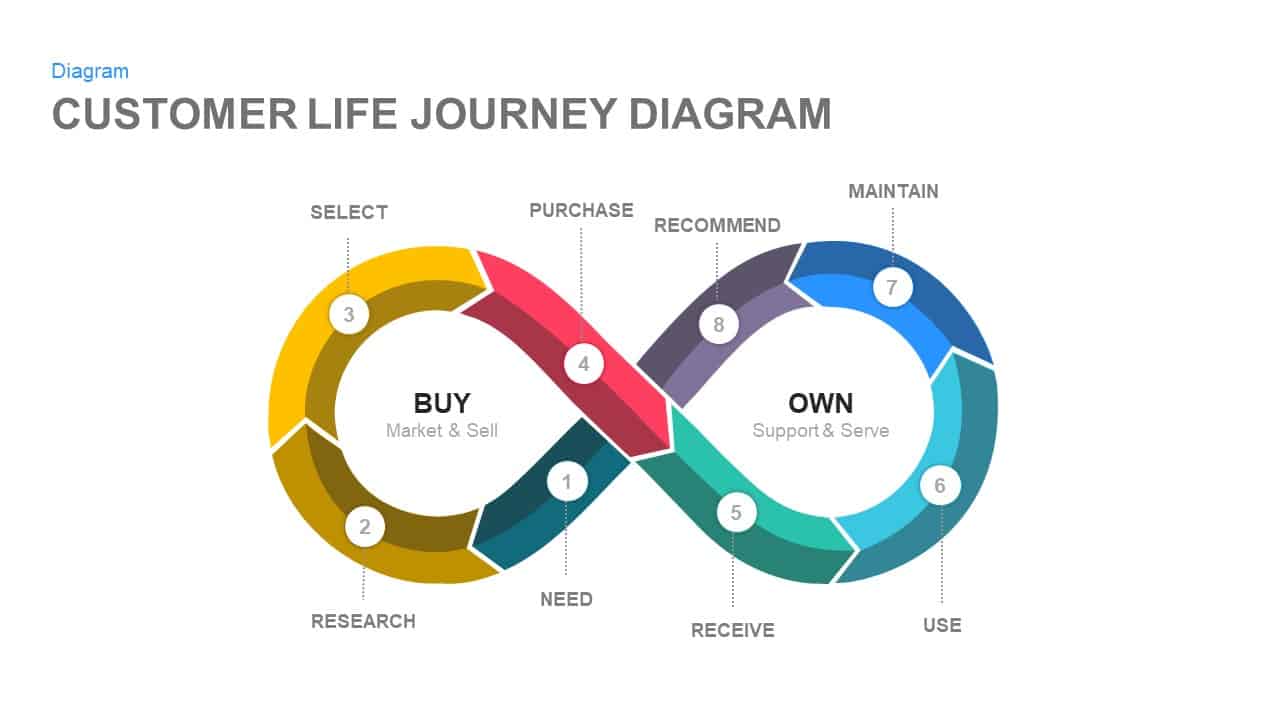
Customer Life Journey Infinity Diagram Template for PowerPoint & Google Slides
Customer Journey
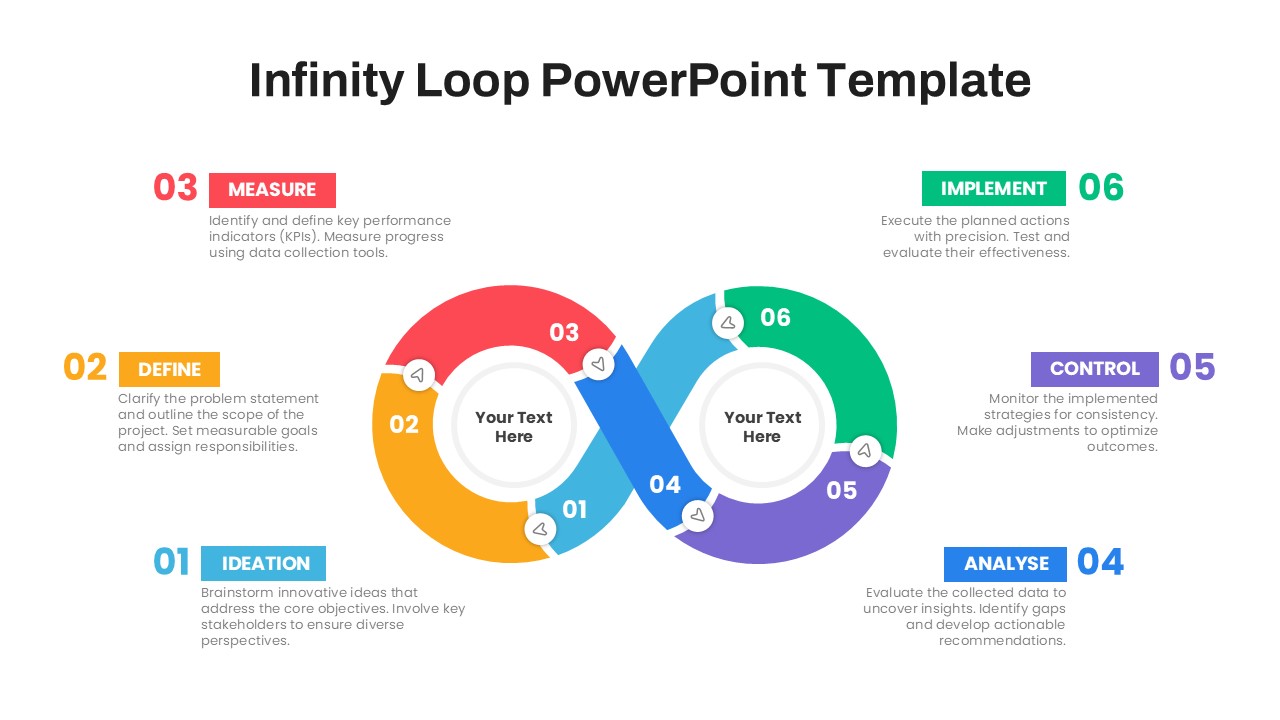
Six-Stage Infinity Loop Process Diagram Template for PowerPoint & Google Slides
Process
Six-Step Infinity Loop Process Diagram Template for PowerPoint & Google Slides
Process

Six-Stage Infinity Loop Diagram Template for PowerPoint & Google Slides
Process
Creative Infinity Loop Process Diagram Template for PowerPoint & Google Slides
Process
Customer Lifecycle Stages Infinity Loop Template for PowerPoint & Google Slides
Customer Journey
Five 3D Growth Arrow Infographic Slide Template for PowerPoint & Google Slides
Arrow

Key Metaphor Infographic Slide Template for PowerPoint & Google Slides
Process
Customer Feedback Infographic Slide Template for PowerPoint & Google Slides
Customer Experience
Roadmap Infographic Timeline Slide Template for PowerPoint & Google Slides
Roadmap
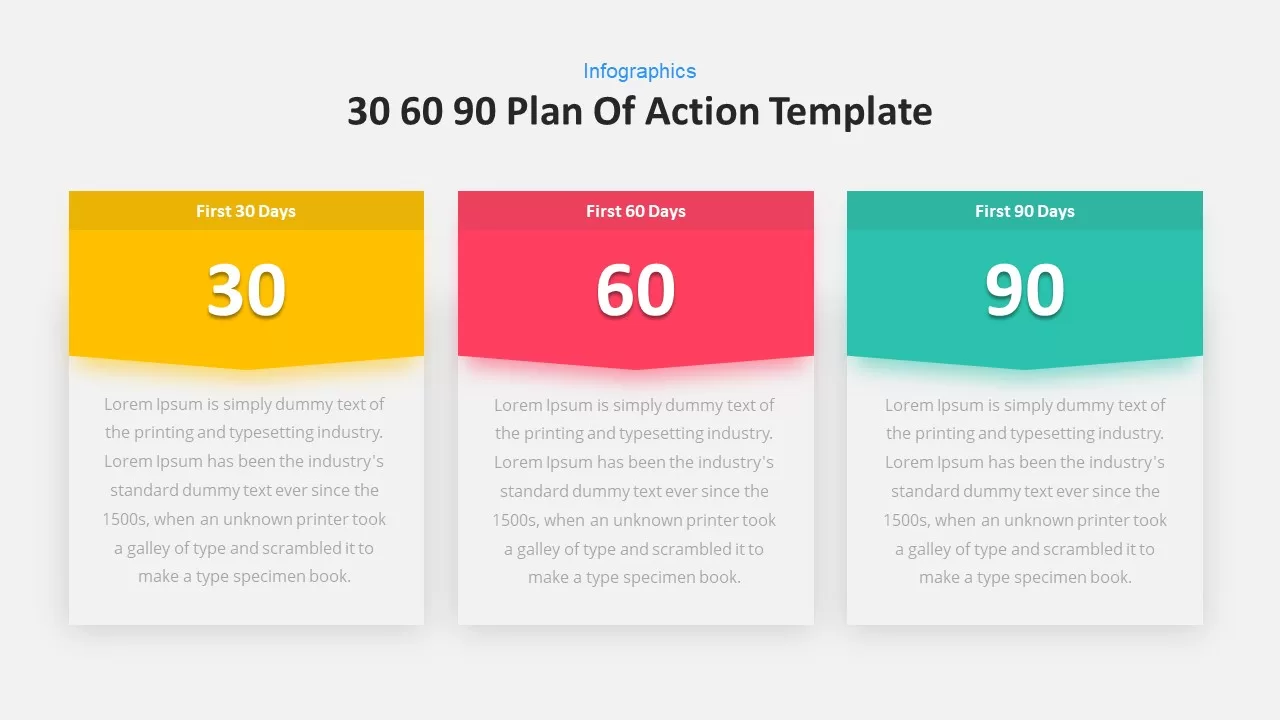
30 60 90-Day Plan Infographic Slide Template for PowerPoint & Google Slides
Business
Arrow Timeline Infographic Slide Template for PowerPoint & Google Slides
Timeline
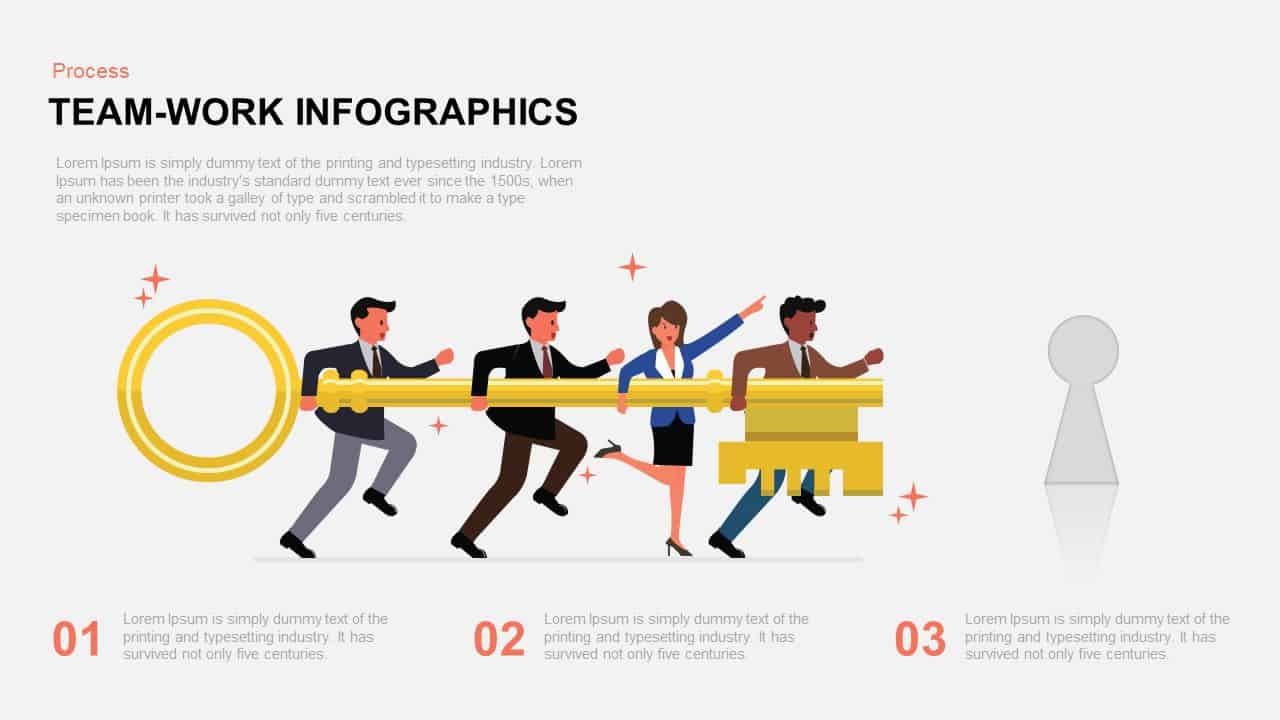
Teamwork Key Infographic Slide Template for PowerPoint & Google Slides
Process
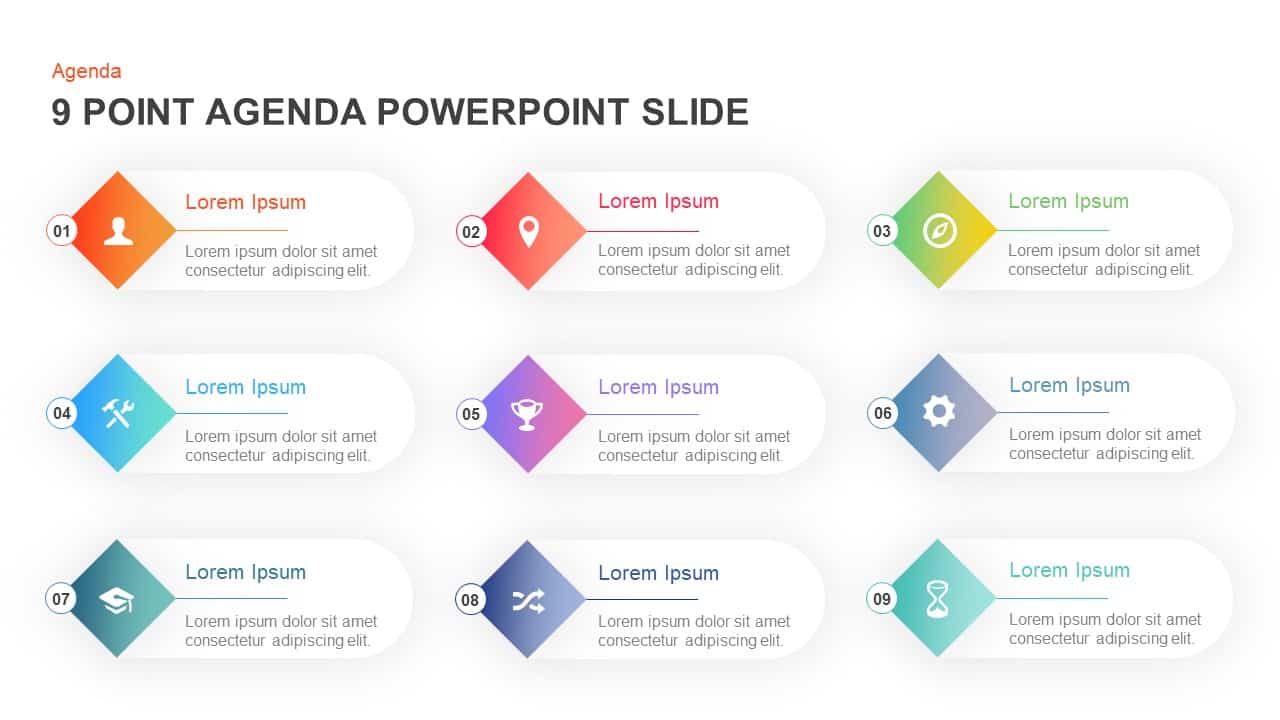
Nine-Point Agenda Infographic Slide Template for PowerPoint & Google Slides
Agenda
Five-Step Growth Infographic Slide Template for PowerPoint & Google Slides
Process
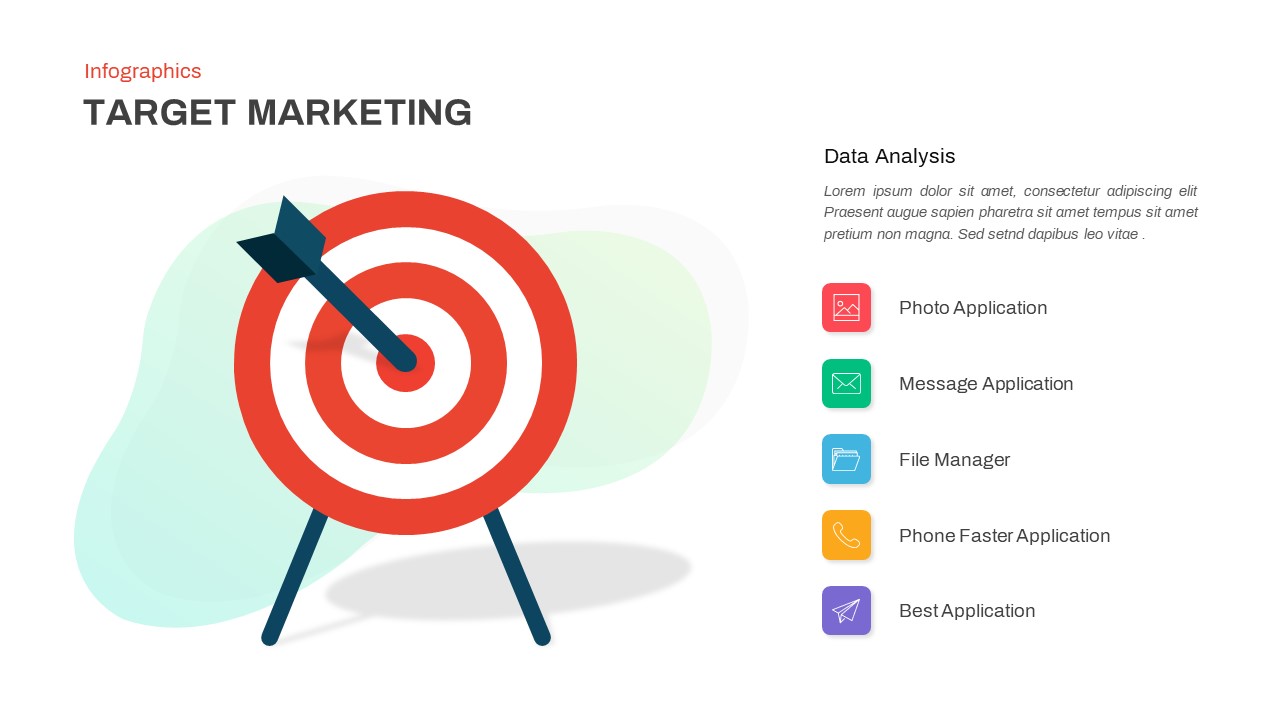
Target Marketing Infographic Slide Pack Template for PowerPoint & Google Slides
Infographics
5 Stage Timeline Infographic Slide Template for PowerPoint & Google Slides
Timeline
Two-Column Comparison Infographic Slide Template for PowerPoint & Google Slides
Comparison

Team Achievements Infographic Slide Template for PowerPoint & Google Slides
Accomplishment
Shape Loop Four-Step Infographic Slide Template for PowerPoint & Google Slides
Process
Four-Stage Agenda Infographic Slide Template for PowerPoint & Google Slides
Agenda
5-Stage Timeline Infographic Slide Template for PowerPoint & Google Slides
Timeline
Four Step Process Infographic Slide Template for PowerPoint & Google Slides
Process
Target Goals Infographic Slide Template for PowerPoint & Google Slides
Goals
Mind Map Infographic Slide Template for PowerPoint & Google Slides
Mind Maps
Bulb Idea Concept Infographic Slide Template for PowerPoint & Google Slides
Process
Table of Contents Infographic Slide template for PowerPoint & Google Slides
Agenda
Multi-Style Flow Infographic Slide template for PowerPoint & Google Slides
Process
North America Map Infographic Slide Template for PowerPoint & Google Slides
World Maps
Modular Block Infographic Slide Template for PowerPoint & Google Slides
Infographics
Colorful Block Infographic Metrics Slide Template for PowerPoint & Google Slides
Infographics
Professional Drone Infographic Slide Template for PowerPoint & Google Slides
Infographics
Key Takeaway Slide Infographic Template for PowerPoint & Google Slides
Process
Key Takeaway Infographic Slide Deck Template for PowerPoint & Google Slides
Process
Key Takeaway Keyhole Infographic Slide Template for PowerPoint & Google Slides
Process
Animated 3D Dice Infographic Slide Template for PowerPoint & Google Slides
Process
Core Values Infographic Slide Template for PowerPoint & Google Slides
Comparison
8-Bell Curve Infographic Slide Template for PowerPoint & Google Slides
Comparison Chart
LinkedIn Metrics Infographic Slide Template for PowerPoint & Google Slides
Digital Marketing
Instagram Infographic Metrics Slide Template for PowerPoint & Google Slides
Marketing
Bow and Arrow Goal Infographic Slide Template for PowerPoint & Google Slides
Goals
Triangle Infographic Slide Collection Template for PowerPoint & Google Slides
Decks

Free Colorful Infographic Slide Pack Template for PowerPoint & Google Slides
Roadmap
Free
Free Solar Energy Infographic Slide Template for PowerPoint & Google Slides
Circular
Free
Free Multi-Step Funnel Infographic Slide Pack Template for PowerPoint & Google Slides
Funnel
Free
Liquidity Ratios Infographic Slide Template for PowerPoint & Google Slides
Finance
Free Nutrition Infographic Slide Template for PowerPoint & Google Slides
Health
Free
Free Goal Setting Target Infographic Slide Template for PowerPoint & Google Slides
Goals
Free
Editable Ireland Map Infographic Slide Template for PowerPoint & Google Slides
World Maps
Free
HIV AIDS Infographic Diagram Slide Deck Template for PowerPoint & Google Slides
Graphics
Free Online Shopping 3-Slide Infographic Template for PowerPoint & Google Slides
Digital Marketing
Free
Market Assessment Infographic Slide Template for PowerPoint & Google Slides
Process
Cost Driver Infographic Slide Pack Template for PowerPoint & Google Slides
Process
Community Building Infographic Slide Template for PowerPoint & Google Slides
Leadership
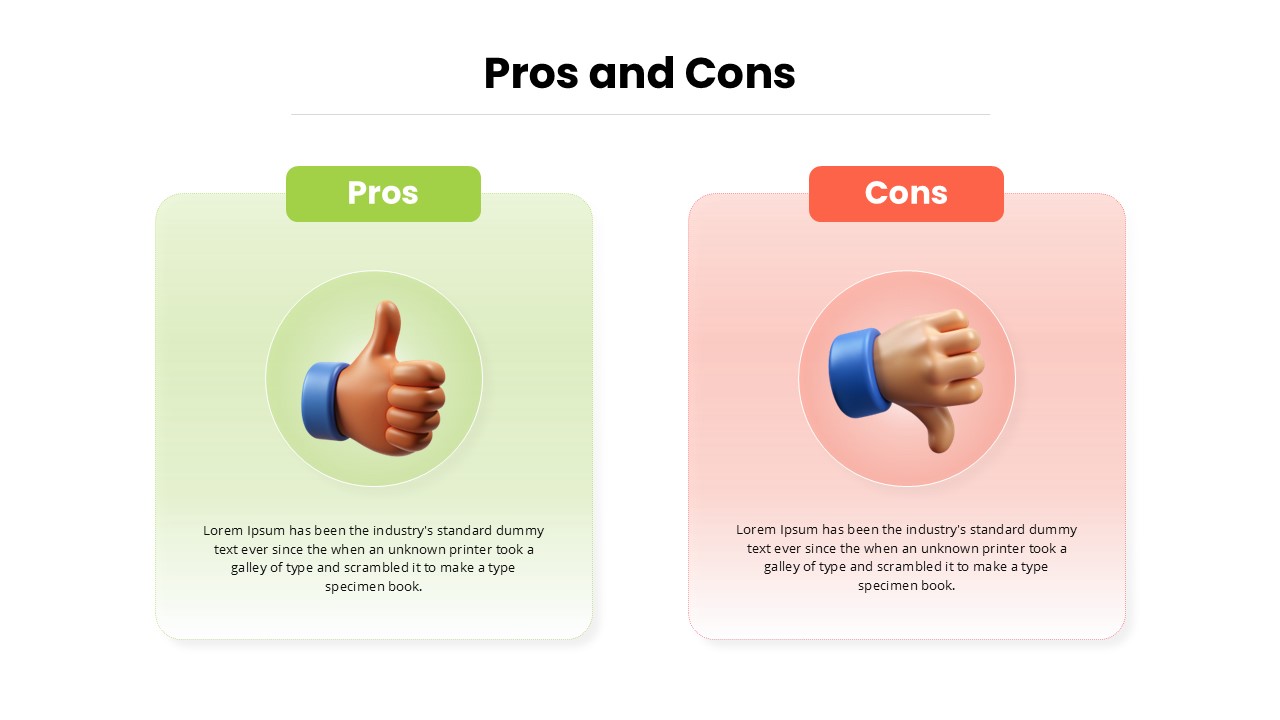
Pros and Cons Infographic Slide Pack Template for PowerPoint & Google Slides
Comparison
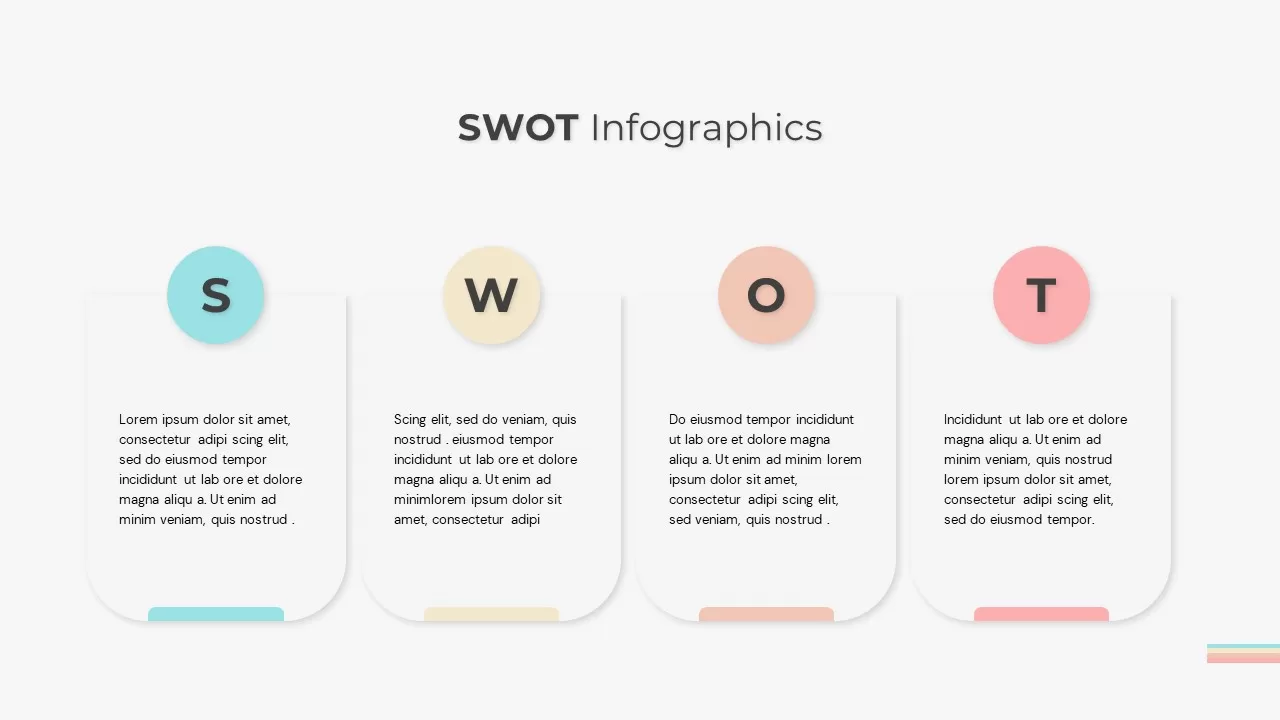
SWOT Analysis Infographic Slide for PowerPoint & Google Slides
SWOT
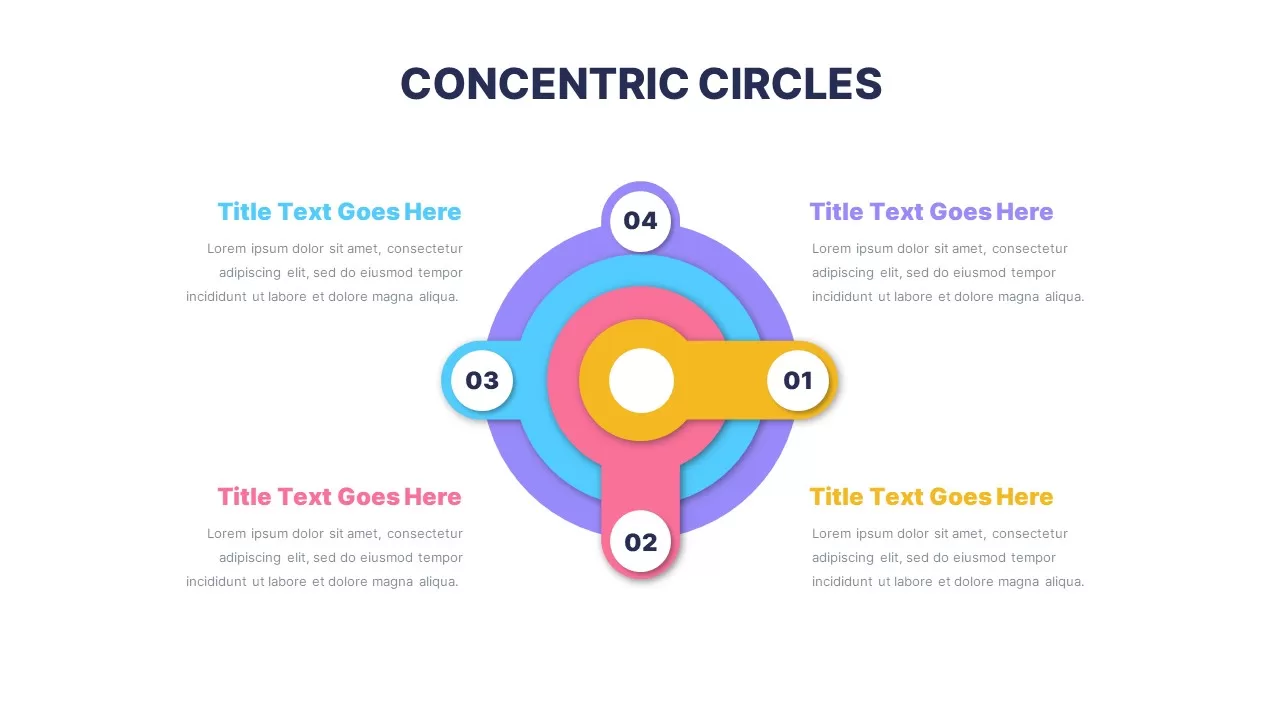
Colorful Concentric Circles Infographic Slide for PowerPoint & Google Slides
Process
Free Infographic Statistics Dashboard Slide for PowerPoint & Google Slides
Bar/Column
Free
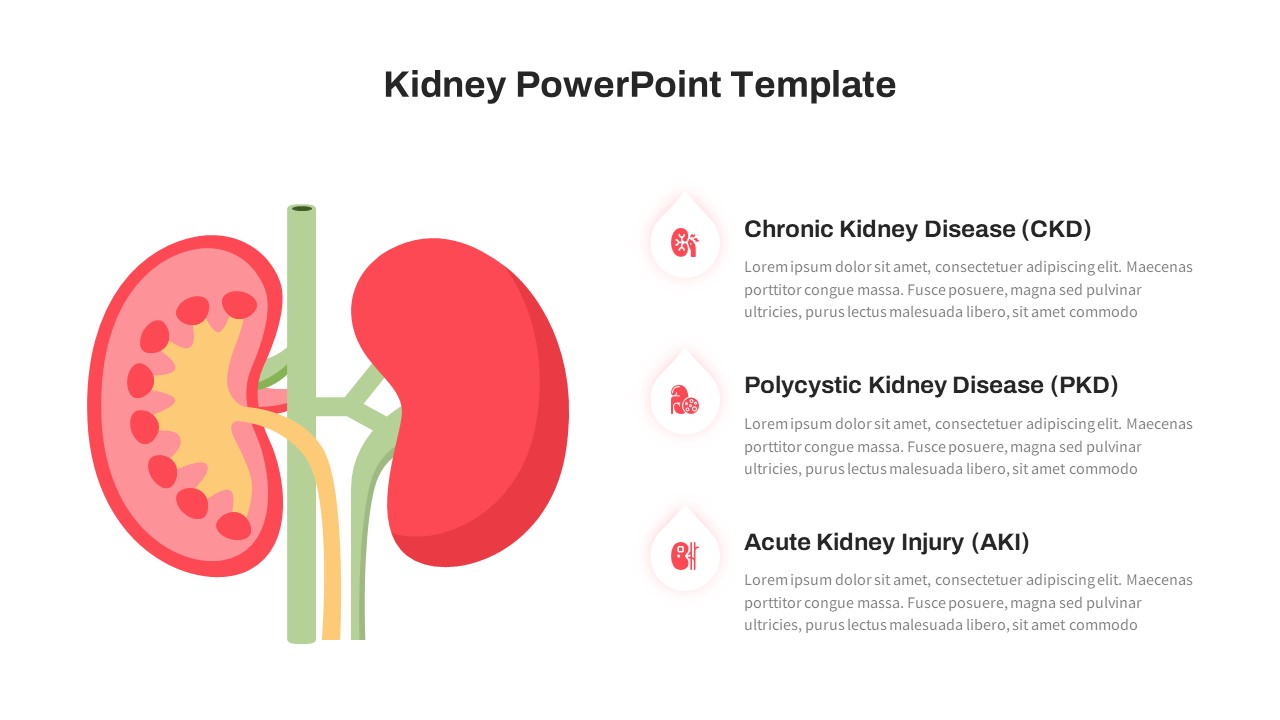
Kidney Disease Infographic Slide for PowerPoint & Google Slides
Health
Google Ads Optimization & Performance Infographic Template for PowerPoint & Google Slides
Digital Marketing
SQ3R Study Strategy Infographic Slides Template for PowerPoint & Google Slides
Business Strategy
Six Double Diamond Infographic Slides Template for PowerPoint & Google Slides
Process

Sales Process Infographic Slides Pack Template for PowerPoint & Google Slides
Process
Casino/Poker Chips Infographic Slides template for PowerPoint & Google Slides
Business Strategy
Agenda Infographic Pack of 2 Slides Template for PowerPoint & Google Slides
Agenda
Quad Chart Infographic Pack of 8 Slides Template for PowerPoint & Google Slides
Comparison Chart
Four Options Infographic Slides Template for PowerPoint & Google Slides
Comparison
Game Plan Infographic Slides Pack Template for PowerPoint & Google Slides
Infographics
Teamwork PowerPoint Infographic Template for PowerPoint & Google Slides
Leadership
Kite Infographic PowerPoint Template for PowerPoint & Google Slides
Process
Cladogram Infographic Di Template for PowerPoint & Google Slides Template
Decision Tree
Workflow PowerPoint Process infographic for PowerPoint & Google Slides
Process
Free Infographic Deck PowerPoint Pack for PowerPoint & Google Slides
Infographics
Free
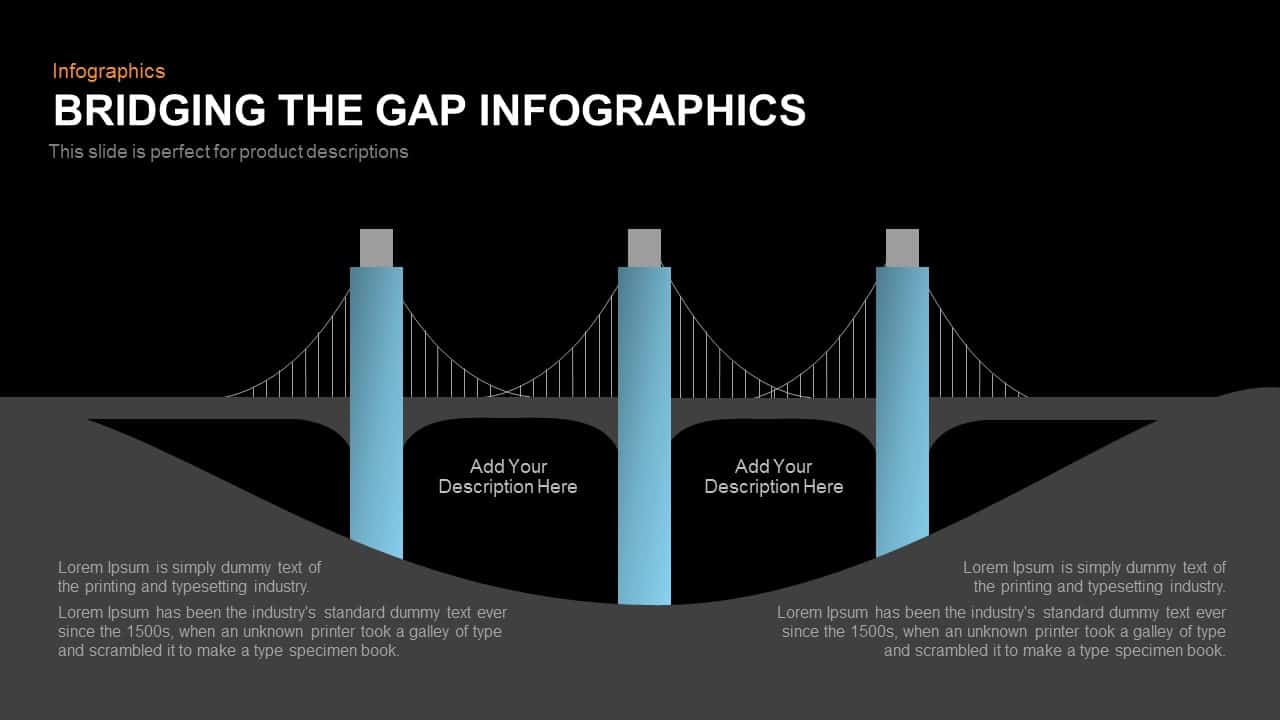
Bridging the Gap Infographic Process template for PowerPoint & Google Slides
Process
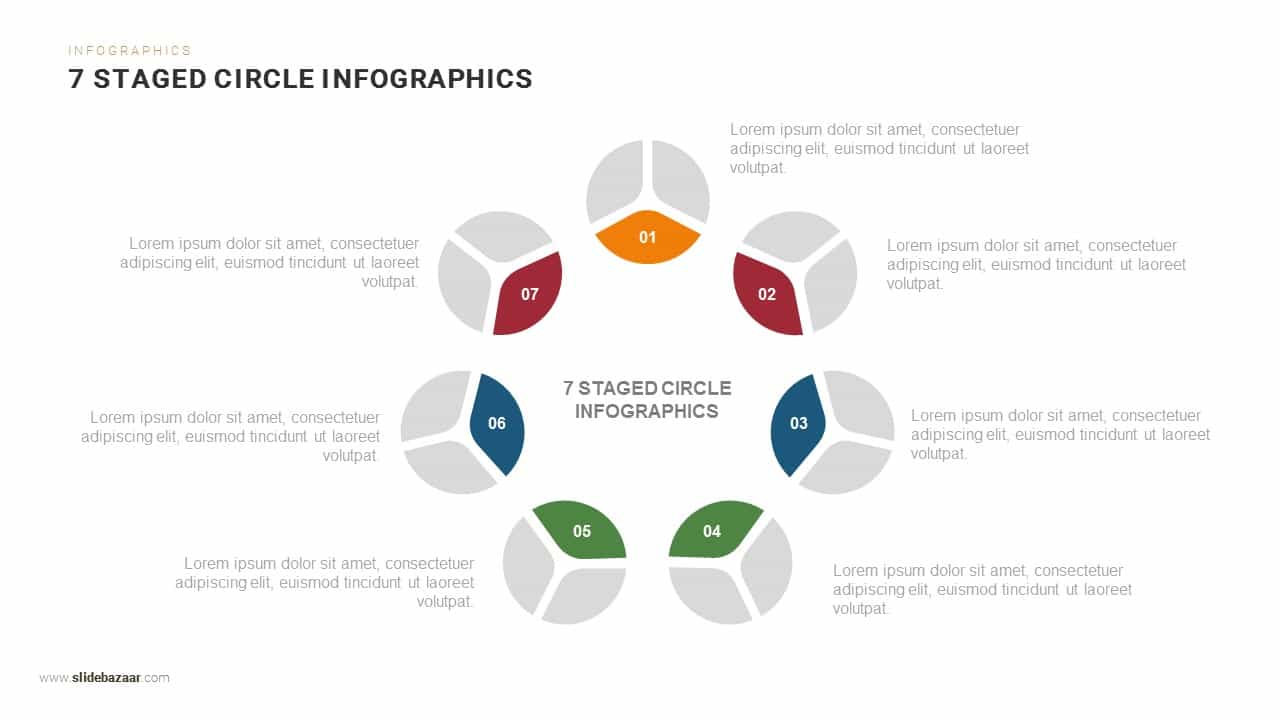
Seven-Stage Circular Infographic Template for PowerPoint & Google Slides
Circular

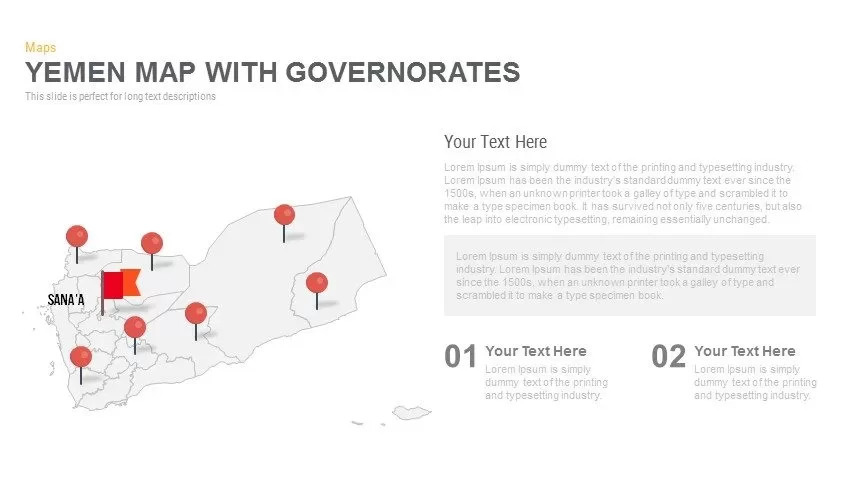
Yemen Governorates Infographic Map Template for PowerPoint & Google Slides
Maps
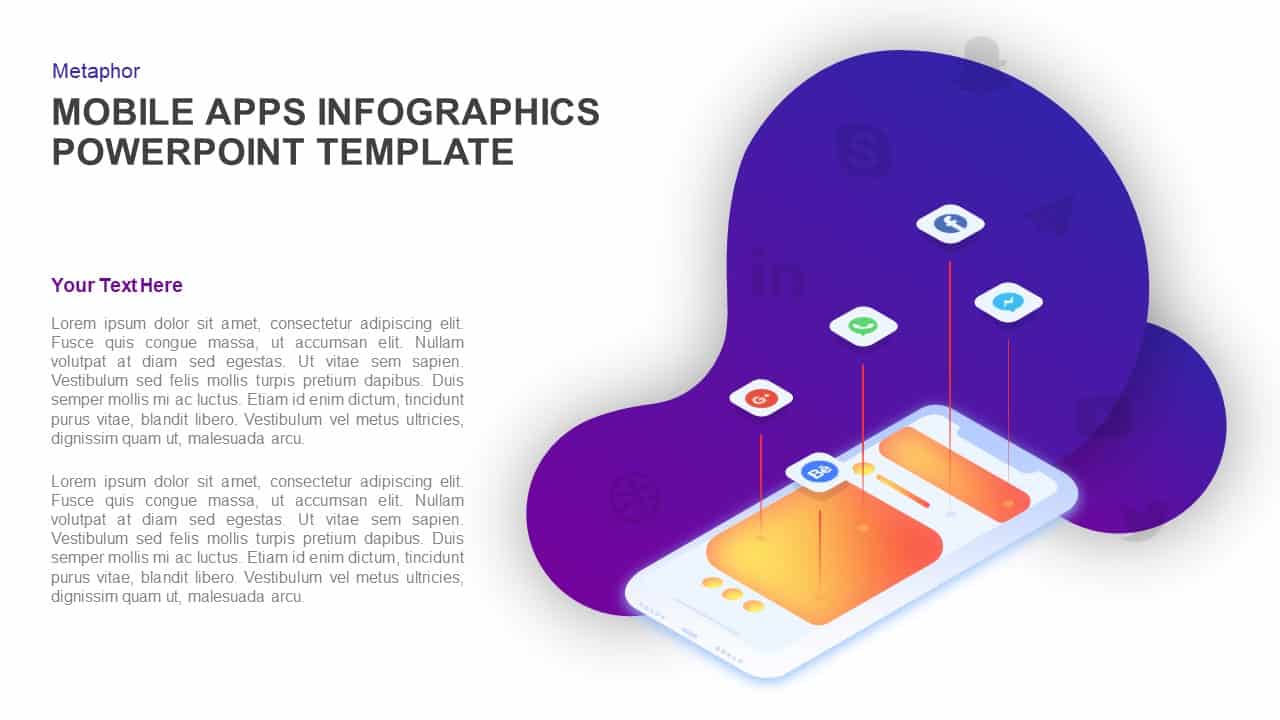
Mobile Apps Infographic Interface Template for PowerPoint & Google Slides
Software Development
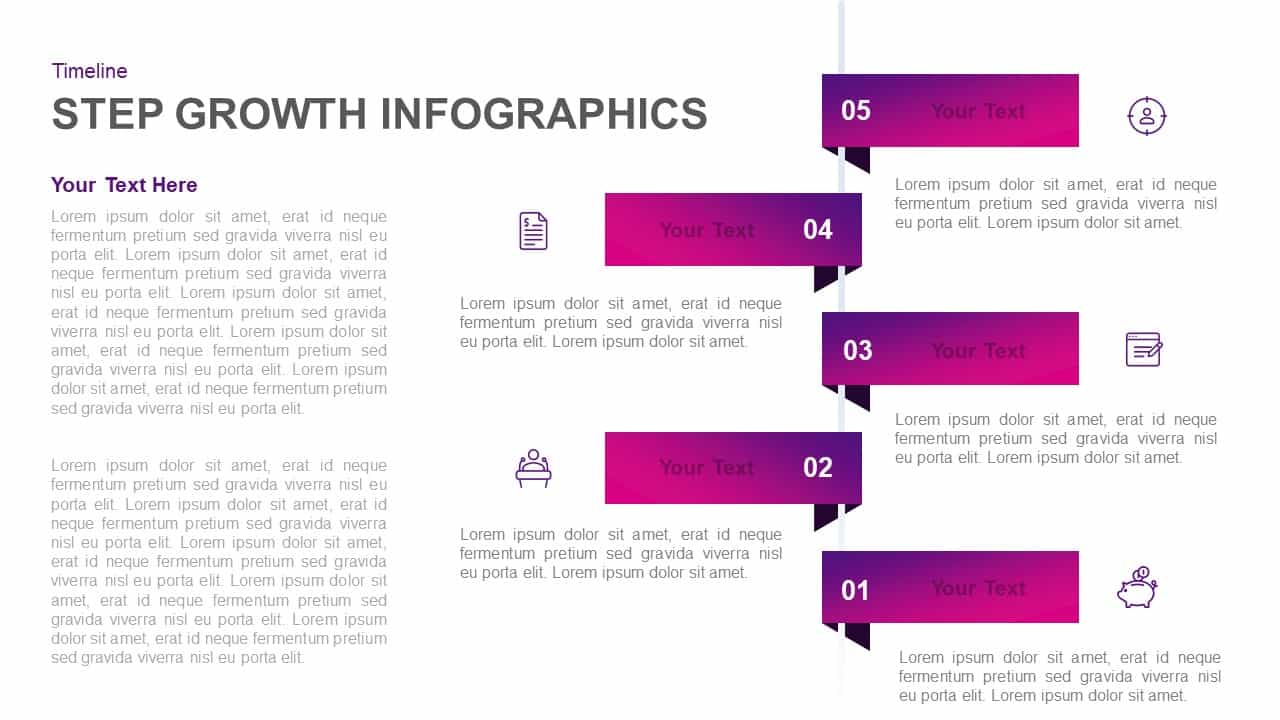
Five-Step Growth Timeline Infographic Template for PowerPoint & Google Slides
Timeline
Four-Stage Funnel Diagram Infographic Template for PowerPoint & Google Slides
Funnel
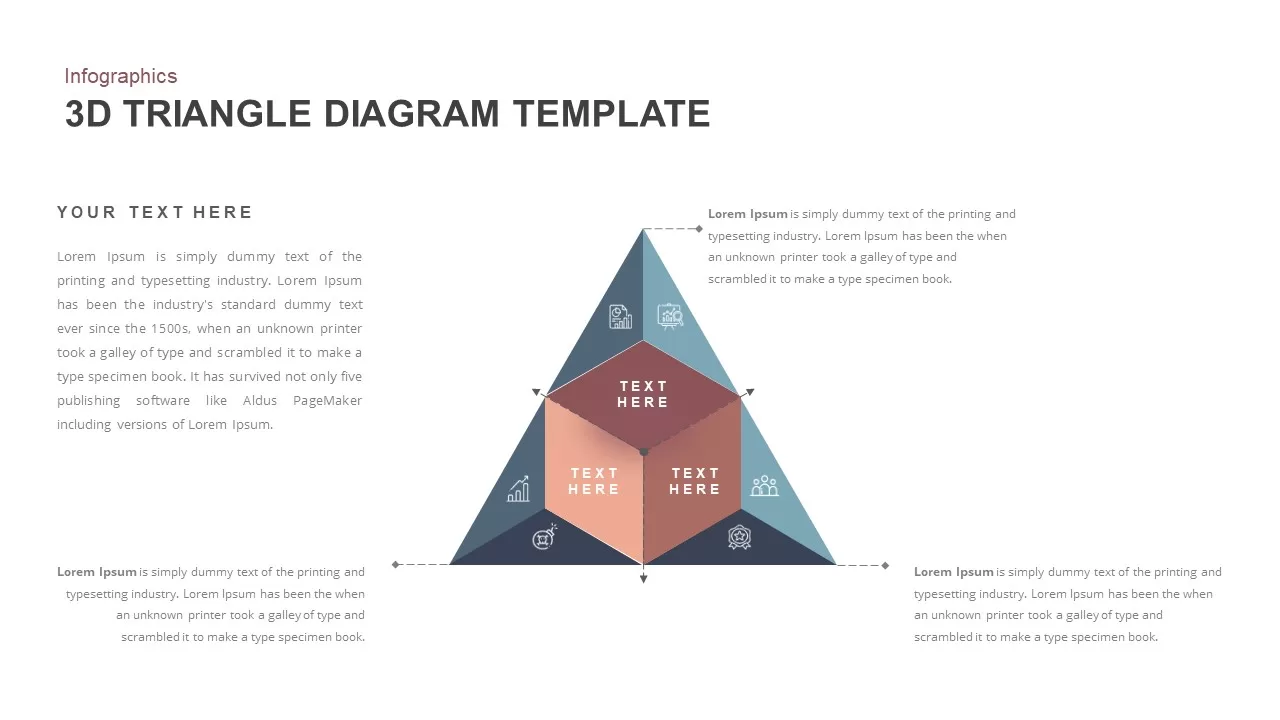
3D Triangle Diagram Infographic Template for PowerPoint & Google Slides
Pyramid
Upward Arrow infographic template for PowerPoint & Google Slides
Infographics
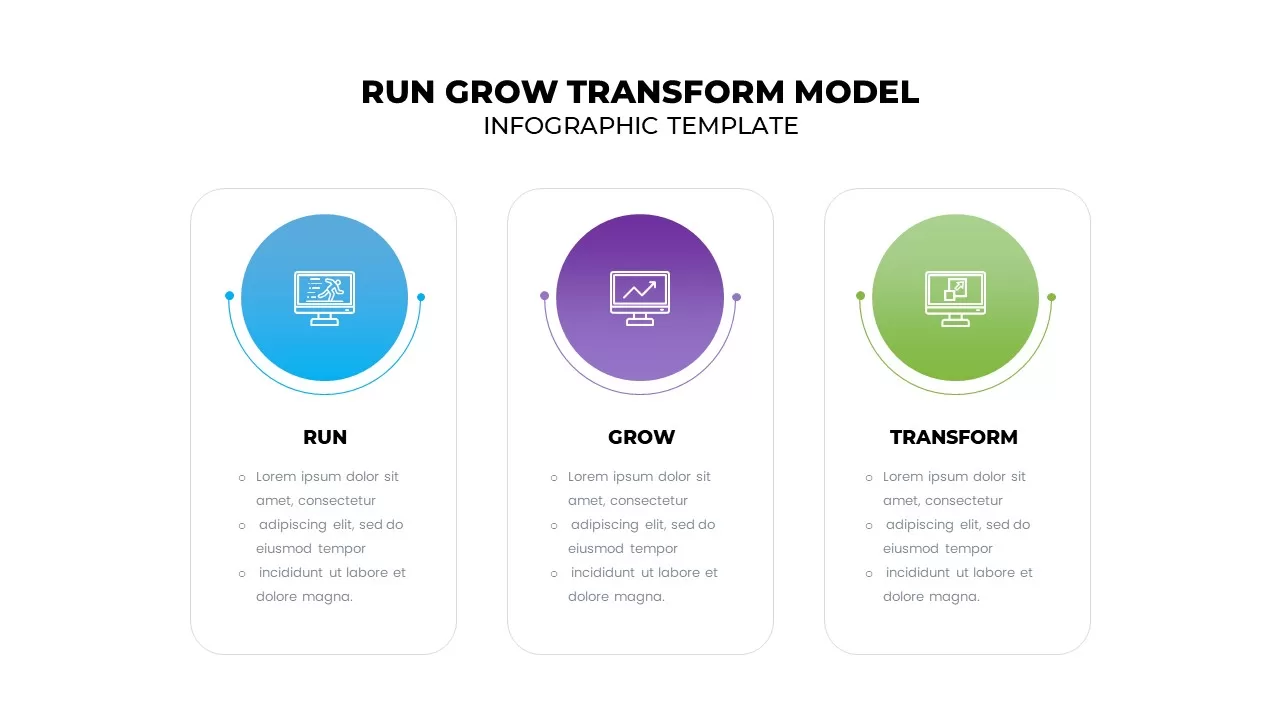
Run Grow Transform Model Infographic Template for PowerPoint & Google Slides
Business
Accomplishment Circular Infographic Template for PowerPoint & Google Slides
Accomplishment
Six-Part Hexagon Infographic Layout Template for PowerPoint & Google Slides
Infographics
Chain Link Process Infographic Diagram Template for PowerPoint & Google Slides
Process
4 Step Methodology Infographic Template for PowerPoint & Google Slides
Process
Dynamic Circular Hub-and-Spoke Infographic Template for PowerPoint & Google Slides
Circular
Quarterly Roadmap Timeline Infographic Template for PowerPoint & Google Slides
Timeline
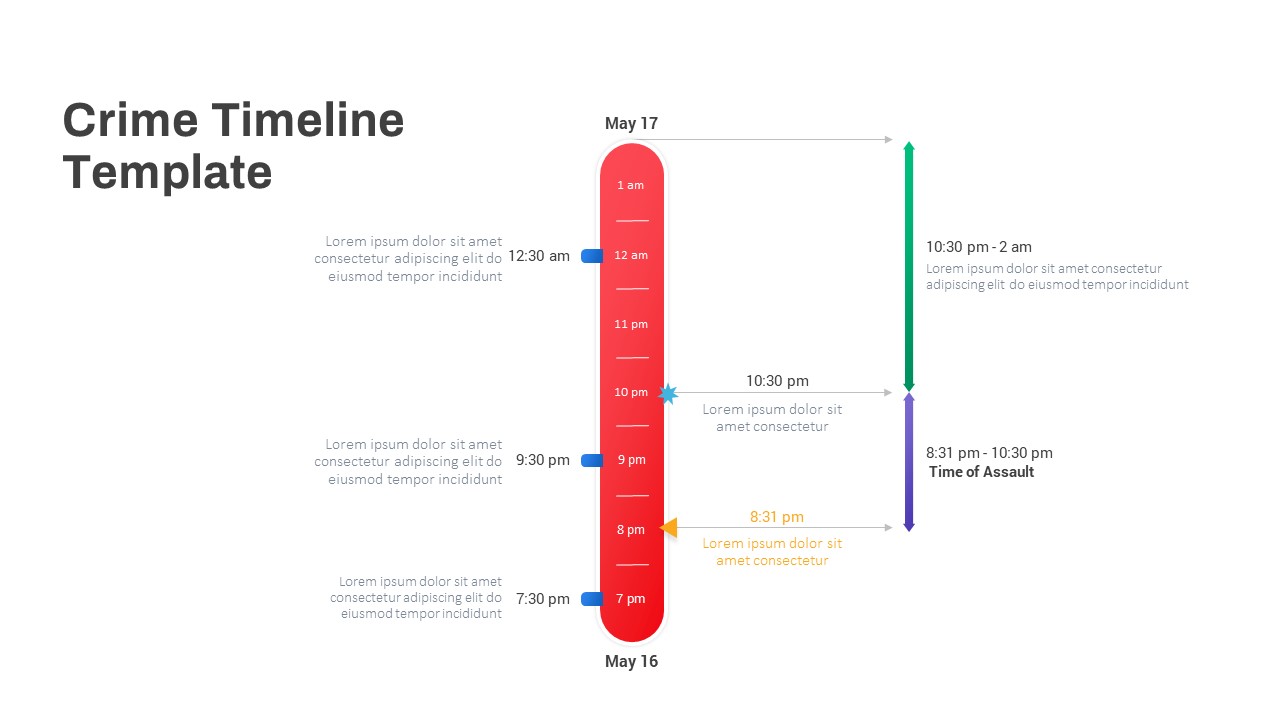
Vertical Crime Timeline Infographic Template for PowerPoint & Google Slides
Timeline
Types of AI Comparison Infographic Template for PowerPoint & Google Slides
AI
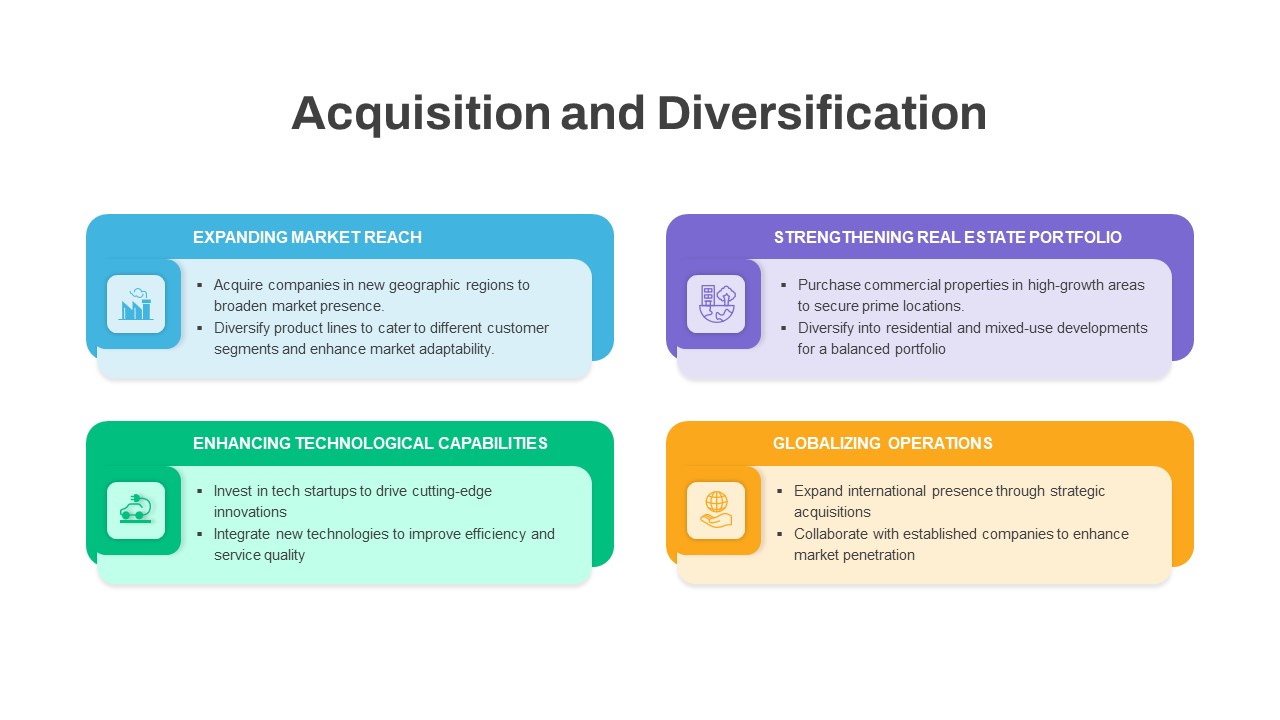
Acquisition & Diversification Infographic Template for PowerPoint & Google Slides
Business Plan
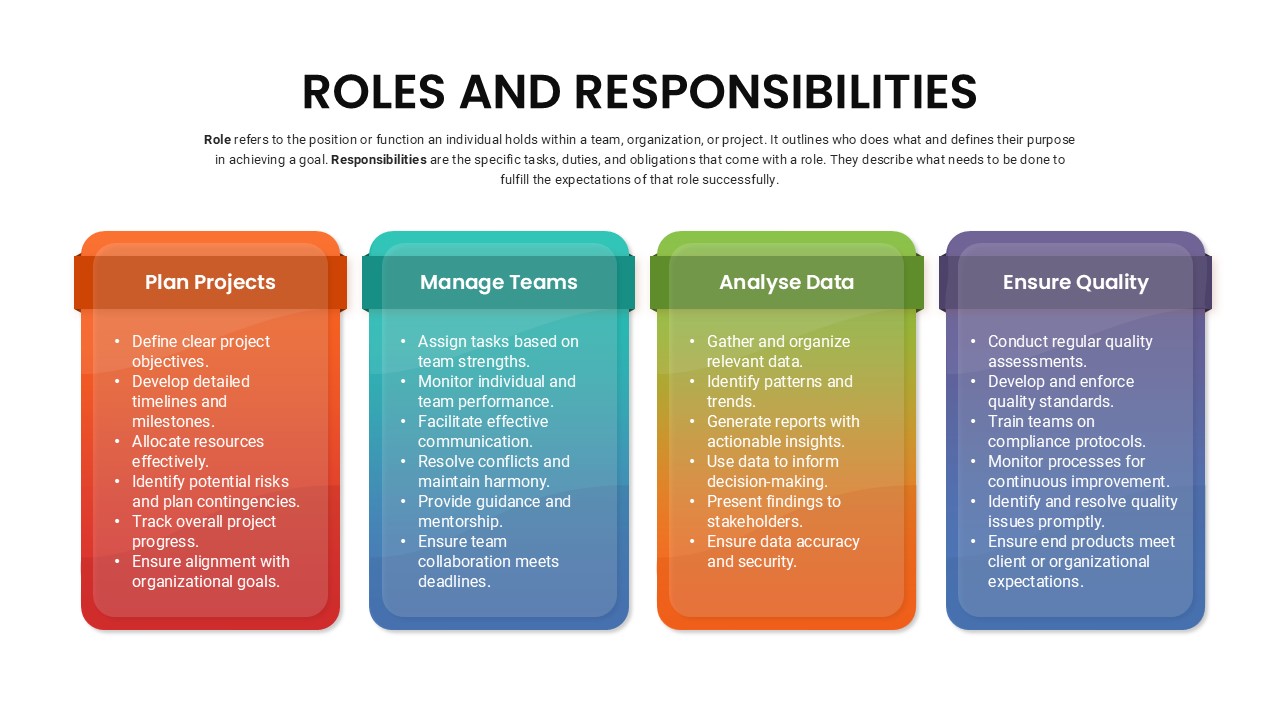
Roles and Responsibilities Infographic Template for PowerPoint & Google Slides
Our Team
Data-Driven AI in Insurance Infographic Template for PowerPoint & Google Slides
Circular
Multimodal AI Modalities Infographic Template for PowerPoint & Google Slides
AI
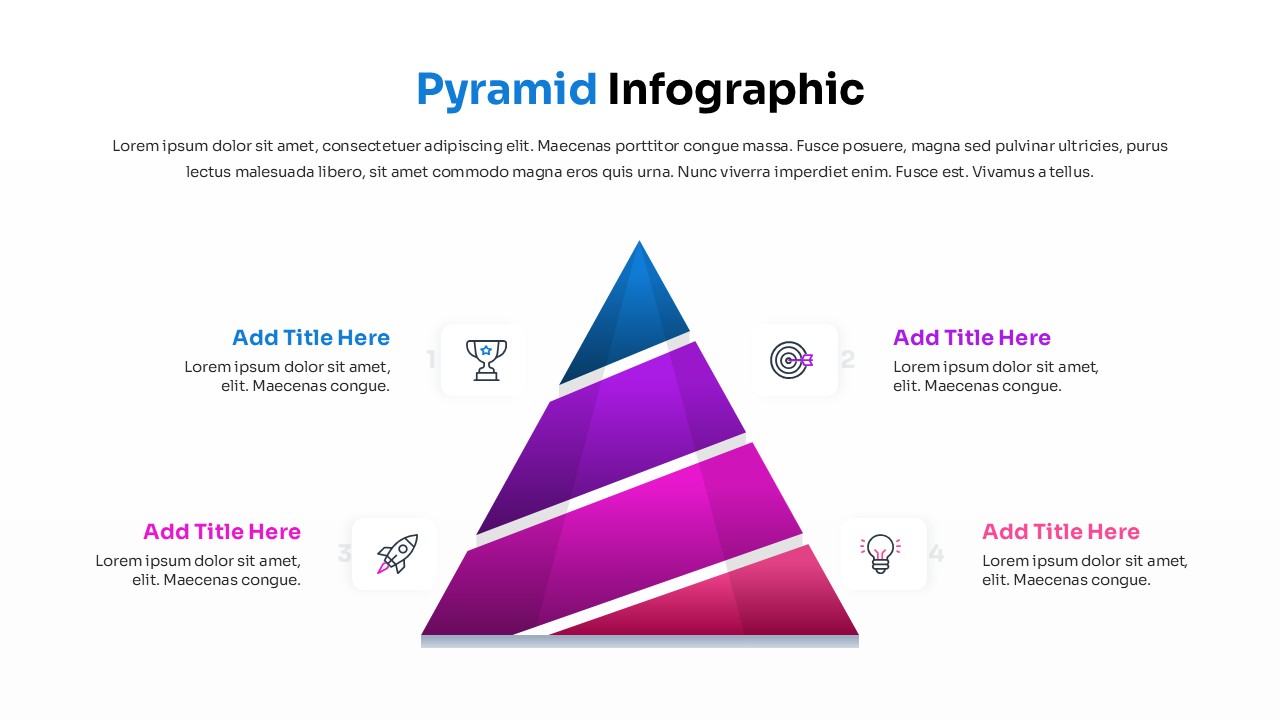
Four Level Pyramid Infographic Template for PowerPoint & Google Slides
Pyramid
Three Segment Donut Chart KPI Infographic Template for PowerPoint & Google Slides
Pie/Donut