Iceberg Infographic Diagram template for PowerPoint & Google Slides
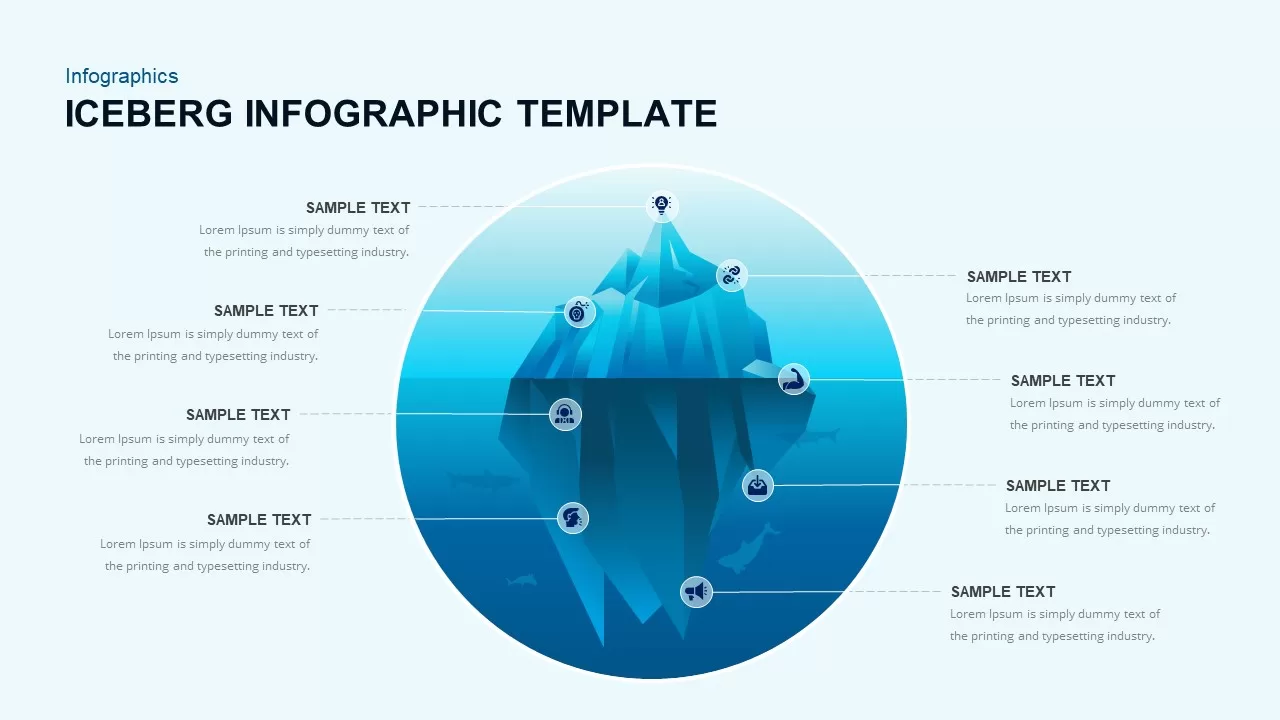


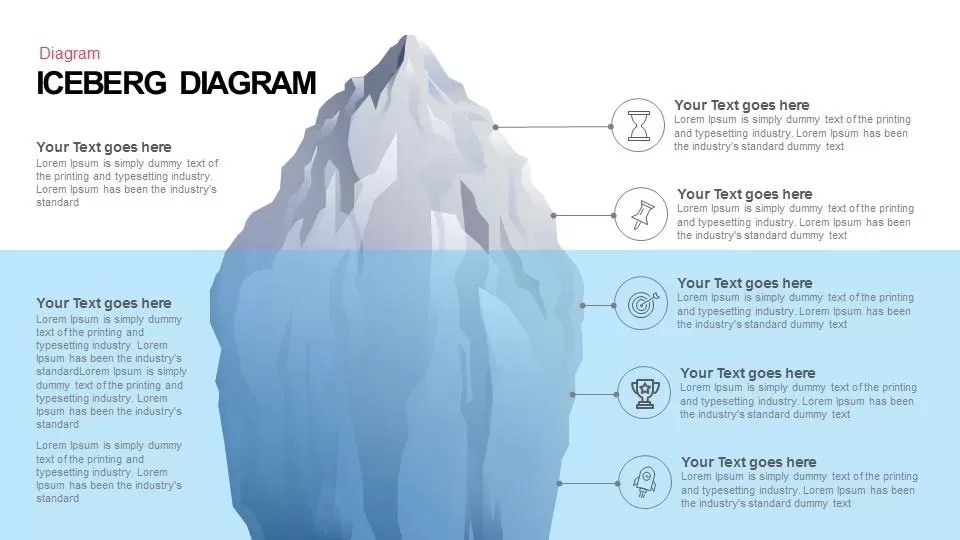
This Iceberg Infographic Diagram slide offers a creative way to visualize complex data, highlighting both visible and hidden elements of a process or concept. The unique iceberg design is divided into layers, with each level representing different facets of an issue, concept, or process. The visually appealing blue gradient colors create a calm yet professional tone, making this slide ideal for explaining ideas like problem analysis, risk management, or multi-layered systems.
Each layer can be easily customized with text and icons, making it adaptable for various contexts. You can use this infographic to illustrate the difference between surface-level information and deeper, underlying factors, perfect for corporate, educational, or project-based presentations. The icons at each level add clarity and help to visually differentiate each stage of the iceberg, enhancing comprehension.
This slide is optimized for presentations that require a balance of detail and simplicity. Whether discussing strategic plans, analyzing challenges, or presenting research findings, the iceberg infographic offers a clear and engaging way to break down complex topics into digestible segments.
Who is it for
Business professionals, analysts, and educators can use this infographic to break down complex ideas or processes. Project managers, risk analysts, and strategic planners can leverage it to show layered processes, hidden risks, or critical insights that go beyond the surface level.
Other Uses
Beyond business and strategy, this slide can be adapted for use in scientific presentations, psychological analyses, or educational sessions where the hidden aspects of a concept need to be illustrated. It is also suitable for explaining anything with visible and hidden components, like technology, market trends, or organizational structures.
Login to download this file

Item ID
SB02081
Related Templates

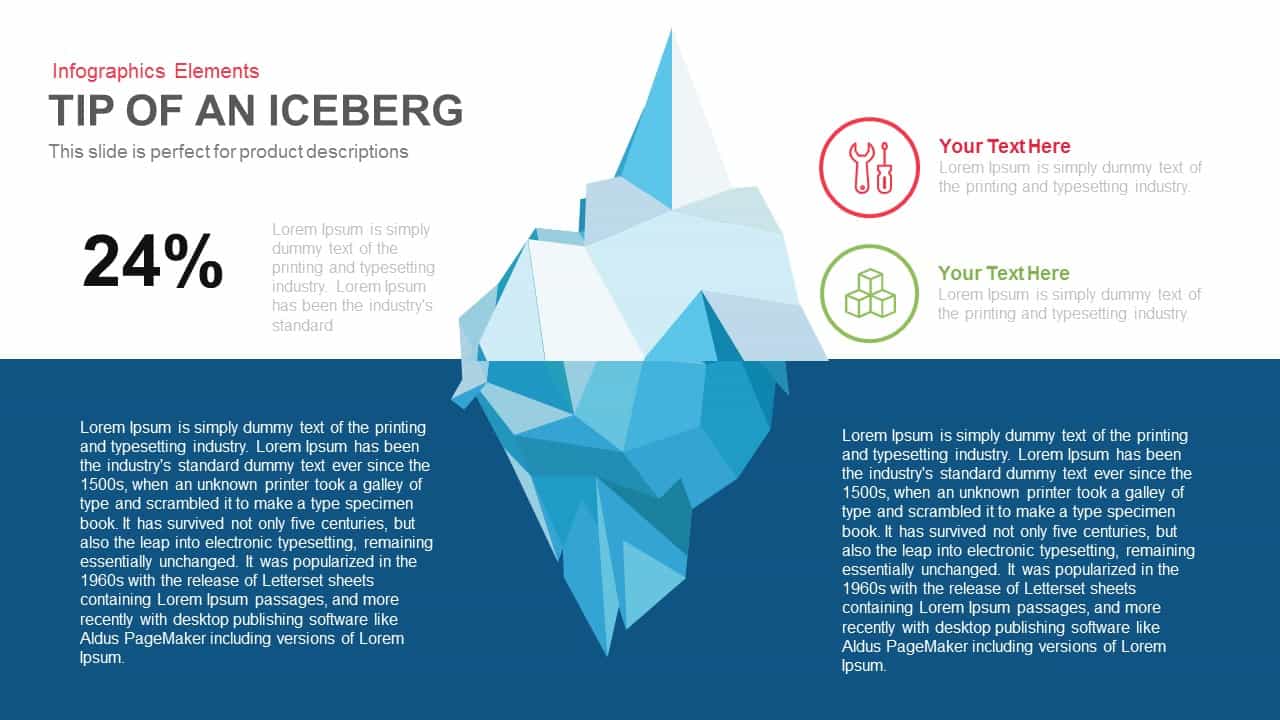
Tip of an Iceberg Infographic Diagram template for PowerPoint & Google Slides
Iceberg Charts
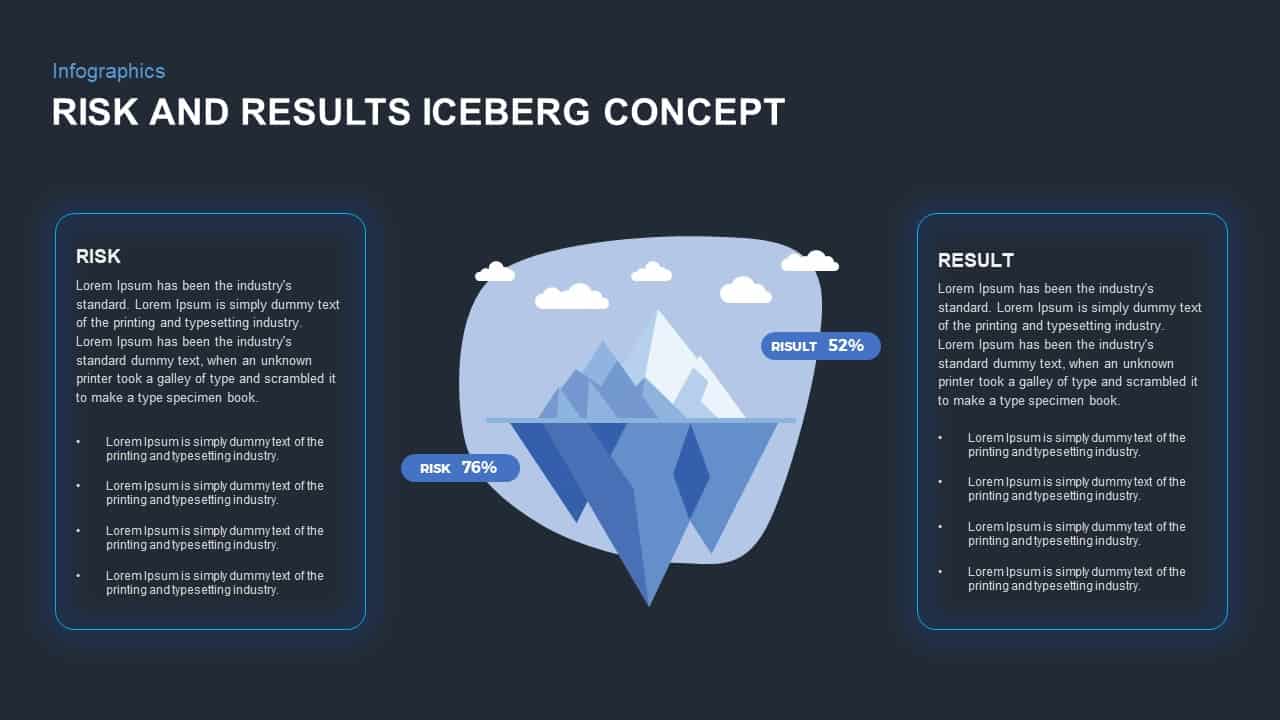
Risk and Results Iceberg Infographic Template for PowerPoint & Google Slides
Comparison
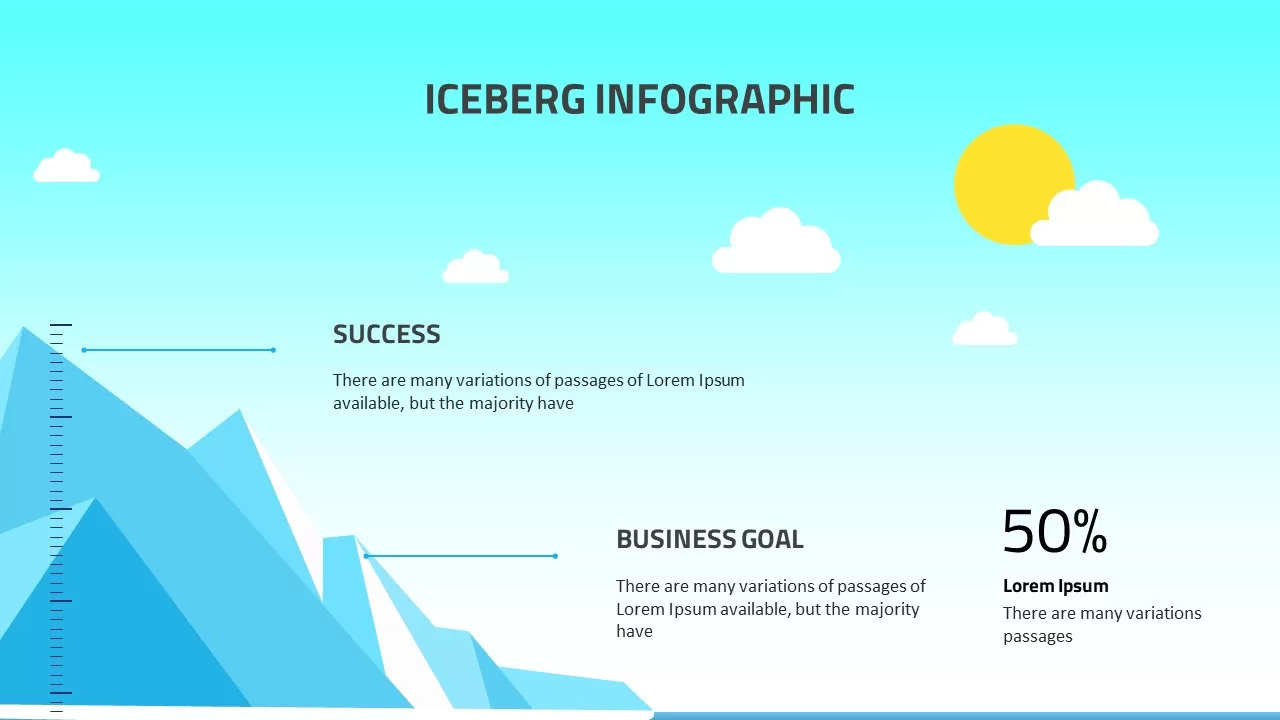
Iceberg Infographic for PowerPoint & Google Slides
Iceberg Charts

Iceberg Diagram for PowerPoint & Google Slides
Iceberg Charts
Multilayer Core Infographic Diagram Template for PowerPoint & Google Slides
Circular
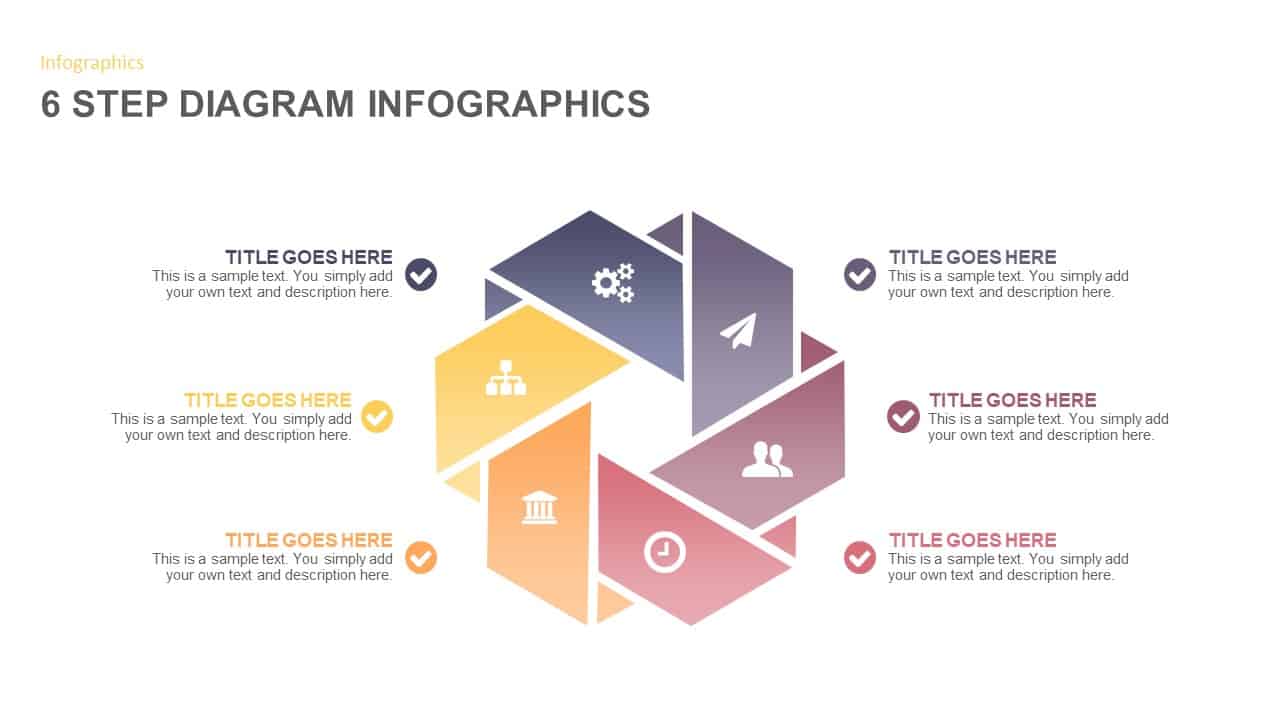
6 Stage Process Diagram Infographic Template for PowerPoint & Google Slides
Process
7-Level 3D Pyramid Infographic Diagram Template for PowerPoint & Google Slides
Pyramid
Hexagonal Shapes Infographic Diagram Template for PowerPoint & Google Slides
Process
Five Up Arrow Infographic Diagram Template for PowerPoint & Google Slides
Arrow
Creative Layered Oval Infographic Diagram Template for PowerPoint & Google Slides
Process
Six Section Circular Infographic Diagram Template for PowerPoint & Google Slides
Circular
Section Diagram Elements Infographic Template for PowerPoint & Google Slides
Process

Cause and Effect Diagram Infographic Template for PowerPoint & Google Slides
Bar/Column
Eight Segment Star Diagram Infographic Template for PowerPoint & Google Slides
Process
Four-Stage Linear Infographic Diagram Template for PowerPoint & Google Slides
Process
Three-Circle Diagram Infographic Template for PowerPoint & Google Slides
Circular
Five Stage Process Diagram Infographic Template for PowerPoint & Google Slides
Process
Segmented Pyramid Diagram Infographic Template for PowerPoint & Google Slides
Pyramid
Cylinder Infographic Diagram template for PowerPoint & Google Slides
Process
Four-Section Arrow Infographic Diagram Template for PowerPoint & Google Slides
Arrow
Six-Section Star Infographic Diagram Template for PowerPoint & Google Slides
Circular
Eight-Step Circular Diagram Infographic Template for PowerPoint & Google Slides
Circular
6-Stage Funnel Diagram Infographic Template for PowerPoint & Google Slides
Funnel
Cluster Analysis Infographic Diagram Template for PowerPoint & Google Slides
Business
3D Conversion Funnel Diagram Infographic Template for PowerPoint & Google Slides
Funnel
Social Network Infographic Diagram Template for PowerPoint & Google Slides
Digital Marketing
Creative Tree Infographic Diagram Template for PowerPoint & Google Slides
Infographics
Five-Stage Circular Infographic Diagram Template for PowerPoint & Google Slides
Process
Four-Stage Circular Diagram Infographic Template for PowerPoint & Google Slides
Circular
Business Services Infographic Diagram Template for PowerPoint & Google Slides
Infographics
4 Factors Circular Diagram Infographic Template for PowerPoint & Google Slides
Circular
Circular CRM Process Diagram Infographic Template for PowerPoint & Google Slides
Circular
5 Key Points Infographic Diagram Template for PowerPoint & Google Slides
Process
Circular Three-Step Infographic Diagram Template for PowerPoint & Google Slides
Circular
Six-Stage Star Diagram Infographic Template for PowerPoint & Google Slides
Process
Four-Stage Funnel Diagram Infographic Template for PowerPoint & Google Slides
Funnel
3D Block Arrow Infographic Diagram Template for PowerPoint & Google Slides
Arrow
6-Step Circular Diagram Infographic Template for PowerPoint & Google Slides
Circular
8-Step Circular Gear Infographic Diagram Template for PowerPoint & Google Slides
Circular
Creative Tree Diagram Infographic Template for PowerPoint & Google Slides
Decision Tree
Six Sigma 6S Process Infographic Diagram Template for PowerPoint & Google Slides
Process
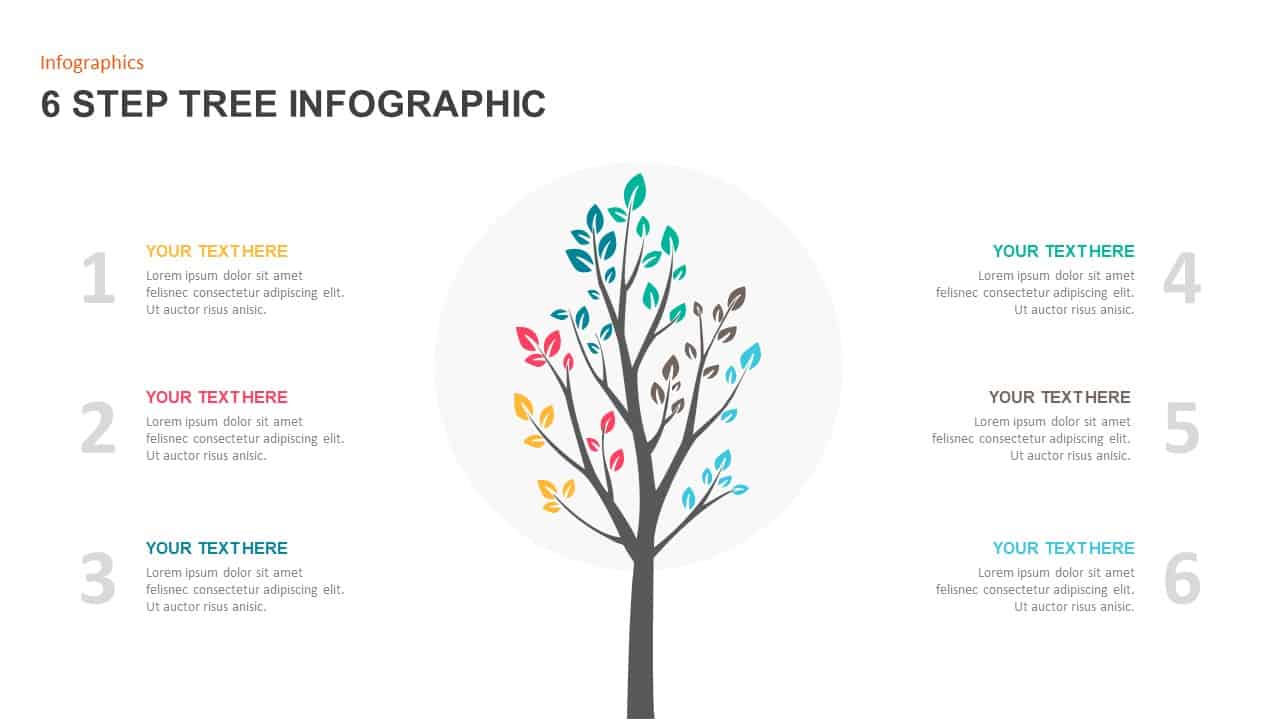
Six-Step Tree Diagram Infographic Template for PowerPoint & Google Slides
Infographics
Six-Circle Process Infographic Diagram Template for PowerPoint & Google Slides
Circular
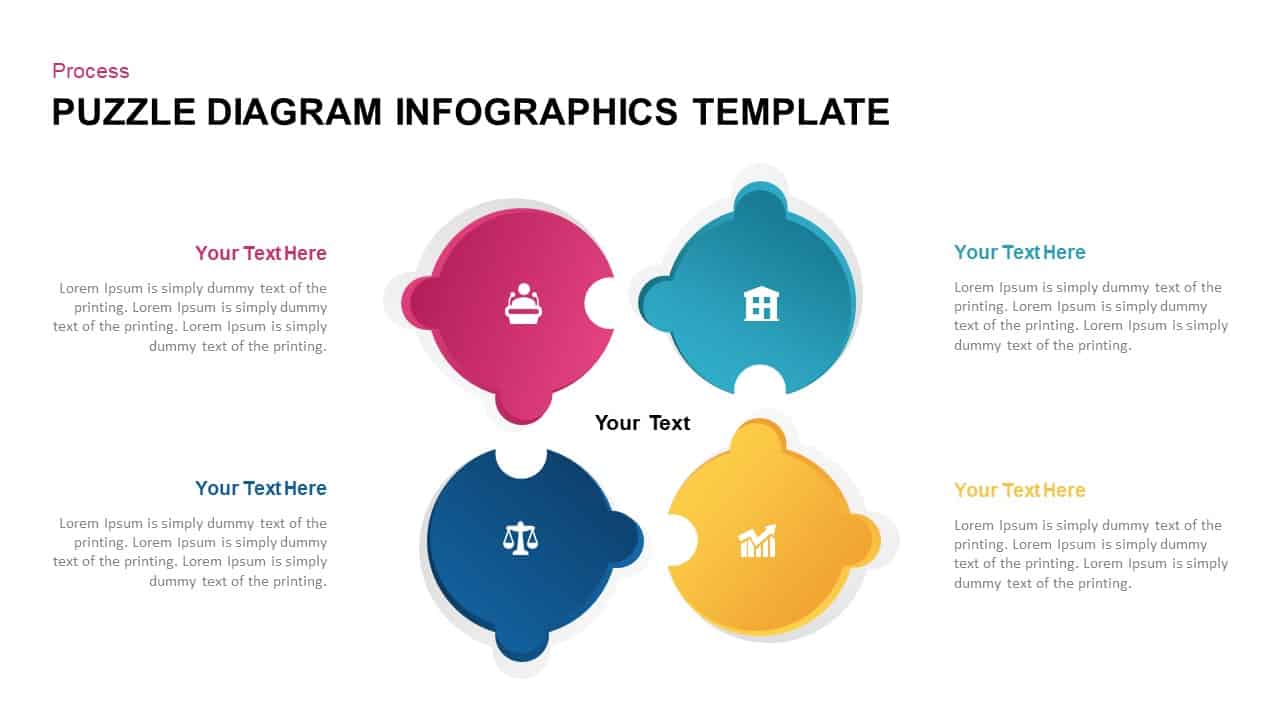
Four-Step Puzzle Diagram Infographic Template for PowerPoint & Google Slides
Process
Four-Stage Funnel Diagram Infographic Template for PowerPoint & Google Slides
Funnel
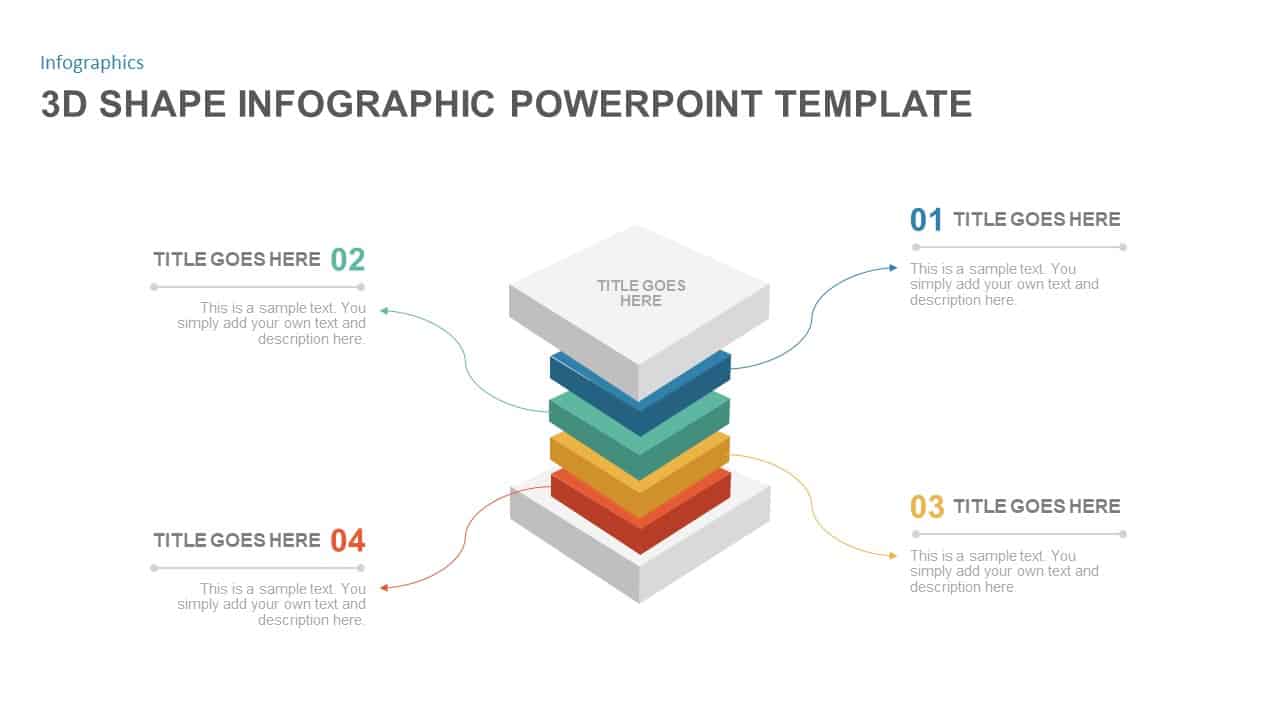
3D Layered Infographic Diagram Template for PowerPoint & Google Slides
Infographics
Modern Gear Venn Diagram Infographic Template for PowerPoint & Google Slides
Comparison
6-Part Circular Gear Infographic Diagram Template for PowerPoint & Google Slides
Process

Four Section Infographic Diagram Template for PowerPoint & Google Slides
Circular
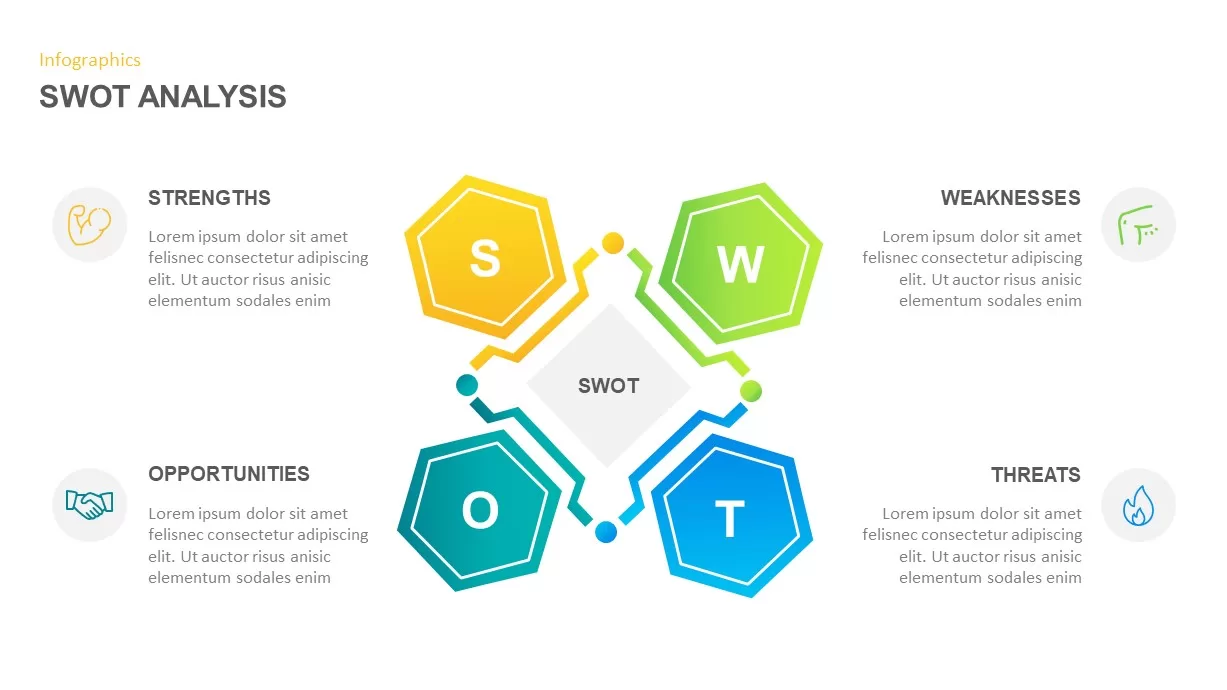
SWOT Analysis Infographic Diagram Template for PowerPoint & Google Slides
SWOT
Circular CRM Process Infographic Diagram Template for PowerPoint & Google Slides
Circular
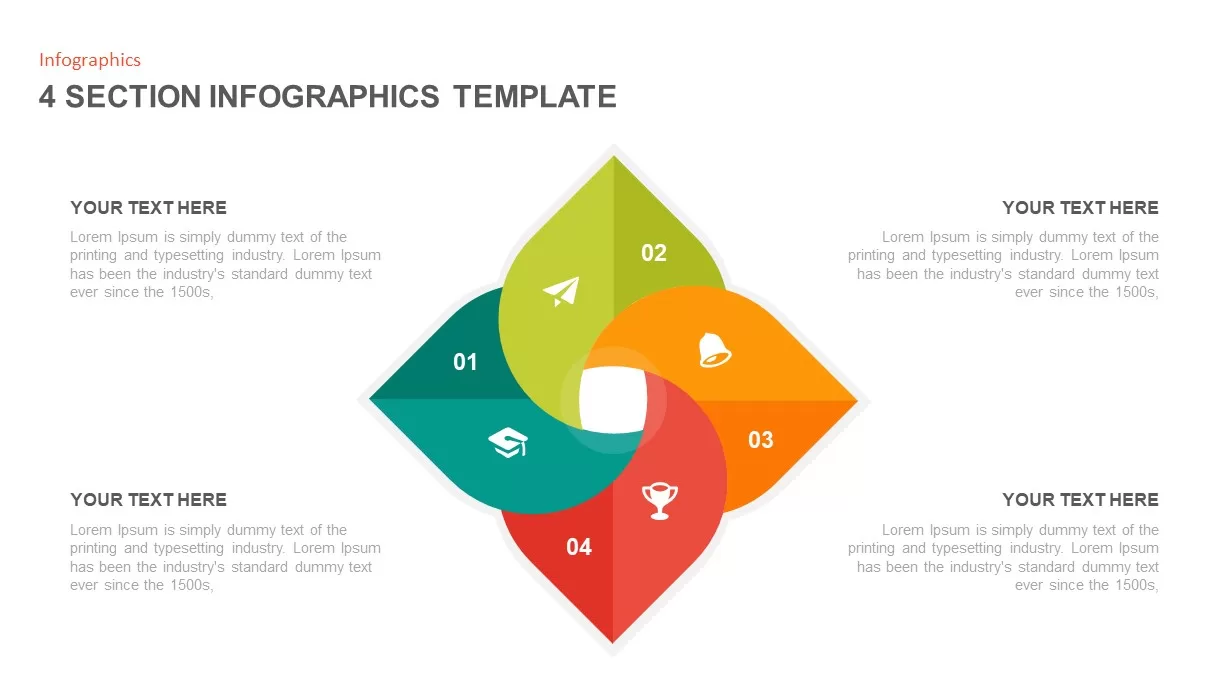
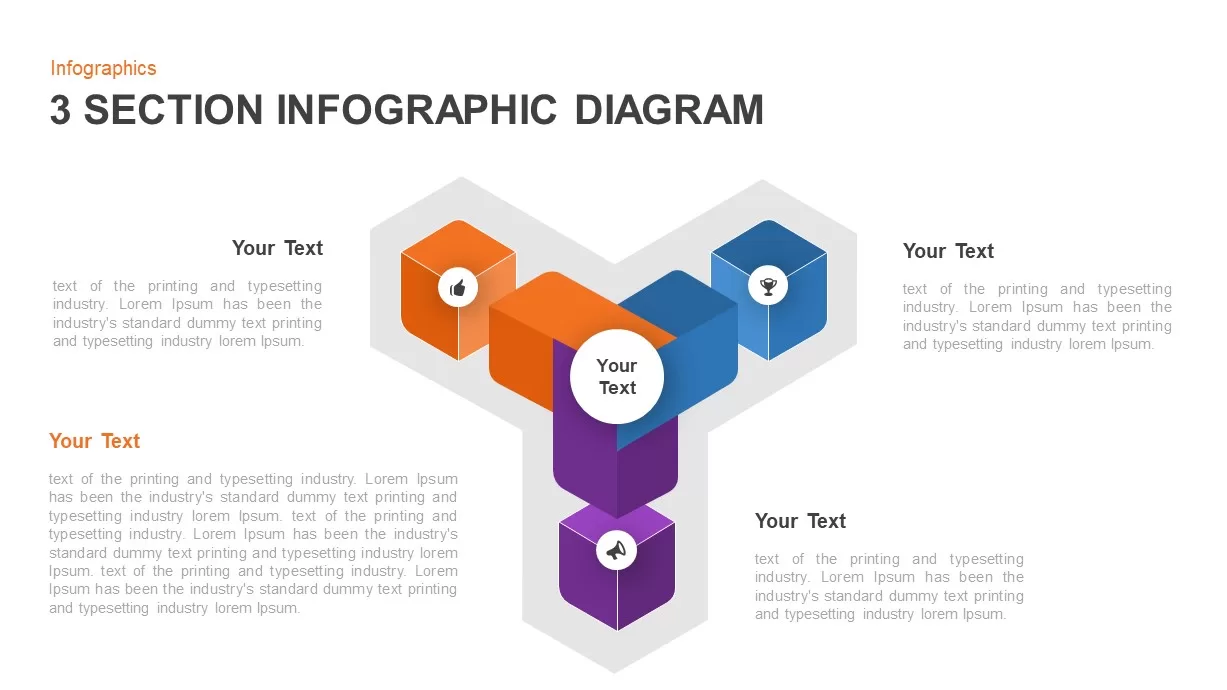
3 Section Infographic Diagram Template for PowerPoint & Google Slides
Process
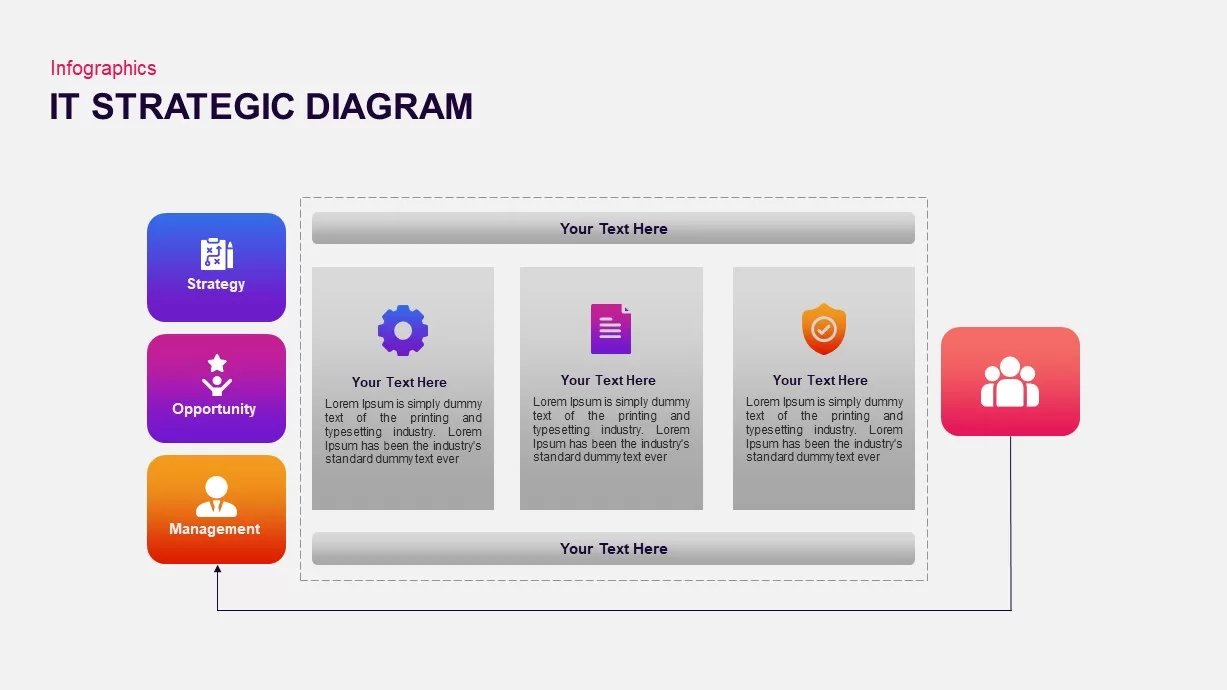
IT Strategic Diagram Infographic Pack Template for PowerPoint & Google Slides
Business Strategy
4-Step Circular Infographic Diagram Template for PowerPoint & Google Slides
Circular
Three-Step Result Diagram Infographic Template for PowerPoint & Google Slides
Process
Eight-Node Mind Map Infographic Diagram Template for PowerPoint & Google Slides
Mind Maps
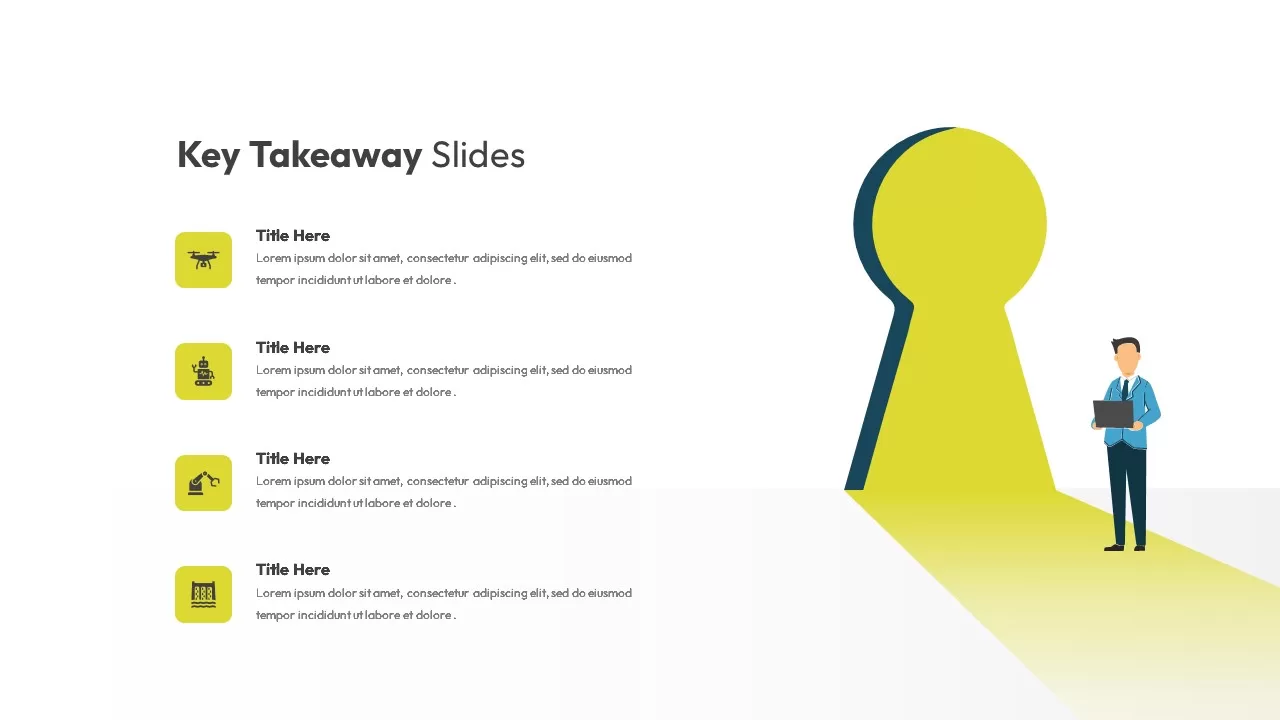
Keyhole Infographic Process Diagram Template for PowerPoint & Google Slides
Process
Four-Option Cross Infographic Diagram Template for PowerPoint & Google Slides
Comparison
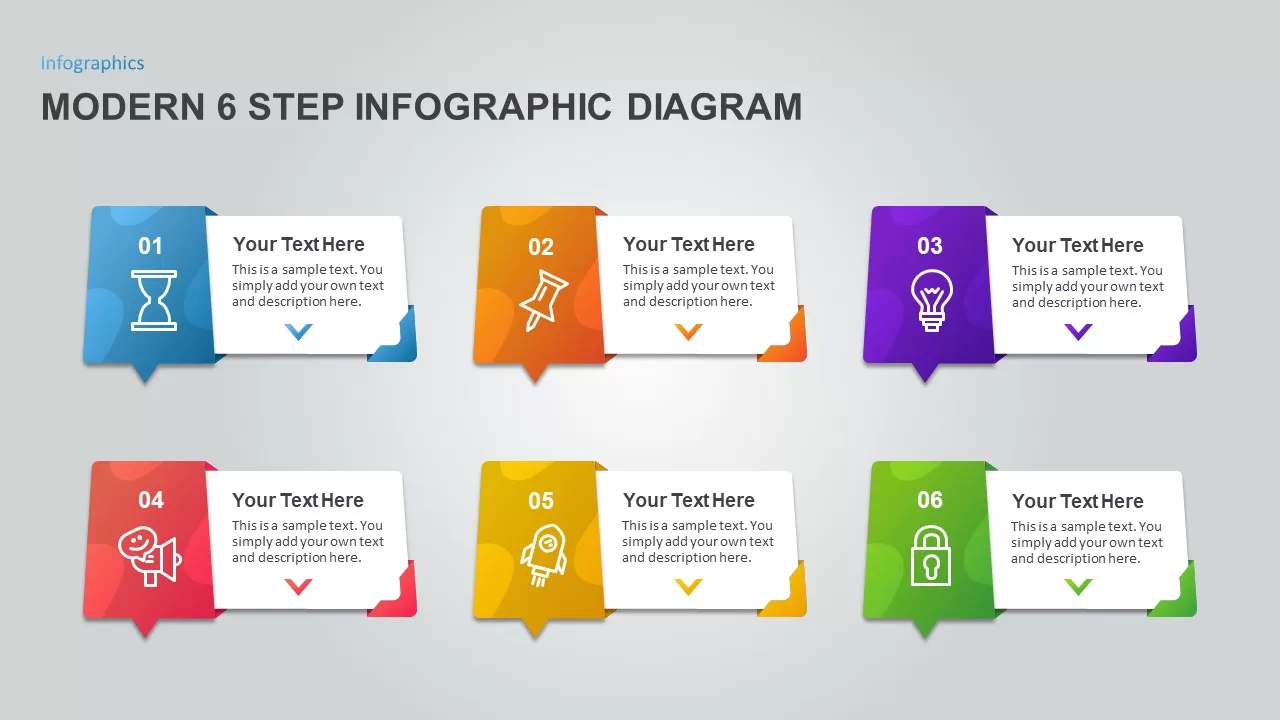
Modern 6 Step Infographic Diagram template for PowerPoint & Google Slides
Process
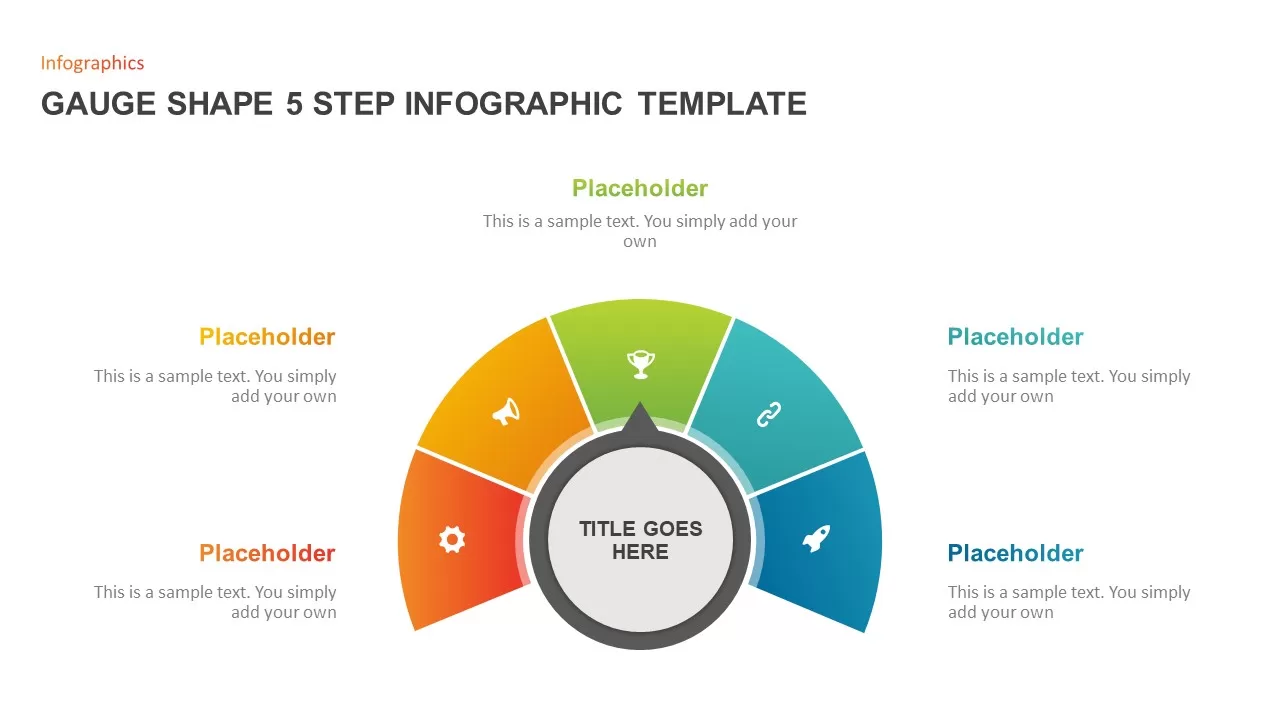
Gauge Shape 5-Step Infographic Diagram Template for PowerPoint & Google Slides
Process
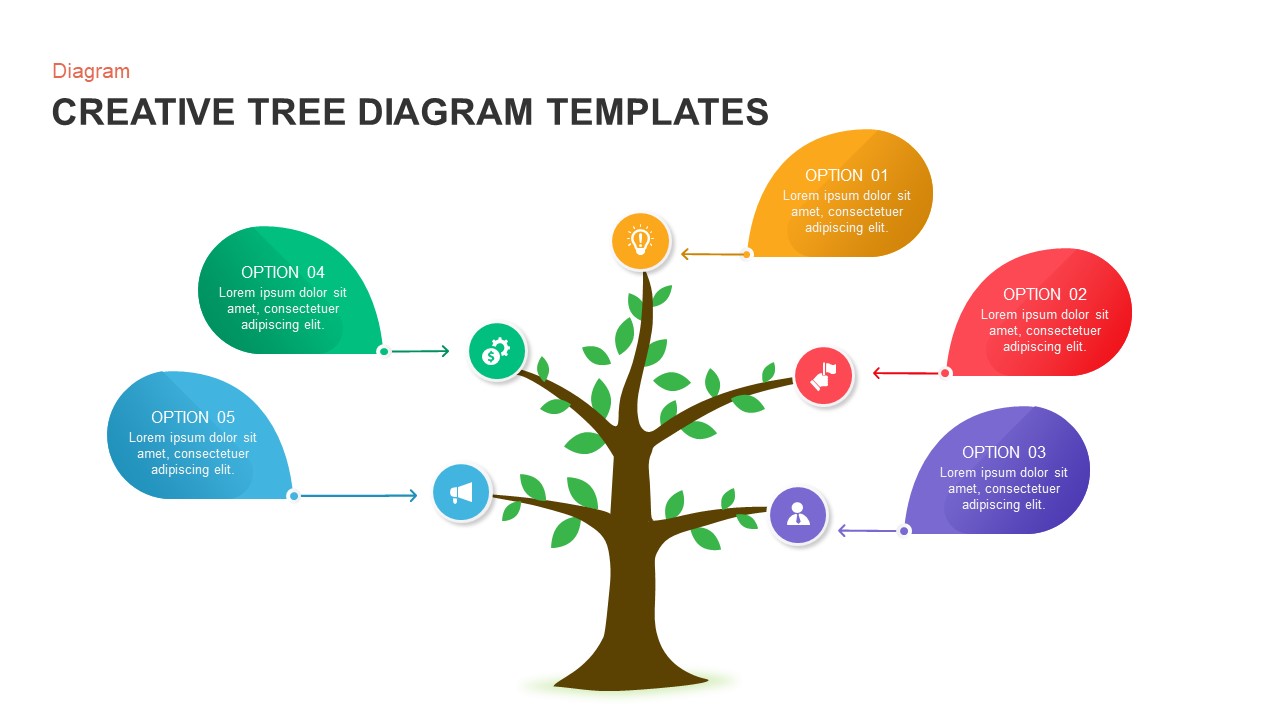
Creative Tree Diagram Infographic Template for PowerPoint & Google Slides
Decision Tree
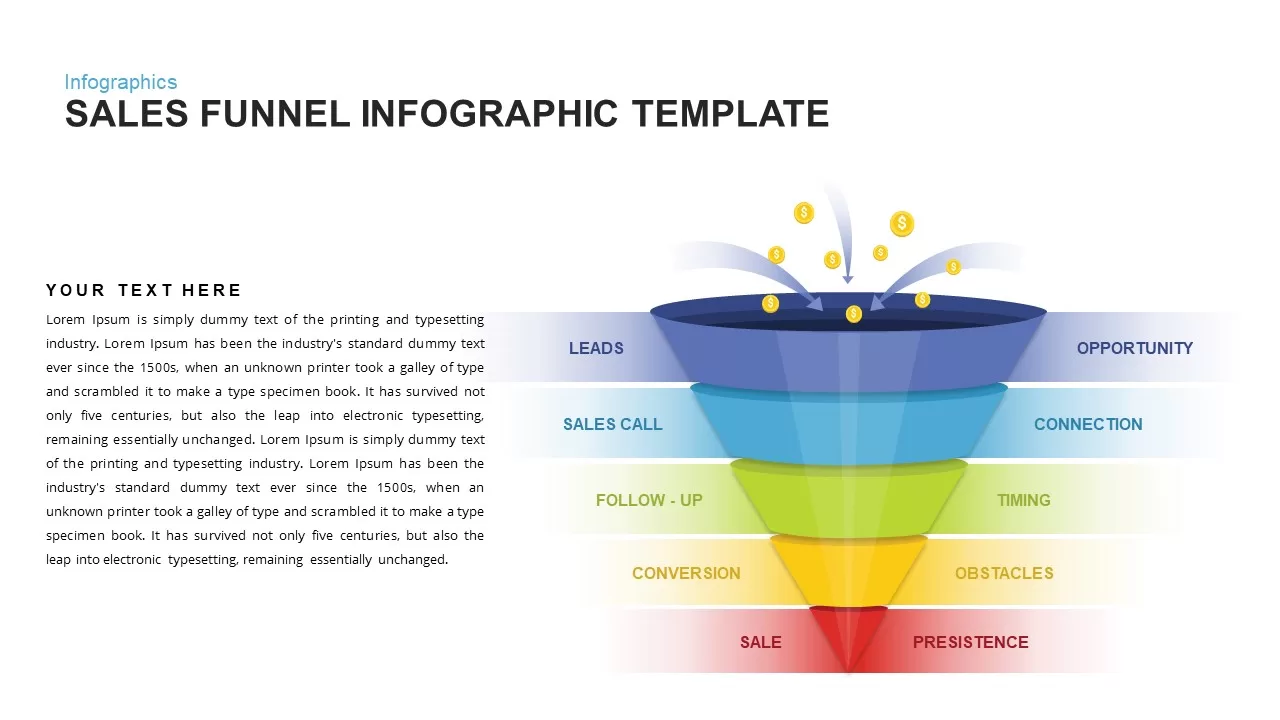
Sales Funnel Infographic Diagram Template for PowerPoint & Google Slides
Funnel
Affinity Diagram Infographic Template for PowerPoint & Google Slides
Business
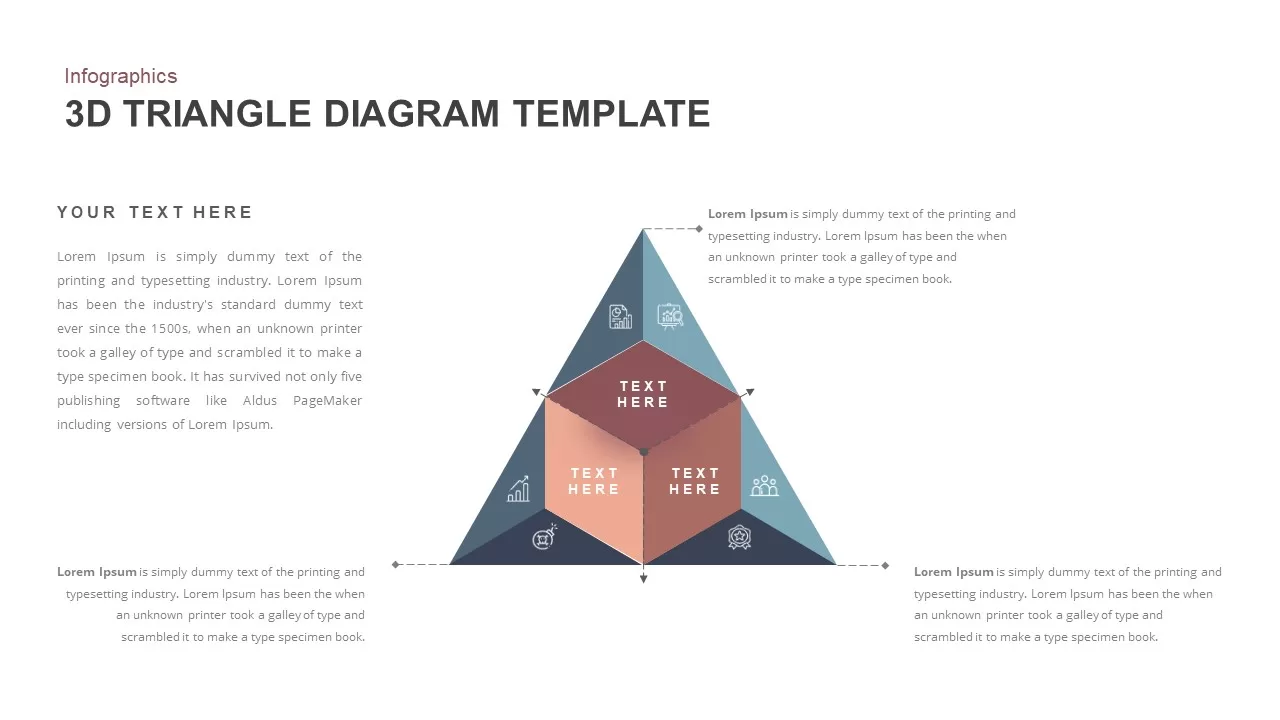
3D Triangle Diagram Infographic Template for PowerPoint & Google Slides
Pyramid
Structured Mind Map Infographic Diagram Template for PowerPoint & Google Slides
Mind Maps
Minimal Process Flow Diagram Infographic Template for PowerPoint & Google Slides
Process
Free Curved Arrow Infographic Diagram Template for PowerPoint & Google Slides
Arrow
Free
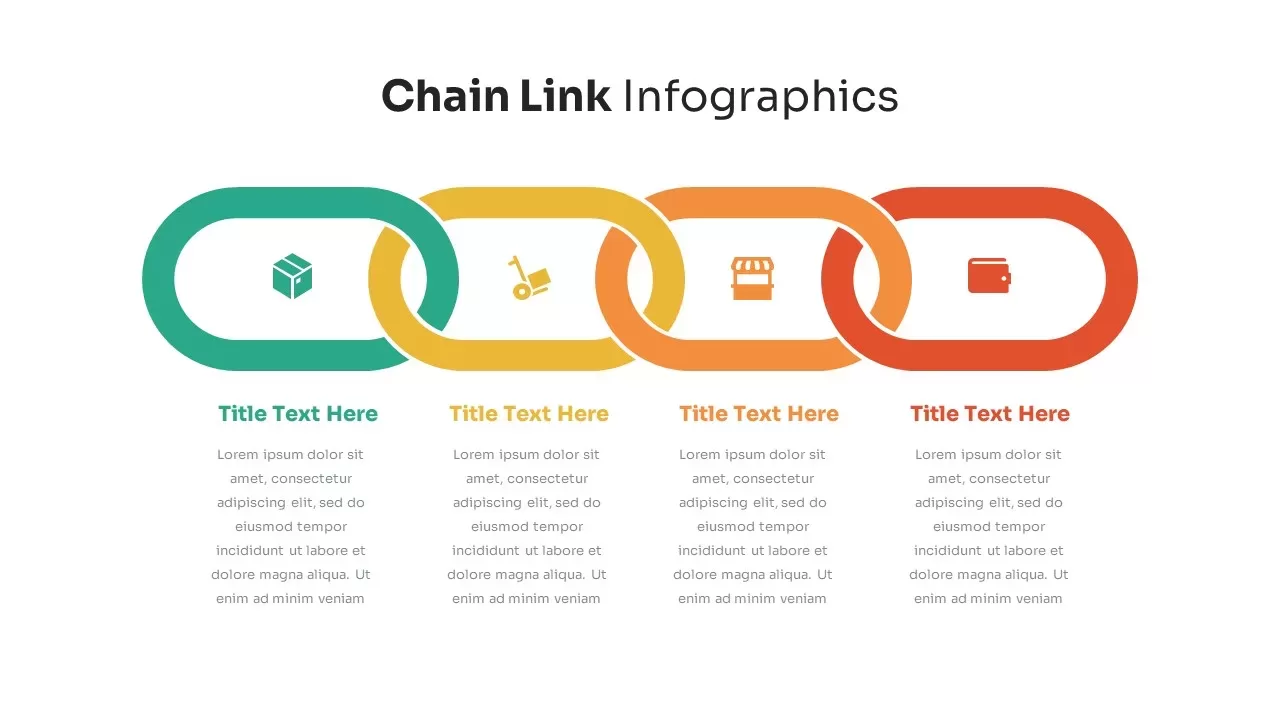
Chain Link Process Infographic Diagram Template for PowerPoint & Google Slides
Process
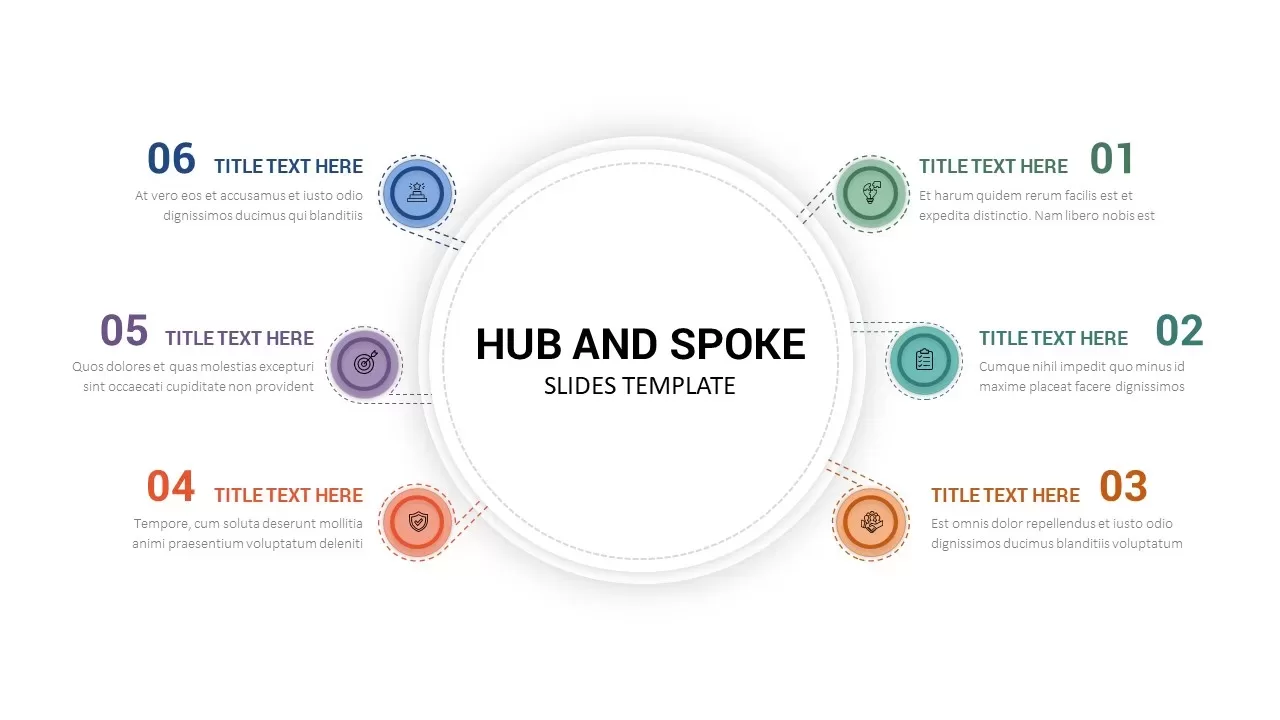
Hub & Spoke Infographic Diagram Template for PowerPoint & Google Slides
Process
Chain Link Process Infographic Diagram Template for PowerPoint & Google Slides
Process
Smartphone Infographic Diagram Template for PowerPoint & Google Slides
Comparison
Chain Link Process Infographic Diagram Template for PowerPoint & Google Slides
Process
Modern Chess Infographic Diagram Template for PowerPoint & Google Slides
Comparison
Dynamic Hub-and-Spoke Infographic Diagram Template for PowerPoint & Google Slides
Circular
Key Takeaway Infographic Keyhole Diagram Template for PowerPoint & Google Slides
Process
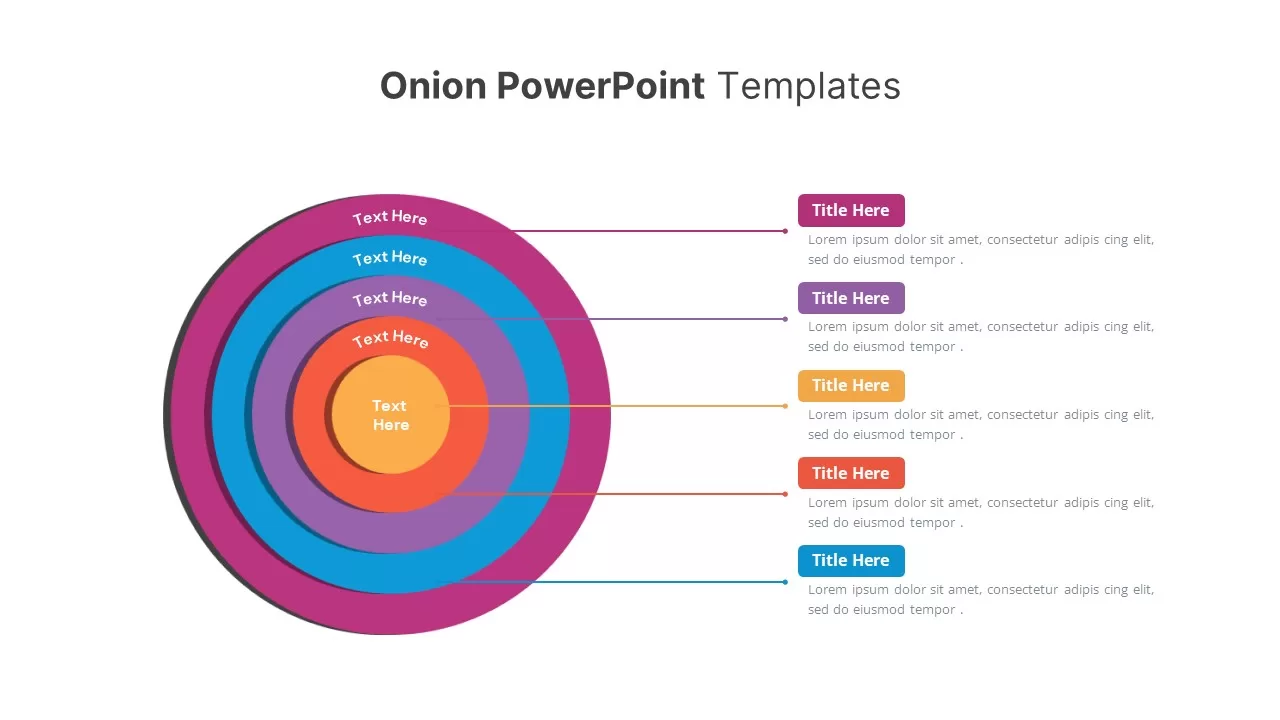
Onion Layer Infographic Diagram Template for PowerPoint & Google Slides
Process
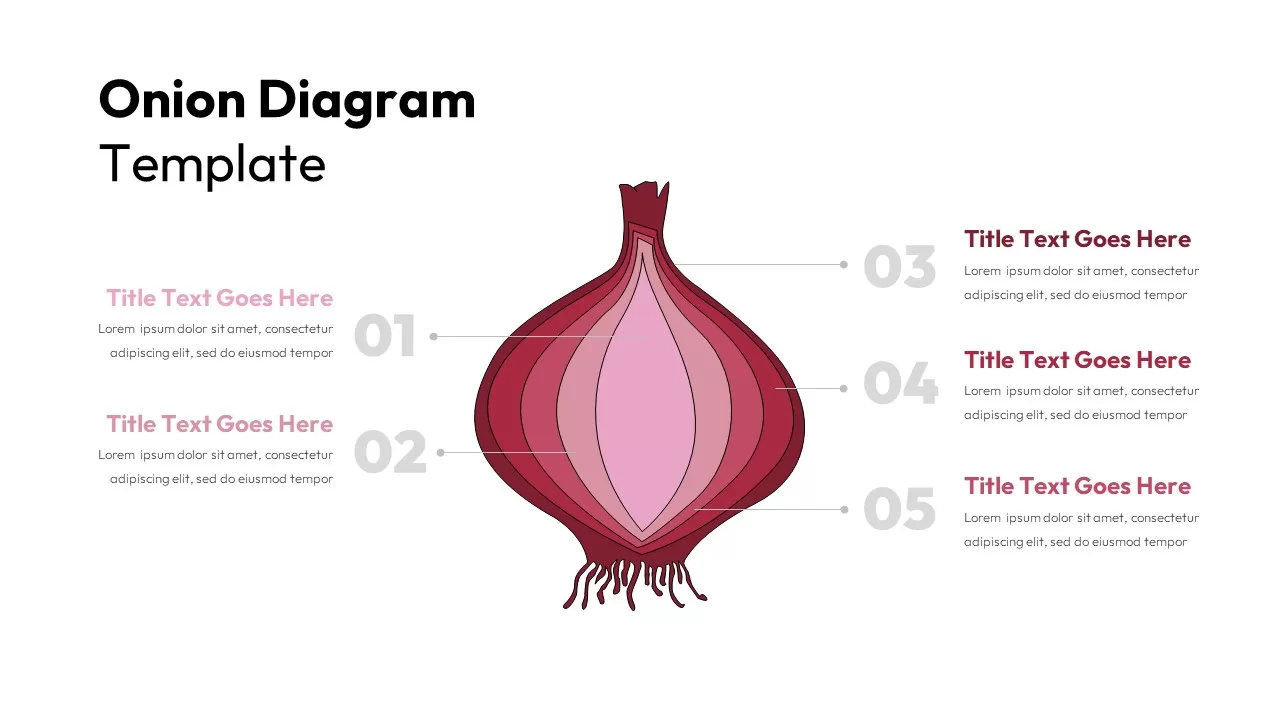
Five-Layer Onion Diagram Infographic Template for PowerPoint & Google Slides
Process
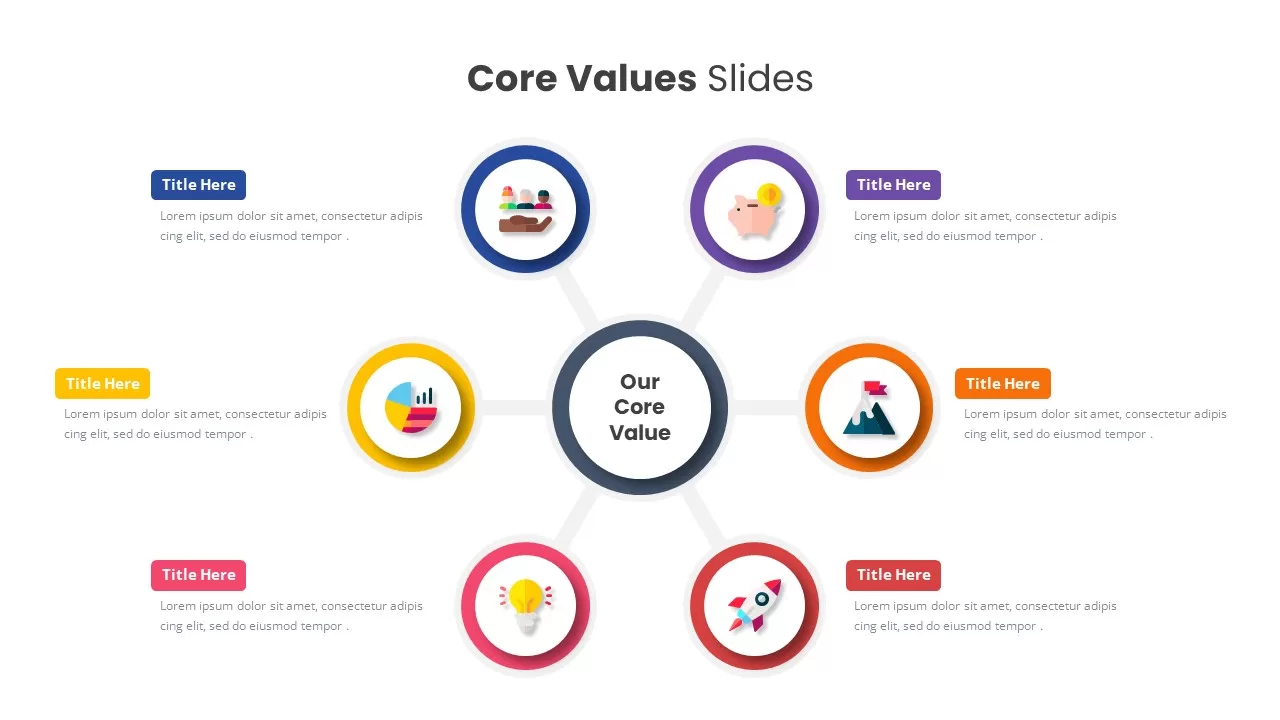
Core Values Infographic Diagram Template for PowerPoint & Google Slides
Circular
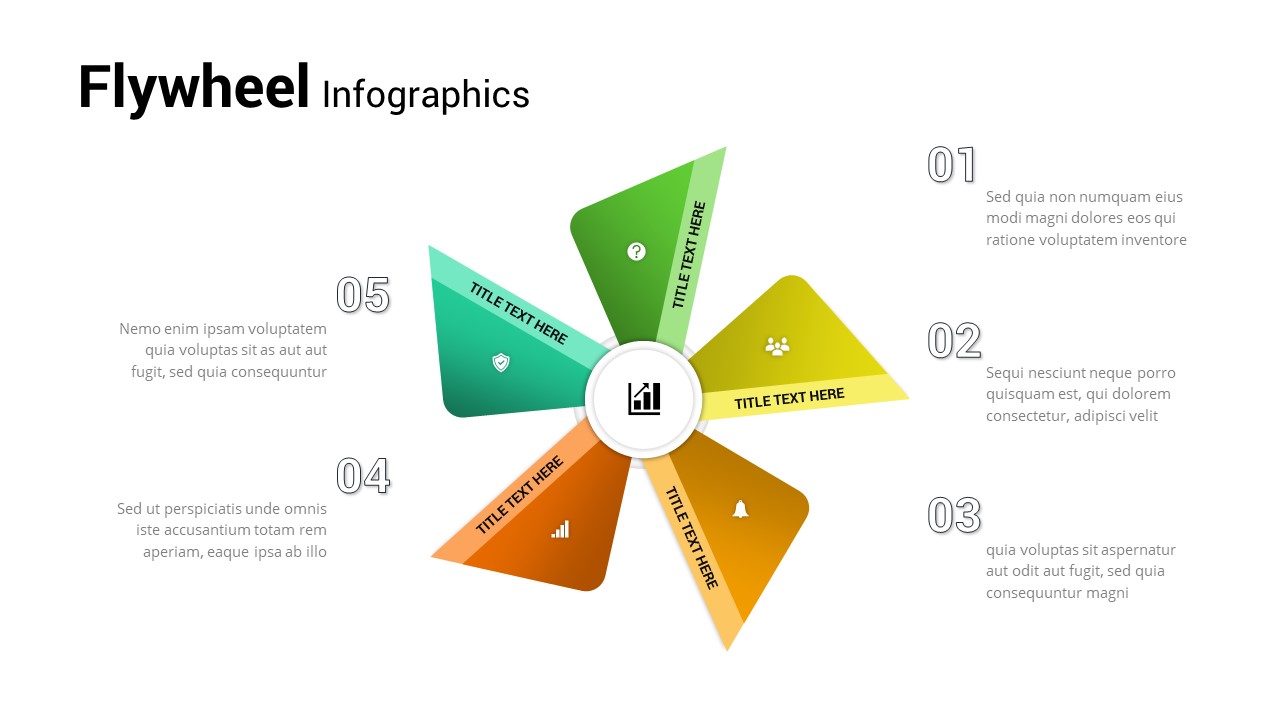
Five-Step Flywheel Infographic Diagram Template for PowerPoint & Google Slides
Process
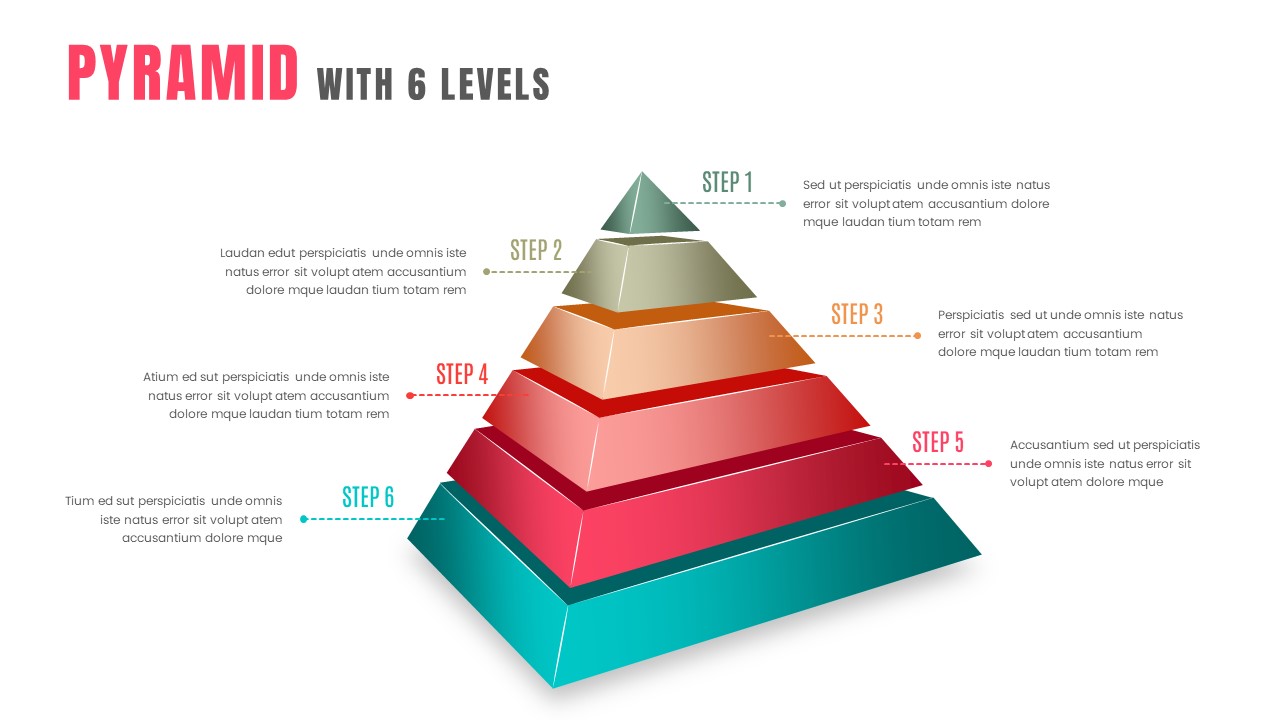
3D Six-Level Pyramid Diagram Infographic Template for PowerPoint & Google Slides
Pyramid
8 Circle Venn Diagram Infographic Design Template for PowerPoint & Google Slides
Circular
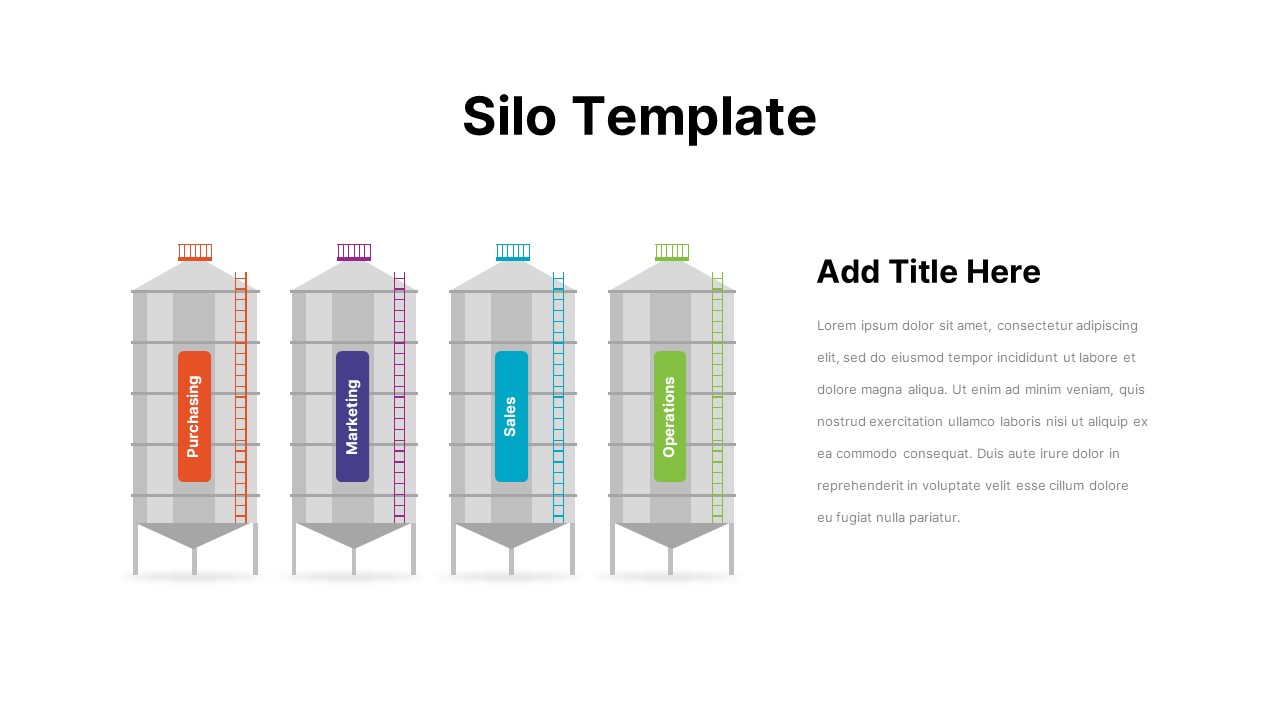
Business Silo Diagram Infographic Design Template for PowerPoint & Google Slides
Business
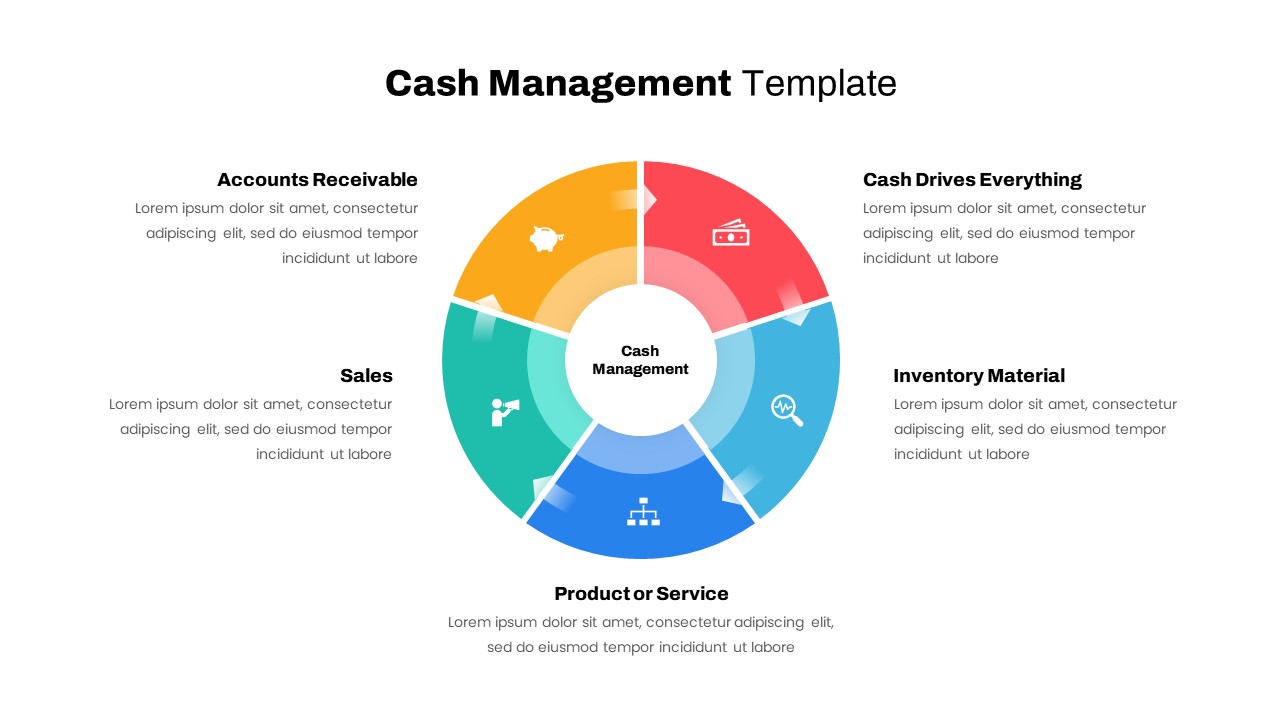
Cash Management Infographic Diagram Template for PowerPoint & Google Slides
Circular
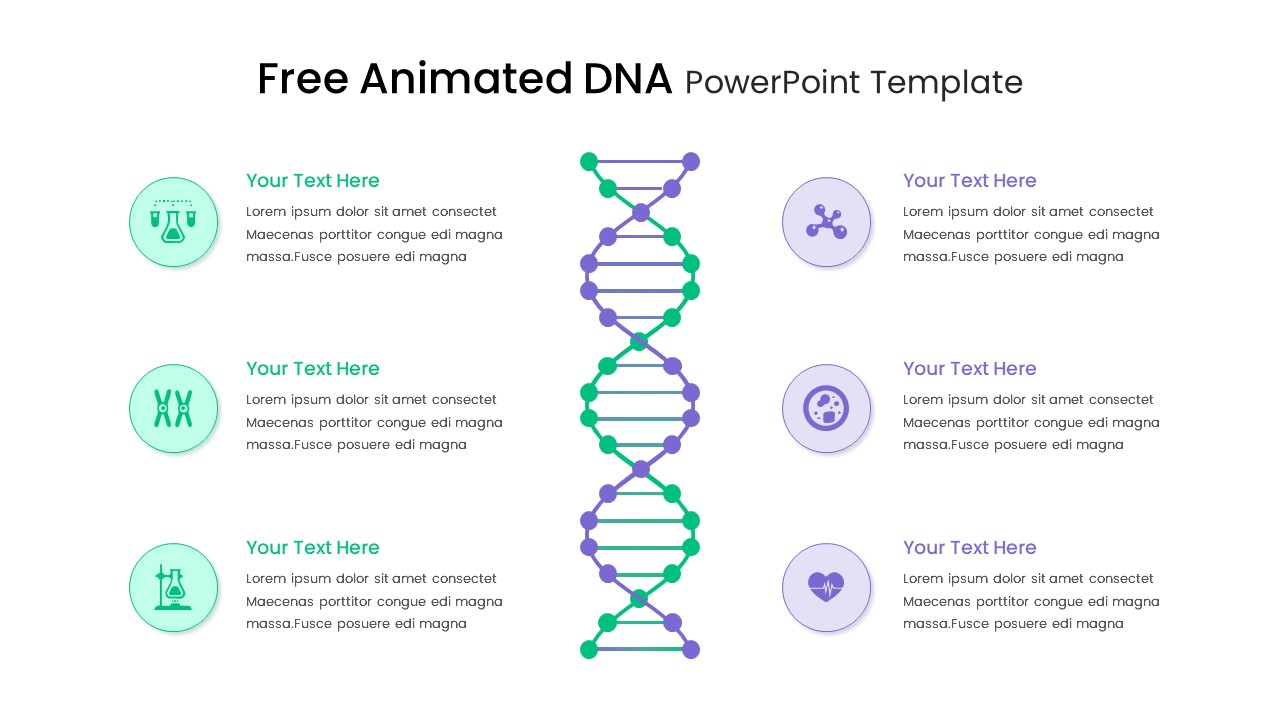
Free Animated DNA Infographic Diagram Template for PowerPoint & Google Slides
Infographics
Free
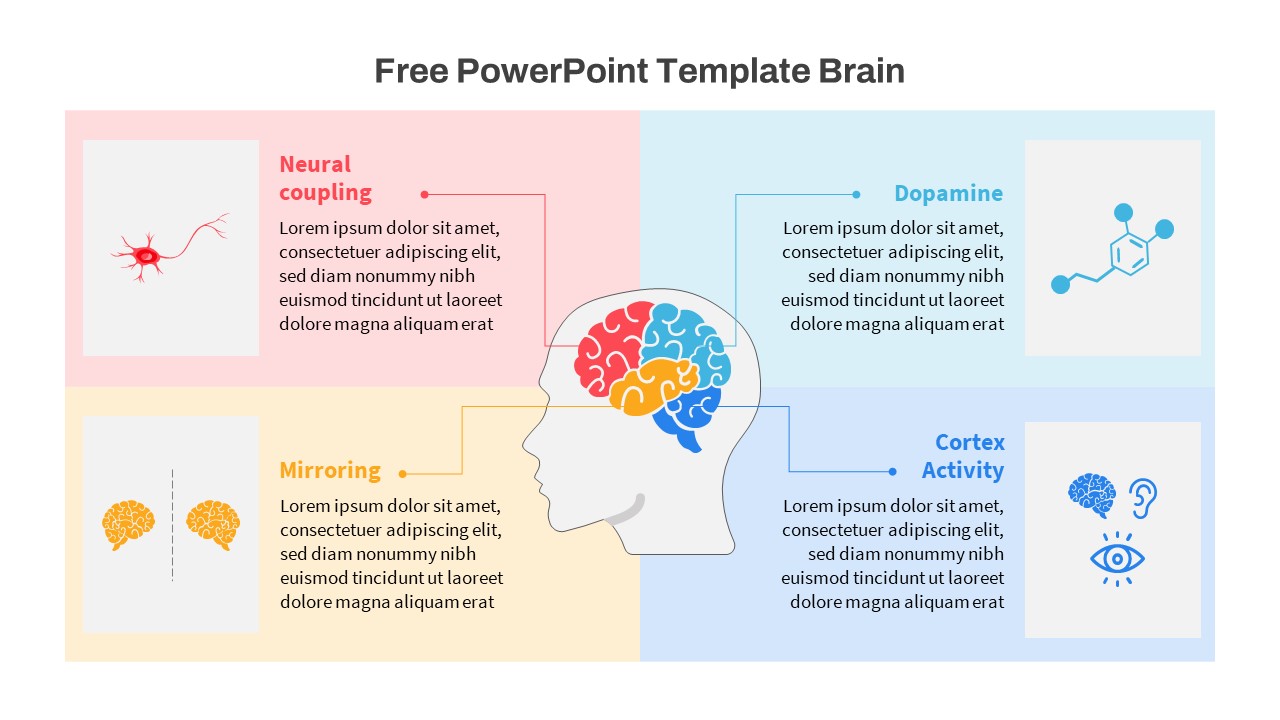
Free Brain Function Diagram Infographic Template for PowerPoint & Google Slides
Process
Free
Salience Model Venn Diagram Infographic Template for PowerPoint & Google Slides
Circular
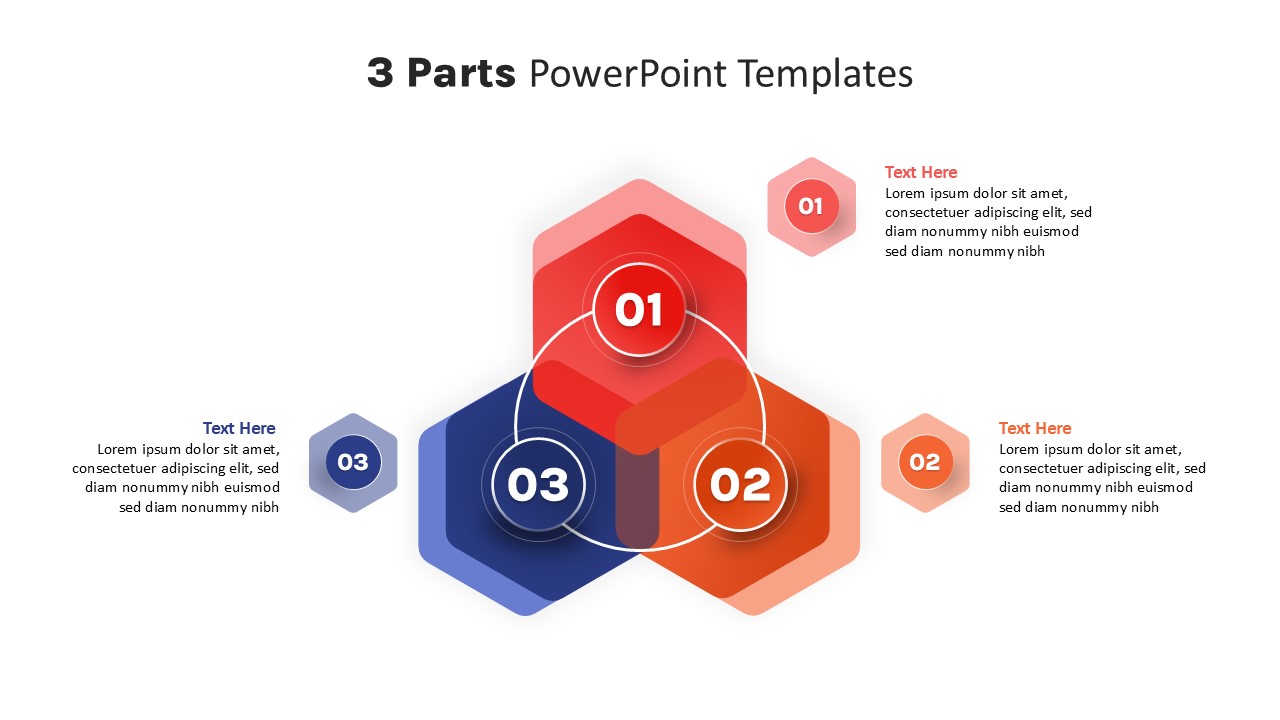
Three-Part Parts Infographic Diagram Template for PowerPoint & Google Slides
Process
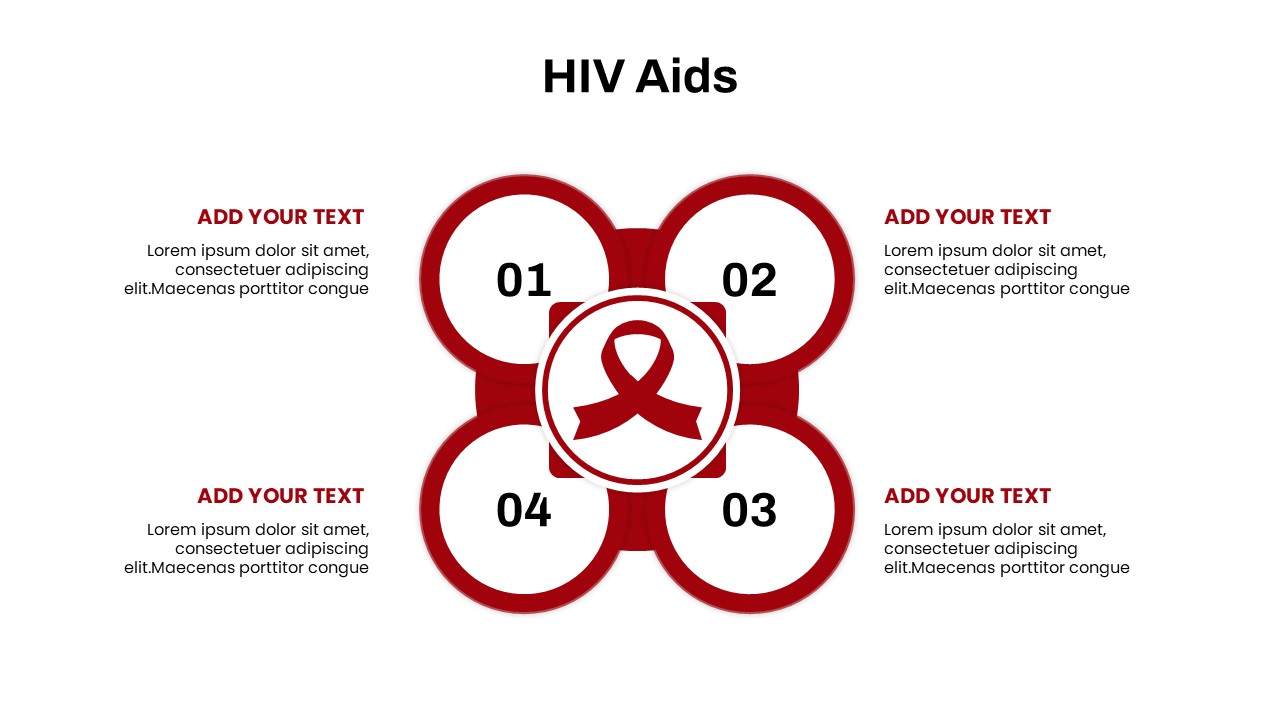
HIV AIDS Infographic Diagram Slide Deck Template for PowerPoint & Google Slides
Graphics
Employer Branding Infographic Diagram Template for PowerPoint & Google Slides
Recruitment
4 Parts Infographic Diagram Template for PowerPoint & Google Slides
Process
Human Resources Diagram Infographic for PowerPoint & Google Slides
Business
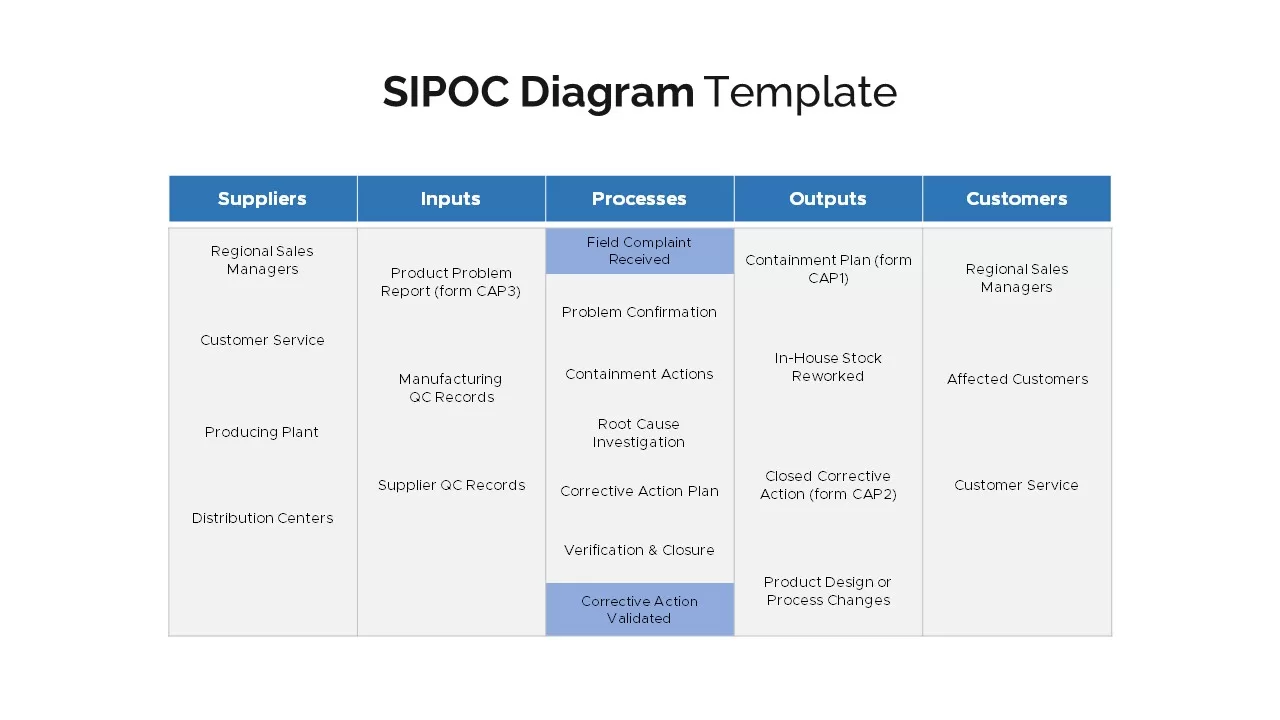
Four SIPOC Diagram Infographic Templates for PowerPoint & Google Slides
Business Plan
Google Ads Optimization & Performance Infographic Template for PowerPoint & Google Slides
Digital Marketing
SQ3R Study Strategy Infographic Slides Template for PowerPoint & Google Slides
Business Strategy
Six Double Diamond Infographic Slides Template for PowerPoint & Google Slides
Process
Casino/Poker Chips Infographic Slides template for PowerPoint & Google Slides
Business Strategy
Agenda Infographic Pack of 2 Slides Template for PowerPoint & Google Slides
Agenda
Quad Chart Infographic Pack of 8 Slides Template for PowerPoint & Google Slides
Comparison Chart
Four Options Infographic Slides Template for PowerPoint & Google Slides
Comparison
Game Plan Infographic Slides Pack Template for PowerPoint & Google Slides
Infographics