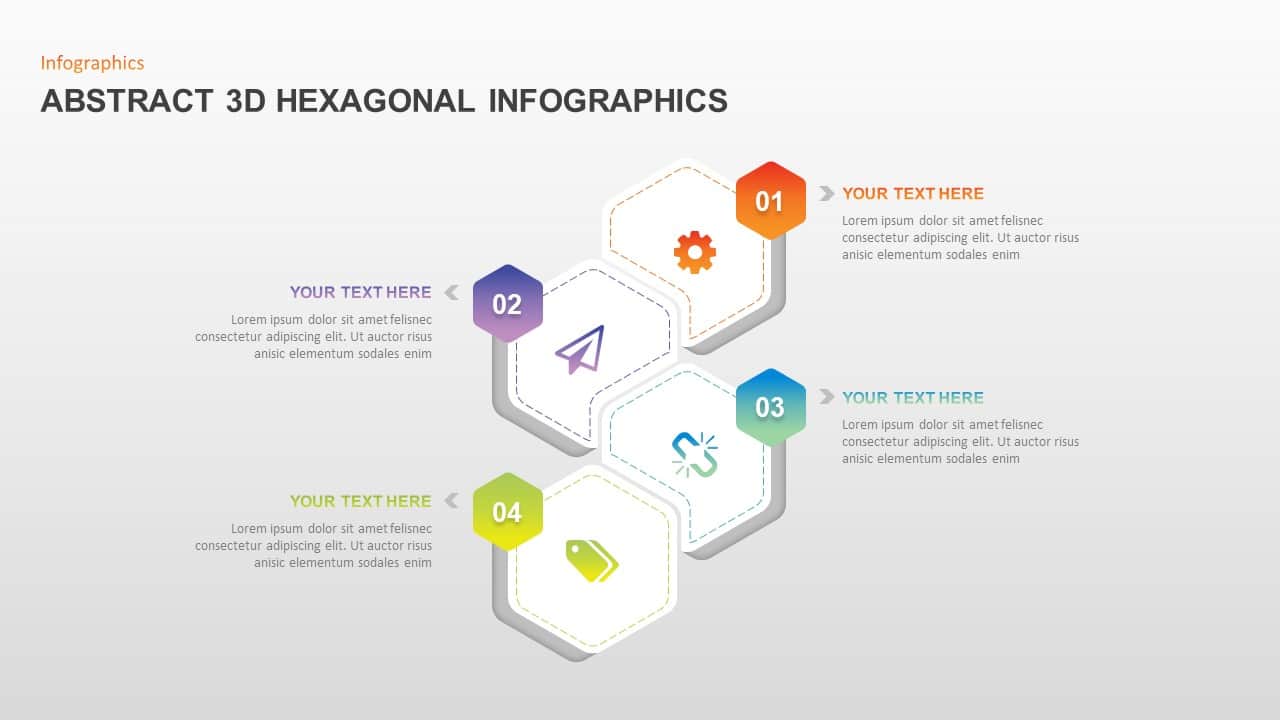
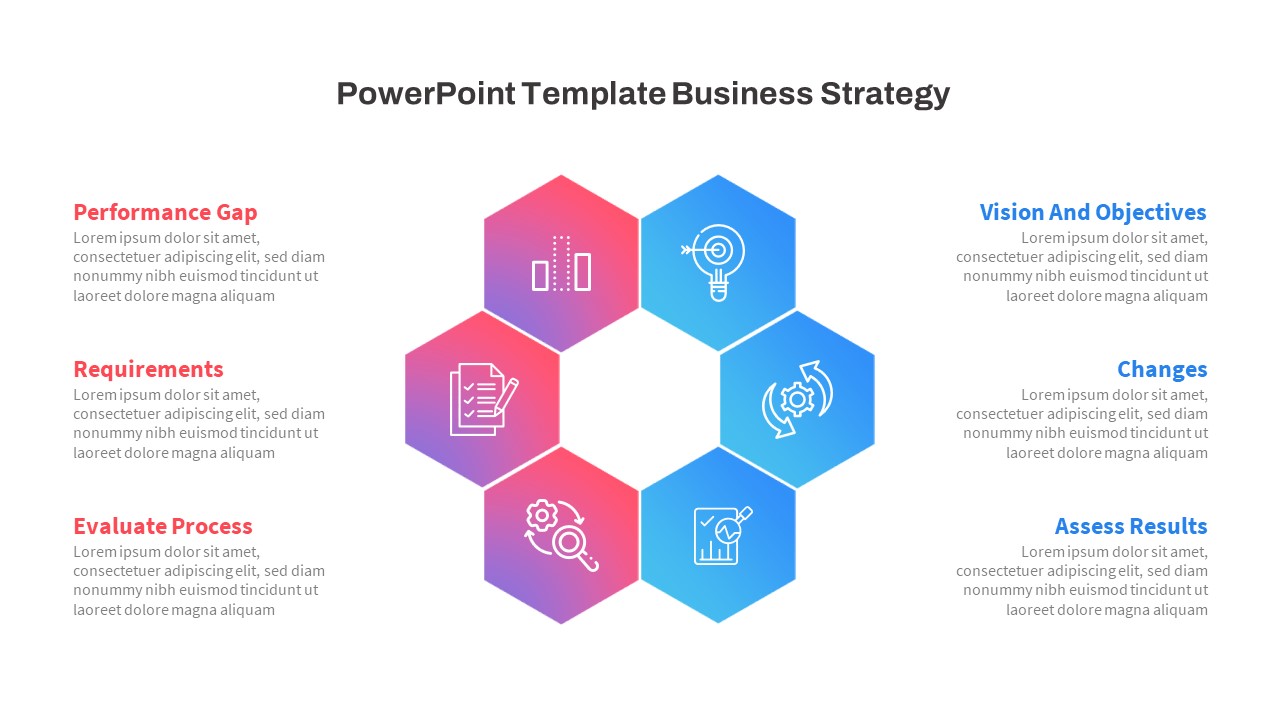
Hexagonal Shapes Infographic Diagram Template for PowerPoint & Google Slides
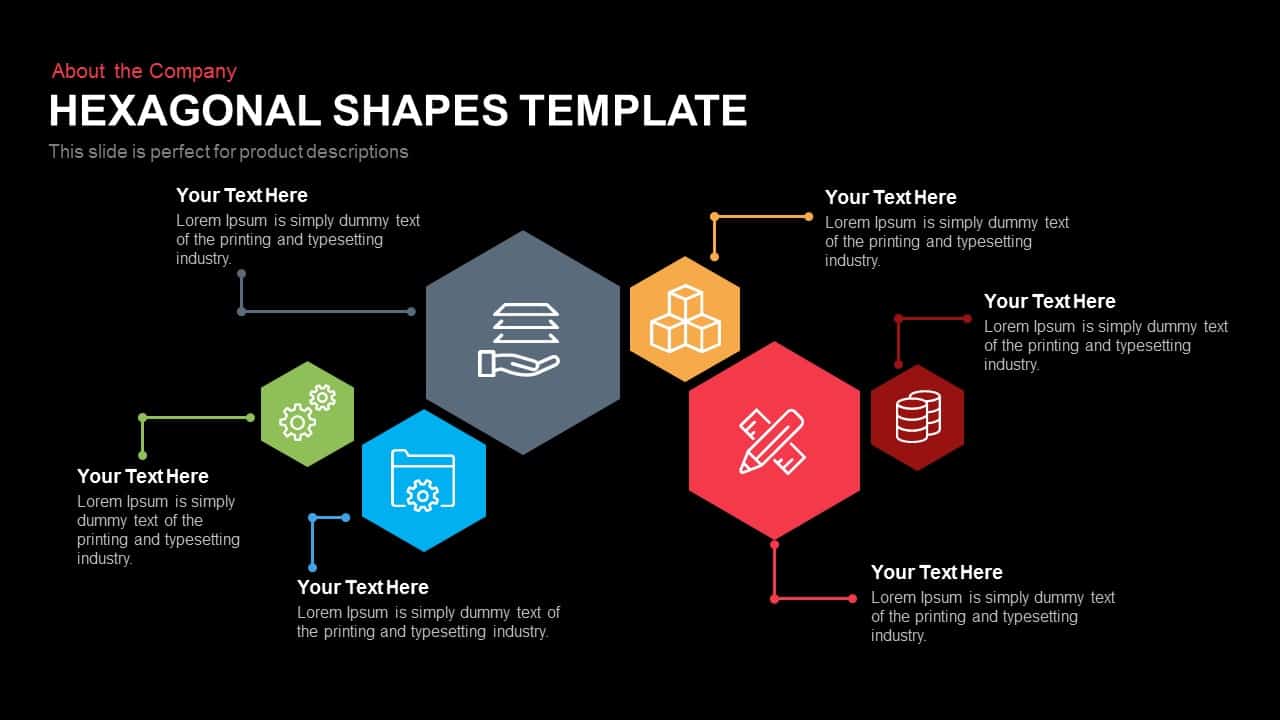

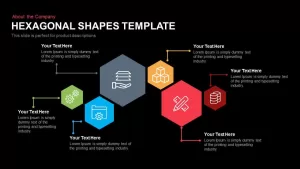
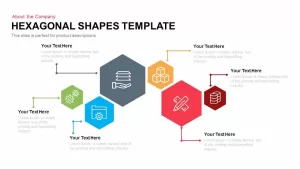
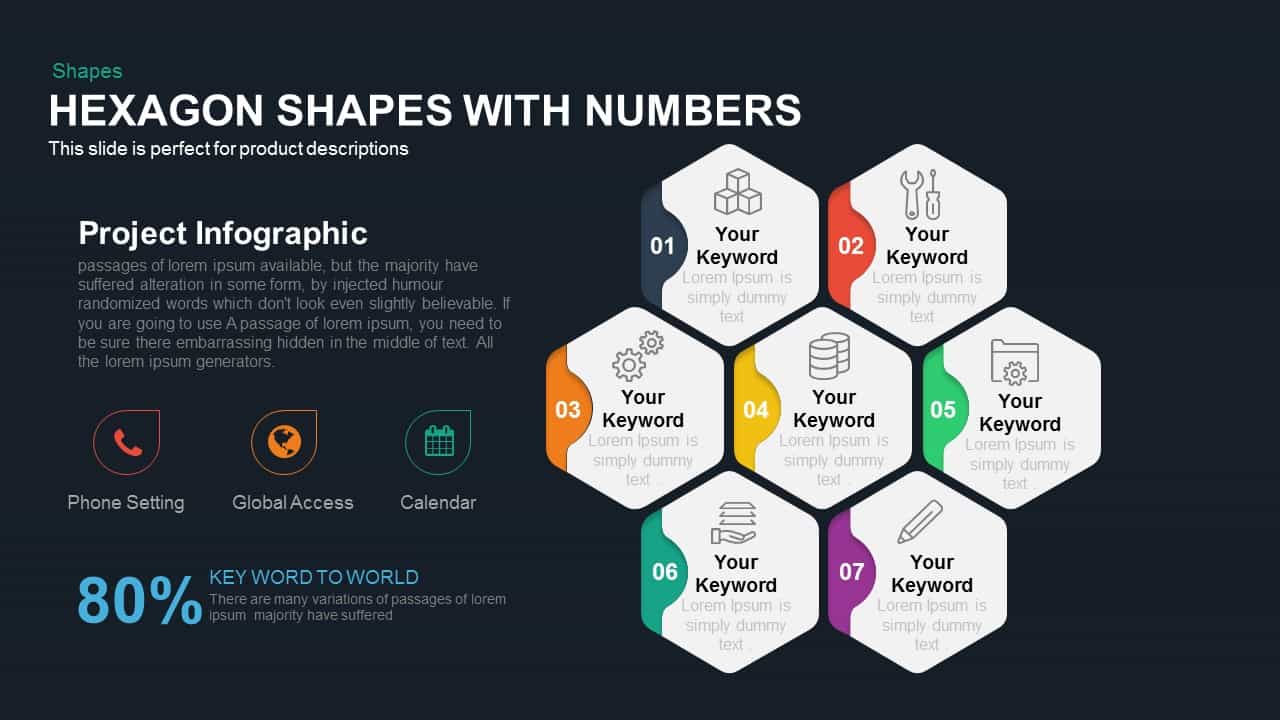
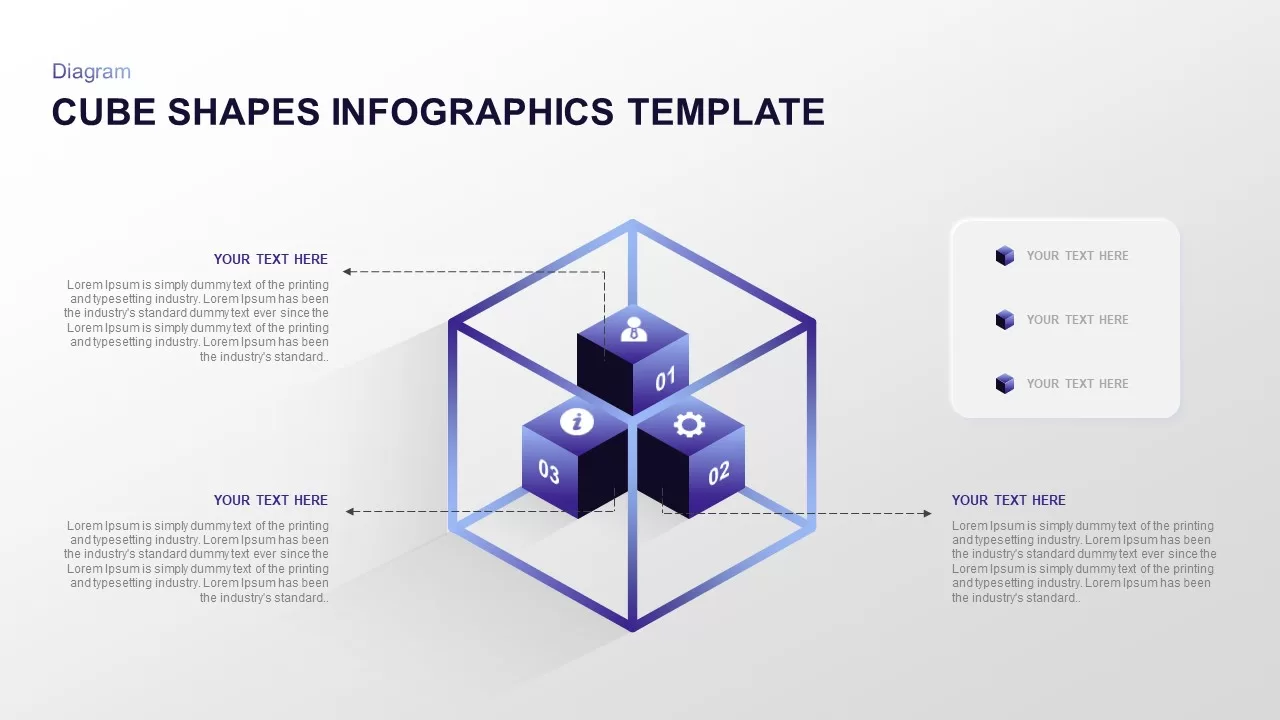
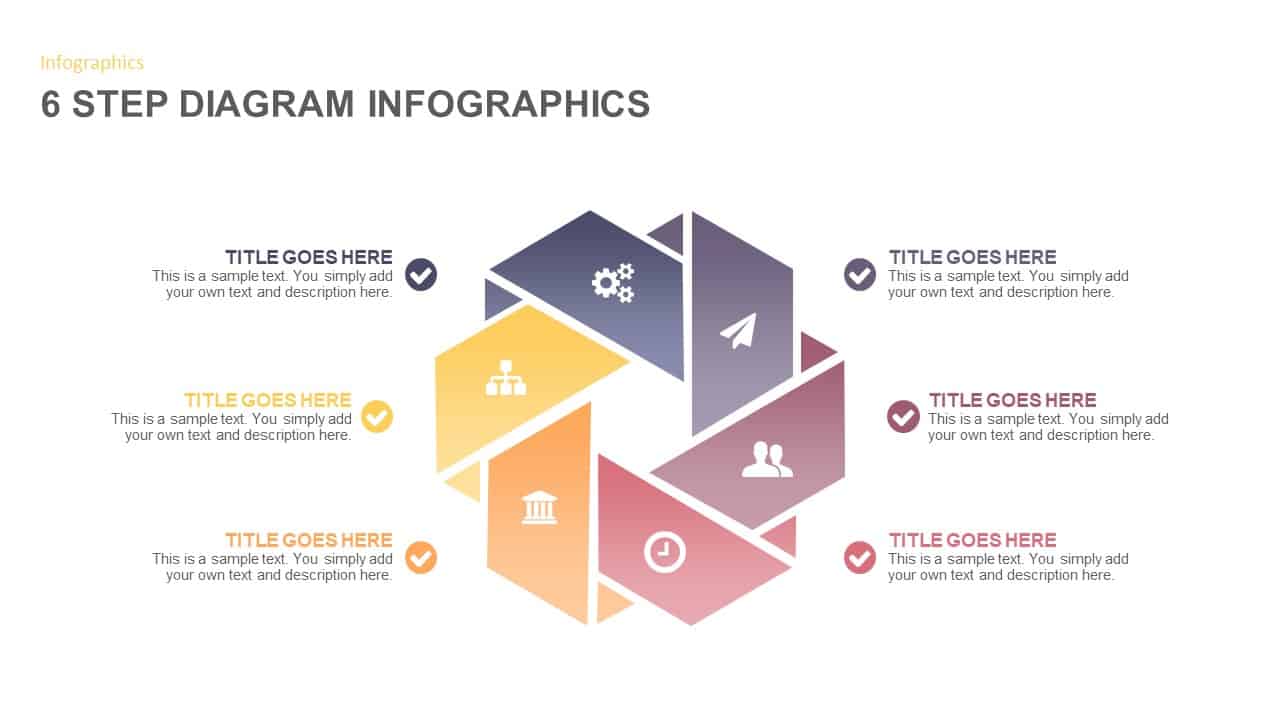
Leverage this hexagonal shapes infographic diagram to present product features, service offerings, or component breakdowns with clarity and impact. The layout includes six editable hexagon shapes—two central modules and four accent nodes—each featuring a minimalist line icon representing documentation, design, operations, inventory, data storage, and system planning. Customizable connector lines link each hexagon to dedicated text callouts, ensuring audiences focus on individual elements without losing sight of the overall structure.
Embracing flat design principles, the slide uses a balanced palette of bold hues—dark gray, vibrant red, forest green, sky blue, warm orange, and deep maroon—to establish visual hierarchy. Generous white space and clean typography maintain readability, while vector-based shapes allow you to resize, recolor, or replace icons instantly through the master slide. Effortlessly align the graphic with your brand identity or presentation theme in just a few clicks.
Fully compatible with Microsoft PowerPoint and Google Slides, this template delivers consistent, high-resolution output across devices and eliminates version-control issues. Quickly update colors, swap icons, or adjust text placeholders with intuitive drag-and-drop controls. Whether you’re preparing a product launch, executive briefing, or technical overview, this infographic empowers you to structure your narrative logically and persuasively.
Beyond product descriptions, this hexagonal diagram serves as a versatile tool for project phase mapping, service workflow outlines, competitive comparisons, or organizational charts. Duplicate or reorder shapes to emphasize priority topics, add data callouts for performance metrics, or apply animation builds to guide step-by-step walkthroughs. Harness the power of hexagonal design to transform complex information into an engaging, cohesive storyline.
Who is it for
Designers, product managers, marketing strategists, and operations leaders will benefit from this infographic when presenting product features or service frameworks. Consultants, business analysts, and technical presenters can leverage the hexagonal callout layout to communicate complex concepts concisely.
Other Uses
Use this hexagonal diagram to map project phases, outline service workflows, illustrate organizational structures, or compare competitive offerings. Adjust shapes and icons to highlight performance metrics, strategic initiatives, or technical processes, making it a multipurpose asset for diverse presentation needs.
Login to download this file

Item ID
SB00193
Related Templates

Abstract 3D Hexagonal 4-Step Infographic Template for PowerPoint & Google Slides
Process
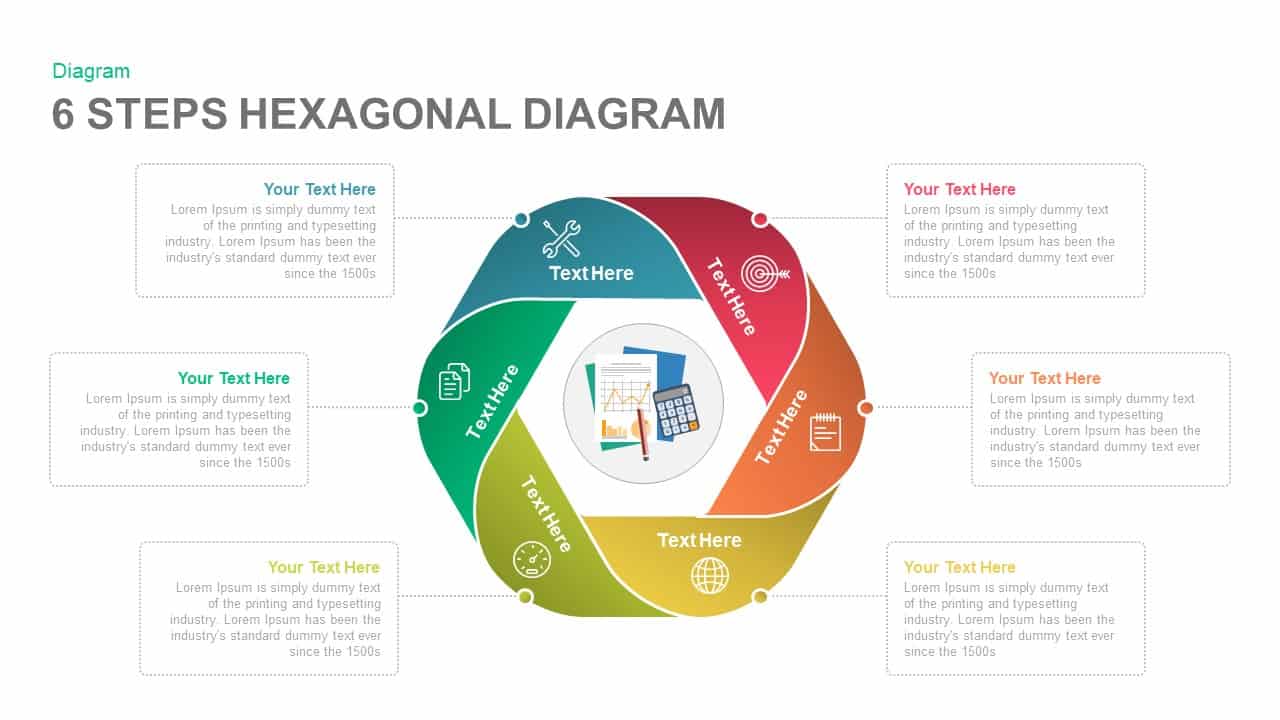
Six-Step Hexagonal Diagram Slide Template for PowerPoint & Google Slides
Circular
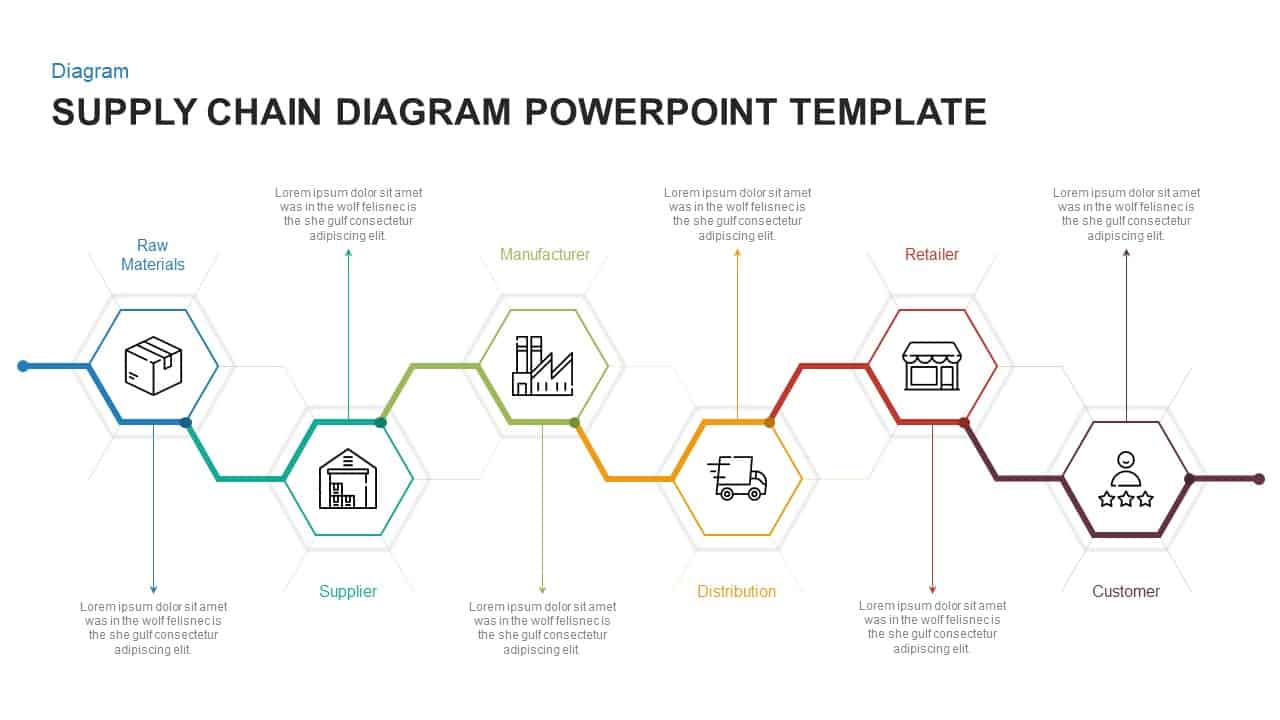
Hexagonal Supply Chain Diagram Template for PowerPoint & Google Slides
Process
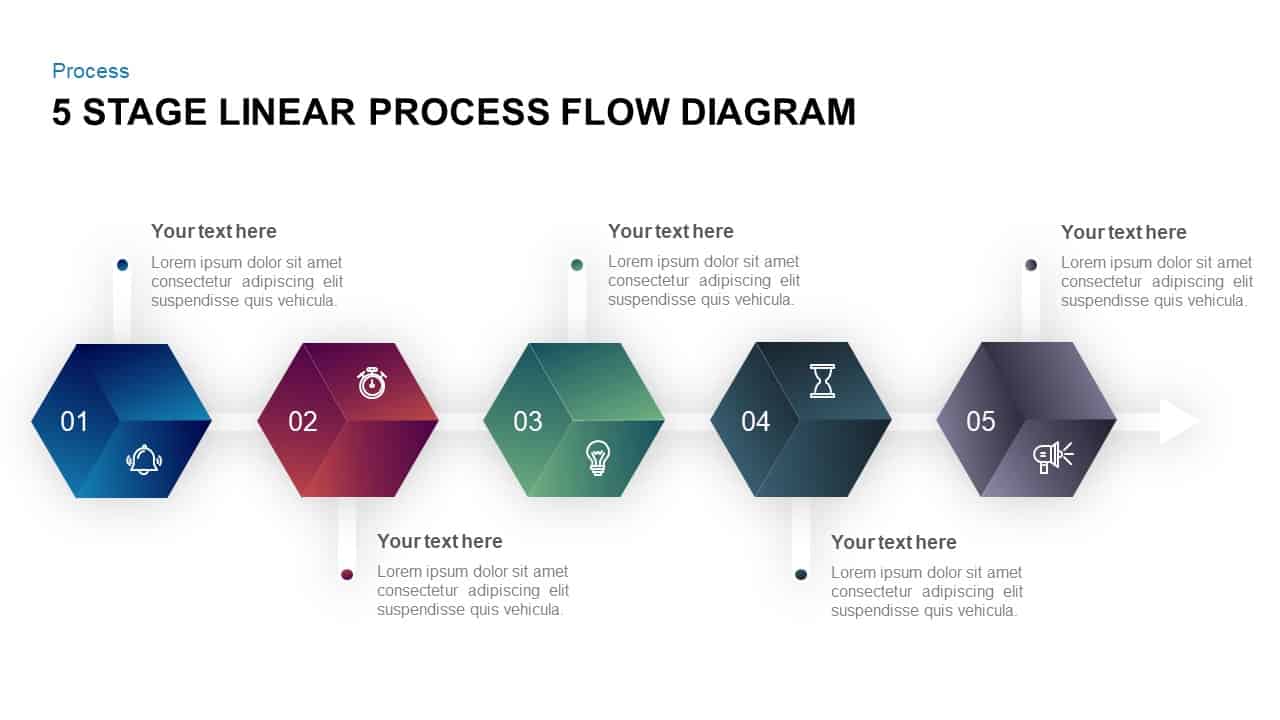
Five-Step Hexagonal Process Flow Template for PowerPoint & Google Slides
Process
Hexagonal Process Flow Template for PowerPoint & Google Slides
Process
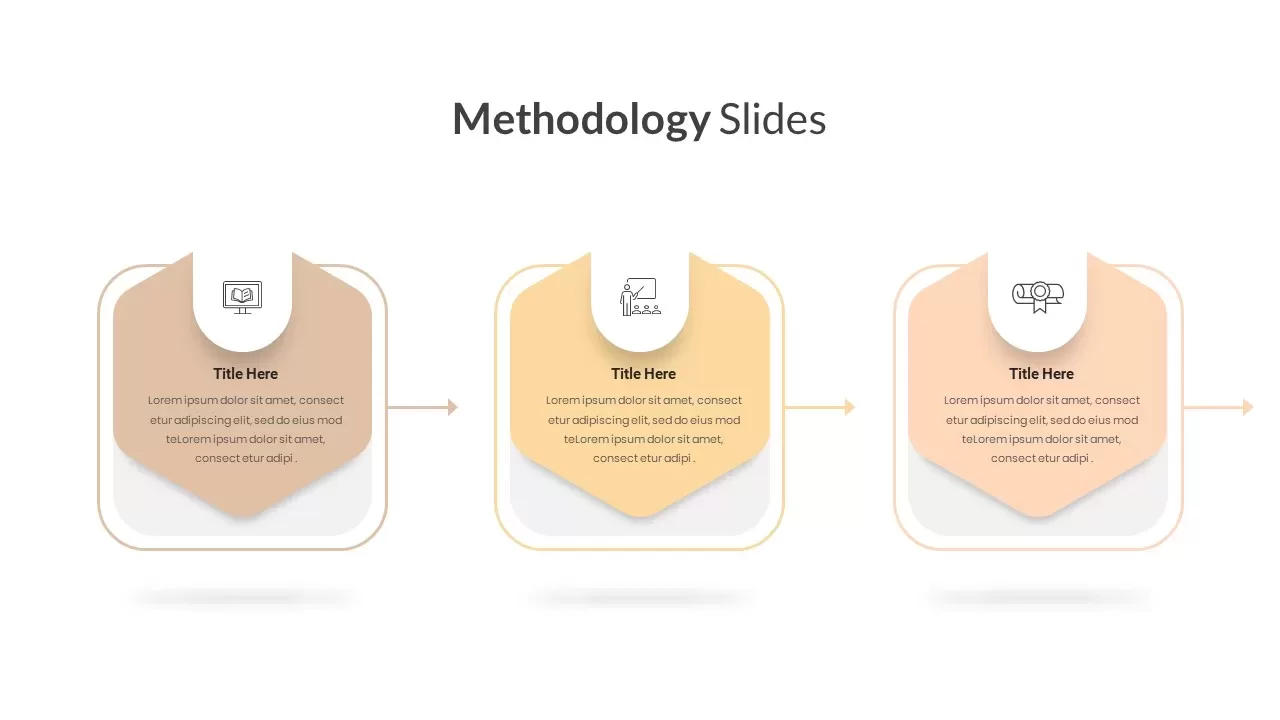
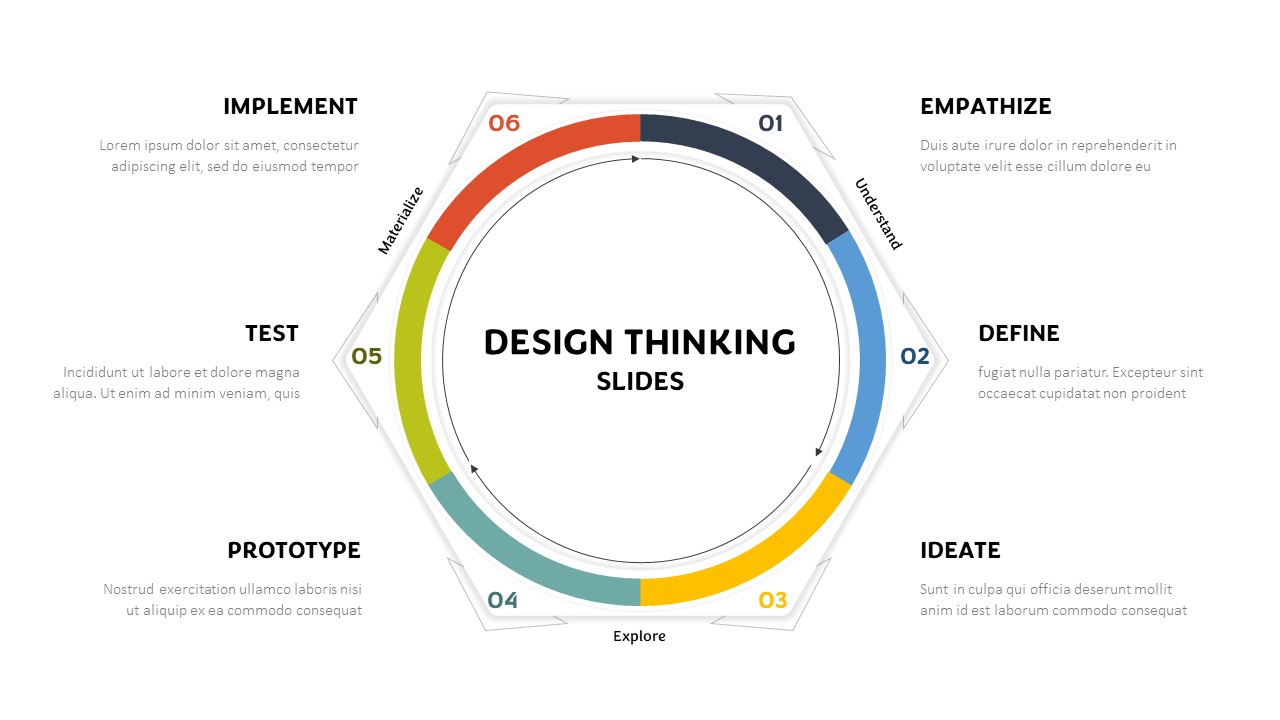
Hexagonal Design Thinking Cycle Template for PowerPoint & Google Slides
Process
Free Hexagonal Six-Step Business Strategy Template for PowerPoint & Google Slides
Process
Free

Free Blue Hexagonal Abstract Presentation Template for PowerPoint & Google Slides
Pitch Deck
Free
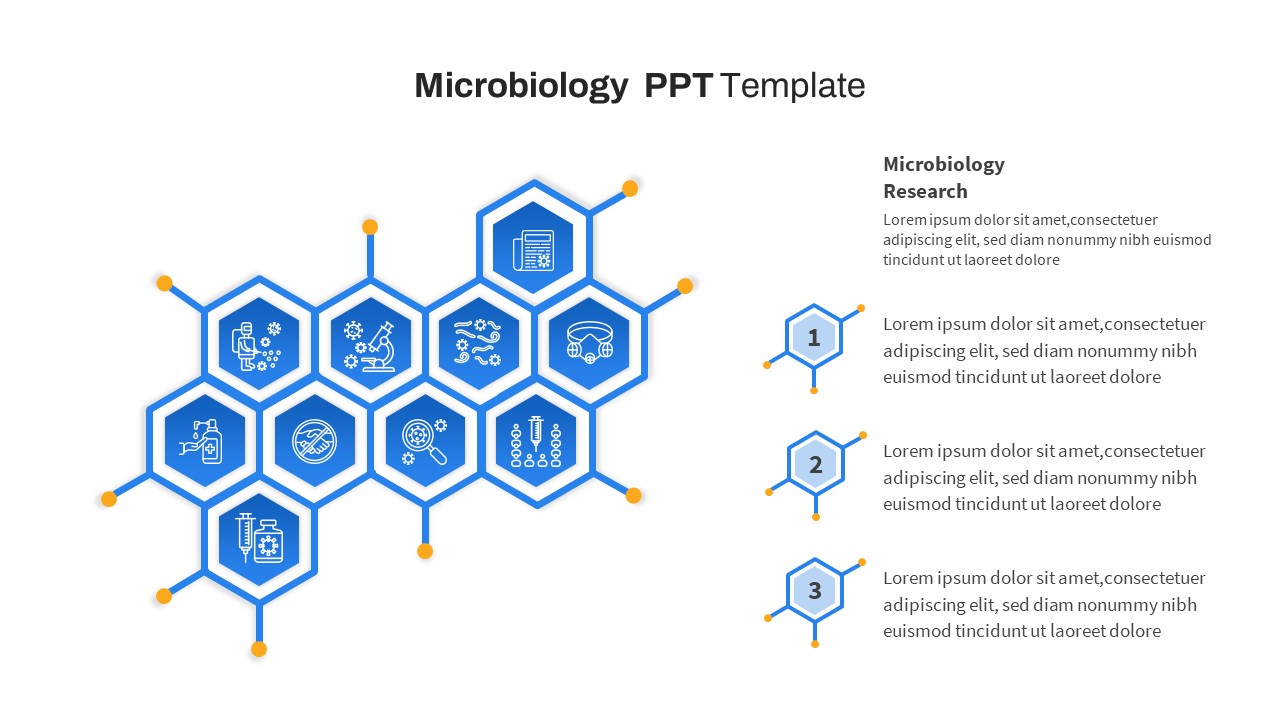
Free Hexagonal Microbiology Research Process Template for PowerPoint & Google Slides
Process
Free
Six Colorful Gear Shapes Infographic Template for PowerPoint & Google Slides
Process
Free
Free Callout Boxes PowerPoint Shapes for PowerPoint & Google Slides
Infographics
Free
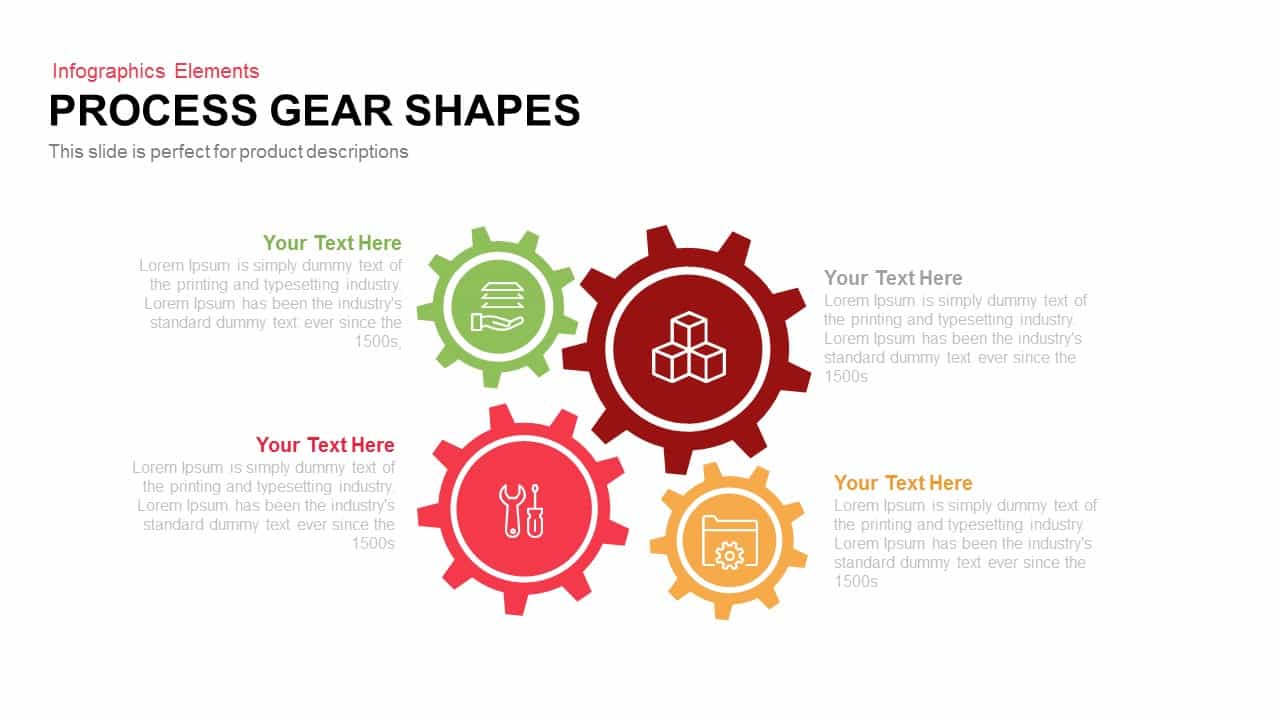
Process Gear Shapes Template for PowerPoint & Google Slides
Infographics
Hexagon Shapes with Numbers Process Template for PowerPoint & Google Slides
Process
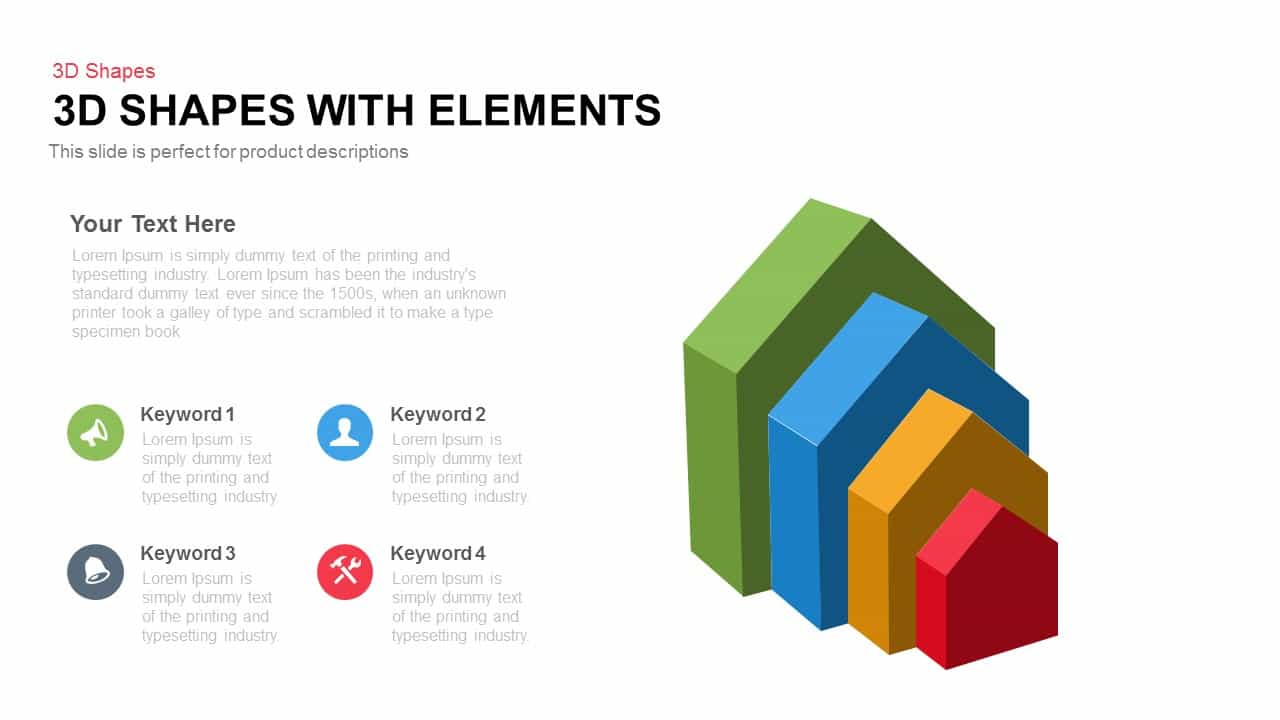
3D Shapes Overview template for PowerPoint & Google Slides
Process

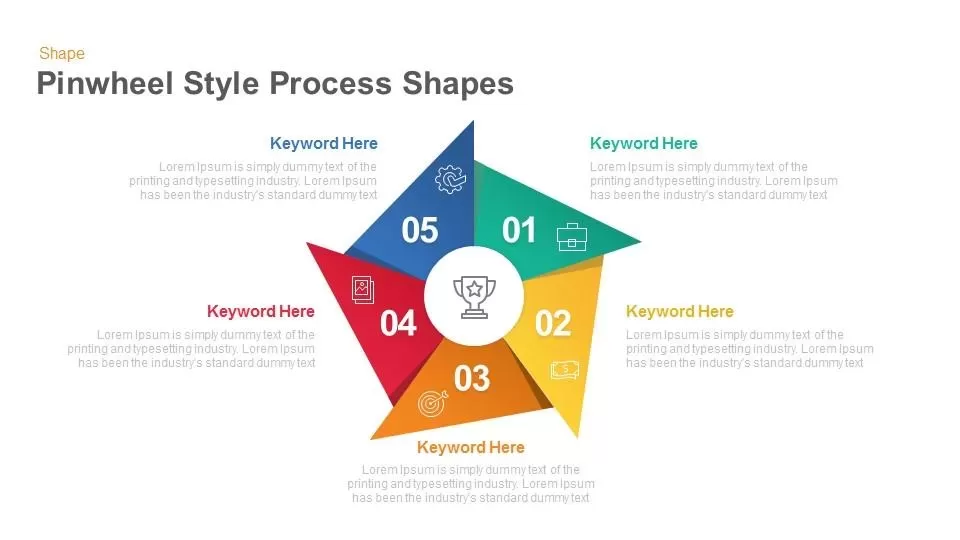
Pinwheel Style Process Shapes template for PowerPoint & Google Slides
Process
Isometric 3D Cube Shapes Infographics Template for PowerPoint & Google Slides
Infographics

Food Theme with Vibrant Orange Shapes Template for PowerPoint & Google Slides
Pitch Deck
Free Psychology Theme with Fluid Shapes Template for PowerPoint & Google Slides
Medical
Free
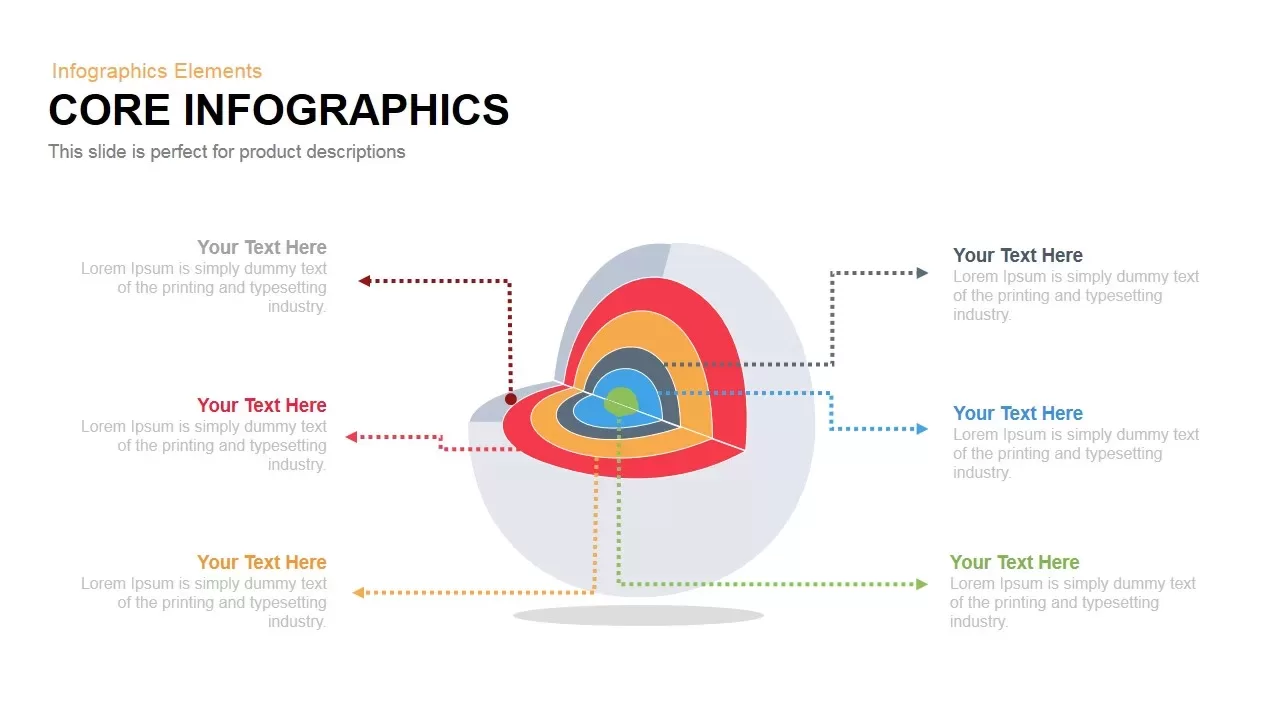
Multilayer Core Infographic Diagram Template for PowerPoint & Google Slides
Circular
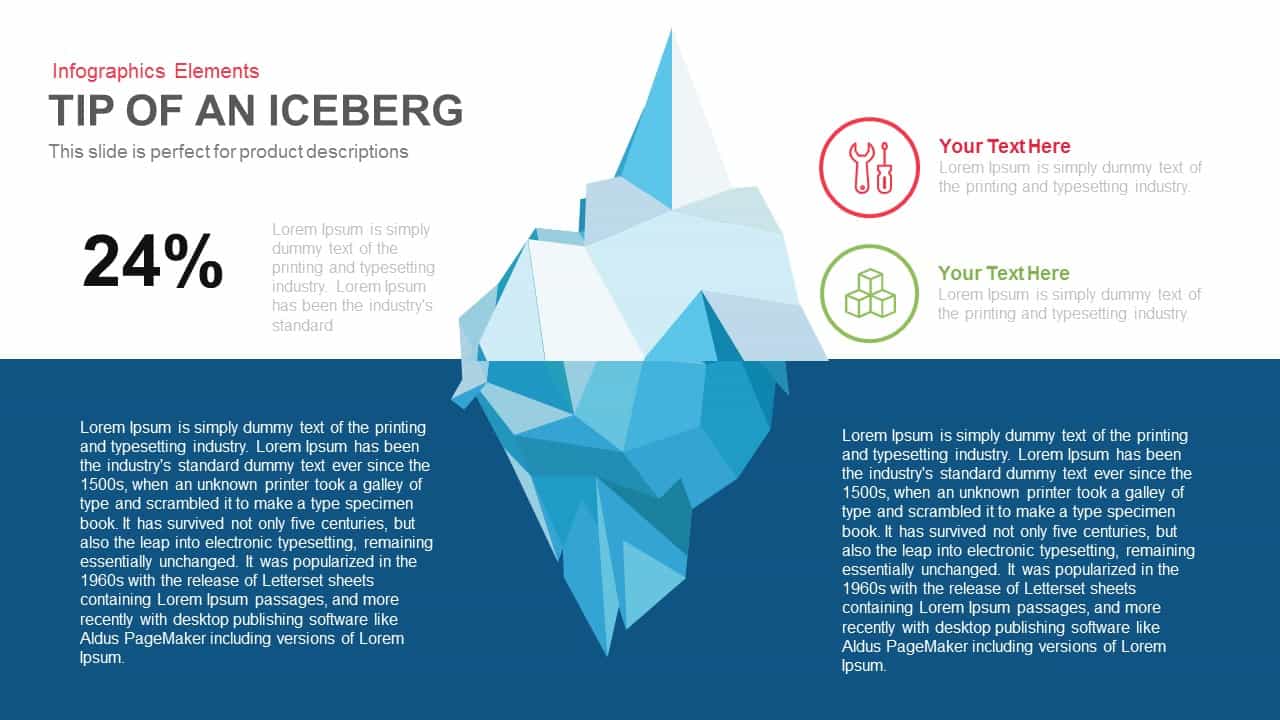
Tip of an Iceberg Infographic Diagram template for PowerPoint & Google Slides
Iceberg Charts
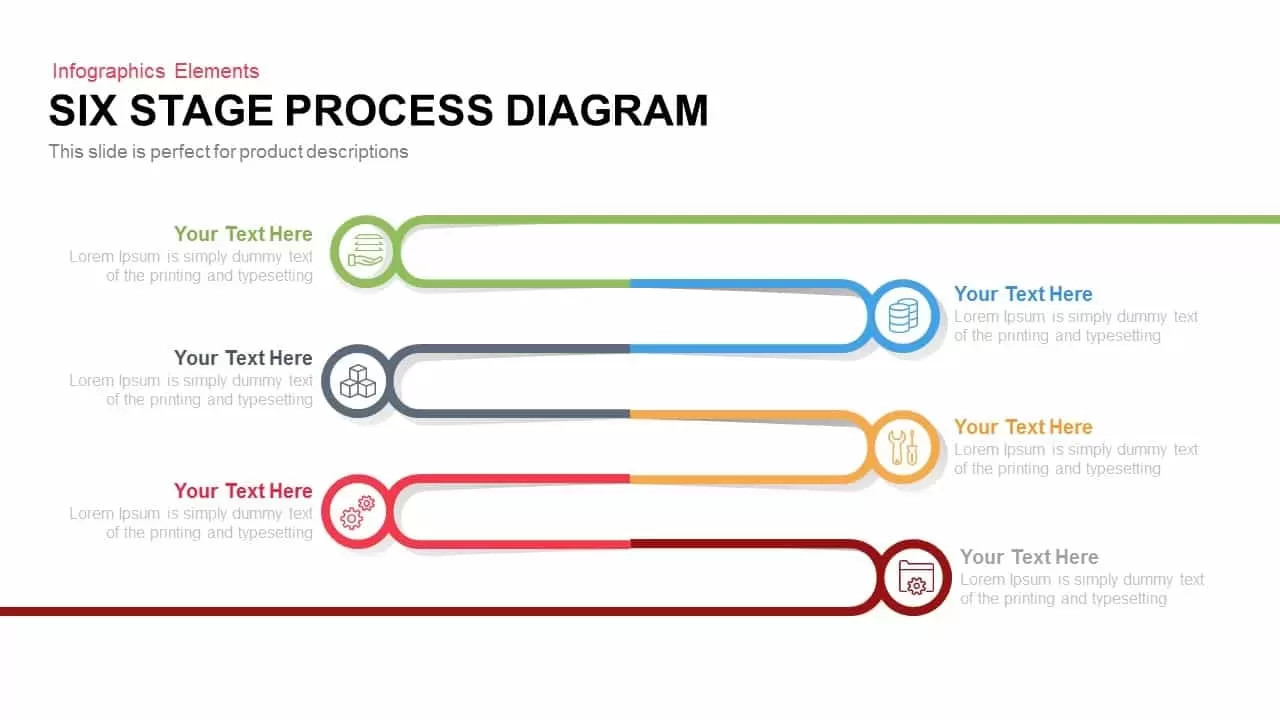
6 Stage Process Diagram Infographic Template for PowerPoint & Google Slides
Process
7-Level 3D Pyramid Infographic Diagram Template for PowerPoint & Google Slides
Pyramid
Five Up Arrow Infographic Diagram Template for PowerPoint & Google Slides
Arrow
Creative Layered Oval Infographic Diagram Template for PowerPoint & Google Slides
Process
Six Section Circular Infographic Diagram Template for PowerPoint & Google Slides
Circular
Section Diagram Elements Infographic Template for PowerPoint & Google Slides
Process

Cause and Effect Diagram Infographic Template for PowerPoint & Google Slides
Bar/Column
Eight Segment Star Diagram Infographic Template for PowerPoint & Google Slides
Process
Four-Stage Linear Infographic Diagram Template for PowerPoint & Google Slides
Process
Three-Circle Diagram Infographic Template for PowerPoint & Google Slides
Circular
Five Stage Process Diagram Infographic Template for PowerPoint & Google Slides
Process
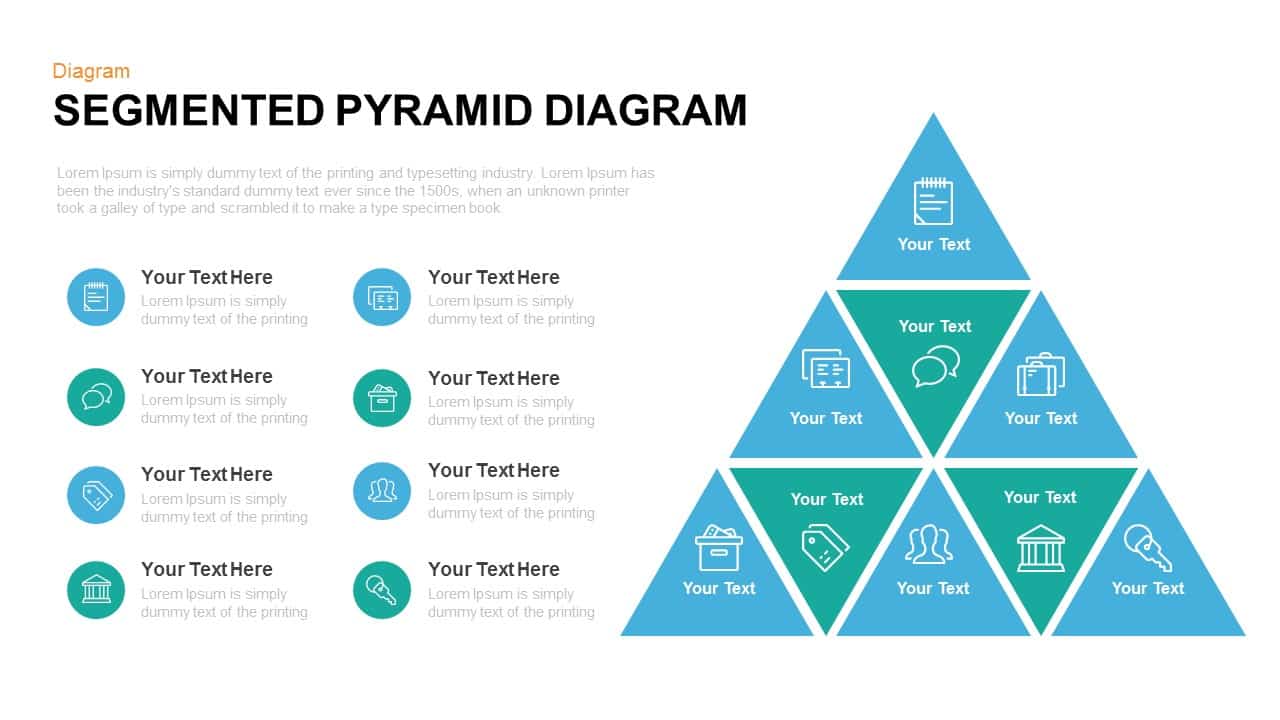
Segmented Pyramid Diagram Infographic Template for PowerPoint & Google Slides
Pyramid
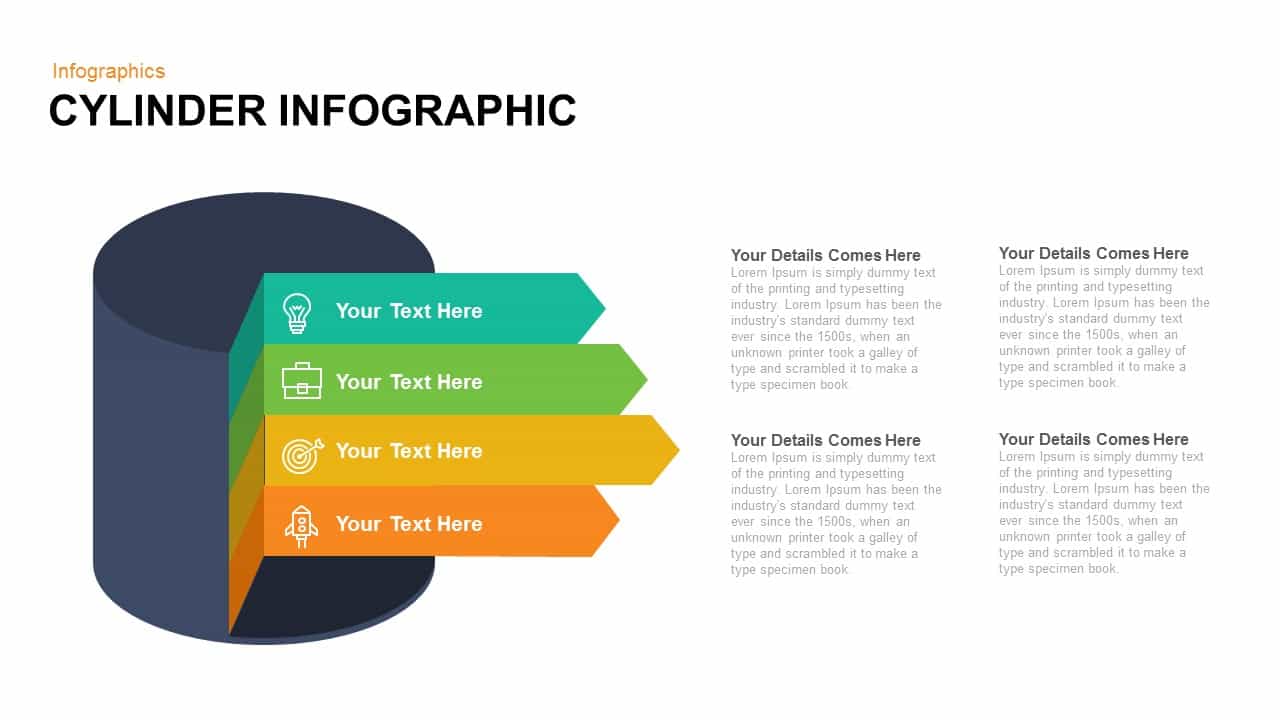
Cylinder Infographic Diagram template for PowerPoint & Google Slides
Process
Four-Section Arrow Infographic Diagram Template for PowerPoint & Google Slides
Arrow
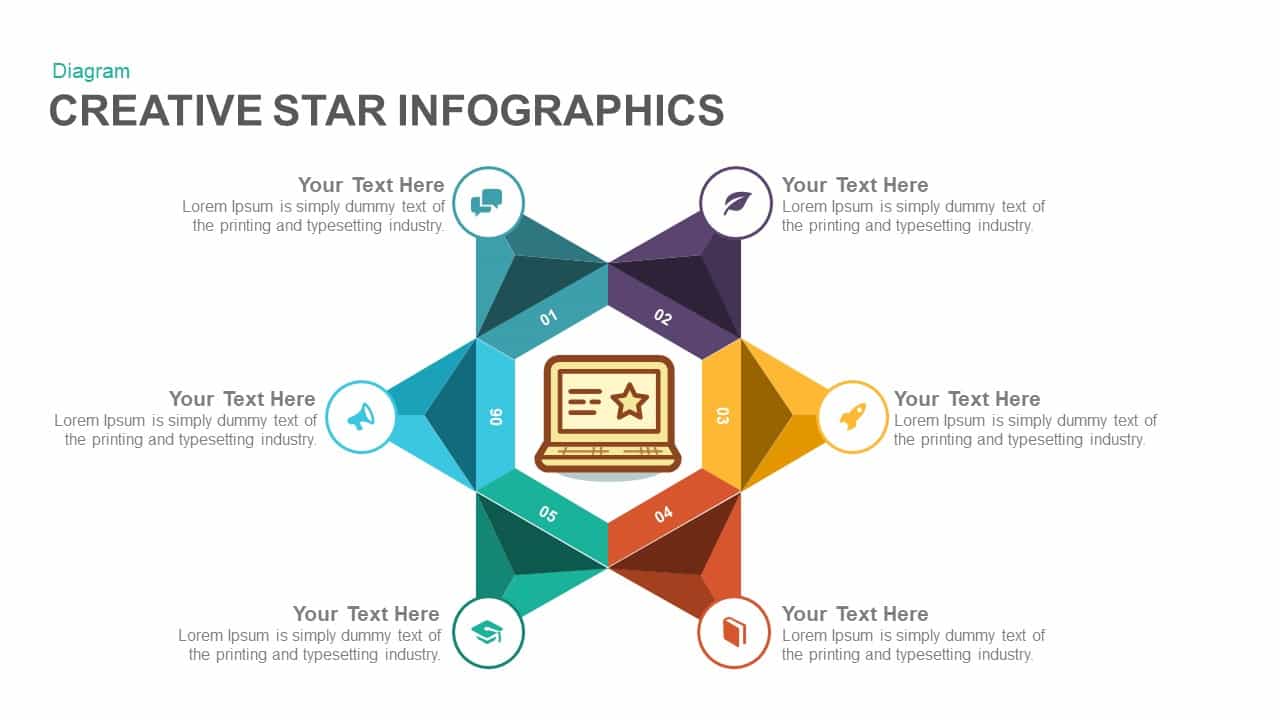
Six-Section Star Infographic Diagram Template for PowerPoint & Google Slides
Circular
Eight-Step Circular Diagram Infographic Template for PowerPoint & Google Slides
Circular
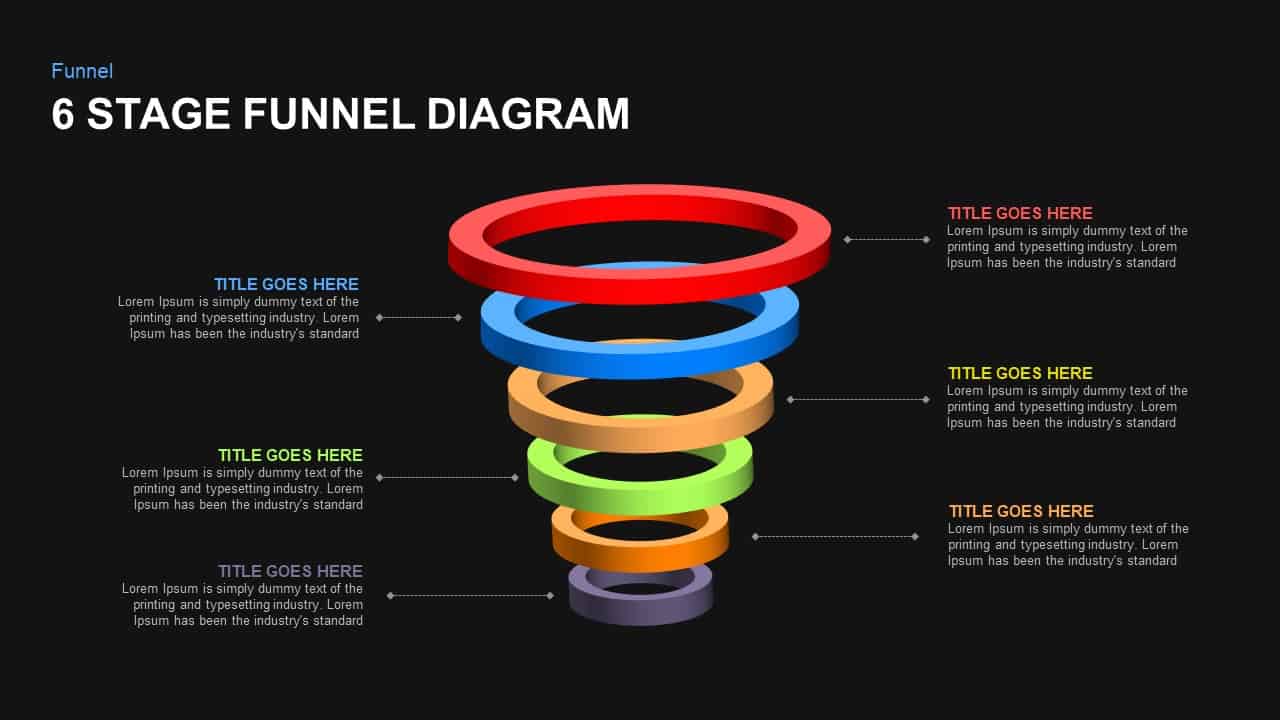
6-Stage Funnel Diagram Infographic Template for PowerPoint & Google Slides
Funnel
Cluster Analysis Infographic Diagram Template for PowerPoint & Google Slides
Business
3D Conversion Funnel Diagram Infographic Template for PowerPoint & Google Slides
Funnel
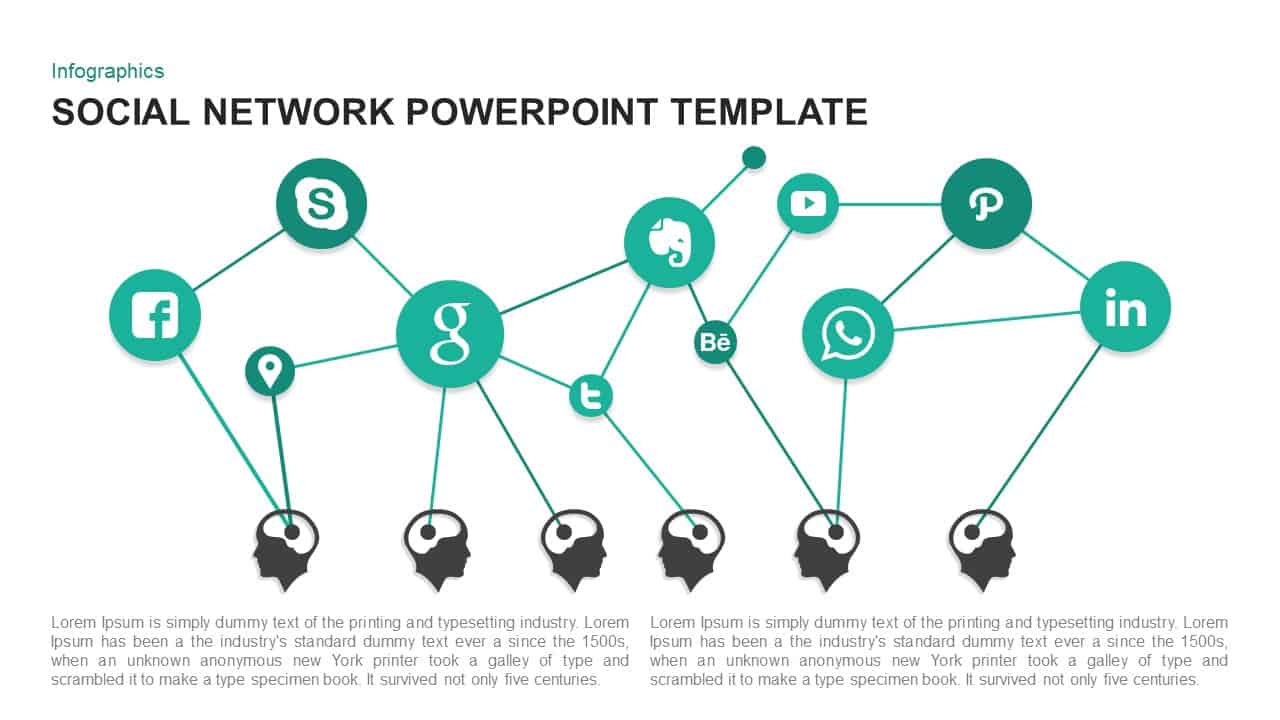
Social Network Infographic Diagram Template for PowerPoint & Google Slides
Digital Marketing
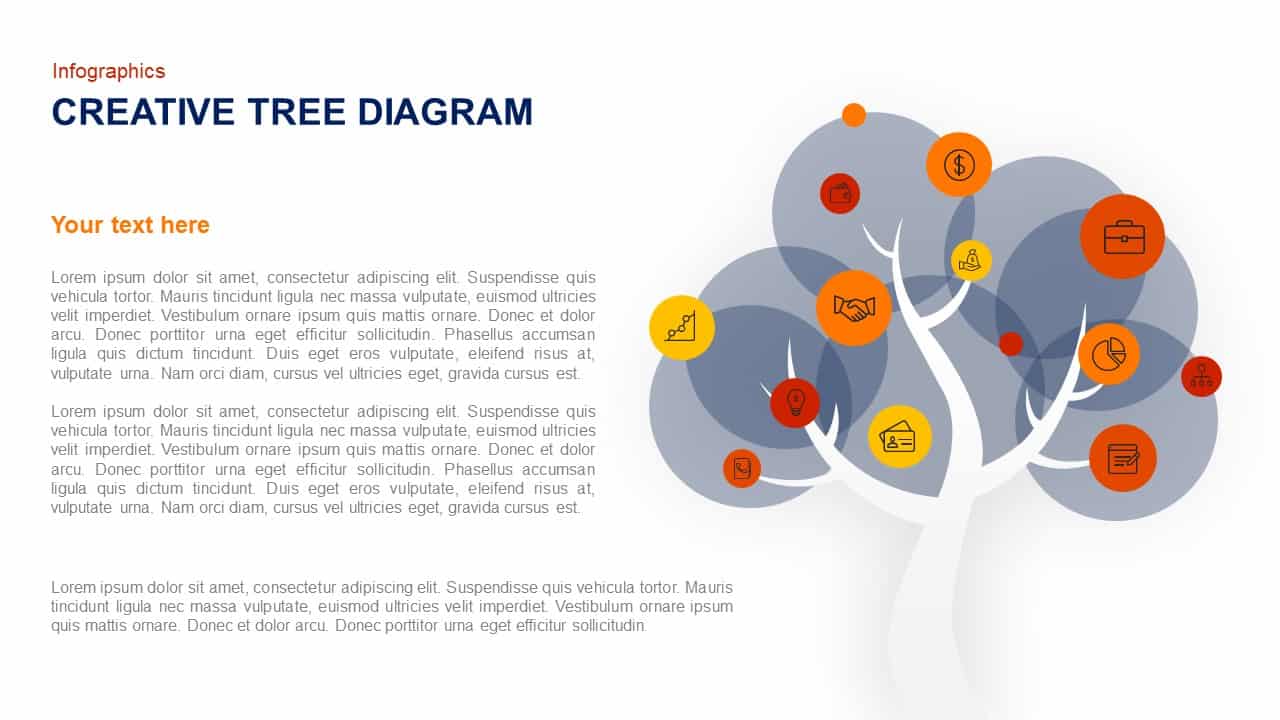
Creative Tree Infographic Diagram Template for PowerPoint & Google Slides
Infographics
Five-Stage Circular Infographic Diagram Template for PowerPoint & Google Slides
Process
Four-Stage Circular Diagram Infographic Template for PowerPoint & Google Slides
Circular
Business Services Infographic Diagram Template for PowerPoint & Google Slides
Infographics
4 Factors Circular Diagram Infographic Template for PowerPoint & Google Slides
Circular
Circular CRM Process Diagram Infographic Template for PowerPoint & Google Slides
Circular
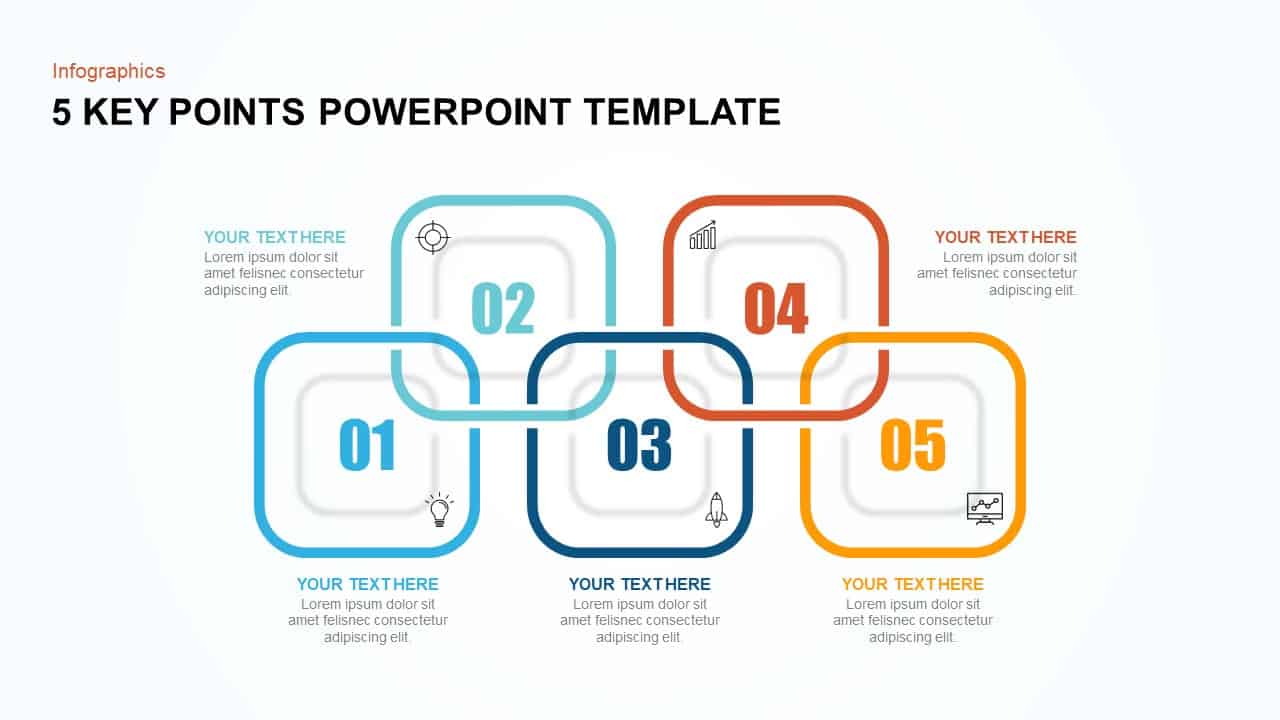
5 Key Points Infographic Diagram Template for PowerPoint & Google Slides
Process
Circular Three-Step Infographic Diagram Template for PowerPoint & Google Slides
Circular
Six-Stage Star Diagram Infographic Template for PowerPoint & Google Slides
Process
Four-Stage Funnel Diagram Infographic Template for PowerPoint & Google Slides
Funnel
3D Block Arrow Infographic Diagram Template for PowerPoint & Google Slides
Arrow
6-Step Circular Diagram Infographic Template for PowerPoint & Google Slides
Circular
8-Step Circular Gear Infographic Diagram Template for PowerPoint & Google Slides
Circular
Creative Tree Diagram Infographic Template for PowerPoint & Google Slides
Decision Tree
Six Sigma 6S Process Infographic Diagram Template for PowerPoint & Google Slides
Process
Six-Step Tree Diagram Infographic Template for PowerPoint & Google Slides
Infographics
Six-Circle Process Infographic Diagram Template for PowerPoint & Google Slides
Circular
Four-Step Puzzle Diagram Infographic Template for PowerPoint & Google Slides
Process
Four-Stage Funnel Diagram Infographic Template for PowerPoint & Google Slides
Funnel
Modern Gear Venn Diagram Infographic Template for PowerPoint & Google Slides
Comparison
6-Part Circular Gear Infographic Diagram Template for PowerPoint & Google Slides
Process

Four Section Infographic Diagram Template for PowerPoint & Google Slides
Circular
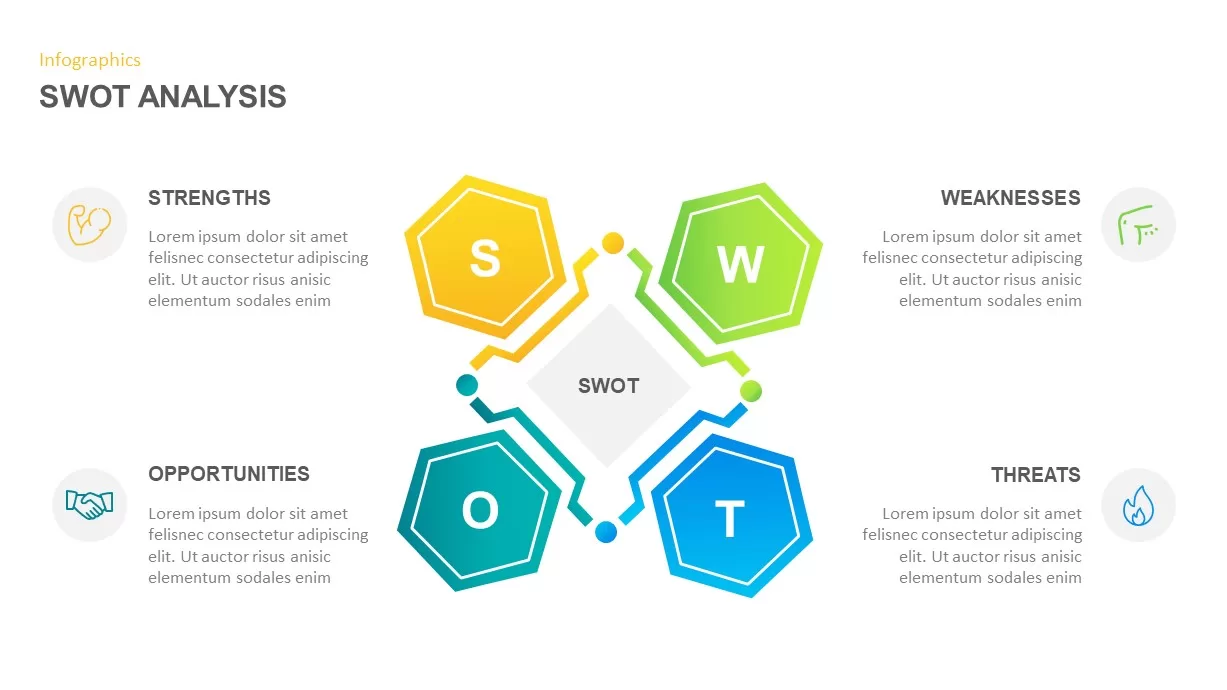
SWOT Analysis Infographic Diagram Template for PowerPoint & Google Slides
SWOT
Circular CRM Process Infographic Diagram Template for PowerPoint & Google Slides
Circular
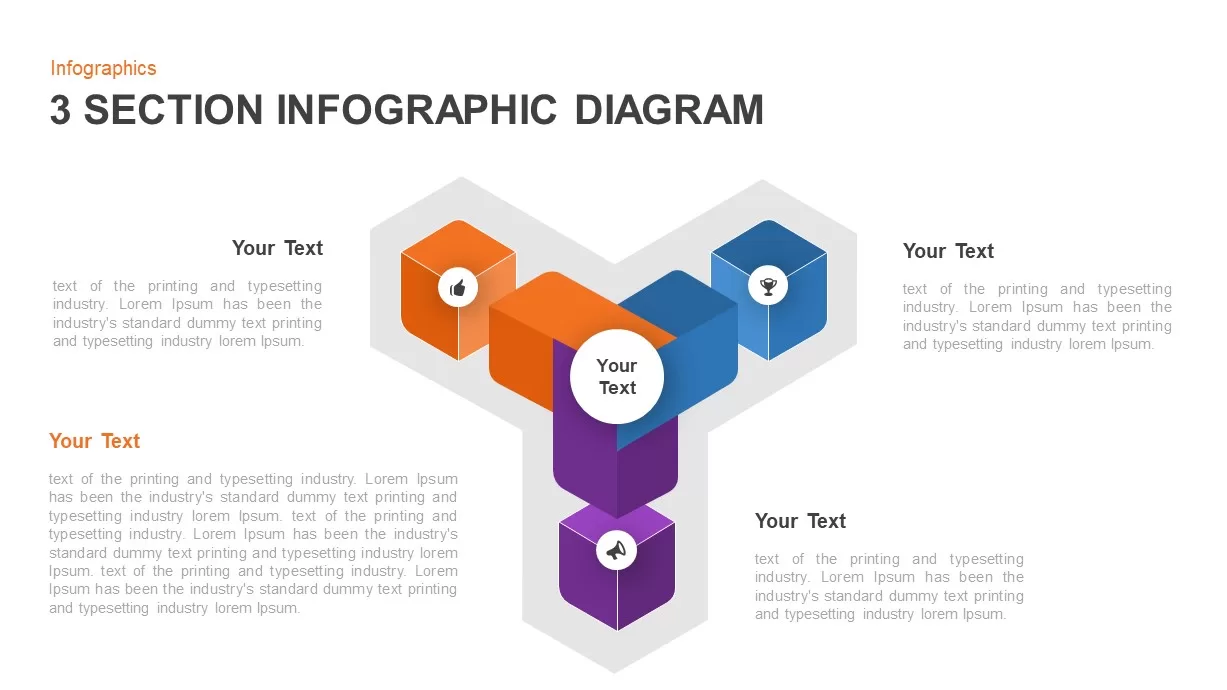
3 Section Infographic Diagram Template for PowerPoint & Google Slides
Process
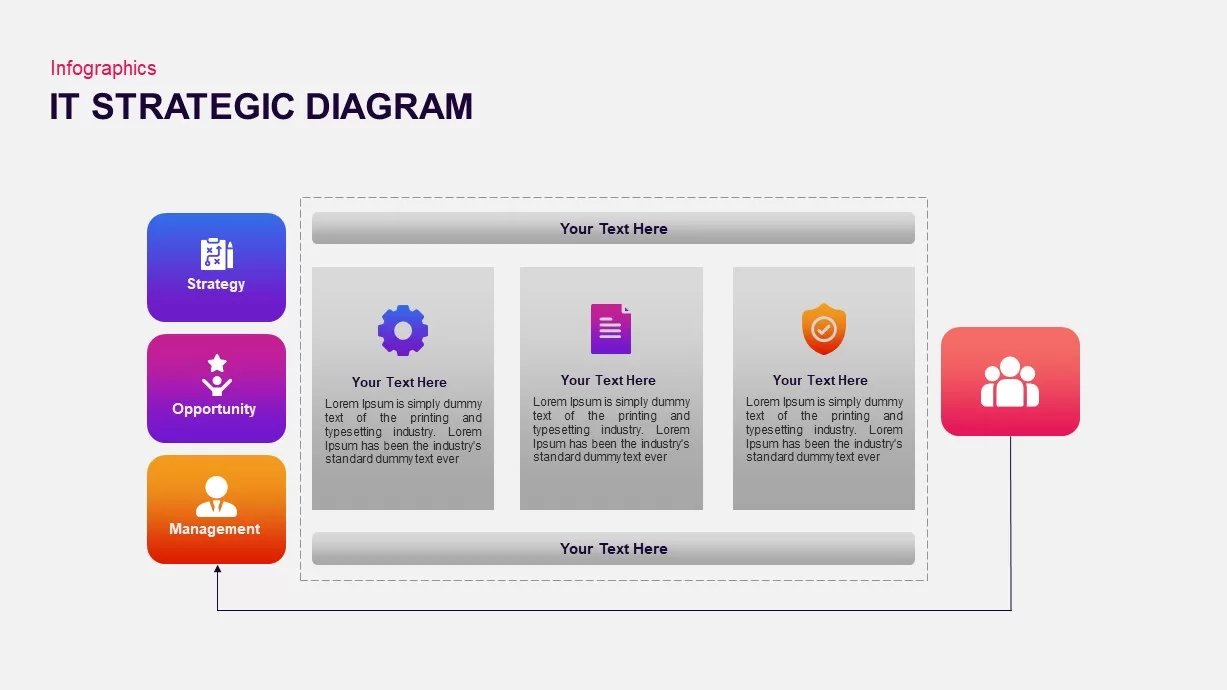
IT Strategic Diagram Infographic Pack Template for PowerPoint & Google Slides
Business Strategy
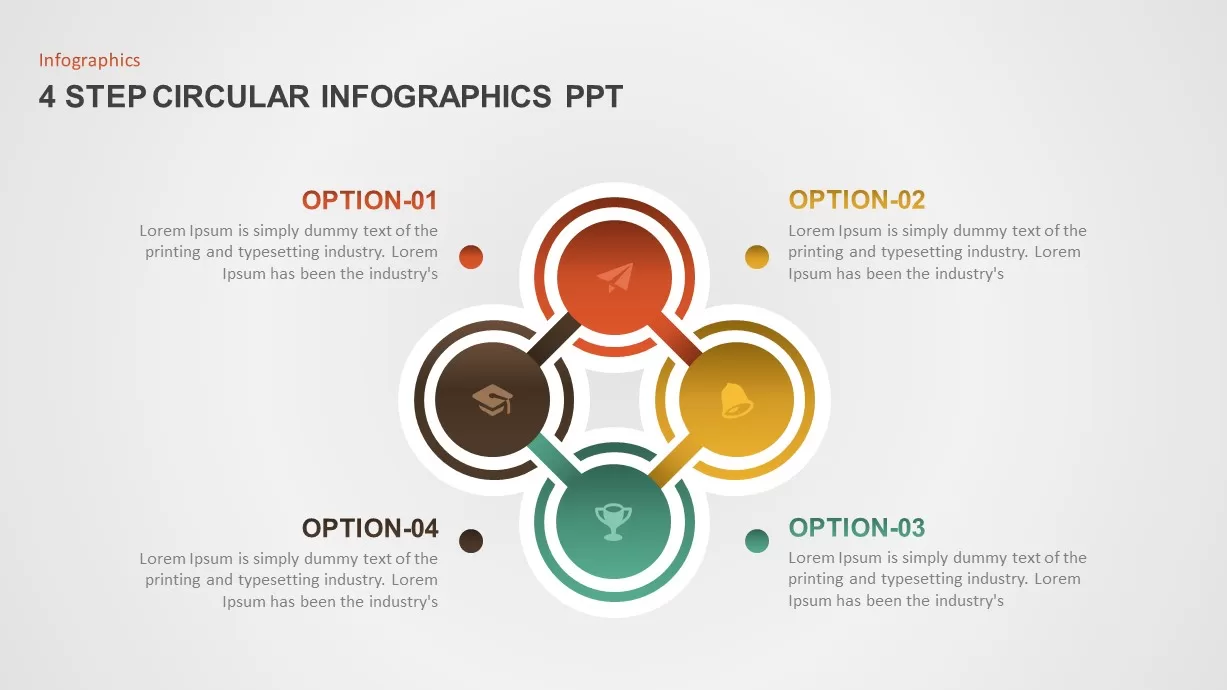
4-Step Circular Infographic Diagram Template for PowerPoint & Google Slides
Circular
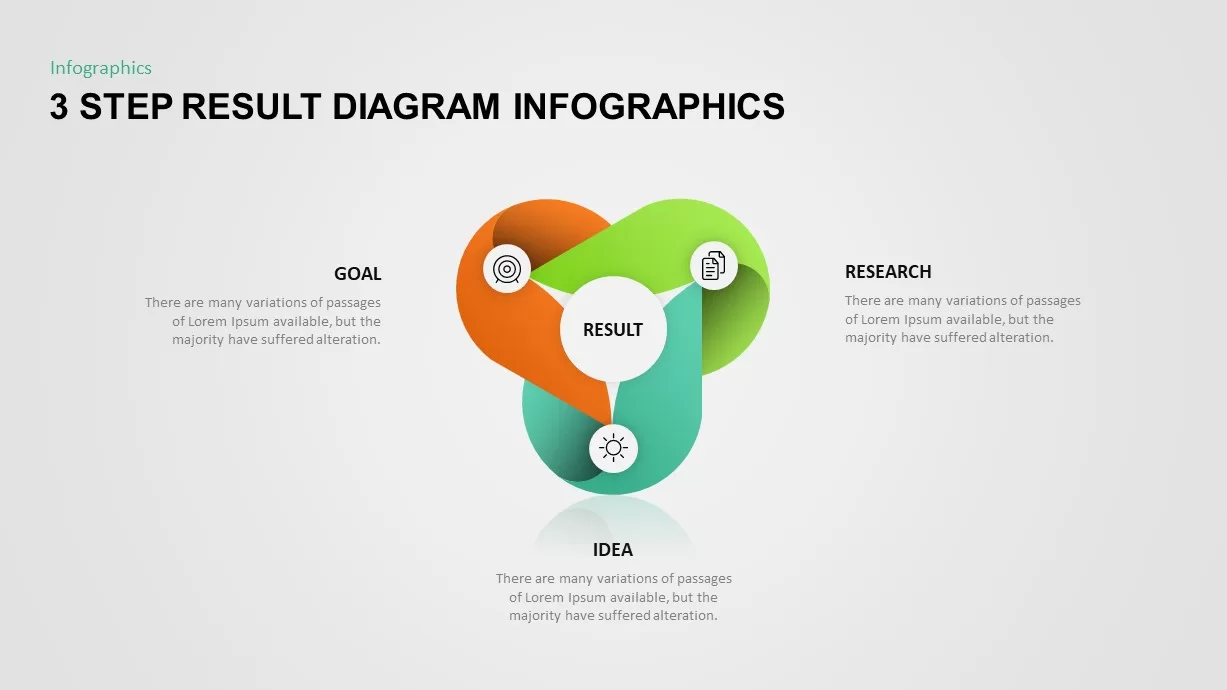
Three-Step Result Diagram Infographic Template for PowerPoint & Google Slides
Process
Eight-Node Mind Map Infographic Diagram Template for PowerPoint & Google Slides
Mind Maps
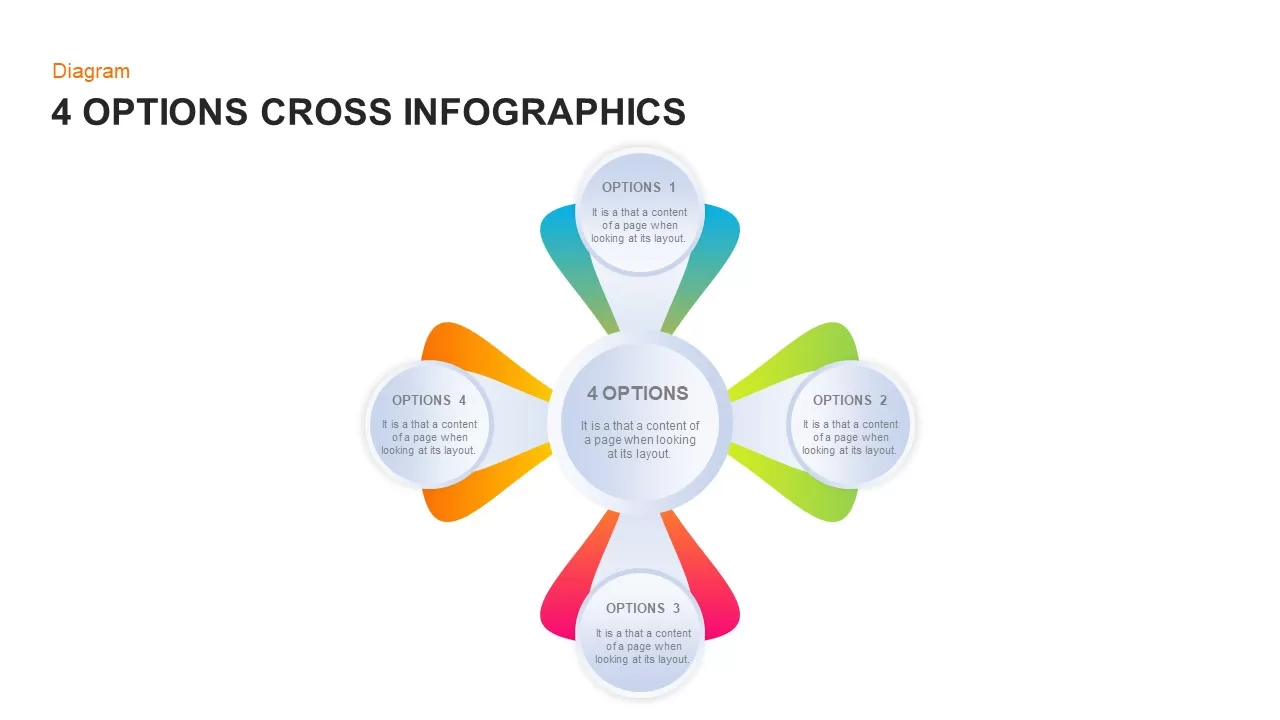
Four-Option Cross Infographic Diagram Template for PowerPoint & Google Slides
Comparison
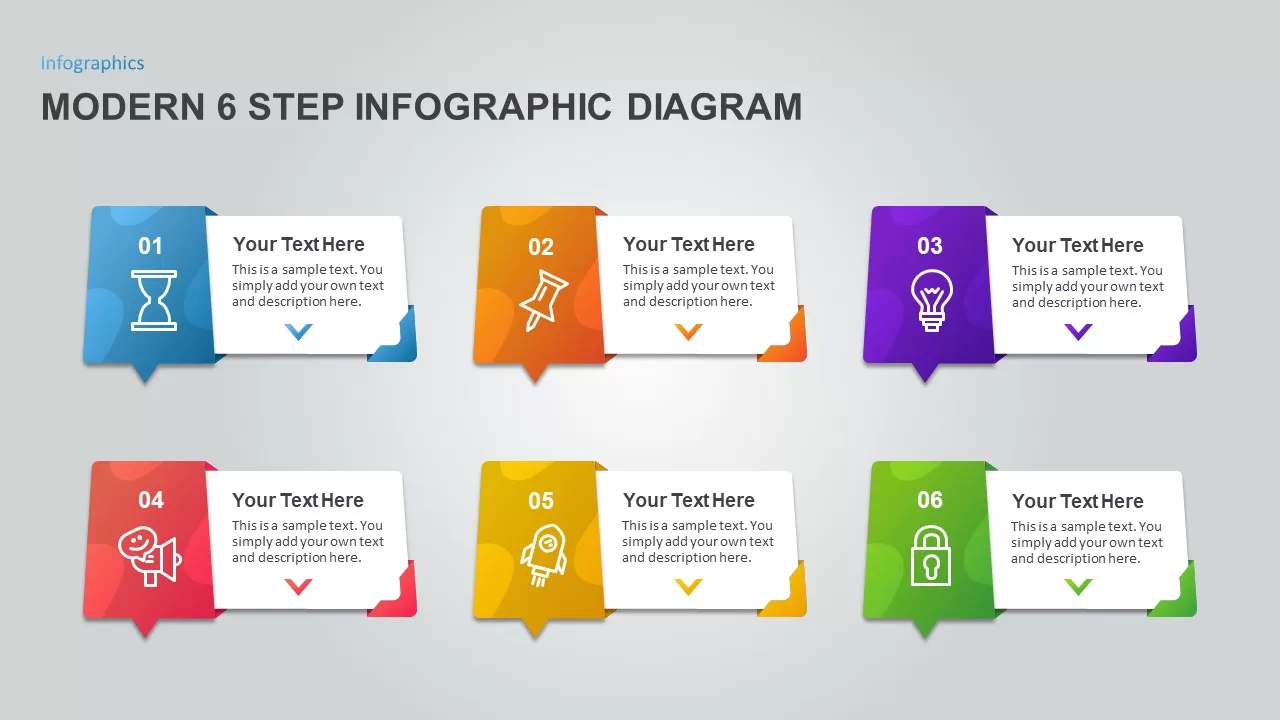
Modern 6 Step Infographic Diagram template for PowerPoint & Google Slides
Process
Gauge Shape 5-Step Infographic Diagram Template for PowerPoint & Google Slides
Process
Creative Tree Diagram Infographic Template for PowerPoint & Google Slides
Decision Tree
Sales Funnel Infographic Diagram Template for PowerPoint & Google Slides
Funnel
Affinity Diagram Infographic Template for PowerPoint & Google Slides
Business
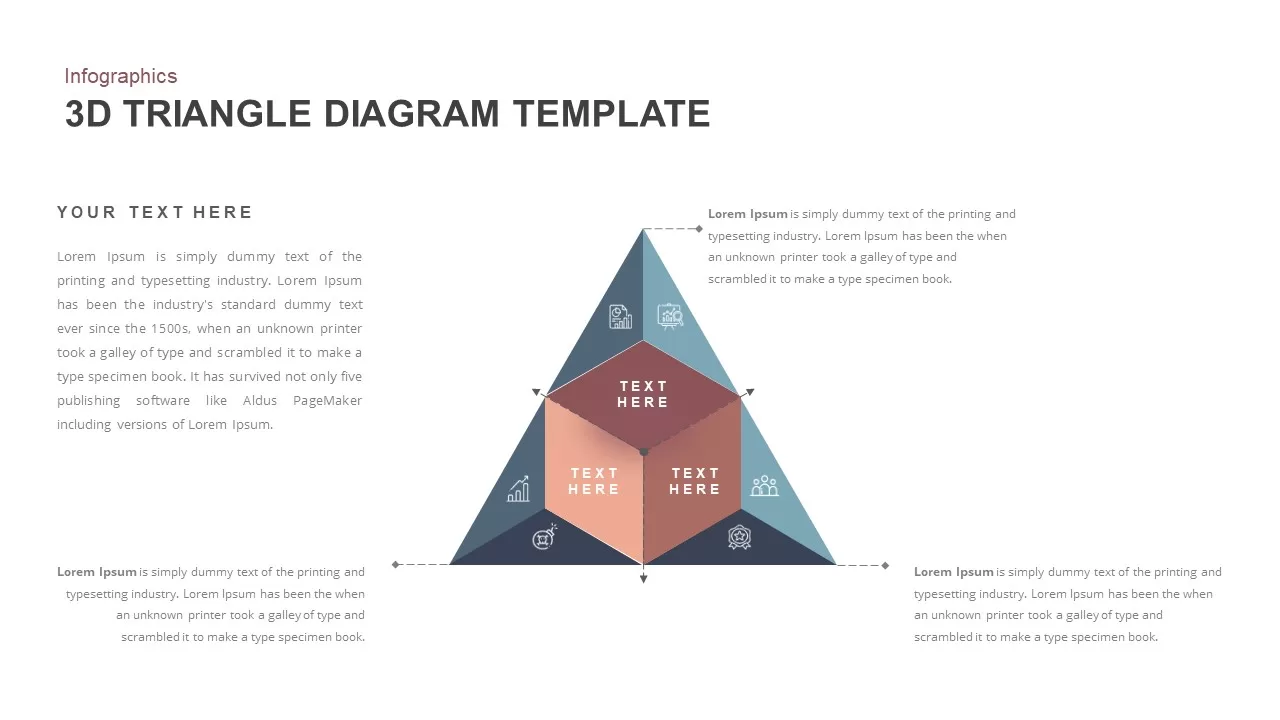
3D Triangle Diagram Infographic Template for PowerPoint & Google Slides
Pyramid
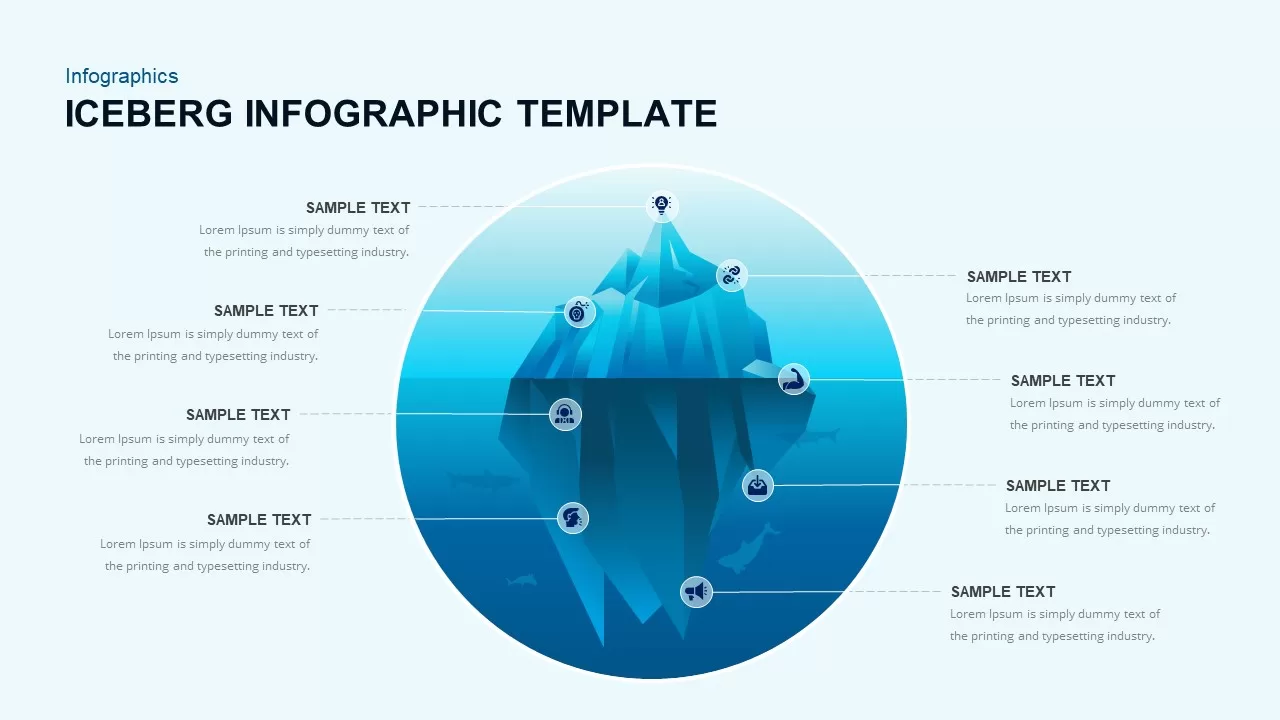
Iceberg Infographic Diagram template for PowerPoint & Google Slides
Opportunities Challenges
Structured Mind Map Infographic Diagram Template for PowerPoint & Google Slides
Mind Maps
Minimal Process Flow Diagram Infographic Template for PowerPoint & Google Slides
Process
Free Curved Arrow Infographic Diagram Template for PowerPoint & Google Slides
Arrow
Free
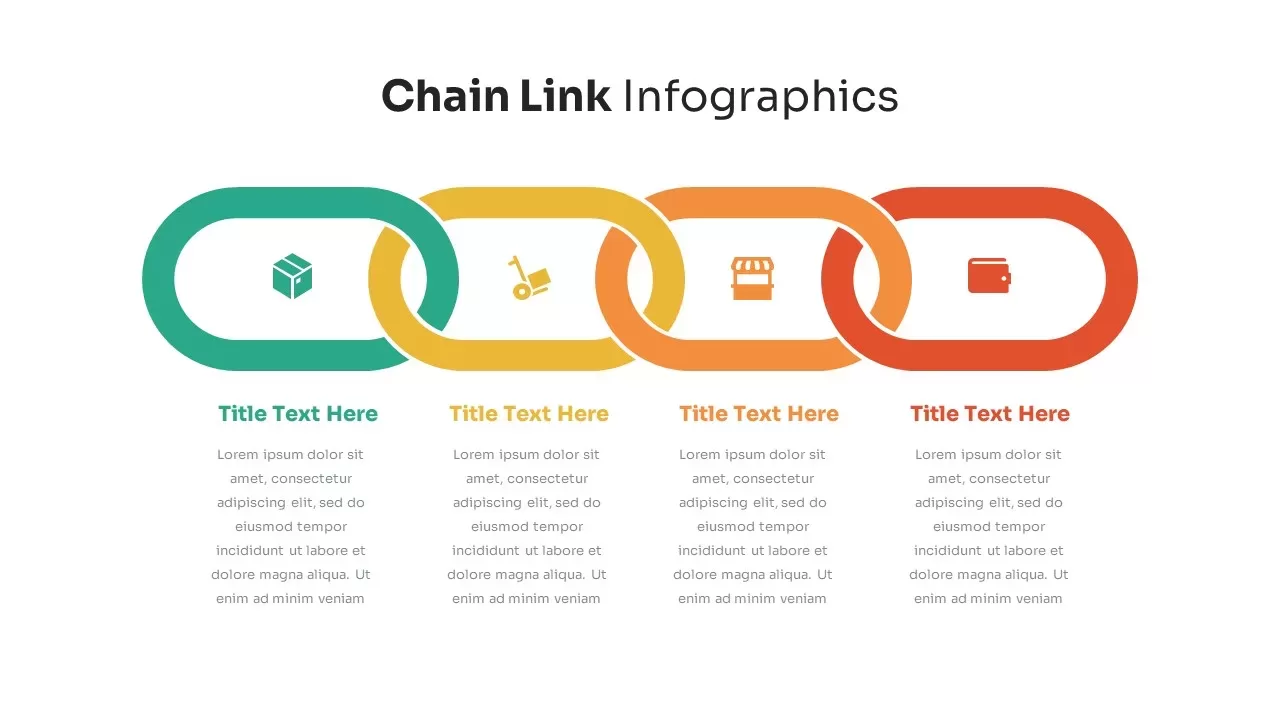
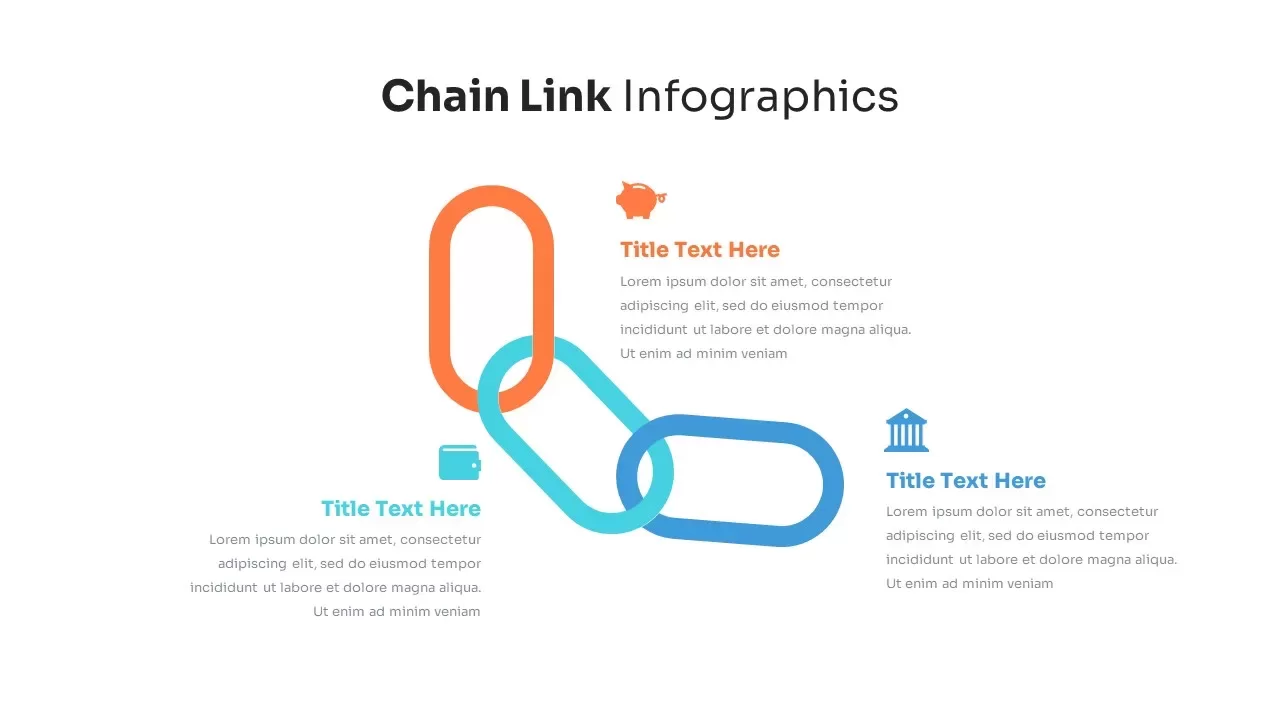
Chain Link Process Infographic Diagram Template for PowerPoint & Google Slides
Process
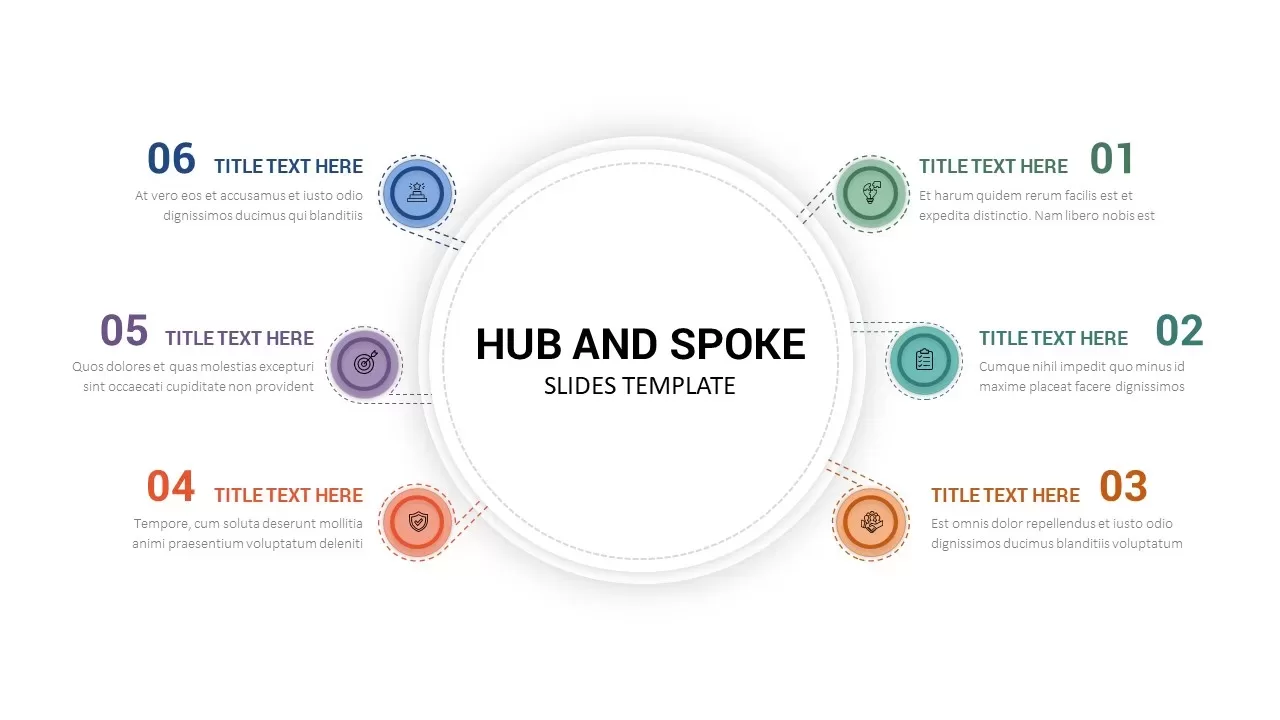
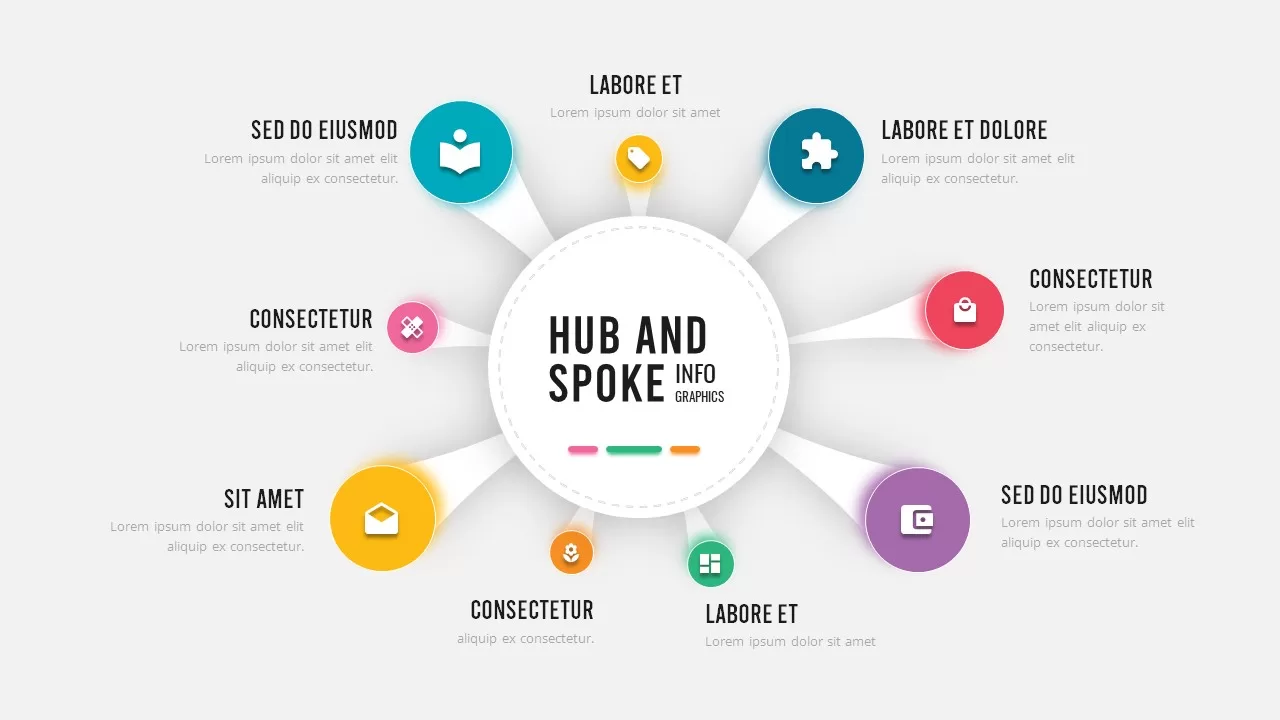
Hub & Spoke Infographic Diagram Template for PowerPoint & Google Slides
Process
Chain Link Process Infographic Diagram Template for PowerPoint & Google Slides
Process
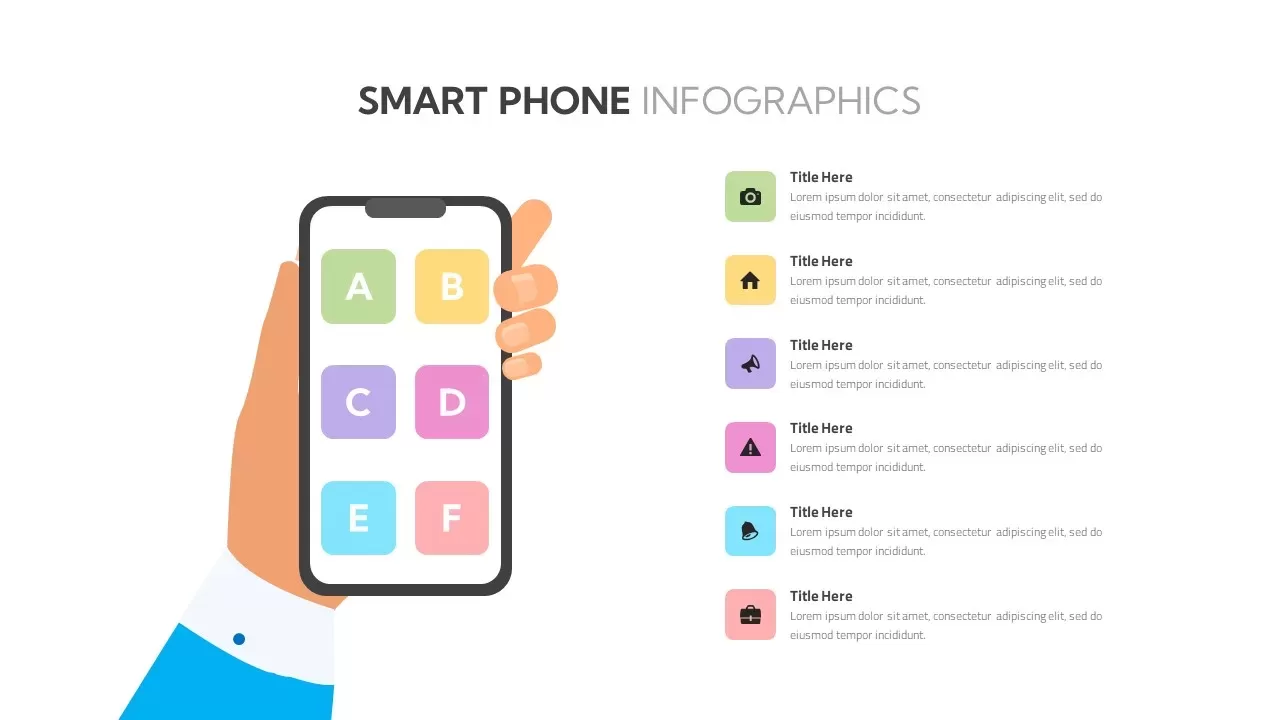
Smartphone Infographic Diagram Template for PowerPoint & Google Slides
Comparison
Chain Link Process Infographic Diagram Template for PowerPoint & Google Slides
Process
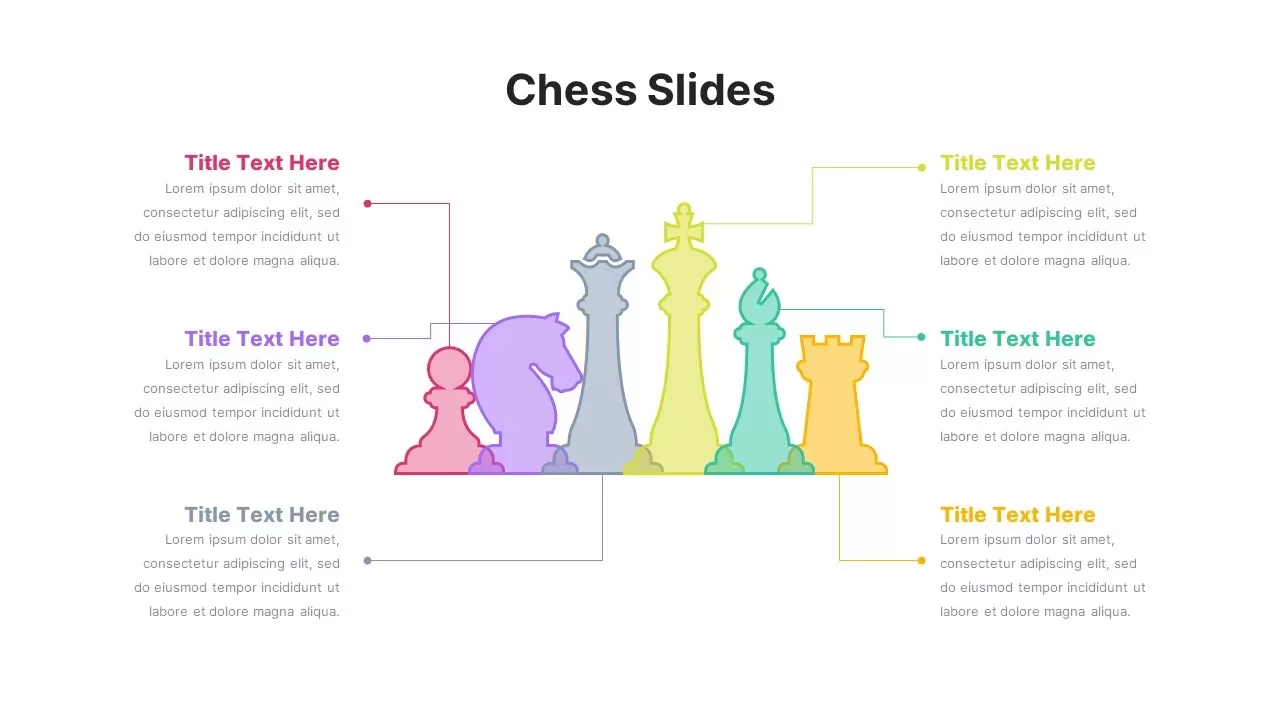
Modern Chess Infographic Diagram Template for PowerPoint & Google Slides
Comparison
Dynamic Hub-and-Spoke Infographic Diagram Template for PowerPoint & Google Slides
Circular
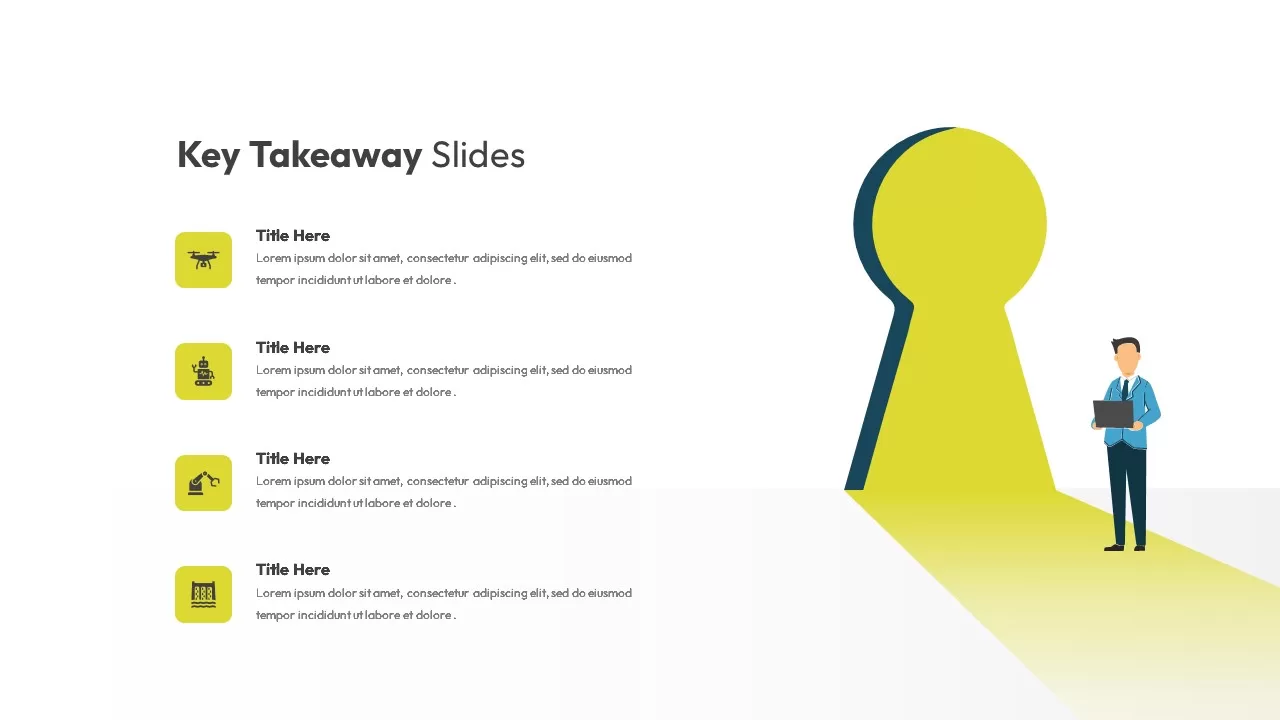
Key Takeaway Infographic Keyhole Diagram Template for PowerPoint & Google Slides
Process
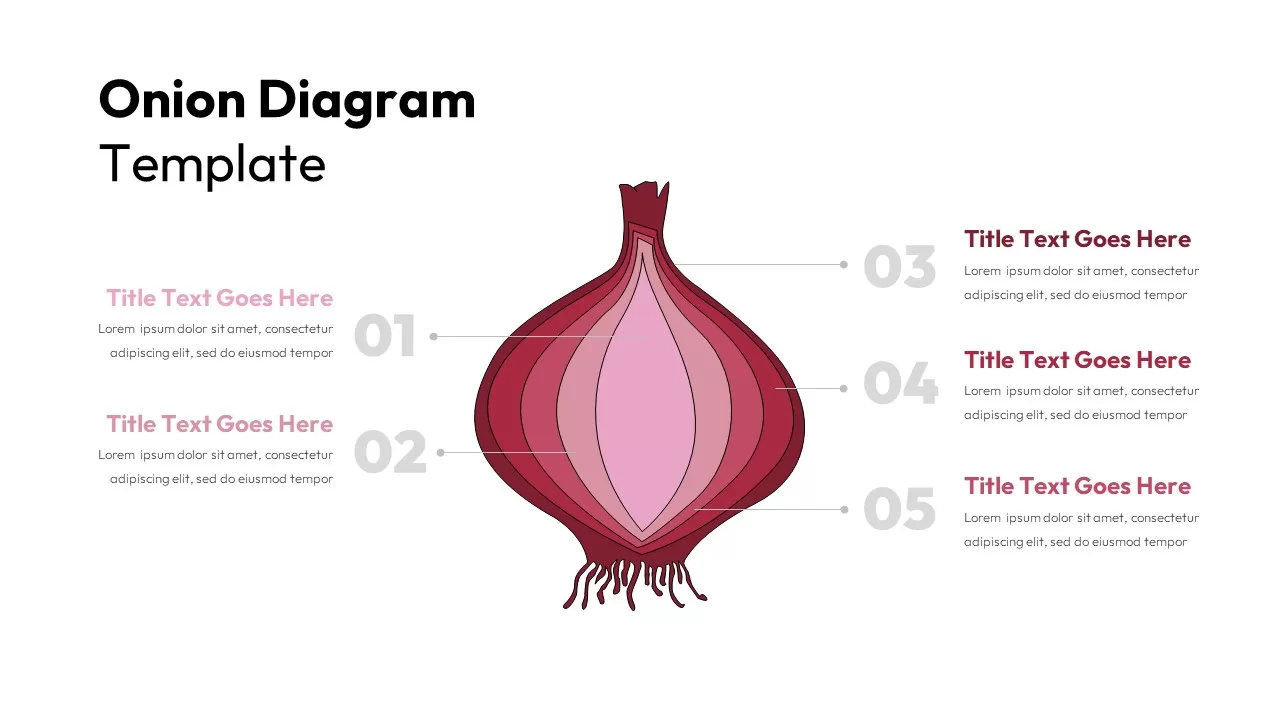
Five-Layer Onion Diagram Infographic Template for PowerPoint & Google Slides
Process
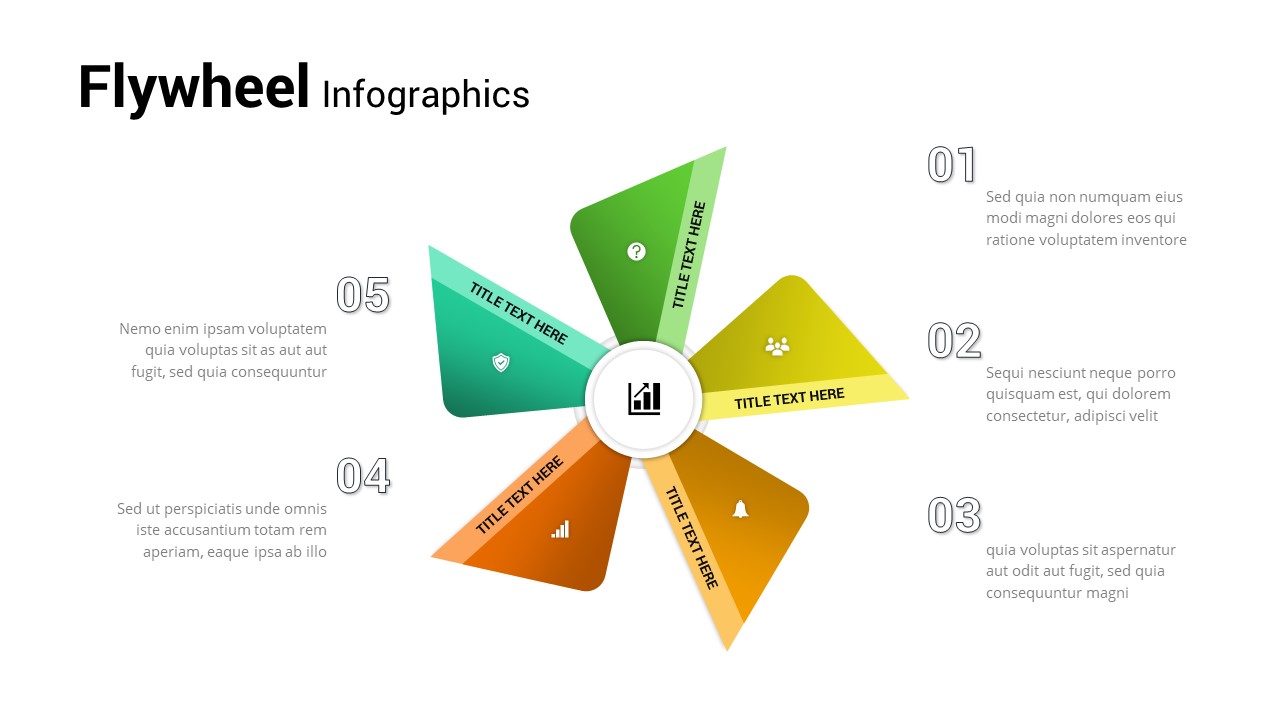
Five-Step Flywheel Infographic Diagram Template for PowerPoint & Google Slides
Process
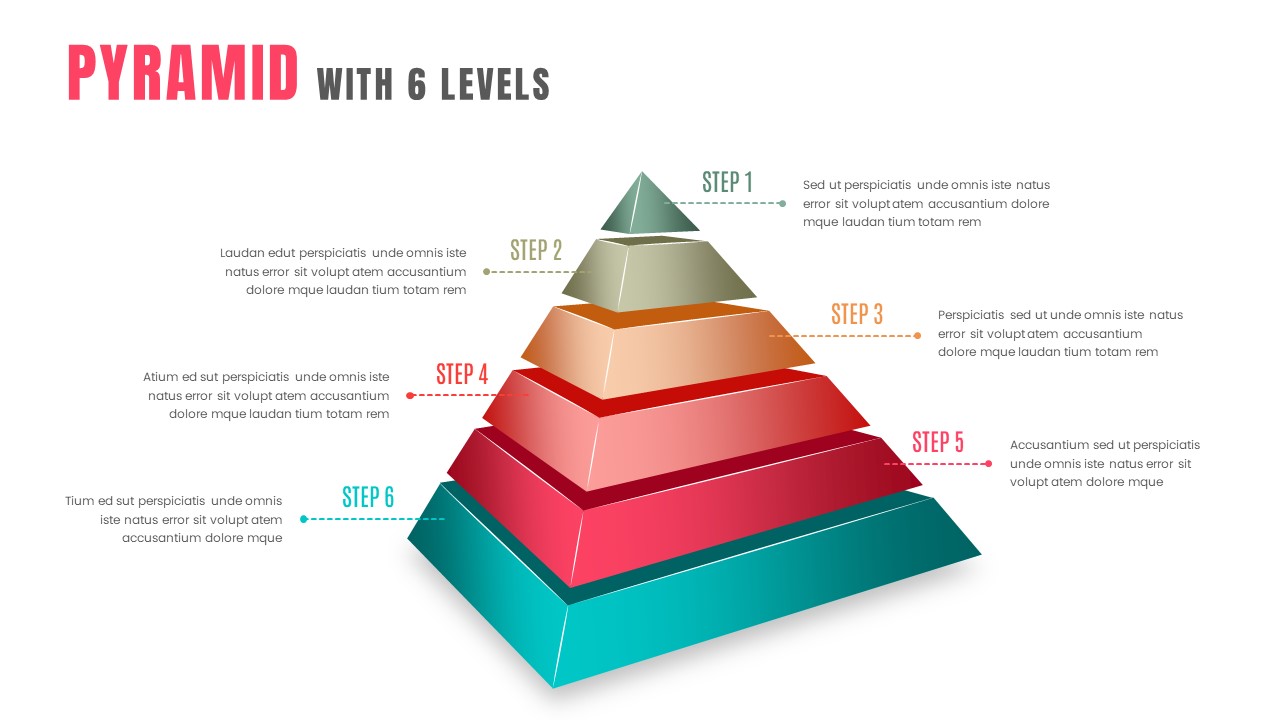
3D Six-Level Pyramid Diagram Infographic Template for PowerPoint & Google Slides
Pyramid
8 Circle Venn Diagram Infographic Design Template for PowerPoint & Google Slides
Circular
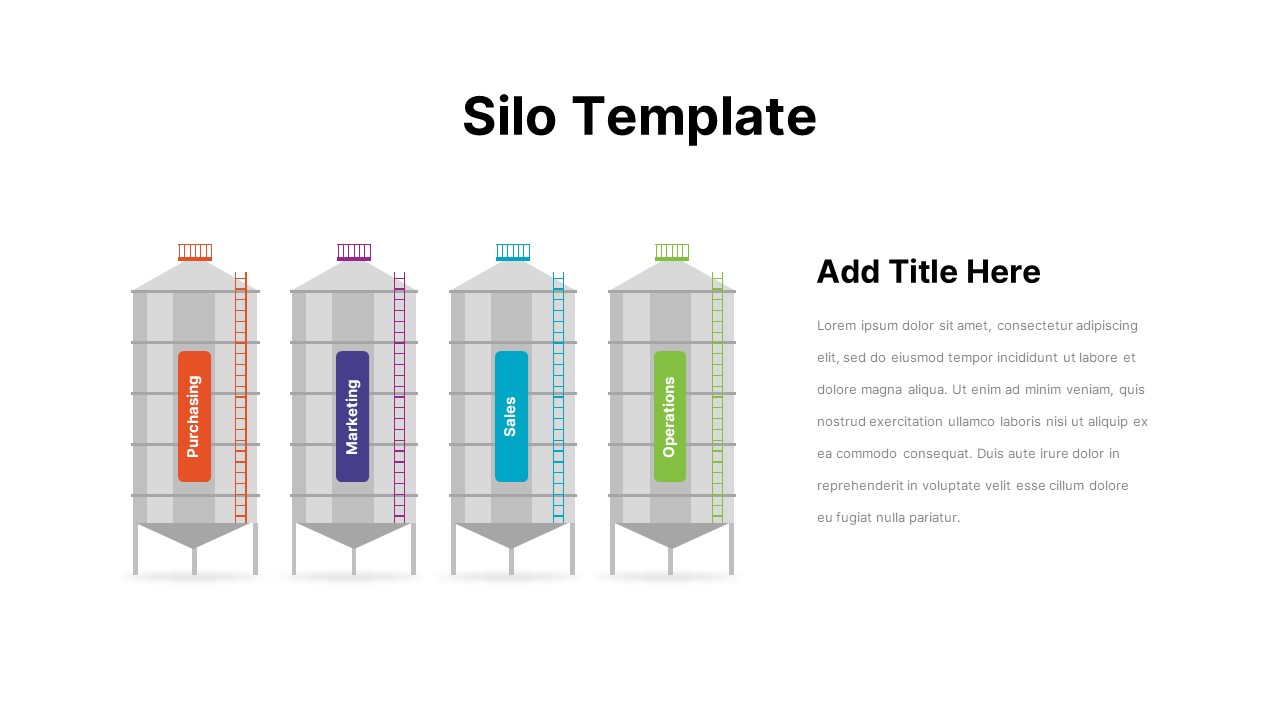
Business Silo Diagram Infographic Design Template for PowerPoint & Google Slides
Business
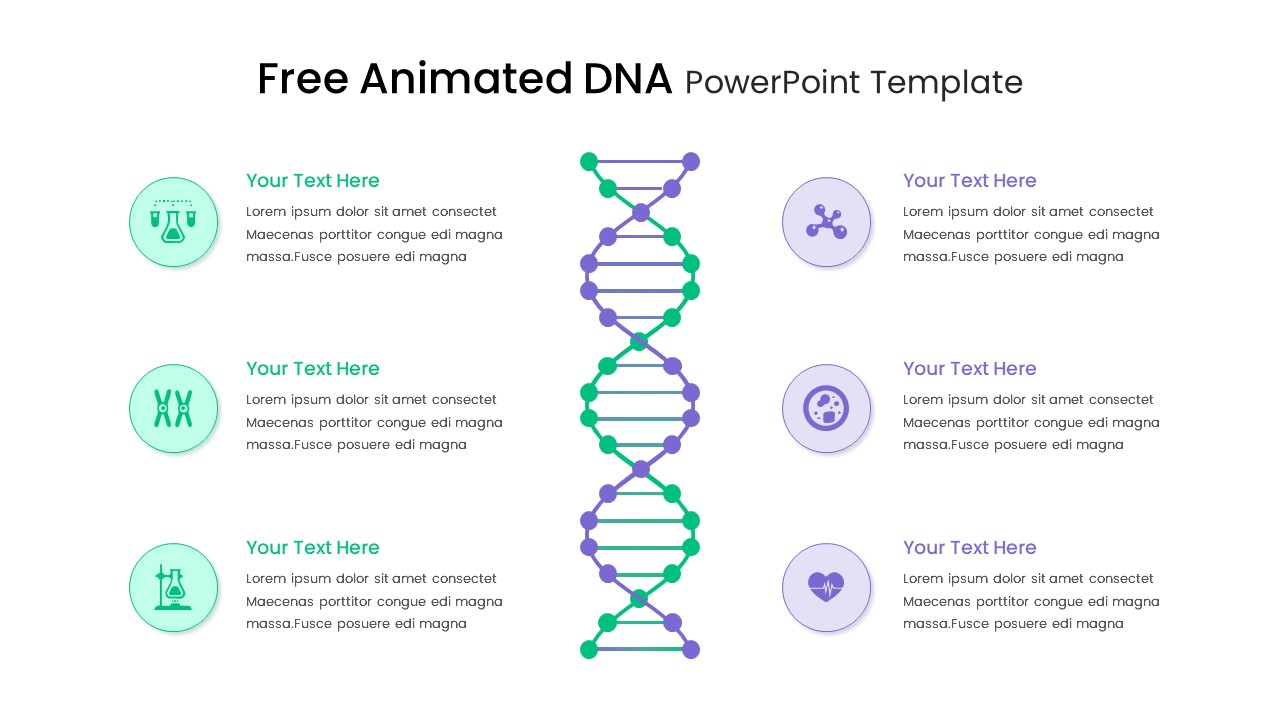
Free Animated DNA Infographic Diagram Template for PowerPoint & Google Slides
Infographics
Free
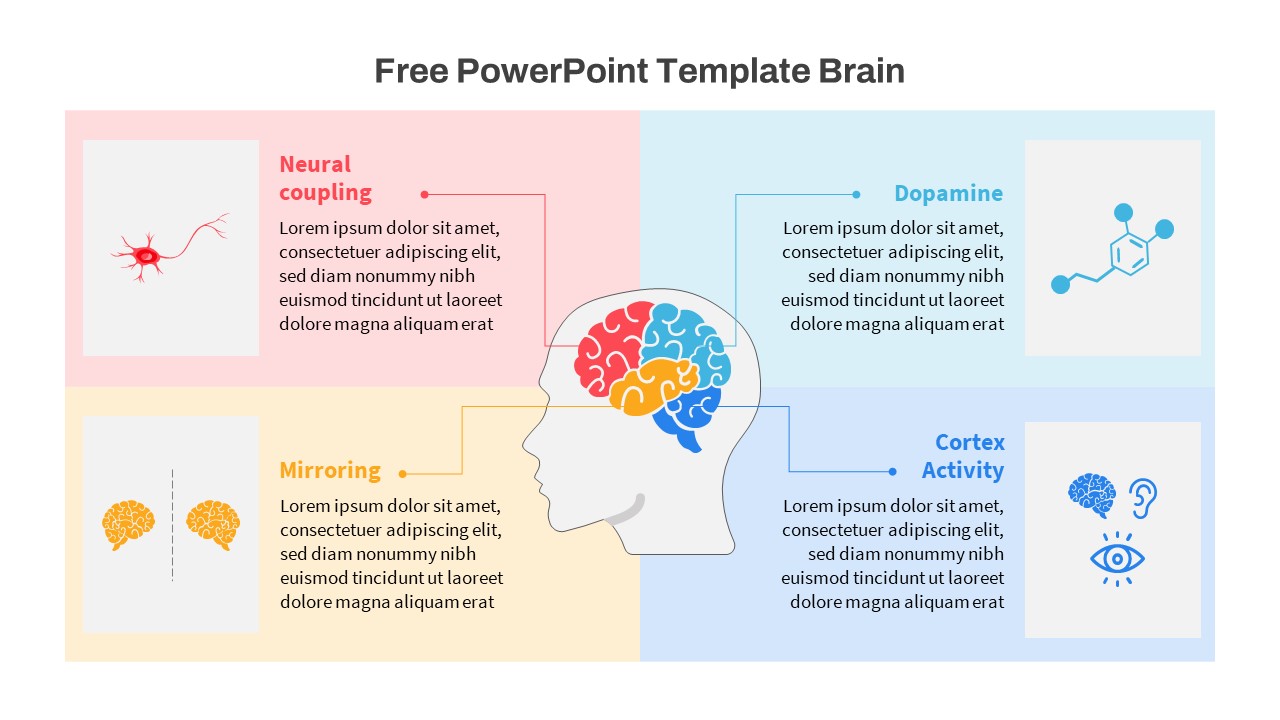
Free Brain Function Diagram Infographic Template for PowerPoint & Google Slides
Process
Free
Salience Model Venn Diagram Infographic Template for PowerPoint & Google Slides
Circular
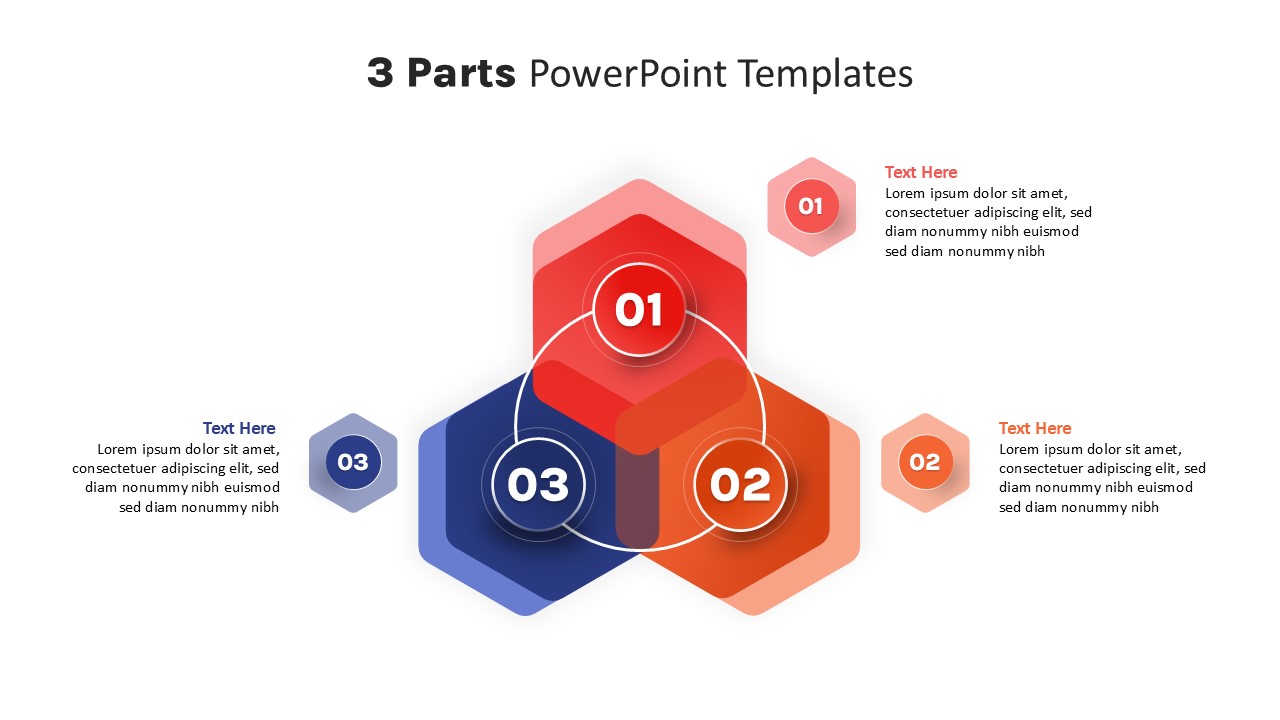
Three-Part Parts Infographic Diagram Template for PowerPoint & Google Slides
Process
HIV AIDS Infographic Diagram Slide Deck Template for PowerPoint & Google Slides
Graphics
Employer Branding Infographic Diagram Template for PowerPoint & Google Slides
Recruitment
4 Parts Infographic Diagram Template for PowerPoint & Google Slides
Process