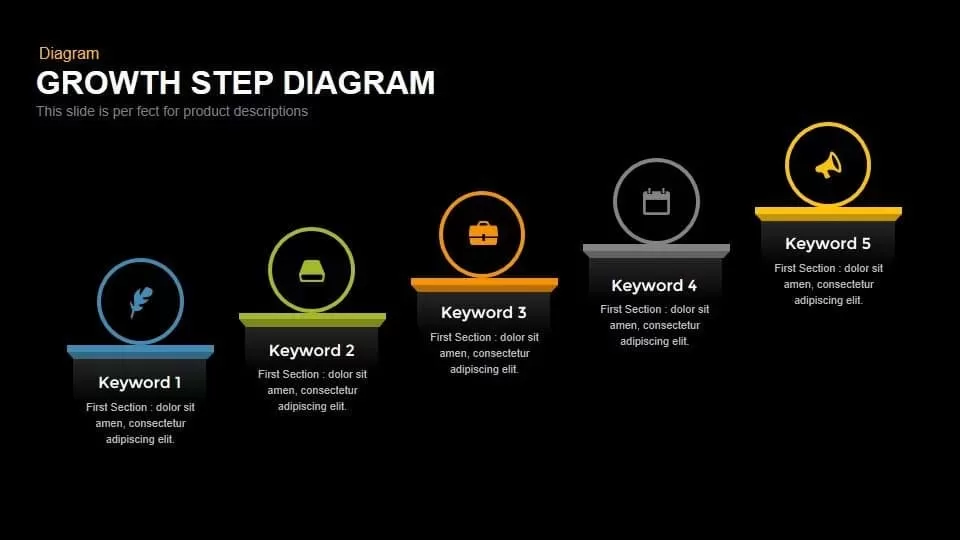
Growth Stage Diagram template for PowerPoint & Google Slides

Description
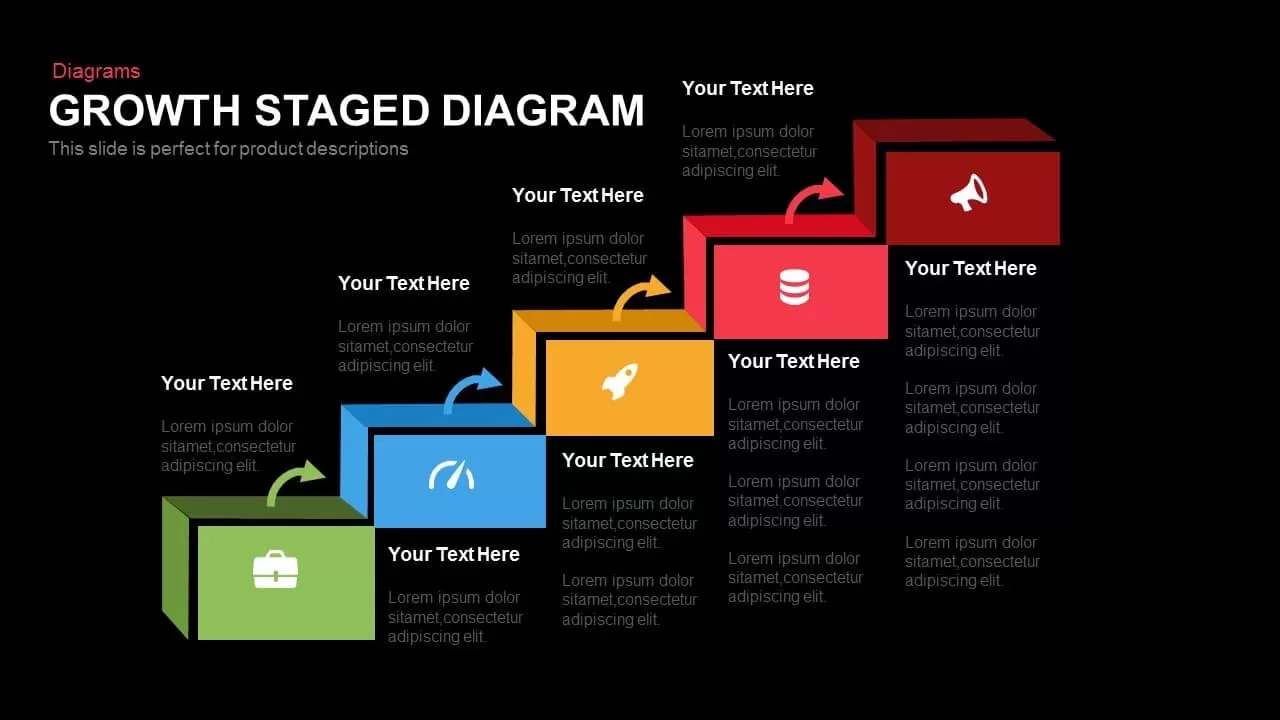
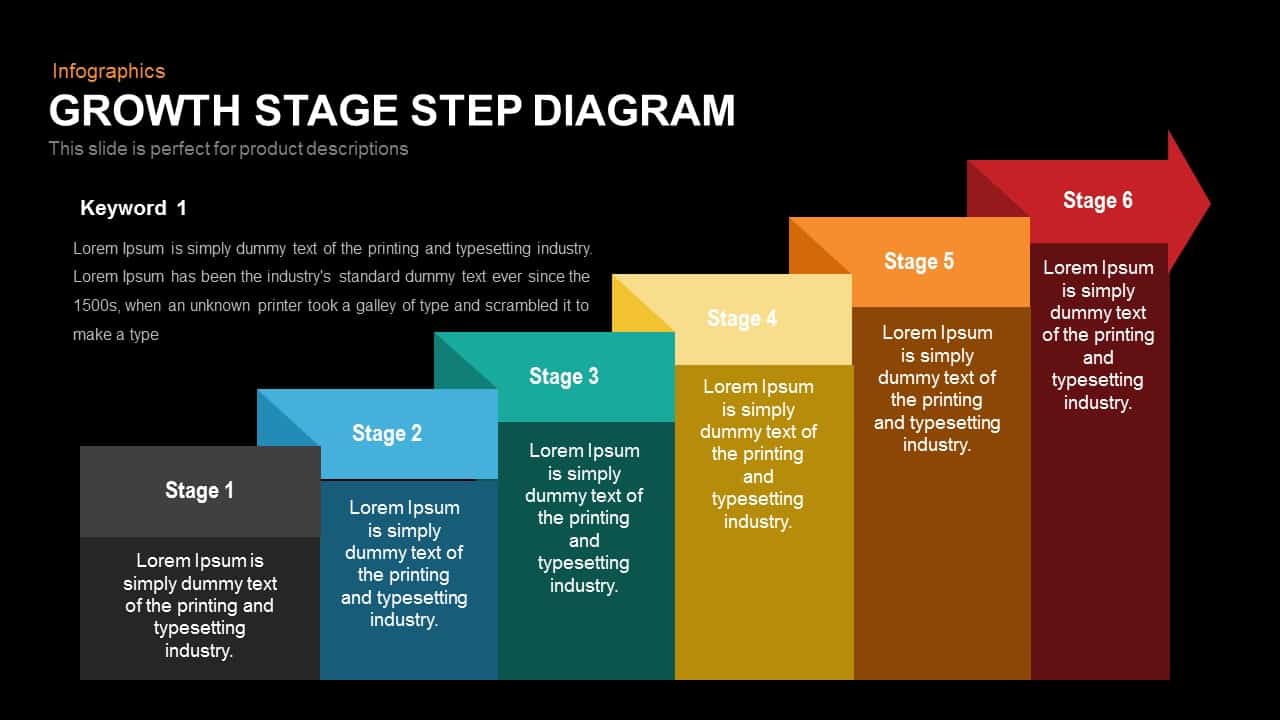
Visualize your company’s growth journey with this customizable six-stage step diagram template for PowerPoint and Google Slides. Each stage is represented by a distinct colored block—dark gray, blue, green, yellow, orange, and red arrow—arranged in ascending order to illustrate progression from Stage 1 through Stage 6. The clean layout features gradient shading and clear typography, ensuring readability across 16:9 and 4:3 slide ratios. Fully editable vector shapes allow you to modify colors, text, and position while maintaining alignment through smart guides and master slide controls.
Use the template to break down business growth phases, product development milestones, or strategic objectives over time. Customize each block’s label and description to reflect KPIs, deliverables, or performance indicators. Adjust block sizes or duplicate steps to accommodate different processes. With built-in drag-and-drop icons and free fonts, you can enrich your slides with visuals and maintain brand consistency by applying theme color palettes in a single click. The high-resolution design ensures crisp printing and on-screen clarity, while editable connectors can be switched between solid and dashed lines to represent varying levels of dependency or risk.
Ideal for executive presentations, investor pitches, strategic planning workshops, and training sessions, this growth stage diagram streamlines complex information into an engaging visual narrative. Slide notes and annotation areas support additional explanations, and the vector-based elements scale seamlessly for handouts or posters. Whether you’re illustrating startup growth cycles, marketing funnel stages, or training modules, this slide template enables you to communicate sequential data clearly, helping audiences grasp core concepts at a glance and keep stakeholders aligned. Use the template to highlight key metrics and annotate each stage with dates or performance trends for deeper context.
Who is it for
Project managers, business strategists, marketing leaders, startup founders, and operations teams will find this slide invaluable for outlining growth phases and strategic milestones. It’s perfect for board meetings, investor updates, quarterly reviews, and training workshops where clear step-by-step visuals drive engagement and understanding.
Other Uses
Beyond growth mapping, repurpose this step diagram to illustrate product roadmaps, recruitment processes, process improvement initiatives, or educational modules. Swap block labels and colors to showcase KPI cascades, departmental rollouts, or phased project launches.
Login to download this file

Item ID
SB00216
Related Templates

Five-Step Growth Stage Staircase Diagram Template for PowerPoint & Google Slides
Process
Three-Stage S Curve Growth Diagram Template for PowerPoint & Google Slides
Process

Growth Arrow for Progress & Growth template for PowerPoint & Google Slides
Arrow

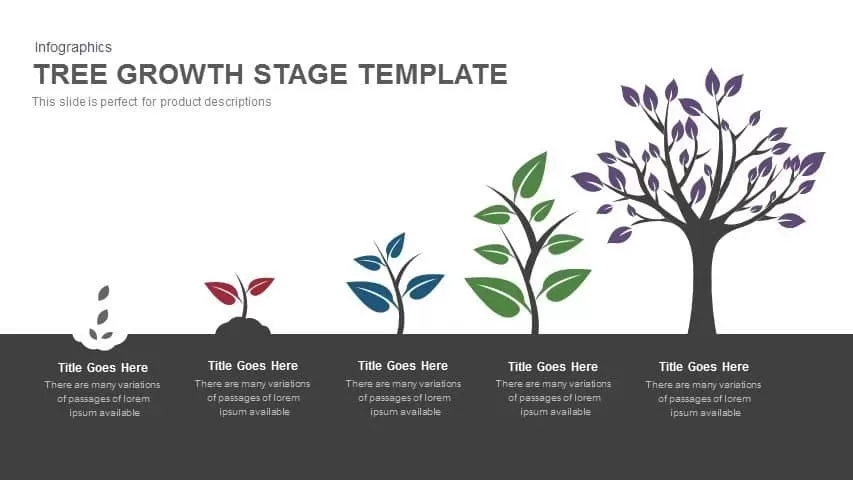
Tree Growth Stage Infographic Template for PowerPoint & Google Slides
Timeline
Five-Stage Growth Arrow Infographic Template for PowerPoint & Google Slides
Arrow
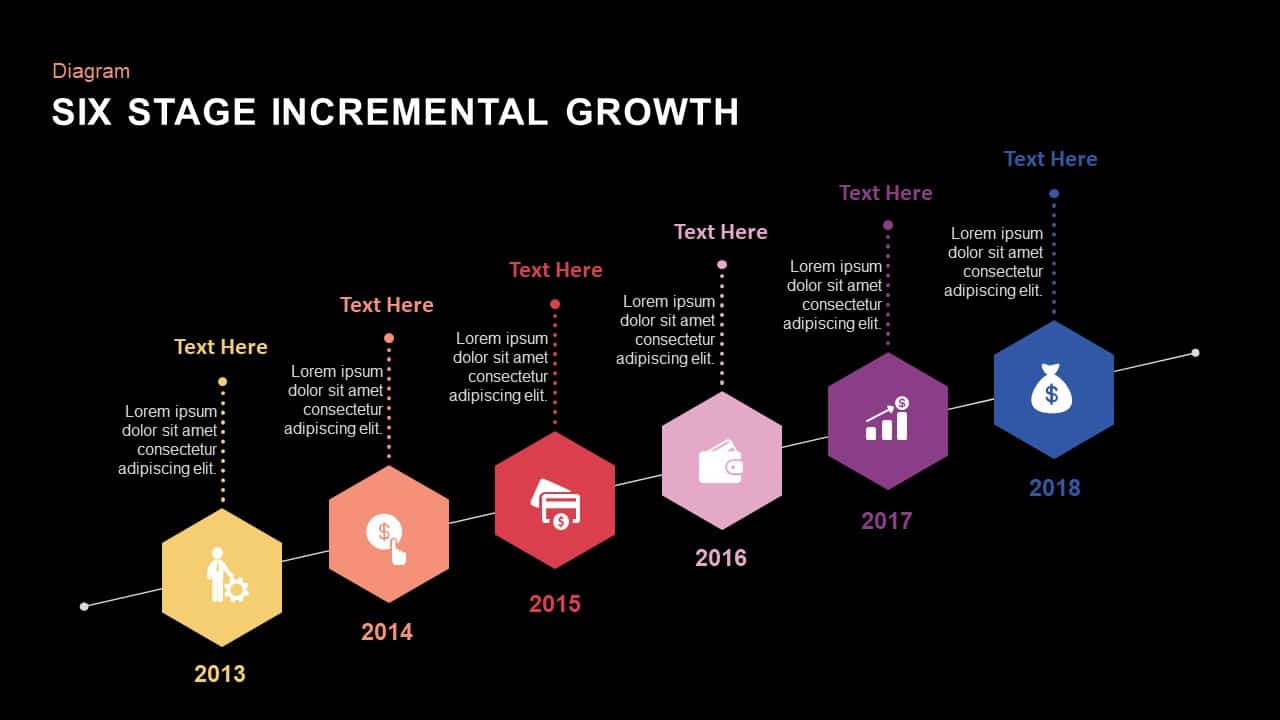
Six Stage Incremental Growth template for PowerPoint & Google Slides
Timeline
5-Stage Financial Growth Timeline Template for PowerPoint & Google Slides
Timeline
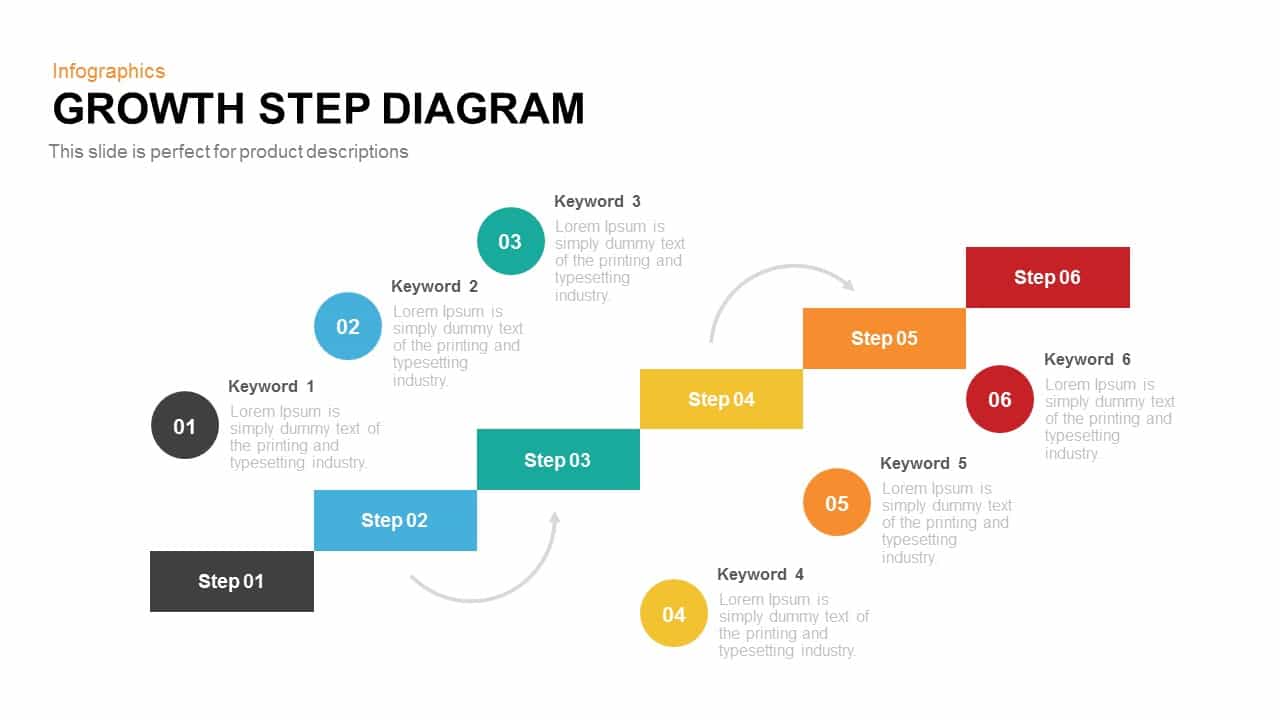
Growth Step Diagram template for PowerPoint & Google Slides
Infographics

Modern Five-Step Growth Diagram Template for PowerPoint & Google Slides
Process
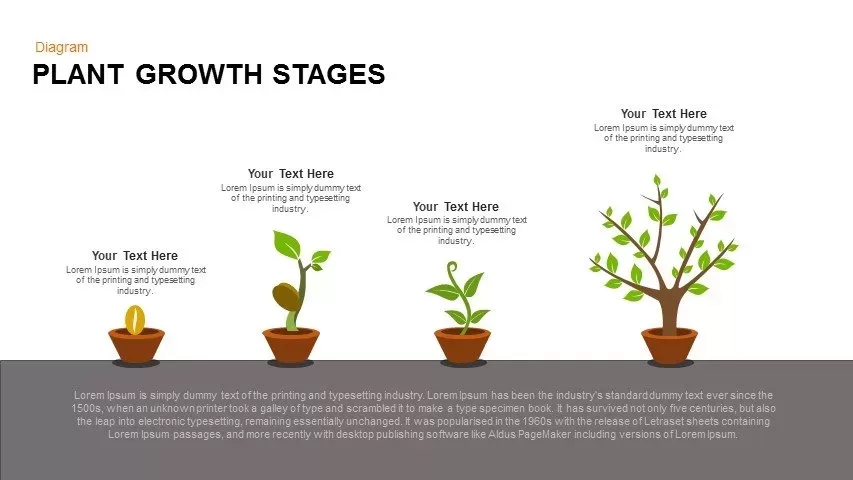
Editable Plant Growth Stages Diagram Template for PowerPoint & Google Slides
Process
4 Step Revenue Growth Flow Diagram Template for PowerPoint & Google Slides
Process
Greiner Growth Model Six-Phase Diagram Template for PowerPoint & Google Slides
Business Models

Ansoff Growth Matrix Strategy Diagram Template for PowerPoint & Google Slides
Business Strategy
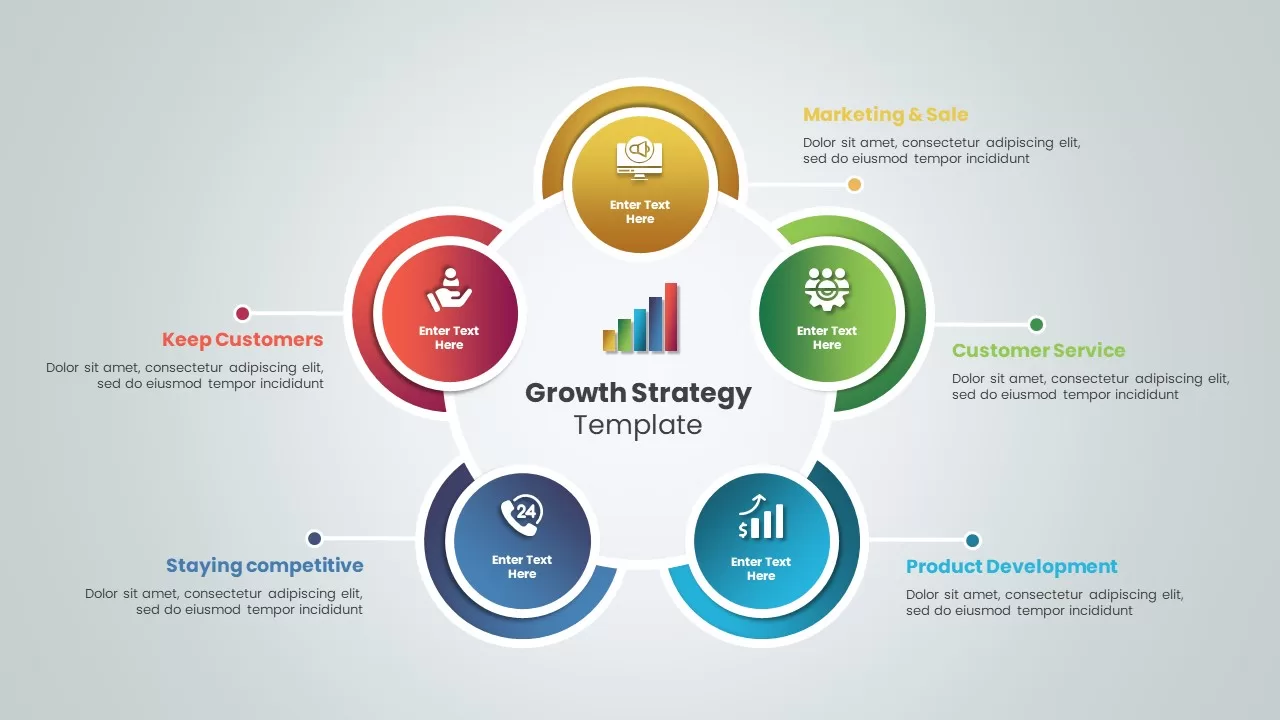
Growth Strategy Circular Diagram Template for PowerPoint & Google Slides
Circular
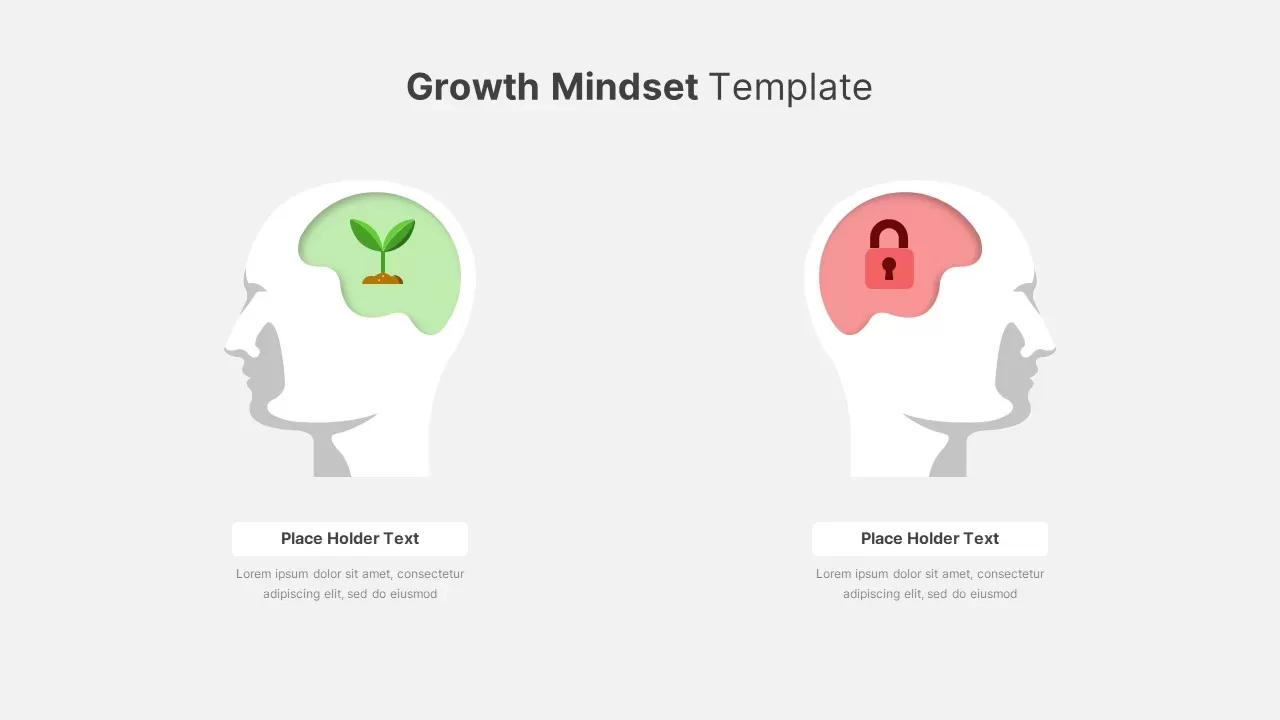
Growth vs Fixed Mindset Diagram Template for PowerPoint & Google Slides
Comparison
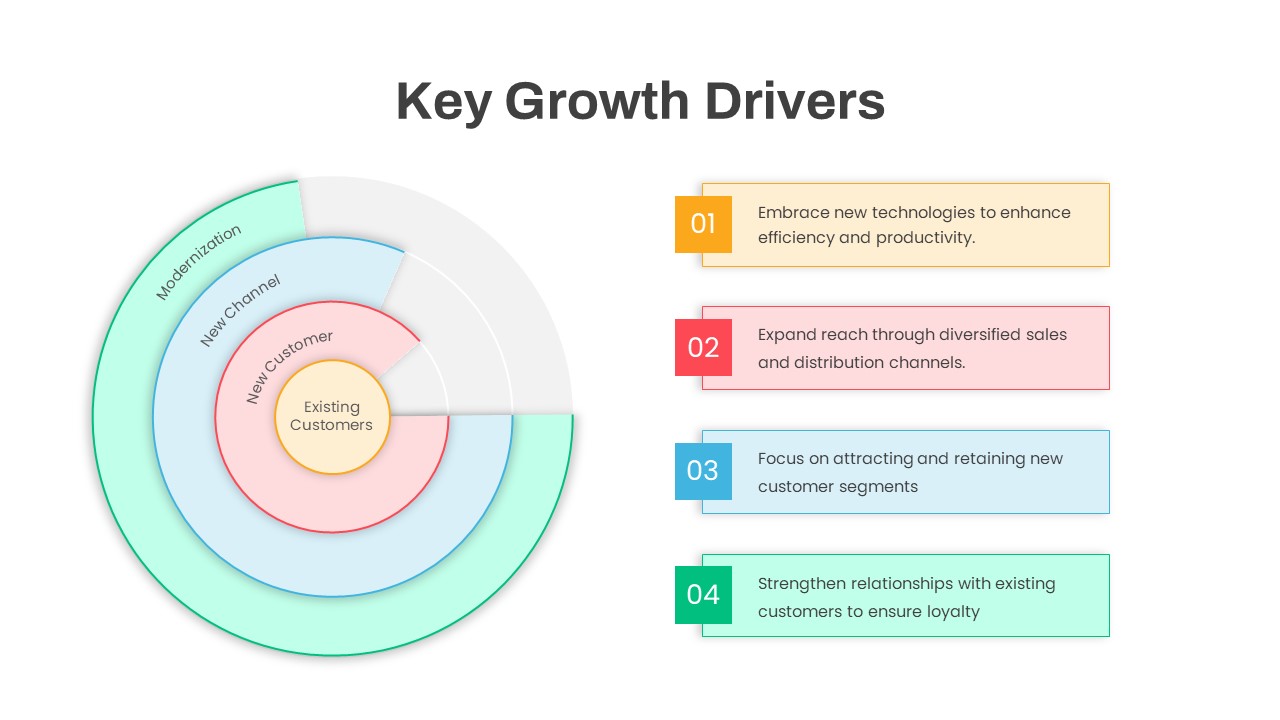
Circular Key Growth Drivers Diagram Template for PowerPoint & Google Slides
Circular
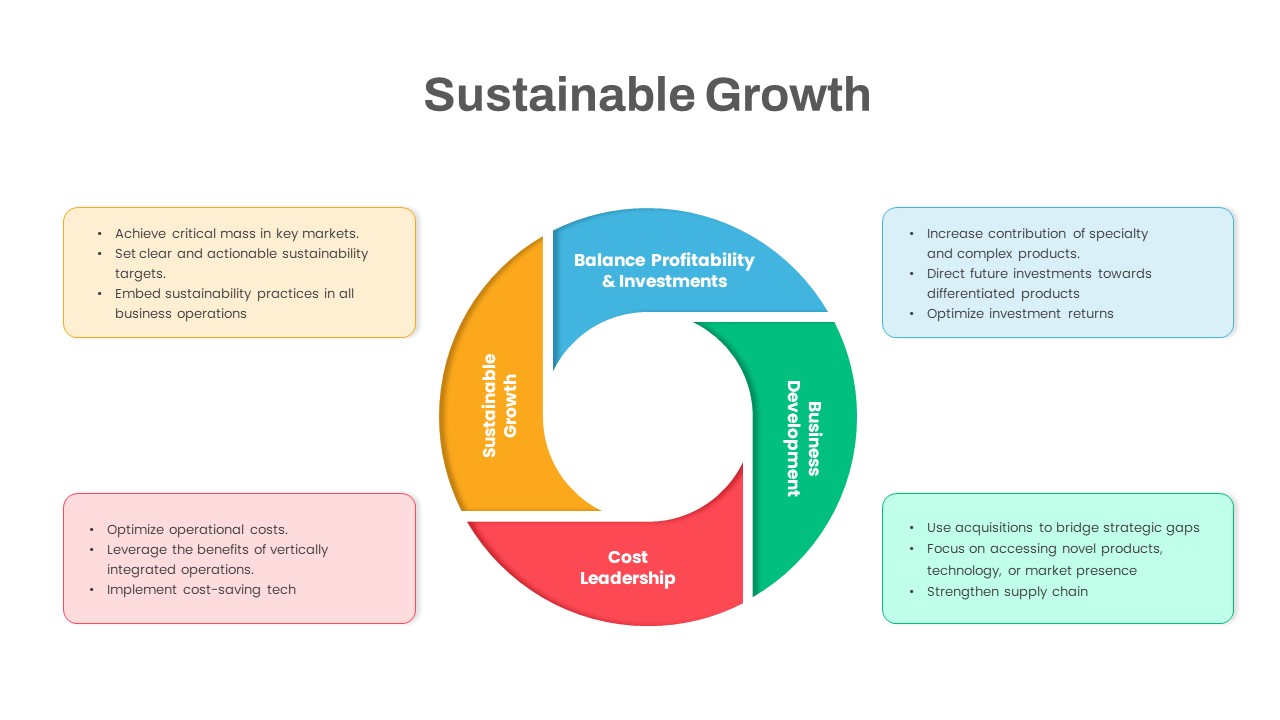
Sustainable Growth Circular Diagram Template for PowerPoint & Google Slides
Circular
Modern Growth Hacking Venn Diagram Template for PowerPoint & Google Slides
Circular
Flywheel Growth Cycle Diagram Template for PowerPoint & Google Slides
Circular
Success and Growth Stair Arrow Diagram for PowerPoint & Google Slides
Process
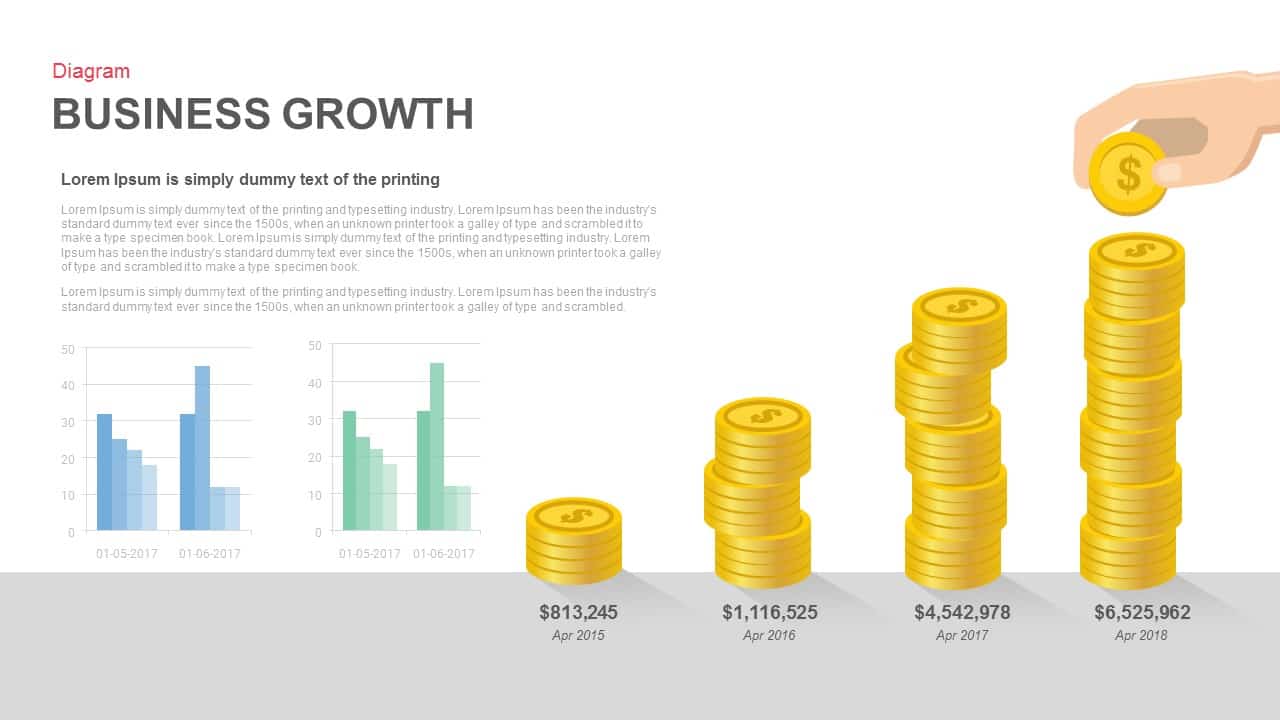
Business Growth Diagram for PowerPoint & Google Slides
Business Models
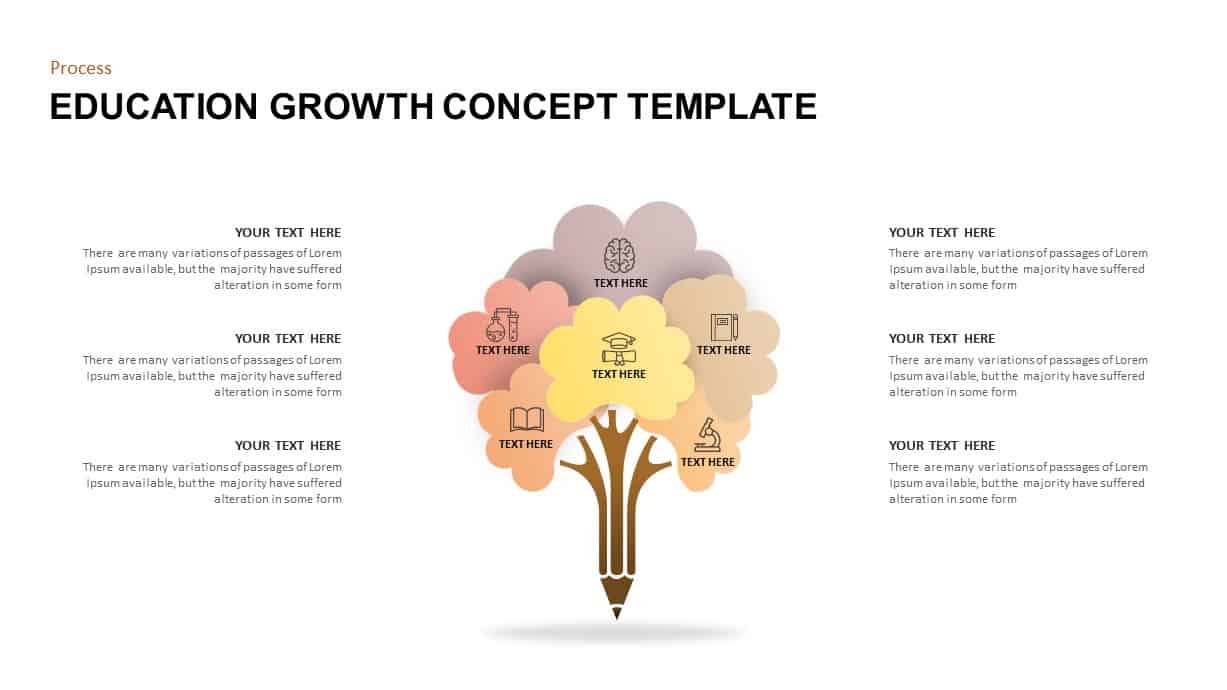
Education Growth Concept Diagram for PowerPoint & Google Slides
Process
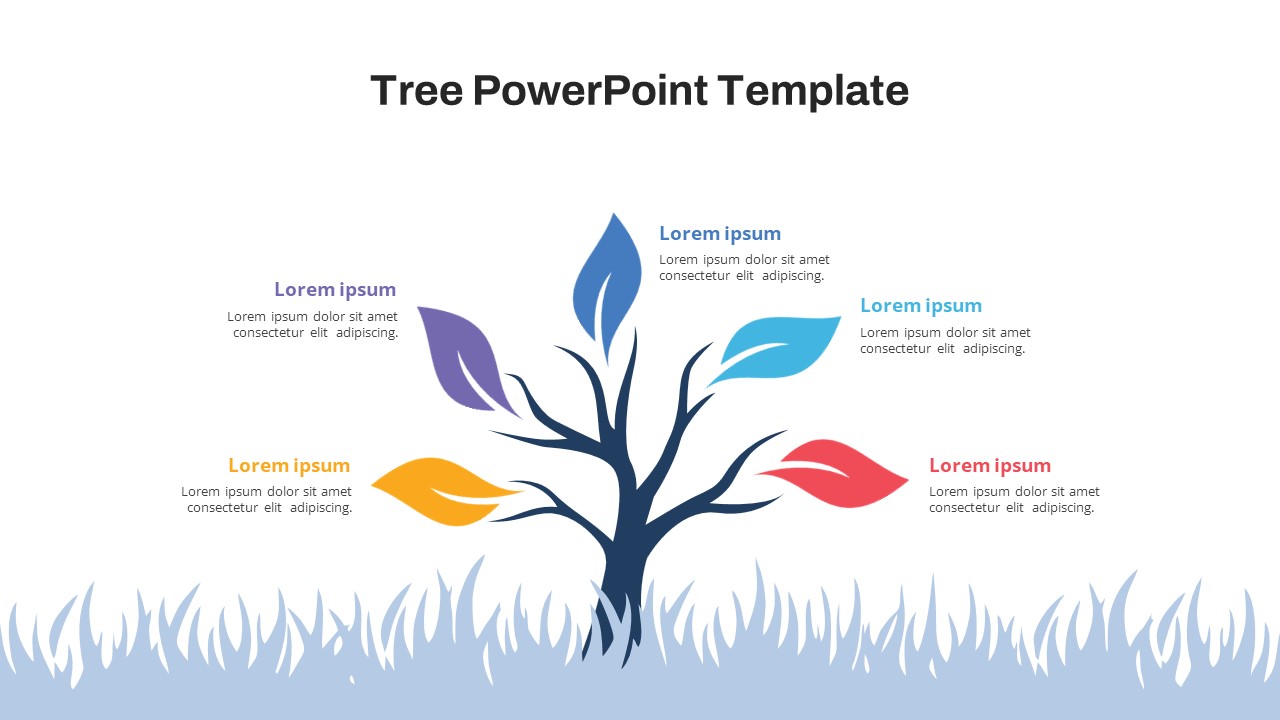
Free Colorful Tree Diagram for Growth & Strategy in PowerPoint & Google Slides
Infographics
Free
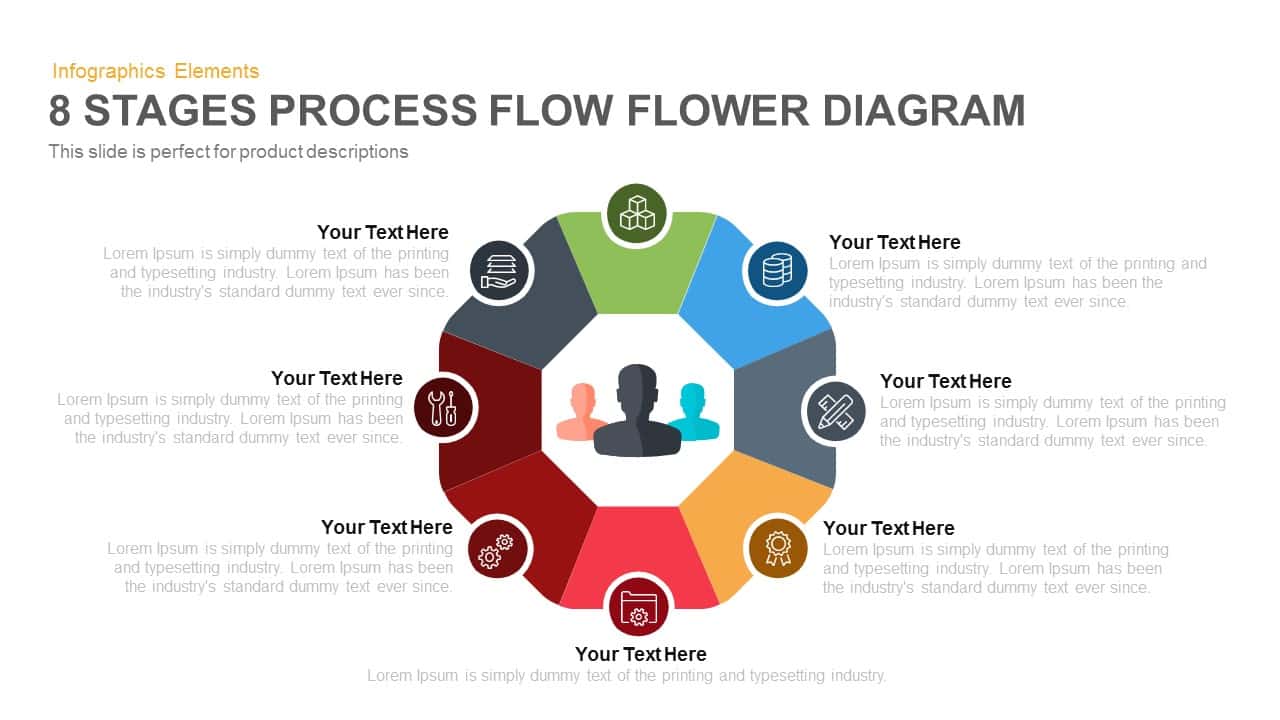
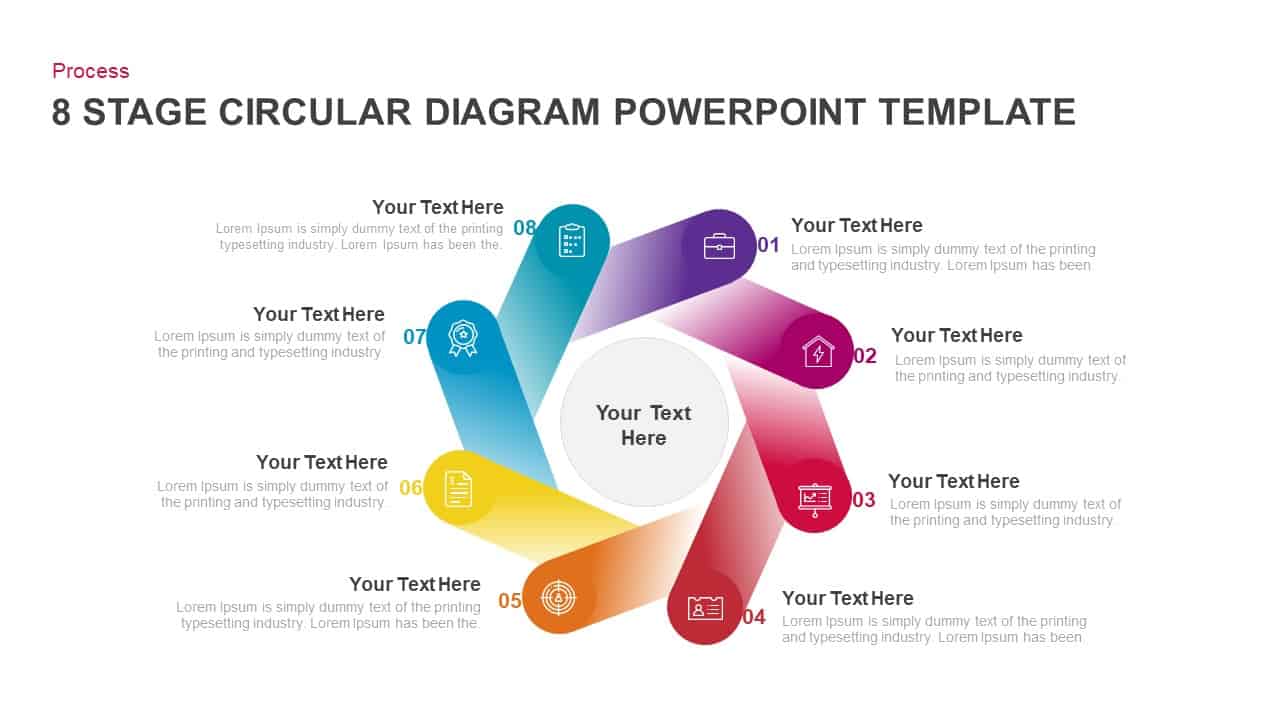
8-Stage Process Flow Flower Diagram Template for PowerPoint & Google Slides
Infographics

Three Stage 3D Arrow Process Diagram Template for PowerPoint & Google Slides
Process
Arrow Stage Process Diagram template for PowerPoint & Google Slides
Arrow
Four-Stage Business Circular Diagram Template for PowerPoint & Google Slides
Process
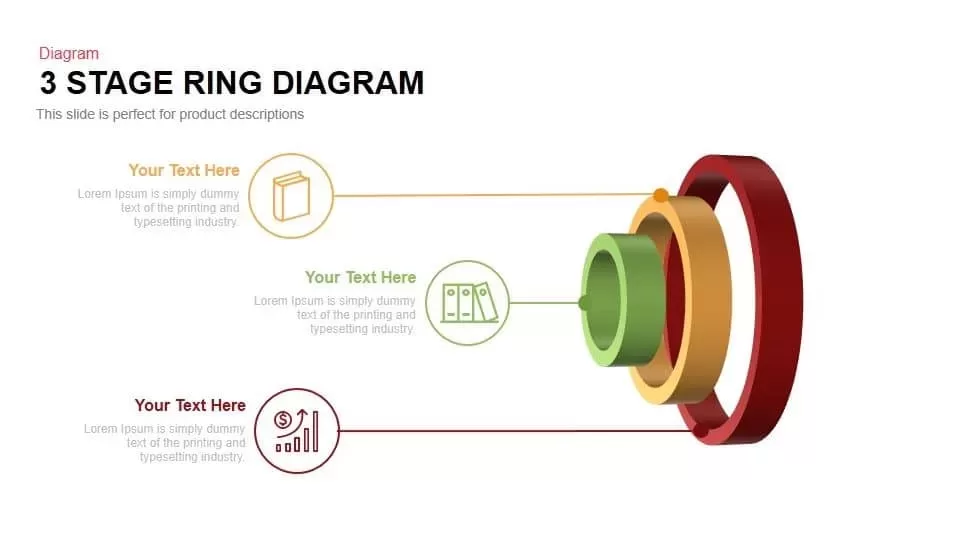
Three-Stage Ring Process Diagram Template for PowerPoint & Google Slides
Circular
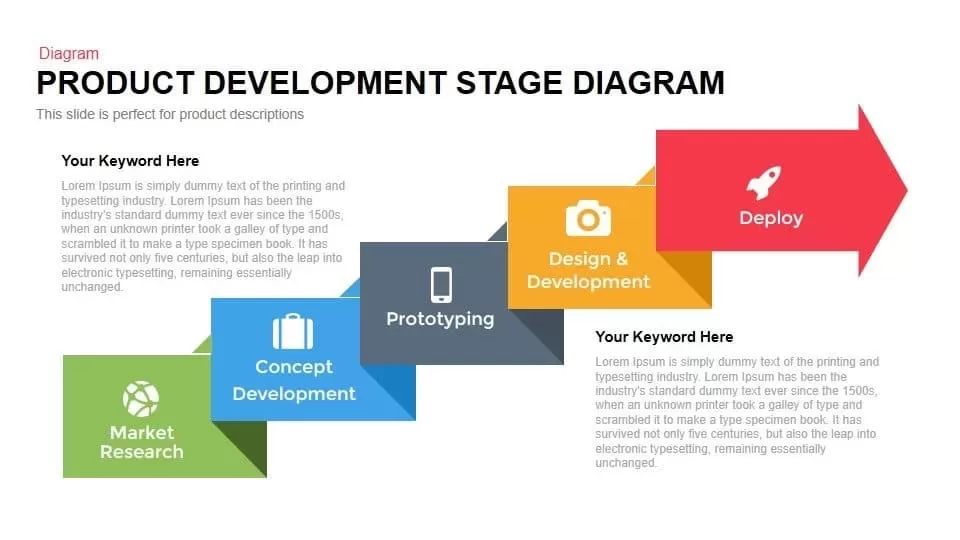
Product Development Stage Diagram Template for PowerPoint & Google Slides
Process
Professional Four-Stage Funnel Diagram Template for PowerPoint & Google Slides
Funnel
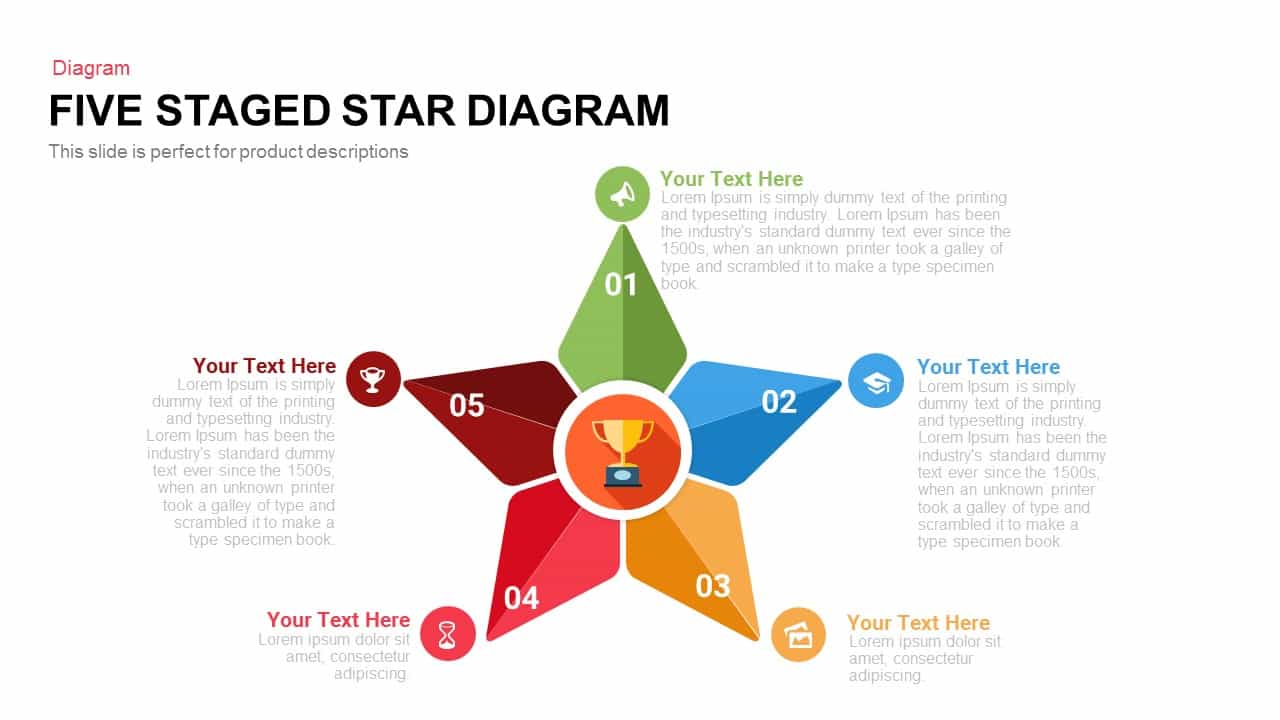
Five-Stage Star Diagram for Milestones Template for PowerPoint & Google Slides
Process
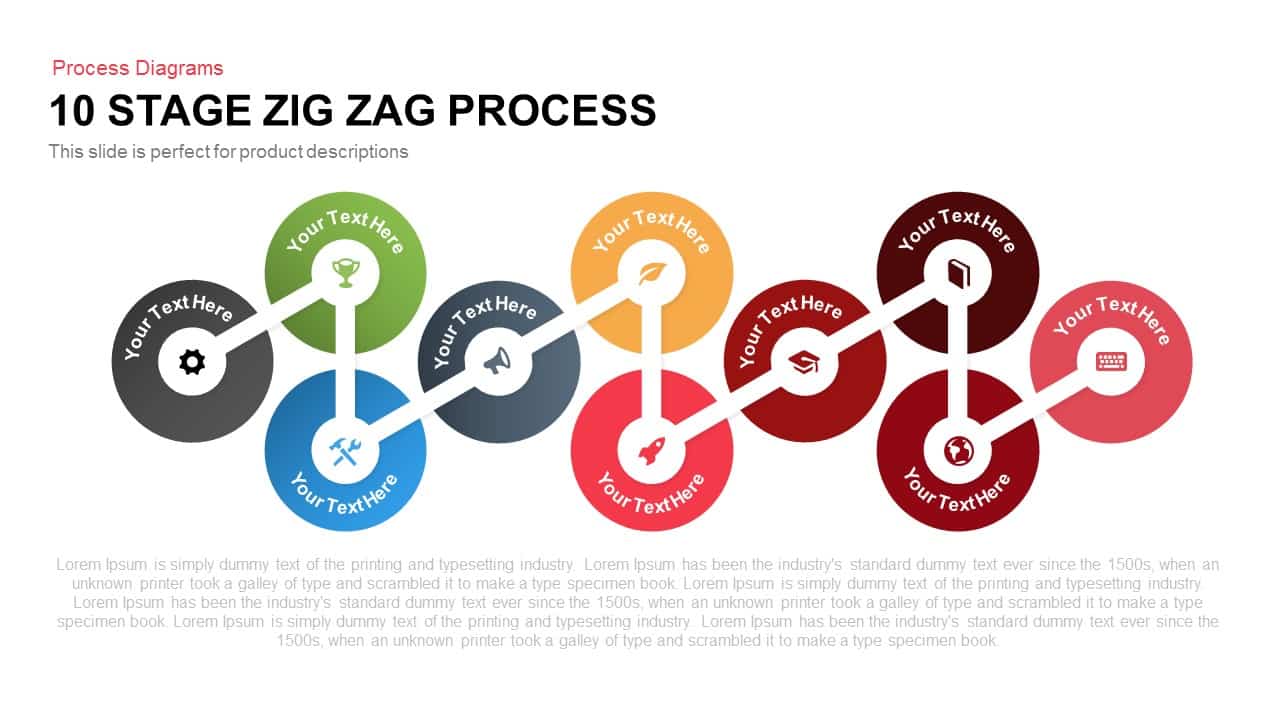
Ten-Stage Zig-Zag Process Diagram Template for PowerPoint & Google Slides
Process
Seven-Stage Arrow Process Diagram Template for PowerPoint & Google Slides
Process
Six-Stage Zig-Zag Process Flow Diagram Template for PowerPoint & Google Slides
Process
Five-Stage Zig-Zag Arrow Diagram Template for PowerPoint & Google Slides
Process
Modern Five-Stage Cycle Process Diagram Template for PowerPoint & Google Slides
Process
Four and Five-Stage Funnel Diagram Template for PowerPoint & Google Slides
Funnel
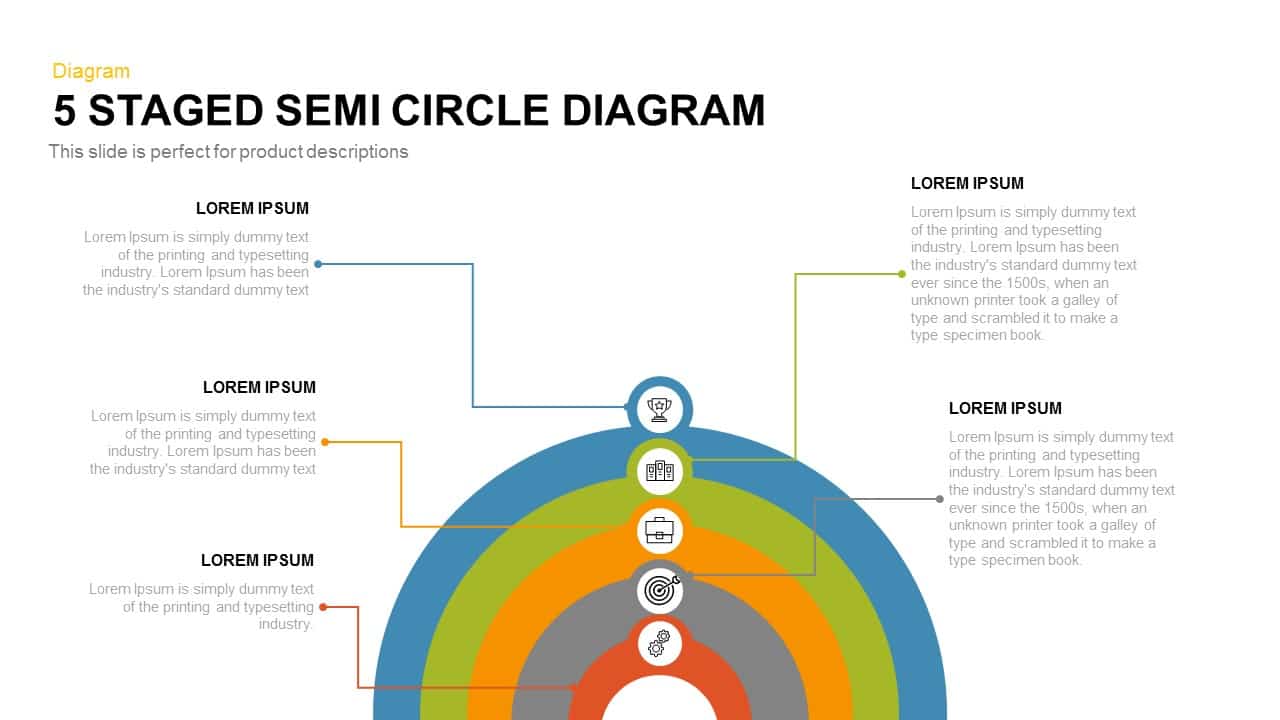
Five-Stage Semi-Circle Diagram Template for PowerPoint & Google Slides
Process
Five-Stage Circle Arrow Diagram Template for PowerPoint & Google Slides
Circular
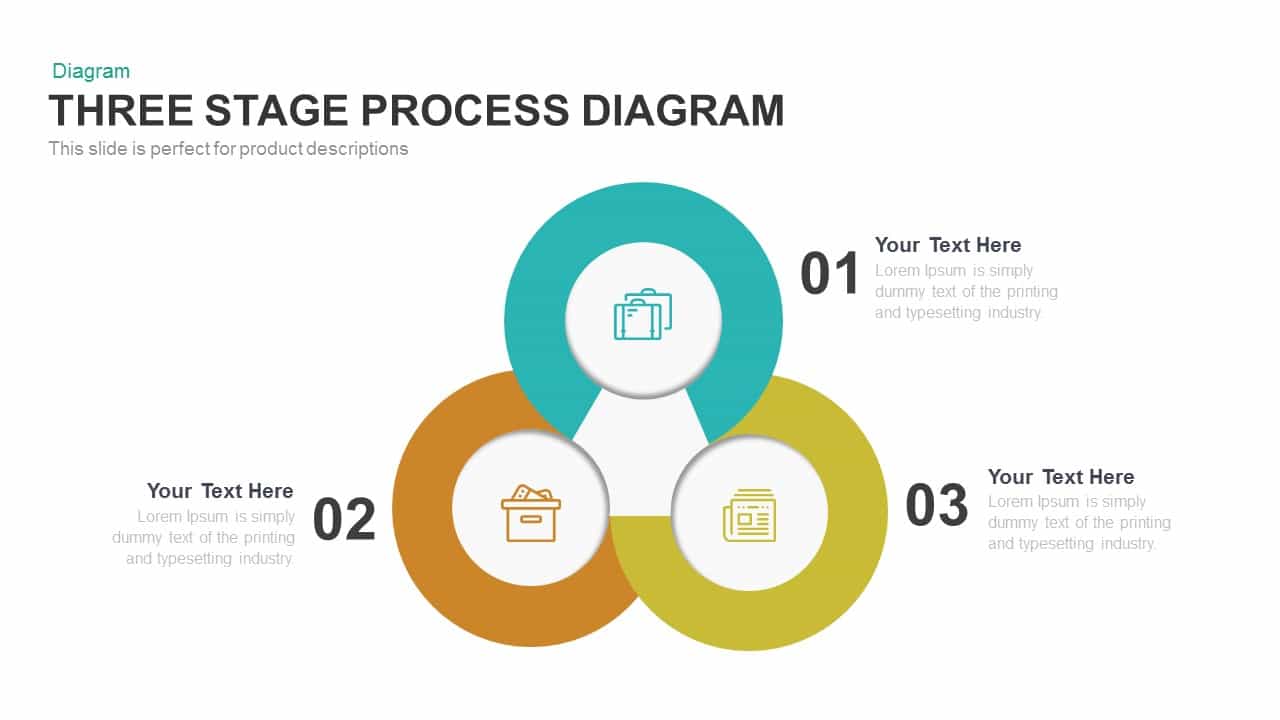
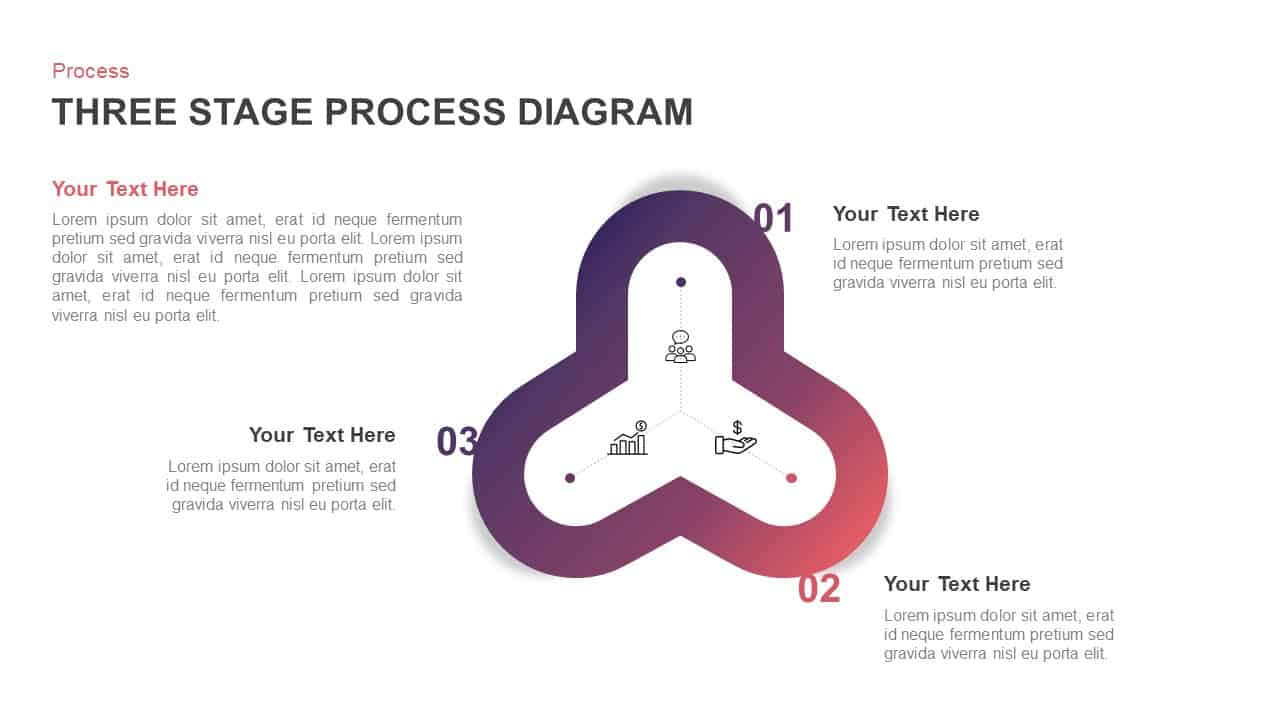
Engaging Three-Stage Process Diagram Template for PowerPoint & Google Slides
Process
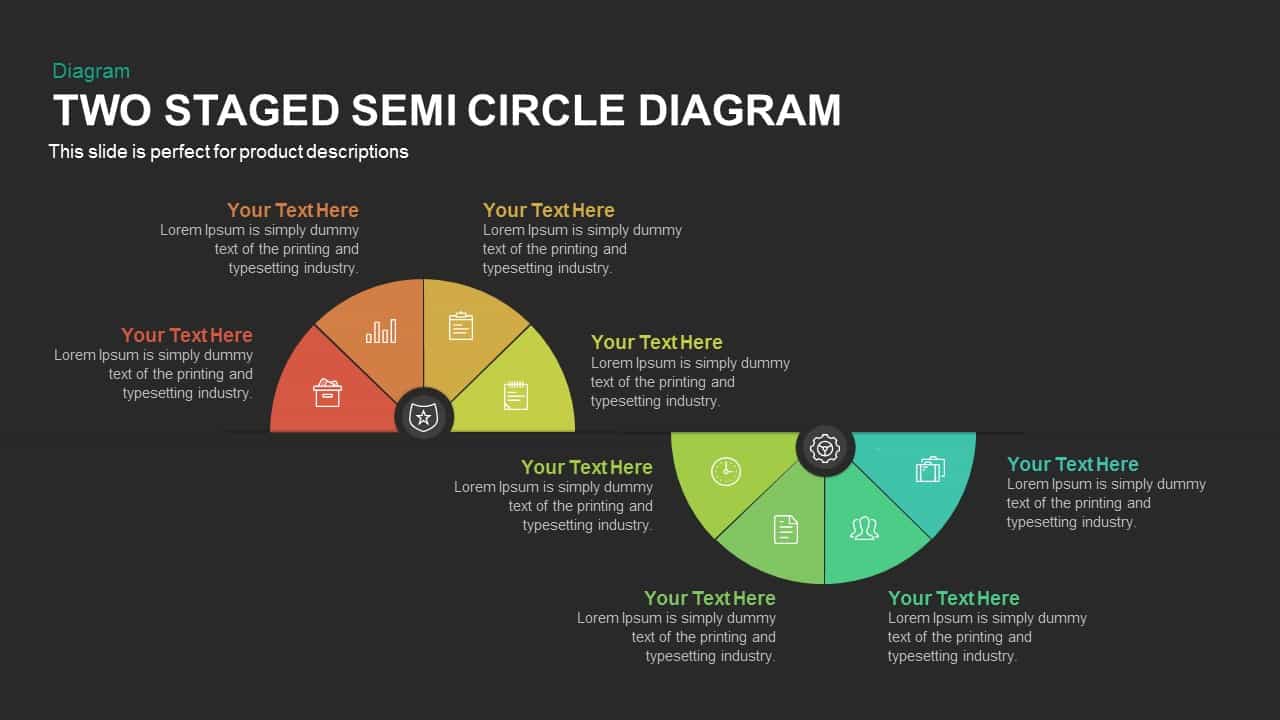
Two-Stage Semi-Circle Diagram Overview Template for PowerPoint & Google Slides
Circular
Six-Stage Semi-Circle Diagram with Icons Template for PowerPoint & Google Slides
Circular
Six-Stage Circular Cycle Diagram Template for PowerPoint & Google Slides
Process
Five-Stage Pentagon Arrow Diagram Template for PowerPoint & Google Slides
Arrow
Five Stage Process Diagram Infographic Template for PowerPoint & Google Slides
Process
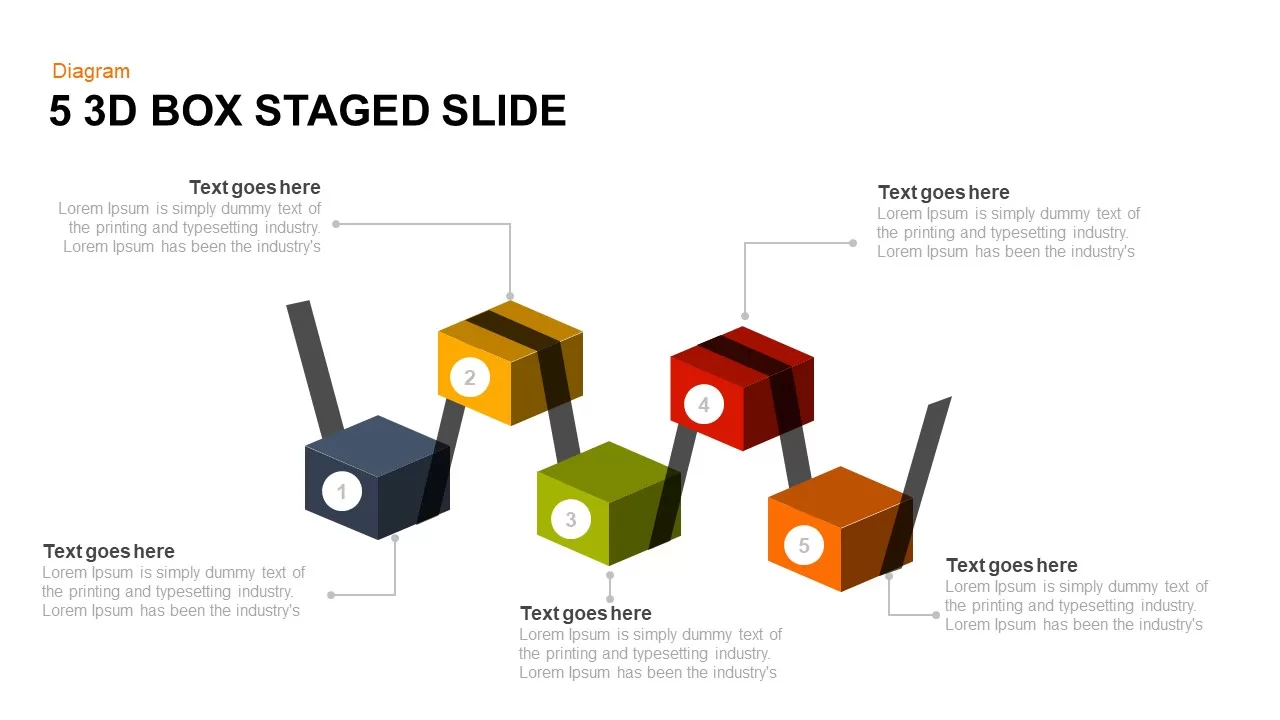
Five-Stage 3D Box Flow Diagram Template for PowerPoint & Google Slides
Process
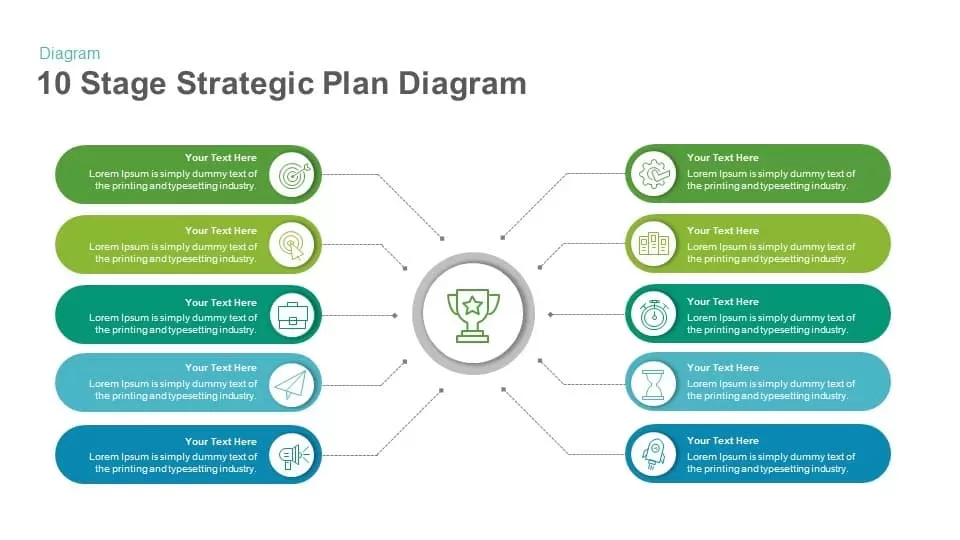
10 Stage Strategic Plan Diagram template for PowerPoint & Google Slides
Process
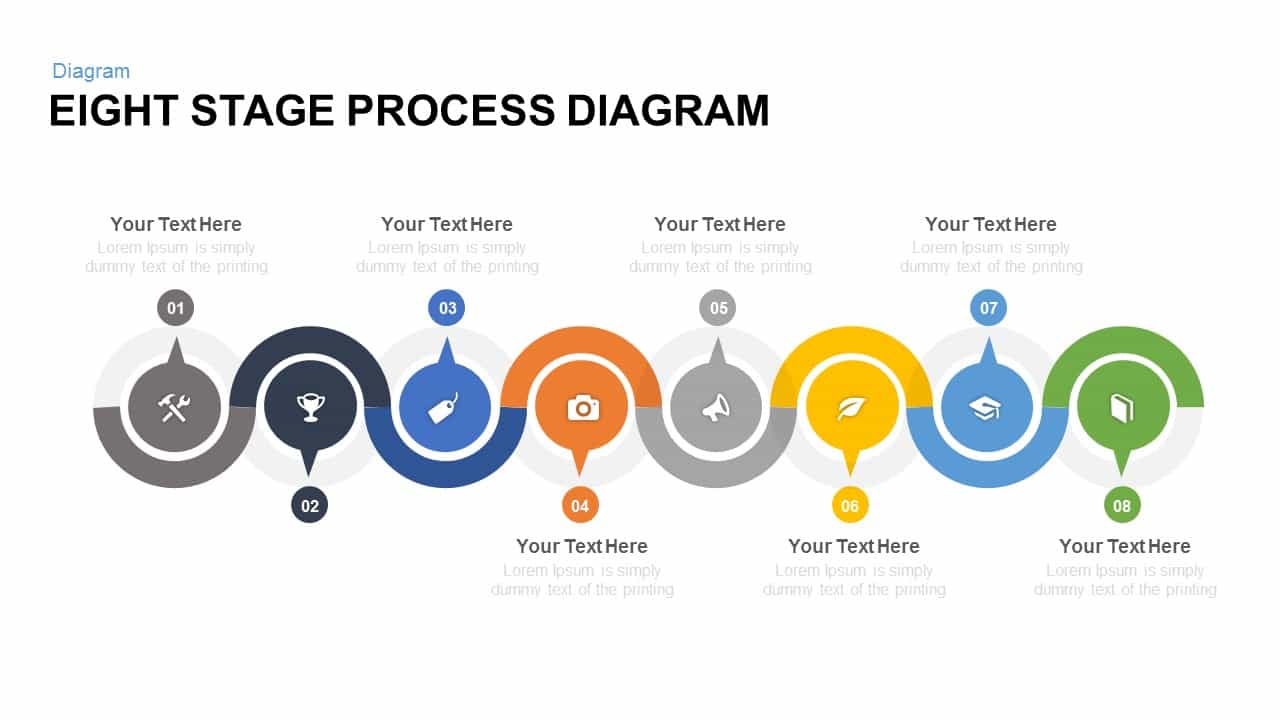
Eight Stage Process Diagram template for PowerPoint & Google Slides
Process
Free Six Stage Bubble Process Diagram template for PowerPoint & Google Slides
Process
Free
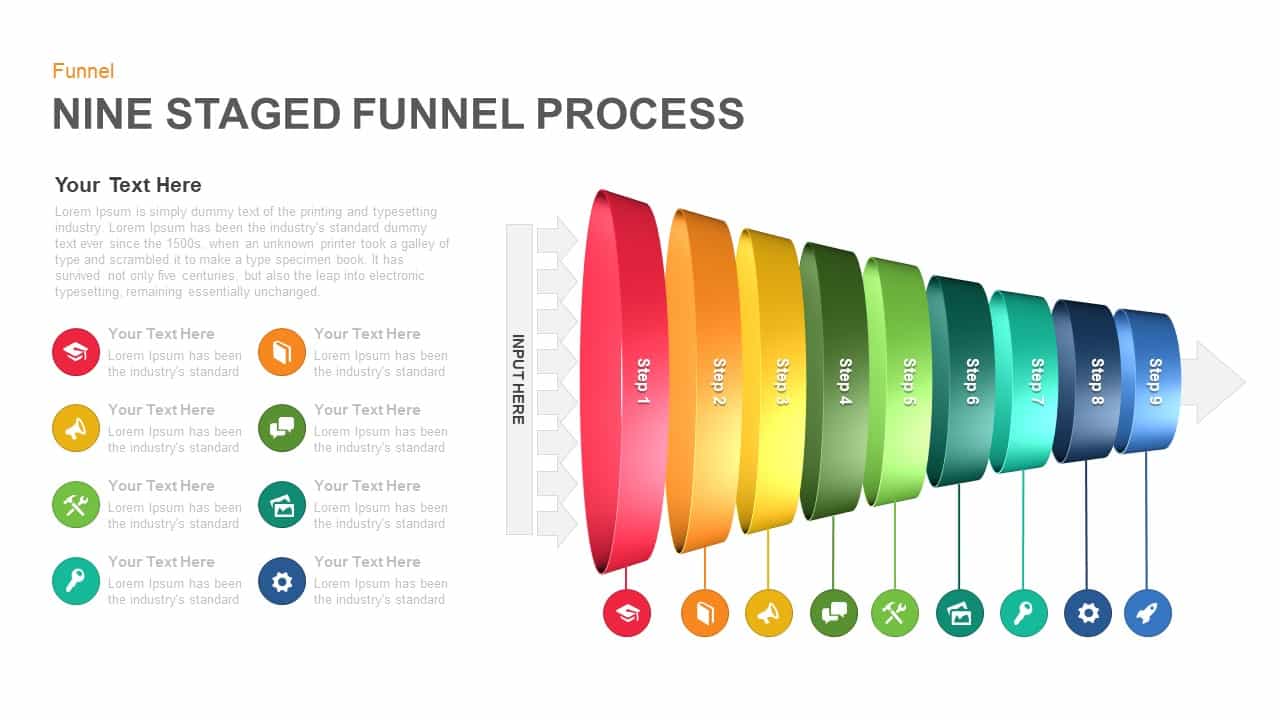
Nine-Stage 3D Funnel Process Diagram Template for PowerPoint & Google Slides
Funnel

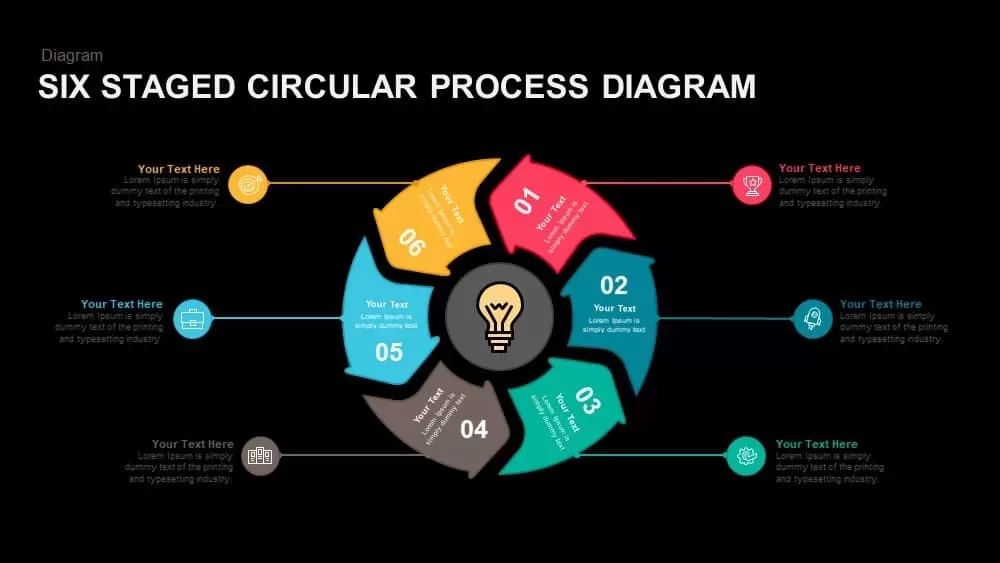
Six-Stage Circular Process Diagram Template for PowerPoint & Google Slides
Process
Eight-Stage Zigzag Arrow Diagram Template for PowerPoint & Google Slides
Process
Eight-Stage Radial Process Flow Diagram Template for PowerPoint & Google Slides
Process
Six Stage Circular Diagram with Icons Template for PowerPoint & Google Slides
Circular
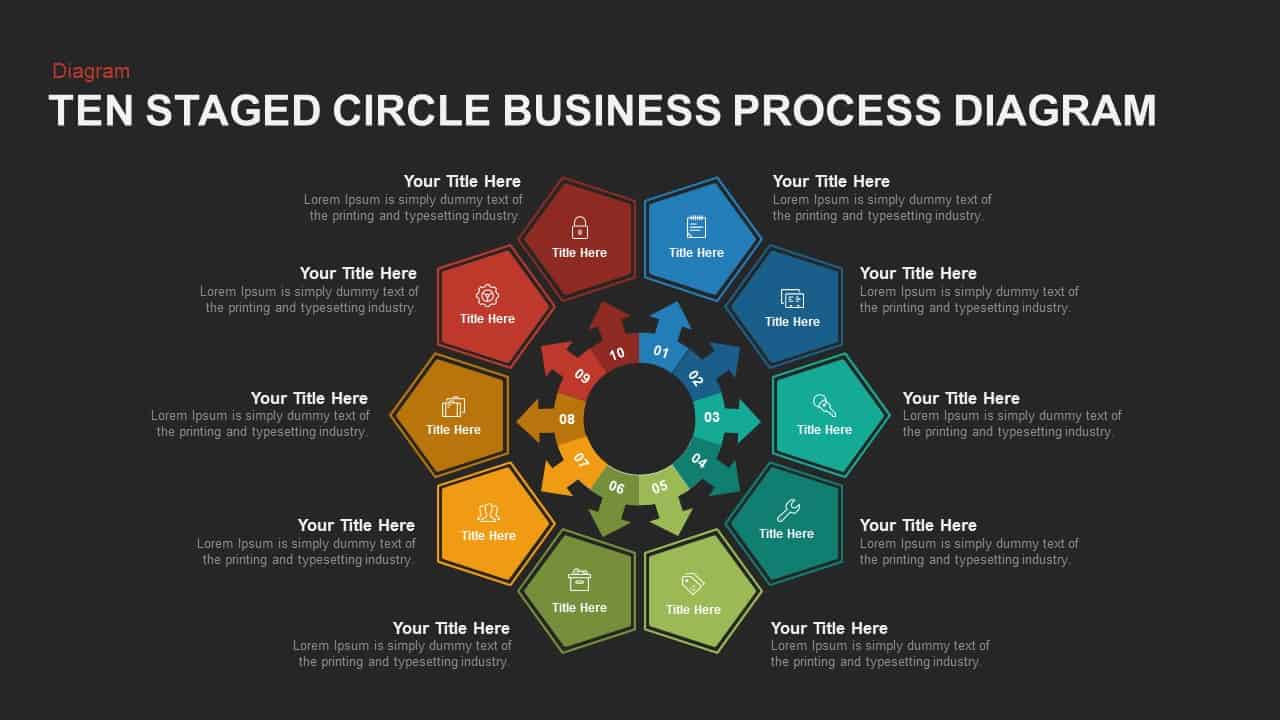
Ten-Stage Business Process Diagram Template for PowerPoint & Google Slides
Process
12-Stage Zig Zag Process Diagram Template for PowerPoint & Google Slides
Process
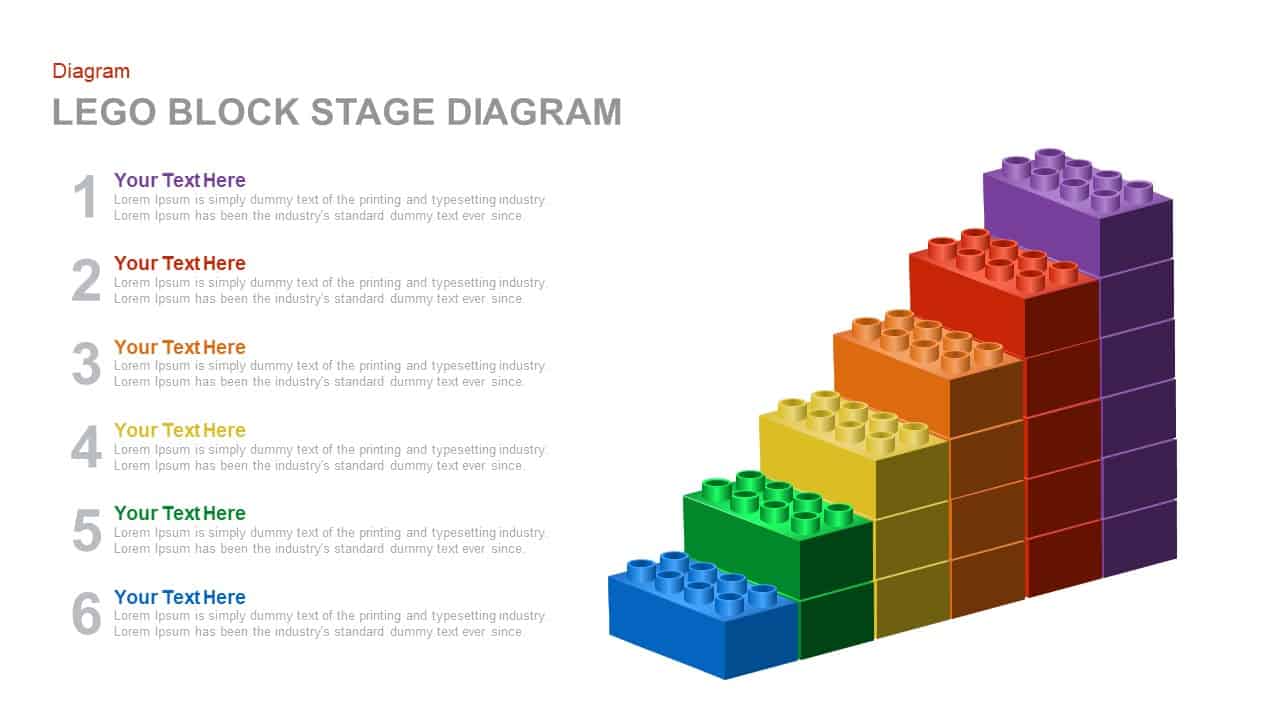
Colorful LEGO Block Stage Diagram Template for PowerPoint & Google Slides
Process
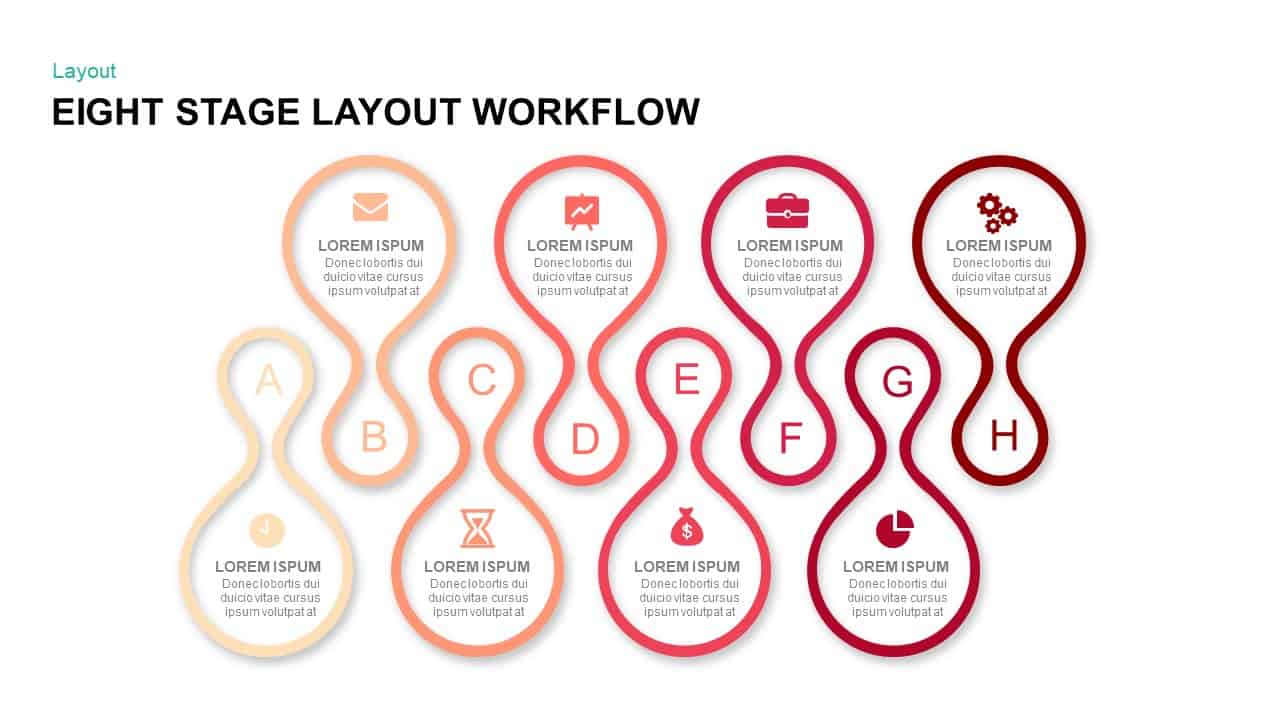
Eight Stage Hourglass Workflow Diagram Template for PowerPoint & Google Slides
Process
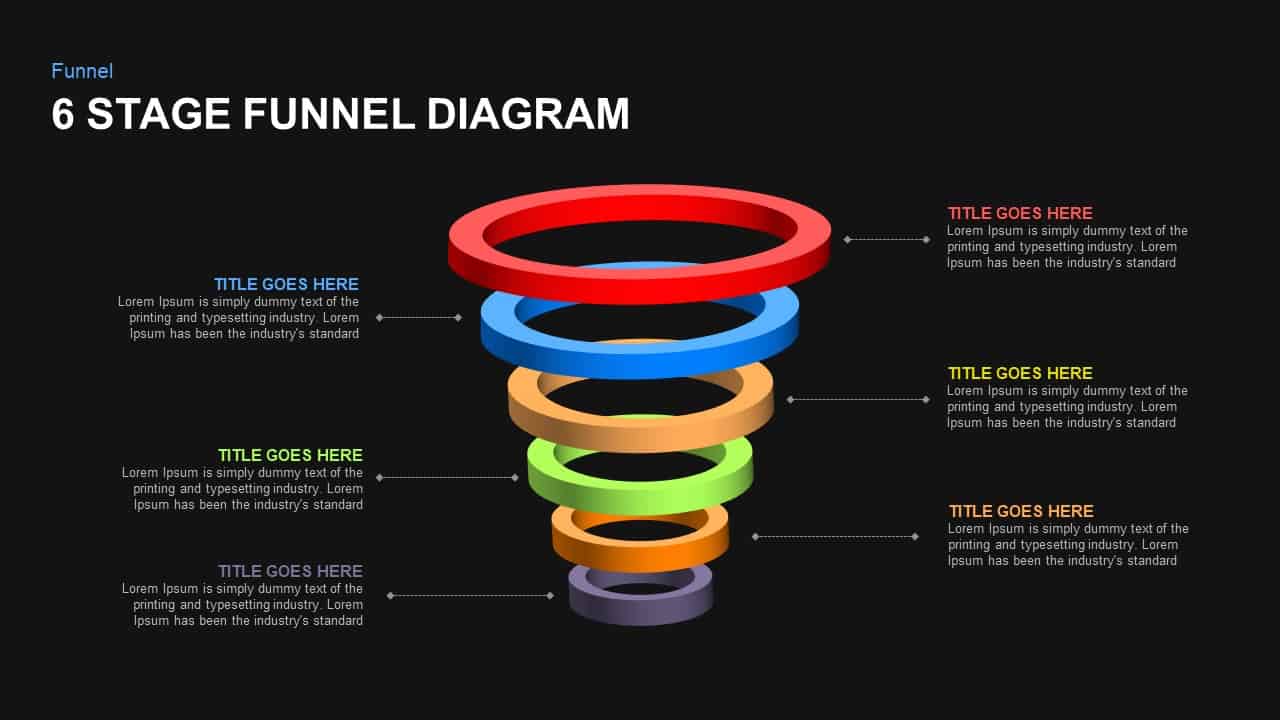
6-Stage Funnel Diagram Infographic Template for PowerPoint & Google Slides
Funnel
Free Six-Stage Arrow Process Diagram Template for PowerPoint & Google Slides
Process
Free
Five Stage Linear Process Flow Diagram Template for PowerPoint & Google Slides
Process
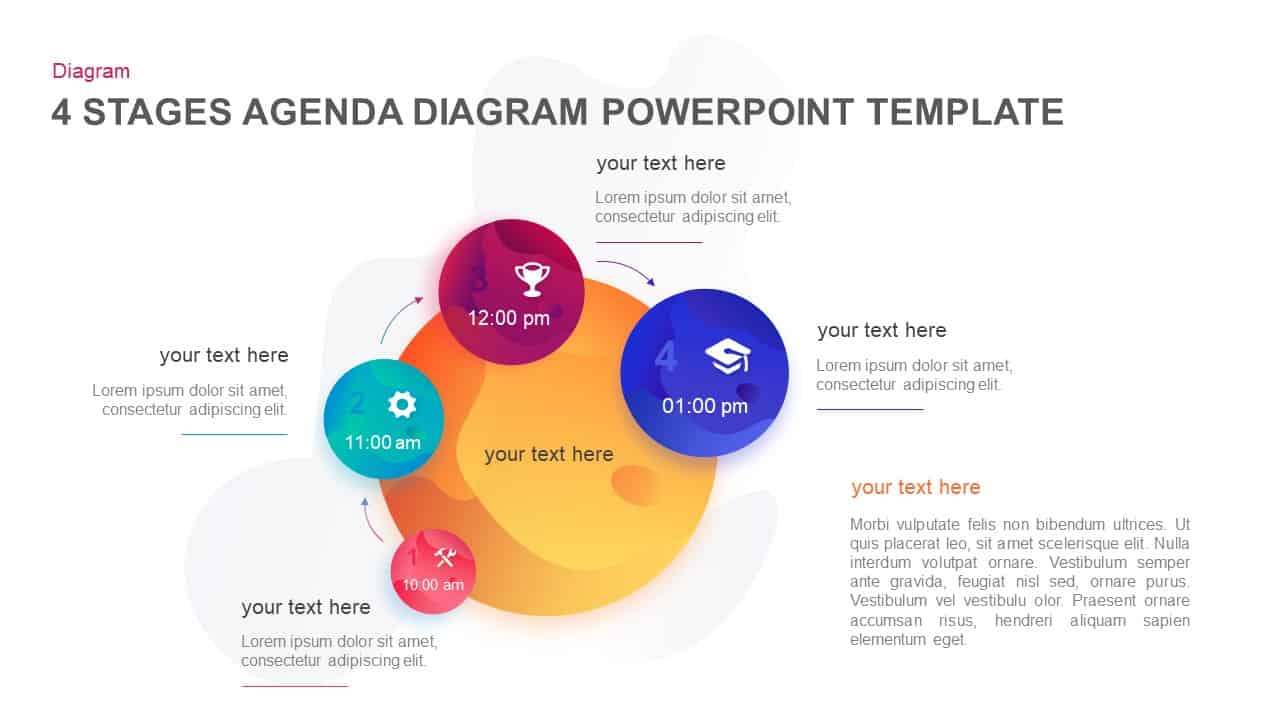
Four-Stage Agenda Circle Diagram Slide Template for PowerPoint & Google Slides
Agenda
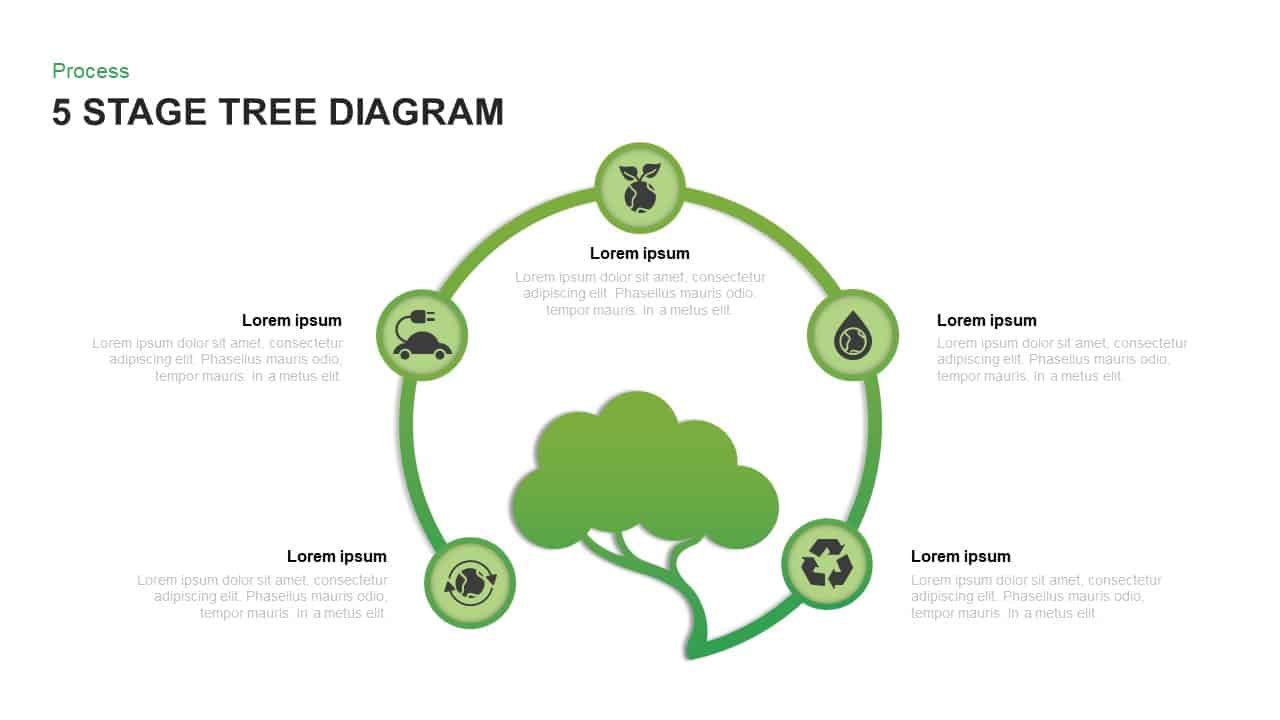
Five-Stage Eco Tree Process Diagram Template for PowerPoint & Google Slides
Process
Five-Stage Circular Infographic Diagram Template for PowerPoint & Google Slides
Process
Six-Stage Circular Diagram Process Template for PowerPoint & Google Slides
Circular
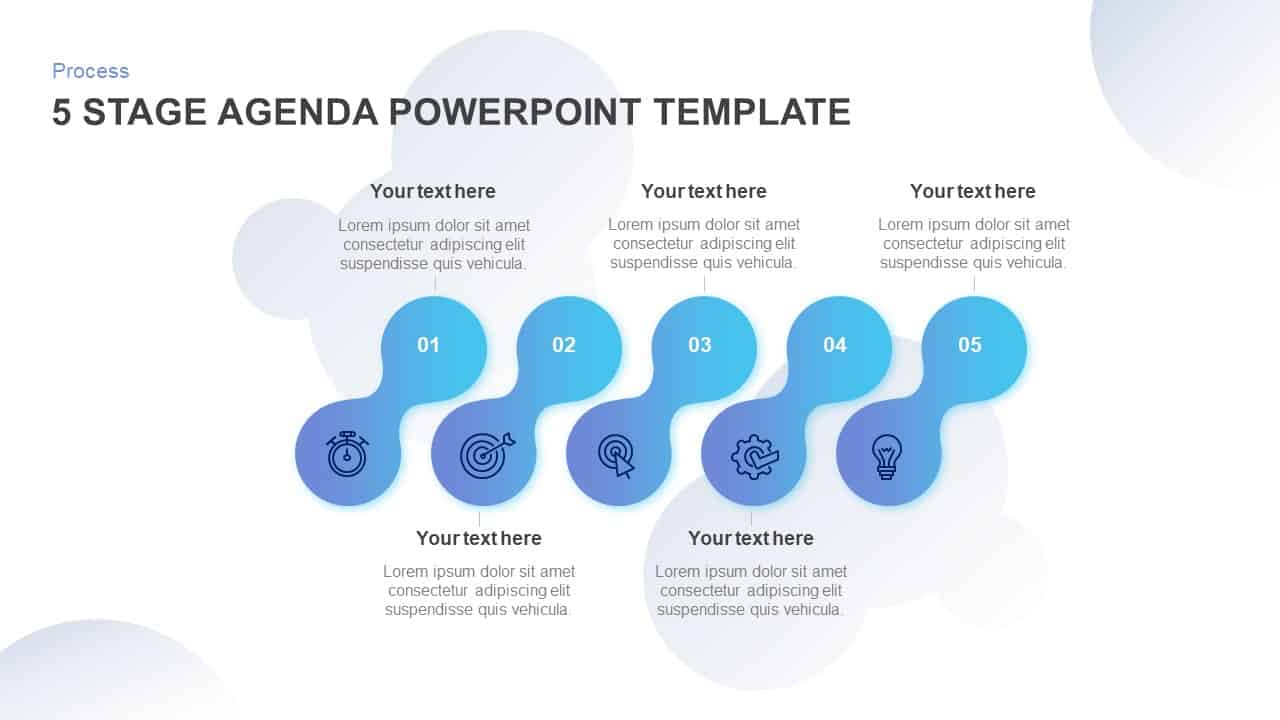
Five-Stage Agenda Flow Diagram Template for PowerPoint & Google Slides
Agenda
Four-Stage Circular Diagram Infographic Template for PowerPoint & Google Slides
Circular
Four-Stage Gear Process Diagram Template for PowerPoint & Google Slides
Process
Five Stage Circular Arrow Diagram Template for PowerPoint & Google Slides
Process
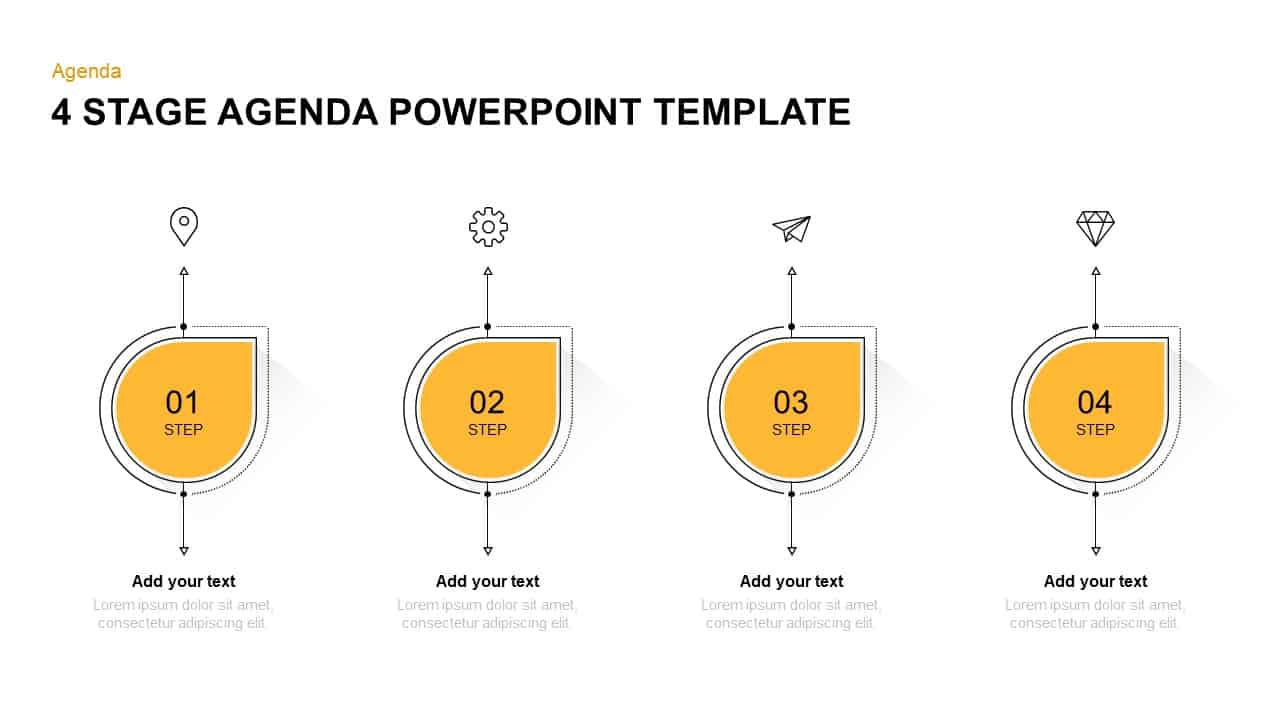
4-, 5- & 6-Stage Agenda Diagram Template for PowerPoint & Google Slides
Agenda
Six-Stage Arrow Timeline Diagram Template for PowerPoint & Google Slides
Timeline
Five-Stage Circular Flow Diagram Template for PowerPoint & Google Slides
Circular
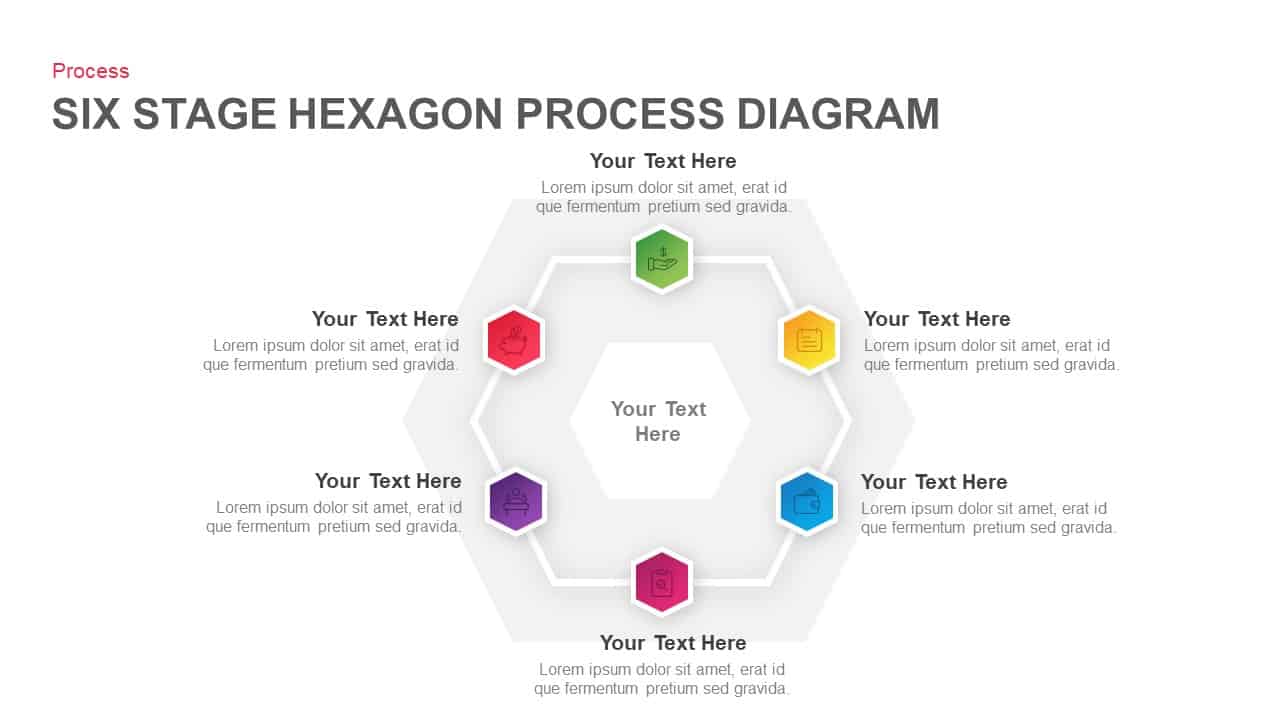
Six Stage Hexagon Process Diagram Template for PowerPoint & Google Slides
Process
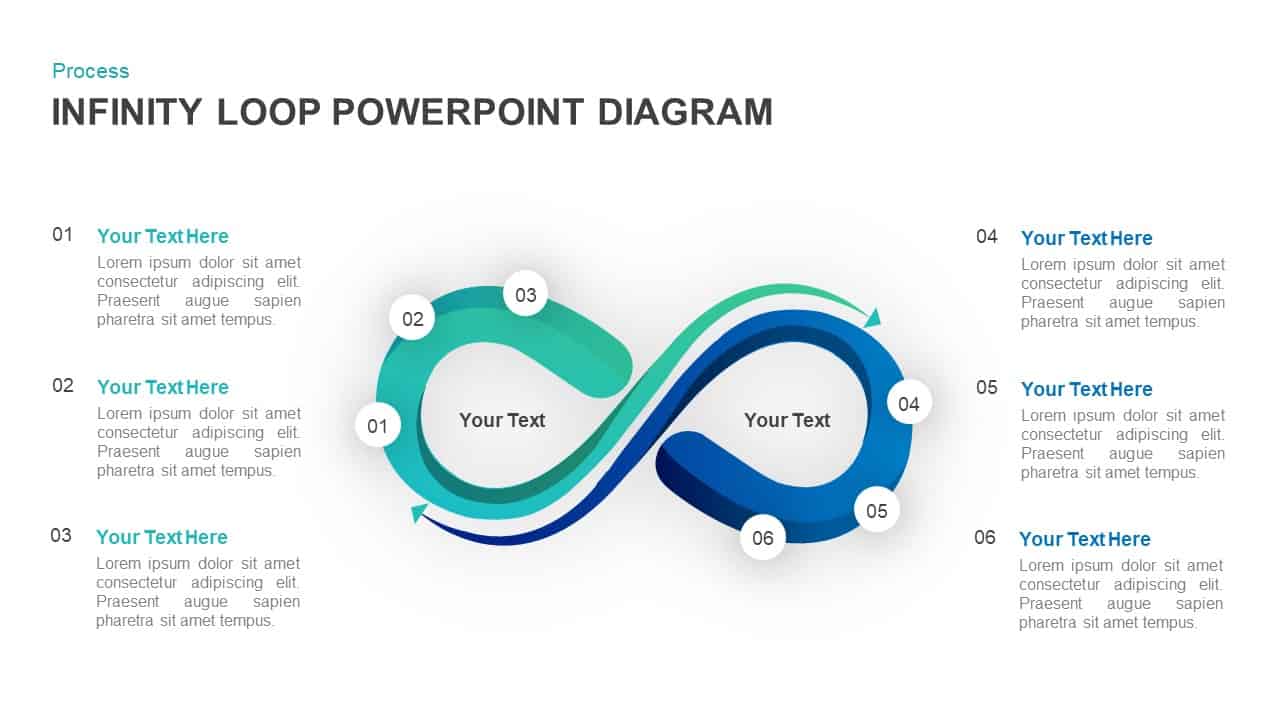
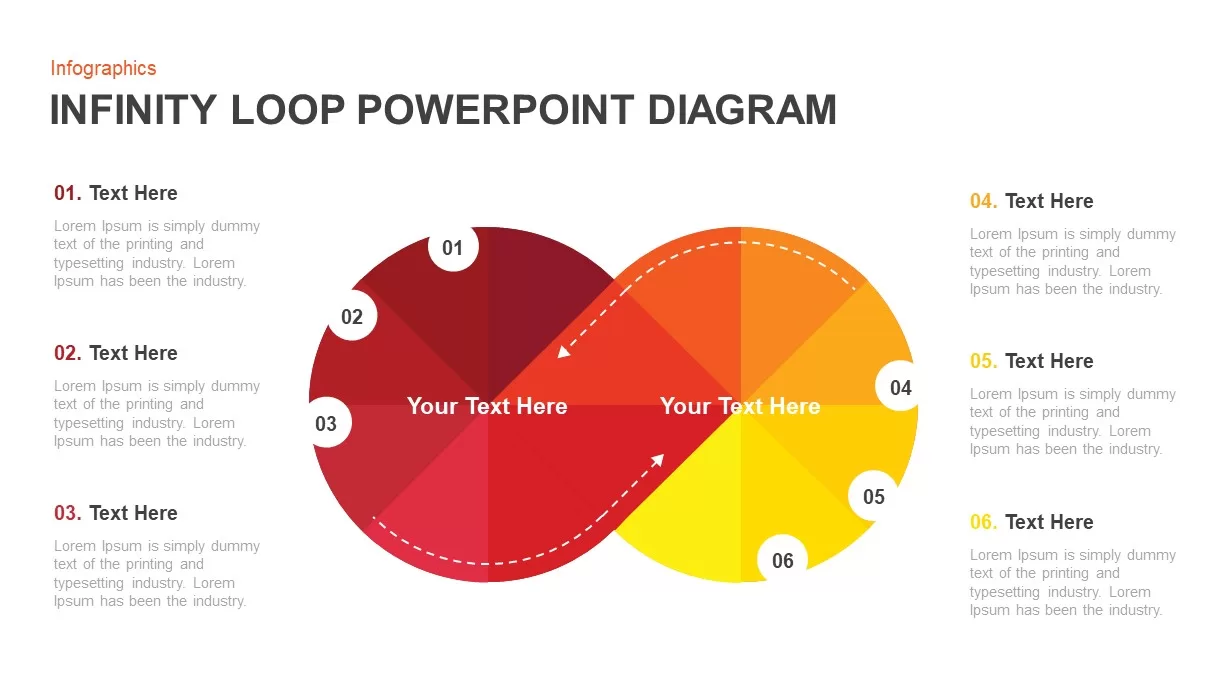
Six-Stage Infinity Loop Process Diagram Template for PowerPoint & Google Slides
Process
5-Stage Gear Process Flow Diagram Template for PowerPoint & Google Slides
Process
3D Seven-Stage Process Flow Diagram Template for PowerPoint & Google Slides
Process
Four-Stage Linear Process Flow Diagram Template for PowerPoint & Google Slides
Process
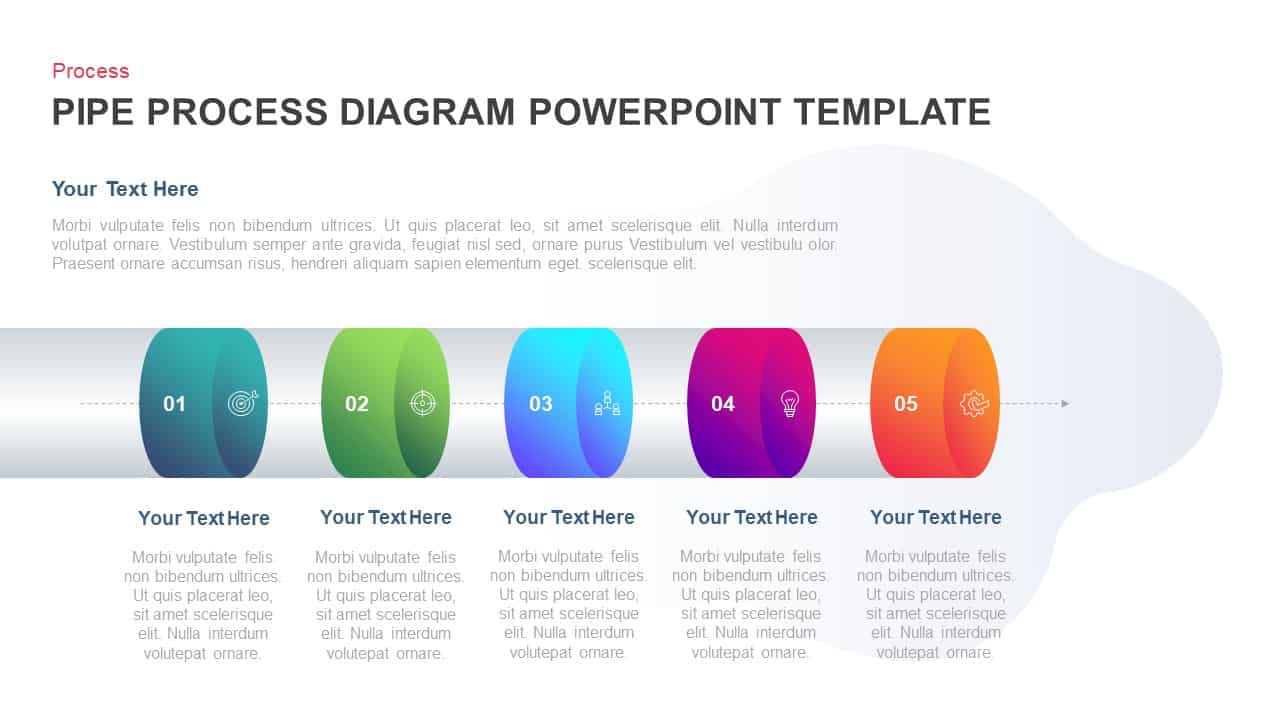
Five-Stage Pipe Process Diagram Template for PowerPoint & Google Slides
Process
Four-Stage Circular Flow Diagram Template for PowerPoint & Google Slides
Circular
5 Stage Linear Process Flow Diagram Template for PowerPoint & Google Slides
Process
Five-Stage Process Flow Diagram Template for PowerPoint & Google Slides
Process
4 Stage Linear Process Flow Diagram Template for PowerPoint & Google Slides
Process
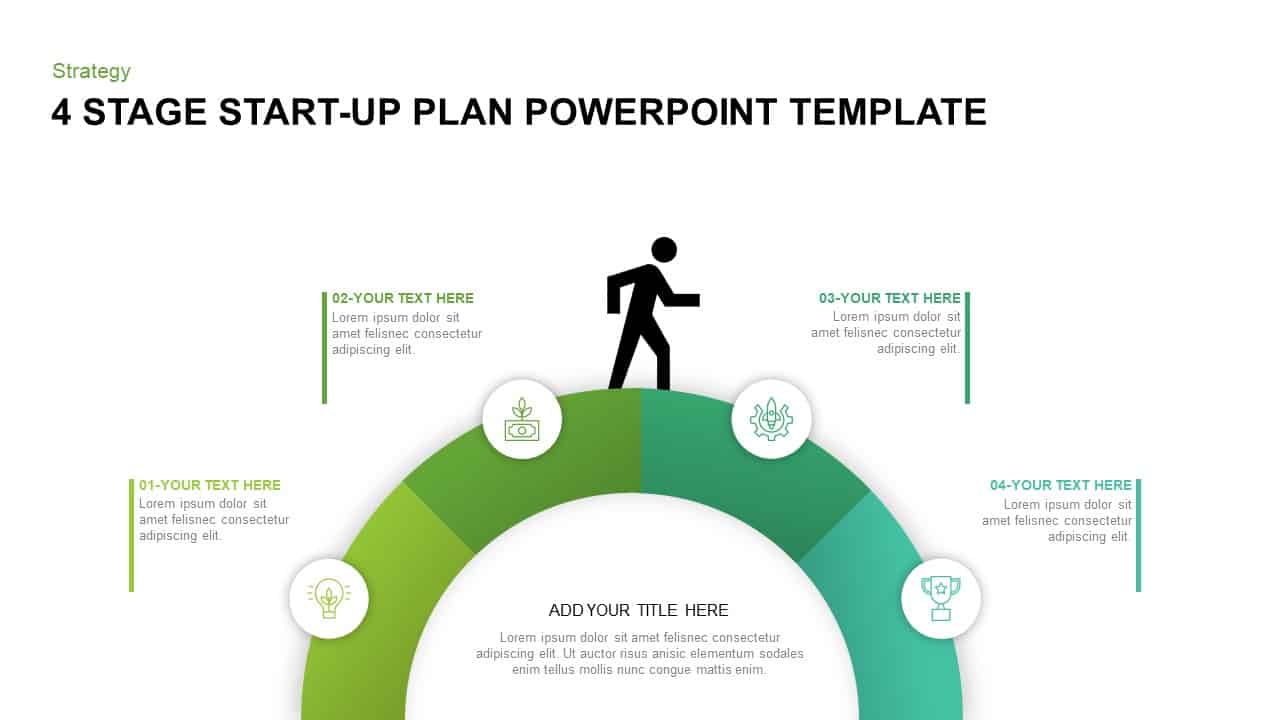
Four-Stage Start-Up Plan Arc Diagram Template for PowerPoint & Google Slides
Process
4 Stage Linear Process Flow Diagram Template for PowerPoint & Google Slides
Process
Six-Stage Circular Flow Diagram Template for PowerPoint & Google Slides
Circular
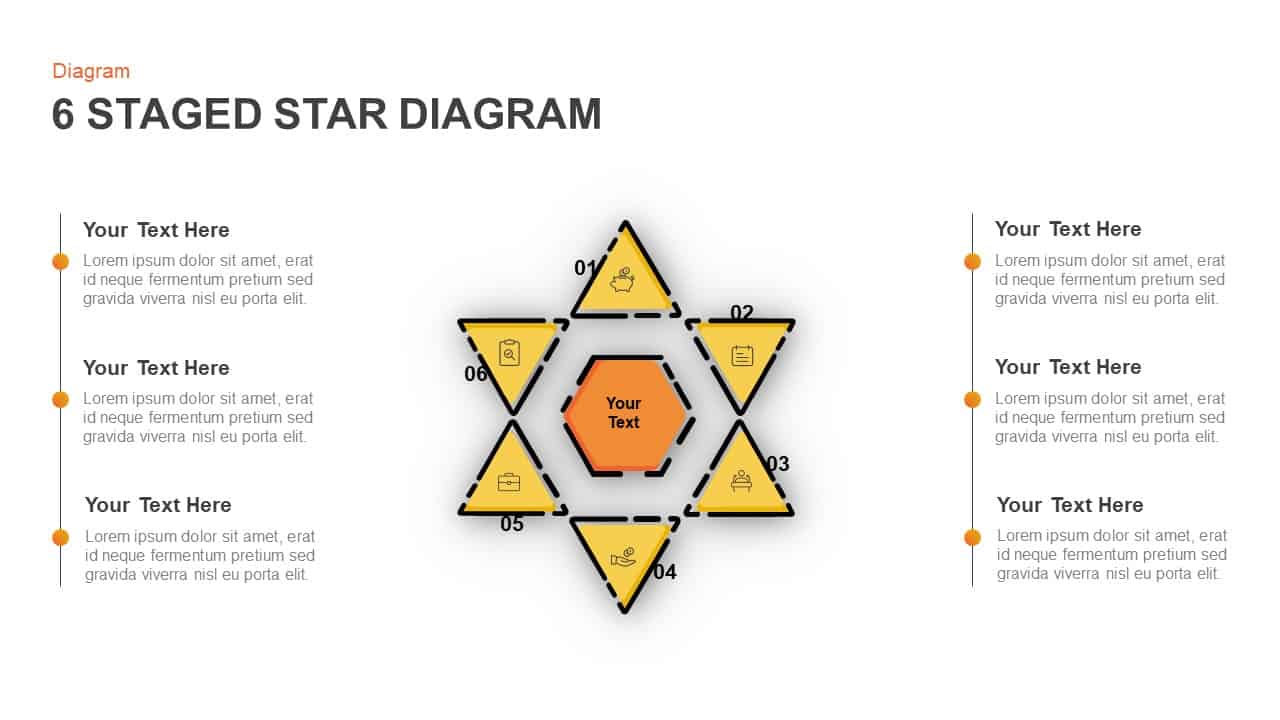
Six-Stage Star Diagram Infographic Template for PowerPoint & Google Slides
Process
8-Stage Chevron Circular Diagram Template for PowerPoint & Google Slides
Process
Three-Stage Loop Process Diagram Template for PowerPoint & Google Slides
Process
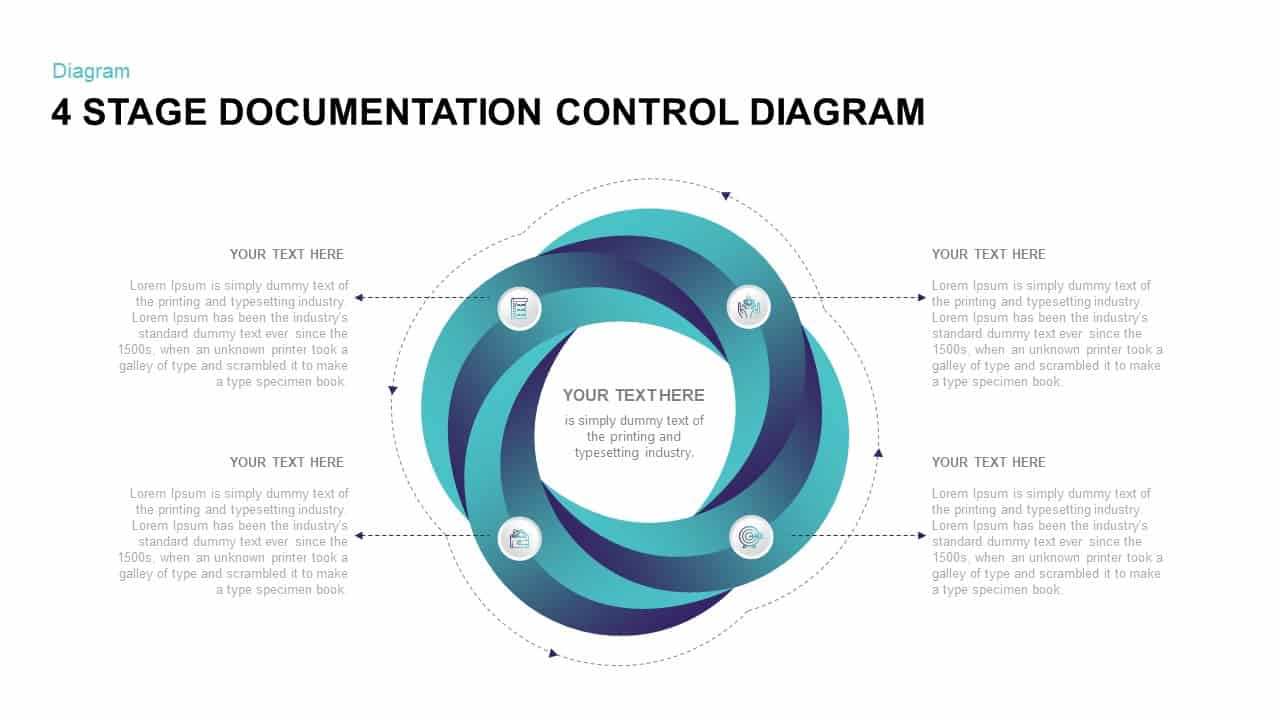
4-Stage Documentation Control Diagram Template for PowerPoint & Google Slides
Process
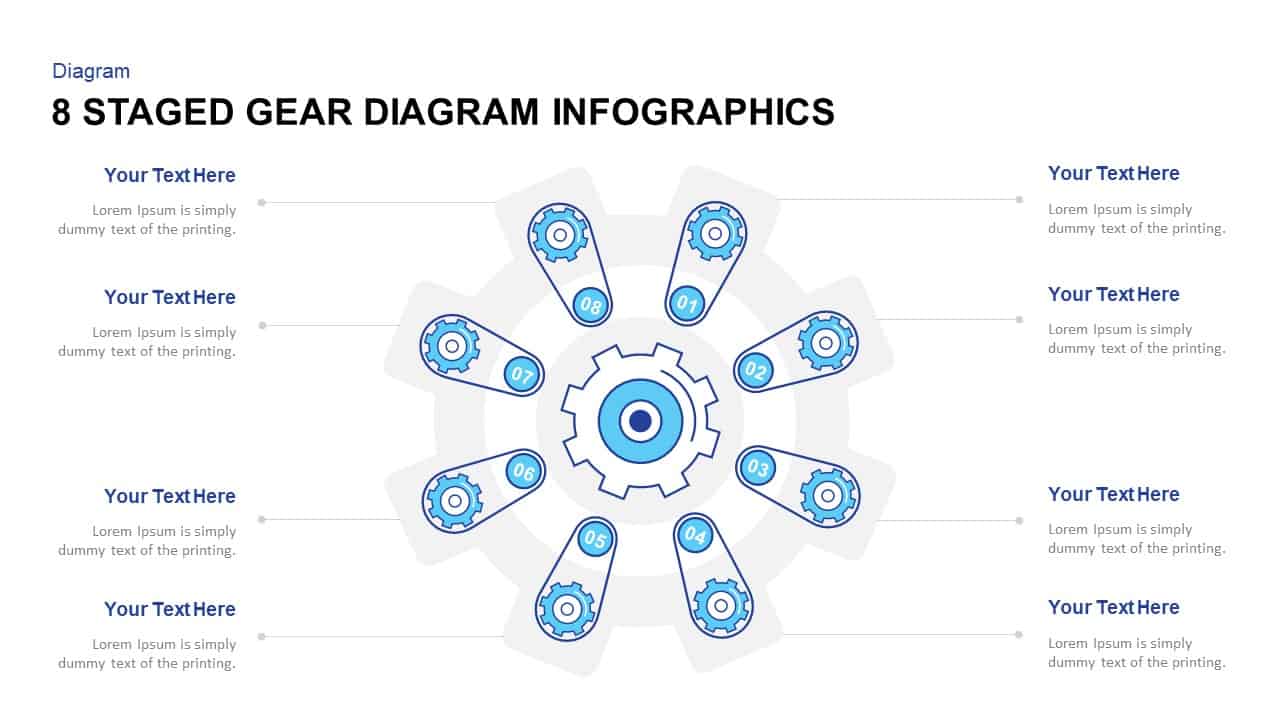
Eight-Stage Gear Diagram Process Template for PowerPoint & Google Slides
Process
Colorful 8-Stage Droplet Process Flow Diagram Template for PowerPoint & Google Slides
Process
Six-Stage Infinity Loop Diagram Template for PowerPoint & Google Slides
Process
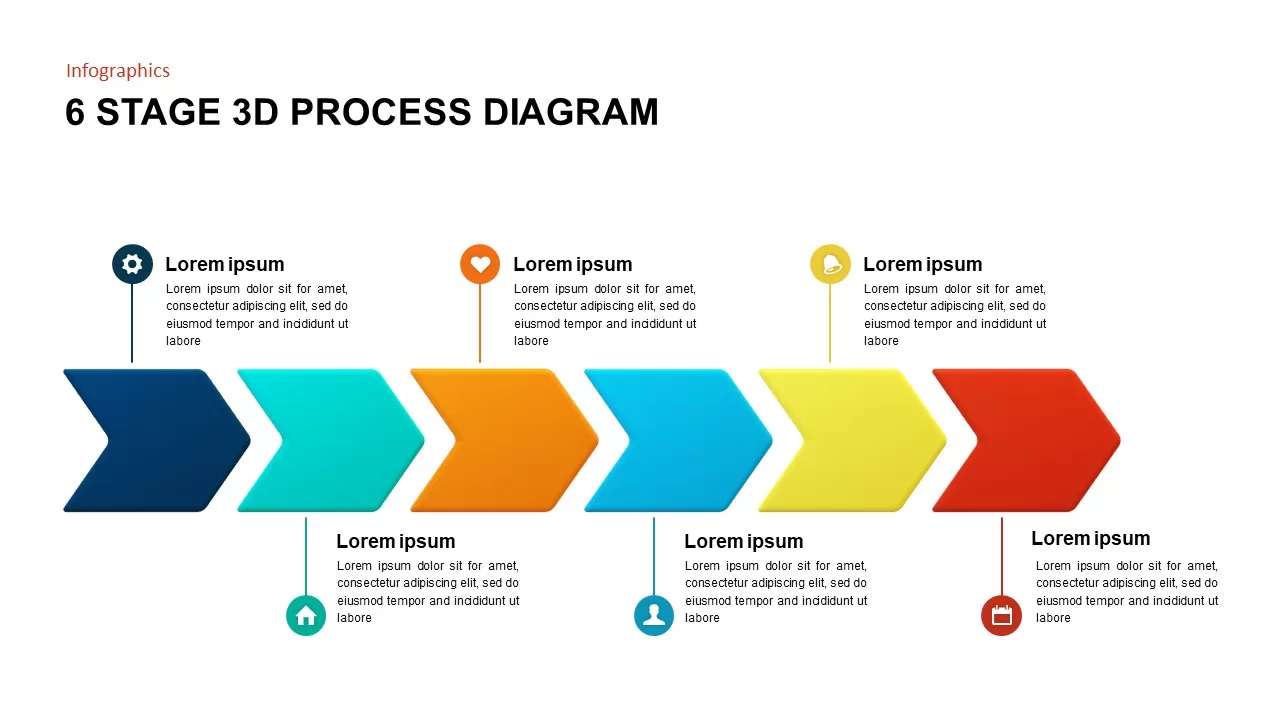
Animated Six-Stage 3D Process Diagram Template for PowerPoint & Google Slides
Arrow
Five-Stage Digital Maturity Model Diagram Template for PowerPoint & Google Slides
Process
Colorful Five-Stage Methodology Diagram Template for PowerPoint & Google Slides
Process
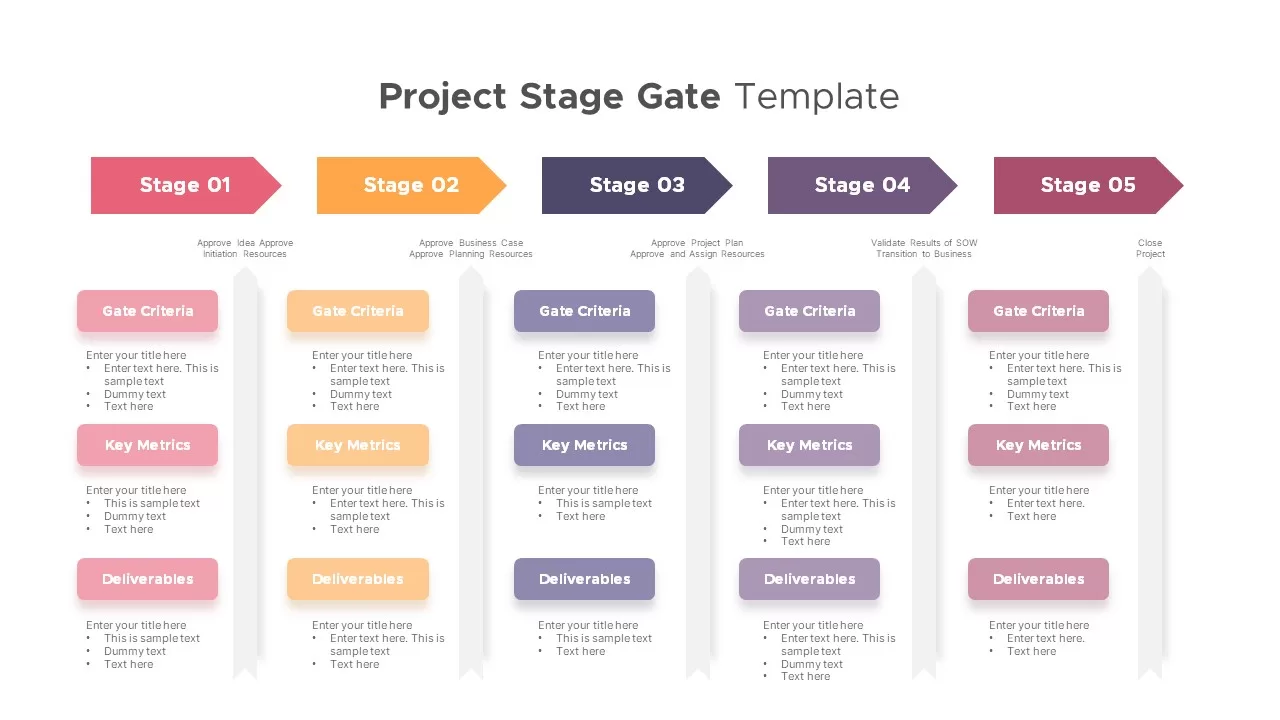
Project Stage Gate Process Diagram Template for PowerPoint & Google Slides
Process
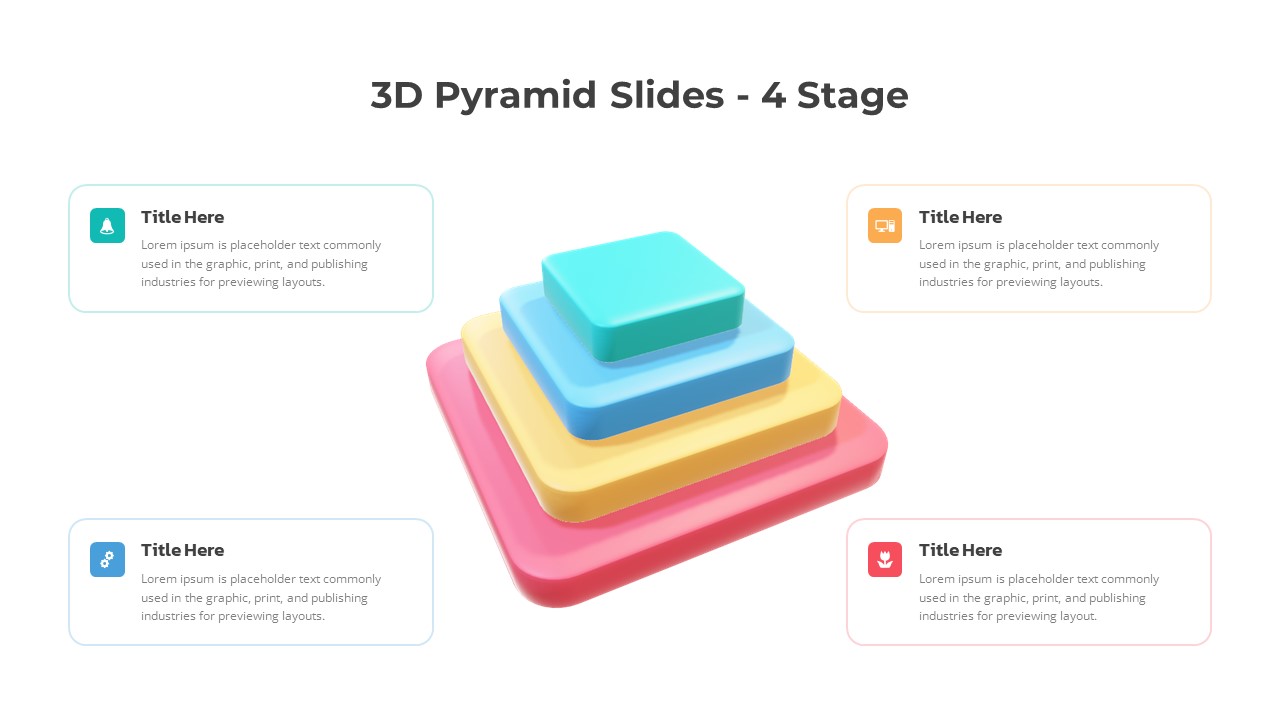
3D Four-Stage Pyramid Diagram Template for PowerPoint & Google Slides
Pyramid
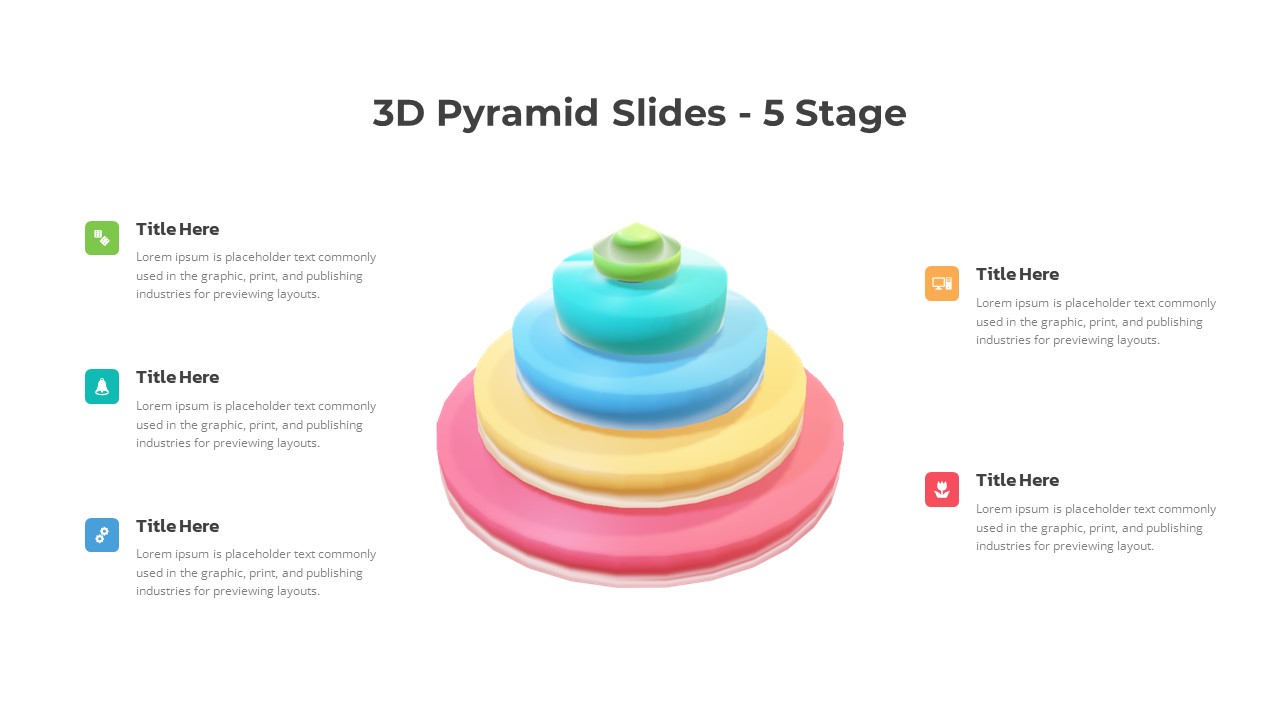
3D Five-Stage Pyramid Diagram Slide Template for PowerPoint & Google Slides
Pyramid
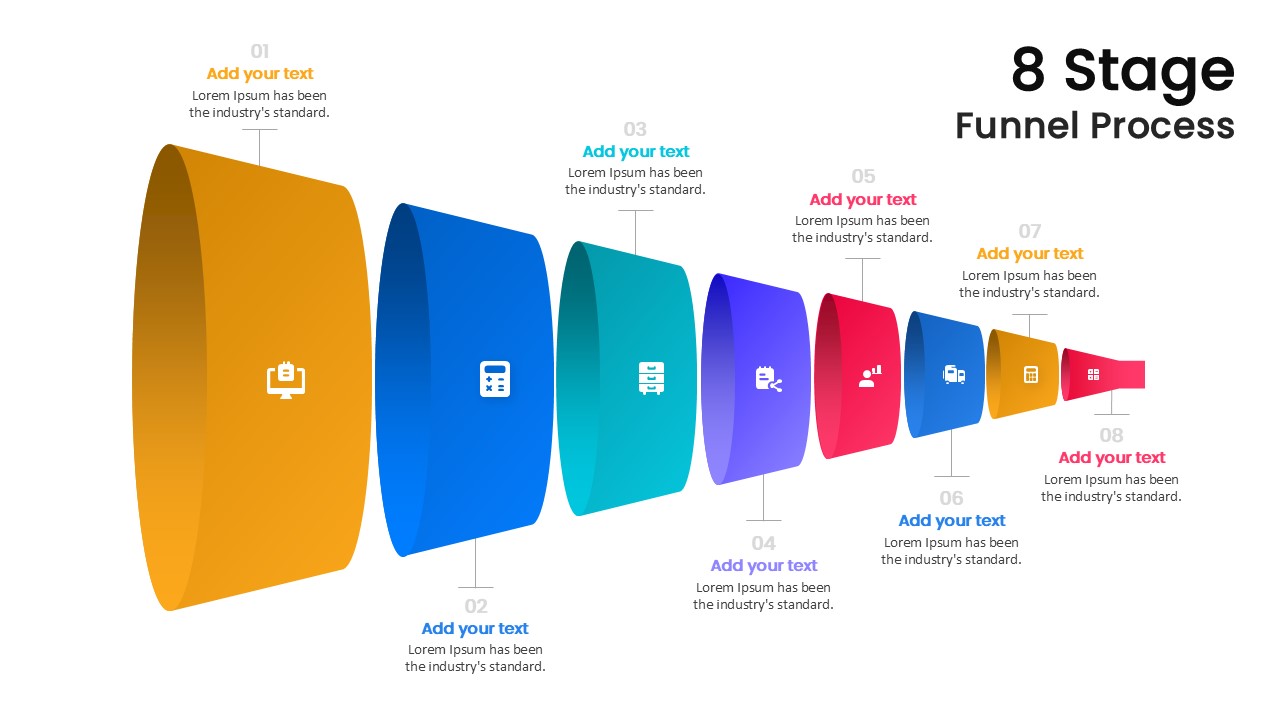
Modern 8-Stage Funnel Process Diagram Template for PowerPoint & Google Slides
Funnel
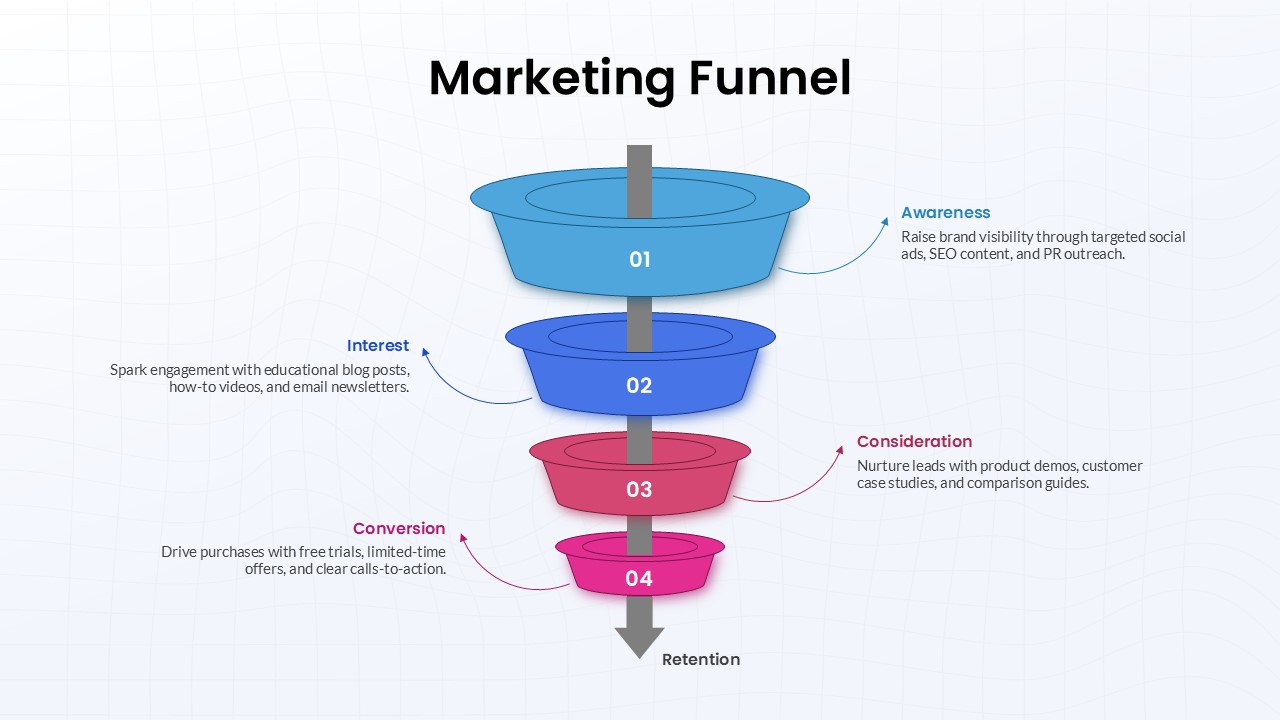
Four-Stage Marketing Funnel Diagram Template for PowerPoint & Google Slides
Marketing Funnel